Article

Multi-Scenario Response of Ecosystem Service Value in High-Groundwater-Level Coal–Grain Overlapping Areas Under Dual Objective Constraints

1
School of Public Policy and Management, China University of Mining and Technology, Xuzhou 221116, China
2
School of Public Security Management, People’s Public Security University of China, Beijing 100038, China
3
School of Environment Science and Spatial Informatics, China University of Mining and Technology, Xuzhou 221116, China
4
College of Water Sciences, Beijing Normal University, Beijing 100875, China
*
Author to whom correspondence should be addressed.
Appl. Sci. 2025, 15(16), 9172; https://doi.org/10.3390/app15169172
Submission received: 8 July 2025 / Revised: 15 August 2025 / Accepted: 16 August 2025 / Published: 20 August 2025
(This article belongs to the Special Issue Application of Remote Sensing in Environmental Monitoring)

Abstract

Ecosystem services (ES) are a key bridge connecting natural ecosystems with human social development. The core significance of ecosystem service value (ESV) is to quantify the contribution of ecosystems to human well-being. The mining of mineral resources causes disturbance to the structure, function, and value of ecosystems. This study focuses on the high groundwater level coal–grain overlapping areas in eastern China, the mining of mineral resources has led to widespread loss of cropland and carbon sinks in the region. Considering the particularity of ecosystem evolution caused by coal mining subsidence, we developed multiple land use demand scenarios under dual objective constraints based on PIM and Markov chain, including Inertial Development (ID), Food Security (FS), Urban Expansion (UE), Ecological Restoration (ER). The PLUS model was used to simulate the spatial changes of land use and the equivalent factor method was used to calculate the changes in ESV, exploring the best path to improve the ecological benefits of the coal–grain overlapping areas. The results indicate that: (1) By 2030, the study area will add 54,249.09 ha of coal mining subsidence, mainly mild and moderate subsidence, and cropland being the most affected by subsidence among all land types. (2) In the multi-scenarios, the total ESV is ranked as follows: ecological governance scenario (CNY 51.21199 billion) > ID scenario (CNY 51.0898 billion) > food security scenario (CNY 48.4767 billion) > UE scenario (CNY 48.27157 billion). Among them, the ER scenario achieves all individual ESV gains and has the highest overall ESV. (3) Spatial analysis shows that in the ER scenario, the ESV of mining townships significantly increases and the ESV gap between other townships has decreased. However, the FS scenario and UE scenario have led to widespread degradation of ESV between various townships in eastern mountainous areas, and severe degradation of ESV in some urban townships. This study validated the accuracy and applicability of the PLUS model in medium scale and plain regions. The study has confirmed our hypothesis that reasonable land use and ecological restoration methods can achieve Pareto improvement in regional ESV, provided a holistic and local dialectical perspective for related research, and a scientific basis for the sustainable development of coal grain overlapping areas.

1. Introduction

Ecosystem services (ES) are the benefits provided by natural ecosystems for human survival and development through structure and function [1,2,3], serving as a bridge and link between the natural environment and human society [4], and are closely related to human well-being [1]. However, the research results of MA indicate that the ecosystem services that humans rely on for survival (15 out of 24) are currently in a degraded or unsustainable state, and nearly two-thirds of natural resources on Earth have been depleted [5]. Fully understanding and protecting these ecosystem services is crucial for the sustainable development of ecosystems and human well-being [6]. Costanza made its first attempt to quantify the global ecosystem service value (ESV), marking a shift in research on ecosystem services from qualitative description to quantitative evaluation [1]. Xie improved the global indicator system based on Costanza to be applicable for ESV assessment in China, leading the development of related research fields in China [7]. The monetization and quantification of ecosystem services can objectively reflect their contribution to human well-being [8], which is conducive to incorporating the “natural capital” of ecosystems into the economic decision-making system [9,10,11], and is of great significance for promoting the construction of mechanisms for realizing the value of ecological products and optimizing the allocation of natural resources.
Coal and land are both natural resources that humans rely on for survival [12,13]. In 2024, the proportion of coal consumption in China’s total energy consumption will be 53.2%. The characteristics of resource endowment determine that coal occupies the dominant position in China’s energy structure, and this pattern is difficult to change in the long term [14,15]. There are studies showing that when 10,000 tons of coal are mined underground, the subsidence area is 0.2–0.33 ha [16]. Based on the proven coal reserves in China, it is estimated that there will be over 60,000 square kilometers of land subsidence after full mining [17]. The coal-bearing areas in eastern China are flat in terrain, densely populated, and have developed agriculture. The proportion of cultivated land pressed with coal accounts for over 60% of the coal-bearing area. Due to the homogeneity of resource distribution, the contradiction between people and land in the coal–grain overlapping area has been exacerbated in the process of coal resource development and utilization [18]. On the one hand, in high groundwater level mining areas, underground aquifers are damaged after coal mining by underground workers, causing large-scale land loss and ecological degradation due to water accumulation [19]. It is worth emphasizing that more than 90% of cropland damage caused by coal mining subsidence is in high-yield agricultural areas [18]. On the other hand, a series of social problems, such as the loss of residents’ livelihoods, deterioration of the living environment, and conflicts in interest distribution caused by coal mining subsidence, cannot be ignored [20]. For example, in Weishan County, Jining City, coal resources are abundant. The large-scale subsidence caused by long-term mining has disrupted water systems, damaged farmland, wetlands, and villages, leaving large ecological scars. Due to its location in a lake area and heavy historical burden, the difficulty of governance is high, resulting in delayed intervention measures. The local ecosystem structure is facing enormous pressure, and the contradiction between people and land is still prominent.
Land is a necessary carrier for human survival and sustainable development [21], and land use/cover change (LUCC) is a key indicator and determining factor of regional ecological environment change [22], reflecting the results of human activities and natural resource utilization. LUCC is closely related to the evolution of ecosystems [23]. Firstly, land use patterns directly affect the types and supply levels of ecosystem services. Secondly, LUCC affects ecosystem processes by altering the composition and structure of ecosystems, which in turn affects ultimate utility and its interrelationships [24], thus profoundly impacting human well-being. It is generally believed that the impact of drastic changes in land use caused by mineral resource extraction is always negative, such as cropland degradation, carbon sink loss, and livelihood transfer [15,18,25]. However, some studies suggest that mining activities in high groundwater level areas can promote the transformation of ecosystems from a single terrestrial type to a water land composite type [26], increase ESV, and enhance the diversity of ecosystem functions [27]. It is worth noting that the ecosystem of the coal–grain overlapping area exhibits significant characteristics of external driving and internal disturbance interweaving, and the coupling evolution of natural and social systems. Outside the mining area, there is a gradual transformation dominated by urbanization and agricultural production. Within the mining area, there is a sudden transformation from mining disturbance to governance and restoration threats. However, existing research either only focuses on the scope of mining areas [28] or does not consider the impact of mining areas on the overall region [15], ignoring the integrity of ecosystems.
Land use spatial modeling and simulation have become one of the main methods for studying LUCC [29,30]. Cellular Automata (CA) is a model that discretizes both time, space, and state, possessing powerful spatial modeling and computational capabilities, capable of finely simulating complex dynamic systems with spatiotemporal features [31,32,33]. However, traditional CA models have limited effectiveness in exploring the driving forces of land use change [34], and are difficult to simulate the spatiotemporal dynamics of patch-level changes in various land use types [35]. The Markov CA, CLUE-S, and FLUS models developed from CA have been widely applied to spatiotemporal dynamic modeling of land use under the influence of natural and socio-economic factors [36,37,38]. Liang etc., proposed the Patch generating Land Use Simulation (PLUS) model [39], which is an improved version of the FLUS model. The PLUS model uses the RF random forest method instead of the FLUS model’s ANN neural network to obtain the development probabilities of various types of land, which has a more efficient framework for mining transformation rules. The PLUS model also has a more optimized patch simulation mechanism, which retains the spatial logic of pixel-level evolution simulation and enhances the realism of “block like evolution”, making up for the shortcomings of traditional CA models in terms of boundary blurring and shape logic [40]. Research has verified that the overall simulation performance of the PLUS model is significantly better than other models, and the simulated rural built-up land scope is more consistent with reality [41]. Some scholars have also verified in their research on the Huaibei mining area that the PLUS model has good applicability in high groundwater level mining areas, and has more advantages in simulating the accuracy of forests and water bodies [42].
The high groundwater level coal–grain overlapping area in the Nansi Lake Basin is located in the eastern plain of China, and its ecosystem services have the characteristics of “multifunctional superposition and high-risk exposure”. On the one hand, abundant coal resources and high-yield grain crops provide considerable material production services. As the largest freshwater lake group in northern China, Nansi Lake has a vast water area and abundant lakeside wetlands. Its hydrological regulation, water quality purification, and biodiversity maintenance functions are powerful, making it an important ecological barrier [43]. On the other hand, land subsidence caused by coal mining directly threatens the ecological functions of farmland and wetlands, and economic development and urbanization also bring multiple pressures to regional ecosystems. Starting from the integrity of the ecosystem, we assume that reasonable land use and ecological restoration methods can enhance the overall and individual ESV, thereby achieving Pareto improvement. The following research will verify this hypothesis. Firstly, by utilizing the different disturbance factors of the ecological system evolution in the coal–grain overlapping area with high groundwater level and the non coal mining subsidence area, a dual constraint rule for land use demand is formulated: the PIM probability integration method is used to predict the level of land subsidence in the mining area, and various land reclamation or ecological restoration scenarios are formulated by adjusting the land use patterns within different subsidence levels. We also use a Markov chain to predict the demand for land use transformation quantity under different development strategies outside the mining area. Secondly, based on the PLUS model, spatial simulation and allocation of land use patches under multi-scenario modes in the region in 2030 will be carried out. Finally, the equivalent factor method is used to calculate the quantity changes of each type of ESV under each scenario, as well as the spatial changes of ESV in each township area. The aim of this study is to explore the intrinsic mechanism of regional ecosystem service evolution under the interference of mineral resource exploitation, explore the sustainable development path of the regional human land system, and provide a scientific basis for land use planning and ecological governance in coal–grain overlapping areas.

2. Study Area

The study area is located in the east of China and the south of the North China Plain (115°40′–117°28′ E, 34°27′–35°58′ N), as described in Figure 1a. including 18 county-level administrative units in the southwest of Shandong Province and the northwest of Jiangsu Province, with a total area of 20,317.64 km2. It belongs to the Nansi Lakes water system of the Huaihe River basin, as described in Figure 1b. The water system in the area is developed, the terrain is flat, there are many cities and towns, the population is dense, the cropland area is large, the coal resources are rich, and the agricultural land is widely compressed. The area includes several major mining areas such as Jining mining area, Yanzhou mining area, Zaoteng mining area, Juye mining area, and Peibei mining area, as described in Figure 1c. The mining area accounts for 17.35% of the total area of the study area, with a total of 102 coal mines, of which 68 are in production and all use underground mining methods. The annual raw coal production exceeds 80 million tons, and the history of large-scale mining exceeds 60 years. The coal seams in the mining area are buried deep (>500 m), thick (6–8 m), and have a high water table (average 1–3 m), making them typical high groundwater coal basins (HGCBs) in the plain. Long-term large-scale high-intensity mining has led to extensive surface subsidence and land loss. The scale of coal mining subsidence is particularly large, and the degree of subsidence tends to be severe. Some of the subsidence water accumulation areas have been connected to the Nansi Lake, and mining activities have a strong impact on the terrestrial and lake ecosystems.

3. Materials and Methods

3.1. Data Source

The data used in this study includes land use data, basic geographic data, socio-economic data, and constraint data. Table 1 lists the content, time span, spatial resolution, and sources of various data. All spatial data in this study were obtained using the Albers Conical Equal Area projection coordinate system, GCSWGS_1984 geographic coordinate system, and the reference plane was D_WGS1984. It should be noted that the GDP spatial data is obtained by pixel allocation of the total regional GDP based on the nighttime light data of Luojia-1. To avoid spatial mismatch caused by resolution differences in multi-source data, all raster data were resampled to 30 m using the BILINEAR method.

3.2. Methods

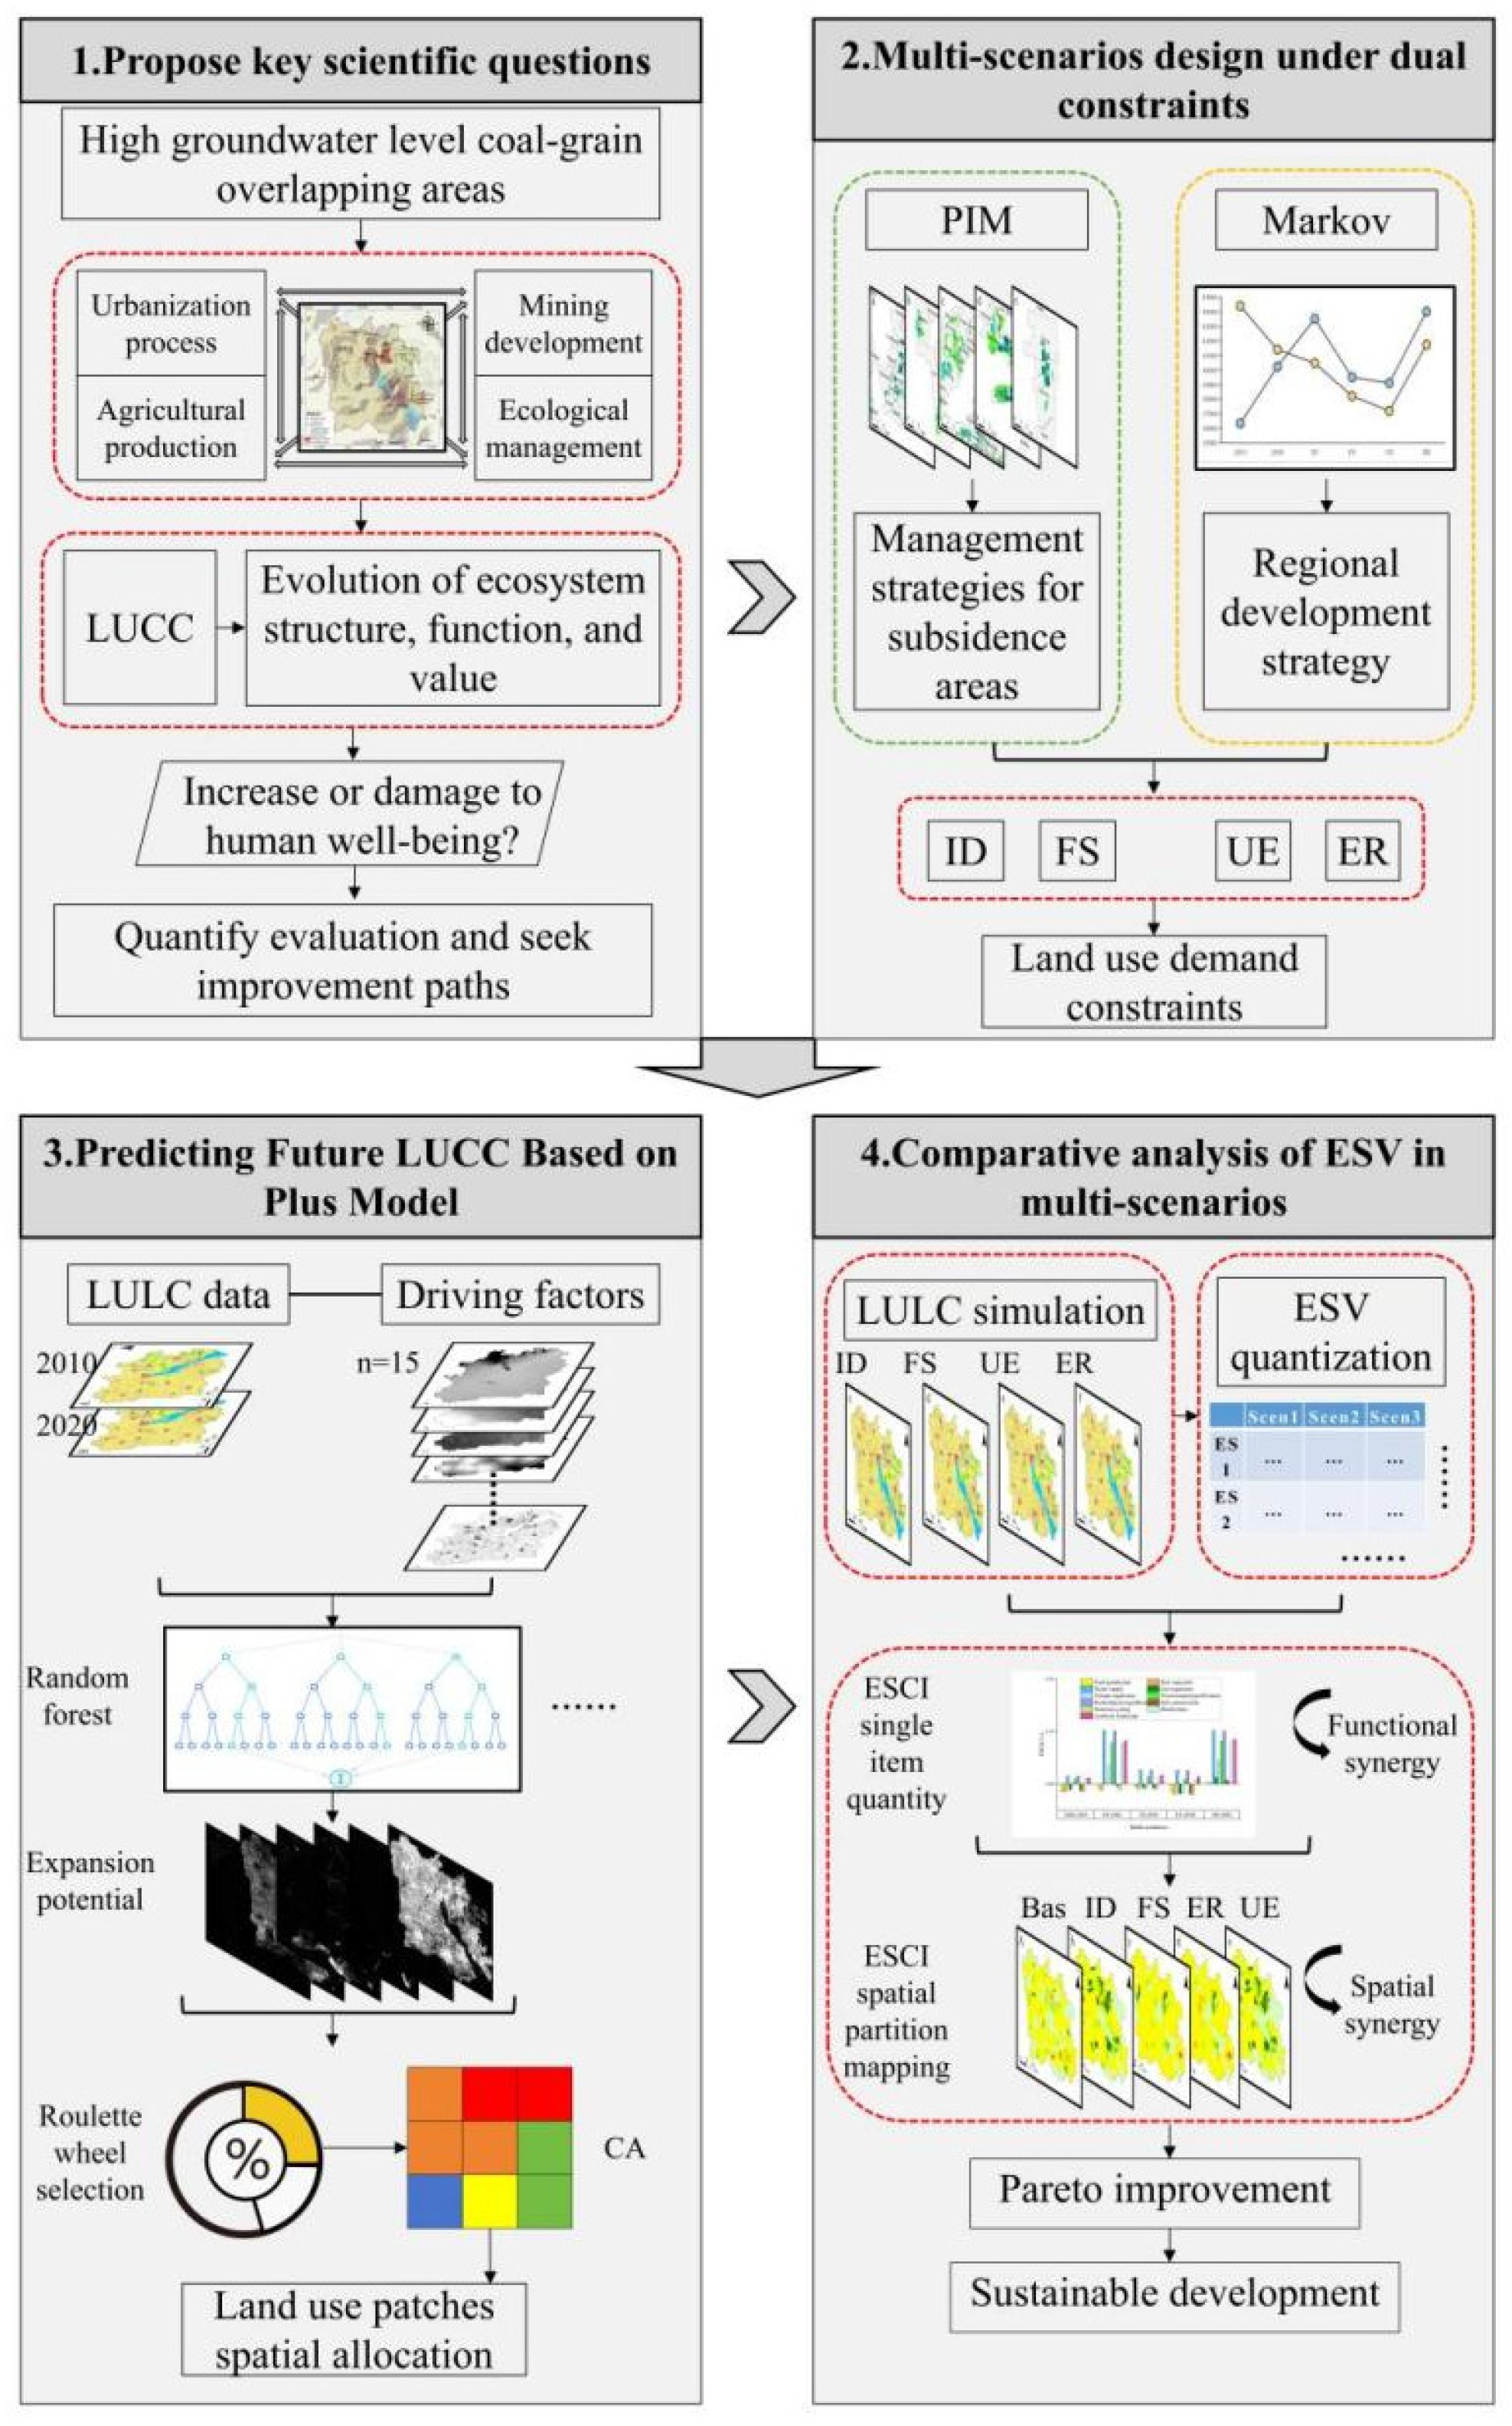
Figure 2 shows the technical roadmap. This roadmap revolves around the human environment system in the high-groundwater-level coal–grain overlapping area, and is developed in four steps:
(1)
Propose key scientific questions: Focus on the impact of urbanization, agricultural protection, and other factors on ecosystem structure, function, and human well-being, clarify the need for quantitative evaluation, and find optimization paths.
(2)
Multi-scenarios design: Based on PIM and Markov model, combined with subsidence area management strategy and regional development strategy, considering land demand constraints such as ID and FS to construct scenarios.
(3)
Predicting future land use: Using the PLUS model, conducting random forest and expansion potential analysis, and based on data from 2010 to 2020, simulate the spatial allocation of land use patches.
(4)
Comparative analysis of ESV in multi-scenarios: Quantify ESV in different scenarios, conduct functional and spatial synergy analysis, seek Pareto improvement, and support sustainable development.

3.2.1. PIM: Probability Integral Method

Predicting the level and spatial distribution of land subsidence in coal mining subsidence areas using the PIM probability integration method. The PIM probability integral method, as a typical discontinuous medium model in theoretical simulation methods, has a solid theoretical foundation, high computational efficiency and prediction accuracy, and easy parameter acquisition and adjustment. It has been widely applied and matured in China [44]. PIM is based on the theory of stochastic media, which decomposes the entire mining area into countless small units. The impact of the entire mining process on the strata and surface is equal to the sum of the impacts of each mining unit on the strata and surface. The subsidence basin caused by the mining process follows a normal distribution and is consistent with the probability density distribution. Therefore, the subsidence profile equation generated by the entire mining process can be expressed as the integral formula of the probability density function [45]. Assuming that the settlement value of any point (x, y) on the surface of the mining area can be expressed as:
W 0 x , y = 1 r 2 exp π x 2 + y 2 r 2 q d a d b
Among them, r is the main influence radius, r = tanβ/H, (tanβ is the tangent of the main influence angle, which is related to lithology). q is the subsidence coefficient (the maximum subsidence value of a unit thickness coal seam during mining, 0 < q < 1, depending on the roof management method and lithology). H is the mining depth (vertical distance from the surface to the mined coal seam, m). Da × db is the area of a small rectangular unit.
Referring to the “Regulations for Comprehensive Land Consolidation” and taking into account the hydrogeological and agricultural planting conditions of the region, the mining subsidence areas in the area are divided into three types: areas with vertical surface subsidence between 10 mm and 1000 mm are classified as mild subsidence areas (less prone to water accumulation), areas with subsidence between 1000 mm and 3000 mm are classified as moderate subsidence areas (prone to seasonal water accumulation), and areas with subsidence exceeding 3000 mm are classified as severe subsidence areas (highly prone to perennial water accumulation). Based on the mining plans, mineral resource utilization plans, and mining parameters provided by each coal mine (coordinate angles, coal seam orientation, coal seam mining thickness, mining depth, coal seam dip angle, subsidence coefficient, etc.), use PIM-based MSPS2009 software to predict coal mine collapse in 2030.

3.2.2. PLUS Model

The PLUS model is a cellular automaton (CA) model based on raster data that can be used for simulating patch-scale LUCC. The PLUS model combines the Land Expansion Analysis Strategy (LEAS) with the CA model based on multiple random seeds (CARS), which can effectively handle the uncertainty in the process of land use change under the influence of both human and natural factors. It can be used to explore the driving factors of land expansion and predict the patch-level evolution of land use landscapes. Land use demand is calculated using the Markov chain integrated with the PLUS model.
After repeated debugging and verification, the parameter settings of the PLUS model are as follows: the number of regression trees is 20, the sampling rate is 0.01, the mTry is 15, the neighborhood size is 3, the patch generation is 0.8, the expansion coefficient is 0.5, and the percentage seeds is 0.0006. Neighborhood weights reflect the expansion potential of different land use types under spatial driving factors, the neighborhood weights of cropland, woodland, grassland, water area, built-up land, and barren land under ID scenario are set to 0.45, 0.3, 0.35, 0.45, 0.8, and 0.5, respectively. The neighborhood weights of other scenarios need to be adjusted accordingly. Based on the land use data of 2010 and 2020, the land use pattern of 2020 was simulated, and the accuracy was verified by comparing it with actual data. The results showed that the Kappa coefficient of the model reached 0.83, with an overall accuracy of 0.93, indicating its high predictive ability and suitability for simulating and predicting future land use patterns.
(5)
Selection of driving factors
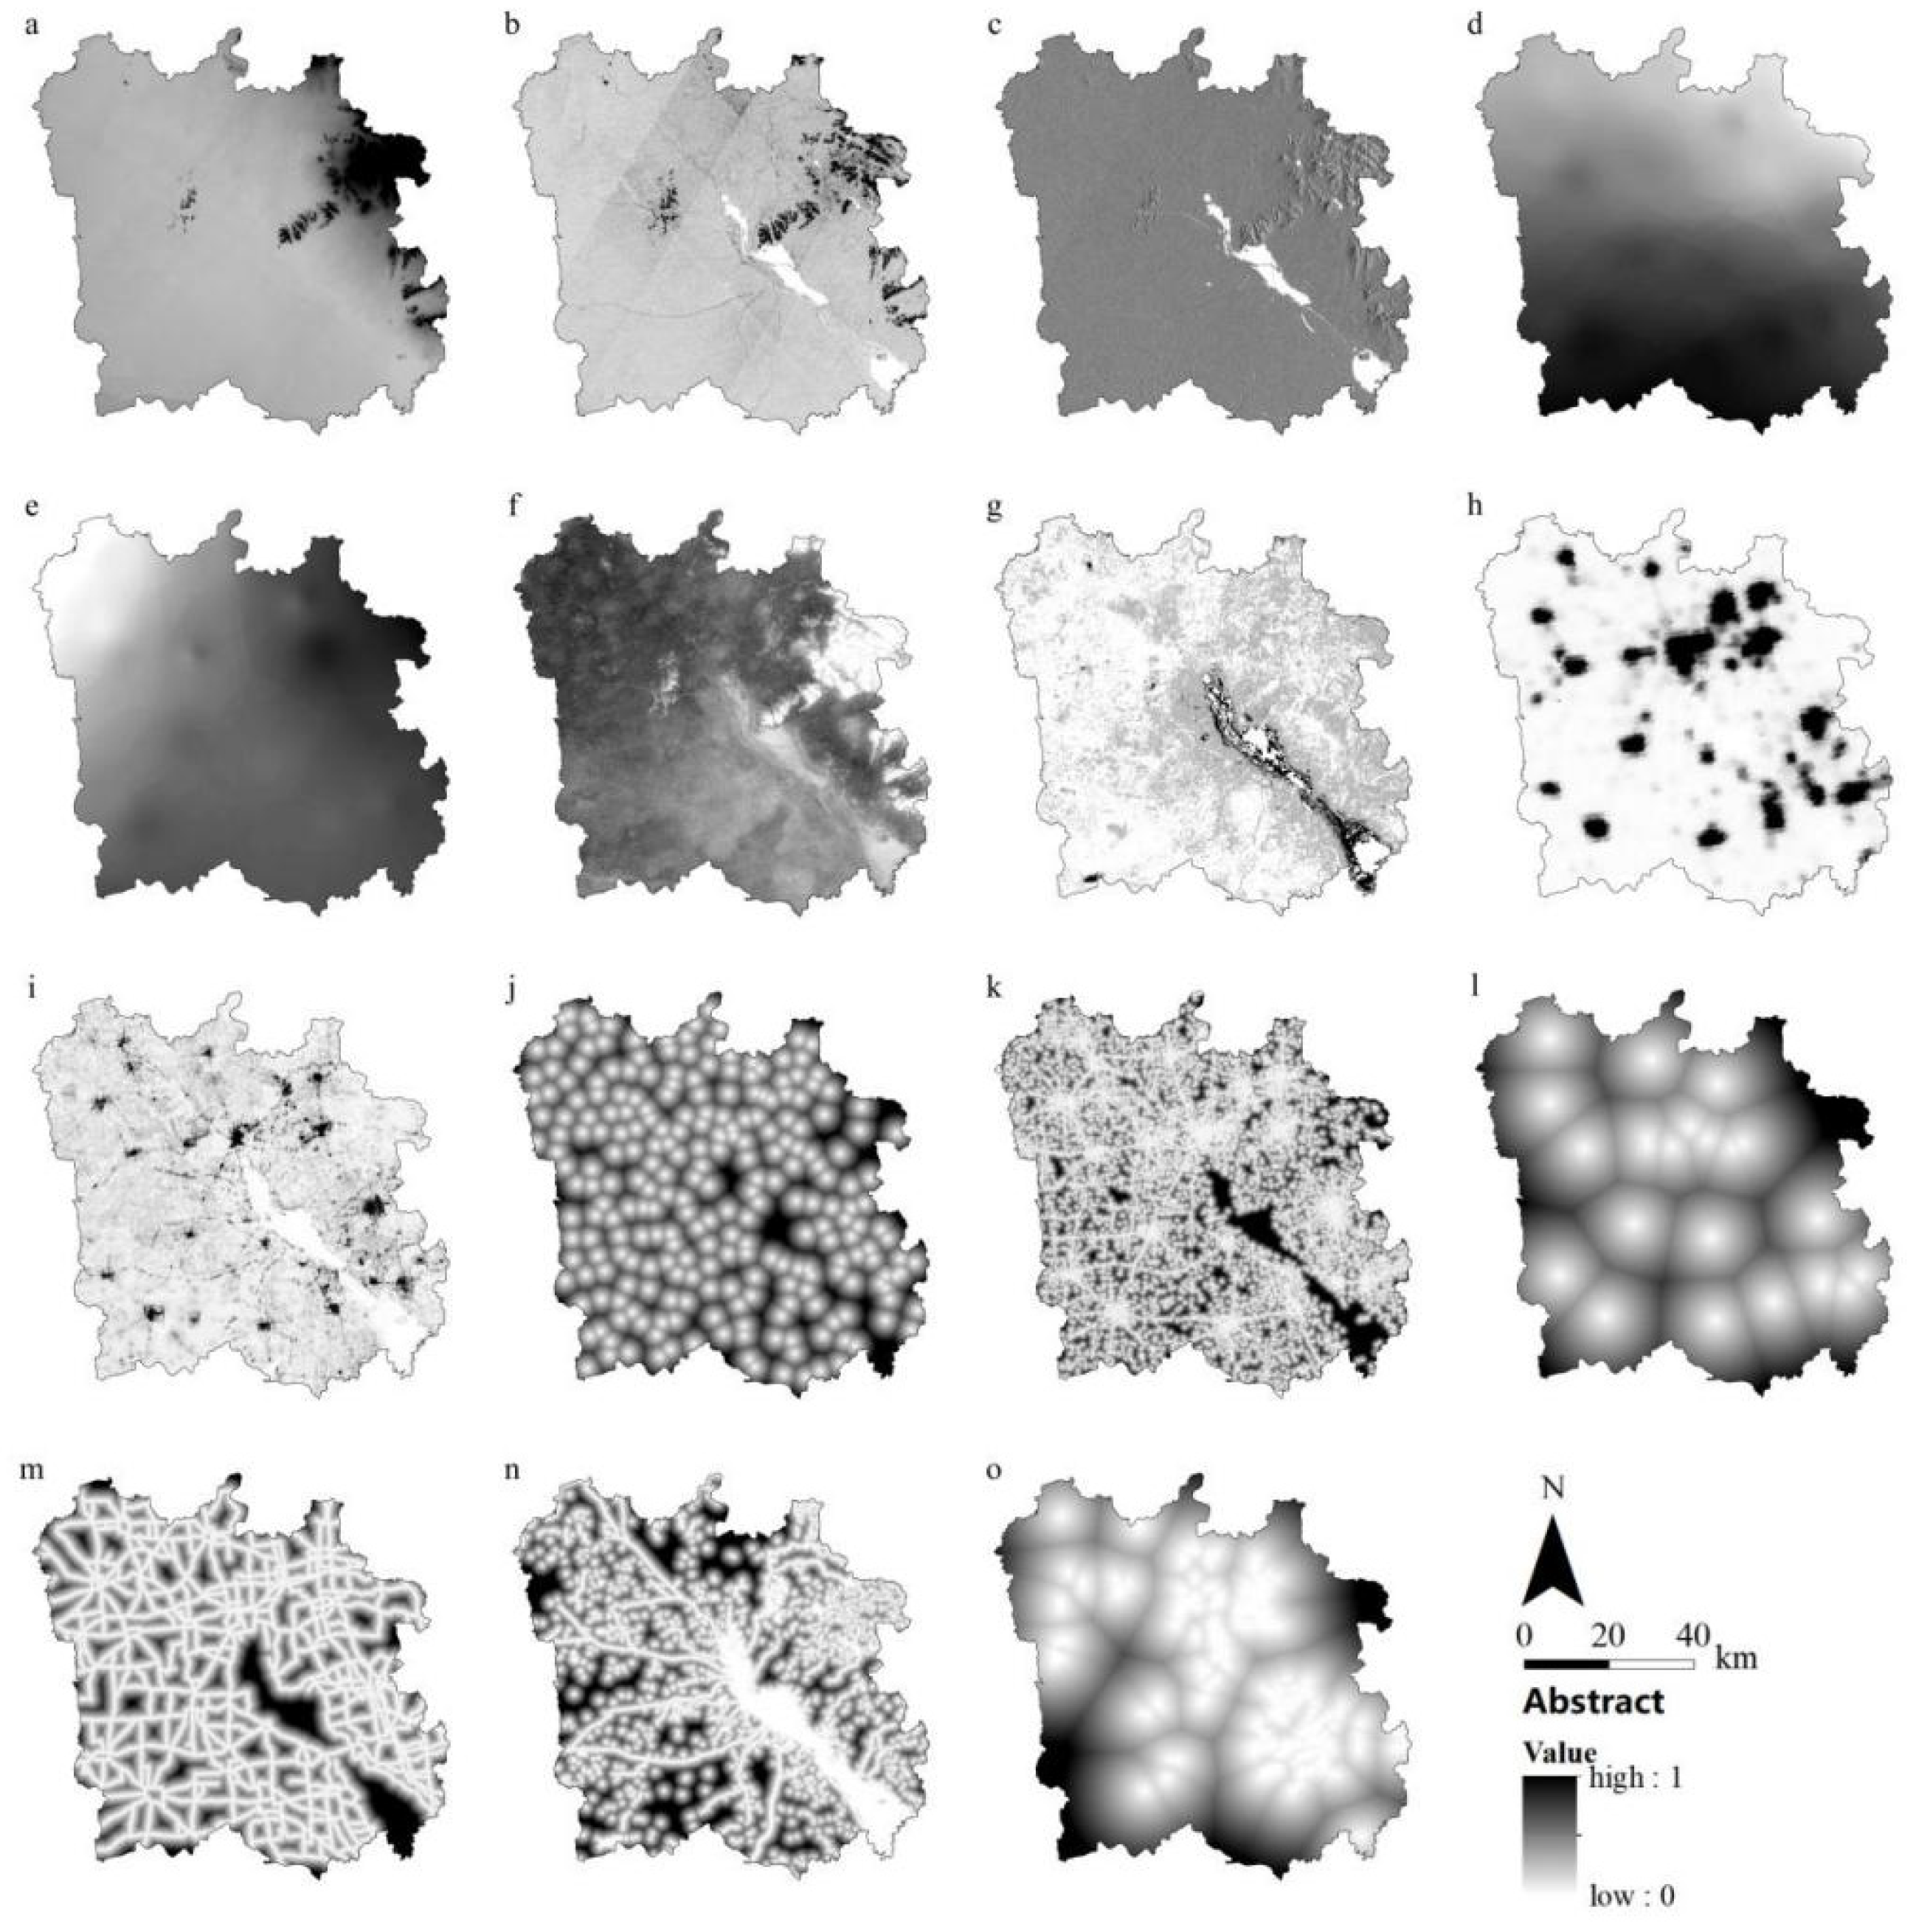
Land use change is the result of the interaction between the intrinsic physical and chemical conditions of various land types and external factors such as natural, social, and economic factors [46,47]. Based on the selection principle of driving factors and combined with the actual situation of mineral resource exploitation, urban economic development, and cropland protection in the high groundwater level coal–grain overlapping area, this study selected 15 driving factors that can affect land use change, including natural and socio-economic factors (Figure 3). Among these 15 driving factors, we added POI point data and coal mining subsidence area data. The distance factor is Euclidean distance, and the temperature and precipitation data are processed using the Inverse Distance Weighting method (IDW). All driving factors have been normalized. The PLUS model is based on using the RF algorithm to mine the size of driving factors and the development probability of various types of land use. It can effectively handle the spatial autocorrelation and multicollinearity between driving factors, and better explain the nonlinear relationship between land use change and potential driving factors.
(6)
Multi-scenario rule formulation with dual objective constraints
According to official documents such as the “Shandong Province Land and Space Plan (2021–2035)”, “Xuzhou City Land and Space Overall Plan (2021–2035)”, “Shandong Province Comprehensive Management Special Plan for Coal Mining Subsidence Land (2019–2030)”, and “Pei County Coal Mining Subsidence Area 14th Five Year Plan for Ecological Restoration”, and based on previous research experience, the scenario settings outside the subsidence area are guided by regional natural environmental conditions, socio-economic foundations, and macro development strategies. Within the subsidence area, the constraints of subsidence levels are comprehensively considered, including subsidence water accumulation, cropland damage (abandonment), building damage, land reclamation, ecological restoration, etc. The scenarios inside and outside the subsidence area are nested and combined, and multi-scenarios with dual goal constraints are formulated. including Inertial Development scenario (ID), Food Security scenario (FS), Urban Expansion scenario (UE), Ecological Restoration scenario (ER). ID scenario serves as a baseline for other scenarios. The specific setting rules are shown in Table 2.

3.2.3. ESV Calculation

The ESV equivalent factor refers to the potential capacity of the relative contribution of ecological services generated by an ecosystem, defined as the economic value of the annual natural grain production of cropland with a national average yield of 1 ha. The grain yield in the research area is 6711.9 kg/ha. The average market purchase price of wheat and corn commonly planted in the Nansi Lake Basin in 2020 was selected as the grain price, which was about 2.32 RMB¥/kg. If the economic value of one ESV equivalent factor is equal to 1/7 of the national average grain yield market value in that year [48], then the value of one ESV equivalent factor in the study area is 2224.52 RMB¥.
This article refers to the unit area ESV basic equivalent table proposed by Xie [48], and makes appropriate revisions based on the actual situation of the ecosystem in the study area: the ESV equivalent of cropland is the weighted average of dry land and paddy field areas. The woodland ESV equivalent is the arithmetic mean of broad-leaved forests and shrubs. The equivalent of grassland ESV is characterized by shrub grass. The arithmetic mean of the water system and wetland is taken for the water area. The ecological value of built-up land is extremely low, only reflected to a small extent in the aesthetic landscape of cultural services. barren land without adjustment. The adjusted ESV equivalent factors are shown in Table 3.
E S V = i = 1 n A i × E i j × V
V = 1 7 k = 1 f c k p k y k C
n the formula, ESV represents the total value of ecosystem services. Ai represents the area of land use type i. Eij is the value of the jth ecological function of land type i. V represents the ecosystem service value of one standard equivalent. F is the type of crop. Ck is the sowing area of crops. Pk is the average price of crops. Yk is the average yield per unit area of crops. C is the total area of crops.
Introduce the Coefficient of Sensitivity (CS) to verify the accuracy and applicability of the coefficient. Quantitatively analyze the sensitivity of ESV to changes in ESV coefficients by calculating the impact of changing input variables on output results. When CS < 1, it indicates that ESV lacks elasticity towards V; when CS > 1, it indicates that ESV is elastic to V. We plan to adjust the coefficient up and down by 50% to verify.
C S = E S V n E S V m / E S V m V n i V C m i / V m i
In the formula, m is the initial ecosystem service value or coefficient before adjustment, n is the adjusted value or coefficient, and i is the land use type.
Introducing the Ecological Services Change Index (ESCI) to represent the changes in ecosystem services relative to their initial state [49], where a positive ESCI indicates ESV growth and a negative ESCI indicates ESV loss.
E S C i = E S i a E S i b ES i b × 100 %
ESCi is the change index of a single ecosystem service, while ESia and ESib correspond to the initial and final values of the respective ecosystem services.

4. Results

4.1. Prediction of Coal Mining Subsidence Level and Spatial Distribution

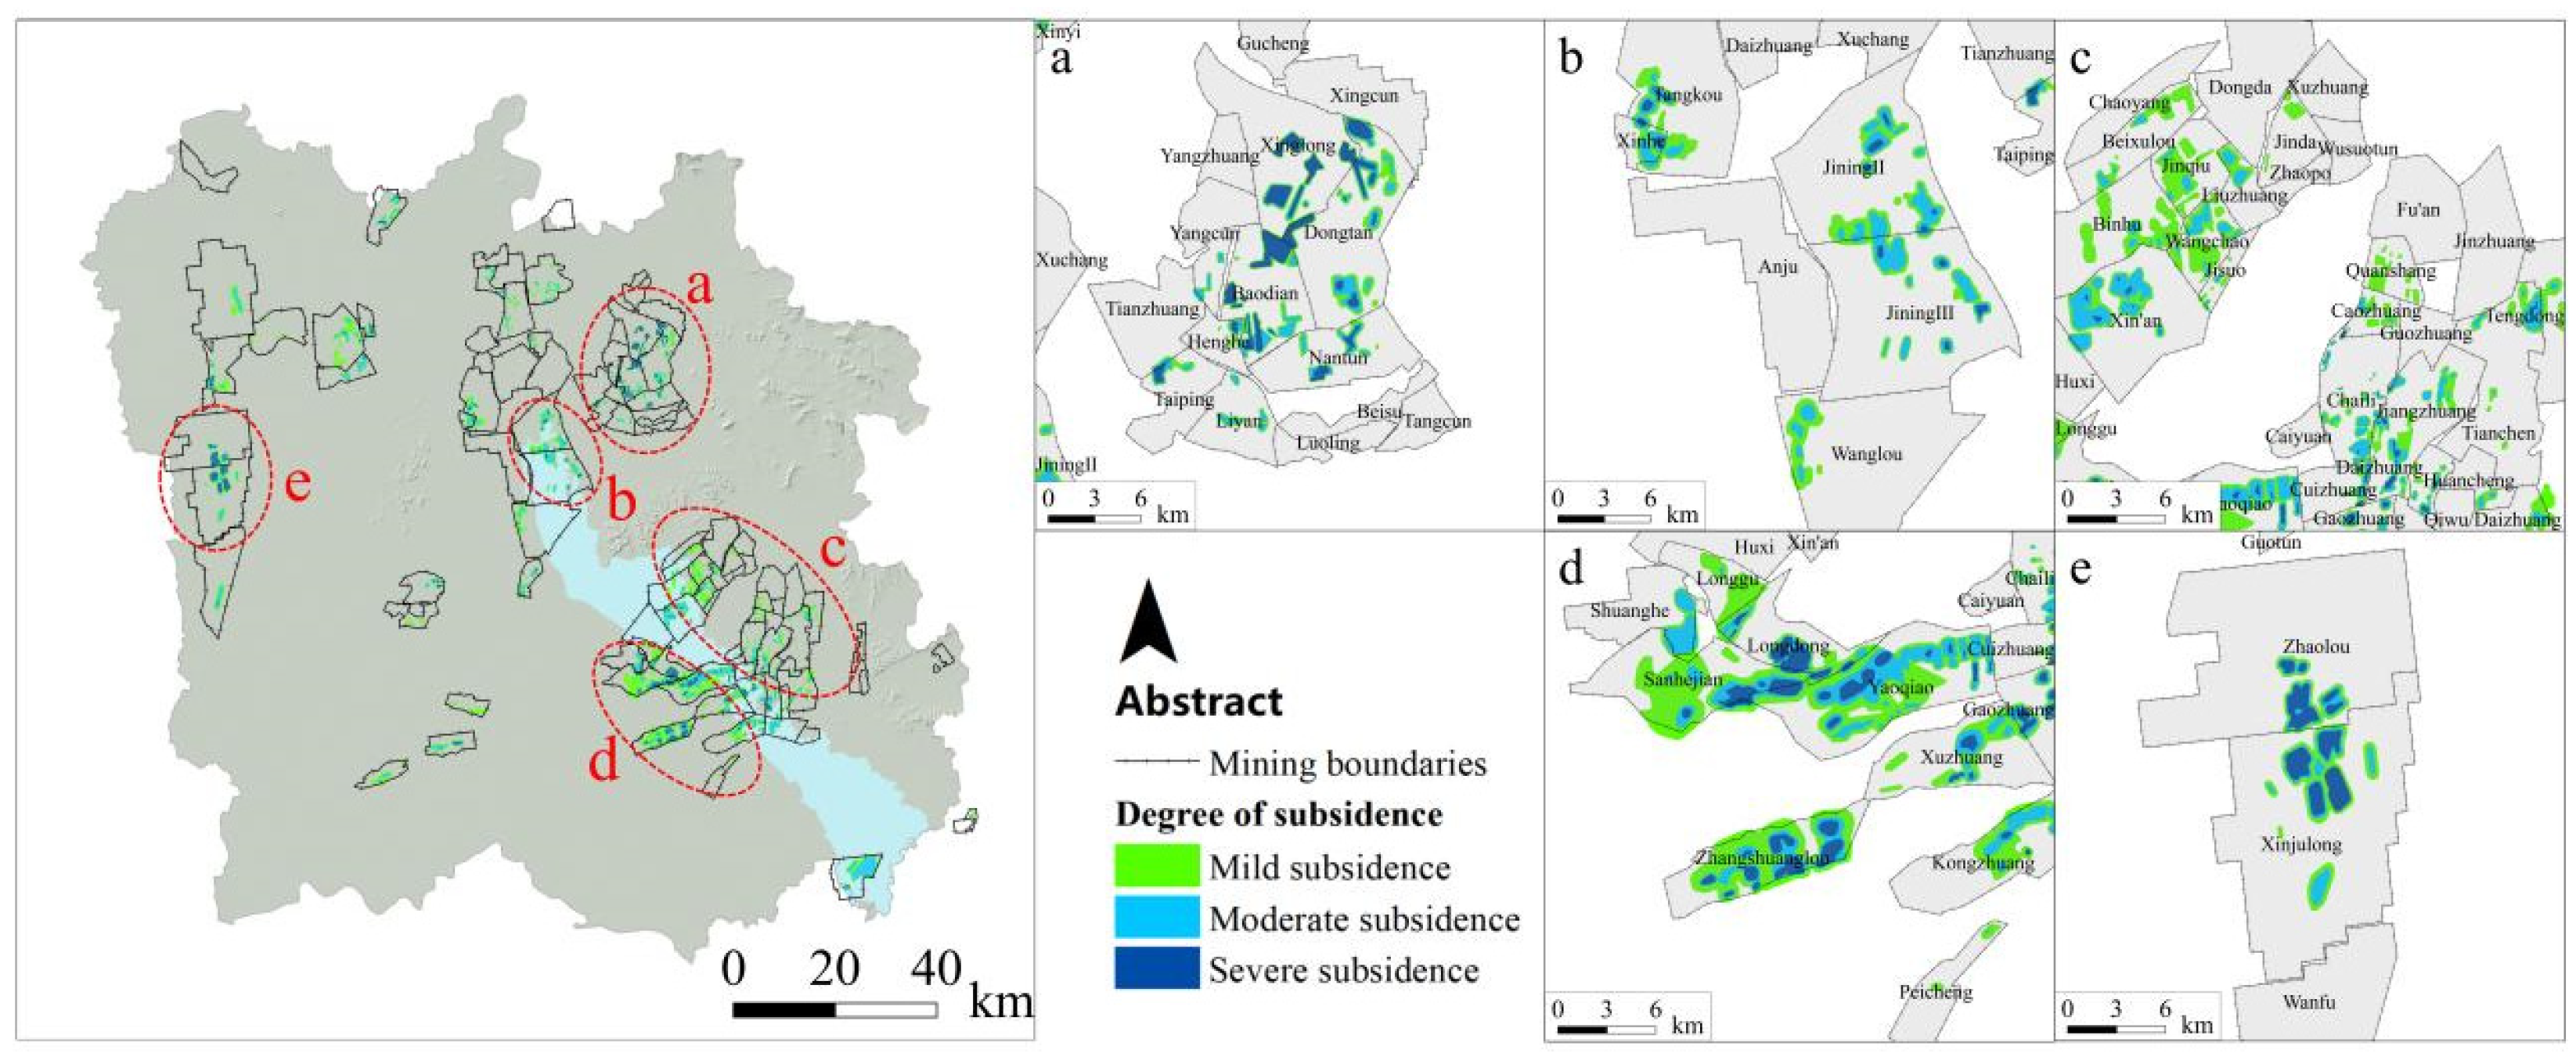
Figure 4 intuitively reflects the overall subsidence status of the study area and the subsidence status of each mining area in 2030. By 2030, a total of 54,249.09 ha of coal mining subsidence will be added to the study area, accounting for 2.67% of the total area and 15.39% of the total mining area. The main types of subsidence are mild and moderate, with 29,682.91 ha of mild subsidence accounting for 54.72% and 17,790.03 ha of moderate subsidence accounting for 32.79%. The area of severe subsidence is 6776.15 ha, accounting for 12.49%. Each mining area has newly added subsidence areas, with the most concentrated distribution around the Nansi Lake. Among them, the Yanzhou mining area, Peibei mining area, and Juye mining area will add a large number of moderate and severe subsidence areas, while the Jining mining area and Zaoteng mining area will mainly have mild and moderate subsidence areas. In the subsidence area, 32,249.93 ha are cropland, accounting for 59.66%, 12,174.64 ha are water areas, accounting for 22.52%, and 8736.30 ha are built-up land, accounting for 16.16%. This result intuitively reflects the triple spatial coupling characteristics of “coal grain composite, coal water composite, and coal village (city) composite” in the high groundwater level coal–grain overlapping area of the Nansi Lake Basin.

4.2. Land Use Simulation Under Different Development Scenarios

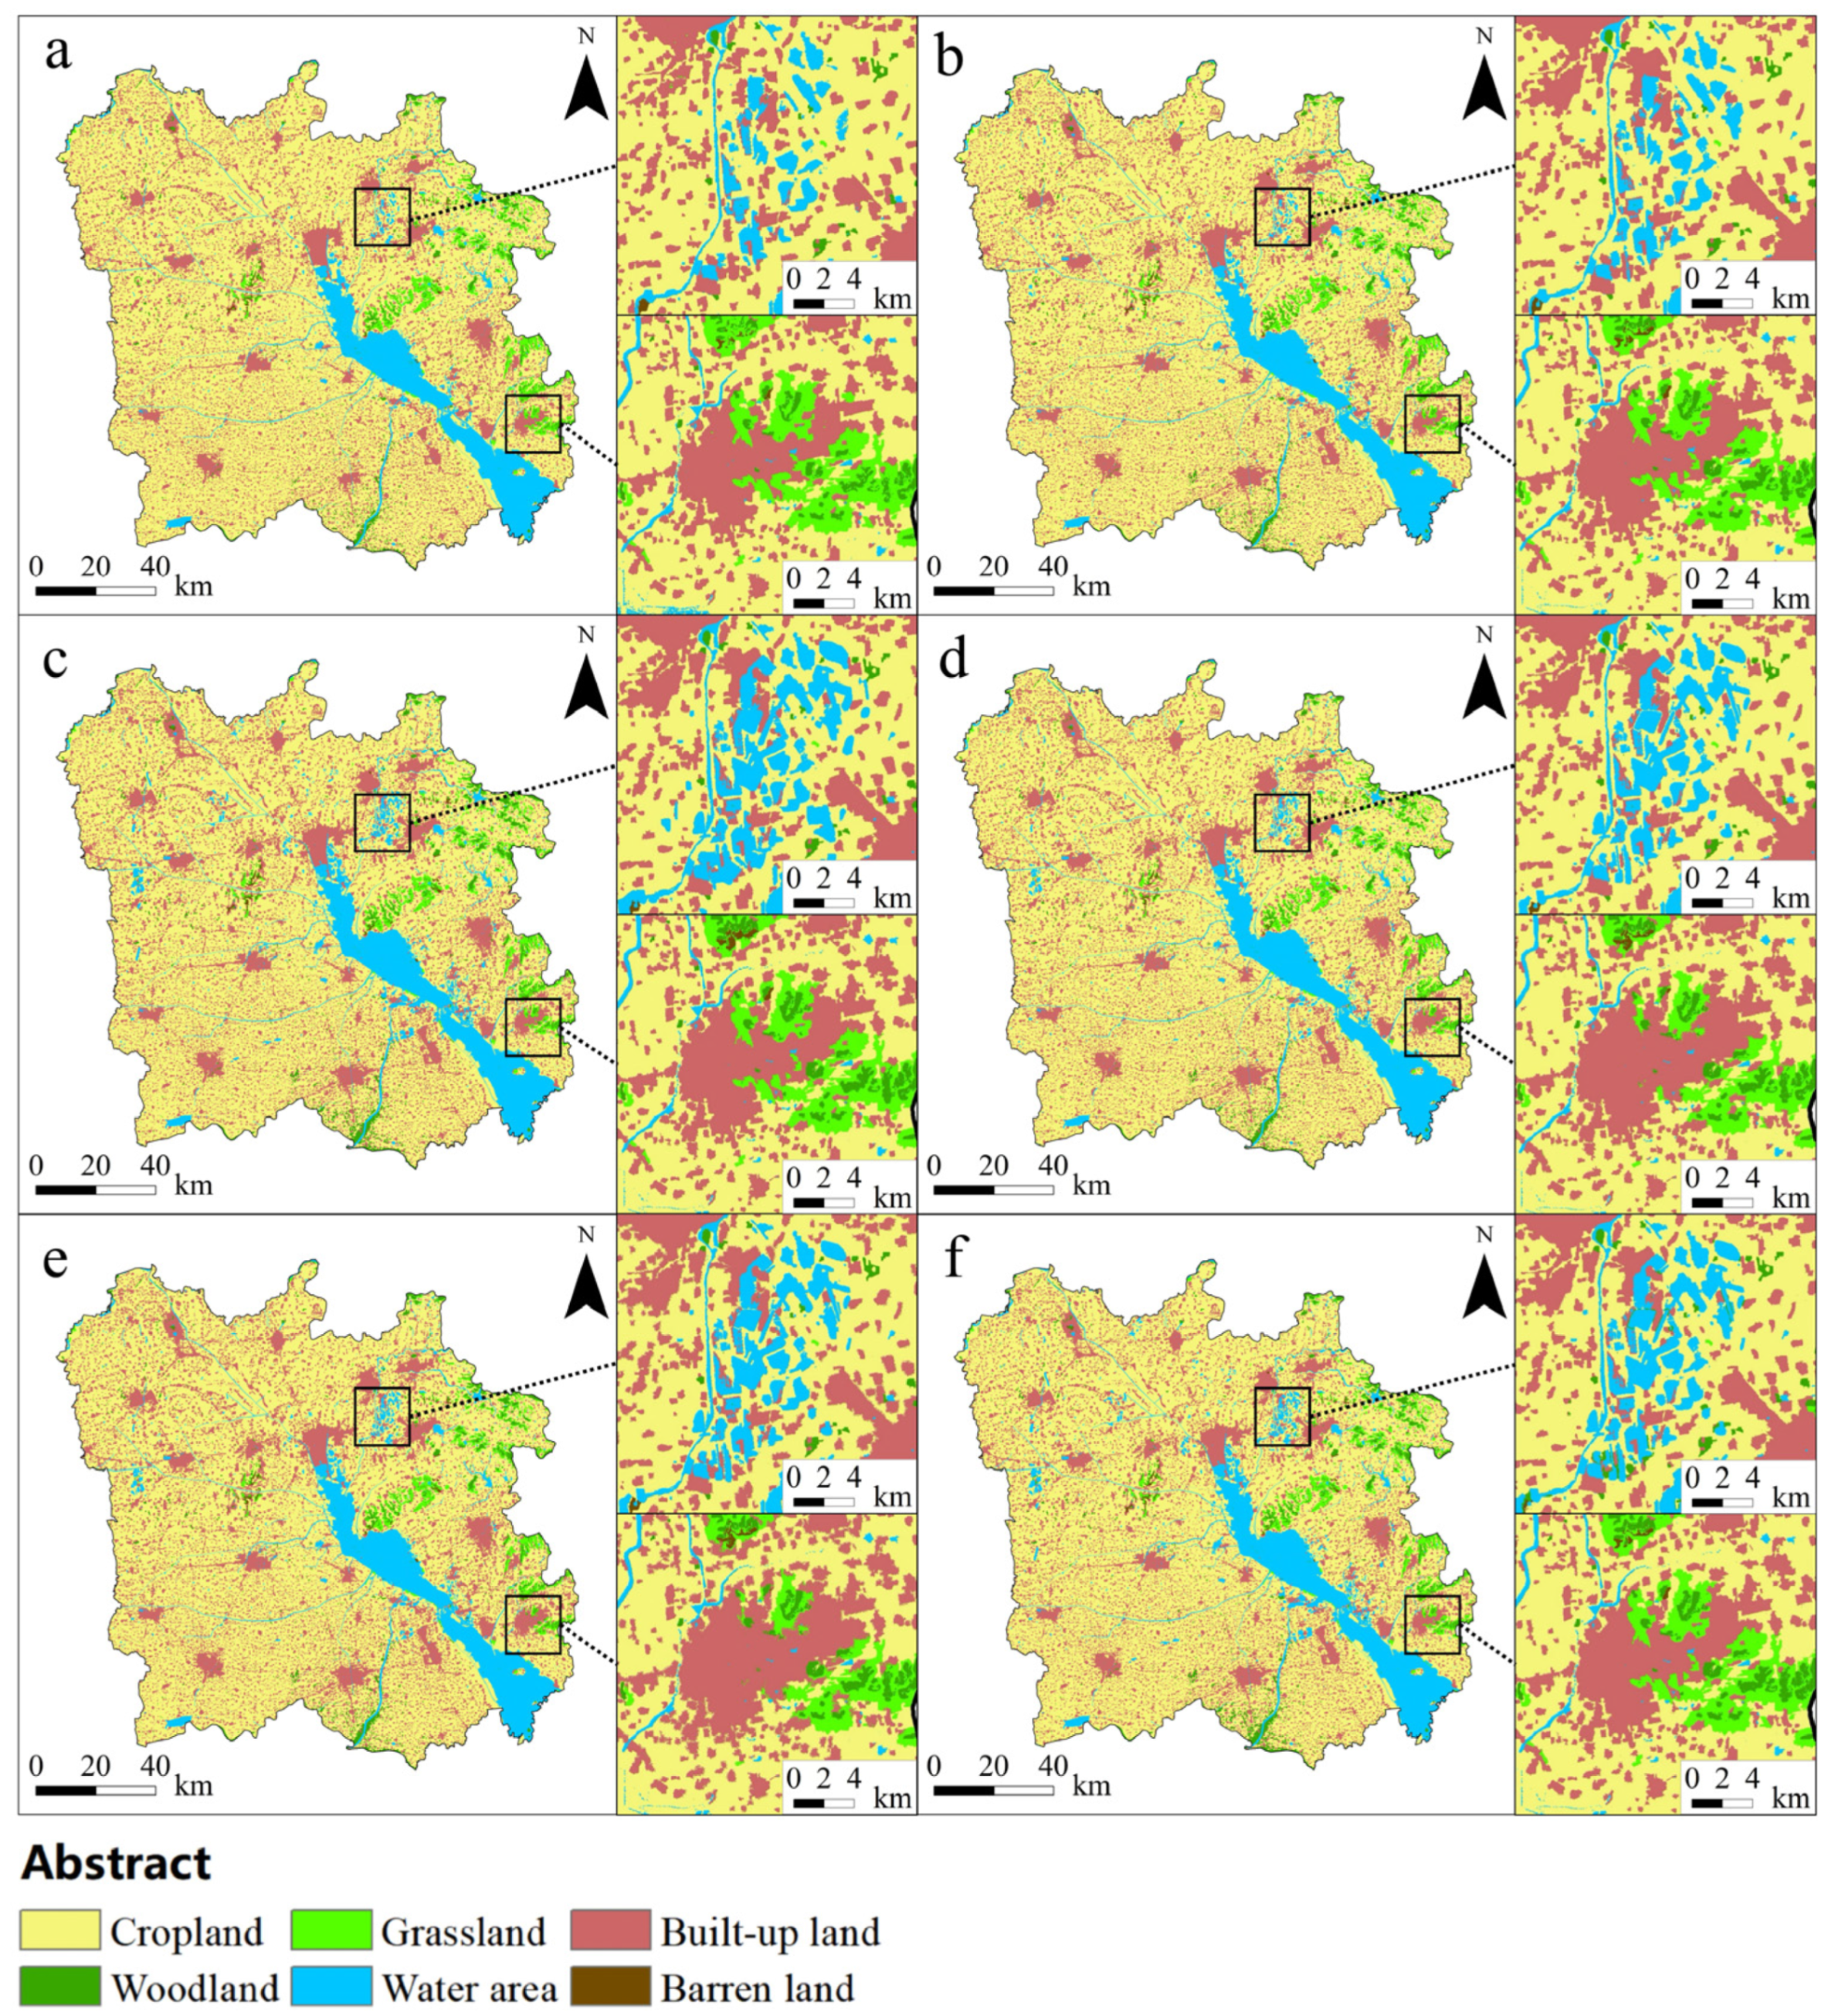
Using 2010 as the initial scenario and 2020 as the baseline scenario, the spatial changes in regional land use were simulated and analyzed (see Figure 5). The land use types in the region were mainly cropland, built-up land, and water bodies, accounting for 68.57%, 19.38%, and 7.87%, respectively, with a small amount of forest and grassland distributed, and a small amount of bare land scattered. Cropland is widely distributed in the plain areas within the watershed, especially in the Huangpan Plain area of Huxi. Cropland is concentrated and contiguous, with a large area, making it the main agricultural production area. Built-up land is concentrated in various cities and surrounding areas of counties within the region, mainly including urban built-up areas, towns, villages, and industrial and mining transportation land. Due to the limited terrain, it generally has a clustered spatial structure. As the largest water body in the basin, Nansi Lake has a vast water area and forms a regional water system network with numerous reservoirs, rivers, ponds, etc. woodland and grassland are mainly distributed in the low mountain and hilly areas in the east, with a small amount of cropland also distributed in the slopes and valleys of mountainous hills, but the level of intensive use is relatively low.
Two typical samples, “Yanzhou Mining Area” and “Zaozhuang New City”, were taken to enlarge and display the simulation results (see Figure 5): the ID scenario basically continues the land use pattern of the initial and baseline scenarios, with built-up land expanding continuously. Due to the natural evolution of coal mining subsidence land, the water area has also increased. In the scenario of SF, although the loss of cropland has been curbed to some extent, woodland and grassland in urban areas are still being encroached upon by built-up land. In the scenario of UE, the loss of woodland and grassland is particularly evident, and some woodland and grassland will be directly converted into built-up land. The ER scenario has led to the restoration of woodland and grassland, increasing the area of ecological land.
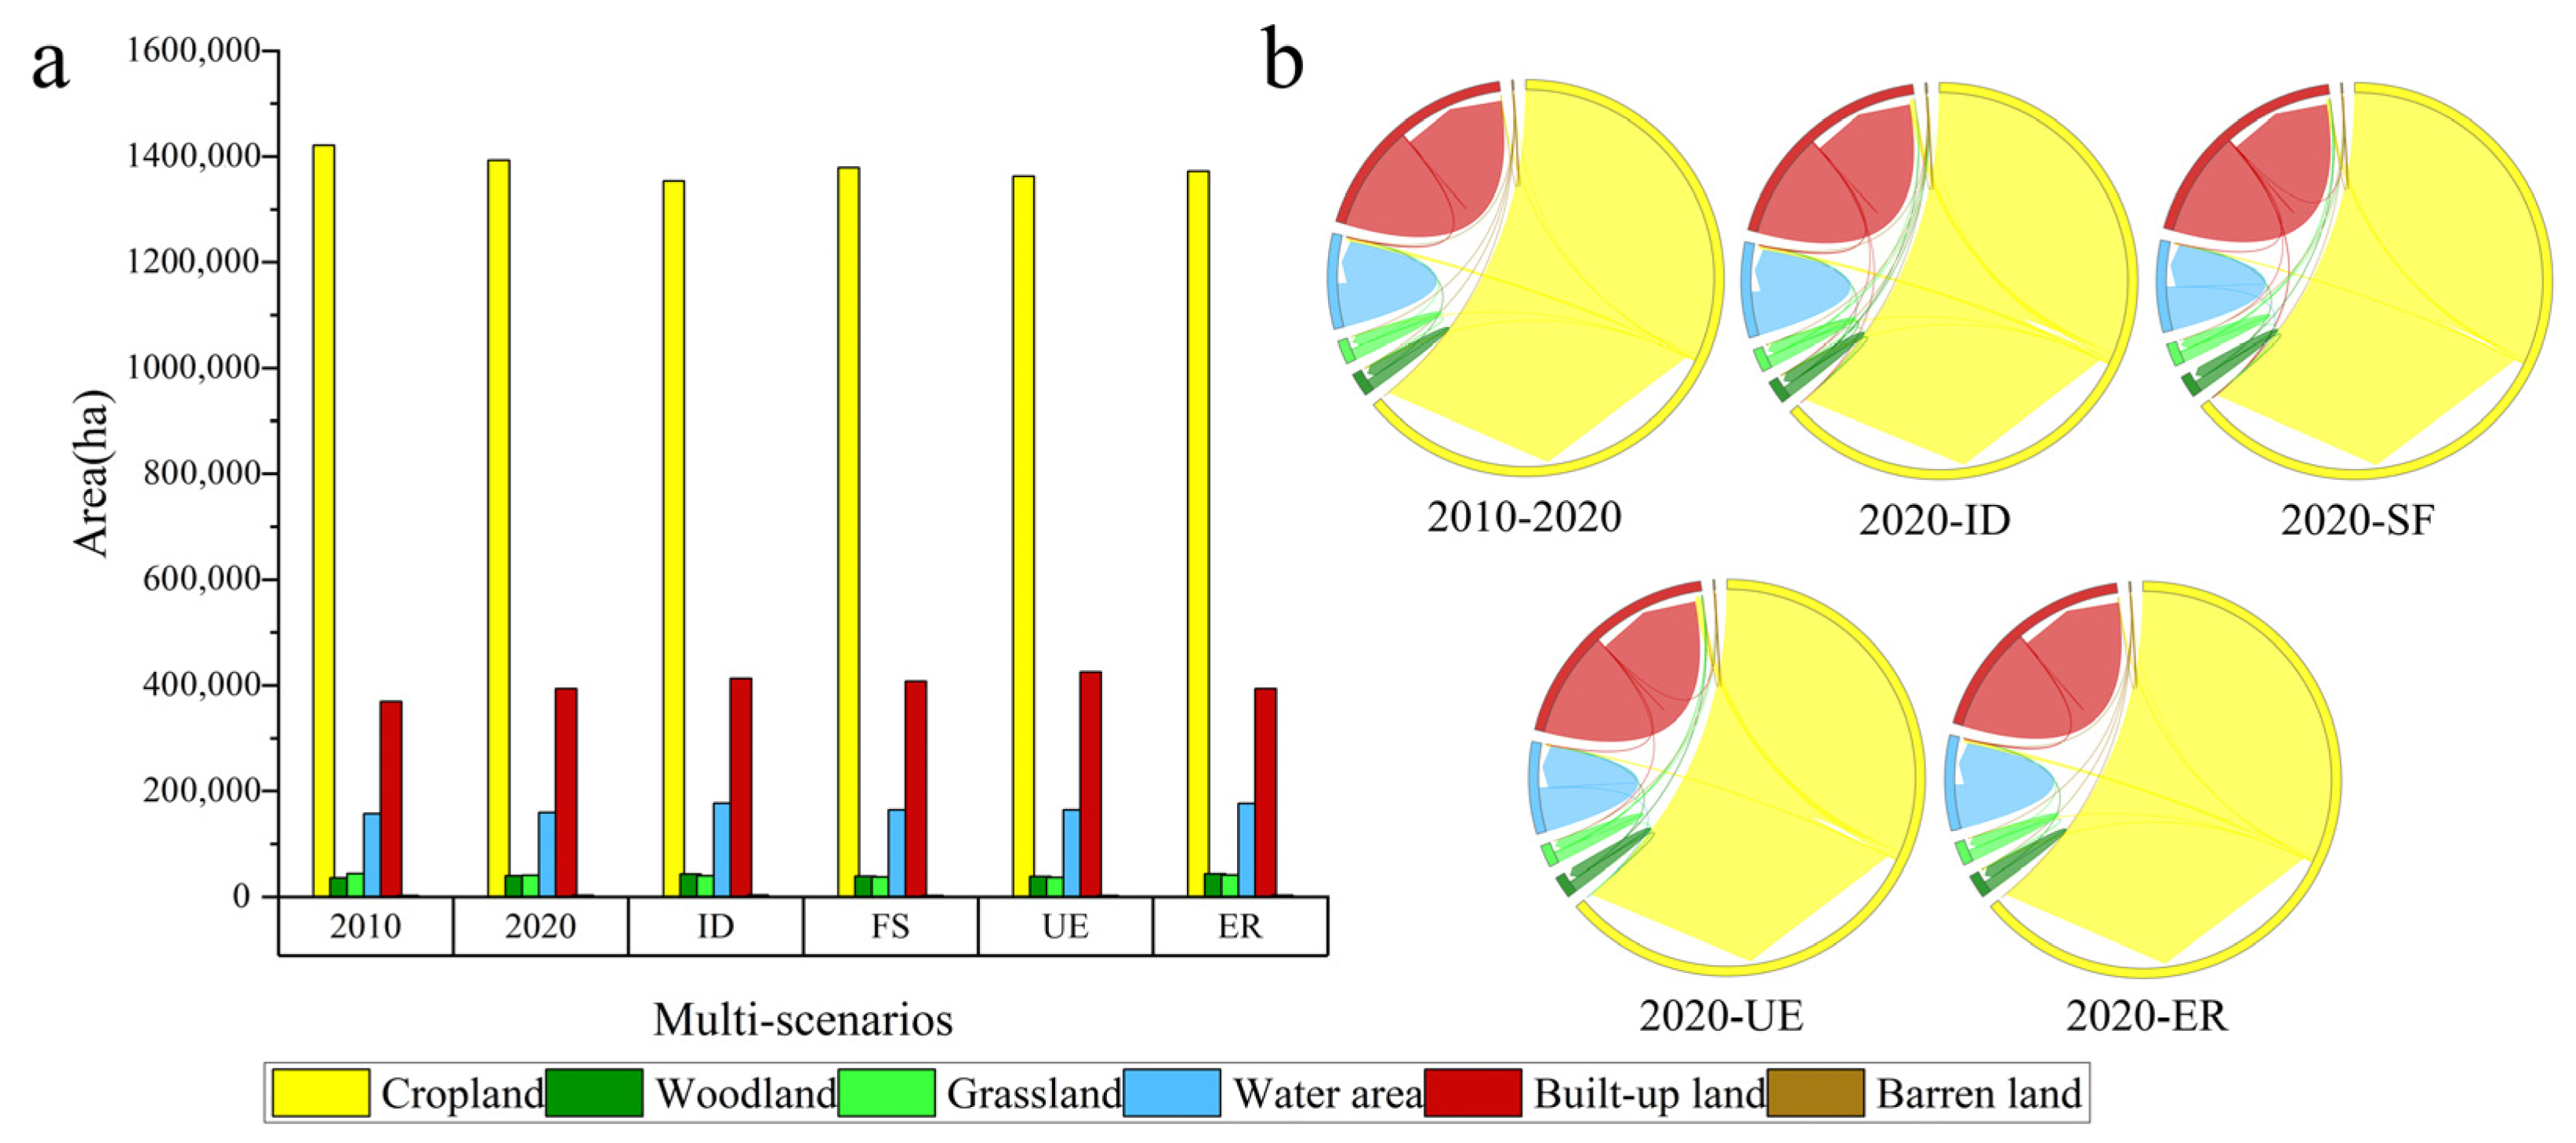
Figure 6a reflects the comparison of the number of land use types in multi-scenarios. During the 10-year period from 2010 to 2020, the cropland area decreased by 28,483.83 ha, accounting for 2%. In the ID scenario (compared to the baseline scenario), this proportion will reach 2.83%. The cropland area in other scenarios is also less than in the initial scenario, indicating that the trend of cropland loss in the region may be irreversible. From 2010 to 2020, the woodland increased by 3900.51 ha, while the grassland area decreased by 2996.37 ha. In the future, the evolution of woodlands and grasslands will initially show a scissor effect, which is related to the natural succession of vegetation communities, afforestation projects in mountainous and hilly areas, wetland water conservation forest projects in lake areas, and the promotion of economic forest planting. In the ER scenario, the woodland area will be higher than the ID scenario, and the grassland area will also return to the baseline scenario level. From 2010 to 2020, the water area increased by 2671.02 ha, and in the ID scenario, the water area will increase by 17,380.26 ha. The water area in other scenarios has also increased compared to the baseline scenario, mainly due to coal mining subsidence. From 2010 to 2020, the built-up land area increased by 6.61%, and the built-up land in the ID scenario, FS scenario, and UE scenario also increased. Among them, the built-up land area in the UE scenario will increase by 7.96% compared to the baseline scenario, while the built-up land area in the ER scenario will decrease slightly, mainly due to losses caused by coal mining subsidence.
As shown in Figure 6b, the main forms of regional land use transfer are the transfer of cropland and the transfer of built-up land. The transferred cropland is mainly transferred to built-up land, followed by water area. Between 2010 and 2020, a total of 34,724.16 ha of cropland were lost, of which 26,894.07 ha were converted into built-up land and 5303.16 ha were converted into water area. The growth of woodland mainly comes from the transfer of grassland and cropland, which are 2815.38 ha and 1755.36 ha, respectively. In addition, 2912.76 ha of water area and 2660.49 ha of built-up land have been reclaimed as cropland. In the future multi-scenarios, the transfer area of cropland from high to low is as follows: ID scenario (39,754.53 ha) > UE scenario (31,558.5 ha) > ER scenario (21,173.67 ha) > FS scenario (17,950.41 ha). The transfer area of built-up land from high to low is as follows: UE scenario (32,798.88 ha) > ID scenario (23,202.54 ha) > FS scenario (17,776.89 ha) > ER scenario (3850.47 ha). The transfer area of water from high to low is as follows: ID scenario (17,397 ha) > ER scenario (17,208.45 ha) > UE scenario (5975.82 ha) > FS scenario (5974.2 ha).

4.3. ESV Calculation Results and Comparative Analysis

In Table 4, the multi-scenarios and their corresponding types of ESVs are presented. From 2010 to 2020, the regional ESV increased slightly from CNY 47.4880 billion to CNY 47.81 billion, an increase of CNY 312.85 million (0.66%). In the multi-scenarios, the total ESV from high to low is as follows: ER scenario (CNY 51.21 billion) > ID scenario (CNY 51.09 billion) > FS scenario (CNY 48.48 billion) > UE scenario (CNY 48.27 billion). It can be seen that the total ESV of the ER scenario is the highest, which can achieve the maximization of ecological benefits, while the total ESV of the UE scenario is the lowest, only slightly higher than the baseline scenario. Among various types of ecosystem service functions, the ESV of hydrological regulation accounts for about 50%, and its value is mainly contributed by water bodies, which fully demonstrates the important role of aquatic ecosystems in the overall ecological benefits of the region. Sensitivity analysis was conducted by adjusting the ecosystem service value coefficient up and down by 50%. The results indicate that all sensitivity indices are between 0 and 1, indicating that ESV is inelastic and insensitive to changes in coefficients. The research results are relatively reliable, and this coefficient is suitable for calculating ESV in the study area.
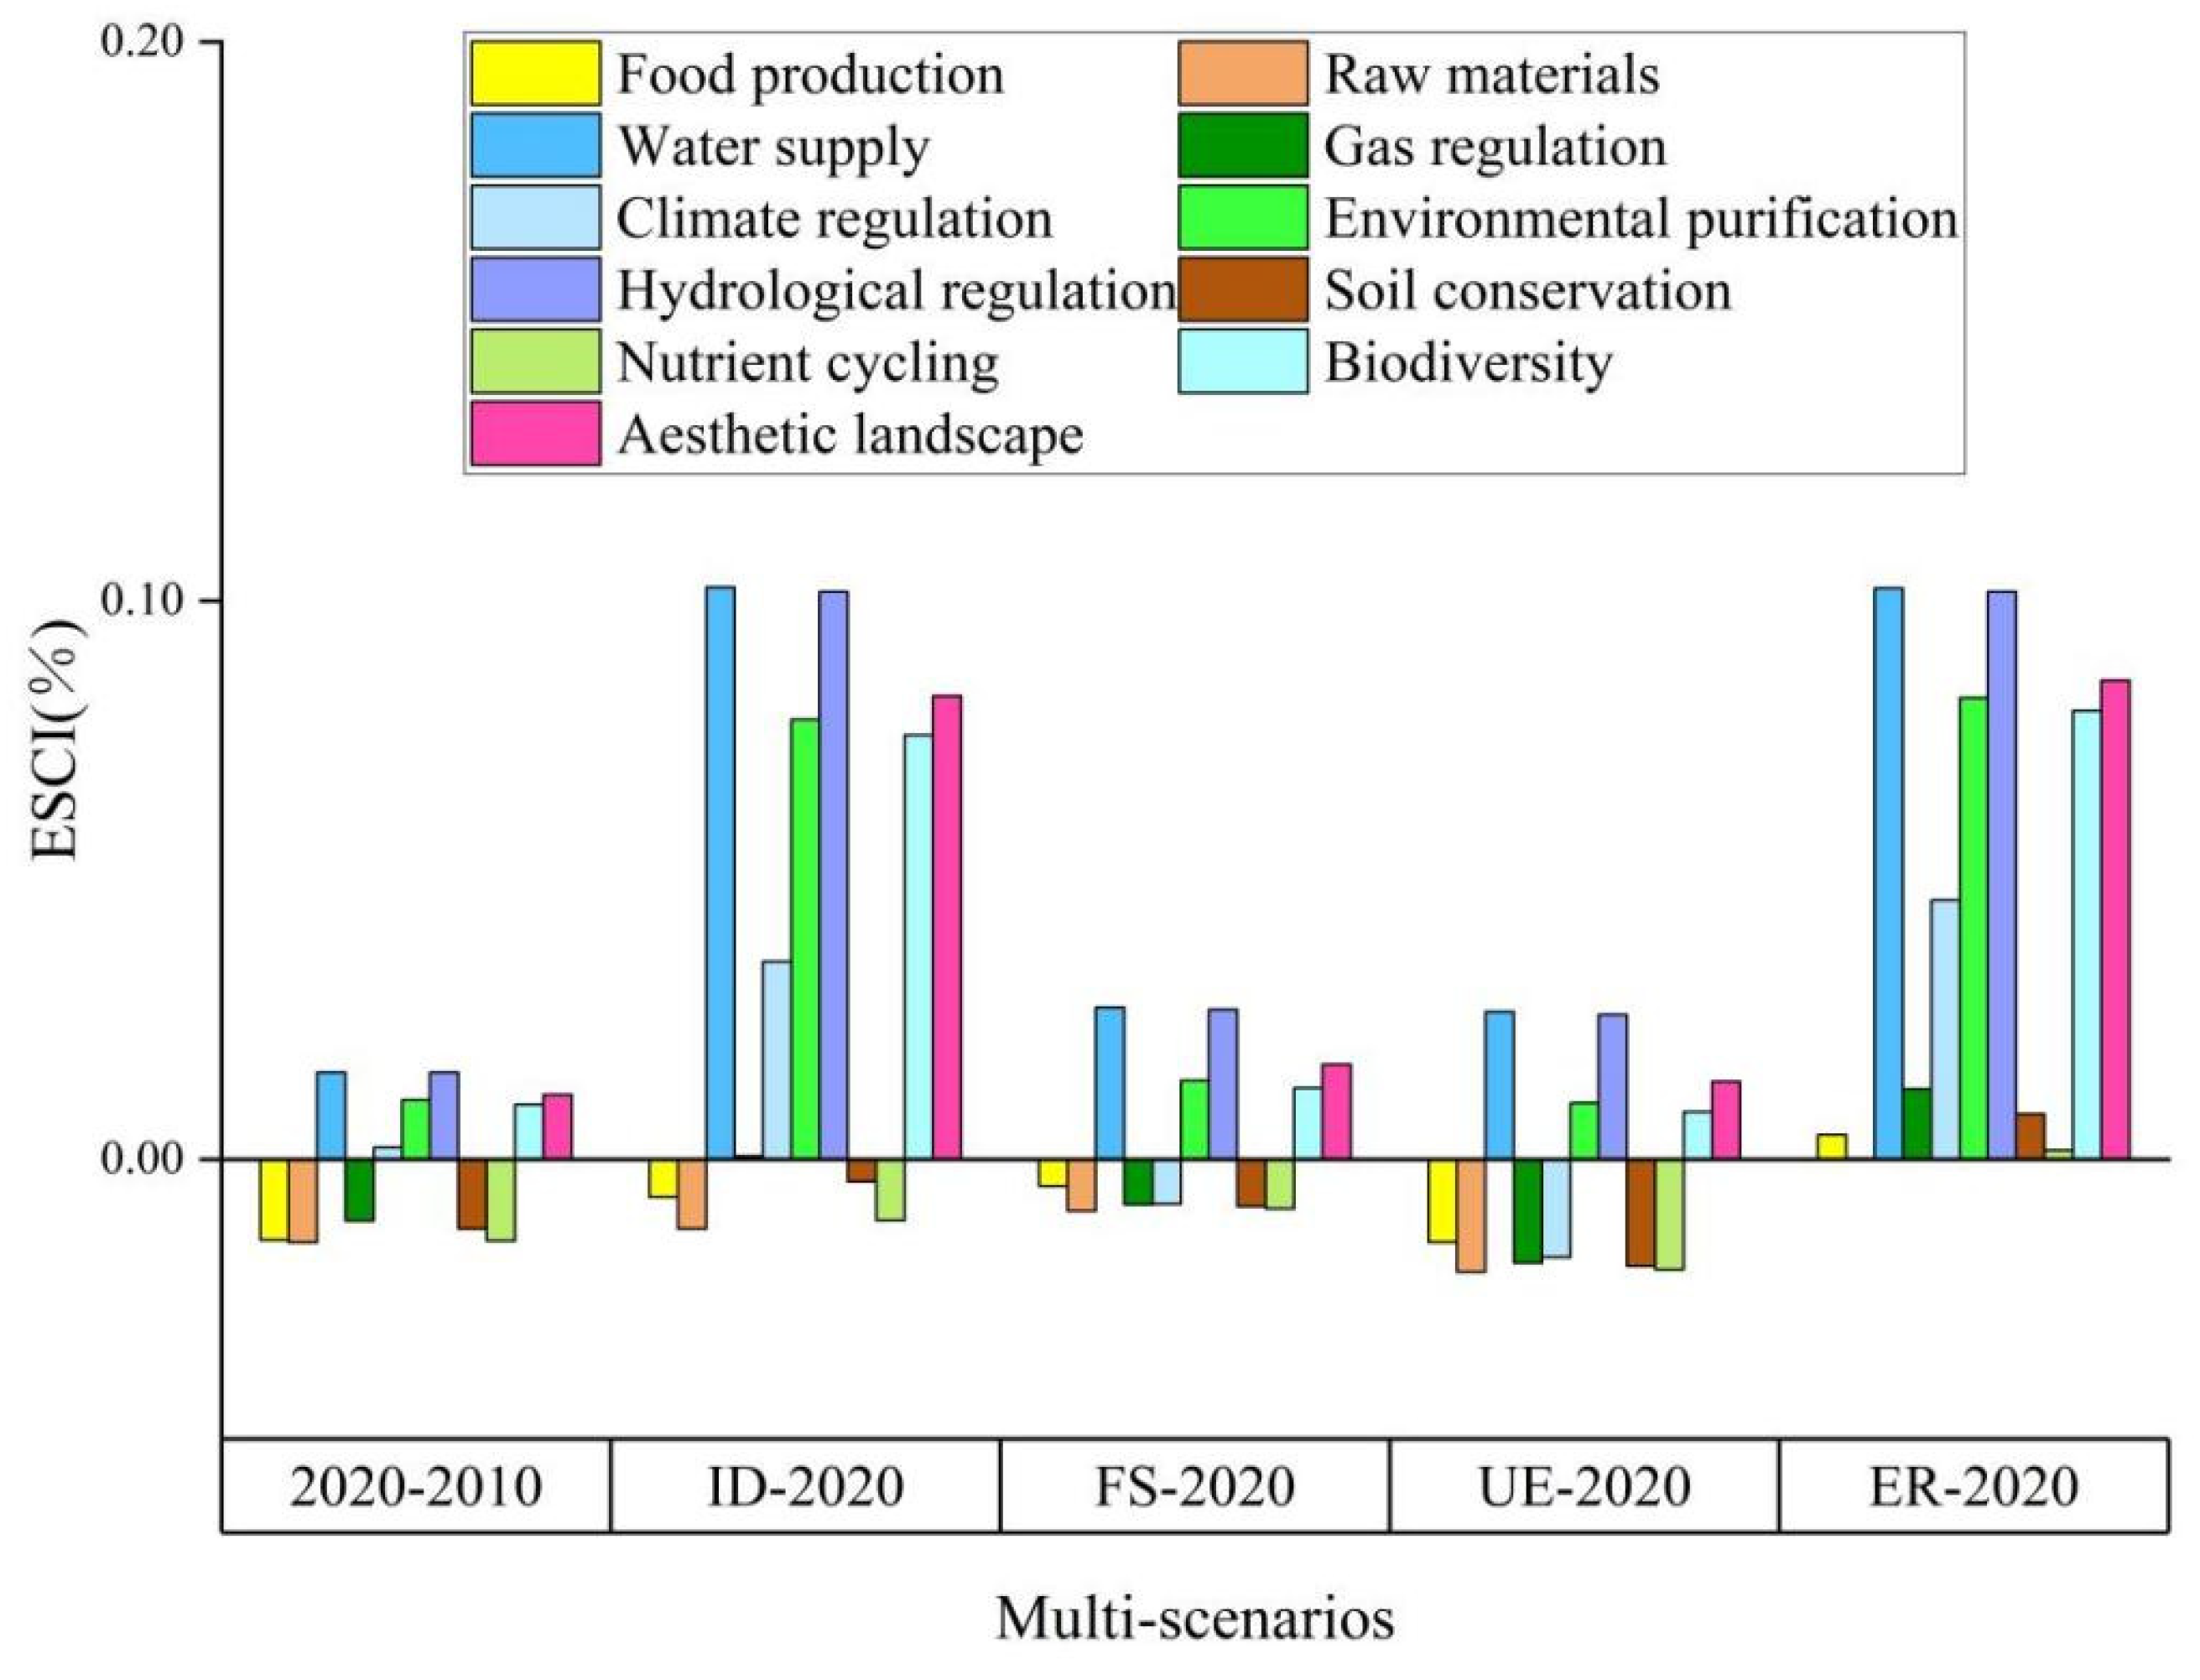
By comparing the change of individual ESCI between baseline scenarios and other multi-scenarios, we reveal the evolution characteristics of ESV under different development modes (see Figure 7). Between 2010 and 2020, although the total amount of ESV increased by CNY 312.85 million, the value of food production, raw materials, gas regulation, soil conservation, nutrient cycling, and other aspects decreased. Although the ID scenario has a high total ESV and a significant increase in hydrological regulation value, the values of food production, raw materials and soil conservation have also decreased. The overall ESV increase in the FS scenario and UE scenarios is relatively small, and there are significant losses in values such as food production, raw materials, gas regulation, climate regulation, soil conservation, and nutrient cycling. The single ESV loss in the UE scenario is more severe. On the contrary, in the ER scenario, the overall ESV reached its highest level without any loss of individual ESVs, and all types of ESVs showed gains, basically achieving the goal of Pareto improvement.
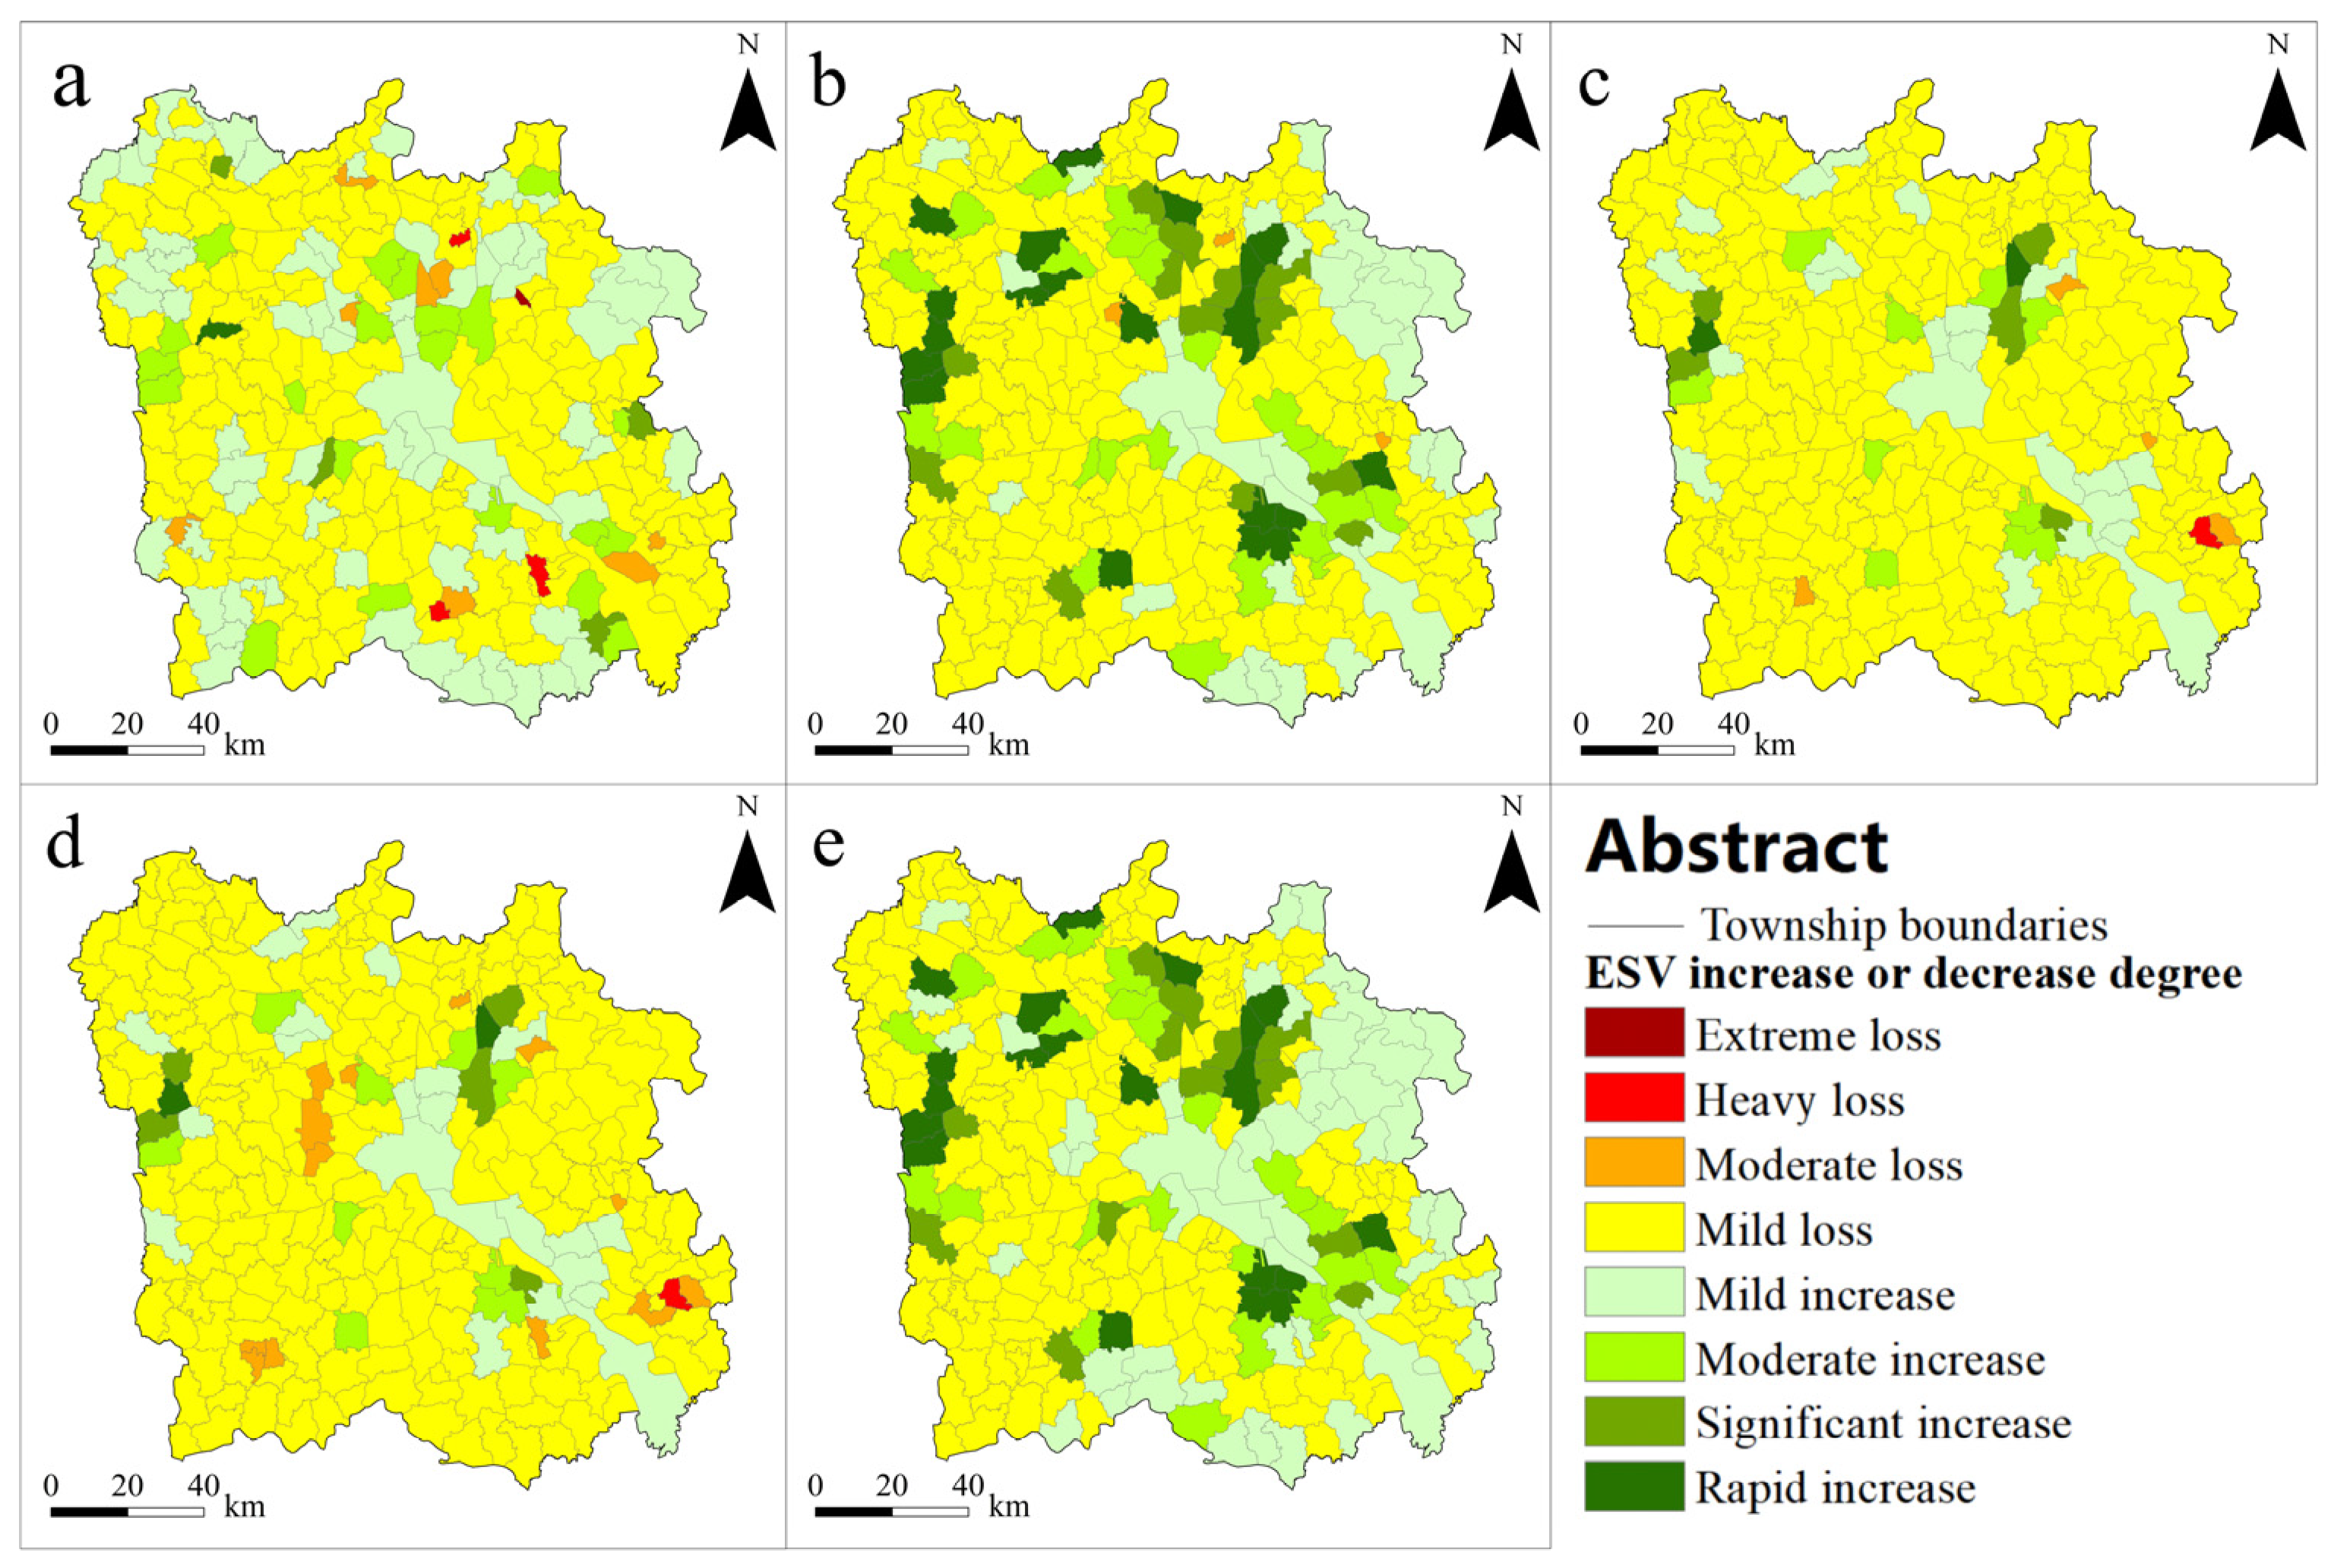
Map ESCI to 267 urban spaces and divide the degree of change into eight levels, with intervals of ±50%, ±30%, ±20%, and ±10%. Further analyze the spatial variation characteristics of ESV in multi-scenarios of coal–grain overlapping areas (see Figure 8). Between 2010 and 2020, the ESV of most townships showed mild changes and remained relatively stable. There were five townships with significant or extremely significant growth in ESV, but there were still 12 townships with moderate or above losses in ESV, including three townships with severe losses and one township with extremely severe losses. In the scenario of ID, the ecosystem service functions have been significantly improved, with 55 townships showing a moderate or above increase in ESV, among which mining townships have shown significant and extremely significant increases. In the scenarios of FS and UE, 5 and 14 townships, respectively, experienced moderate to severe losses, mainly in urban areas or suburban townships. ESV in eastern mountainous townships generally degraded, with only some mining townships experiencing an increase in ESV. In the ER scenario, the difference in ESV between towns has decreased, and there has been no moderate or above loss of ESV. At the cost of mild ESV loss in a few plain agricultural towns, the ESV of mountainous towns, lake towns, and mining towns has significantly increased, especially in mining towns where the growth is most significant. There are 24 towns with significant or rapid ESV growth, which is highly consistent with the scope of subsidence areas.

5. Discussion

5.1. The Necessity of Imposing Dual Constraints on Land Use Demand in Coal–Grain Overlapping Areas—Differences in Ecosystem Evolution Paths

The coal–grain overlapping areas are a complex and open giant system composed of different elements with a certain structure and function as a whole [50]. Based on the boundary of the mining area, it can be divided into two subsystems: internal and external. The two subsystems interact and influence each other [51], and together form a high-level coal grain composite ecological system. The internal and external ecosystems of the mining area exhibit vastly different evolutionary paths due to the heterogeneity of disturbance mechanisms, evolution speed, and response patterns: the external ecosystem of the mining area is a gradual balance between disturbance and function, dominated by agricultural development and urbanization, and the structure and function of the ecosystem show a gradual transformation [52]. The internal ecosystem of the mining area is characterized by abrupt disturbance and system reconstruction, with mineral resource development and ecological governance as the dominant factors. The structure and function of the ecosystem exhibit nonlinear mutations [53,54]. By 2030, it is expected that the research area will increase by 54,249.09 ha of subsidence land. If the subsidence area is allowed to evolve naturally without human intervention, 12,174.64 ha of subsidence land will be directly converted into water bodies, resulting in a 10.8% increase in water area compared to 2020 (ID scenario), forming an ecological succession path of “underground coal mining surface subsidence water accumulation into lakes wetland growth”, evolving from a single terrestrial ecosystem to a water land composite ecosystem [55].
Due to the nonlinearity of changes, traditional models are difficult to directly simulate land use changes in high groundwater level mining areas and, therefore, cannot reveal the evolution laws of their ecosystems. This study applies dual constraints on land use demand both inside and outside the subsidence zone, which not only enables objective and accurate simulation and prediction but also optimizes overall efficiency through subsystem coupling and coordination, avoiding systemic risks caused by a single goal orientation. In fact, relying solely on the self-repairing ability of natural ecosystems cannot completely eliminate the ecological disturbance caused by coal mining [56]. Reasonable ecological governance strategies are crucial for the health of the coal grain composite area ecosystem [57]. If urban expansion and cropland protection are regarded as elastic adjustments, then land reclamation and ecological restoration in coal mining subsidence areas are rigid controls, which together constitute a dual constraint on land use in coal grain composite areas. By using the mechanism of “rigid-elastic combination” to ensure that land use change is within the carrying capacity threshold of the ecosystem, the governance transformation from “local rationality” to “system optimization” can be achieved, and realize Pareto improvement of regional ecosystems.

5.2. Coal–Grain Overlapping Areas’ ESV Evolution Characteristics and Governance Path Trade-Offs Under Different Scenarios

Coupled Model Intercomparison Project Phase 6 (CMIP6) promoted research on land use change simulation under multi-scenarios [58], making it an important research method for optimizing land allocation [59]. Comparing the multi-scenarios, it was found that there were significant differences in the impact of different land use strategies on ESV. Under the ID scenario, although the total ESV is relatively high, the value of food production, raw material, and other aspects still show a downward trend, indicating that continuing the existing development model is difficult to fundamentally solve the human land contradiction in the coal–grain overlapping area. Although the FS scenario to some extent ensures the cropland area, it sacrifices ecological land such as woodland and grasslands, resulting in a decrease in the value of services such as gas regulation and biodiversity, reflecting the limitations of a single goal-oriented development model. In fact, in the context of limited cropland resources, the possibility of increasing production through grain sowing area in the future is already low [60]. To ensure food security, in addition to implementing strict cropland protection systems, attention should also be paid to the construction of agricultural water conservancy facilities, agricultural mechanization, high-quality grain seed cultivation, and improving the level of grain yield per unit area [61], compensating for potential grain losses caused by urbanization and resource exploitation. In the UE scenario, the large-scale occupation of cropland and ecological land by built-up land has resulted in the lowest total ESV and significant damage to multiple service functions, highlighting the enormous threat of blind urbanization to the ecosystem. In coal mining areas with high groundwater levels, resource development and rapid urbanization have brought dual pressures to regional ecological security [53], increasing the vulnerability of the ecological environment [62].
Under the ER scenario, the total ESV in the study area reached CNY 51.21 billion, and all individual ESVs achieved gains, basically achieving the Pareto improvement goal. This result confirms the key significance of proactive ecological restoration strategies for the ecosystem gain of high groundwater level coal–grain overlapping areas. By expanding forest and water areas, returning cropland to forests and wetlands, and other measures, this scenario fully leverages the dominant role of aquatic ecosystems in hydrological regulation [28] (accounting for about 50% of the total ESV), while synergistically enhancing multiple service functions such as biodiversity and climate regulation. This indicates that in areas with strong coal mining disturbances, a development model centered on ecological restoration can effectively alleviate the contradiction between resource development and ecological protection [63]. This study confirms that through technological innovation and systematic governance, the ecological benefits of high groundwater level coal–grain overlapping areas can achieve Pareto improvement, and preliminarily explores the improvement path. However, the implementation of ecological governance needs to comprehensively consider the interests of multiple parties. In practice, the collaborative path of “ecological compensation + industrial transformation” can be borrowed, such as providing economic compensation to farmers whose livelihoods have been transferred due to coal mining subsidence and whose income has decreased due to returning cropland to forests and wetlands, and guiding them to participate in green industries such as ecotourism and ecological agriculture, in order to balance the relationship between ecological protection and livelihood development, and ensure the sustainability of ecological governance measures [64,65].

6. Limitations

This study focused on future scenario simulation and comparative analysis, so there was no long-term analysis of the evolution of ESV in coal–grain overlapping areas. Although the equivalent factors relied on for ESV calculation have been localized and corrected, some ESVs are still difficult to accurately quantify. The constraint rules in the multi-scenario settings only consider changes in land use area, and relatively lack consideration for factors such as the complexity of human behavior decision-making and dynamic policy adjustments. The ecological restoration strategy within the mining area is relatively crude. Apart from distinguishing the level of subsidence and the area inside and outside the lake, it has not taken into account more local factors such as distance from the urban area and the size of the subsidence zone. Future research can set more constraint conditions, further expand scenario dimensions, improve the logical details of scenario settings and explore more forward-looking sustainable development models.
The PLUS model has advantages in simulating patch-level land use changes, but it still lacks sufficient characterization of the micro-geomorphological evolution of mining subsidence (such as the relocation of coal mining villages). The spatial resolution of most driving factor data is lower than that of land use data, which, to some extent, reduces the accuracy of the simulation. In future research, more advanced machine learning or deep learning algorithms can be introduced to improve model structure, expand functional modules, and further optimize the predictive ability of the model. Combining socio-economic big data, such as national spatial planning data, to enhance the explanatory power of the model for complex land use changes. At present, the second-generation PLUS model-intPLUS has been launched, and scholars should conduct empirical case studies as soon as possible to test its applicability.

7. Conclusions

This study takes the high groundwater level coal–grain overlapping area in the Nansi Lake Basin as the object, and through constructing a multi-scenario simulation with dual constraints, reveals the impact mechanism of land use change on ESV under the background of coal mining subsidence. Research shows that by 2030, a large number of coal mining subsidence areas will be added to the region, causing severe damage to cropland and continuous evolution of land use patterns. Four scenario simulations show that the total ESV under the ER scenario is the highest (CNY 51.21 billion), and all individual ESVs have achieved gains, effectively improving regional ecological benefits. The UE scenario leads to a significant decrease in ESV, exacerbating the degradation of ecological service functions. Further confirmation shows that ecological restoration can narrow the ESV gap between small towns, especially promoting ecological improvement in mining towns. Research has confirmed that the ecological restoration strategy of active intervention and scientific planning is a key path to coordinate resource development and ecological protection. The core contradiction of the human–land system in the high groundwater level coal–grain overlapping area lies in the collaborative dilemma between coal resource development, food security, and ecosystem protection. Subsequent research should pay attention to the integrity and heterogeneity of composite ecosystems, explore multidimensional collaboration and optimization paths driven by multiple factors, including “source control process restoration structural transformation benefit balance”, and ultimately build a new pattern of human–land system coordination.

Author Contributions

Q.N. contributed to the research conception and wrote the major manuscript. D.Z. checked the logical structure of the paper, streamlined some content, and adjusted the format of the paper. Y.W. provided project funding support. Z.D. defined the scope of the coal–grain overlapping areas in this study. G.Q. adjusted the parameters of the PLUS model. All authors have read and agreed to the published version of the manuscript.

Funding

This research was funded by the “2022 CUMT Outstanding Student Innovation Special Fund”, Fundamental Research Funds for Central Universities, grant number (2022XSCX36).

Institutional Review Board Statement

Not applicable.

Informed Consent Statement

Not applicable.

Data Availability Statement

The data presented in this study are available upon request from the corresponding author. The data are not publicly available due to privacy.

Acknowledgments

The authors would like to thank the reviewers and the editor, whose suggestions greatly improved the manuscript. We would also like to thank Shandong Quanxing Energy Group for coordinating and providing relevant coalfield geological data.

Conflicts of Interest

The authors declare no conflicts of interest.

References

  1. Costanza, R.; D’Arge, R.; de Groot, R.; Farber, S.; Grasso, M.; Hannon, B.; Limburg, K.; Naeem, S.; O’Neill, R.V.; Paruelo, J.; et al. The value of the world’s ecosystem services and natural capital. Nature 1997, 387, 253–260. [Google Scholar] [CrossRef]
  2. Daily, G.C. Nature’s services: Societal dependence on natural ecosystems. Pac. Conserv. Biol. 1997, 6, 220–221. [Google Scholar]
  3. De Groot, R.S.; Wilson, M.A.; Boumans, R.M.J. A typology for the classification, description and valuation of ecosystem functions, goods and services. Ecol. Econ. 2002, 41, 393–408. [Google Scholar] [CrossRef]
  4. Tallis, H.; Mooney, H.; Andelman, S.; Balvanera, P.; Cramer, W.; Karp, D.; Polasky, S.; Reyers, B.; Ricketts, T.; Running, S.; et al. A global system for monitoring ecosystem service change. BioScience 2012, 62, 977–986. [Google Scholar] [CrossRef]
  5. MA (Millennium Ecosystem Assessment). Ecosystems and Human Well-being: Current State and Trends: Synthesis; Island Press: Washington, DC, USA, 2005; pp. 829–838. [Google Scholar]
  6. Bennett, E.M.; Peterson, G.D.; Levitt, E.A. Looking to the future ecosystem services. Ecosystems 2005, 8, 125–132. [Google Scholar] [CrossRef]
  7. Xie, G.D.; Lu, C.X.; Leng, Y.F. Valuation of Ecological Assets in the Qinghai Tibet Plateau. J. Nat. Resour. 2003, 18, 189–196. [Google Scholar]
  8. Su, Y.; Ma, X.; Feng, Q.; Liu, W.; Zhu, M.; Niu, J.; Liu, G.; Shi, L. Patterns and controls of ecosystem service values under different land-use change scenarios in a mining-dominated basin of northern China. Ecol. Indic. 2023, 151, 15. [Google Scholar] [CrossRef]
  9. Fisher, B.; Turner, R.K. Ecosystem services: Classification for valuation. Biol. Conserv. 2008, 141, 1167–1169. [Google Scholar] [CrossRef]
  10. Costanza, R.; de Groot, R.; Sutton, P.; van der Ploeg, S.; Anderson, S.J.; Kubiszewski, I.; Farber, S.; Turner, R.K. Changes in the global value of ecosystem services. Global Environ. Change 2014, 26, 152–158. [Google Scholar]
  11. Long, H.X.; Yuan, L.; Yin, Z.L.; Wu, X. Spatiotemporal of ecosystem service values response to land use/cover change based on geo-informatic Tupu-A case study in Tianjin. China. Ecol. Indic. 2023, 154, 110511. [Google Scholar] [CrossRef]
  12. Styers, D.M.; Chappelka, A.H.; Marzen, L.J.; Somers, G.L. Developing a land-cover classification to select indicators of forest ecosystem health in a rapidly urbanizing landscape. Landsc. Urban Plan. 2010, 94, 158–165. [Google Scholar] [CrossRef]
  13. Song, Y.; Zhang, M.; Sun, R. Using a new aggregated indicator to evaluate China’s energy security. Energy Policy 2019, 132, 167–174. [Google Scholar] [CrossRef]
  14. Xue, L.; Zhang, W.; Zheng, Z.; Liu, Z.; Meng, S.; Li, H.; Du, Y. Measurement and influential factors of the efficiency of coal resources of China’s provinces: Based on Bootstrap-DEA and Tobit. Energy 2021, 221, 119763. [Google Scholar] [CrossRef]
  15. Han, J.; Hu, Z.; Wang, P.; Yan, Z.; Li, G.; Zhang, Y.; Zhou, T. Spatio-temporal evolution and optimization analysis of ecosystem service value-A case study of coal resource-based city group in Shandong, China. J. Clean. Prod. 2022, 363, 132602. [Google Scholar] [CrossRef]
  16. Xiao, W.; Fu, Y.H.; Wang, T.; Lv, X.J. Effects of land use transitions due to underground coal mining on ecosystem services in high groundwater table areas: A case study in the Yanzhou coalfield—ScienceDirect. Land Use Policy 2018, 71, 213–221. [Google Scholar] [CrossRef]
  17. Zhu, X.; Ning, Z.; Cheng, H.; Zhang, P.; Sun, R.; Yang, X.; Liu, H. A novel calculation method of subsidence waterlogging spatial information based on remote sensing techniques and surface subsidence prediction. J. Clean. Prod. 2022, 335, 130366. [Google Scholar] [CrossRef]
  18. Hu, Z.Q.; Li, J.; Zhao, Y.L. Problems, Causes, and Countermeasures of Environmental Quality and Food Security in Mineral and Grain Composite Main Production Areas. Sci. Technol. Rev. 2006, 24, 21–24. [Google Scholar]
  19. He, T.; Xiao, W.; Zhao, Y.L.; Deng, X.; Hu, Z. Identification of waterlogging in Eastern China induced by mining subsidence: A case study of Google Earth Engine time-series analysis applied to the Huainan coal field. Remote Sens. Environ. 2020, 242, 111742. [Google Scholar] [CrossRef]
  20. Bian, Z.; Miao, X.; Lei, S.; Chen, S.; Wang, W.; Struthers, S. The challenges of reusing mining and mineral-processing wastes. Science 2012, 337, 702–703. [Google Scholar] [CrossRef]
  21. Darwin, R.; Tsigas, M.; Lewandrowski, J.; Raneses, A. Land use and cover in ecological economics. Ecol. Econ. 1996, 17, 157–181. [Google Scholar] [CrossRef]
  22. Xiao, J.; Zhang, Y.; Xu, H. Response of ecosystem service values to land use change, 2002–2021. Ecol. Indic. 2024, 160, 111947. [Google Scholar] [CrossRef]
  23. Wang, J.; Peng, P.; Liu, T.; Wang, J.; Zhang, S.; Niu, P. Revealing the Spatiotemporal Changes in Land Use and Landscape Patterns and Their Effects on Ecosystem Services: A Case Study in the Western Sichuan Urban Agglomeration, China. Land 2025, 14, 1012. [Google Scholar] [CrossRef]
  24. Fu, B.J.; Zhang, L.W. Land use change and ecosystem services: Concepts, methods, and progress. Adv. Geogr. Sci. 2014, 33, 441–446. [Google Scholar]
  25. Han, J.; Hu, Z.; Mao, Z.; Li, G.; Liu, S.; Yuan, D.; Guo, J. How to Account for Changes in Carbon Storage from Coal Mining and Reclamation in Eastern China? Taking Yanzhou Coalfield as an Example to Simulate and Estimate. Remote Sens. 2022, 14, 2014. [Google Scholar] [CrossRef]
  26. Zhang, M.; Yuan, X.; Guan, D.; Liu, H.; Sun, K.; Zhang, G.; Wang, K.; Zhou, L.; Wang, F.; Sun, J. An ecological scenario prediction model for newly created wetlands caused by coal mine subsidence in the Yanzhou, China. Environ. Geochem. Health 2020, 42, 1991–2005. [Google Scholar] [CrossRef]
  27. Liu, S.; Liu, L.; Li, J.; Zhou, Q.; Ji, Y.; Lai, W.; Long, C. Spatiotemporal Variability of Human Disturbance Impacts on Ecosystem Services in Mining Areas. Sustainability 2022, 14, 7547. [Google Scholar] [CrossRef]
  28. Bao, X.Y.; Guo, Q.B.; Wu, S.B.; Luo, J.; Xu, J.R. Identifying the spatio-temporal evolution and driving mechanisms of ecosystem service value in high groundwater table coal mining areas. Environ. Monit. Assess. 2025, 197, 581. [Google Scholar] [CrossRef] [PubMed]
  29. Kouassi, J.L.; Gyau, A.; Diby, L.; Bene, Y.; Kouamé, C. Assessing land use and land cover change and farmers’ perceptions of deforestation and land degradation in South-West Côte d’Ivoire, West Africa. Land 2021, 10, 429. [Google Scholar] [CrossRef]
  30. Haase, D.; Haase, A.; Kabisch, N.; Kabisch, S.; Rink, D. Actors and factors in land-use simulation: The challenge of urban shrinkage. Environ. Model. Softw. 2012, 35, 92–103. [Google Scholar] [CrossRef]
  31. Li, X.; Li, X. and Yeh, A.G.-O. Neural-Network-Based Cellular Automata for Simulating Multiple Land Use Changes Using GIS. Int. J. Geogr. Inf. Sci. 2002, 16, 323–343. [Google Scholar] [CrossRef]
  32. Li, S.Y.; Liu, X.P.; Li, X.; Chen, Y.M. Research progress on simulation models and applications of land use change. J. Remote Sens. 2017, 21, 329–340. [Google Scholar]
  33. Yang, J.; Gong, J.; Tang, W.; Liu, C. Patch-based cellular automata model of urban growth simulation: Integrating feedback between quantitative composition and spatial configuration. Comput. Environ. Urban Syst. 2020, 79, 101402. [Google Scholar] [CrossRef]
  34. Sohl, T.L.; Claggett, P.R. Clarity versus complexity: Land-use modeling as a practical tool for decision-makers. J. Environ. Manag. 2013, 129, 235–243. [Google Scholar] [CrossRef] [PubMed]
  35. Li, G.; Cheng, G.; Liu, G.; Chen, C.; He, Y. Simulating the land use and carbon storage for nature-based solutions (nbs) under multi-scenarios in the three gorges reservoir area: Integration of remote sensing data and the rf-markov-ca-invest model. Remote Sens. 2023, 15, 24. [Google Scholar] [CrossRef]
  36. Nasiakou, S.; Vrahnakis, M.; Chouvardas, D.; Mamanis, G.; Kleftoyanni, V. Land use changes for investments in silvoarable agriculture projected by the clue-s spatio-temporal model. Land 2022, 11, 598. [Google Scholar] [CrossRef]
  37. Li, Z.; Wu, S.L.; Zhang, S.W.; Nie, C.; Li, Y.; Huang, Y. Optimization of Land Reuse Structure in Coal Mining Subsided Areas Considering Regional Economic Development: A Case Study in Pei County, China. Sustainability 2020, 12, 3335. [Google Scholar] [CrossRef]
  38. Zhu, K.; Cheng, Y.; Zang, W.; Zhou, Q.; El Archi, Y.; Mousazadeh, H.; Kabil, M.; Csobán, K.; Dávid, L.D. Multiscenario Simulation of Land-Use Change in Hubei Province, China Based on the Markov-FLUS Model. Land 2023, 12, 744. [Google Scholar] [CrossRef]
  39. Liang, X.; Guan, Q.; Clarke, K.C.; Liu, S.; Wang, B.; Yao, Y. Understanding the drivers of sustainable land expansion using a patch-generating simulation (PLUS) model: A case study in Wuhan, China. Comput. Environ. Urban Syst. 2021, 85, 101569. [Google Scholar] [CrossRef]
  40. Liu, X.; Liang, X.; Li, X.; Xu, X.; Ou, J.; Chen, Y.; Li, S.; Wang, S.; Pei, F. A future land use simulation model (FLUS) for simulating multiple land use scenarios by coupling human and natural effects. Landsc. Urban Plan. 2017, 168, 94–116. [Google Scholar] [CrossRef]
  41. Jiang, X.F.; Duan, H.C.; Liao, J.; Song, X.; Xue, X. Research on Land Use in the Ganlin Plateau of the Middle Reaches of the Heihe River Basin Based on the PLUS-SD Coupling Model. Arid. Reg. Res. 2022, 39, 1246–1258. [Google Scholar]
  42. Yu, Z.; Zhao, M.; Gao, Y.; Wang, T.; Zhao, Z.; Wang, S. Multiscenario Simulation and Prediction of Land Use in Huaibei City Based on CLUE-S and PLUS Models. Appl. Sci. 2023, 13, 7142. [Google Scholar] [CrossRef]
  43. Yingchun, L.; Yande, J.; Shanmei, H. Ecological function zoning of Nansi Lake Basin in China based on ecosystem service bundles. Environ. Sci. Pollut. Res. 2023, 30, 77343–77357. [Google Scholar] [CrossRef]
  44. Chi, S.; Wang, L.; Yu, X. A New Method for Calculating Prediction Parameters of Surface Deformation in the Mining Area. Appl. Sci. 2023, 13, 8030. [Google Scholar] [CrossRef]
  45. Deng, K.Z.; Zhang, D.Z.; Zhang, Z.Q. Discussion on prediction and control of surface subsidence under deep mining conditions. J. China Univ. Min. Technol. 2000, 1, 52–55. [Google Scholar]
  46. Aburas, M.M.; Ahamad, M.S.S.; Omar, N.Q. Spatio-temporal simulation and prediction of land-use change using conventional and machine learning models: A review. Environ. Monit. Assess. 2019, 191, 205. [Google Scholar] [CrossRef] [PubMed]
  47. Chughtai, A.H.; Abbasi, H.; Ismail, R.K. A review on change detection method and accuracy assessment for land use land cover. Remote Sens. Appl. Soc. Environ. 2021, 22, 100482. [Google Scholar] [CrossRef]
  48. Xie, G.D.; Zhang, C.X.; Zhang, L.M.; Chen, W.; Li, S. Improvement of ecosystem service valuation method based on unit area value equivalent factor. Chin. J. Nat. Resour. 2015, 30, 1243–1254. [Google Scholar]
  49. Gong, J.; Liu, D.Q.; Zhang, J.X.; Xie, Y.C.; Cao, E.J.; Li, H.Y. Tradeofs/synergies of multiple ecosystem services based on land use simulation in a mountain-basin area, western China. Ecol. Indic. 2019, 99, 283–293. [Google Scholar] [CrossRef]
  50. Qian, X.S. A New Scientific Field—Open Complex Giant Systems and Their Methodology. Urban Dev. Res. 2005, 13, 3–10. [Google Scholar]
  51. Holt, A. Understanding environmental and geographical complexities through similarity matching. Complex. Int. 2000, 7, 1–16. [Google Scholar]
  52. Li, W.; Cai, Z.; Jin, L. Urban green land use efficiency of resource-based cities in China: Multidimensional measurements, spatial-temporal changes, and driving factors. Sustain. Cities Soc. 2024, 104, 105299. [Google Scholar] [CrossRef]
  53. Du, L.; Hou, Y.; Zhong, S.; Qu, K. Identification of Priority Areas for Ecological Restoration in Coal Mining Areas with a High Groundwater Table Based on Ecological Security Pattern and Ecological Vulnerability. Sustainability 2024, 16, 159. [Google Scholar] [CrossRef]
  54. Chen, S.; Qin, J.; Dong, S.; Liu, Y.; Sun, P.; Yao, D.; Song, X.; Li, C. Assessing the Impact of Land Use Changes on Ecosystem Service Values in Coal Mining Regions Using Google Earth Engine Classification. Remote Sens. 2025, 17, 1139. [Google Scholar] [CrossRef]
  55. Dong, J.H.; Dai, W.T.; Xu, J.R.; Zhang, H.; Li, Y.P.; Xie, F. Impact and elastic modulus of coal mining on terrestrial ecosystems. Sci. Rep. 2025, 15, 9454. [Google Scholar] [CrossRef]
  56. Zhao, J.G.; Song, S.; Zhang, K.; Li, X.N.; Zheng, X.H.; Wang, Y.; Ku, G. An investigation into the disturbance efects of coal mining on groundwater and surface ecosystems. Environ. Geochem. Health 2023, 45, 7011–7031. [Google Scholar] [CrossRef]
  57. Chen, Y.; Yu, X.; Xu, D.; Peng, J. A spatial machine learning approach to exploring the impacts of coal mining and ecological restoration on regional ecosystem health. Environ. Res. 2024, 264, 120379. [Google Scholar] [CrossRef]
  58. Gao, F.; Xin, X.; Song, J.; Li, X.; Zhang, L.; Zhang, Y.; Liu, J. Simulation of LUCC Dynamics and Estimation of Carbon Stock under Different SSP-RCP Scenarios in Heilongjiang Province. Land 2023, 12, 1665. [Google Scholar] [CrossRef]
  59. Fan, F.F.; Xiao, C.W.; Feng, Z.M.; Chen, Y. Land-planning management based on multiple ecosystem services and simulation in tropical forests. J. Environ. Manag. 2022, 323, 116216. [Google Scholar] [CrossRef]
  60. Li, Y.; Han, X.; Zhou, B.; Lv, L.; Fan, Y. Farmland Dynamics and Its Grain Production Efficiency and Ecological Security in China’s Major Grain-Producing Regions between 2000 and 2020. Land 2023, 12, 1404. [Google Scholar] [CrossRef]
  61. Zhou, S.Y.; Chang, J.; Luo, P.J. Landscape dynamics and human disturbance processes in wetlands in a mining city: A case study in Huaibei, China. Environ. Monit. Assess. 2025, 197, 581. [Google Scholar] [CrossRef]
  62. Li, W.J.; Guo, J.Y.; Tang, Y.H.; Zhang, P.C. Resilience of agricultural development in China’s major grain-producing areas under the double security goals of “grain ecology”. Environ. Sci. Pollut. Res. 2024, 31, 5881–5895. [Google Scholar] [CrossRef]
  63. Xu, J.; Yin, P.; Hu, W.; Fu, L.; Zhao, H.; Xue, B. Assessing the ecological regime and spatial spillover effects of a reclaimed mining subsided lake: A case study of the Pan’an Lake wetland in Xuzhou. PLoS ONE 2020, 15, e0238243. [Google Scholar] [CrossRef]
  64. Zhao, Q.; Niu, K. Blessings or curses?—The bittersweet impacts of the mining industry on rural livelihoods in China. J. Clean. Prod. 2023, 421, 138548. [Google Scholar] [CrossRef]
  65. Wang, P.; Wang, J.; Zhu, C.; Li, Y.; Sun, W.; Li, J. Factors Influencing Livelihood Resilience of Households Resettled from Coal Mining Areas and Their Measurement-A Case Study of Huaibei City. Land 2024, 13, 13. [Google Scholar] [CrossRef]
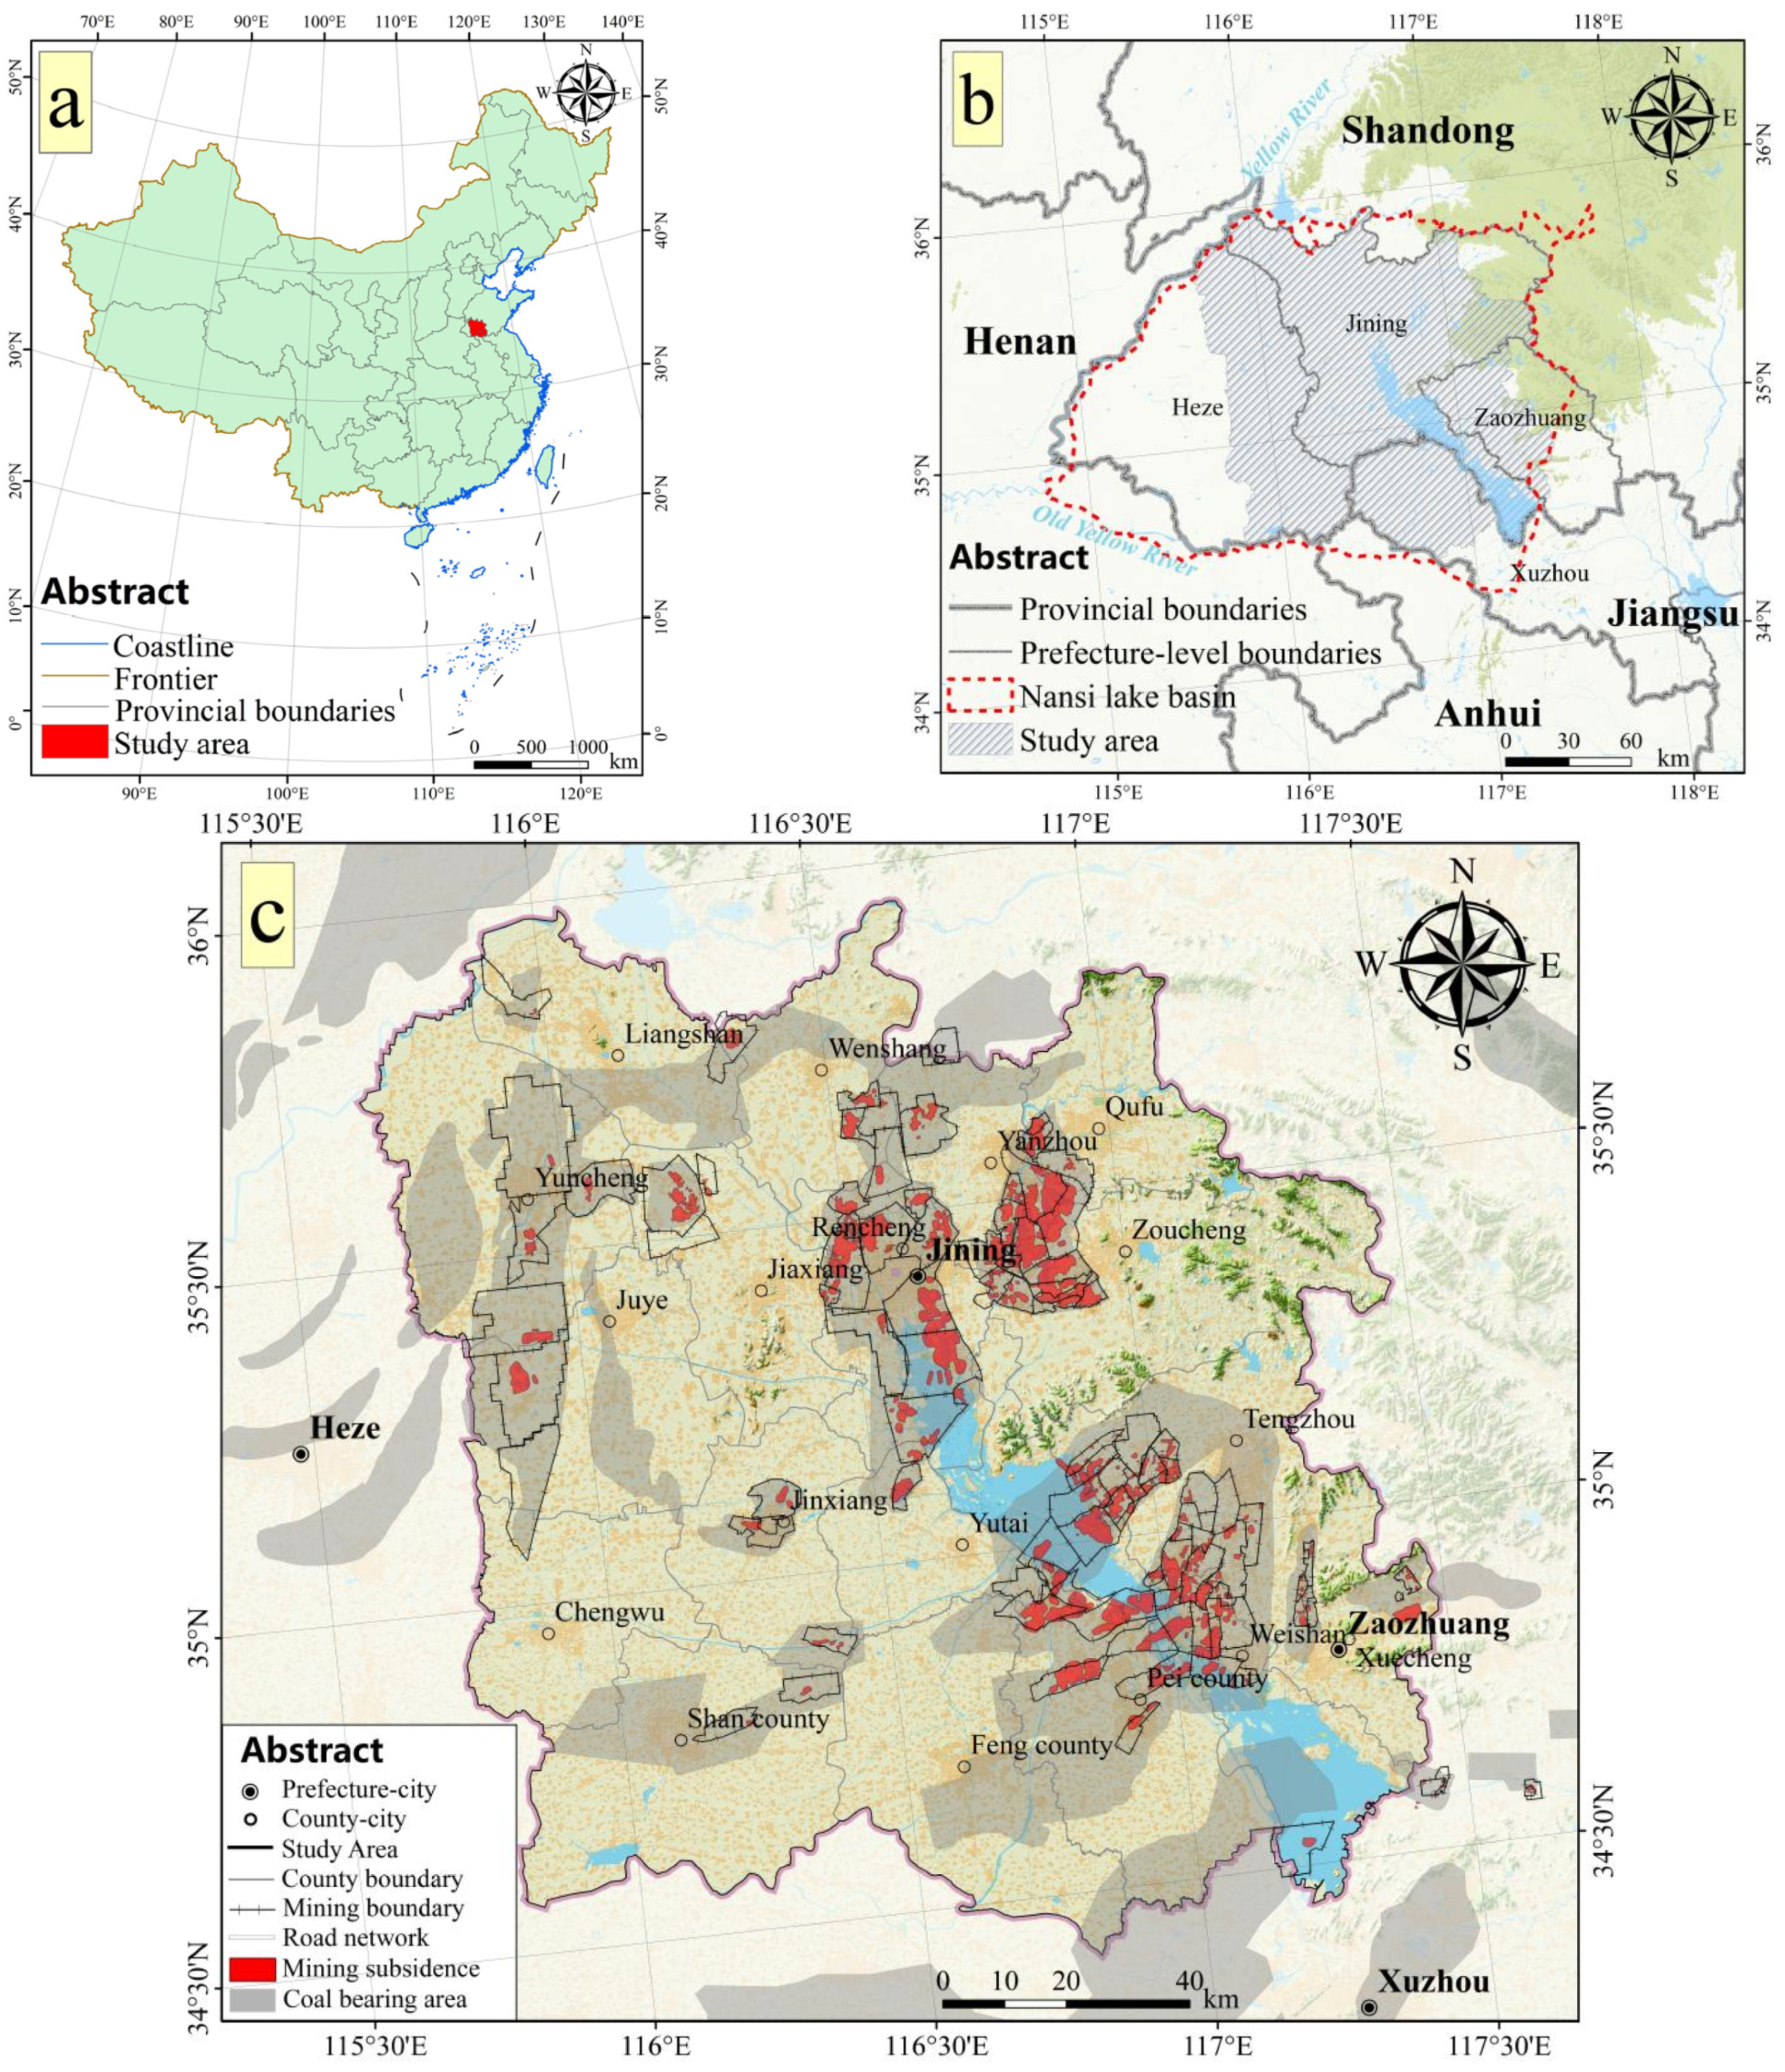
Figure 1. Location and scope of the study area: (a) the location of the research area in China; (b) the cross-administrative division situation of the study area and its inclusion relationship with the Nansi Lake Basin; (c) the scope of the research area, spatial distribution of coal resource occurrence and mining.
Applsci 15 09172 g001
Figure 2. Research framework.
Applsci 15 09172 g002
Figure 3. Driving factors of land use change: (a) Elevation. (b) Slope. (c) Aspect. (d) Soil OM content. (e) Soil thickness. (f) GDP. (g) Population density. (h) Average annual precipitation. (i) Average annual temperature. (j) Main roads_dis. (k) Economic development zones_dis. (l) Industrial and mining enterprises_dis. (m) Administrative centers_dis. (n) Coal mining subsidence areas_dis. (o) Water bodies_dis.
Applsci 15 09172 g003
Figure 4. The degree and spatial distribution of coal mining subsidence in the coal–grain overlapping area: (a) Yanzhou mining area; (b) Jining mining area; (c) Zaoteng Mining Area; (d) Peibei Mining Area; (e) Juye Mining Area.
Applsci 15 09172 g004
Figure 5. Spatial distribution structure of land use in 2010, 2020 and different development scenarios: (a) 2010, initial scenario; (b) 2020, baseline scenario; (c) ID scenario; (d) FS scenario; (e) UE scenario; (f) ER scenario.
Applsci 15 09172 g005
Figure 6. Chord diagram of land use transfer: (a) quantity of various types of land use under multi-scenarios; (b) multi-scenario land use transfer matrix based on baseline scenario.
Applsci 15 09172 g006
Figure 7. Comparison of various types of ESCI between multi-scenarios and baseline scenarios in the future.
Applsci 15 09172 g007
Figure 8. Spatial comparison of ESCI changes between future multi-scenario and baseline scenarios at the township scale: (a) 2010–2020; (b) 2020-ID scenario; (c) 2020-FS scenario; (d) 2020-UE scenario; (e) 2020-ER scenario.
Applsci 15 09172 g008
Table 1. Data source.
Data TypeData ContentData YearData AccuracyData Source
Land use dataPrimary classification2010, 202030 mCNLUCC
(https://www.resdc.cn/Default.aspx, accessed on 22 September 2024)
Basic geographic dataDEM201912.5 mALOS (https://search.asf.alaska.edu/, accessed on 14 November 2022)
Soil data2019250 mPredictive Soil Mapping with R.
(https://opengeohub.org/, accessed on 6 January 2025)
Meteorological data1980–2020-National Meteorological Science Data Center
(http://data.cma.cn/, accessed on accessed on 6 January 2025)
Socio-economic dataGDP,
population
2020130 m,
100 m
Luojia-1
(http://www.hbeos.org.cn/, accessed on 18 February 2025)
PoPSE
(https://doi.org/10.6084/m9.figshare.24916140.v1, accessed on 15 February 2025)
Road network data2023-Open Street Map
(https://www.openstreetmap.org/, accessed on 18 December 2023)
POI2024-Gaode Map Open Platform API
(https://lbs.amap.com/, accessed on 29 December 2024)
Constraint dataCoalfield geological data2018-The First Exploration Team of Shandong Coalfield Geologic Bureau
Ecological Red Line Boundary of Nansihu District20201:1,000,000Official website of Shandong Provincial Department of Ecology and Environment
(http://xxgk.sdein.gov.cn/xxgkml/hbxlcj/, accessed on 3 September 2023)
Table 2. The underlying logic of multi-scenario setting: core objectives and dual constraint rules.
Scenario TypeCore
Objectives
Dual Constraint Rules
Outside the Subsidence AreaWithin the Subsidence Area
IDContinuing the existing development model, balancing economy and ecologyThe areas of cropland and grassland continue to decrease, while the areas of forest land, water bodies, and built-up land continue to expand. Except for water bodies that cannot be converted into other land types, other land types can be converted into each other. The subsidence zone allows for natural evolution. Mild subsidence areas generally do not produce water accumulation, but built-up land will no longer increase. The land types in moderate and severe subsidence areas have been converted to water bodies.
FSProtecting basic cropland, controlling land non-agriculturalization and promoting land reclamationThe probability of cropland being converted to other land types decreases by 20%, while the probability of woodland, grassland, and barren land being converted to cropland increases by 20%.The original cropland in the mild subsidence area will no longer be converted to other land types. All areas with moderate subsidence, except for the lake area, will be reclaimed as cropland. Severe subsidence only transforms into water bodies, the same below.
UEPromote industrialization and urbanization, prioritize the expansion of built-up landThe probability of converting other land types into built-up land increases by 30%. Except for restricted conversion areas and water bodies, all other land types can be converted into built-up land.The built-up land in areas with mild subsidence is still expanding according to inertia. The built-up land in the moderately subsidence area, except for the lake area, will be restored to its original appearance after damage, while the rest of the land types will be reclaimed as cropland.
ERStrictly adhere to the ecological red line, and promote ecological restoration projectsThe conversion of forests and grasslands to other land types is restricted, and the probability of woodland land conversion to land types other than water area increases by 10%.The probability of mild subsidence areas transforming into woodland and grassland increases by 10%. Except for the lake area, areas with moderate subsidence will restore their original woodland and grassland, while other land types will be converted into water bodies.
Table 3. Equivalent factors of ESV per unit area (dimensionless).
ES FunctionsCropWoodGrassWaterBuiltBarren
Provision servicesFood production0.850.240.381.350.000.00
Raw materials0.400.550.560.370.000.00
Water supply0.020.280.315.440.000.00
Regulation servicesGas regulation0.671.791.971.340.000.02
Climate regulation0.365.375.212.950.000.00
Environmental purification0.101.601.724.580.000.10
Hydrological regulation0.274.053.8263.240.000.03
Support
services
Soil conservation1.032.192.401.620.000.02
Nutrient cycling0.120.170.180.130.000.00
Biodiversity0.132.002.185.210.000.02
Cultural servicesAesthetic landscape0.060.880.963.310.010.01
Total-4.0119.1219.6989.540.010.20
Table 4. Various ESVs under multi-scenarios (CNY billion).
20102020IDFSUEER
Food production3.223.173.153.153.123.18
Raw materials1.491.471.451.461.441.47
Water supply2.022.052.262.112.112.26
Gas regulation2.922.892.892.872.842.93
Climate regulation3.123.123.233.103.073.27
Environmental purification2.222.242.422.272.262.43
Hydrological regulation23.6824.0526.4924.6924.6726.49
Soil conservation4.244.184.174.154.104.22
Nutrient cycling0.450.450.440.440.440.45
Biodiversity2.612.642.842.672.662.85
Aesthetic landscape1.521.541.671.571.561.67
Total47.4947.8051.0148.4848.2751.21
Disclaimer/Publisher’s Note: The statements, opinions and data contained in all publications are solely those of the individual author(s) and contributor(s) and not of MDPI and/or the editor(s). MDPI and/or the editor(s) disclaim responsibility for any injury to people or property resulting from any ideas, methods, instructions or products referred to in the content.