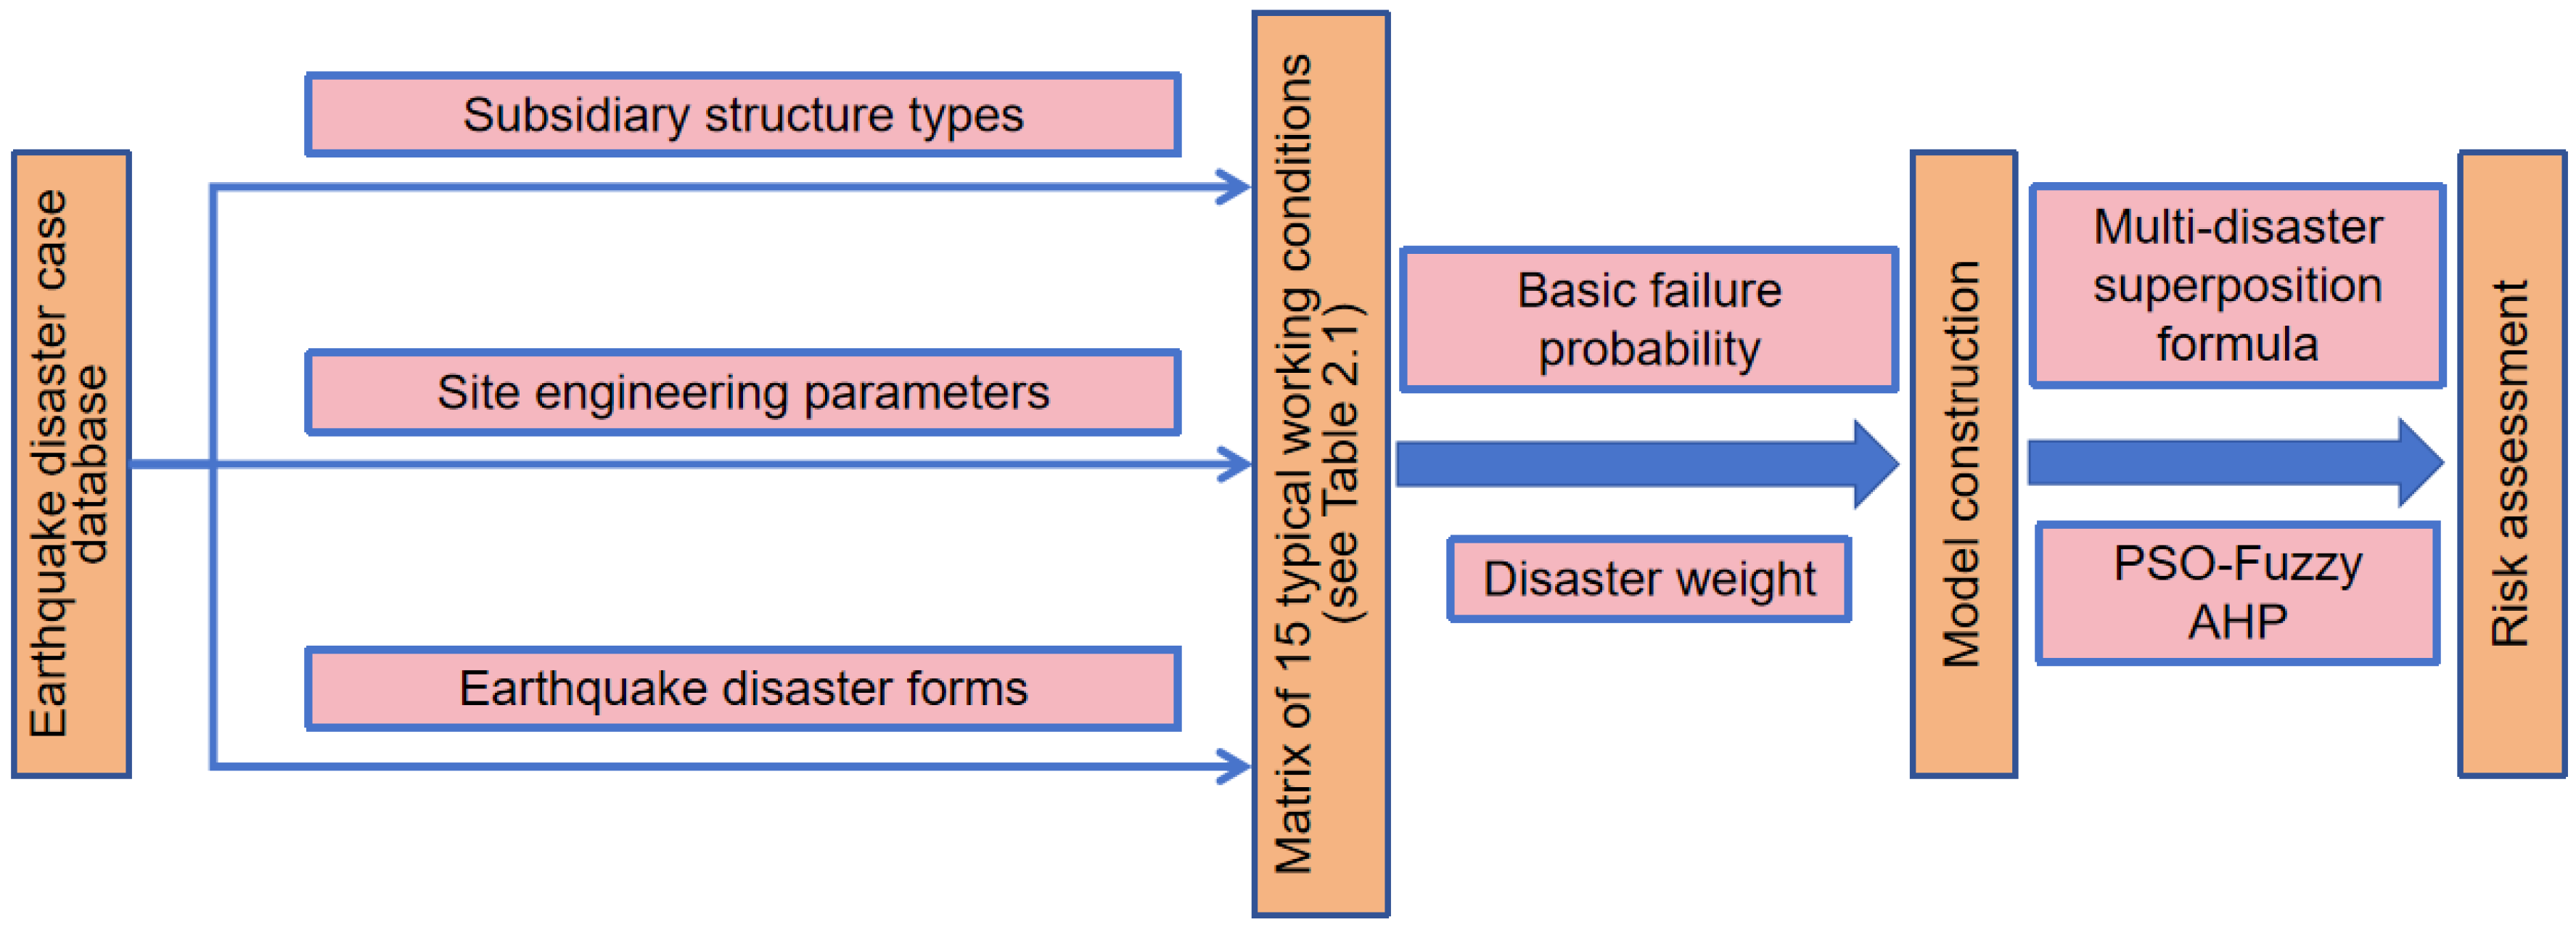
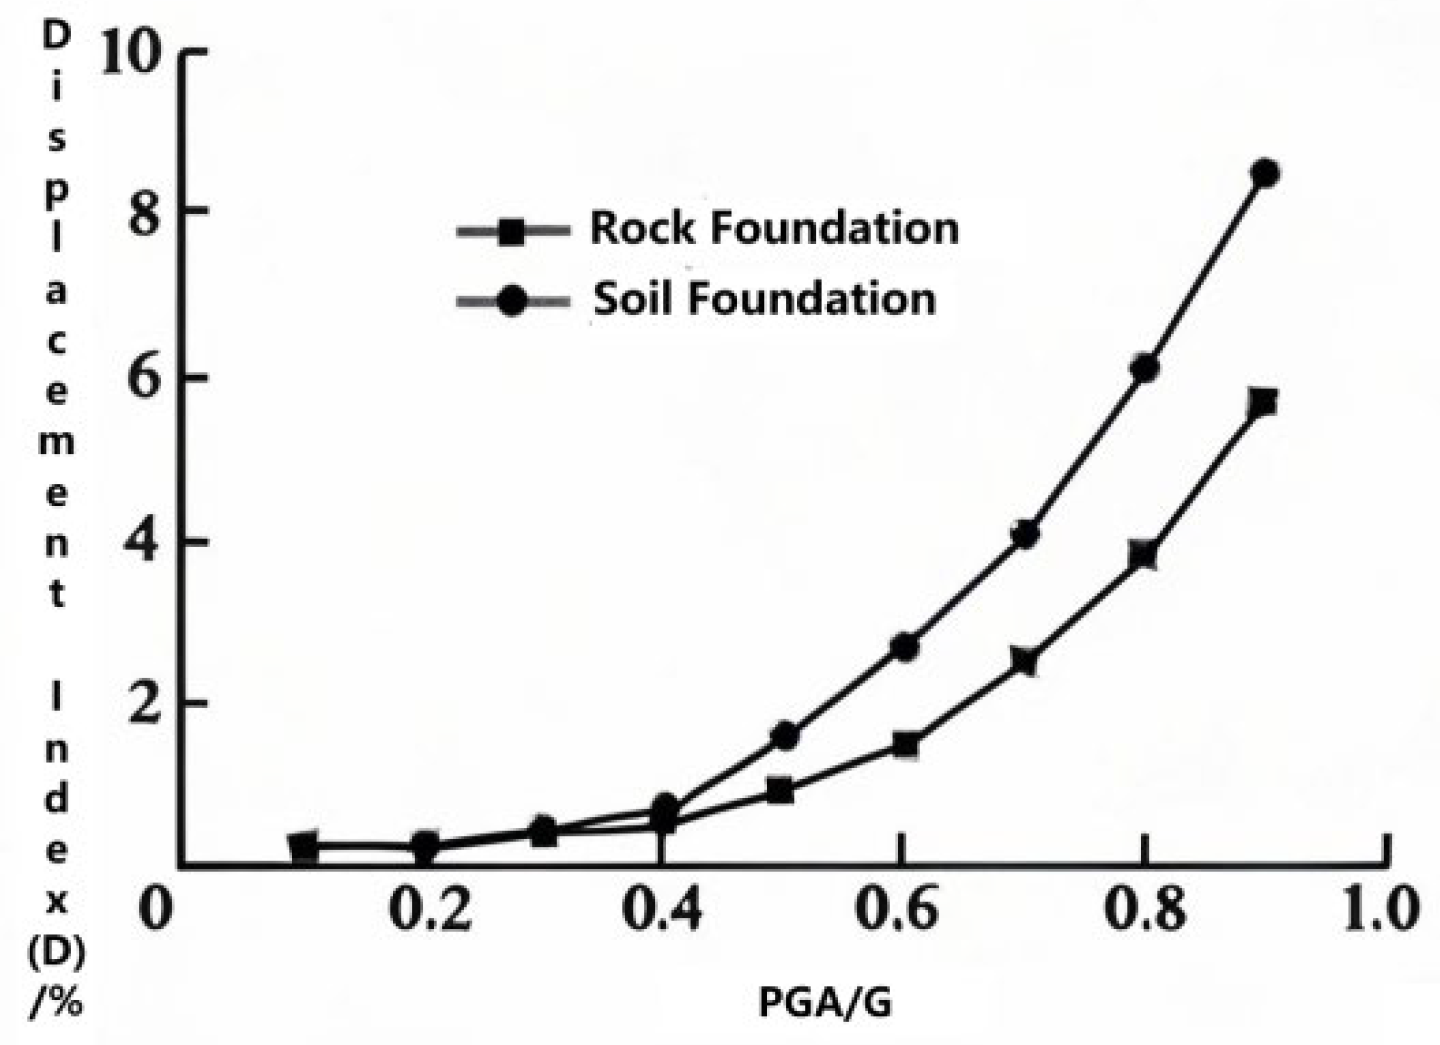
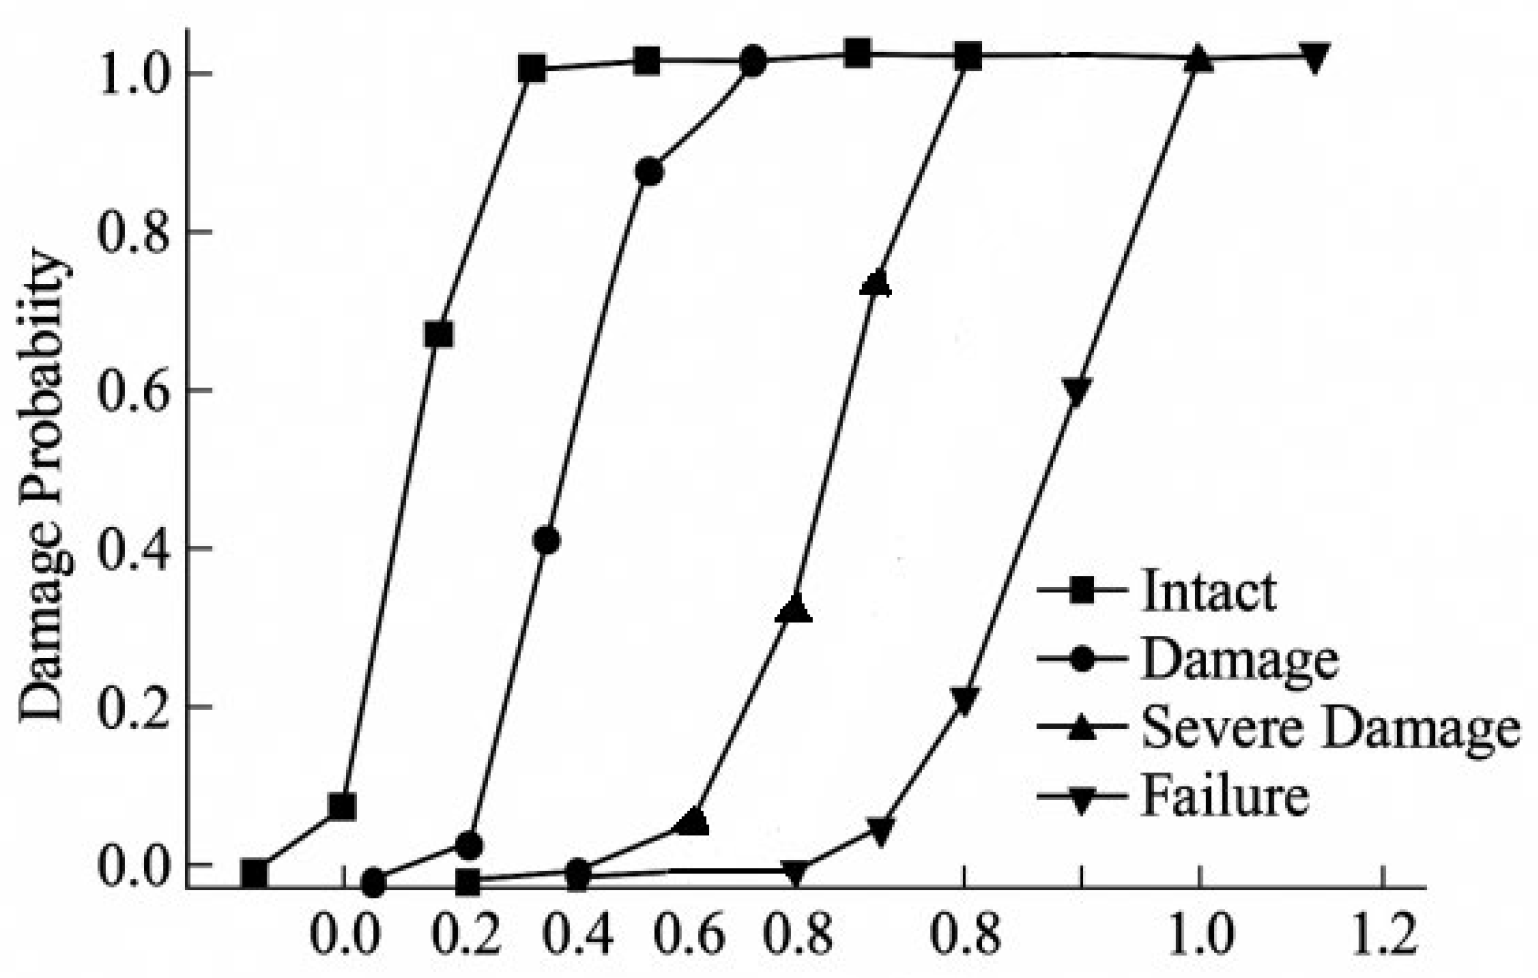
4.2. Basic Failure Model—Pi0
Pi0 is the basic failure model of the
i-th ancillary structure, which is the failure probability of various auxiliary structures under the influence of earthquakes only. In the context of pipeline engineering, the basic failure model for the
i-th ancillary structure, denoted as
Pi0, plays a critical role in assessing structural integrity and safety. This section summarizes the fundamental failure models for four typical pipeline ancillary structures: Truss Crossing, Masonry Retaining Wall, Cable-Stayed Bridge, and Tunnel, with detailed specifications provided in
Table 4. These models are systematically defined to characterize the primary failure mechanisms associated with each structure under operational and environmental loads, serving as essential benchmarks for subsequent reliability analyses and risk assessments.
As outlined in
Table 4, the failure model
Pi0 for the Truss Crossing is primarily associated with the instability of load-bearing members or joint failures due to excessive stress concentrations, which can lead to structural collapse under extreme mechanical loads. For the Masonry Retaining Wall,
Pi0 focuses on potential failure modes such as overturning, sliding, or foundation settlement, driven by soil pressure and gravitational forces. The basic failure model Pi0 of the Cable-Stayed Bridge emphasizes cable fatigue, tower deformation, or deck instability, considering the dynamic interactions between the pipeline and bridge structure under traffic and wind loads. Finally, the Tunnel’s
Pi0 is defined by critical failure scenarios, including lining cracking, rock mass collapse, or water ingress, which are influenced by geological conditions and internal pressure fluctuations. Each model in
Table 4 encapsulates the unique structural characteristics and failure triggers of the respective ancillary structure, providing a standardized framework for engineers to evaluate and mitigate the potential risks in pipeline systems.
4.4. Influence Coefficients of the Severity of Disasters—wih
Parameter wih represents a pivotal set of influence coefficients that encapsulate the severity of four major seismic-induced hazards: active faulting, collapse/landslide, sand liquefaction, and soft soil seismic subsidence. Distinct from the general influence weights kih, wih offers enhanced granularity by establishing a one-to-one correspondence with both specific types of pipeline ancillary structures (e.g., truss crossings, masonry retaining walls, cable-stayed bridges, and tunnels) and four hazard categories. This refined specificity enables wih to capture nuanced variations in hazard impact across different structural configurations, addressing the limitations of kih’s broader, less structure-specific characterization. These coefficients are fundamental in quantifying the impact of secondary disasters on the structural integrity of pipelines, bridging the gap between hazard intensity and structural response. By integrating wih into the risk assessment framework, a more comprehensive and nuanced understanding of the complex interactions between seismic hazards and pipeline performance can be achieved. Each coefficient within the wih set corresponds to a specific hazard type, acting as a multiplier that reflects the relative contribution of the hazard to potential pipeline damage.
The calculation of wih employs a hybrid multi-criteria decision-making fuzzy optimization model that integrates Particle Swarm Optimization (PSO) and Fuzzy Analytic Hierarchy Process (Fuzzy AHP), addressing the complex nonlinear interactions between seismic hazards and pipeline ancillary structures. This framework leverages Fuzzy AHP to systematically structure subjective expert judgments and uncertainties into a hierarchical evaluation system, where each wih is derived from pairwise comparisons of hazard severity impacts across four pipeline structure types (truss crossings, masonry retaining walls, cable-stayed bridges, and tunnels) and four seismic-induced hazards (active faulting, collapse/landslide, sand liquefaction, and soft soil seismic subsidence) within a fuzzy linguistic environment. By assigning triangular fuzzy numbers to represent relative importance judgments, the model mitigates ambiguity in qualitative assessments, ensuring robustness against subjective biases.
4.4.1. PSO-Fuzzy AHP Workflow
The multi-criterion decision-making fuzzy optimization model of PSO-Fuzzy AHP is usually used to solve problems involving multiple decision-making criteria with uncertain or fuzzy information. Taking the retaining wall as an example, the following explains how to solve the multi-criterion decision-making problem through the Particle Swarm Optimization (PSO) algorithm and the Fuzzy Analytic Hierarchy Process (Fuzzy AHP). The specific calculation steps are as follows:
Construction of Fuzzy Judgment Matrix
A decision-making hierarchical structure is built, and the indicators are compared in pairs to build a fuzzy judgment matrix. (a, b, c) Characterizes the importance of the relationship between different indicators. For example, consider the comparison of the importance of “liquefaction (L)” and “fault (F)”: If experts judge that “faults are slightly more important than liquefaction”, the value is assigned to (1/3, 1/2, 1), which means that the importance of faults is 1/3 ~ 1 times that of liquefaction, and most likely 1/2 times; the complete judgment matrix needs to satisfy reciprocity: if the fuzzy number of indicator
i to
j is (a, b, c), then
j to
i is (1/c, 1/b, 1/a). A hierarchical structure is created, and the fuzzy judgment matrix is built by pairwise comparison of indicators. The form of the fuzzy judgment matrix is shown in
Table 10.
The indicators (a, b, c) are determined as follows:
- (1)
Importance judgment: When the importance of two indicators is the same, the value is (1/2, 1, 2); when one indicator is x times more important than another, the value is (x − 1, 2, x + 1) for x = 2, 3, …, 9; when one indicator is x times less important than another, the value is (1/(x + 1), 1/x, 1/(x − 1)).
- (2)
Subjective judgment approach based on expert knowledge: Specify the importance of multiple relationships between each indicator, that is, the value of x in 1).
Taking the retaining wall as an example, see
Table 11 for the values.
Calculate the Weights
The triangular fuzzy number (lij, mij, uij) is used to quantify the relative importance of the indicator, where lij, mij, and uij represent the lower limit, most probable value, and upper limit of importance, respectively.
The elements of the judgment matrix are composed of pairwise-comparison fuzzy triangular numbers
aij = (
lij,
mij,
uij), where
i and
j take values from 1 to
n. The weights (
w1,
w2, …,
wn) must satisfy the fuzzy inequality as follows:
According to
Table 10,
w1,
w2, …,
wn refer to active faulting, collapse/landslide, sand liquefaction, and soft soil seismic subsidence.
Define the Membership Function
Assuming that the nonlinear equation system in the formula is solvable and the solution is (
w1,
w2, …,
wn), this solution is equivalent to minimizing the main function:
Use the PSO Algorithm to Solve the Above-Mentioned Nonlinear Equation System to Obtain the Global Optimal Solution
The particle position (randomly generated weight vectors that satisfy the constraints) and velocity are initialized. For each particle, the consistency of the fuzzy judgment matrix is calculated under its corresponding weight CI. The individual best (pbest) and global best (gbest) particles are updated.
Weight Calibration and Verification
The calculation of the disaster weights of retaining walls is considered as an example.
The iteration parameters are as follows: the maximum number of iterations was set to 100 times, and the particle swarm size was set to 30, w = 0.7, c1 = c2 = 1.5.
Convergence results: After 56 iterations, CI converges from 0.12 to 0.03 (<0.1, meets the consistency requirement), and the final weights are as follows: Active faulting: 0.598; Collapse/landslid: 0.117; Sand liquefaction: 0.117; and Soft soil seismic subsidence: 0.168. As shown in
Table 12.
Comparative verification: Compared with the results of the traditional AHP method, the deviation rates are all less than 5% (for example, the traditional AHP obtains a fault weight of 0.612, and the deviation is 2.3%), indicating that the PSO-Fuzzy AHP algorithm has higher stability.
Determine the Indicator Assignment and Weights
The weight calculation results of the impact of various disasters on masonry retaining walls are shown in
Table 13.
In the field of engineering geological disaster risk assessment, a method based on expert experience to construct the index fuzzy judgment matrix and combined with the PSO algorithm is adopted to determine the weights and influence coefficients of the four disasters: active faulting, collapse/landslide, sand liquefaction, and soft soil seismic subsidence. Firstly, the initial fuzzy judgment matrix is established using the scale method, and then the PSO algorithm is utilized to optimize its consistency. The final weights of each disaster index are obtained through iterative optimization. Based on this, failure probability models for retaining walls, trusses, and other ancillary structures are constructed. This model comprehensively considers the influence of multiple disasters and couples the effects of various disasters with weights optimized by the PSO algorithm. Compared with the SLSQP algorithm, the PSO algorithm is more robust in handling discrete-type weight optimization and complex nonlinear constraints. It can effectively avoid the problem of local optimal solutions, ensure the reliability of index assignment and failure probability calculation, and provide solid data support for engineering disaster-resistant design.
By determining the fuzzy judgment matrix of indicators based on expert experience and the importance of indicators, and using the PSO algorithm to obtain the final indicator assignment and weights in
Table 14, it can serve as the basis for determining the disaster weights and influence coefficients in Equation (1) and establishing the failure probability models for retaining walls, trusses, and other ancillary structures.
4.5. Practical Engineering Verification Based on the Lanzhou–Chengdu–Chongqing Pipeline
To further verify the accuracy and practicality of the failure probability formula and related models proposed in this study, data from the Lanzhou–Chengdu–Chongqing pipeline during the 2008 Wenchuan earthquake were selected for comparative analysis. The Lanzhou–Chengdu–Chongqing pipeline, a crucial energy transportation artery in China, suffered varying degrees of damage during the Wenchuan earthquake. The seismic damage data provided valuable practical cases for this research.
During the Wenchuan earthquake, some sections of the Lanzhou–Chengdu–Chongqing pipeline were located in areas that were severely affected by the earthquake. Relevant information on the ancillary structures of specific pipeline sections was obtained by collecting detailed monitoring data from pipeline operation enterprises and post-earthquake inspection reports. Consider a tunnel section crossing a mountainous area as an example. This tunnel is located at a Class III site. According to data from the local earthquake monitoring station, the PGA in this area during the earthquake reached 0.3 g.
Displacement monitoring of the Lanzhou-Chengdu-Chongqing pipeline tunnel adopted a hybrid measurement system:
Leica TS60 total station (accuracy ±0.5 mm) for high-precision 3D displacement tracking of tunnel portals and key support points.
A distributed optical fiber strain sensor (sampling interval 1 m, accuracy ±1 με) was embedded in the tunnel lining to capture continuous strain distributions.
A crack width gauge (accuracy 0.02 mm) was used for detailed measurement of lining cracks, such as the 0.3 mm circumferential crack observed in the 2017 Jiuzhaigou earthquake case [
27].
This instrumentation setup aligns with the monitoring protocols, which validated the effectiveness of the combined total station and fiber sensing for seismic damage assessment. The high-precision measurements enabled an accurate correlation between the calculated failure probability (0.089) and field observations, including a 2.7 mm support displacement and 0.28 mm/m axial strain in the pipeline segment [
27].
Firstly, based on the vulnerability matrix established in this paper (
Table 4) and combined with the site category of the tunnel (Class III site), the failure probability of the tunnel’s ancillary structure was preliminarily calculated. Without considering the influence of other disasters (only based on PGA), it can be found from the vulnerability matrix that when the PGA is 0.3 g, the benchmark failure probability P
0 of the tunnel is approximately 0.0530.
Subsequently, the actual disasters that occurred in this area during the earthquake are considered. Through investigation, it was found that there was a slight sandy soil liquefaction phenomenon near the tunnel, and it was also affected by the surrounding mountain landslides. The failure probability is corrected according to the disaster influence weights k
ih and influence coefficients w
ih given, and the influence weights of various disasters are determined by the PSO-Fuzzy AHP algorithm in
Section 4.4. For sandy soil liquefaction (h = liquefaction), when the tunnel is in a slightly liquefied condition, the value of w
ih is 0.1; for collapse/landslide (h = collapse/landslide), because of a slight landslide nearby, the value of w
ih is 0.078. According to Equation (1):
The data are substituted into the formula as follows:
In the actual seismic damage, the ancillary structure of this tunnel suffered damage, such as local cracking of the lining and slight displacement of the pipeline support. The actual damage data were obtained by a professional research team jointly formed by Southwest Petroleum University and pipeline operation units. Immediately after the earthquake, the team went to the site and used a series of professional methods, including on-site measurements, photography, and structural detection. The team measured the cracks in the tunnel lining in detail, recorded their positions, lengths, and widths, and used professional measuring instruments to determine the displacement of the pipeline support. Through statistical analysis of historical data of similar tunnel structures with the same damage degree and combined with expert evaluation, the actual failure probability of this tunnel during this earthquake was determined to be approximately 0.095. It can be seen that the failure probability calculated by the model in this paper is relatively close to the actual failure probability, and the deviation is within an acceptable range, verifying the effectiveness and reliability of the failure probability formula for pipeline ancillary structures considering multiple factors and related models proposed in this paper in practical engineering.
In addition, the masonry retaining wall ancillary structure on the Lanzhou–Chengdu–Chongqing pipeline was also analyzed. A masonry retaining wall is located on a Class II site, and the PGA during the earthquake was 0.2 g. From the vulnerability matrix, the benchmark failure probability P
0 was approximately 0.0090. A slight collapse/landslide occurred near the retaining wall, and a slight liquefaction phenomenon occurred in the area. According to the values in the relevant tables, the w
ih for collapse/landslide is 0.78, and the w
ih for liquefaction is 1.3. Substituting these values into Equation (1), we obtain:
In the actual seismic damage, this masonry retaining wall had problems such as partial wall cracking and mortar-joint peeling. After evaluation, the actual failure probability was approximately 0.018. This further demonstrates that the calculation results of the model are in good agreement with the actual conditions.
Through the practical engineering verification of different types of ancillary structures of the Lanzhou–Chengdu–Chongqing pipeline during the Wenchuan earthquake, it is shown that the failure probability assessment system established in this study can relatively accurately predict the failure probability of oil and gas pipeline ancillary structures under the action of multiple seismic disasters, providing reliable technical support for the seismic design, operation and maintenance management, and disaster risk prevention and control of oil and gas pipelines.
In addition, for a gas transmission pipeline crossing a VII magnitude earthquake area, the tunnel auxiliary structure calculated P
0 = 0.0269, as shown in
Table 4. After considering the impact of site liquefaction, the failure probability increased to 0.0435. Based on this, the steel-bar configuration of the tunnel lining was optimized.


