1. Introduction
Guided acoustic waves (GAWs) have been the focus of research and development in the domains of sensor and actuator technologies for many decades [
1,
2]. The term GAW encompasses a variety of acoustic wave types. The most notable examples include Lamb waves, Rayleigh waves, Scholte waves, and quasi-Scholte waves [
3,
4,
5,
6]. Sensor applications of GAWs are diverse, ranging from deposit detection [
7,
8] to flow rate measurement in pipes [
9,
10] to nondestructive failure testing [
11,
12]. Typical examples for actuator applications include the movement of droplets or the mixing of liquids without moving parts, e.g., on lab-on-a-chip devices [
13,
14,
15]. Current research frequently focuses on phononic crystals for the fine-tuned manipulation of these sound waves [
16,
17].
The continuous enhancement of technical capabilities, specifically the advent of sophisticated simulation methodologies, has rendered comprehensive studies on these subjects more attainable. This advancement enables a reduction in experimental demands, thereby promoting efficiency and cost effectiveness in research endeavors. This is particularly evident in the context of transient simulations and complex geometries, such as metamaterials, where models based on the finite element method (FEM) have become the prevailing standard [
18,
19]. In this contemporary era, alternative methods compete within the domain of GAW dispersion calculation [
20]. Nevertheless, the FEM remains the optimal approach for achieving specific objectives due to its unique capabilities. A significant benefit of the FEM is its flexibility, allowing for the seamless integration of models into multiphysics problems, even when dealing with complex geometric structures [
17,
21].
In contrast to our approach, a wide variety of methods for calculating GAWs are available in the literature. Beyond our approach there are other FEM-based methods such as the wave FEM (WFEM) and semi-analytic FEM (SAFE), which are often designed for specifically defined conditions and therefore perform faster in terms of computation [
22,
23,
24,
25]. While all FEM-based methods completely mesh the geometry in all spatial directions, there are other methods that only partially mesh them or do not use a mesh at all. An example of partially meshing methods are the spectral collocation method (SCM) and Legendre polynomial method (LGM) [
26,
27,
28,
29]. Here, only the cross-section of the plate is meshed, while there is no meshing in the direction of the propagating wave. In the case of fluid loading, this is only implemented by boundary conditions at the edges of the geometry. The SCM and LGM differ primarily on the basis of the functions used to solve the system of equations. Non-meshing methods include the transfer matrix method (TMM) and the global matrix method (GMM) [
30,
31,
32]. Both solve only one system of equations that describes, respectively, the interfaces of the plate and the interfaces of a multilayer system as parts of a matrix. According to the literature, the TMM tends to be unstable at high frequencies. In terms of stability, the GMM performs better, but this must be compensated for by increased computing effort.
In this study, a novel, universally applicable FEM approach is used to model and calculate GAWs in different scenarios. At the beginning, the work is focused on a metal plate with a free surface. The model is then extended to the case of fluid loading. The results are validated by experimental data and two numerical reference methods, viz., the GMM and the SCM. This selection was made in order to include one representative from each of the above-mentioned partial- and non-meshing methods. Additionally, this study demonstrates that a convincing agreement between simulation and experimental results can be achieved by using a simple optimization algorithm to adapt material parameters.
2. Experimental Methods
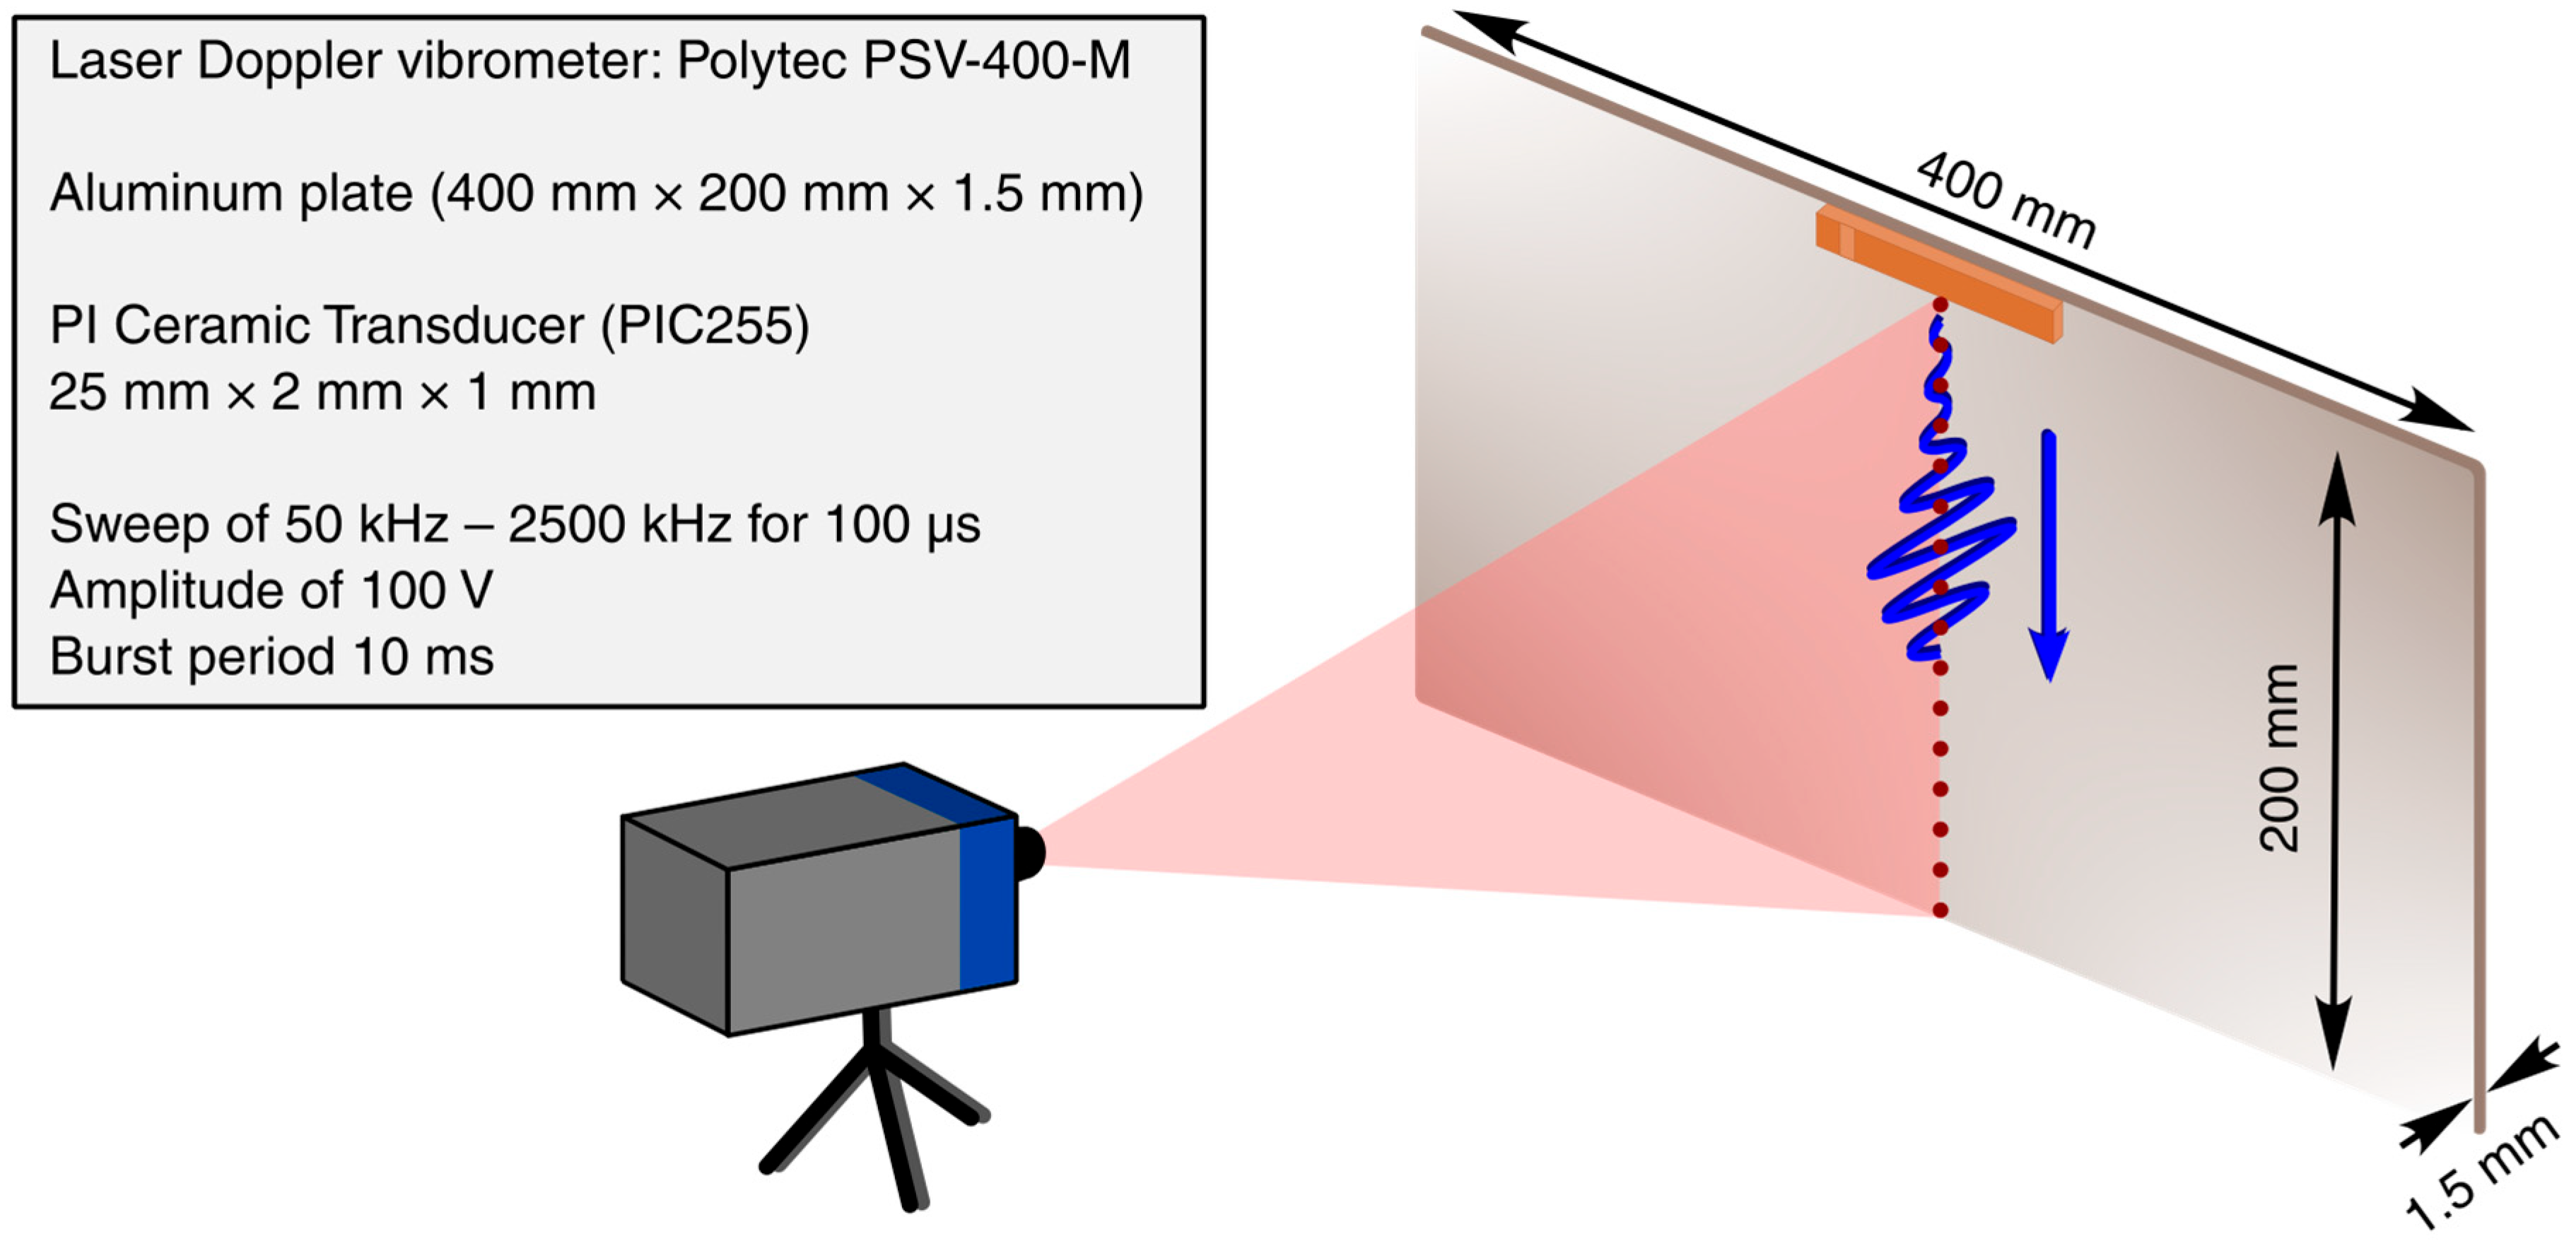
For this study, all experimental and simulative investigations were performed on a 1.5 mm thick metal sheet. The experimental sample was a 400 mm × 200 mm anodized aluminum plate (
Figure 1). For GAW excitation a piezoelectric transducer (PI Ceramic GmbH, Lindenstraße, 07589 Lederhose, Germany: PIC255, 25 mm × 2 mm × 1 mm) was used. The transducer was glued to the center of the long edge to allow the observation of the traveling GAWs over a distance of approximately 198 mm without undesired interfering edge reflections. The electric signals were generated by a combination of function generator and amplifier. This setup allowed us to excite strong waves by applying sinusoidal electrical voltages with amplitudes of up to 100 V. To observe up to five different Lamb modes, the GAWs were excited by a 100 µs long linear frequency sweep starting from 50 kHz up to 2500 kHz with a burst period of 10 ms.
For the experimental evaluation of the propagating GAWs, a scanning laser Doppler vibrometer (LDV) (Polytec GmbH, Polytec-Platz 1–7, 76337 Waldbronn, Germany: PSV-400-M) was used. This technique exploits a frequency shift in the reflected laser light caused by the motion of the surface, which allows the measurement of local time-dependent displacement
with high accuracy [
33,
34]. The sensitivity of the LDV to different modes varies as the method cannot detect movements perpendicular to the propagation direction of the incident beam [
33]. In the experiment, wave propagation was measured pointwise at 333 equidistant points along a single line in the vertical center of the plate (cf.
Figure 1).
This resulted in a vertical resolution of
. Additionally, the local motion of the surface was sampled at a frequency of
.
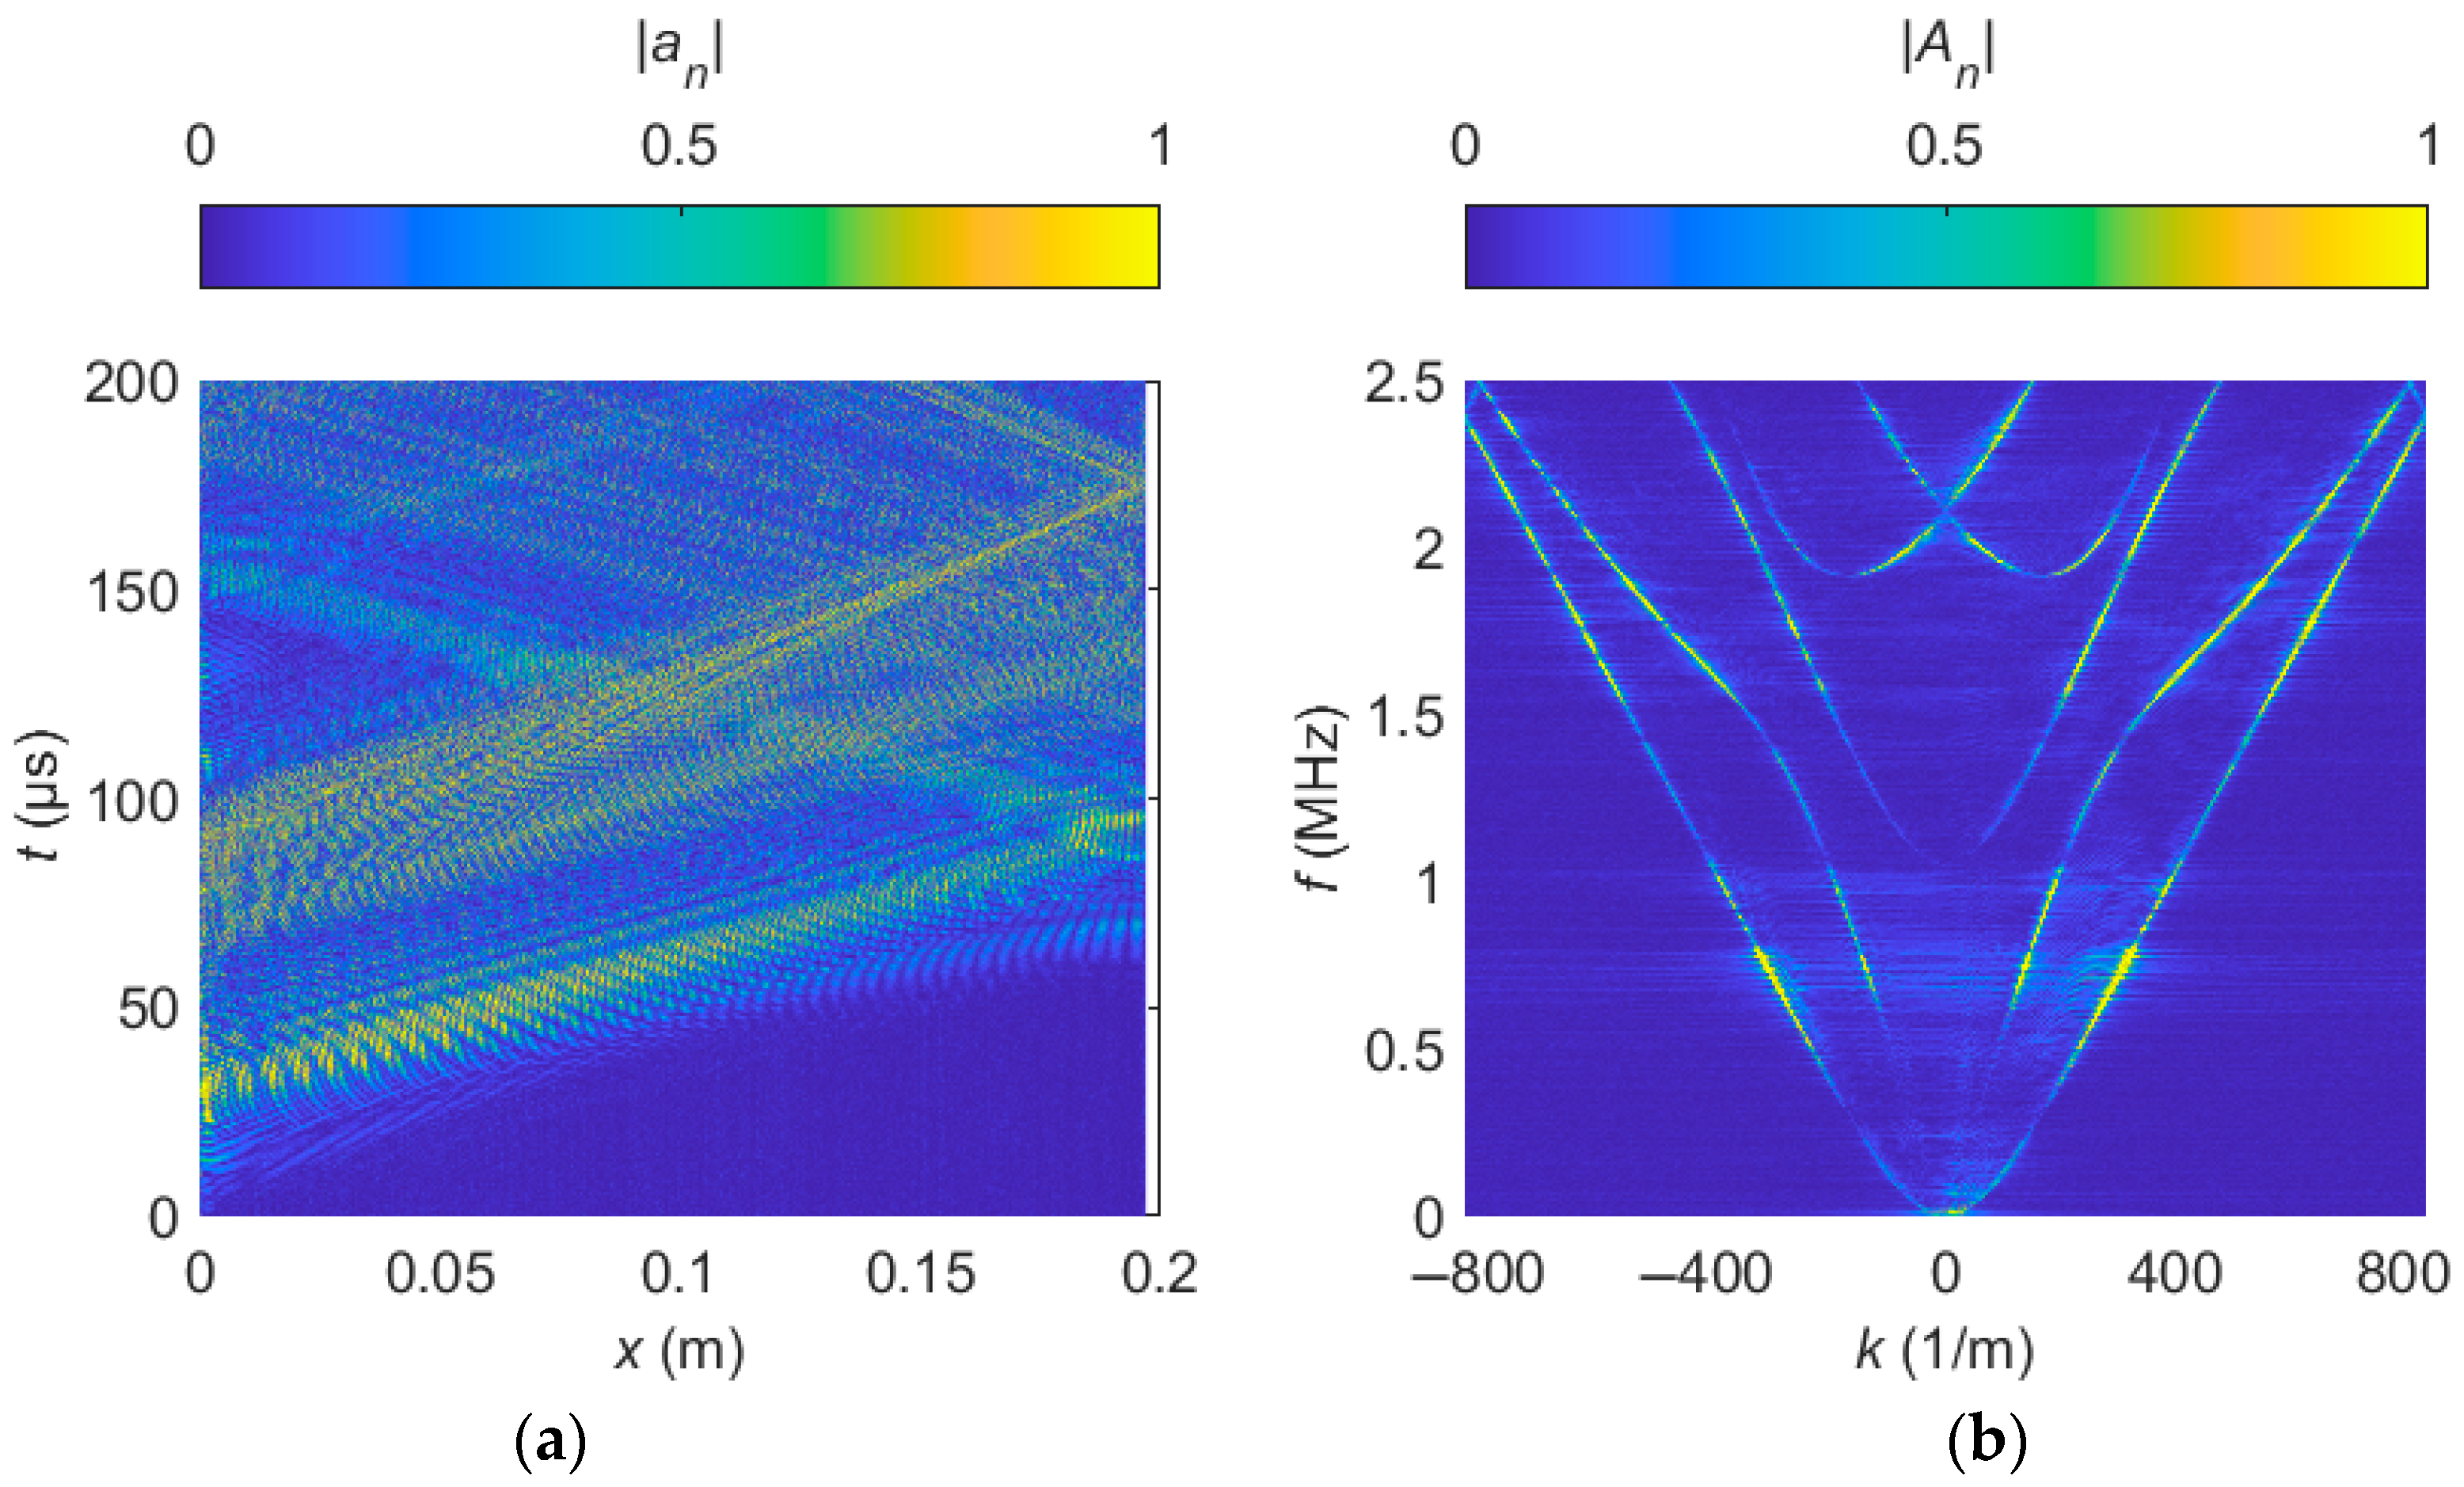
Figure 2a illustrates the measured propagation of the GAWs in space
and time
as a 2D surface plot. For this visualization the absolute normalized values
are displayed. An advantage of this chart is the visual traceability of the GAW propagation, including reflections at the plate’s edge.
To analyze the dispersion relation of the investigated GAWs, a two-dimensional Fast Fourier transform (2D FFT) was performed [
35]. According to
the 2D FFT transforms the normalized displacement field
into a field of complex valued amplitudes, or phasors,
. Thereby, the spatial coordinate
and the time
are respectively transformed into the wave number
and the frequency
.
In the following, the graphical representation of the magnitude of the field
is called a band structure diagram [
36]. In this application the Nyquist–Shannon limits for
and
are
By default, frequencies or wavenumbers greater than these limits cause aliasing [
37]. Furthermore, the magnitude of the 2D FFT is symmetric to the origin of the coordinate system. Therefore, all relevant information is contained in two neighbouring quadrants.
Figure 2b shows the two-sided band structure diagram related to
Figure 2a in quadrants I and II. The first quadrant includes all waves with positive wavenumbers (traveling from the left
to the right
), whereas the second quadrant contains the reflected waves (traveling from the right
to the left
). Due to the isotropy of the aluminum plate, the dispersion relation of right-propagating waves shows the same behavior as left-propagating waves. Nevertheless, owing to measurement noise, the experimentally determined amplitudes vary in the two quadrants. The data from both quadrants can be overlaid to smooth out this effect in a single-sided band structure diagram
:
In the results section below, this single-sided version is used to validate the calculated dispersion relations. Furthermore, it will be shown how to make the simulations better agree with the measured data by an optimization algorithm.
In a second experiment, the influence of fluid loading on the wave propagation was investigated. Because of two major advantages, a single-sided water loading was used:
Therefore, the aluminum plate used in the experiment described above was glued into a container as an outer side wall. Deionized water with a measured temperature of 24 °C was used as fluid in the container. To ensure good interaction of the GAWs with the fluid, all outgassed bubbles adhering to the metal surface were removed before each measurement. Since the signal-to-noise ratio tends to decrease in such measurements due to the radiation of energy into the fluid along the path of the propagating wave, multiple measurements at varying frequencies were performed instead of a single frequency sweep measurement. For the evaluation, the 2D FFTs were calculated for all measured signals followed by a superimposition of the magnitudes.
3. Numerical Methods
In this section, all relevant steps for the FEM model are introduced. Additionally, a short overview of the used reference models is given.
3.1. Finite Element Method for GAWs on a Free Plate
The first step was to model the aluminum plate by FEM. In this work, all FEM models were implemented in and solved by COMSOL Multiphysics 6.1 [
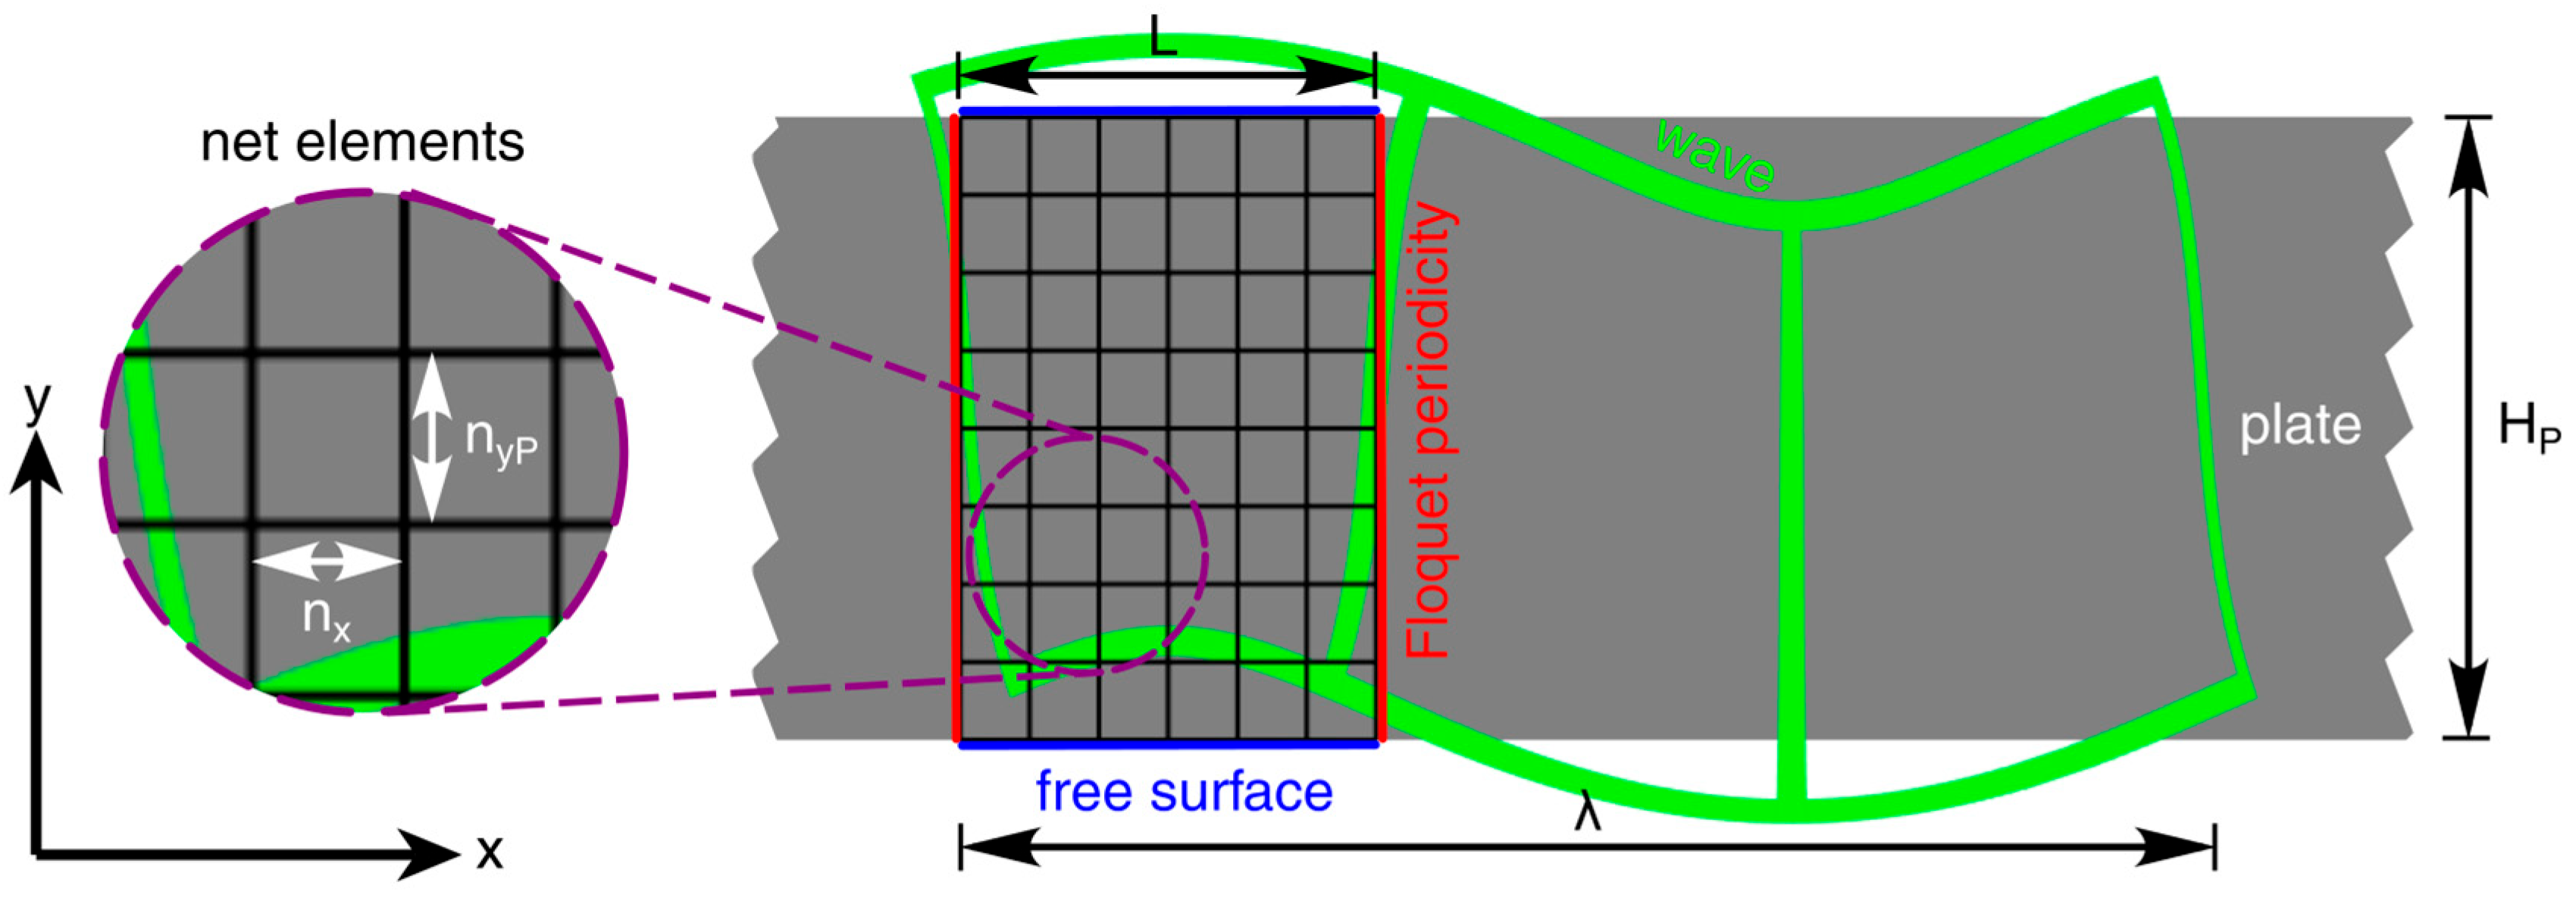
39]. A 2D model was built to model the dispersion relation of the free plate. In the case of an ideal plate, only a small section needs to be modeled to determine all possible GAWs. This section of the plate, with height
and length
, is called the unit cell (UC) [
40].
Figure 3 shows a sketch of the UC including all relevant length scales, boundary conditions, and a regular quadrilateral mesh.
Elastic waves in a plate without external forces obey the equation of motion [
41]
Here,
is the displacement field,
the stress tensor, and
denotes the mass density of the plate. The stress tensor
is a rank 2 tensor depending on the Young’s modulus
, the Poisson’s ratio
or analogous material constants, and the displacement field
:
with the identity tensor
.
The fundamental idea of the simulation was to calculate the eigenvalues and eigenvectors of Equation (5) for different wavelengths. The eigenvalues represent the eigenfrequencies of the GAW, whereas the eigenvectors describe the local displacements. For an eigenvalue evaluation,
is assumed to be sinusoidal with an angular frequency of
. Equation (5) then becomes
To model the free surface no loads or constraints were applied to the upper and lower UC boundaries. By Floquet’s theorem [
40], the displacements at the left and right boundaries of the UC are linked by
This boundary condition allows one to control the phase shift of the displacement field from the left edge (at
) to the right edge (at
) by the parameter
. The phase shift, of course, is periodic in
. Consequently, it is sufficient to calculate all eigenfrequencies on the interval
. Therefore,
can be written as
represents a dimensionless sweep parameter in the interval
. In the later section of this paper, it is shown that all solutions are symmetric with respect to the points
. This allows one to calculate the solutions on the reduced interval
. For an equidistant discretization over the whole interval, the sweep step width
was introduced. In a parametric study eigenfrequencies
were calculated for the following values of
:
The advantage of the chosen schema for
is revealed in the post-processing section in the next chapter. The UC was discretized by a quadrilateral mesh. The parameters
and
were used to control the horizontal and vertical element sizes:
In order to obtain sufficiently accurate results, the mesh was adapted to the expected waves. For the resolution in y-direction, 15 elements was a reasonable value for the investigated Lamb waves. In the case of the resolution in x-direction,
was a little bit more complicated to get a universal value for in advance. As a rule of thumb there should always be about 10 elements per wavelength. Unfortunately, the shortest wavelength is hard to determine before the first simulation. For this reason, it is important to check the mesh after each calculation. In this case, 20 elements were applied on a UC with a length of 1.5 mm. All these parameters proved suitable in convergence studies. To solve the FEM model, an iterative solver (ARPACK) based on an algorithmic variant of the Arnoldi process was applied [
39,
42]. The search space for the frequency was limited to a maximum
of 3 MHz in the solver settings. For the local discretization of the equations. quadratic serendipity shape functions were used.
Table 1 summarizes all model parameters used for the FEM calculation. The material parameters of the plate have been derived from values in the literature [
43]. However, the Young’s modulus and the Poisson’s ratio were deliberately modified to a minor extent to assess the efficiency of the optimization algorithm in a later section. It is important to note that this had no influence on the direct comparison of the models with each other, as they all utilized the same values in the calculation.
3.2. Post-Processing for the Finite Element Method Data
The solution provides several eigenfrequencies
with corresponding displacement fields
for each sweep parameter value
. In the case of the free plate, there were no artifacts which needed to be identified and removed. Hence, all of these solutions represent real GAW modes, usually denoted as Lamb waves for free plates [
44]. Lamb modes can typically be classified by their symmetry characteristics into symmetric (S) and antisymmetric (A) modes and the order of their mode (e.g., A0, A1, A2, …). This classification can be made by analyzing the displacement fields
in the plate’s cross-section for each solution.
However, all modes can occur more than once in the data for a single
. Multiple solutions exist for a single value of
because of the periodicity of the Floquet term in Equation (8). The Floquet condition assigns the same complex conjugated value for several exponents, respectively:
Consequently, the solutions differ not only in their mode but also in their wavelength and the direction of propagation. This could be resolved by analyzing the wavelength in the direction of sound propagation by spectral methods. However, both steps would involve a relatively high computational effort due to the amount of data being processed. Nevertheless, to determine the dispersion relation, for each frequency the corresponding wavenumber must be identified.
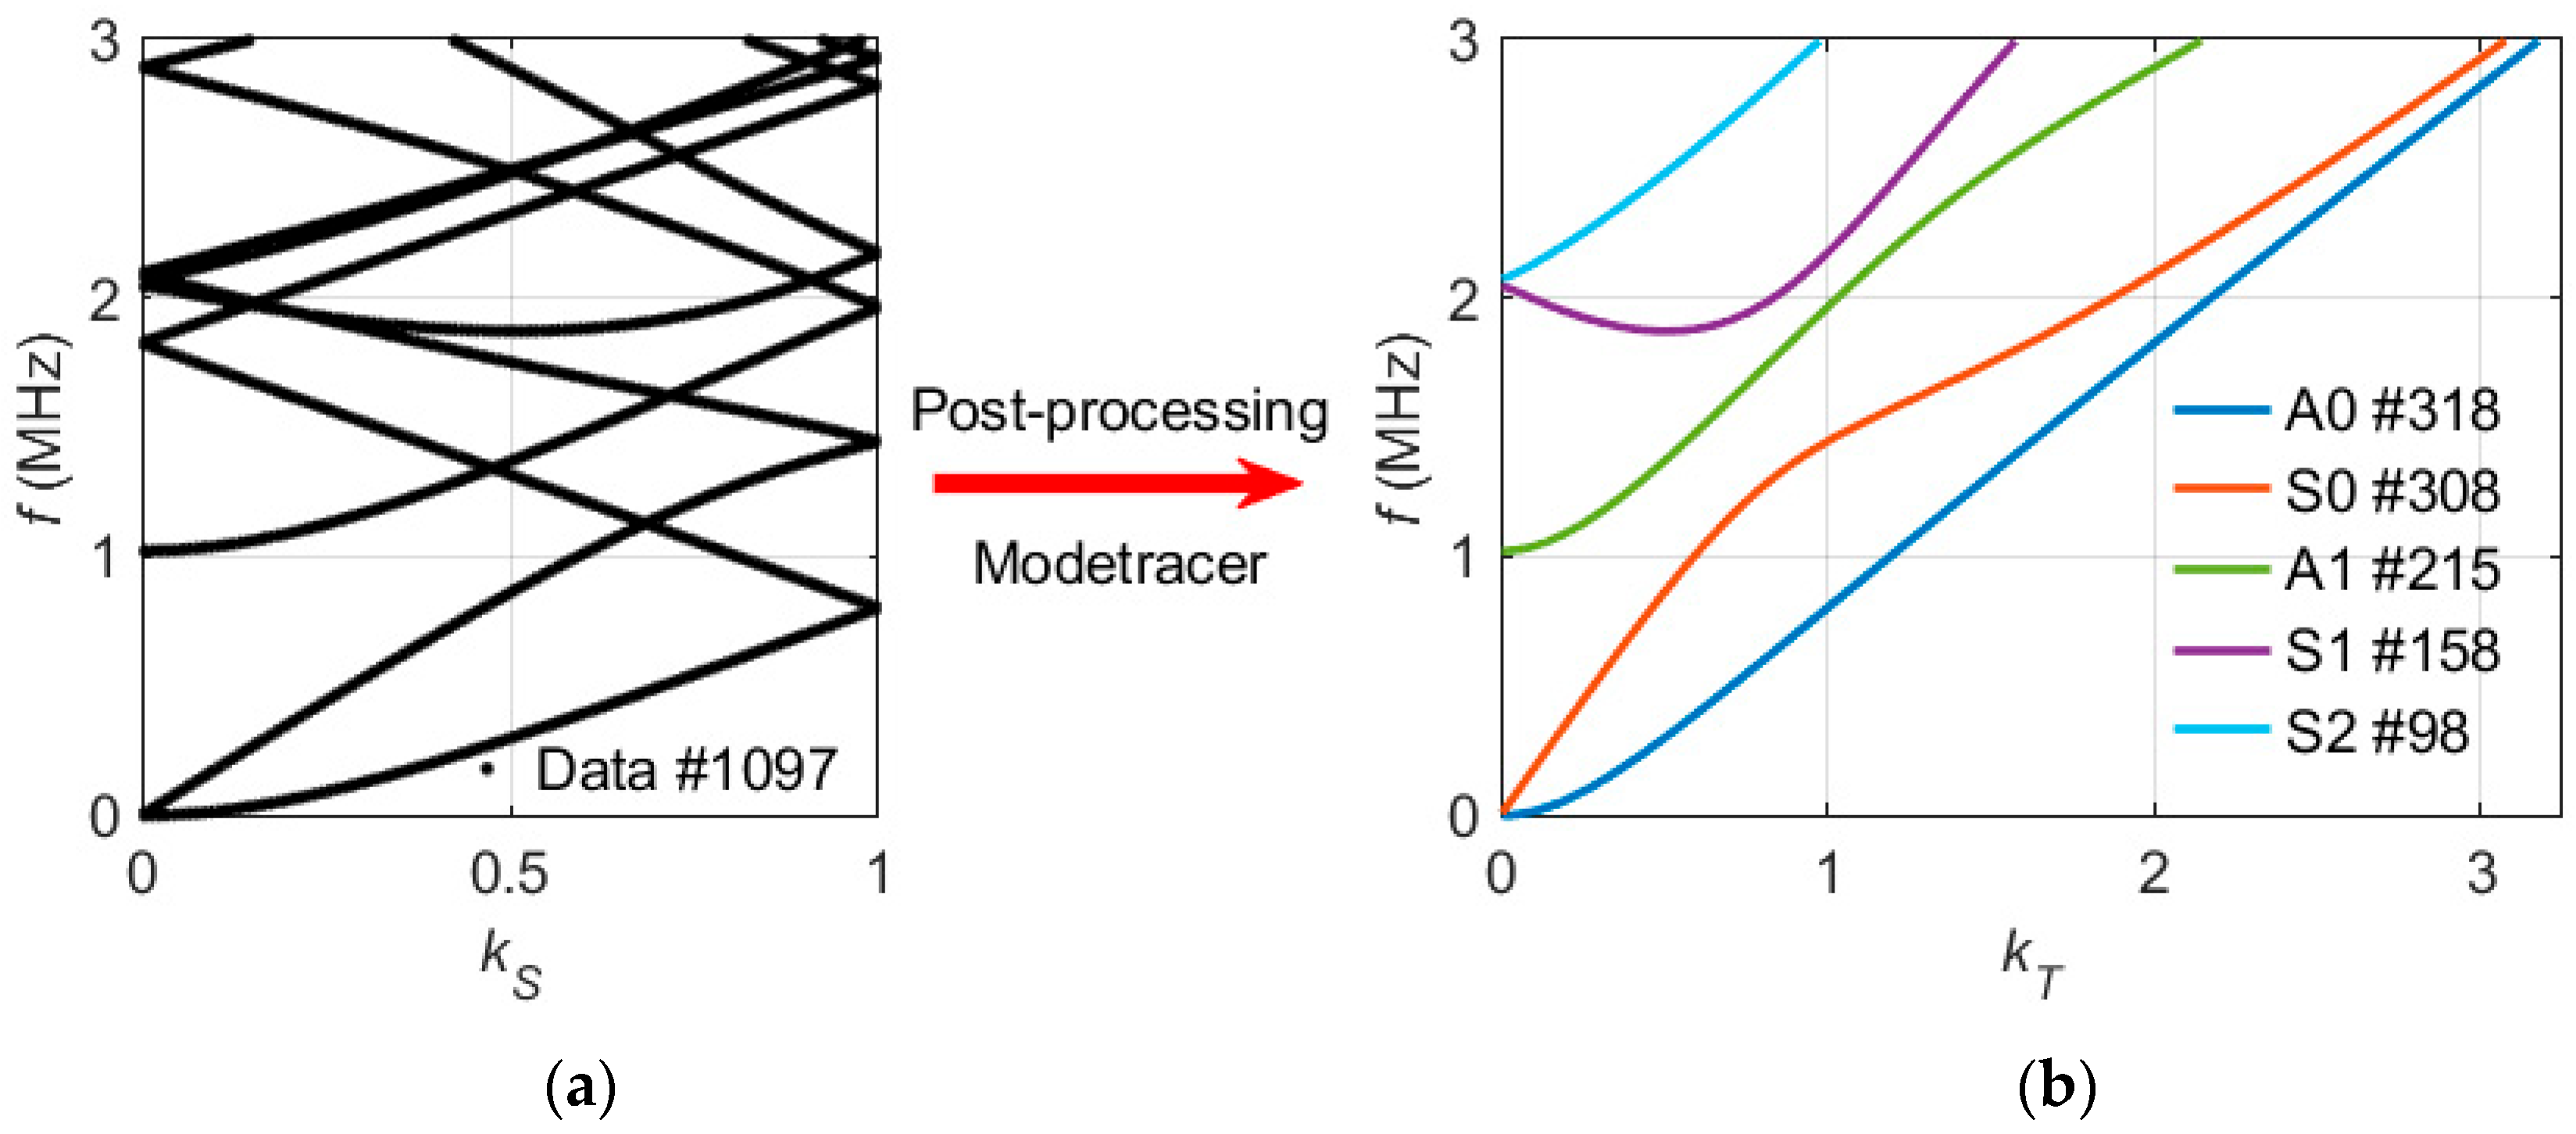
To develop a more accessible approach, all solutions were visualized as points in a band structure diagram without considering the displacement fields .
Due to the small step size of
, the band structure diagram already shows the profiles for all modes. Each mode curve starts at
and runs to the edge of the interval
. According to the periodicity expressed by Equation (9), each time a mode curve reaches a boundary of the interval
, backfolding occurs. This is always associated with a slope change in the band structure diagram and a reversal of the propagation direction in the calculated displacement fields
. Backfolding cannot be avoided, but the limiting frequencies of the backfolding can be controlled by the length of the unit cell
. Reducing
shifts the frequencies at
up to higher values. The trick for unwrapping the band structure diagram is to continuously increment the variable
. This maps the sweep parameter
into a traced parameter
:
By applying such a mode tracer, the folded band structure diagram is converted into a diagram with mode curves
possessing continuous slopes. At this point, the advantage of the chosen
(10) for the lower and upper limits
and
becomes obvious. This definition results in a constant step size of
, even over the whole unwrapped domain of
.
Figure 4b shows the traced and unwrapped modes based on the data visualized in
Figure 4a. These curves of
can be used to derive the dispersion relation for each mode:
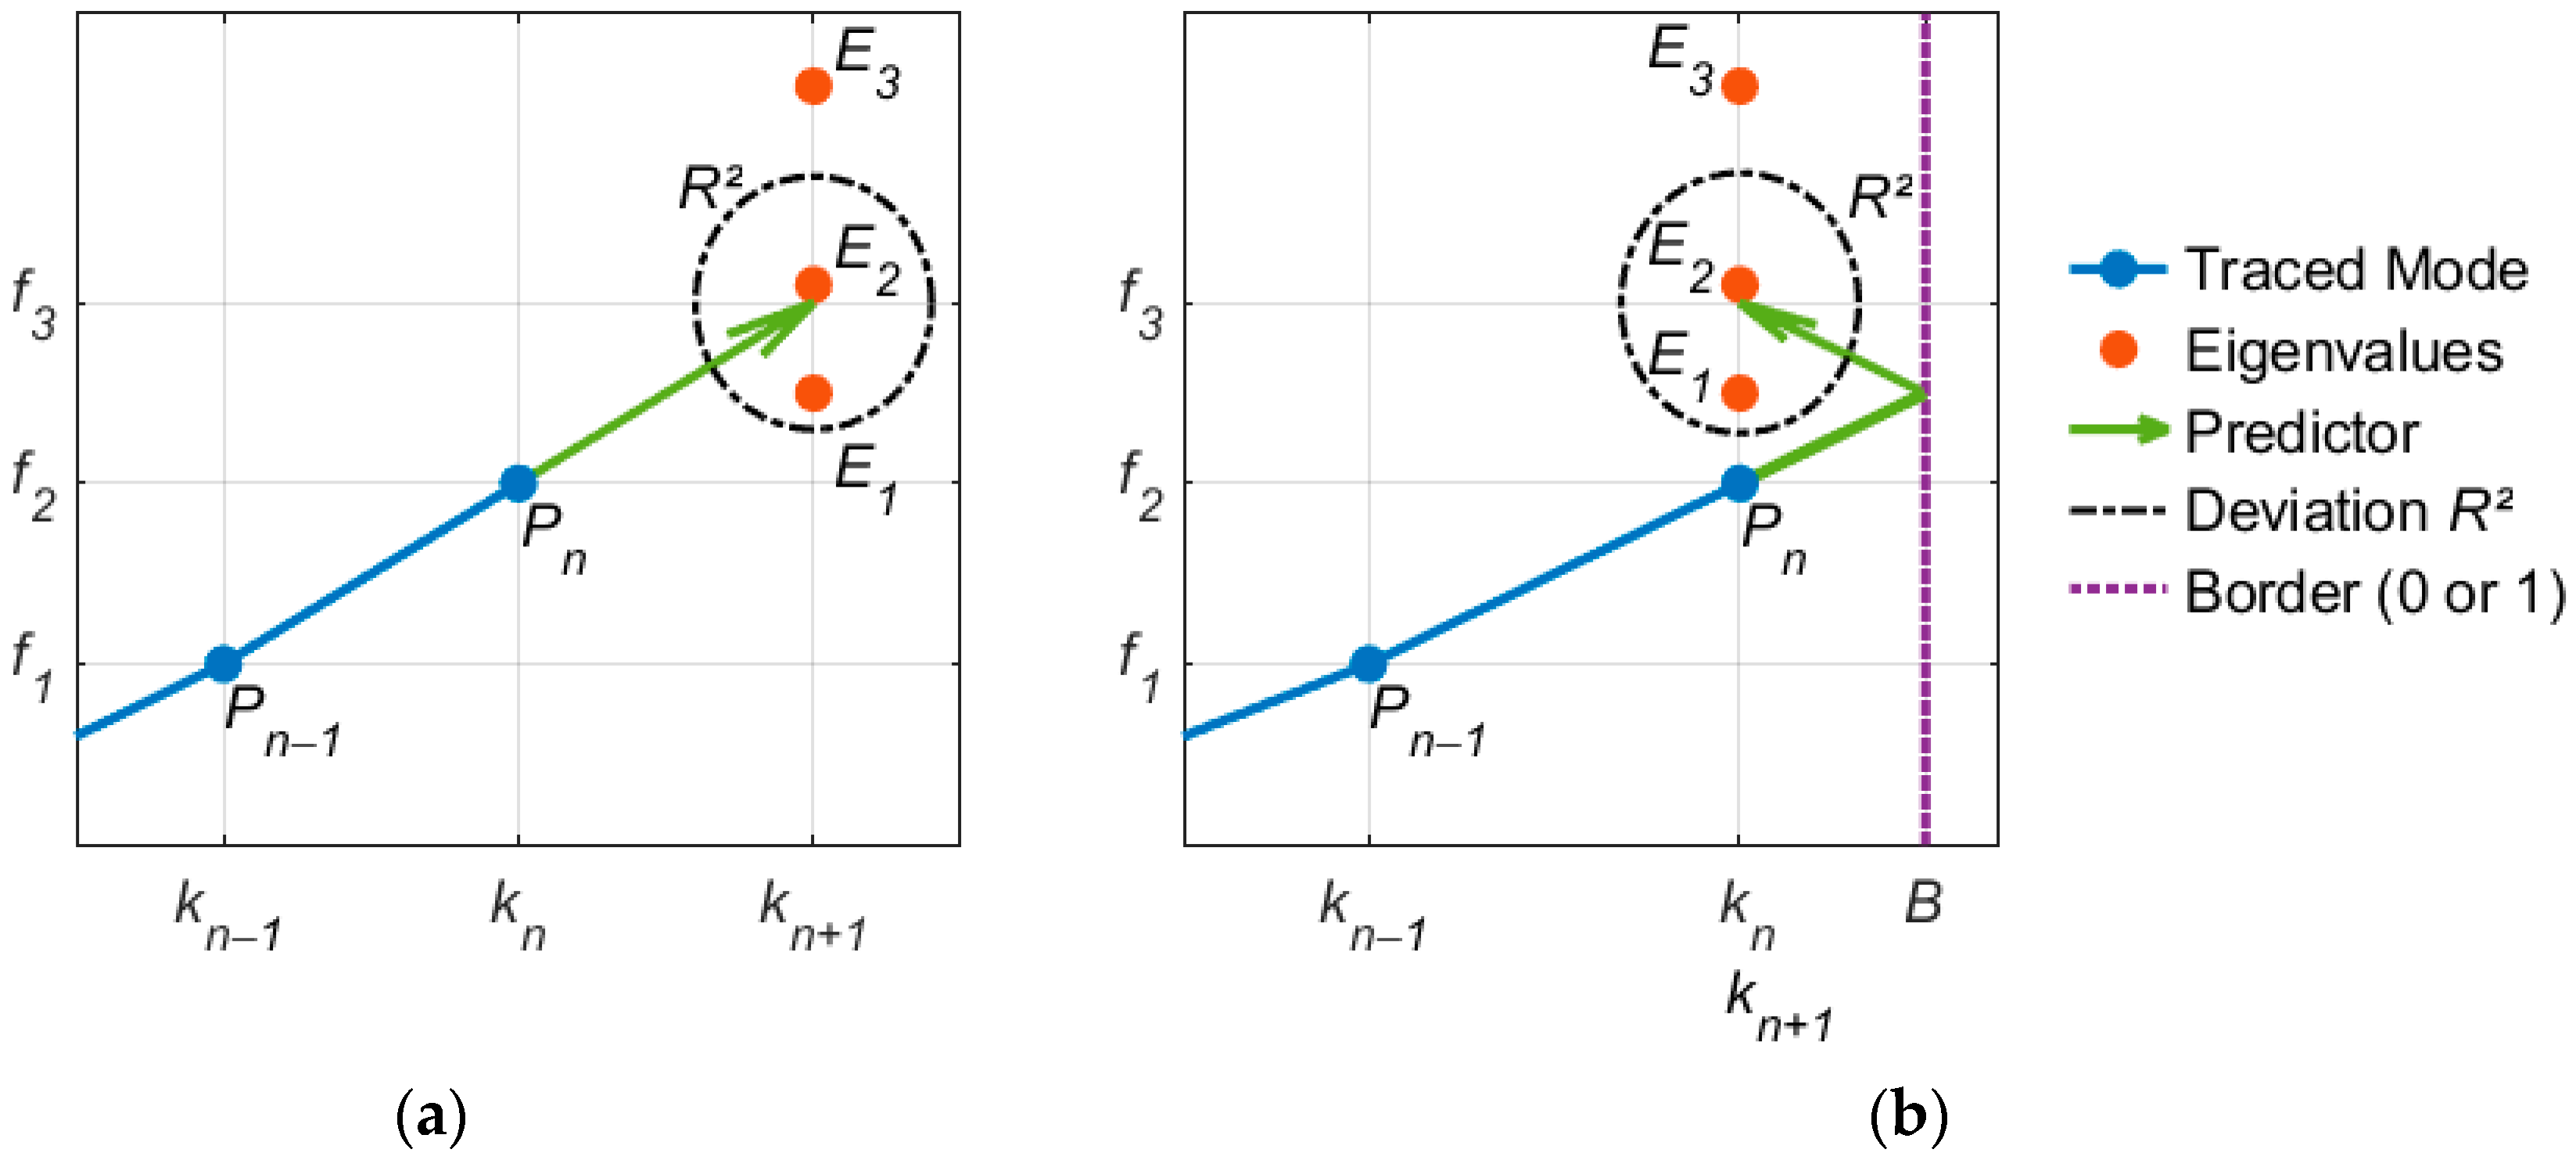
The mode tracer was implemented as an automatic algorithm, based on a simple extrapolation method. The algorithm follows six steps:
- (1)
Define two start points:
and
. These two points represent the lowest frequencies for the first and second values of
(cf.
Figure 5).
- (2)
Predict the next point of the mode by linear extrapolation using the points
and
(cf.
Figure 5a). Expand the mode curve with the solution
closest to the predictor. Continue extrapolating for the next point.
- (3)
If the interpolation reaches one edge of the sweep interval of
, interpolate beyond this border by backfolding (cf.
Figure 5b). This operation changes the horizontal orientation of the predictor up to the next edge. Keep extrapolating.
- (4)
In the whole trace process the parameter has to be transformed into the monotonously growing parameter according to (9) and (10).
- (5)
The end of a single mode curve can be controlled by defining a maximum deviation . When the quadratic deviation of the predictor from the nearest-frequency solution is greater than , the tracing of the current mode curve is terminated.
- (6)
When a mode curve has been traced completely, the procedure starts again by searching for another mode beginning with step 1 considering the remaining data. When no points remain, all modes have been traced.
Extensive tests have shown that this simple algorithm is sufficient to assign the pointwise solutions correctly to the modes. When facing any problems, the following aspects have to be considered. The step size of the extrapolation algorithm in the band structure diagram corresponds to the parameter dk. The sampling rate discretizing the modes depends on the combination of the parameters dk and L (cf. Equation (15)). L determines the frequency range between the points at which backfolding occurs. Considering a given frequency range, the following applies:
This results in the fact that, if dk is kept constant with varying L, the curves have more sampling points for a larger L than for a smaller L. It is imperative to prioritize the understanding that there has to be enough sampling points on the mode to follow all occurring bends. If the mode tracer presented here fails, it is usually helpful to decrease the value of dk. As with most simulations, it is not possible to define a generally valid rule for these model parameters a priori without further information.
3.3. Model Fitting by Parameter Optimization with Experimental Data
The agreement between experimentally determined and simulated dispersion relations rests on the accuracy of dimensional parameters (plate thickness) and material parameters (Young’s modulus, mass density, Poisson’s ratio) used in the simulation. Resources (time, staff) usually do not allow one to accurately measure these parameters for all samples of interest. A more efficient way is to use an optimization algorithm to vary the simulation parameters until the simulation results agree with the experimental results in the best possible way. However, care must be exercised to ensure that measurement noise or errors are not compensated for by unphysical parameter adjustments.
A look at Equations (6) and (7) reveals that two out of the four parameters are not independent. These two parameters are the mass density and Young’s modulus because it is only their ratio that enters into the equation. Consequently, a linear factor could be applied to a given ratio or only one of the two parameters could be optimized while the other is kept unchanged. Both alternatives do not necessarily yield physically correct parameters. Nevertheless, the dispersive behavior is described correctly.
In this work the optimizer was designed to vary Poisson’s ratio and Young’s modulus in the simulation model to minimize the least squares deviation
between measured and simulated eigenfrequencies:
To this end, multiple pairs of
were extracted from the measured dispersion relation, as in
Figure 2b, and were passed to the simulation model. It turned out that it was more important to select data from all available modes instead of many points on one single mode. In addition, the points should be distributed over different wavelengths and not just accumulate locally to achieve good results. The starting values for the simulation parameters were taken from the literature as listed in
Table 1.
3.4. Implementation of Fluid Loading to the FEM Plate Model
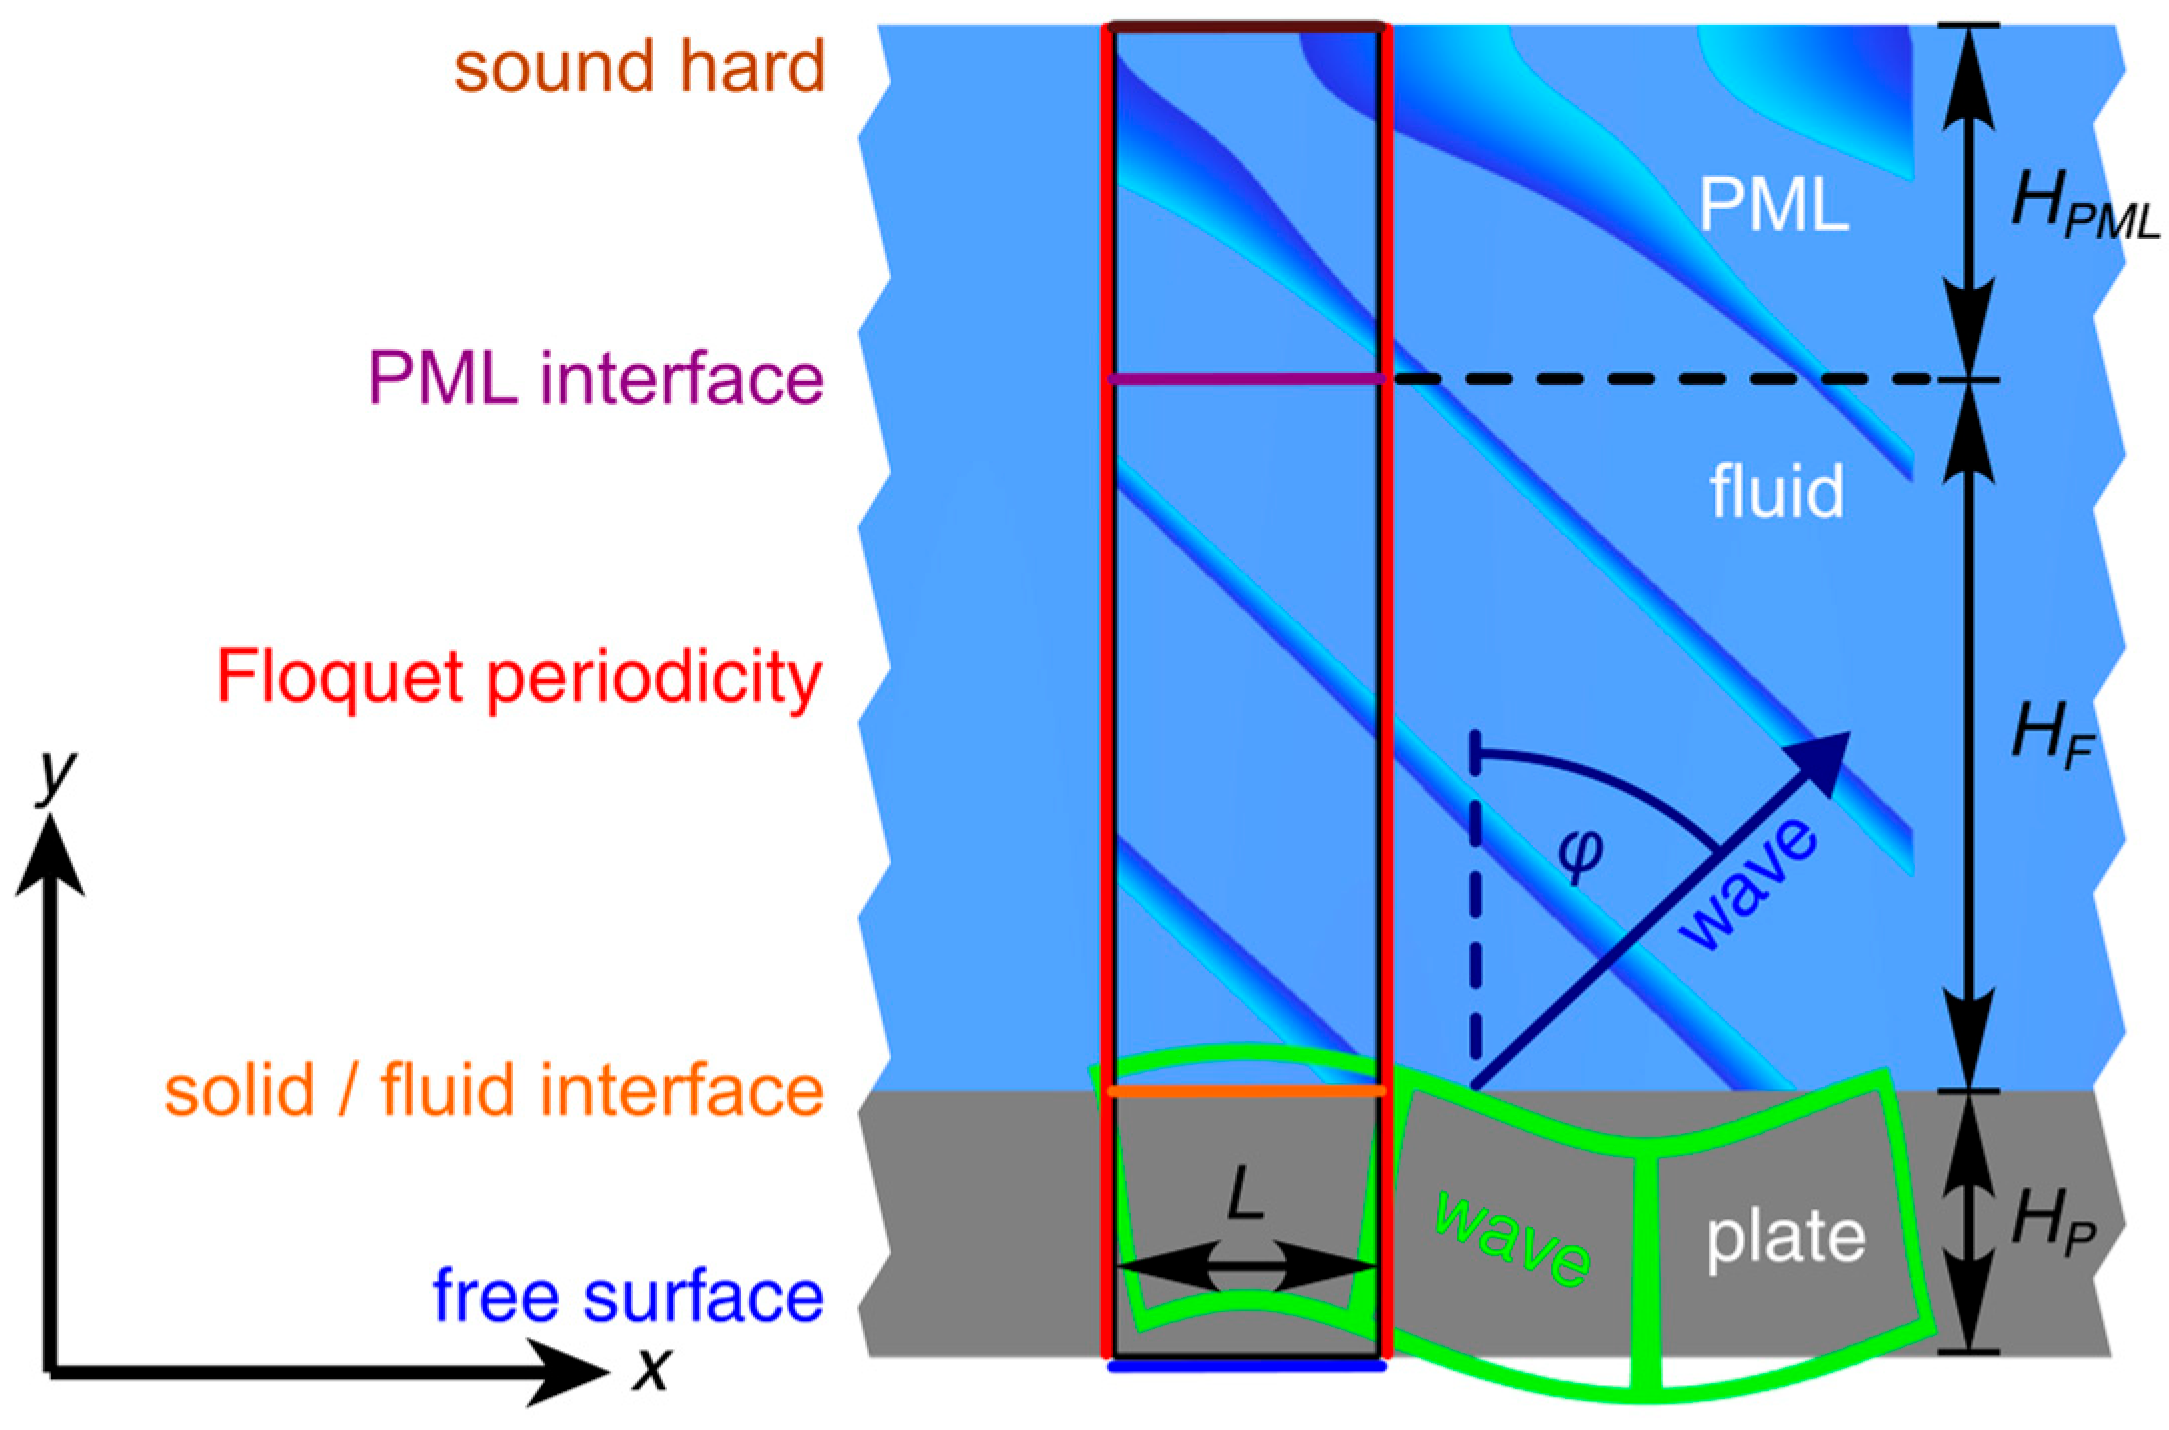
In the next step, the effect of fluid loading and its interaction with GAWs was investigated. For this purpose, the model was extended by an additional fluid domain on one side of the plate (
Figure 6).
Similar to the unloaded model, only a small unit cell was modeled to reduce computational effort. The physical behavior of the sound waves in the fluid is described by the Helmholtz equation [
45]
Here,
represents the scalar pressure field of the wave, and the parameter
is the speed of sound in the fluid. At the fluid–plate interface, Equation (20) of the fluid has to be linked to the Equation (7) for the plate [
39]. From the perspective of the plate, the interaction can be written as
This Dirichlet boundary condition links the external load of plate
to the pressure of the fluid domain at the interface
. Based on Newton’s second law, a Neumann boundary condition at the fluid–plate interface can be derived as
from the perspective of the fluid. Formula (22) couples the local normal acceleration of the plate with the gradient of pressure in the fluid domain. In this formula
is the unit vector normal to the interface,
the local displacement field of the plate and
the local pressure in the fluid. The intensity of the interaction is defined by the fluid mass density
.
To ensure that the simulation only yields waves in the fluid radiated away from the plate (rather than being incident on the plate), a perfectly matched layer (PML) was implemented at the top boundary of the fluid domain. Therefore, the fluid domain was split into a lower physical region and the upper PML region with the respective heights
and
, with complex parameters
and
in the PML region [
46].
Similar to the free plate, the Floquet boundary condition was used for the fluid domain. To this end, Equation (8) had to be rewritten for the variable
. Again, a regular quadrilateral mesh was used. All relevant parameters for this model are listed in
Table 2. The parameters used for the fluid-loaded plate were derived by combining the data from the free plate experiment with the optimizer described in
Section 3.3.
To solve the system of equations for the eigenfrequencies, a parametric study over
was performed to solve for the eigenfrequencies. Caused by the PML’s energy dissipation, the calculated eigenfrequencies show complex behavior:
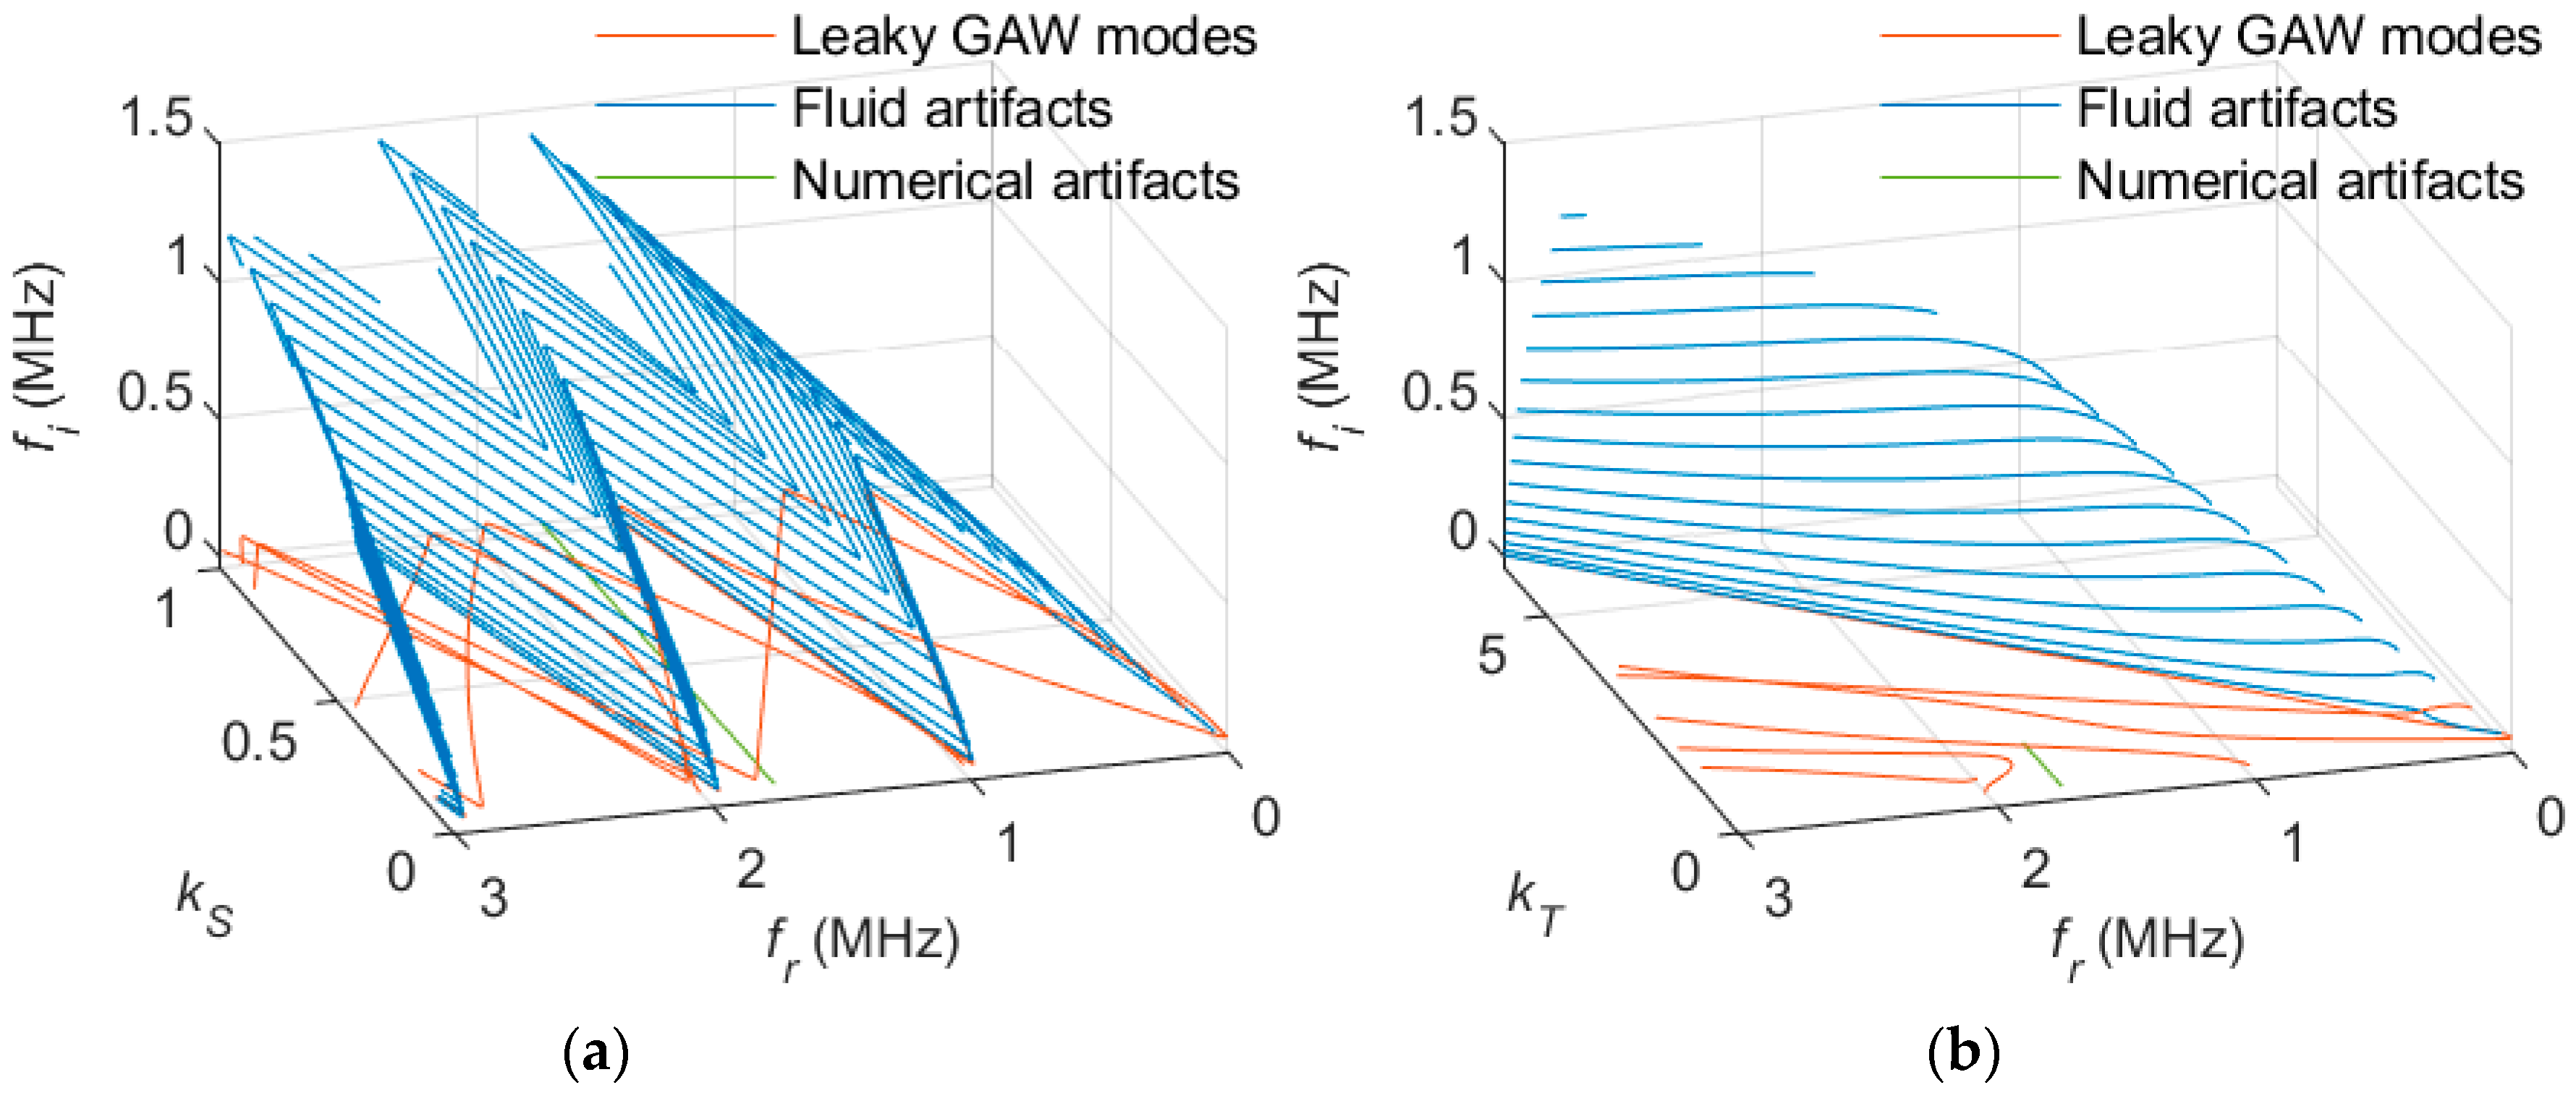
Therefore, the mode curves must now be drawn in a three-dimensional coordinate space (cf.
Figure 7). For tracing the modes, a three-dimensional version of the tracing algorithm presented in
Section 3.2 was used.
As illustrated by
Figure 7, the traced curves can be classified in three categories. This classification is indicated by different colors in
Figure 7. The red lines correspond to the familiar GAWs extended by the evanescent quasi-Scholte plate mode (QSP). These modes show typical behavior and can be identified by small imaginary parts of the eigenfrequencies. The blue lines are unphysical eigenfrequencies caused by the fluid domain. Their quantity and position depend on the heights
and
. The short green curve fluctuates around a value of about 1.75 MHz and is limited to the interval of
∈ [0; 1]. These are numerical artifacts caused by the Multiphysics coupling. A more detailed analysis of the curve’s behavior and interaction is given in the results section.
After the separation of the GAW modes, the characteristic parameters were calculated by the Equations (15)–(18). Additionally, to cope with the fluid loading, a further parameter for the decoupling behavior of the waves was calculated. To derive the attenuation factor
, we started with the wave equation and manipulated it:
The time-dependent decay coefficient of the envelope in Equation (26) can be reformulated into the usual local variant by using the group velocity of the wave:
Therefore, the final expression for
is given by
in Np/m.
3.5. Numerical Reference Models
Two non-FEM-based methods, the GMM and SCM, were selected as reference models. The parameters used for these models are listed in
Table 1 (free plate) and
Table 2 (fluid-loaded plate).
- 1.
Global Matrix Method (GMM)
The GMM is a well-established method for the calculation of dispersion relations [
31,
32,
48]. It is suitable for single-layer and multi-layer models. In this work, the commercial software tool Disperse (Version 2.0.20a) [
48] from Imperial College London was used to set up and solve the GMM models. Since Disperse has been extensively tested and improved for a long time, it is perfectly suited for the validation of the FEM model.
Generally, GMM models describes the complete waveguide system by a single matrix, the so-called global matrix. In contrast to the FEM, the plate in our geometry is not discretized. Instead, the individual sections of the matrix only represent the interfaces between two neighboring layers. In the first and last section of the matrix, it is specified whether the system is limited by a solid half-space, a fluid half-space, or a vacuum region, depending on the implementation. The system of equations is solved for the partial amplitudes in each layer describing the wave’s frequency, wavenumber, and attenuation. For this purpose, the Disperse software uses an iterative algorithm based on a Gaussian elimination scheme. The removal of artifacts and the post-processing of the data is automatically organized in Disperse. Further details on the GMM and how to handle the software can be found in the literature [
49] and the Disperse User’s Manual [
48].
- 2.
Spectral Collocation Method (SCM)
To find GAW solutions the SCM uses the same Helmoltz equations approach as the GMM [
20,
26,
27]. The SCM works with local discretization similar to the FEM model. However, the geometry is discretized only in one dimension along a line through the plate’s cross-section, perpendicular to the direction of wave propagation. Similar to the GMM, the SCM takes the fluid space into account by applying a suitable boundary condition without further discretization. To obtain the dispersion relation, the eigenvalues of the system of equations have to be determined. In this work, a spectral collocation method with Chebyshev polynomials was implemented in MATLAB R2024b, based on the work of Kiefer et al. [
20]. To ensure good comparability with FEM simulations, the same amount of sampling points for the plate discretization was chosen. Similar to the FEM, the SCM produces unordered solutions, which must be assigned to individual modes by post-processing and purged of non-physical artifacts.
4. Results
In this section, the validity of the FEM model is evaluated by comparing the results with the two reference models and the experimental data.
4.1. Numerical Validation for a Free Plate
The dispersion relation of Lamb waves in free plates is well known and was therefore used as a benchmark to validate our algorithms.
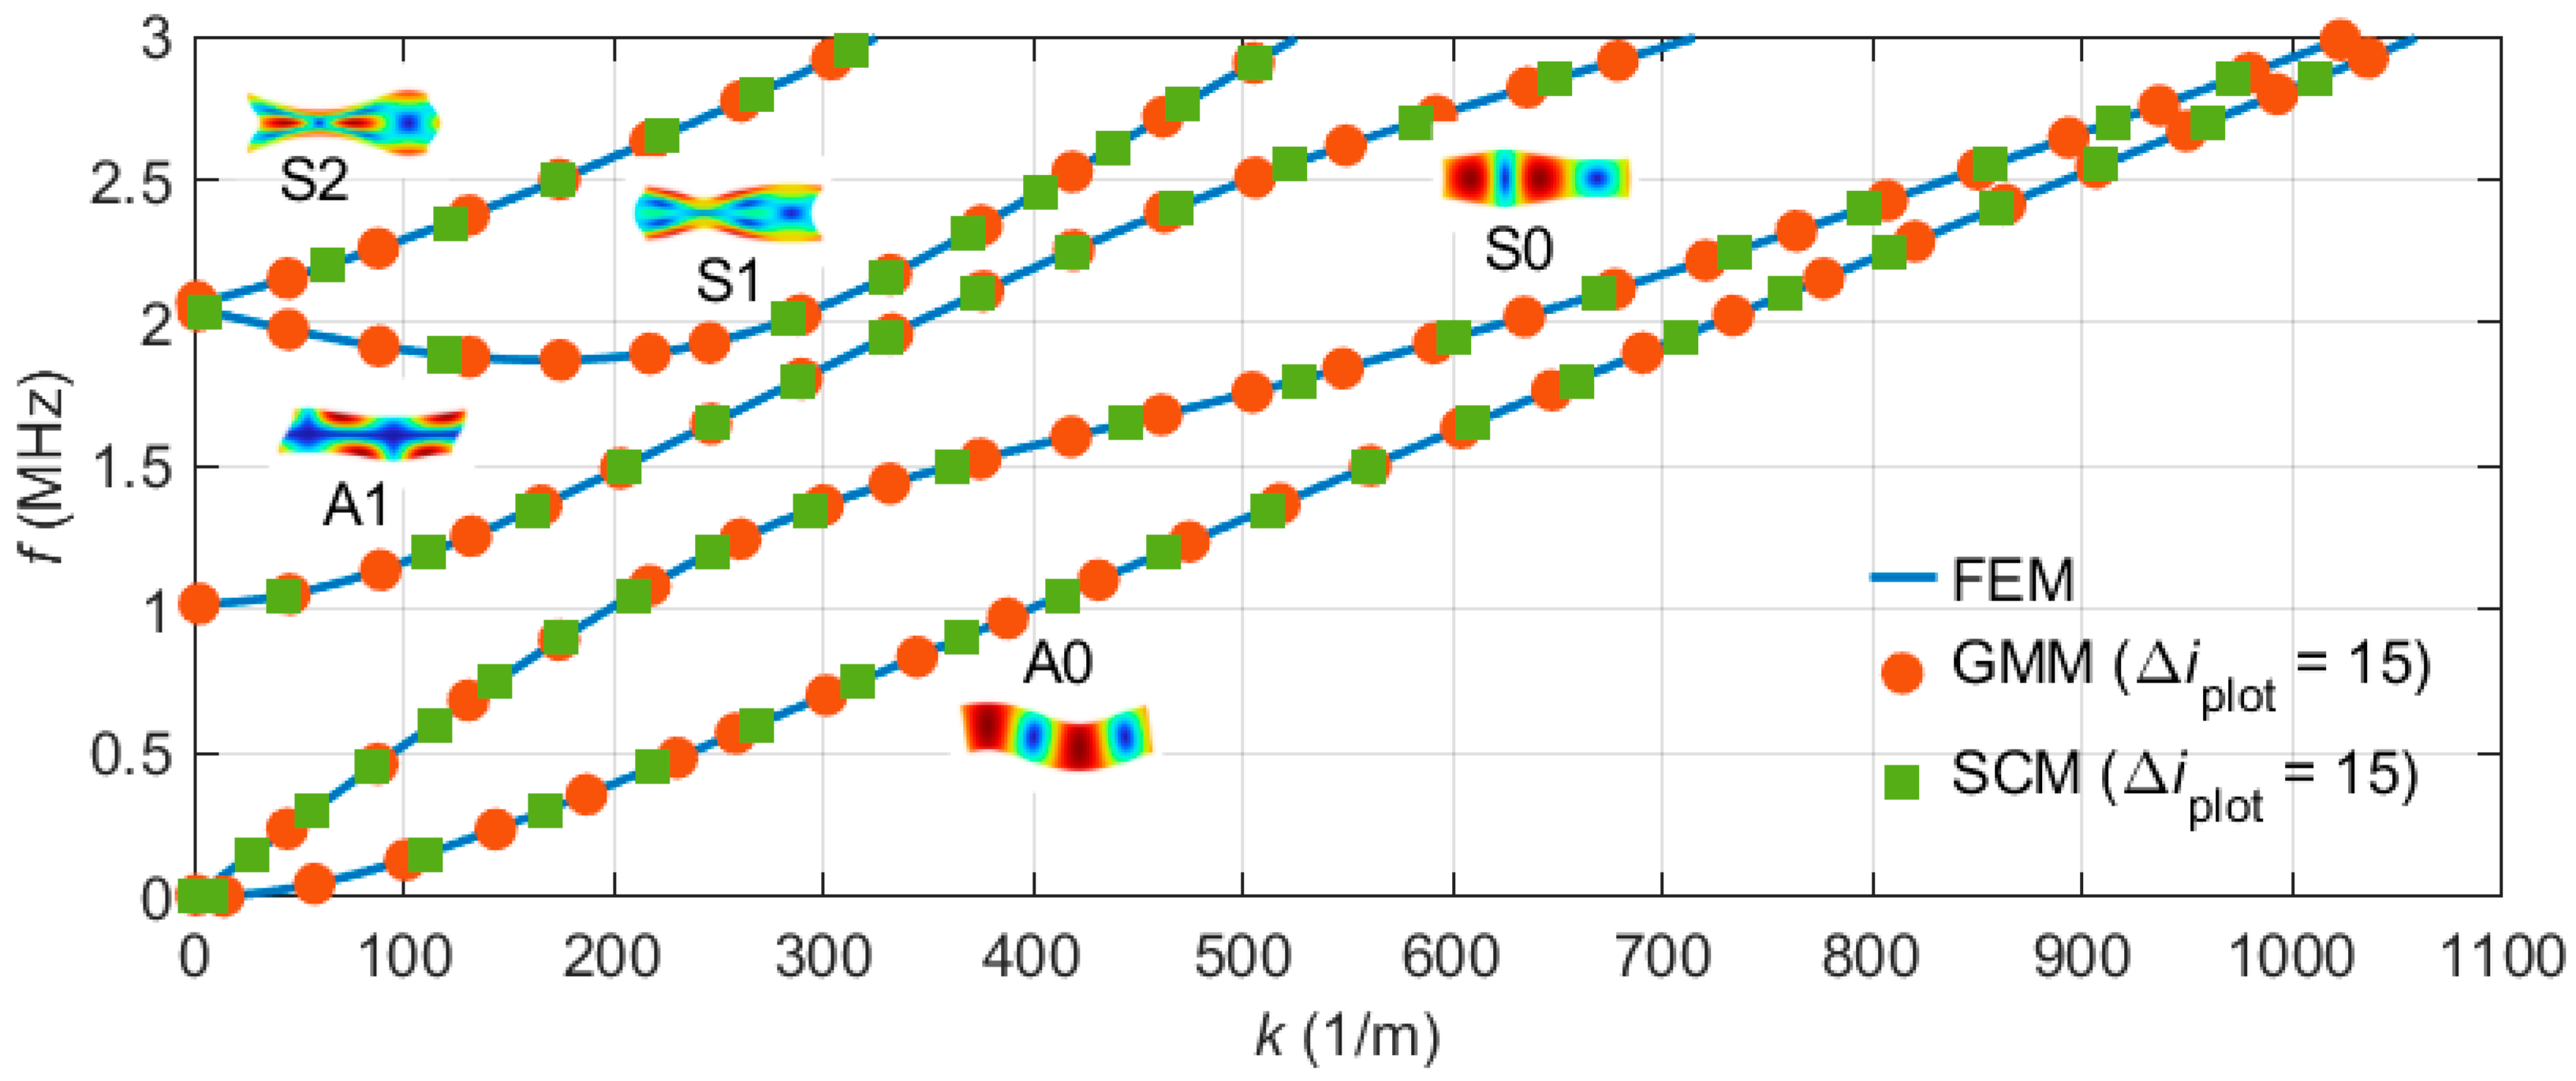
Figure 8 shows the traced and unwrapped band structure diagrams obtained from the FEM model (blue line) and the two reference models (symbols). Each curve is labeled with the name of the mode and a small image of the corresponding displacement field. For better readability’s sake, only every 15th data point of the reference models is shown. It is obvious that the reference model results and the FEM curves agree exactly. No significant deviations can be recognized in this diagram.
For a more detailed analysis, the relative deviations were calculated. Due to their different calculation methods, each model used different discrete values of
and
. To compute the deviations, the results of the two reference methods were resampled to the
values used in the FEM by linear interpolation.
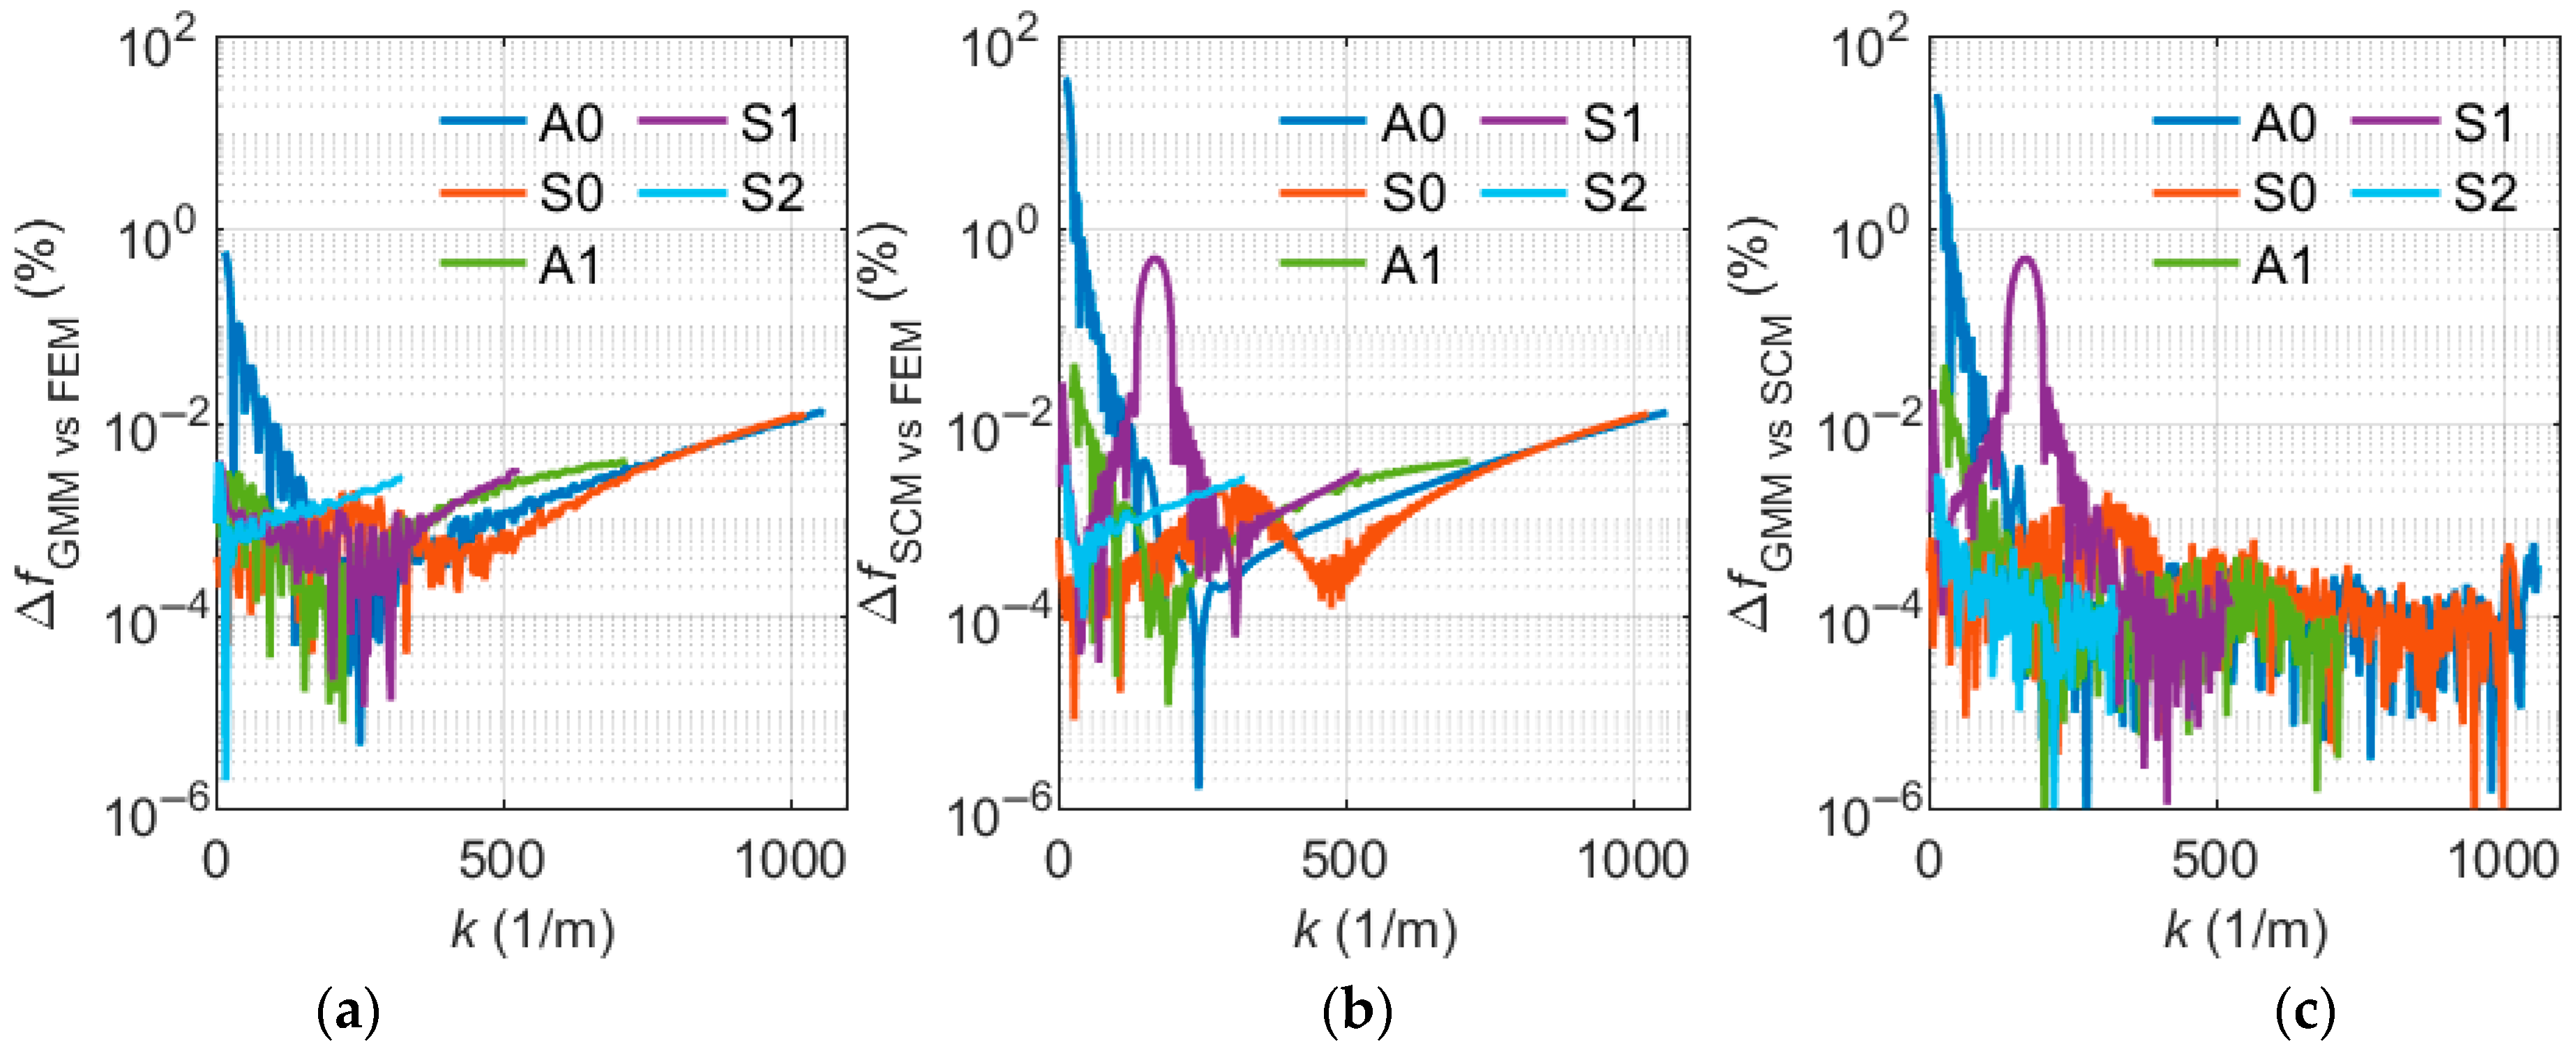
Figure 9 shows the relative deviations, comparing the three different simulation methods.
Unsurprisingly, the largest relative deviations can be observed at lower frequencies. This is due to the fact that, in relative evaluation, very small frequency values are involved, leading to high relative deviations even when the absolute differences are small. The comparison of the FEM model with both reference methods shows similar trends, with deviations almost always well below 0.1%. However, the deviation between the FEM and SCM model is larger than that between the FEM and GMM, which is also evident when comparing the two reference methods against each other. The SCM struggles especially in the case of the S1 mode. Here, only a few data points are available at the curve’s minimum, caused by the used parameter sweep over and the intention to obtain approximately the same number of data points in each method. This leads to a comparison of numerous interpolated values, introducing artificial uncertainty. Additionally, the comparison of the reference methods highlights that the SCM tends to show deviations not only from the FEM but also from the GMM. However, only in the FEM model, the deviations increase with higher frequencies. This is related to the fact that the FEM is the only method that discretizes the wavelength along the plate in addition to the plate thickness. The decrease in accuracy is synonymous with a dwindling number of elements per wavelength by increasing frequencies.
4.2. Parametric Optimization by Experimental Dispersion Data
To validate the applicability of the FEM model to experimental data, the optimization algorithm described in
Section 3.3 was applied using the experimental data visualized in
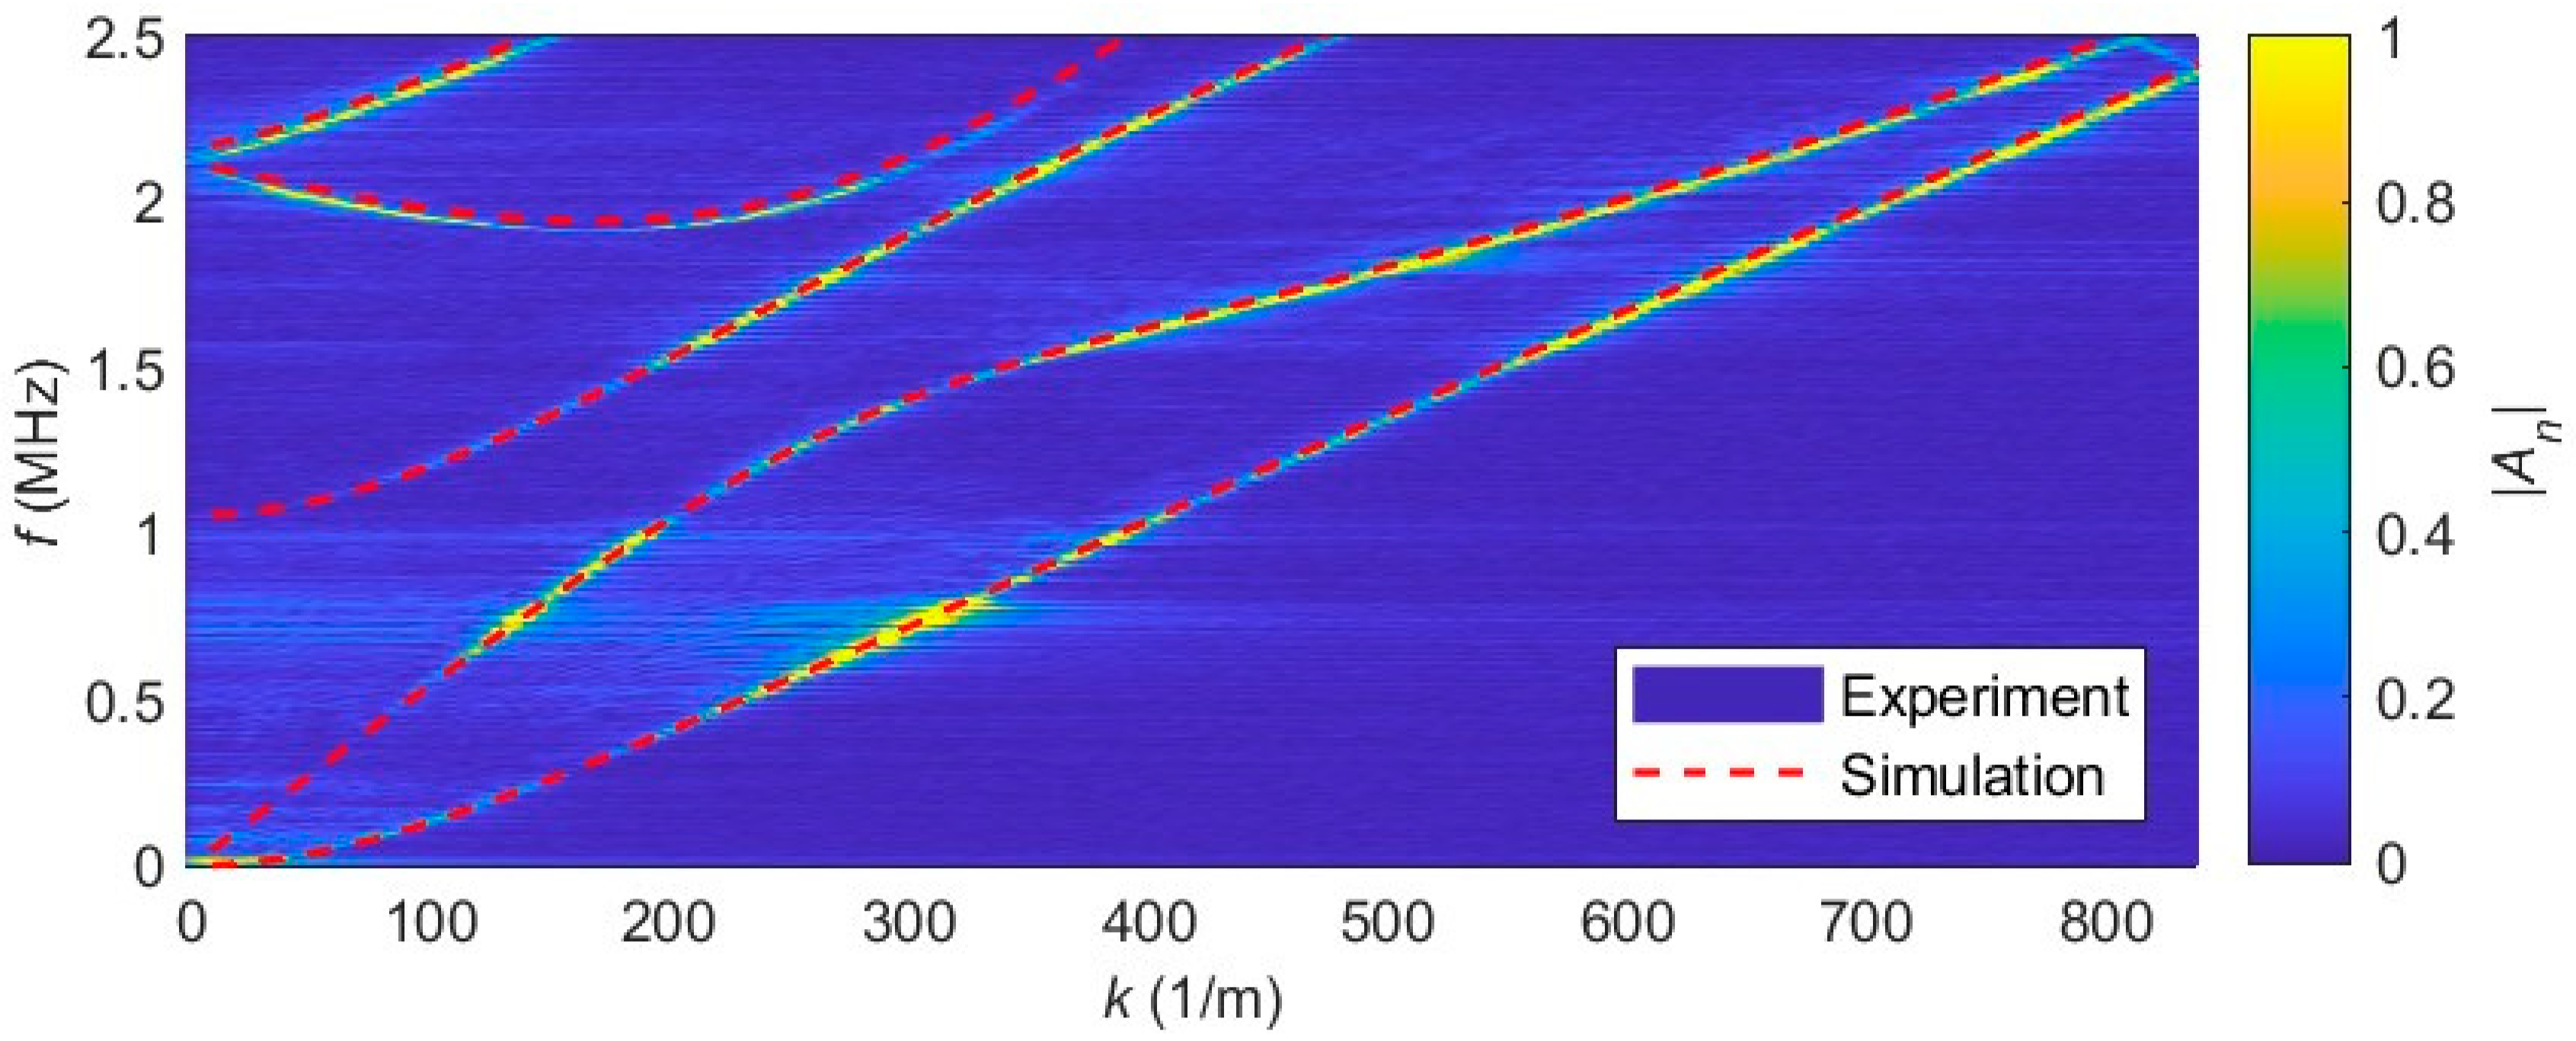
Figure 2. To select the sampling points, it is important to consider the limits of the measured data. In this case, the limit is the wavelength resolution caused by the step width of the point-by-point scanning laser. For example,
Figure 2 reveals an aliasing effect in the upper right corner (backfolding of A0 mode) caused by reaching the wavelength limit calculated in Equation (3). To demonstrate the efficiency of this method, only a small number of supporting points were used. For this purpose, five equidistant wavenumbers (
= 83 1/m, 250 1/m, 417 1/m, 583 1/m, 750 1/m) were selected. The corresponding frequencies were evaluated and passed on to the optimizer. Due to this discretization the amount of sampling points per mode may vary in the optimizer (A0: five points, S2: just one). The starting values and the results of the optimizing process are listed in
Table 3.
Figure 10 displays the experimental data in comparison with the optimized FEM results. The agreement is very good for each mode over a wide range. Sometimes slight deviations occur, especially for the higher modes, which might be due to lower weighting of a smaller number of sampling points in the optimizer. These results were achieved with just 17 points used in the optimizer. If a higher resolution is required, additional sample points can be added or further parameters such as plate thickness can easily be included in the optimization process.
Due to the excellent agreement of the measured and simulated dispersion curves, these values were used for the fluid-loaded modeling, too. Therefore, the optimized parameters are listed in
Table 2.
4.3. Characteristics of Finite Element Models with Fluid Loading
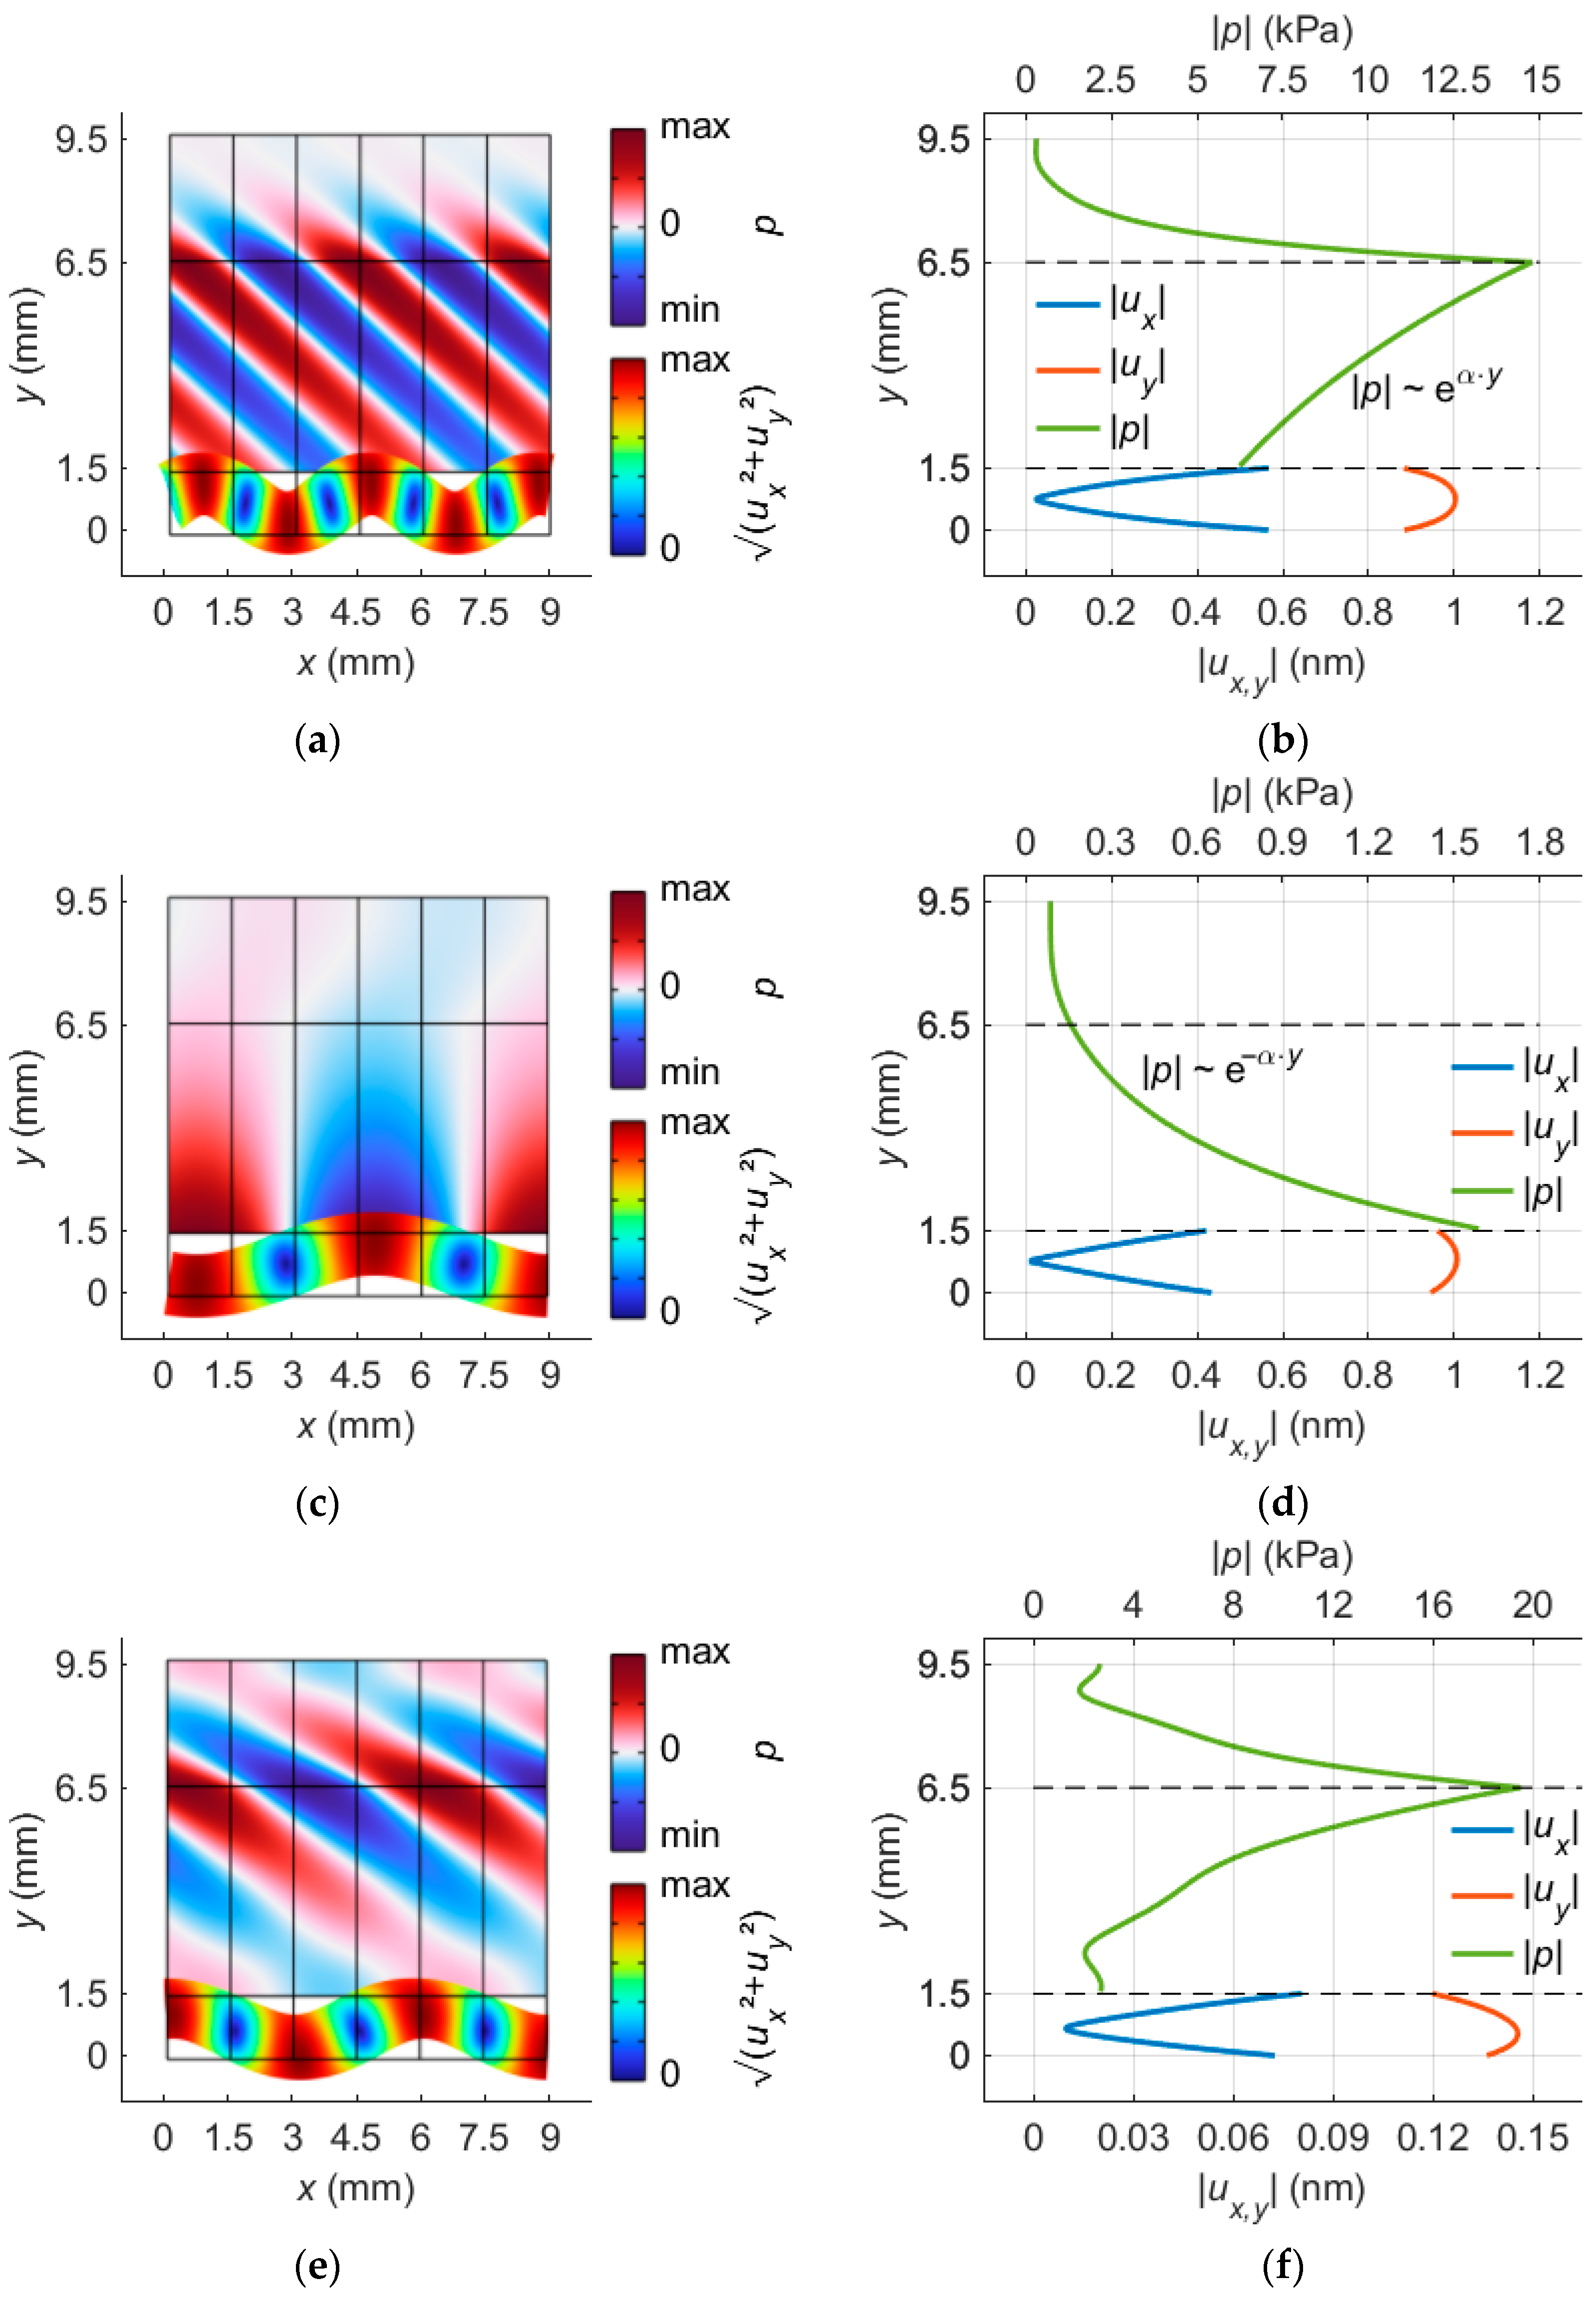
To improve understanding of FEM solution characteristics with fluid loading, three exemplary solutions were analyzed. The A0 and QSP modes—both GAWs of interest—were compared to each other and with one artifact solution caused by the height of the fluid domain.
Figure 9 displays the mode shapes and pressure profiles of these solutions.
Figure 11a,b shows the results for the A0 mode. The leaking of this A0 mode with a pressure wave in the fluid is caused by the higher phase velocity of the wave on the plate as compared to the sound velocity of the fluid. This leads to the plane pressure front visible in
Figure 11a. In
Figure 11b the corresponding vertical pressure profile is displayed. The pressure amplitude shows an exponential increase with distance in the y-direction away from the plate. The reason for this is that the solutions represent a snapshot of waves decoupling into the fluid from an infinitely long plate. The pressure values at the solid–liquid boundary are linked to the instantaneous amplitude on the plate. Pressure values further away are caused by higher amplitudes which were leaked in the past. The aspect of time-dependent leaking is just translated from time to space by the speed of sound in the fluid. Based on this, the plate’s attenuation factor
(28) leads to an exponential increase in pressure in the fluid according to Equation (29) along the Rayleigh angle
and according to Equation (30) along the
y-axis.
Here,
is the pressure amplitude at the plate surface,
the distance along the Rayleigh angle,
the distance along the
y-axis, and
denotes the corresponding growth rates. Caused by the fluid loading, most GAWs radiate energy into the fluid. Here, the only exception is the QSP (
Figure 11c,d). The reason for this is the phase velocity of the wave. When the velocity of the wave is slower than the speed of sound in the fluid, it cannot leak, which leads to an evanescent pressure field. In the case of QSP, the sound pressure in the fluid decreases exponentially with the distance to the plate. The corresponding Rayleigh angle
is 90° in theory. The decoupling factor
can be calculated by two pressure values at two points:
and
.
The mode visualized in
Figure 11e,f is an example of a spurious mode generated by the presence of the fluid domain. At first sight this mode looks quite similar to the other two. The vibration behavior of the plate resembles that of the A0 mode for all three modes. And the leaking behavior also looks familiar to the A0 mode. On closer inspection, however, the artifact solution does not produce a plane wave front in the fluid and the displacement profile of the plate looks slightly skewed. Furthermore, the pressure profile in
Figure 11f no longer increases exponentially away from the plate surface.
Figure 7 reveals the existence of many spurious modes which have to be sorted out by the mode tracer. As already mentioned the artifacts of the fluid-loaded model vary with the parameters
and
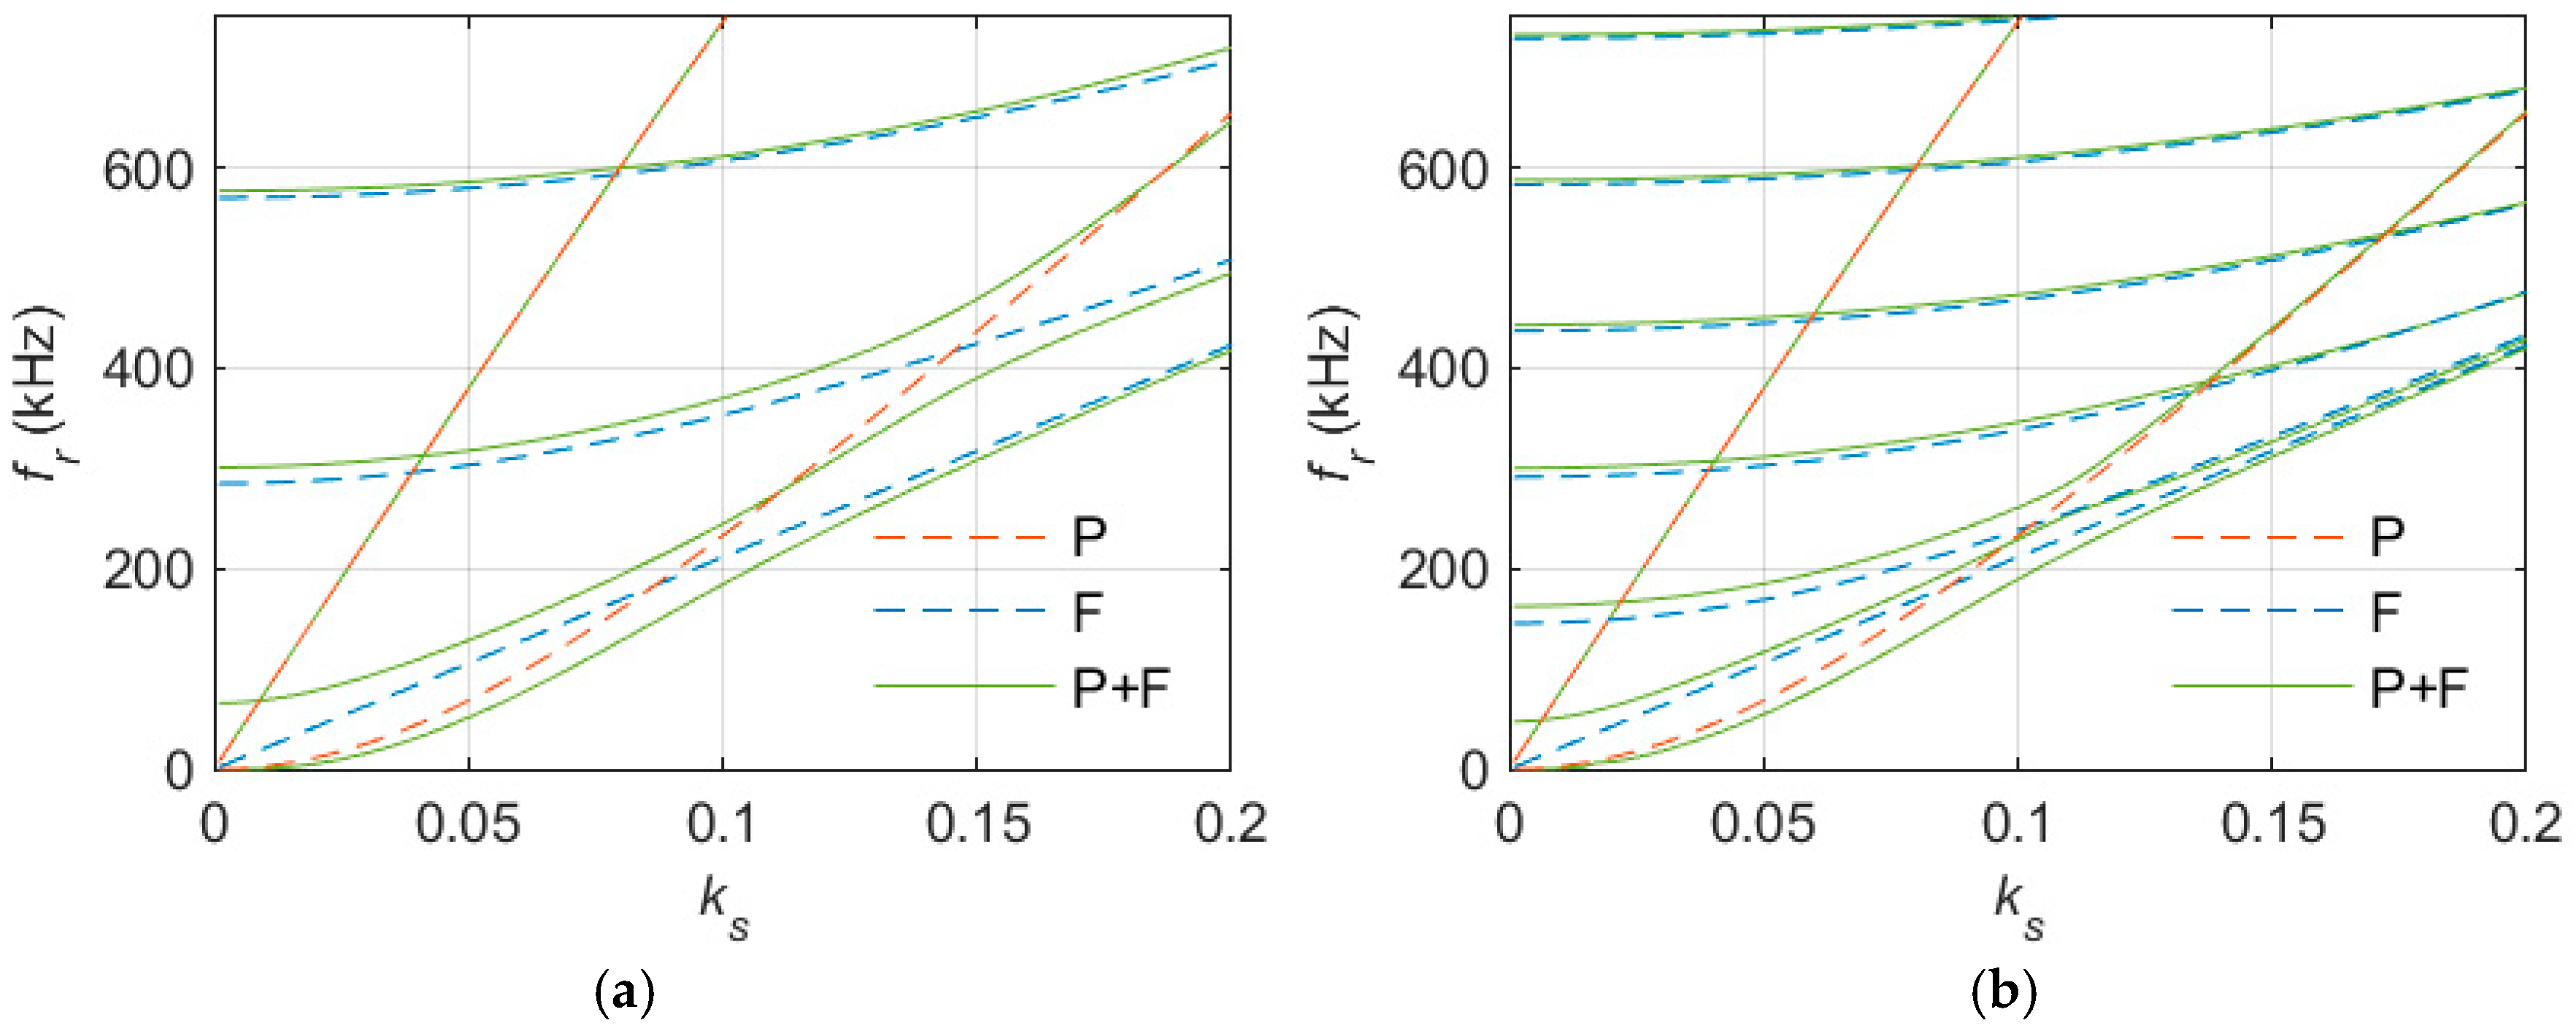
. The thicker the fluid domain, the more natural frequencies appear in the frequency range investigated. Unfortunately, depending on the choice of these parameters, there are weaker or stronger interactions between the modes of the GAWs and the spurious modes. This effect can be clarified by overlaying the band structure diagrams for a free plate, with the solution of a free fluid domain with PML and their coupled combinations.
Figure 12 shows two examples with different thicknesses of the fluid domain.
The two examples reveal several aspects of the FEM model. The coupled fluid/plate model solution (solid green lines in
Figure 12) are mainly combinations of the solutions of the pure models (dashed red and blue lines) modified by small interactions. But the interactions can become especially strong where the dispersion curve of the low-frequency A0 mode is crossed by a curve associated with a fluid mode artifact. As a consequence of the interactions, the pure-mode dispersion curves no longer intersect (which would indicate a mode degeneracy) but fall apart into clearly separated smooth curves, much in the same way as coupled identical resonators that no longer resonate at the same (degenerate) frequency but at different frequencies. These effects often occur when the PML fails to damp incident waves sufficiently. In this case the first attempt should be to increase the PML thickness. Nonetheless, a complete avoidance of such interactions was never successfully achieved. They always occurred at low frequencies for the A0 mode. It is therefore particularly difficult to determine the exact cut-off behavior of the mode by FEM. The most pragmatic approach was to select parameters to produce one remaining interaction. Beyond the transition, the traced mode converges to the correct solution of the A0 mode.
4.4. Validation of the Fluid-Loaded Model
Similar to the free plate, the solutions of the model with fluid loading were compared with both reference methods. However, when calculating the reference model of a plate with one-sided fluid loading using the GMM, the used commercial software (Disperse) failed. Although several local minima of the equations were found, the algorithm was not able to determine the progression of the mode curves. It is assumed that the algorithm is not able to determine the classical symmetric and antisymmetric modes due to the asymmetric boundary conditions. In order to be able to validate the FEM model with both reference methods, all models were extended by a two-sided fluid loading for the model-based validation. Due to its simpler experimental setup, the one-sided fluid loading is still used for the experimental validation.
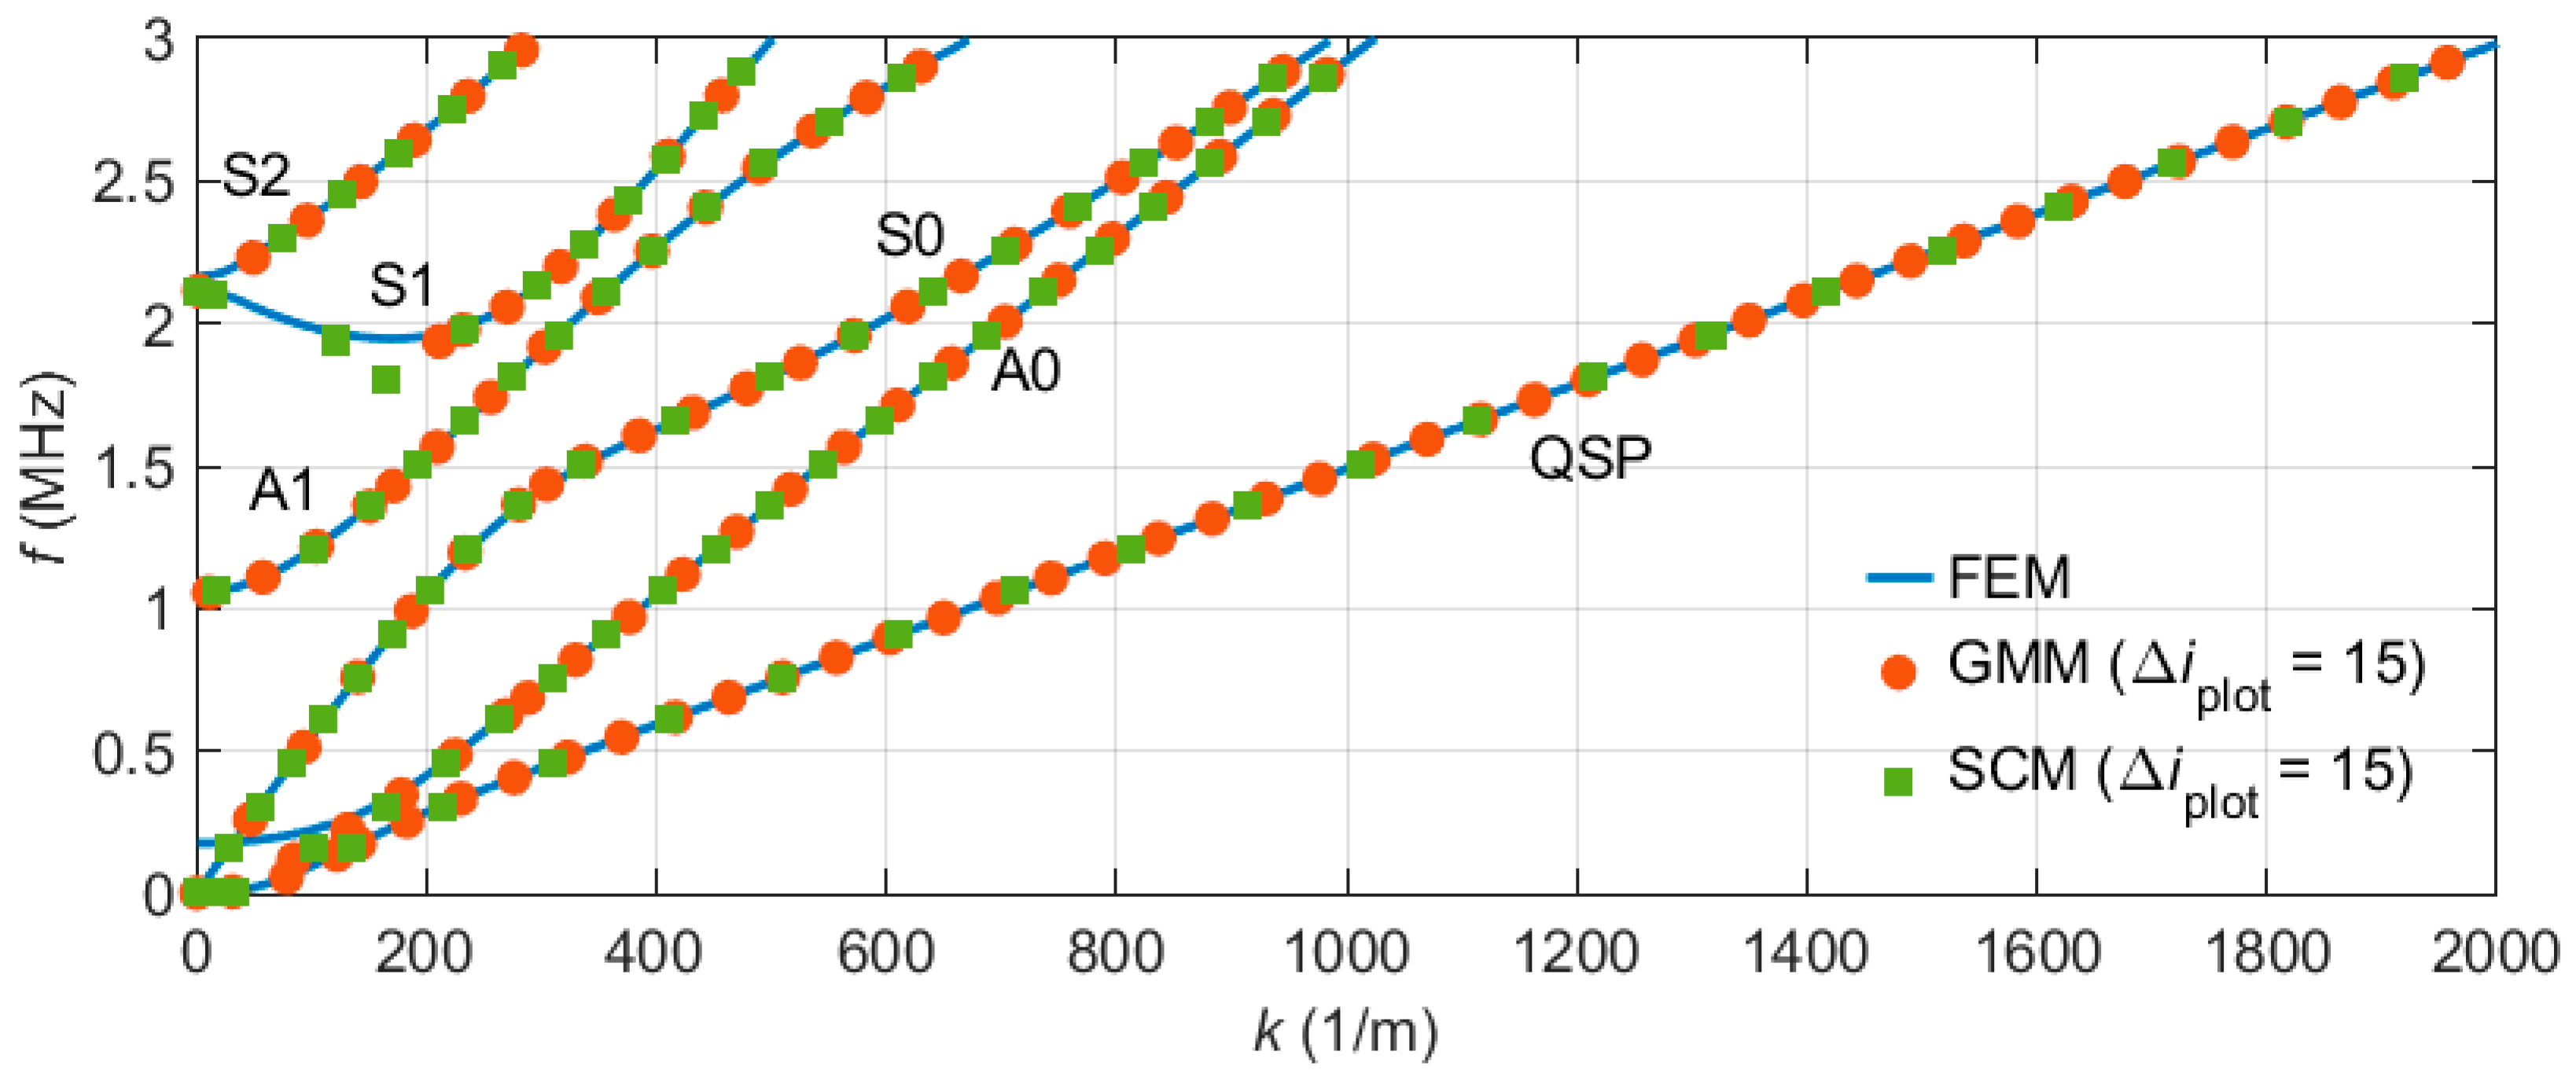
Figure 13 shows the dispersion relation as determined by the two-sided fluid-loaded FEM model and the GMM and SCM models.
Similar to the analysis for the free plate, the most important features of the reference models show up in the FEM curves very well. However, as expected from the interaction of the fluid artifacts with the GAW modes (
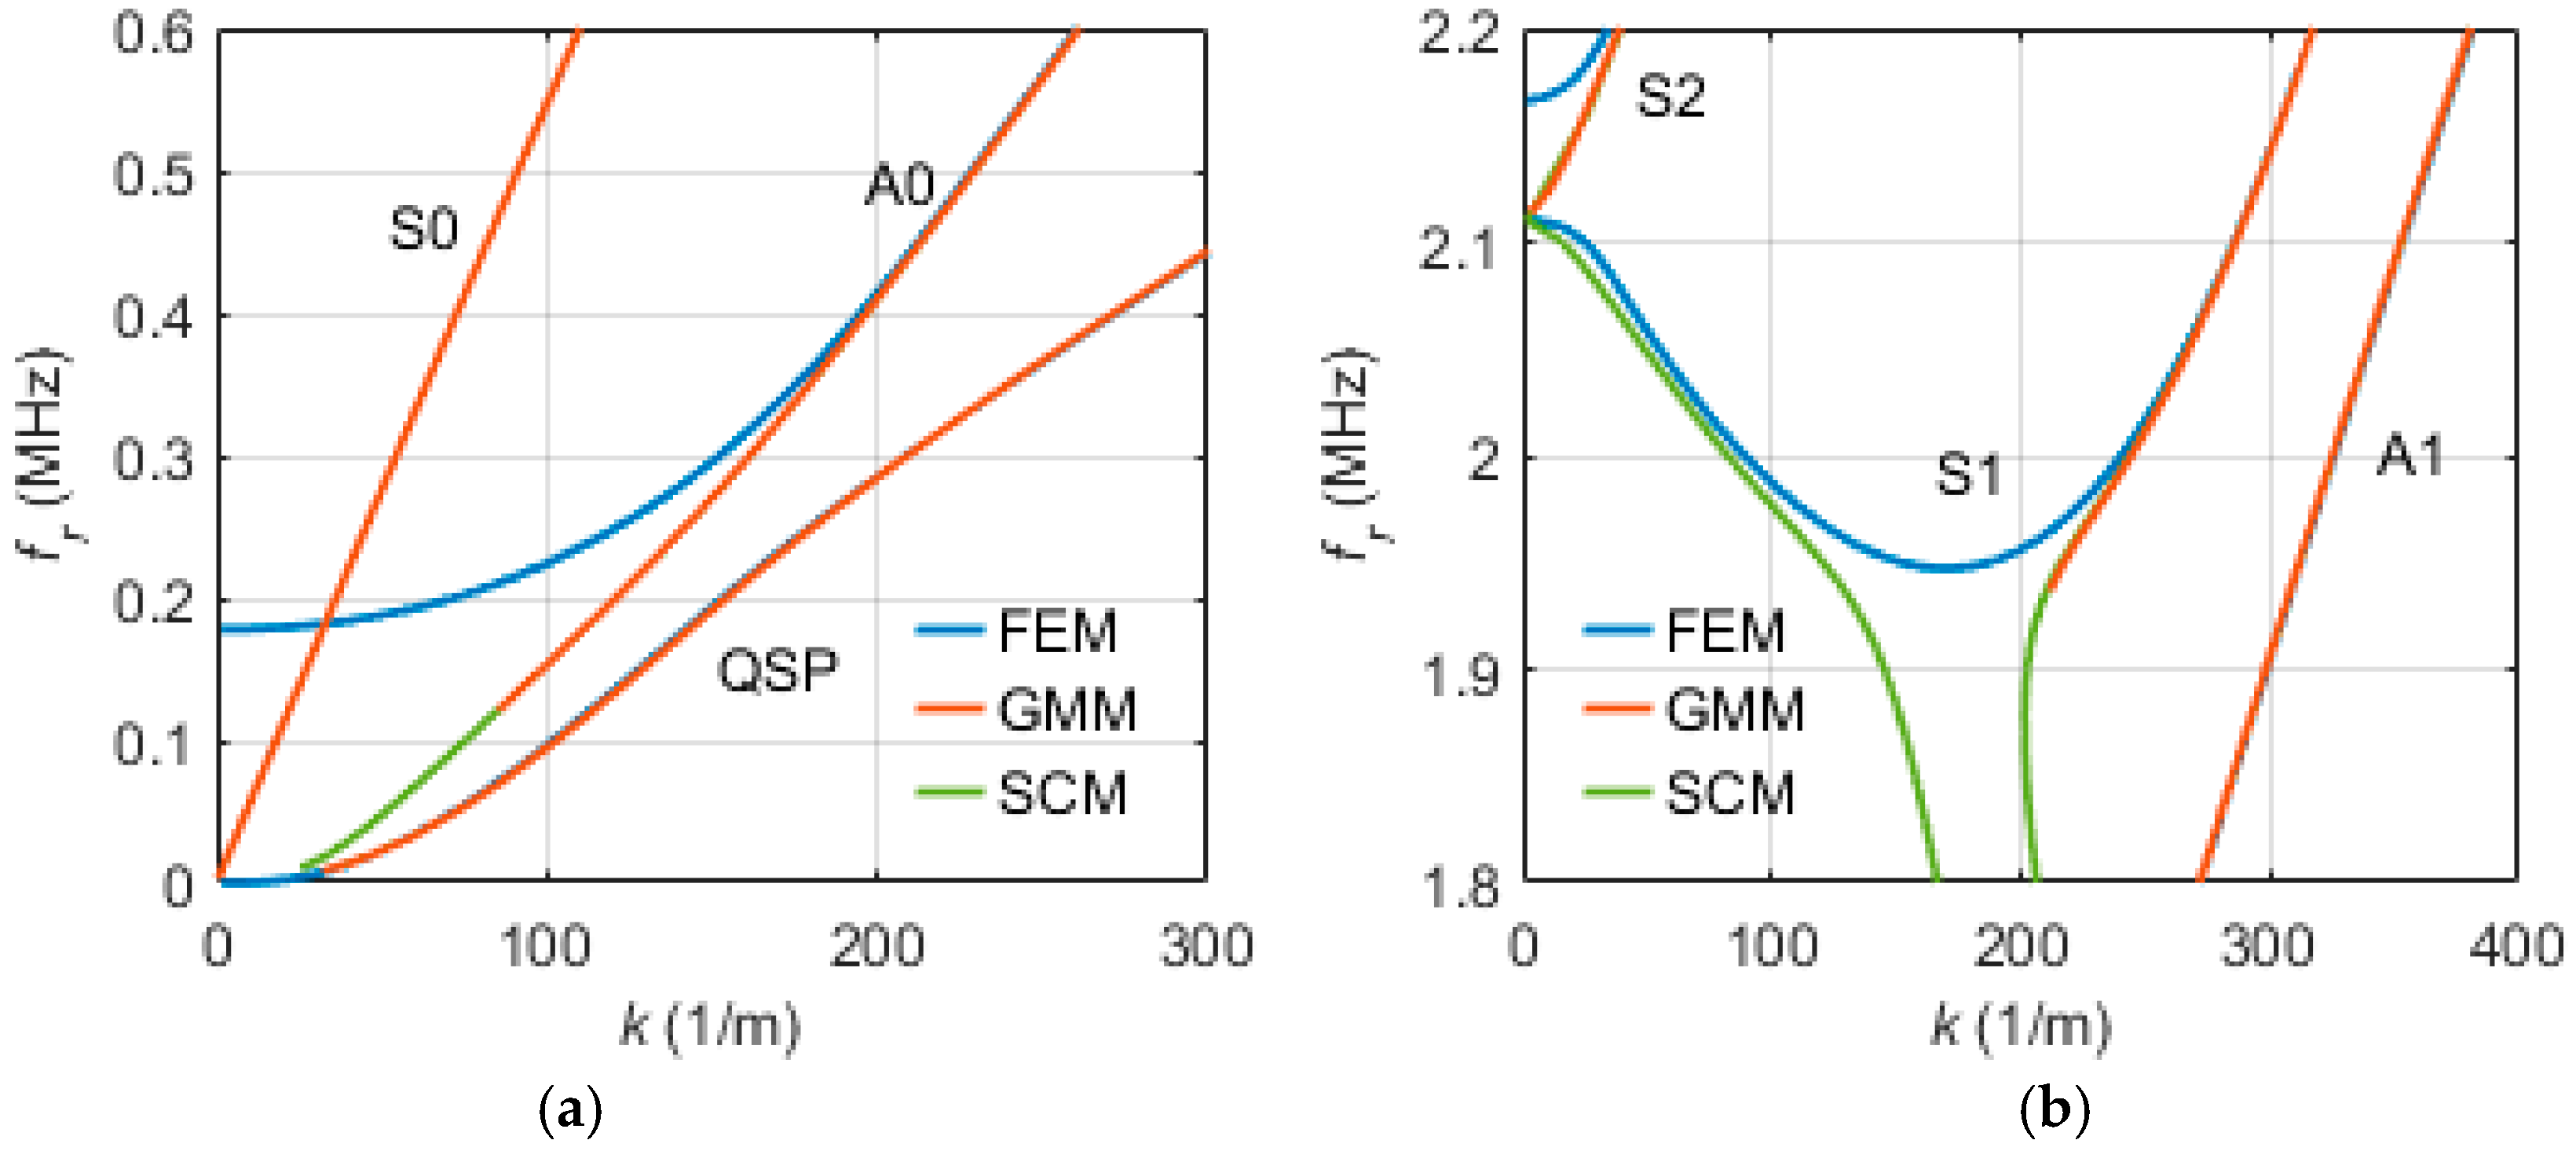
Figure 12), there are obvious deviations in the vicinity of the cut-off frequency of the A0 mode. The same holds true for the initial area of the S1 and S2 modes. For a more detailed view, magnifications of these corresponding sections are displayed in
Figure 14.
Figure 14a reveals the fact that each of the used methods resulted in a different cut-off behavior of the A0 mode, with the FEM deviating most from both reference models. The reason for this behavior was, again, the influence of the spurious fluid solution. With the increasing wavenumber
, all mode curves converged to each other. Above a wavenumber
of 200 1/m, the FEM results deviated by less than 1% from the reference values, whereas in the case of the free plate, all methods reproduced the minima of the S1 mode very well (cf.
Figure 8) and both reference models behaved differently (
Figure 14b). The GMM software only yielded values for
greater than 210 1/m. The SCM, on the other hand, converged with the same values as the FEM both for lower and higher
. However, near the S1 minimum, the SCM behaved in a completely different manner in that the predicted dispersion curve split into two separate curves which quickly dropped to lower frequencies. Whenever the GMM and SCM both obtained S1 mode solutions, these solutions agreed very well. Further deviations can be observed at the cut-off frequency of the S2 mode. For further analysis, relative deviations were calculated for all modes (
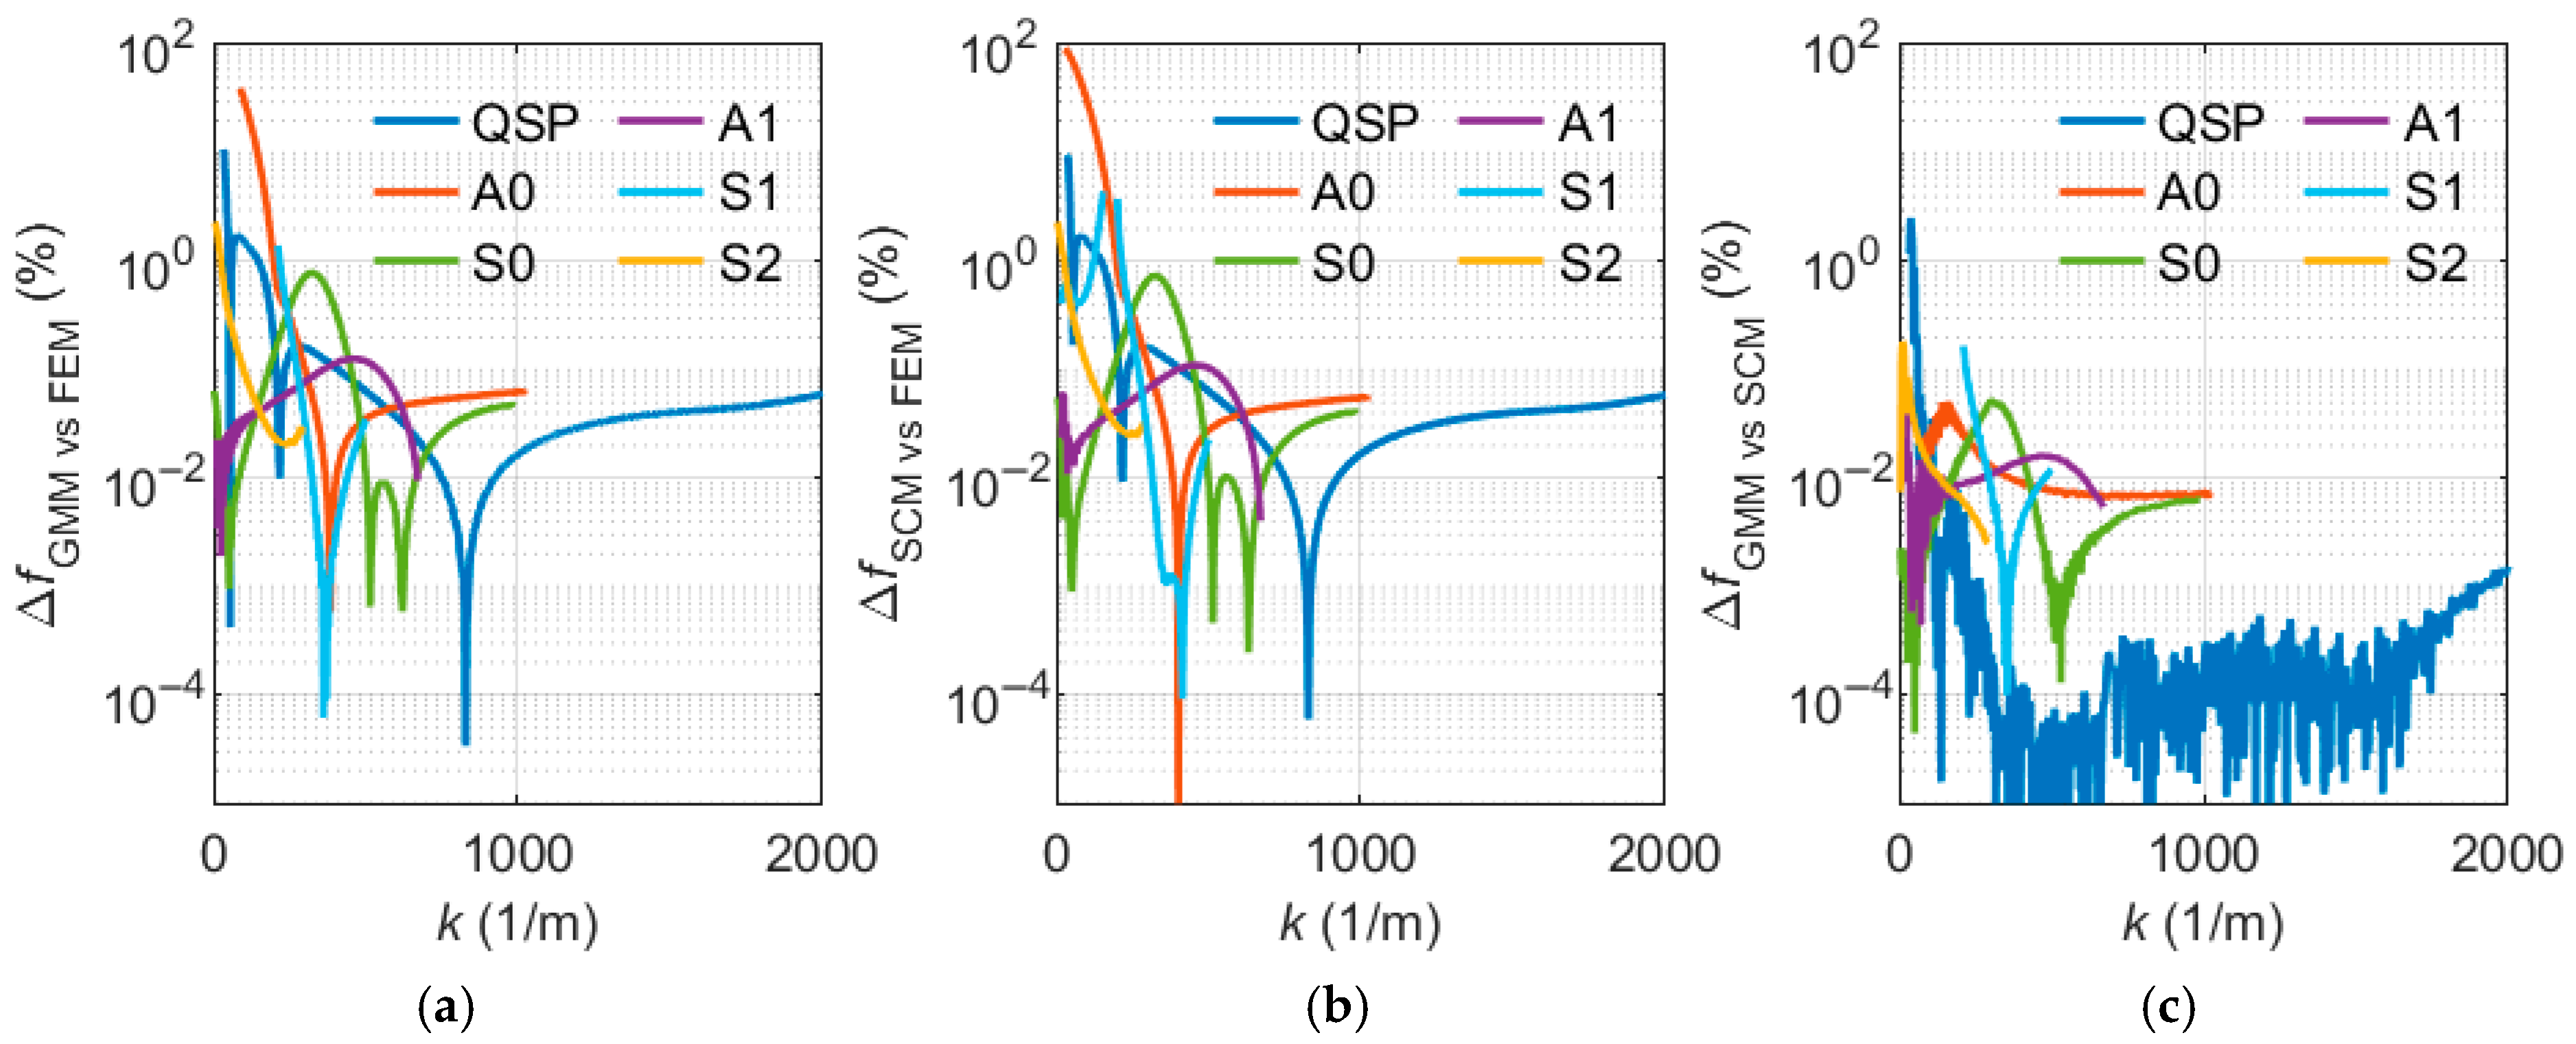
Figure 15).
Except for the conspicuous sections already discussed, most mode curves agreed very well, with typical deviations of less than 0.1%. However, it is noticeable that the FEM model result tended to deviate from the two reference model results. This is likely to be caused by the fact that the GMM and SCM solve the same problem with different algorithms, whereas the FEM model is based on discretization of the whole domain. In addition, the fluid loading enters the GMM and SCM only via boundary conditions.
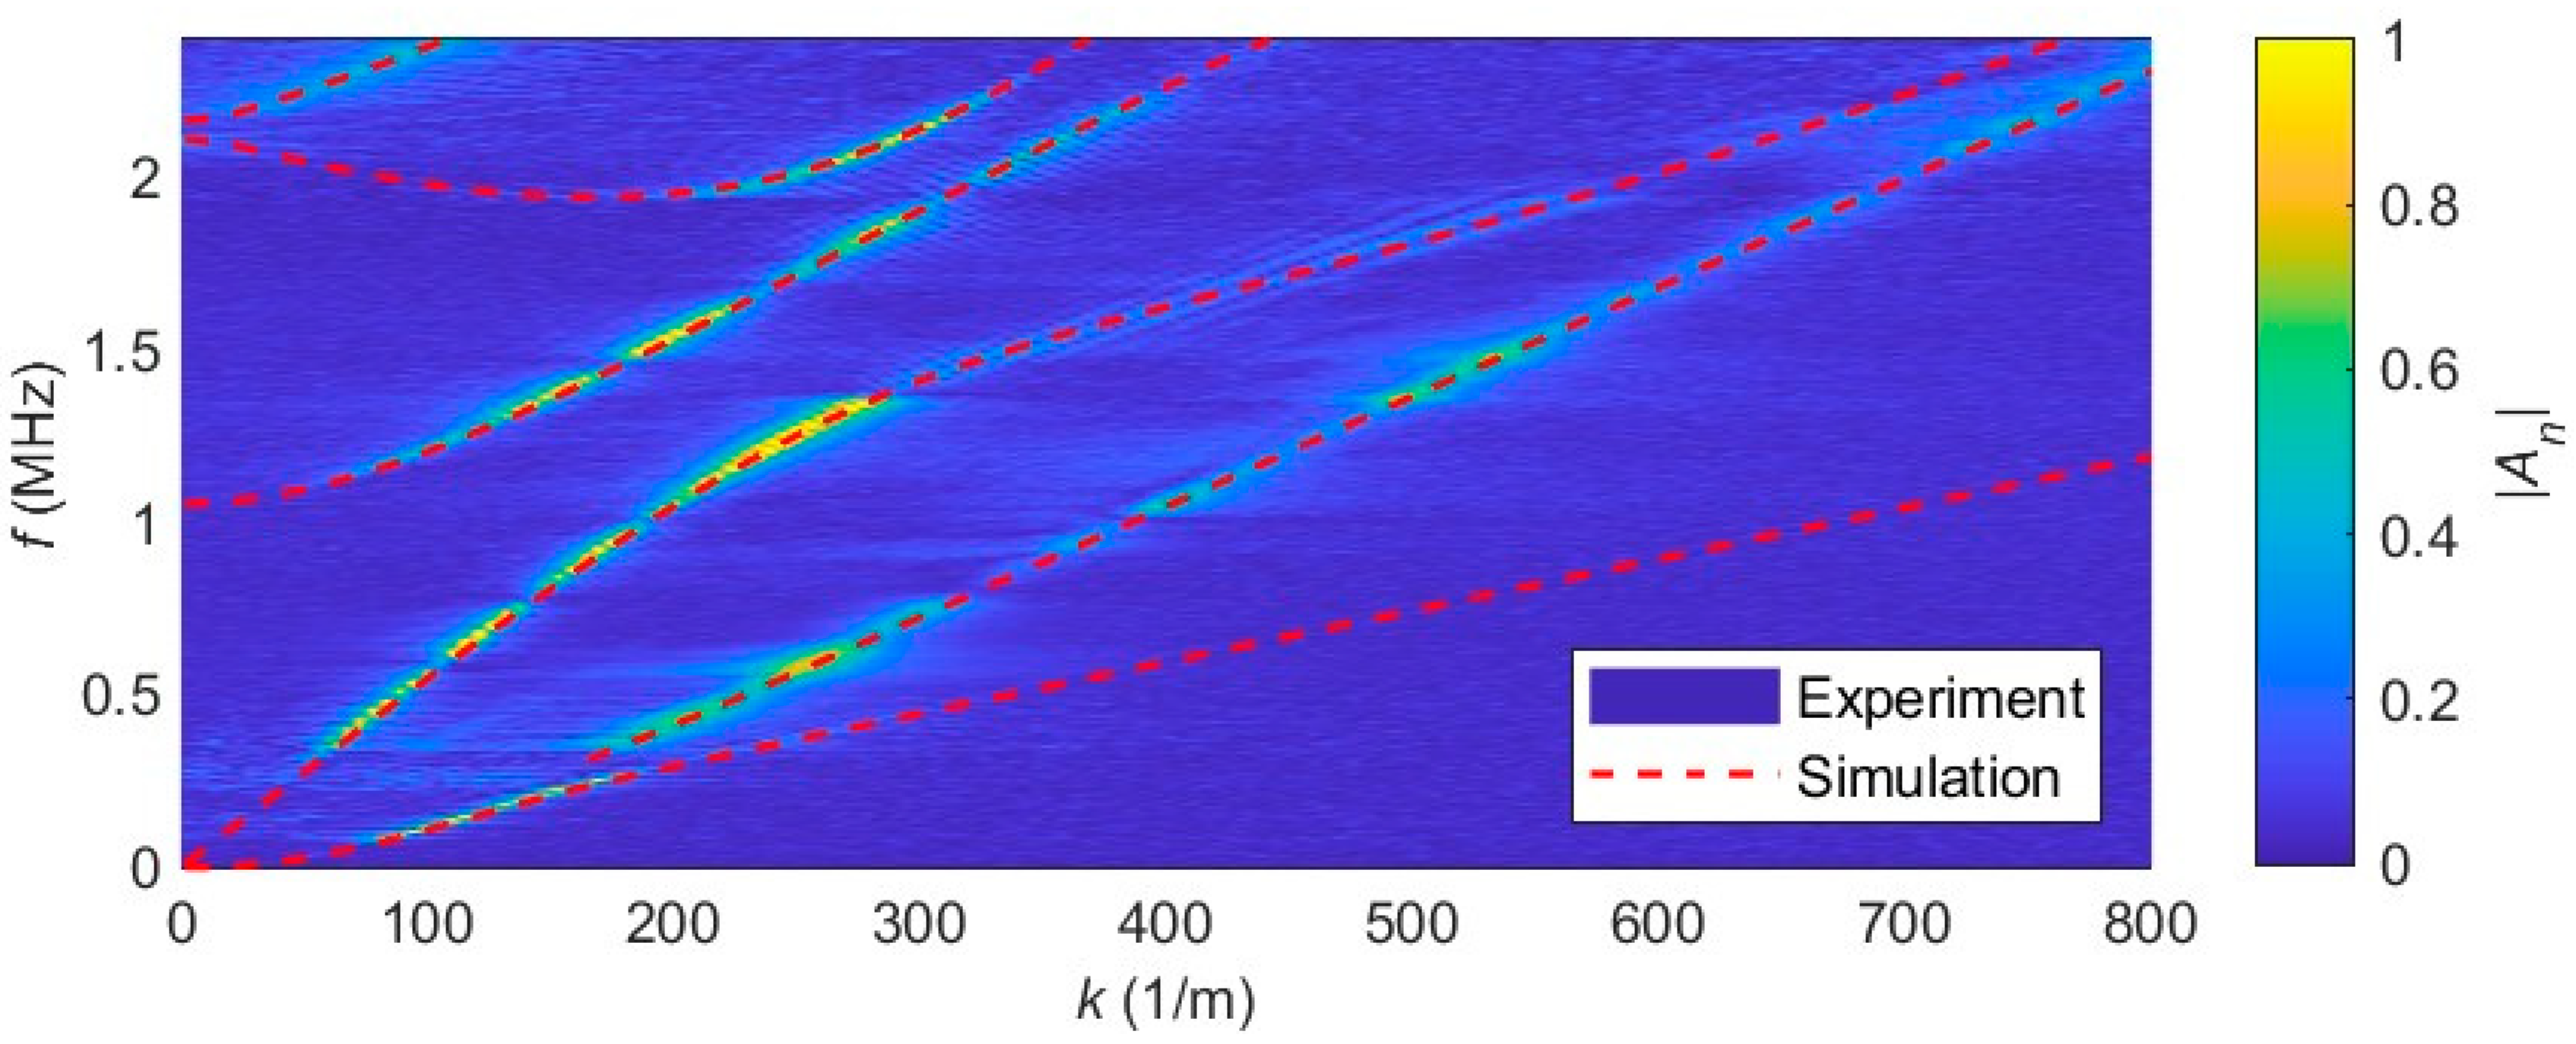
Finally,
Figure 16 compares the results of the FEM model to the experimental data. Since the A0 mode was not correctly described by the FEM model near its cut off, its dispersion curve is only shown for wavenumbers above 180 1/m.
The agreement between the measured and simulated dispersion curves is very good. However, it is noticeable that the signal-to-noise ratio of this measurement is worse than in the free plate case. In addition, some dispersion curve sections are not recognizable in the measurement results (see, e.g., the cut-off behavior of the S1 mode, small
and
near 2 MHz, etc.). The reason for this is GAW attenuation due to coupling with pressure waves in the fluid. This energy loss made the coupling modes more difficult to measure by the LDV. The measured S1 and S2 mode curves therefore cannot shed any light on the critical model sections shown in
Figure 14b. One also notices that even the evanescent QSP completely vanishes in the measured diagram with increasing
. This is explained by a shift in the energy distribution of the QSP. With increasing
, the center of the energy distribution shifts away from the plate into the interior of the fluid, leaving no measurable displacement on the plate surface.
5. Discussion and Outlook
In this work, a novel, universally applicable FEM approach was presented for the calculation of GAWs. This new method includes simple, straightforward post-processing, which enables all relevant dispersion relations to be derived from the results of the FEM eigenfrequency study. The method has been demonstrated to be a good choice for the characterization of both free and fluid-loaded plates. The most significant findings of the work are summarized briefly below.
The analysis of the free plate showed that the FEM model together with the presented post-processing reliably produce good results. Even if the suggested post-processing cannot be implemented directly into the COMSOL environment, the used algorithm performs very successfully in tracing the modes reliably and deriving the corresponding dispersion relation. All eigenfrequencies of the free plate FEM model were GAW solutions without the need to handle any artifacts. This was especially not the case with the SCM reference model. Even with the free plate, a large number of non-physical solutions had to be discarded. Additionally, since the SCM delivers unsorted solutions, suitable post-processing is necessary for that method, too. This step was omitted only for the GMM, as it was already implemented in the commercial software Disperse. All reference methods yielded the same trends for all five investigated modes. Detailed comparisons with the reference models showed very good agreement throughout and the calculated deviations were negligible. Additionally, very good agreement with experimental data could be achieved by the FEM model through precise material parameter optimization. This underlines the flexibility and accuracy of this method, especially when realistic material behavior has to be considered.
The extended models including a fluid loading proved to be particularly interesting. Again, the results showed very good agreement between the three methods across wide sections. However, there were also two noticeable regions where the models differed. The first of these regions was the beginning of the A0 mode. Here, the FEM A0 mode interacted with the artifacts of the fluid domain due to similarities. The geometry-dependent interactions of the solutions rendered unfeasible the evaluation of the A0 mode in this transition region proximate to the QSP in the actual model. Interestingly, all artificial fluid modes showed a vibration profile similar to the A0 mode on the plate’s domain. This is probably the reason why there are interactions between the modes in the FEM model at all. This remains an exciting topic for future research. Perhaps an analysis of the similarities of the modes using their orthogonality relations can provide an indication of the degree of similarity between the interacting modes [
50,
51,
52]. The second noticeable region was the initial part of the S1 mode. The FEM showed behavior very similar to that of a free plate, while the GMM could only determine the S1 mode for higher wavenumbers
k. In contrast, the SCM deviated strongly from this, as here the mode split up in the vicinity of the minimum and fell off sharply. We have not been able to observe such behavior in any experimental measurement yet. At this point, the question remains whether the results of the FEM model were imprecise or whether an artifact interaction in the solution of the SCM occurred. However, this issue is frequently not targeted by other scientific research.
Despite the exclusive utilization of a single aluminium plate in the experimental validation of this study, this methodology can be seamlessly adapted for the investigation of alternative materials, plate thicknesses, or multi-layer systems. However, the accuracy of the simulation in comparison to the experiments depends on the quality of the material parameters used.
The main advantages of our method are its universal applicability and robustness. Simplification and special cases are completely avoided when implementing structural and fluid mechanics, so essentially all applications can be addressed with this approach. In this context, the quality of the results depends entirely on the choice of parameters for material properties and the mesh, such as the UC width L and the sweep parameter dk. It is important to ensure that the mesh can represent all occurring waves, while L defines the amount and positions of the occurring backfolding. Finally, the parameter dk has to be selected in a way that allows all modes to be sampled with sufficient accuracy to enable the mode tracer to follow all bends. If dk is set too high, it may cause unwanted transitions between different modes. Tests employing a spline-based extrapolation algorithm did not demonstrate any significant improvements in the performance of the mode tracer. Also, high frequency–thickness products can be calculated by this method reliably. Here, the width L of the UC should be reduced to reach high frequencies with a minimal amount of backfolding. These circumstances imply that the evaluation of multi-layer systems or models based on unstructured 3D UCs remains consistent without any extensive adaptations.
In summary, the FEM, GMM, and SCM each have their own advantages and disadvantages. While the GMM and SCM shine with simple plate geometries and fast performance, the FEM is the only option for more complex problems, such as modeling periodic structures. So-called phononic crystals do not require any modifications in the FEM procedures outlined in this study. Nevertheless, these structures have a significant influence on the behavior of the resulting modes. These effects would require minor adjustments to the post-processing and a detailed analysis of the resulting modes. Since the typical classification of Lamb waves into symmetric and antisymmetric modes can be lost in this process, these topics should be addressed in future work. In this context, the interaction of phononic crystals with fluid loading emerges as a promising area of research. Furthermore, FEM introduces the potential for multiphysics applications. For instance, the incorporation of one or multiple additional simulation steps that consider acoustic streaming is a viable approach for our fluid-loaded scenarios. In this case, dispersion calculations can be utilized directly as a starting value without the need to change the simulation environment. The scope of this procedure may be expanded by additional model steps that for example address the dynamics of charge transport in galvanic processes, accompanied by the active acoustic mixing of electrolytes. Another potential application for our method is the design of acoustically based flow meters. In this case, with minor modifications to the implementation of the fluid, the impact of background flow on the modes could be calculated. All of these possible applications may be evaluated in accordance with the standard protocol of the presented post-processor. These examples demonstrate the potential of this method and will hopefully help explore further areas of application for GAWs in the future.
Author Contributions
Conceptualization, J.L.; methodology, J.L.; software, J.L. and A.B.; validation, J.L. and A.B.; formal analysis, J.L., A.B., C.R.W., G.F. and K.S.D.; investigation, J.L.; resources, K.S.D.; data curation, J.L.; writing—original draft preparation, J.L.; writing—review and editing, A.B., C.R.W., G.F. and K.S.D.; visualization, J.L.; supervision, C.R.W. and K.S.D.; project administration, K.S.D.; funding acquisition, K.S.D. and G.F. All authors have read and agreed to the published version of the manuscript.
Funding
This research was funded by Technologie Allianz Oberfranken TAO; Bayerisches Staatsministerium für Wirtschaft, Landsentwicklung und Energie (Project: Akureakin, grant: VAL-2007-0004); Bayerisches Staatsministerium für Wissenschaft und Kunst (Project: BeGaW, grant: H.2-F1116.CO/42/2); and Bundesministerium für Bildung und Forschung and Gemeinsame Wissenschaftskonferenz GWK (Project: IMPETUS).
Data Availability Statement
For personal access to the calculated and measured data, please contact the corresponding authors by mail.
Acknowledgments
Our thanks go to our colleagues at ISAT, who were always motivated to discuss new results.
Conflicts of Interest
The authors declare no conflicts of interest. The funders had no role in the design of the study; in the collection, analyses, or interpretation of data; in the writing of the manuscript; or in the decision to publish the results.
Abbreviations
The following abbreviations are used in this manuscript:
| A0 | Antisymmetric Zero-Order Lamb Wave |
| FEM | Finite Element Method |
| FFT | Fast Fourier Transformation |
| GAW | Guided Acoustic Waves |
| GMM | Global Matrix Method |
| LDV | Laser Doppler Vibrometer |
| LGM | Legendre Polynomial Method |
| PML | Perfectly Matched Layer |
| QSP | Quasi Scholte Platemode |
| S0 | Symmetric Zero-Order Lamb Wave |
| SCM | Spectral Collocation Method |
| SAFE | Semi-Analytic Finite Element Method |
| TMM | Transfer Matrix Method |
| UC | Unit Cell |
| WFEM | Wave Finite Element Method |
References
- Lamb, H.I. On the Propagation of Tremors over the Surface of an Elastic Solid. Philos. Trans. R. Soc. London Ser. A Contain. Pap. Math. Phys. Character 1904, 203, 359–371. [Google Scholar]
- Biot, M.A. Theory of Propagation of Elastic Waves in a Fluid-Saturated Porous Solid. II. Higher Frequency Range. J. Acoust. Soc. Am. 1956, 28, 179–191. [Google Scholar] [CrossRef]
- Liu, Y.; Zhao, Y.; Deng, M.; Shui, G.; Hu, N. One-Way Lamb and SH Mixing Method in Thin Plates with Quadratic Nonlinearity: Numerical and Experimental Studies. Ultrasonics 2022, 124, 106761. [Google Scholar] [CrossRef]
- Apostol, B.F. Vibrations of an Elastic Half-Space. Geosciences 2025, 15, 144. [Google Scholar] [CrossRef]
- Pan, Y.; Chen, S.; Wen, H.; Yang, Y.; Zhou, H. Impact Analysis of Sea Ice Stratification on the Propagation Characteristics of Guided Waves in Ice. In Proceedings of the 2024 OES China Ocean Acoustics (COA), Harbin, China, 29–31 May 2024; IEEE: New York, NY, USA, 2024; pp. 1–5. [Google Scholar]
- Takiy, A.E.; Granja, S.C.G.; Higuti, R.T.; Kitano, C.; Elvira, L.; Martinez-Graullera, O.F.; Montero De Espinosa, F. Theoretical Analysis and Experimental Validation of the Scholte Wave Propagation in Immersed Plates for the Characterization of Viscous Fluids. In Proceedings of the 2013 IEEE International Ultrasonics Symposium (IUS), Prague, Czech Republic, 21–25 July 2013; IEEE: New York, NY, USA, 2013; pp. 1614–1617. [Google Scholar]
- Tietze, S.; Singer, F.; Lasota, S.; Ebert, S.; Landskron, J.; Schwuchow, K.; Drese, K.S.; Lindner, G. Monitoring of Soft Deposition Layers in Liquid-Filled Tubes with Guided Acoustic Waves Excited by Clamp-on Transducers. Sensors 2018, 18, 526. [Google Scholar] [CrossRef]
- Luo, T.; Liu, W.; Wen, Z.; Xie, Y.; Tong, X.; Cai, Y.; Liu, Y.; Sun, C. A High-Sensitivity Gravimetric Biosensor Based on S1 Mode Lamb Wave Resonator. Sensors 2022, 22, 5912. [Google Scholar] [CrossRef] [PubMed]
- Fan, Z.; Qie, T.; Zhou, Y. Multiple Reflective Signal Reception in Gas Flow Measurement Using Air-Coupled Leaky Lamb Waves. Measurement 2019, 140, 342–353. [Google Scholar] [CrossRef]
- Fan, Z.; Jiang, W.; Wright, W.M.D. Non-Contact Ultrasonic Gas Flow Metering Using Air-Coupled Leaky Lamb Waves. Ultrasonics 2018, 89, 74–83. [Google Scholar] [CrossRef]
- Xu, B.; Huang, J.; Jie, Y. Application of the Lamb Wave Mode of Acoustic Emission for Monitoring Impact Damage in Plate Structures. Sensors 2023, 23, 8611. [Google Scholar] [CrossRef] [PubMed]
- Chen, J.; Li, Z.; Gong, K. Nondestructive Testing Method Based on Lamb Waves for Localization and Extent of Damage. Acta Mech. Solida Sin. 2017, 30, 65–74. [Google Scholar] [CrossRef]
- Winkler, A.; Harazim, S.M.; Menzel, S.B.; Schmidt, H. SAW-Based Fluid Atomization Using Mass-Producible Chip Devices. Lab Chip 2015, 15, 3793–3799. [Google Scholar] [CrossRef]
- Richard, C.; Fakhfouri, A.; Colditz, M.; Striggow, F.; Kronstein-Wiedemann, R.; Tonn, T.; Medina-Sánchez, M.; Schmidt, O.G.; Gemming, T.; Winkler, A. Blood Platelet Enrichment in Mass-Producible Surface Acoustic Wave (SAW) Driven Microfluidic Chips. Lab Chip 2019, 19, 4043–4051. [Google Scholar] [CrossRef]
- Friend, J.; Yeo, L.Y. Microscale Acoustofluidics: Microfluidics Driven via Acoustics and Ultrasonics. Rev. Mod. Phys. 2011, 83, 647–704. [Google Scholar] [CrossRef]
- Tian, Y.; Song, Y.; Shen, Y.; Yu, Z. A Metamaterial Ultrasound Mode Convertor for Complete Transformation of Lamb Waves into Shear Horizontal Waves. Ultrasonics 2022, 119, 106627. [Google Scholar] [CrossRef]
- Nedospasov, I.A.; Pupyrev, P.D.; Bechler, N.; Tham, J.; Kuznetsova, I.E.; Mayer, A.P. Guided Acoustic Waves at Periodically Structured Edges: Linear Modes and Nonlinear Generation of Lamb and Surface Waves. J. Sound Vib. 2022, 527, 116854. [Google Scholar] [CrossRef]
- Gravenkamp, H.; Prager, J.; Saputra, A.A.; Song, C. The Simulation of Lamb Waves in a Cracked Plate Using the Scaled Boundary Finite Element Method. J. Acoust. Soc. Am. 2012, 132, 1358–1367. [Google Scholar] [CrossRef] [PubMed]
- Shen, Y.; Giurgiutiu, V. Combined Analytical FEM Approach for Efficient Simulation of Lamb Wave Damage Detection. Ultrasonics 2016, 69, 116–128. [Google Scholar] [CrossRef]
- Kiefer, D.A.; Ponschab, M.; Rupitsch, S.J.; Mayle, M. Calculating the Full Leaky Lamb Wave Spectrum with Exact Fluid Interaction. J. Acoust. Soc. Am. 2019, 145, 3341–3350. [Google Scholar] [CrossRef]
- Sankaranarayanan, S.K.R.S.; Cular, S.; Bhethanabotla, V.R.; Joseph, B. Flow Induced by Acoustic Streaming on Surface-Acoustic-Wave Devices and Its Application in Biofouling Removal: A Computational Study and Comparisons to Experiment. Phys. Rev. E 2008, 77, 066308. [Google Scholar] [CrossRef]
- Hoang, T.; Duhamel, D.; Foret, G. Wave Finite Element Method for Waveguides and Periodic Structures Subjected to Arbitrary Loads. Finite Elem. Anal. Des. 2020, 179, 103437. [Google Scholar] [CrossRef]
- Nobrega, E.D.; Gautier, F.; Pelat, A.; Dos Santos, J.M.C. Vibration Band Gaps for Elastic Metamaterial Rods Using Wave Finite Element Method. Mech. Syst. Signal Process. 2016, 79, 192–202. [Google Scholar] [CrossRef]
- Hayashi, T.; Inoue, D. Calculation of Leaky Lamb Waves with a Semi-Analytical Finite Element Method. Ultrasonics 2014, 54, 1460–1469. [Google Scholar] [CrossRef]
- Cong, M.; Wu, X.; Liu, R. Dispersion Analysis of Guided Waves in the Finned Tube Using the Semi-Analytical Finite Element Method. J. Sound Vib. 2017, 401, 114–126. [Google Scholar] [CrossRef]
- Georgiades, E.; Lowe, M.J.S.; Craster, R.V. Leaky Wave Characterisation Using Spectral Methods. J. Acoust. Soc. Am. 2022, 152, 1487–1497. [Google Scholar] [CrossRef]
- Karpfinger, F.; Valero, H.-P.; Gurevich, B.; Bakulin, A.; Sinha, B. Spectral-Method Algorithm for Modeling Dispersion of Acoustic Modes in Elastic Cylindrical Structures. Geophysics 2010, 75, H19–H27. [Google Scholar] [CrossRef]
- Lefebvre, J.E.; Zhang, V.; Gazalet, J.; Gryba, T. Legendre Polynomial Approach for Modeling Free-Ultrasonic Waves in Multilayered Plates. J. Appl. Phys. 1999, 85, 3419–3427. [Google Scholar] [CrossRef]
- Yu, J.G.; Lefebvre, J.E. Guided Waves in Multilayered Hollow Cylinders: The Improved Legendre Polynomial Method. Compos. Struct. 2013, 95, 419–429. [Google Scholar] [CrossRef]
- Wang, L.; Rokhlin, S.I. Stable Reformulation of Transfer Matrix Method for Wave Propagation in Layered Anisotropic Media. Ultrasonics 2001, 39, 413–424. [Google Scholar] [CrossRef]
- Knopoff, L. A Matrix Method for Elastic Wave Problems. Bull. Seismol. Soc. Am. 1964, 54, 431–438. [Google Scholar] [CrossRef]
- Schmidt, H.; Tango, G. Efficient Global Matrix Approach to the Computation of Synthetic Seismograms. Geophys. J. Int. 1986, 84, 331–359. [Google Scholar] [CrossRef]
- Rothberg, S.J.; Allen, M.S.; Castellini, P.; Di Maio, D.; Dirckx, J.J.J.; Ewins, D.J.; Halkon, B.J.; Muyshondt, P.; Paone, N.; Ryan, T.; et al. An International Review of Laser Doppler Vibrometry: Making Light Work of Vibration Measurement. Opt. Lasers Eng. 2017, 99, 11–22. [Google Scholar] [CrossRef]
- Sun, H.; Zarkadoula, E.; Crespillo, M.L.; Weber, W.J.; Rathod, V.; Zinkle, S.J.; Ramuhalli, P. Laser Doppler Vibrometry for Piezoelectric Coefficient (d 33) Measurements in Irradiated Aluminum Nitride. Sens. Actuators A Phys. 2022, 347, 113886. [Google Scholar] [CrossRef]
- Moser, F.; Jacobs, L.J.; Qu, J. Modeling Elastic Wave Propagation in Waveguides with the Finite Element Method. NDT E Int. 1999, 32, 225–234. [Google Scholar] [CrossRef]
- Liu, J.; Guo, H.; Wang, T. A Review of Acoustic Metamaterials and Phononic Crystals. Crystals 2020, 10, 305. [Google Scholar] [CrossRef]
- Lévesque, L. Revisiting the Nyquist Criterion and Aliasing in Data Analysis. Eur. J. Phys. 2001, 22, 127–132. [Google Scholar] [CrossRef]
- Tietze, S.; Lindner, G. Visualization of the Interaction of Guided Acoustic Waves with Water by Light Refractive Vibrometry. Ultrasonics 2019, 99, 105955. [Google Scholar] [CrossRef]
- Comsol Multiphysics GmbH. COMSOL Documentation. Available online: https://doc.comsol.com/6.3/docserver/#!/com.comsol.help.comsol/helpdesk/helpdesk.html (accessed on 1 February 2025).
- Van Den Boom, S.J.; Van Keulen, F.; Aragón, A.M. Fully Decoupling Geometry from Discretization in the Bloch–Floquet Finite Element Analysis of Phononic Crystals. Comput. Methods Appl. Mech. Eng. 2021, 382, 113848. [Google Scholar] [CrossRef]
- Rodriguez, M.C.; Mederos, V.H.; Sarlabous, J.E.; Hernández, E.M.; Graverán, A.M. Numerical Solution of the Wave Propagation Problem in a Plate. arXiv 2020, arXiv:2011.00141. [Google Scholar] [CrossRef]
- Mielewski, J.; Mrozowski, M. Application of the Arnoldi Method in FEM Analysis of Waveguides. IEEE Microw. Guid. Wave Lett. 1998, 8, 7–9. [Google Scholar] [CrossRef]
- Massachusetts Instiute of Technology. Material Property Database—Material: Aluminum. Available online: https://www.mit.edu/~6.777/matprops/aluminum.htm (accessed on 16 March 2025).
- Mitra, M.; Gopalakrishnan, S. Guided Wave Based Structural Health Monitoring: A Review. Smart Mater. Struct. 2016, 25, 053001. [Google Scholar] [CrossRef]
- Bayliss, A.; Goldstein, C.I.; Turkel, E. The Numerical Solution of the Helmholtz Equation for Wave Propagation Problems in Underwater Acoustics. Comput. Math. Appl. 1985, 11, 655–665. [Google Scholar] [CrossRef]
- Johnson, S.G. Notes on Perfectly Matched Layers (PMLs). arXiv 2021, arXiv:2108.05348. [Google Scholar] [CrossRef]
- Comsol Multiphysics GmbH. COMSOL 6.1—Material Library. Available online: https://www.comsol.de/material-library (accessed on 13 August 2025).
- Lowe, M.; Pavlakovic, B. DISPERSE—A System for Generating Dispersion Curves; Imperial College London: London, UK, 2013. [Google Scholar]
- Pavlakovic, B.; Lowe, M.; Alleyne, D.; Cawley, P. Disperse: A General Purpose Program for Creating Dispersion Curves. In Review of Progress in Quantitative Nondestructive Evaluation; Thompson, D.O., Chimenti, D.E., Eds.; Springer: Boston, MA, USA, 1997; pp. 185–192. ISBN 978-1-4613-7725-2. [Google Scholar]
- Moreau, L.; Castaings, M.; Hosten, B.; Predoi, M.V. An Orthogonality Relation-Based Technique for Post-Processing Finite Element Predictions of Waves Scattering in Solid Waveguides. J. Acoust. Soc. Am. 2006, 120, 611–620. [Google Scholar] [CrossRef]
- Ratassepp, M.; Klauson, A.; Chati, F.; Léon, F.; Maze, G. Separation of Lamb Modes at a Plate Edge by Using Orthogonality Relation. Est. J. Eng. 2013, 19, 283. [Google Scholar] [CrossRef]
- Ratassepp, M.; Klauson, A.; Chati, F.; Léon, F.; Décultot, D.; Maze, G.; Fritzsche, M. Application of Orthogonality-Relation for the Separation of Lamb Modes at a Plate Edge: Numerical and Experimental Predictions. Ultrasonics 2015, 57, 90–95. [Google Scholar] [CrossRef]
Figure 1.
Experimental setup for the transducer-based excitation of GAWs on a 1.5 mm thin aluminum plate. The propagation of the GAWs is observed pointwise by a laser Doppler vibrometer.
Figure 1.
Experimental setup for the transducer-based excitation of GAWs on a 1.5 mm thin aluminum plate. The propagation of the GAWs is observed pointwise by a laser Doppler vibrometer.
Figure 2.
Measurement result for GAW propagation on an aluminum plate. (a) Visualization of the measured and normalized displacement field magnitude . (b) Derived two-sided band structure diagram (modulus of the 2D Fourier transform), revealing the dispersion relation of the measured GAWs.
Figure 2.
Measurement result for GAW propagation on an aluminum plate. (a) Visualization of the measured and normalized displacement field magnitude . (b) Derived two-sided band structure diagram (modulus of the 2D Fourier transform), revealing the dispersion relation of the measured GAWs.
Figure 3.
Sketch of the 2D FEM model: The unit cell represents a small section of the aluminum plate. Floquet periodicity is used to search for solutions with different wavelengths. For the unloaded case, no constraints or loads are acting on the upper and lower boundaries. As is typical for FEM models, the 2D section is discretized by small structured net elements.
Figure 4.
Unambiguous identification of dispersion curves. (a) The FEM simulation results in a band structure diagram consisting of 1097 unsorted individual data points. At the limits 0 and 1 of , the mode curves are backfolded into the diagram. (b) In the post-processing the data points are assigned to the individual Lamb modes and the folded curves are unwrapped. In addition to the names, based on the order and symmetry property of the waves, the legend specifies the amount of data points included.
Figure 5.
Sketch of the mode tracer algorithm: (a) Between the edges of the sweep interval of , the next point of a mode curve is approximately predicted by linear extrapolation. When the quadratic deviation of the closest solution from the predictor is greater than a predefined value , the end of the mode has been reached. (b) When the edges of the interval are reached, the tracing must be performed over the edge to unwrap the backfolded modes.
Figure 6.
Sketch of the 2D FEM unit cell approach with fluid loading: Again, a unit cell approach was used. A perfectly matched layer (PML) served to model a fluid-filled half-space on top of the plate.
Figure 6.
Sketch of the 2D FEM unit cell approach with fluid loading: Again, a unit cell approach was used. A perfectly matched layer (PML) served to model a fluid-filled half-space on top of the plate.
Figure 7.
Three-dimensional dispersion curves for a fluid-loaded plate in (a) the folded band structure diagram and (b) unwrapped form. The red curves describe GAWs (red); the blue and green curves are unphysical artifacts.
Figure 7.
Three-dimensional dispersion curves for a fluid-loaded plate in (a) the folded band structure diagram and (b) unwrapped form. The red curves describe GAWs (red); the blue and green curves are unphysical artifacts.
Figure 8.
Calculated band structure diagram for Lamb waves. The Lamb wave associated with each curve is named based on its order and symmetry type. Additionally, a characteristic displacement field is visualized for each mode. The FEM data (blue) is overlaid with data points calculated by the GMM (red) and SCM (green). To avoid overloading, only every 15th point is displayed for both reference methods. The three methods produce the same curves with no visible variations.
Figure 9.
Relative deviation of the Lamb wave results obtained by the two reference methods and by the FEM model: (a) GMM vs. FEM, (b) SCM vs. FEM, and (c) GMM vs. SCM.
Figure 9.
Relative deviation of the Lamb wave results obtained by the two reference methods and by the FEM model: (a) GMM vs. FEM, (b) SCM vs. FEM, and (c) GMM vs. SCM.
Figure 10.
Experimentally observed one-sided dispersion relation (surface plot) and the parameter-optimized FEM results (red lines) for a free aluminum plate.
Figure 10.
Experimentally observed one-sided dispersion relation (surface plot) and the parameter-optimized FEM results (red lines) for a free aluminum plate.
Figure 11.
Visualization of the leaky A0 mode (a,b), the evanescence QSP mode (c,d) and an artificial fluid mode (e,f) calculated for a 1.5 mm thick aluminum plate covered with one-sided fluid domain of the heights . Shown are mode shapes (a,c,e) with corresponding vertical pressure and elongations (b,d,f).
Figure 12.
Small sections of unwrapped band structure diagrams for a free plate (P), a free fluid domain with PML (F) and the Multiphysics interaction (P + F) for two different heights and . (a): and (b): .
Figure 12.
Small sections of unwrapped band structure diagrams for a free plate (P), a free fluid domain with PML (F) and the Multiphysics interaction (P + F) for two different heights and . (a): and (b): .
Figure 13.
Calculated band structure diagram for Lamb waves in a fluid-loaded aluminum plate. FEM results (solid blue lines) are shown together with GMM and SCM results (red circle and green squares, respectively). To avoid overloading, only every 15th point is displayed for both reference methods.
Figure 13.
Calculated band structure diagram for Lamb waves in a fluid-loaded aluminum plate. FEM results (solid blue lines) are shown together with GMM and SCM results (red circle and green squares, respectively). To avoid overloading, only every 15th point is displayed for both reference methods.
Figure 14.
Enlarged sections of the band structure diagram in
Figure 13: (
a) cut-off region of A0 mode and (
b) minimum of S1 mode curve. Both plots show significant deviations between the curves determined by different methods.
Figure 14.
Enlarged sections of the band structure diagram in
Figure 13: (
a) cut-off region of A0 mode and (
b) minimum of S1 mode curve. Both plots show significant deviations between the curves determined by different methods.
Figure 15.
Relative deviation of the Lamb wave results obtained by the two reference methods and by the FEM for the fluid-loaded plate: (a) GMM vs. FEM, (b) SCM vs. FEM, and (c) GMM vs. SCM. Due to method-related differences in discretization, the reference systems were linearly interpolated to the frequency steps of the FEM data.
Figure 16.
Measured one-sided dispersion relation (surface plot) and the parameter-optimized FEM results (dashed red lines) for a water-loaded aluminum plate.
Figure 16.
Measured one-sided dispersion relation (surface plot) and the parameter-optimized FEM results (dashed red lines) for a water-loaded aluminum plate.
Table 1.
Starting parameters for the FEM model of an aluminum plate.
Table 1.
Starting parameters for the FEM model of an aluminum plate.
| Parameter | Variable | Value |
|---|
| Unit Cell Length | L | 1.5 mm |
| Unit Cell Hight 1,2 | HP | 1.5 mm |
| X-Mesh Elements | Nx | 20 |
| Y-Mesh Elements 1 | NyP | 15 |
| Sweep Step Width | dk | 0.01 |
| Young’s Modulus 1,2,3 | EP | 68 GPa |
| Density 1,2 | ρP | 2700 kg/m3 [43] |
| Poisson’s Ratio 1,2,3 | νP | 0.34 |
| Max. Frequency | fm | 3 MHz |
Table 2.
Parameters for the FEM model of an aluminum plate with single-sided water loading.
Table 2.
Parameters for the FEM model of an aluminum plate with single-sided water loading.
| Parameter | Variable | Value |
|---|
| Unit Cell Length | L | 1.5 mm |
| Hight Plate 1,2 | HP | 1.5 mm |
| Hight Fluid | HF | 0.5 mm |
| Hight PML | HPML | 2.5 mm |
| X-Mesh Elements | Nx | 20 |
| Y-Mesh Elements on Plate 1 | NyP | 15 |
| Y-Mesh Elements on Fluid | NyF | 10 |
| Y-Mesh Elements on PML | NyPML | 50 |
| Sweep Step Width | dk | 0.01 |
| Plate: Young’s Modulus 1,2,3 | EP | 72.7388 GPa |
| Plate: Density 1,2 | ρP | 2700 kg/m3 [43] |
| Plate: Poisson’s Ratio 1,2,3 | νP | 0.3445 |
| Fluid: Speed of Sound (at 24 °C) | cF | 1493 m/s [47] |
| Fluid: Density (at 24 °C) | ρF | 997 kg/m3 [47] |
Table 3.
Optimized parameters for the FEM model.
Table 3.
Optimized parameters for the FEM model.
| Parameter | Variable | Start | Optimized |
| Young’s Modulus 1,2 | EP | 68 GPa | 72.7388 GPa |
| Poisson’s Ratio 1,2 | νP | 0.34 | 0.3445 |
| Disclaimer/Publisher’s Note: The statements, opinions and data contained in all publications are solely those of the individual author(s) and contributor(s) and not of MDPI and/or the editor(s). MDPI and/or the editor(s) disclaim responsibility for any injury to people or property resulting from any ideas, methods, instructions or products referred to in the content. |
© 2025 by the authors. Licensee MDPI, Basel, Switzerland. This article is an open access article distributed under the terms and conditions of the Creative Commons Attribution (CC BY) license (https://creativecommons.org/licenses/by/4.0/).
