Article

Effect of Pressure Gradient on Flow and Heat Transfer over Surface-Mounted Heated Blocks in a Narrow Channel

1
Hybrid and Electric Vehicle Technology, Vocational School of Gemlik Asım Kocabıyık, Bursa Uludağ University, Gemlik 16600, Bursa, Turkey
2
Department of Mechanical Engineering, Faculty of Engineering, Bursa Uludağ University, Görükle 16059, Bursa, Turkey
*
Author to whom correspondence should be addressed.
Appl. Sci. 2025, 15(16), 9099; https://doi.org/10.3390/app15169099
Submission received: 22 July 2025 / Revised: 12 August 2025 / Accepted: 15 August 2025 / Published: 18 August 2025
(This article belongs to the Section Applied Thermal Engineering)

Abstract

In this study, pressure gradient effects on heat transfer from block-like electronic chips are investigated computationally. The pressure gradient is provided by the slope given to the upper plate and starts just before the first block. Tilt angles of −2°, 0°, 2°, 4° and 6° have been used. Air is used as the fluid, and it enters the duct at a constant speed with a uniform velocity profile. Calculations were made for Re numbers (Re = 6000, 9015, and 11,993) defined according to the channel height. For this purpose, conservation and SST k-ω turbulence model equations are solved by using ANSYS-Fluent 20.1 software for two-dimensional, incompressible, and turbulent flow conditions. Velocity, temperature, pressure, and turbulence kinetic energy distributions were obtained and compared for the considered slope angles. The effects of all changing conditions on heat transfer were discussed by calculating local and average Nusselt values, the reattachment lengths after the last block were calculated by plotting, and a comparison was made by plotting the pressure values on the block in the middle of the channel and at the top of the channel.

1. Introduction

Developments in the field of electronics affect our daily lives directly and indirectly. The large number of application areas of these developed systems makes it necessary for them to operate more flawlessly. While this requirement necessitates compact design, the need for increased performance causes a significant increase in heat generation per unit area due to compact design. For this reason, it is very important to control the heat generated in the design of the devices so that the system elements can operate more efficiently.
The temperatures of the integrated circuit elements should be kept at the lowest possible level while ensuring uniform temperature distribution within the system. The failure rate of electronic devices increases as the temperature increases. Thermomechanical stresses caused by excessive temperature rise can cause failures such as breakage of solder joints and melting or burning of materials that must operate at low temperatures. Also, as a result of overheating, functional irregularities may occur in semiconductor materials [1]. Therefore, ensuring efficient cooling and thermal management to prevent performance degradation at high operating temperatures is crucial for the continuous and reliable operation of the system. This necessity reveals the need for the development of cooling systems.
Barton [2] numerically investigated inlet effects in a backstep flow. The flow is assumed to be laminar, two-dimensional, steady, and incompressible. The SIMPLE algorithm and QUICK scheme were used in the computations. It was observed that the longer the inlet is kept, the more compatible it is with the results obtained from experimental data. Pulat [3] in his study, examined the flow and heat transfer through blocks and blocks mounted on the lower of two parallel plates and gave information about velocity and temperature distributions. In the single-block case, the type of fluid is water, and in the multi-block case, the fluid is air. Both laminar and turbulent cases were studied using different Re numbers. It was observed that in turbulent flow, the length of the reconnection decreases with increasing Re number. In laminar flow, he found that the reunion length increases with increasing Re number. Meinders et al. [4] conducted an experimental study on the cooling of multiple heat-dissipating blocks. They observed that with increasing Reynolds number, flow separations occur, especially on the upper surface of the blocks, and the flow is irregular and behaves like natural convection at low Reynolds numbers.
Xu [5] numerically investigated forced convection between two parallel plates with discrete heat sources on one surface. FC-72 and water were used as fluids in the study, and they investigated the effects of the ratio of the channel width to the length of the heat source (block length) and the placement of the heat source (block) on heat transfer. They observed that the surface temperature increases along the heat source, heat transfer in the channel is higher when the channel height is less, and heat transfer decreases as the ratio of the channel width to the length of the heat source increases.
Pulat et al. [6] investigated the flow and heat transfer through a block mounted on the bottom plate of two horizontally parallel plates in 3D. The study was conducted under laminar flow conditions, and the Re number was calculated according to the channel height. Investigations were carried out at different fluid inlet temperatures, and the fluid was water. In the study, velocity and temperature controllers with different properties were compared. It was observed that increasing the Re value increases the reunion length. In 2D (2-dimensional) analysis, this value is slightly higher than the experimental study, but in 3D (3-dimensional) analysis, this value is lower than the value obtained in the experimental study, but closer to the experimental results.
Etemoğlu et al. [7] computationally analyzed the flow and temperature distribution over a single block mounted on the bottom plate from two parallel plates and calculated the local heat transfer coefficient on the block. They performed their calculations for both laminar and turbulent flow conditions. Geometric factors were kept constant, and a constant heat flux was given. As a result, they observed that the heat transfer coefficient increases with increasing Reynolds number, and the maximum temperature occurs at the bottom of the back face of the block. Mathews and Balaji [8] numerically analyzed the mixed convection for turbulent flow in a 2D vertical channel with embedded heaters on both opposite surfaces using the k-ɛ turbulence model. The effects of the Reynolds number, the heat conduction coefficient of the wall, the conduction coefficient of the heat sources, the corrected Richardson number, and the aspect ratio of the duct are considered.
Ratnam and Vengadesan [9] investigated the flow and heat transfer through a microelectronic chip mounted on a printed circuit board. Fluent was used for the computational parts. The flow is taken as 3D and incompressible. In the calculations, k-Ɛ and k-ω turbulence models and the SIMPLE algorithm were used. It was observed that the best result was obtained in the k-ω turbulence model. It is observed that the maximum heat transfer coefficient is near the reunion point, and the minimum is in the recirculation region.
Gavara [10] numerically analyzed the three-dimensional natural convection from 6 discrete and embedded heaters placed on opposite surfaces in a vertical channel. In this study, the effects of the distance between the walls, the distance between the heaters, and the thermal conductivity of the walls on the flow and heat transfer were investigated. It was found that increasing the distance between heating sources decreases the maximum temperature. They observed that the optimum inter-wall distance is different for flow and heat transfer, and the distance required for maximum mass flow is greater than the distance required for maximum heat transfer.
Aylı et al. [11] experimentally and numerically investigated forced convection in a duct with rectangular fins mounted on the bottom surface under turbulent, fully developed flow conditions. Air was used as the fluid. The channel bottom surface is uniformly heated. Geometrical parameters are varied, and their effects on flow and heat transfer are investigated. As a result of the studies, a new correlation for the Nu number was developed.
Durgam et al. [12] experimentally and numerically investigated the natural and forced convection through a printed circuit board with discrete heat sources located both horizontally and vertically. The aim of the study is to determine the geometry in which the location of the heat sources will provide optimum cooling to reduce the temperature of the heat sources.
Umur et al. [13] experimentally and numerically investigated the flow and heat transfer in a channel with four blocks on the bottom surface. The numerical investigation was performed using Fluent, and the flow was analyzed for laminar, transition zone, and turbulent conditions. The results show that flow separation occurs, especially in the first block and after the last block. They observed that flow separation and block thickness variation resulted in higher turbulence and heat transfer in laminar flow. The highest turbulence value was observed between the blocks with reverse flow. They stated that the Stanton numbers obtained in the numerical study were higher than the values obtained in the experimental study.
In his thesis study, Güngör [14] investigated the heat transfer from blocks with flat, rectangular, triangular, trapezoidal, and semicircular cross-sections in a 2-dimensional, laminar flow using ANSYS Fluent. The effects of Stanton number at different cross sections are compared. It is observed that the increase in the Re number decreases the Stanton number in each cross-section. It was observed that heat transfer was highest in blocks with a triangular cross-section. It was examined that the maximum temperature in chips of different cross-sections occurs at the top surface of each block. The highest heat transfer was obtained at the top starting corner of the first block, while the lowest heat transfer was obtained at the back surface of the last block.
Amghar et al. [15] investigated the heat transfer over 2 and 4 blocks placed on a horizontal plate. The study was examined as 2-dimensional and turbulent. The study was carried out using the k-ɛ turbulence model and the SIMPLEC algorithm via Fluent. The effects of the space between the blocks and the block length on the flow structure were investigated. They observed that increasing the space between them increased the heat transfer rate and the friction coefficient. In the transverse distance, they observed that decreasing the space between them increased the heat transfer rate and the friction coefficient. For four square blocks arranged side by side, the heat transfer rate was obtained to be higher than the case with two blocks in the case of transverse spacing.
There are many studies in the literature on the present problem. The effects of different fluids on heat transfer have been investigated in natural, forced, and mixed convection regimes. There are also studies that examine the effects on heat transfer and flow field when heat sources are embedded in or protruding from the surface. Pressure gradient causes flow separation that affects heat transfer. However, there are no studies focusing on the effects of the pressure gradient in the context of the authors’ knowledge. In this context, the aim of this study is to numerically calculate the flow characteristics over heated blocks and their effects on heat transfer.

2. Materials and Methods

Computational fluid dynamics is a tool for solving problems involving fluid dynamics, such as fluid mechanics, heat transfer, etc., and for analyzing the flow under different conditions by using a numerical method. CFD (computational fluid dynamics) is basically based on continuity, momentum, and energy equations to obtain data such as velocity, pressure, and temperature distributions in the flow field. In this study, the CFD method is used as a numerical method. The turbulence, energy, and momentum equations are solved using ANSYS Fluent 20.1 commercial software.
In this numerical study, the effects of pressure gradient on the heat transfer from four blocks simulating electronic chips mounted on the bottom surface for five different geometries were computationally investigated. The pressure gradient is provided by the inclination given on the top plate, starting just before the first block. The analysis was performed at −2°, 0°, 2°, 4°, 6°. The two-dimensional turbulent case is analyzed, and air is used as the coolant. The effects of the height and the pitch of the protruding objects on the heat transfer have not been accounted for in this study.

2.1. Geometry and Boundary Conditions

The geometries and dimensions considered in the study are given in Figure 1. In the formation of these geometries, the channel inlet height H = 2.54 cm (4h) for each of 4 chips. Chip height h = 0.635 cm, chip length l = 1.27 cm, distance between chips s = 1.27 cm, distance from the channel inlet to the first chip is 10.16 cm (4H), and distance from the last chip to the channel outlet is 26.67 cm (10.5H). The channel length L is 45.72 cm (18H). The Re number defined by the channel inlet height is calculated as Re1 = 6000, Re2 = 9015 and Re3 = 11993, and the corresponding inlet velocities are U1 = 3.607 m/s, U2 = 5.42 m/s, and U3 = 7.21 m/s. The velocity is zero at all solid surfaces, and the wall condition (no-slip condition) is valid. Uniform velocity and temperature profiles are taken at the inlet, and the pressure is zero at the outlet. The inlet temperature is T = 293.15 K, and the temperature on the chips is constant at Ts = 342.1 K. This temperature is usually encountered in the cooling of electronic chips. Meinders et al. [4], in their experimental analysis of the cooling problem in electronic chips, and Sherry et al. [16], who used this study, took the block surface temperature as constant at 348 K. In the other simulations of Meinders et al. [4,17], the block surface temperature was assumed constant at 348 K [18,19]. All other solid surfaces, i.e., all bottom surfaces except the top surface and the front, top, and back surfaces of the block, are considered adiabatic. The input turbulence parameters are entered in ANSYS-Fluent using either the turbulence intensity/length scale, turbulence intensity/viscosity ratio, or turbulence/hydraulic diameter binary. In this study, the binary turbulence intensity/hydraulic diameter is entered. Boundary conditions are given in Table 1, and boundary conditions are shown in Figure 2. In all geometries, the top plate was angled 0.3 cm before the first chip. As can be seen in Figure 1, the effect of pressure gradient on heat transfer was investigated by giving an angle of α = −2° to Geometry 1, 0° to Geometry 2, 2° to Geometry 3, 4° to Geometry 4, and 6° to Geometry 5. The geometries and boundary conditions were inspired and adapted from [4,18,20,21]. The geometric factors for the base geometry (Geometry 2 for α = 0°) are given in Table 2 in comparison with the geometric factors in the experimental study of Meinders et al. [4].

2.2. Numerical Method

In the steady regime, turbulent, incompressible, two-dimensional conservation equations are solved using ANSYS Fluent 20.1. SST k-ω is used as the turbulence model. This model, developed by Menter [22], is a hybrid model that uses both the k-ε model and the k-ω model and converts the k-ε model into the k-ω model using the formulation ε = k ω. Since the properties obtained by this transformation make the SST k-ω model highly accurate and reliable for flows with inverse pressure gradients, this model is used in this study, where the effects of pressure gradients are also investigated. Changchaoren and Eiamsa-ard [23] emphasized that the SST k-ω model gives more accurate results than the k-ε model in their study, in which they placed ribs in a duct and calculated heat transfer through them. In the solution of the conservation equations, velocity and pressure are linked using the SIMPLE algorithm. Gupta et al. [24] in their flow over blocks study, and Anwar-ul-Haque et al. [25] in their backstep flow study, reported that the SIMPLE algorithm gave the best results. In spatial discretization, least squares cell-based least squares were used for gradient, second order for pressure, second order upwind for momentum, and second order for energy. For the base geometry, the solution space was divided into coarse, medium, and dense meshes, and a mesh independence study was performed. The number of elements for the meshes studied is given in Table 3. While constructing the meshes, the top surface of the chips and the walls were divided into dense meshes. The dense mesh structure of the base geometry is shown in Figure 3, and the mesh independence study on the surface heat transfer convection coefficients is shown in Figure 4. As can be seen from Figure 4, the results obtained in the medium and fine meshes are very close to each other, while in the coarse mesh, the fine mesh structure was chosen because the values in the first chip are different from them. In addition, the SST k-ω turbulence model requests a lower value of y+, so the dense mesh was chosen. While creating the mesh structure, each edge was divided separately with the number of division methods. The face meshing method was applied to obtain rectangular mesh elements. For the suitability of the turbulence model and the mesh used, y+ values were also obtained for all geometries. Park et al. [26] and Jaramillo et al. [27] suggested that the y+ value should be below 2.5 for k-ω and k-ω-based models. However, in some studies, such as Lu and Jiang [28], they used grids having y+ ≈ 10, and the results with grids having y+ < 10 are only slightly different from the results presented in their experimental values. Table 4 shows the average, minimum, and maximum y+ values obtained in the analyses, and the maximum y+ value has been obtained as approximately 5, as seen from Table 4.

2.3. Validation

It is very important to perform a validation process to check whether the studies conducted with computational fluid dynamics-based programs are reliable. In this study, the experimental work of Meinders et al. [17] on flow and heat transfer over the single heated block was used for the validation test. Their work was chosen because it is an example of separated flows encountered in flows through a heated single block surface, similar to this study, where separated flows are also found. The geometric model used in the validation test is shown in Figure 5. The geometrical factors, such as blockage ratio, expansion ratio, etc., are the same as Meinders et al.’s [4] study for flow over multiple heated blocks, as seen from Table 2.
The model used in the study of [17,18] was modeled in 2D with the same dimensions, and the same boundary conditions were entered and solved using ANSYS Fluent, and the results were obtained. In the study, a constant velocity input is defined. A constant temperature Ts = 348 K is applied to all block surfaces, and a pressure outlet is defined at the outlet. Other walls are taken as adiabatic. No-slip boundary condition is also applied to all solid channel and block surfaces. Further details can be found in [17,18,19]. Average heat transfer coefficients were obtained for channel flow inlet bulk velocities of Ui = 2.8, 3.2, 4.0, 4.5, and 5 m/s, which corresponded to the Reynolds numbers equal to 2750, 3200, 4000, 4440, and 4970. These Reynolds numbers are defined based on the cube height and flow inlet bulk velocity. All thermophysical properties of air were taken at an inlet temperature of Ti = 294 K [18]. Average heat transfer coefficients have been obtained by using the arithmetic mean of the local heat transfer coefficients of all block surfaces, and are shown in Figure 6. When Figure 6 is inspected, it is seen that the numerical studies are compatible with the experimental studies, but as expected, the agreement in the three-dimensional numerical study is better than the two-dimensional study. In this study, the average heat transfer coefficient was underpredicted with a minimum error of 8.8%, below the experimental value at the lowest Reynolds number of 2750. The maximum error was also underpredicted with a 13.8% error at the Reynolds number of 3200. Lu and Jiang [28] experimentally investigated convective heat transfer in a channel equipped with angled ribs and compared their results with those obtained using the RNG k-e and SST-k-ω turbulence models. The numerical average Nusselt number results using the SST k–ω turbulence model agree better with the experimental results than those using the RNG k–e turbulence model. The difference between the numerical results using the SST k–ω turbulence model and the experimental data is less than 10%. For estimating local Nusselt numbers, the deviation between the experimental results and the numerical prediction obtained using the SST k–ω turbulence model is less than 15%. Considering the above and other studies using the SST k–ω model [28,29] and the deviations in these studies, the maximum 13.8% deviation in this validation study can be attributed to three-dimensional effects rather than the turbulence model used.

3. Results

3.1. Velocity, Temperature, Pressure, and Kinetic Energy Distributions

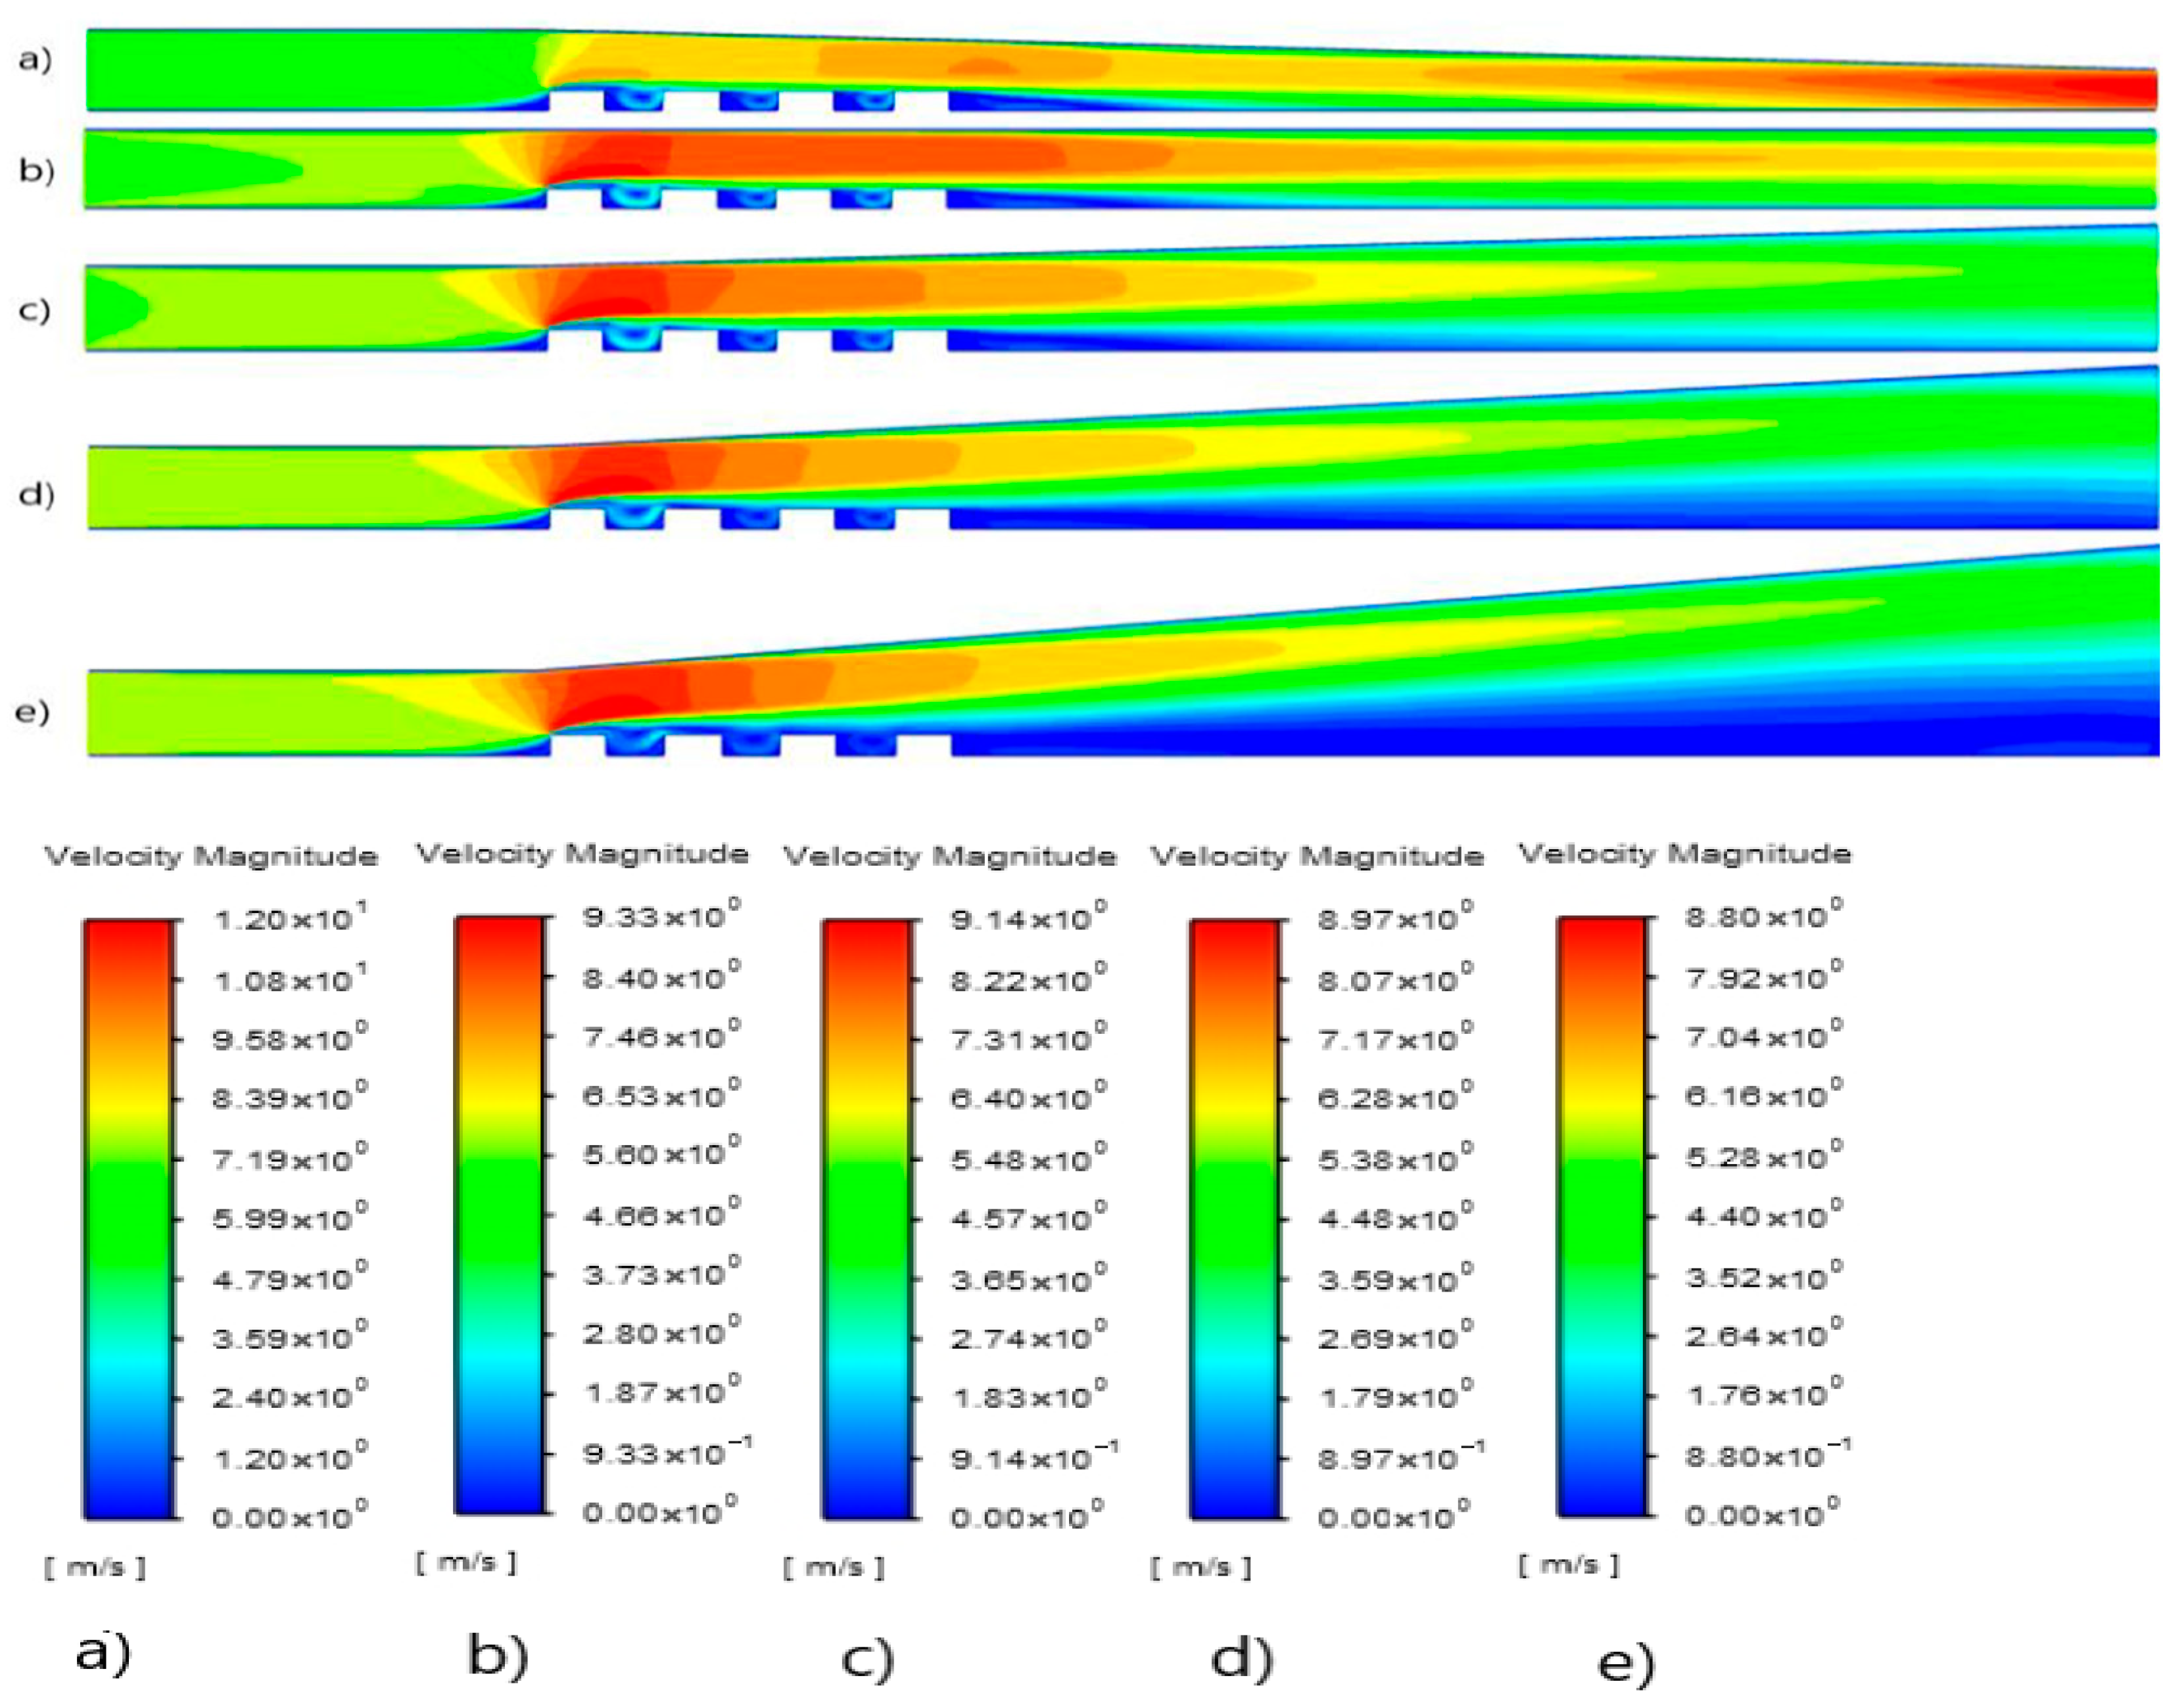
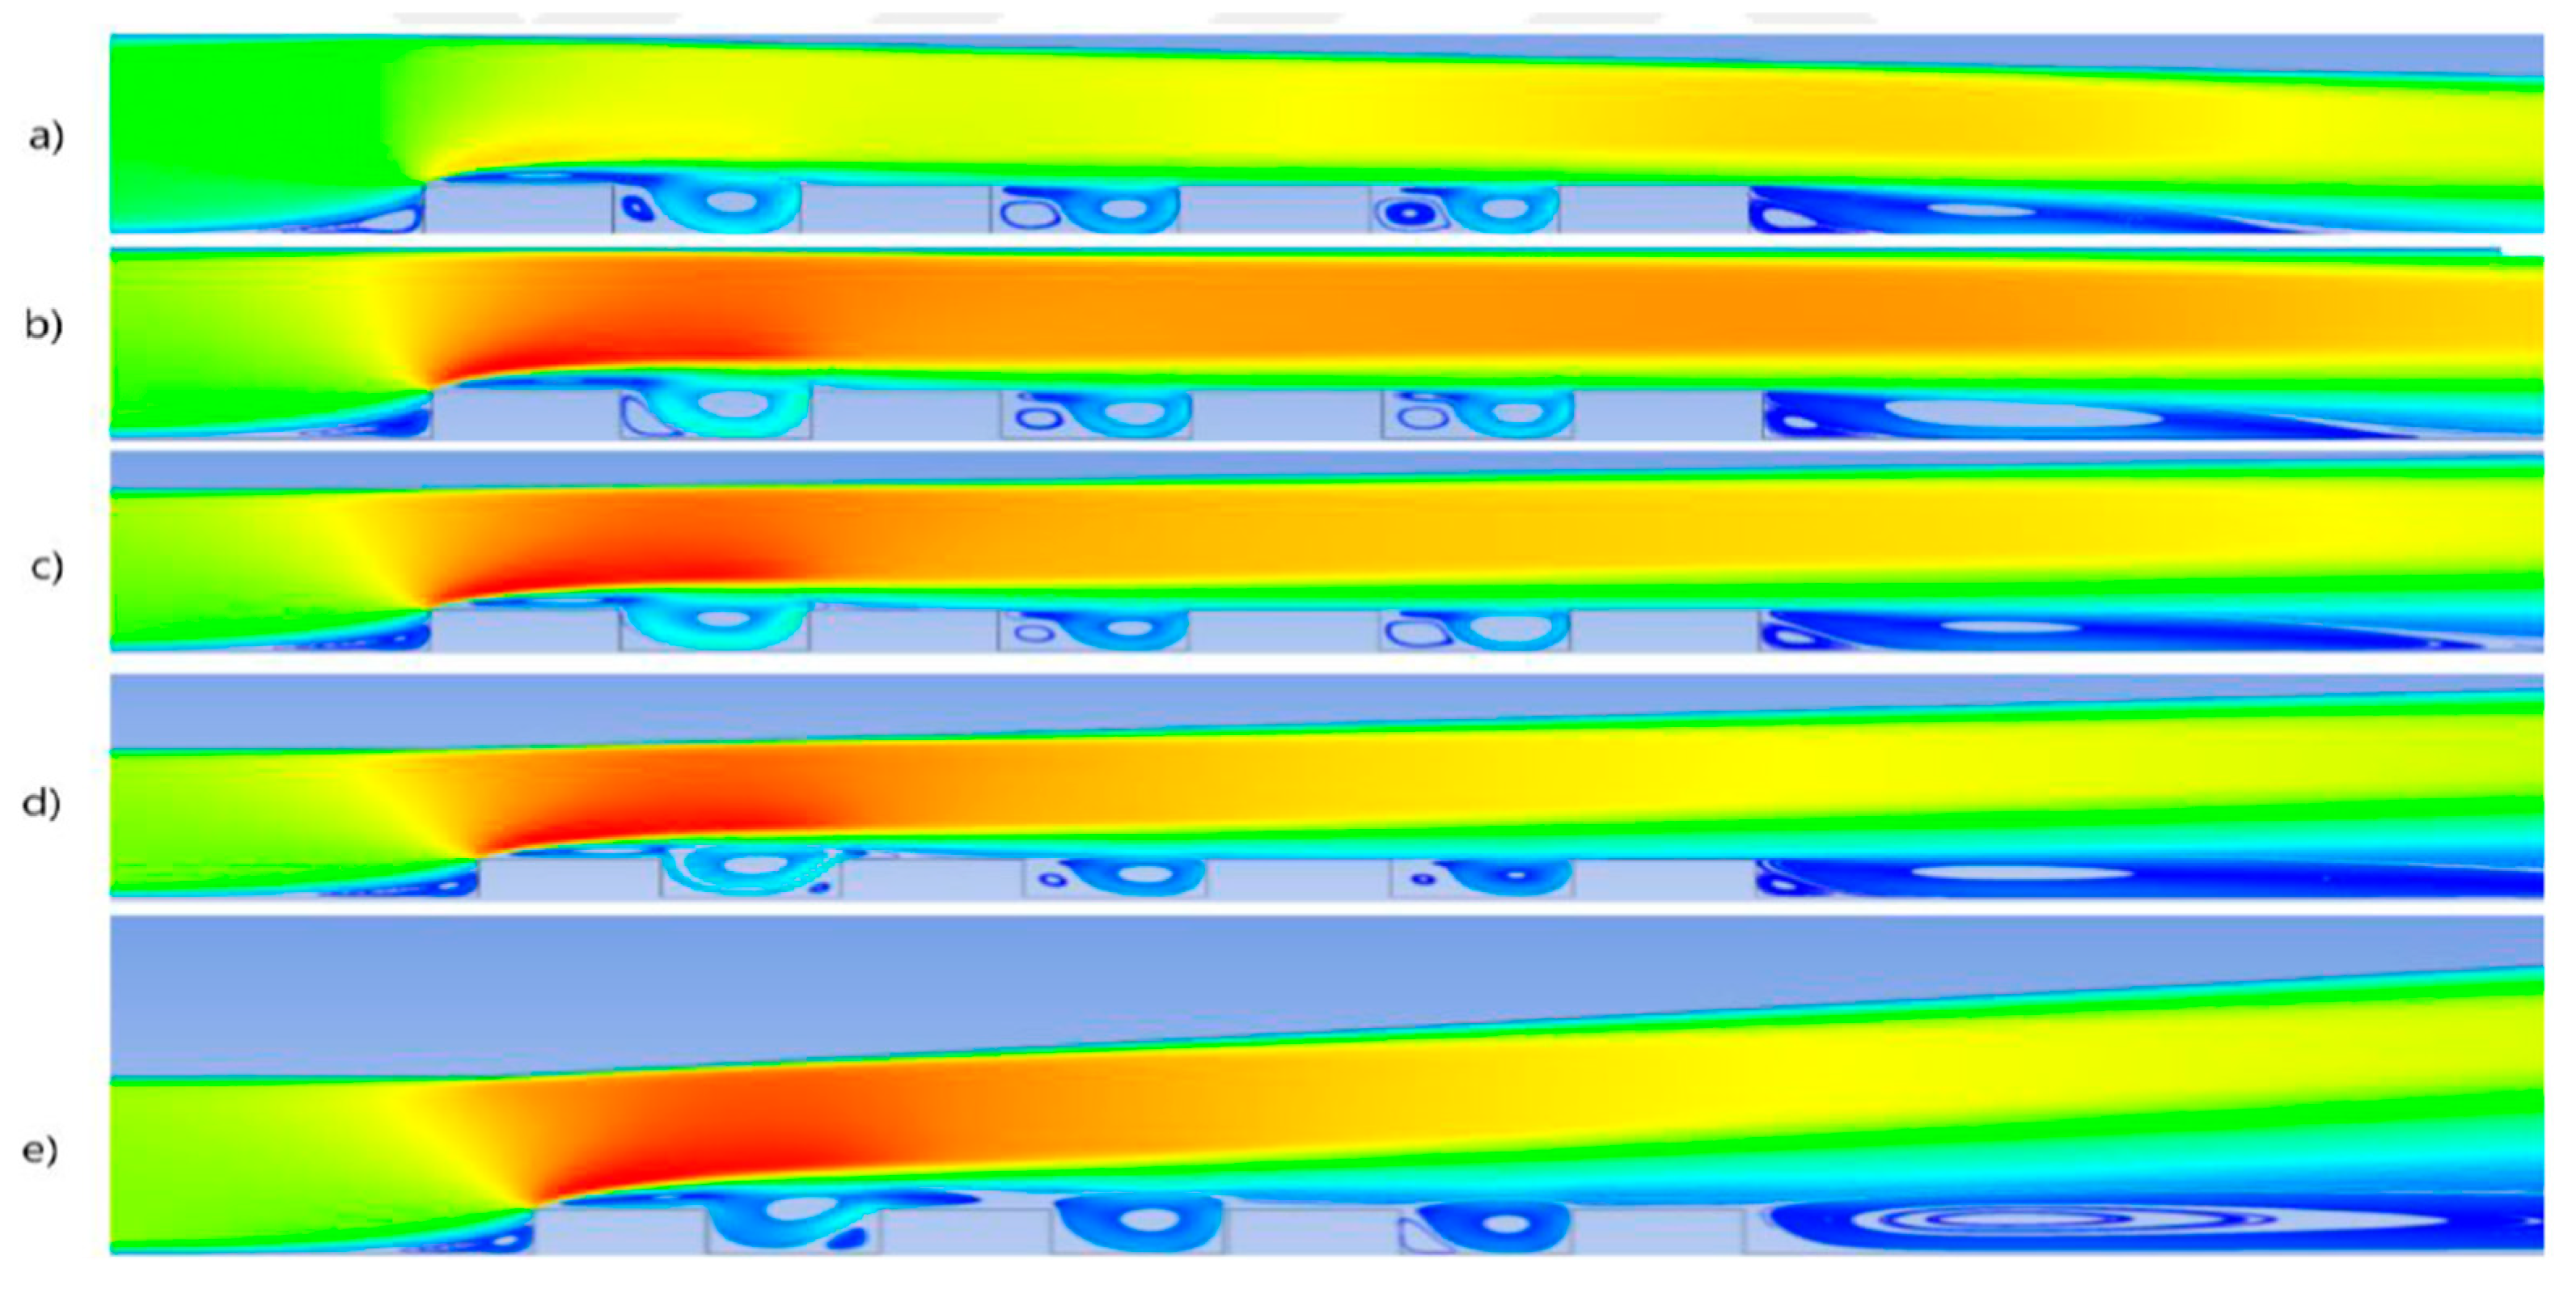
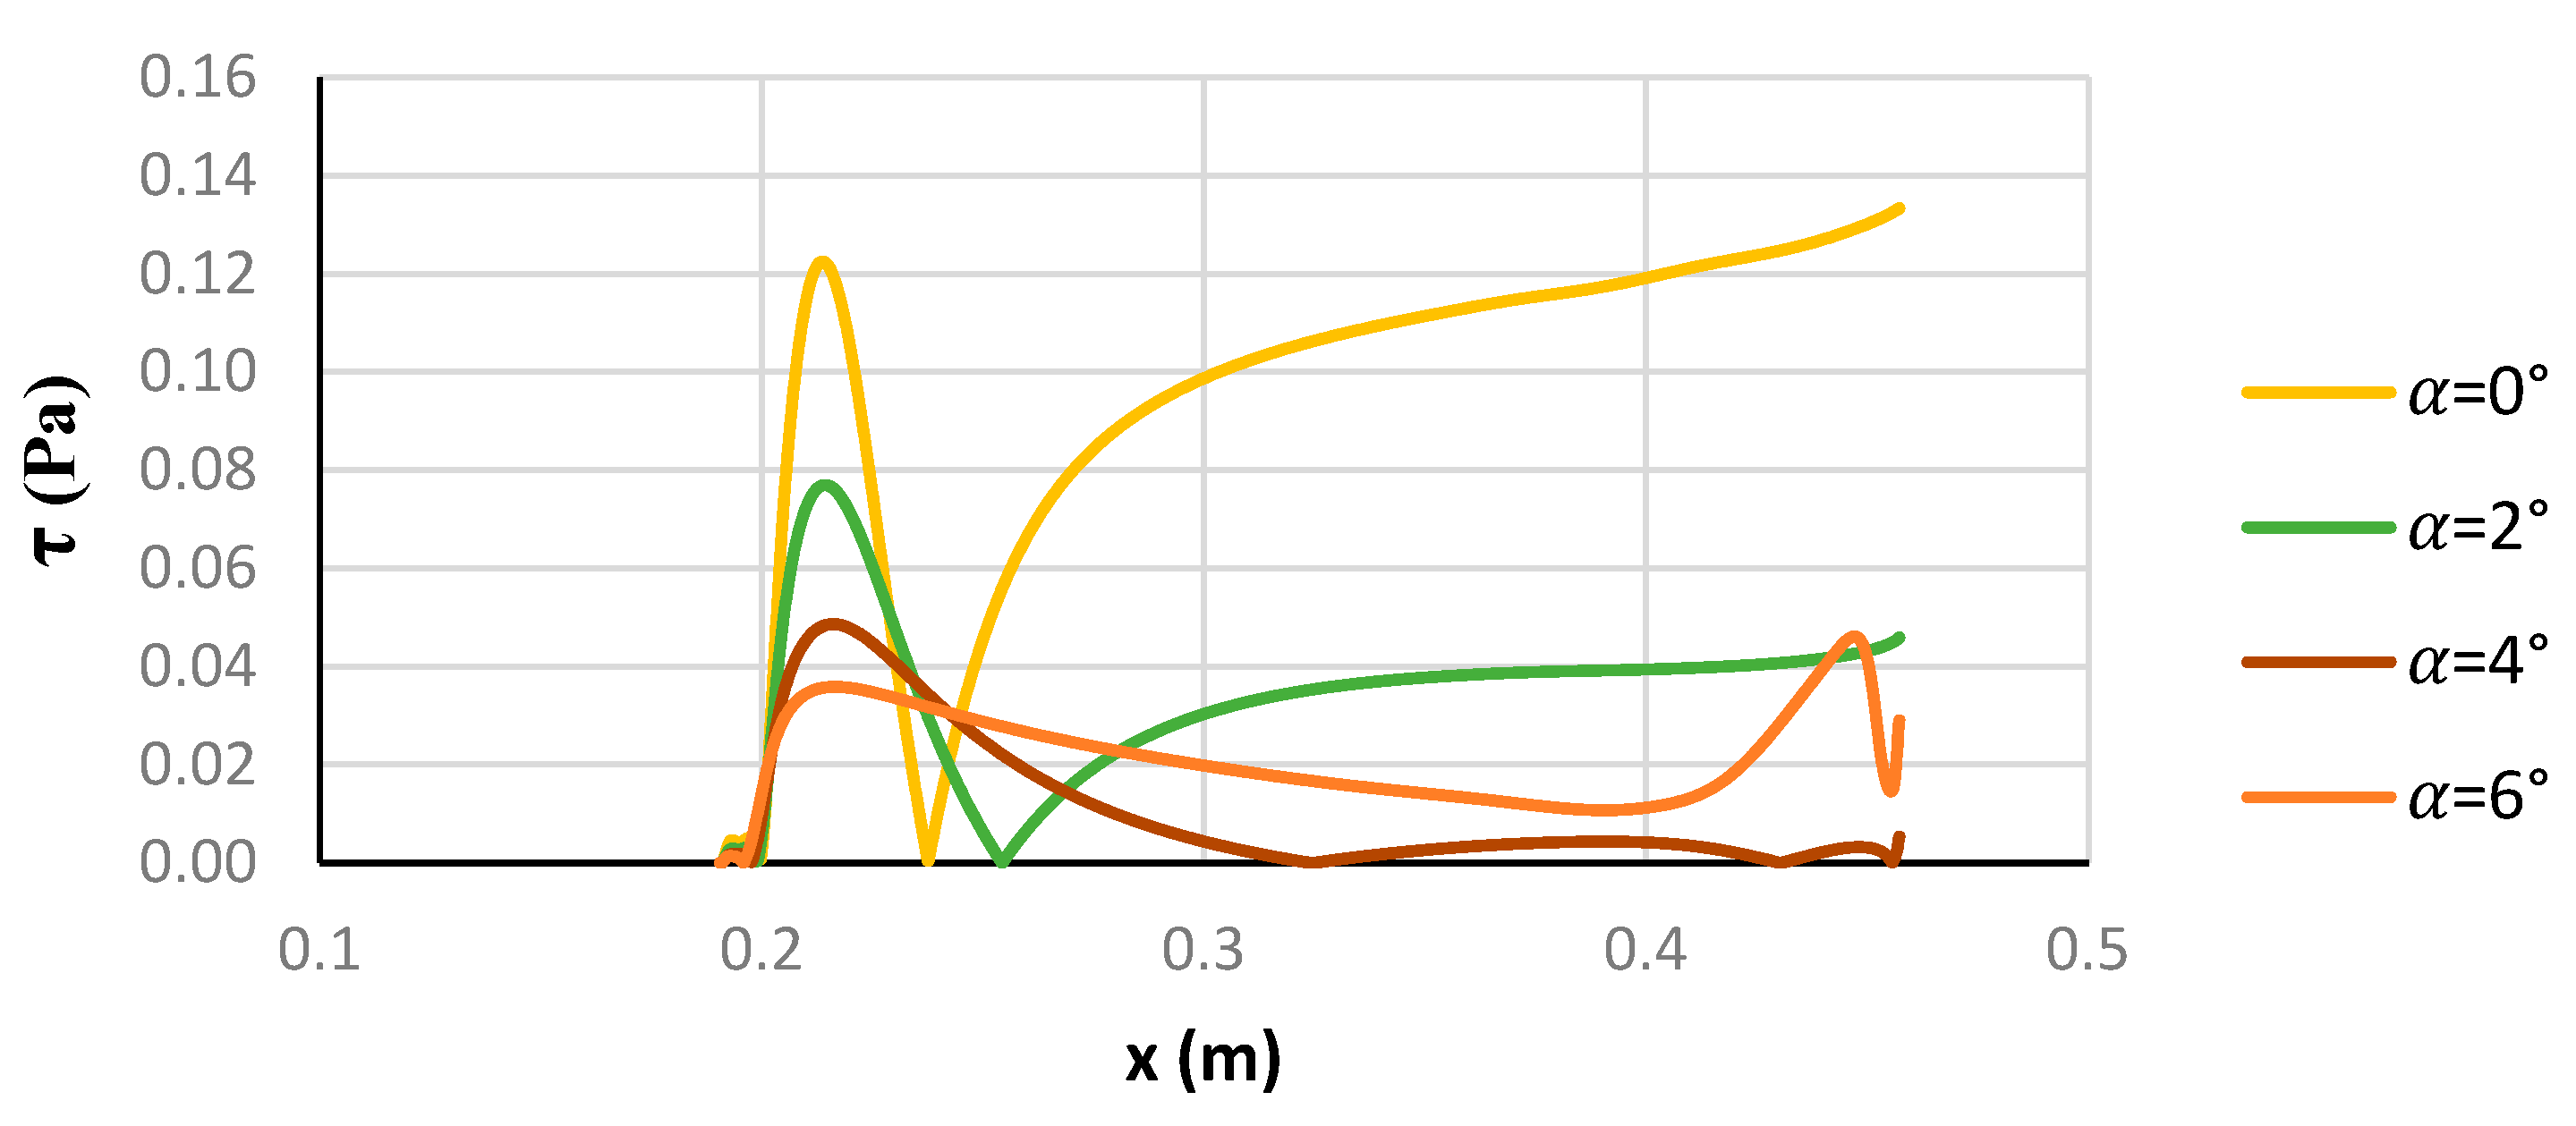
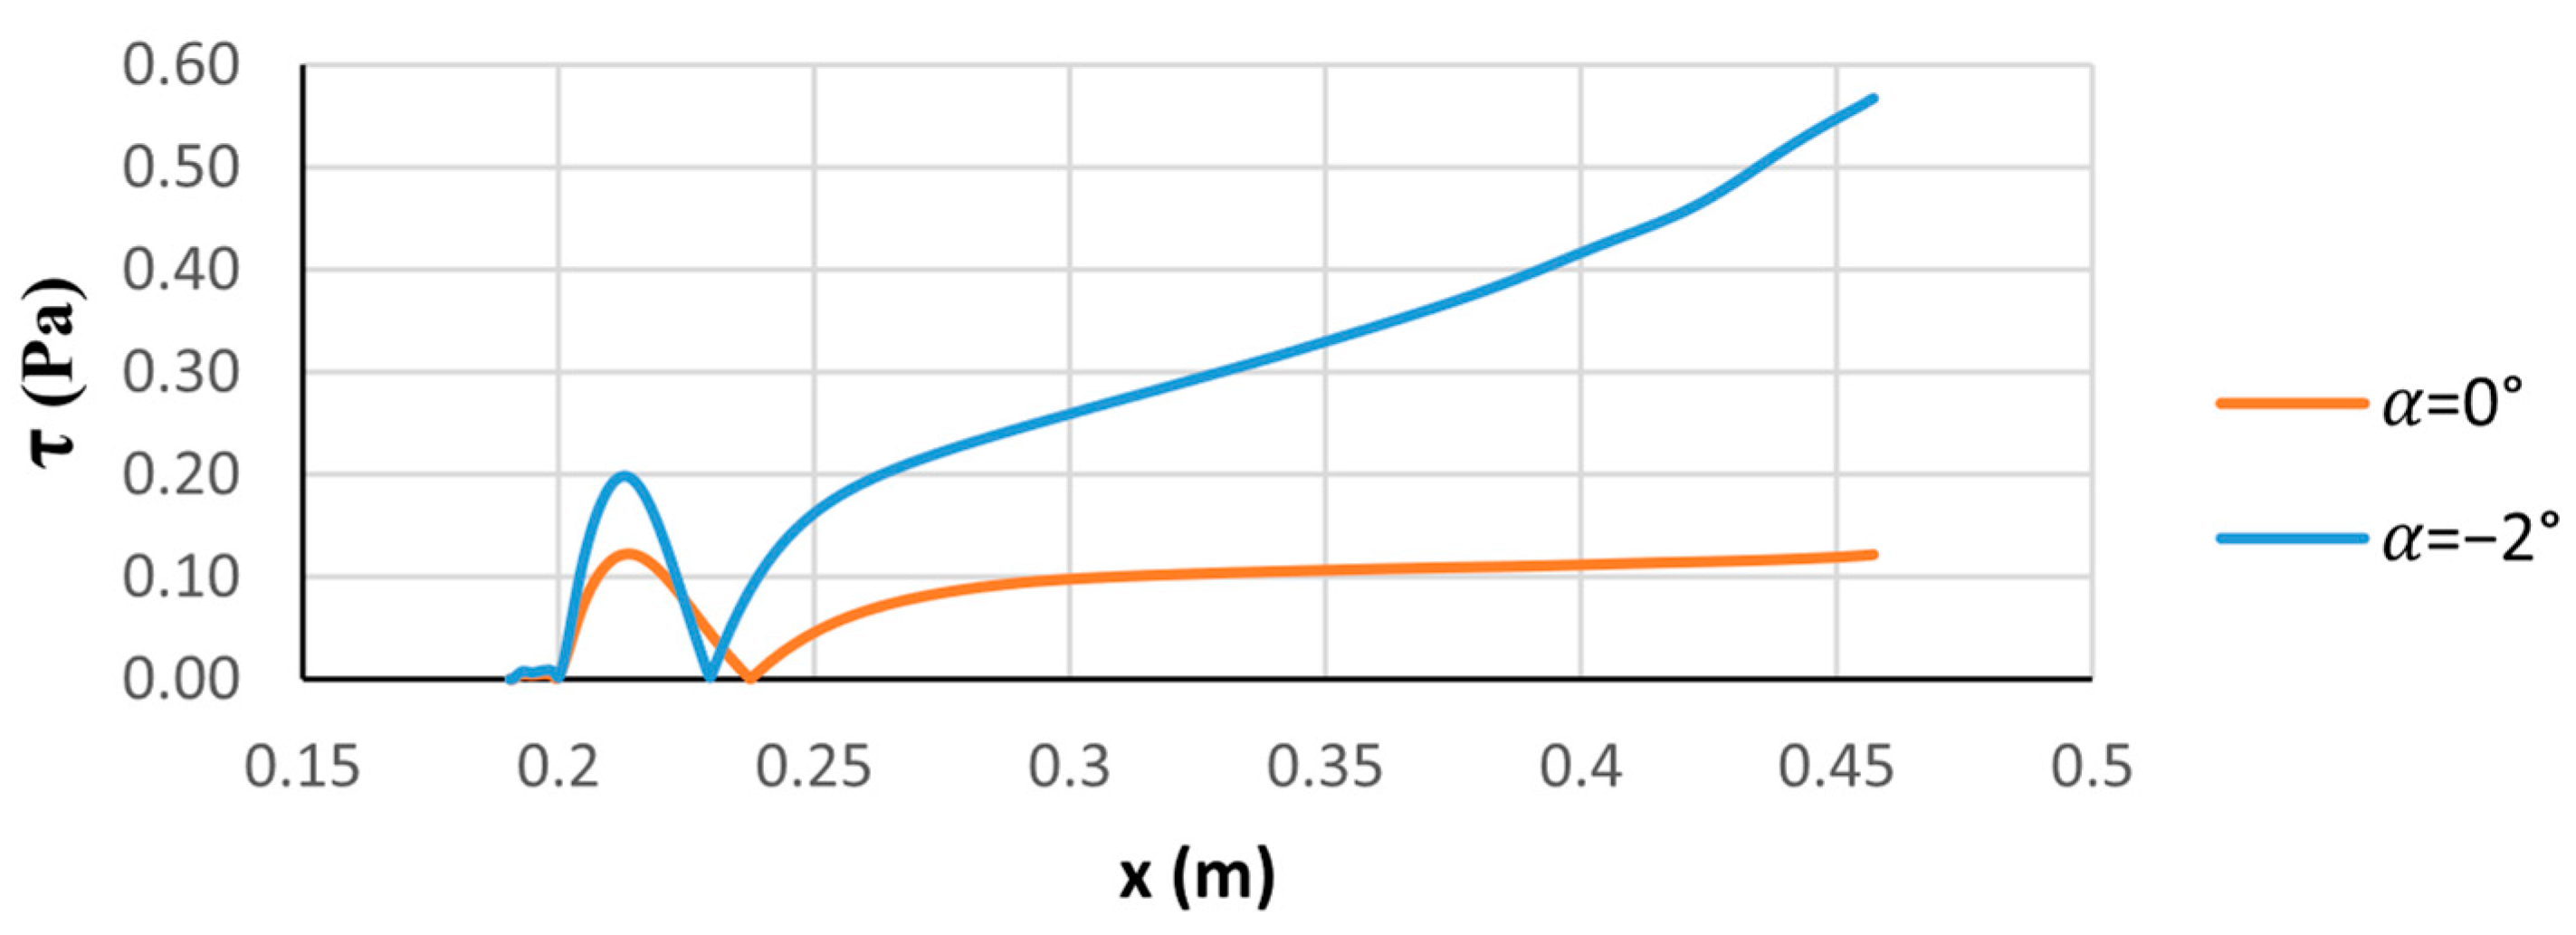
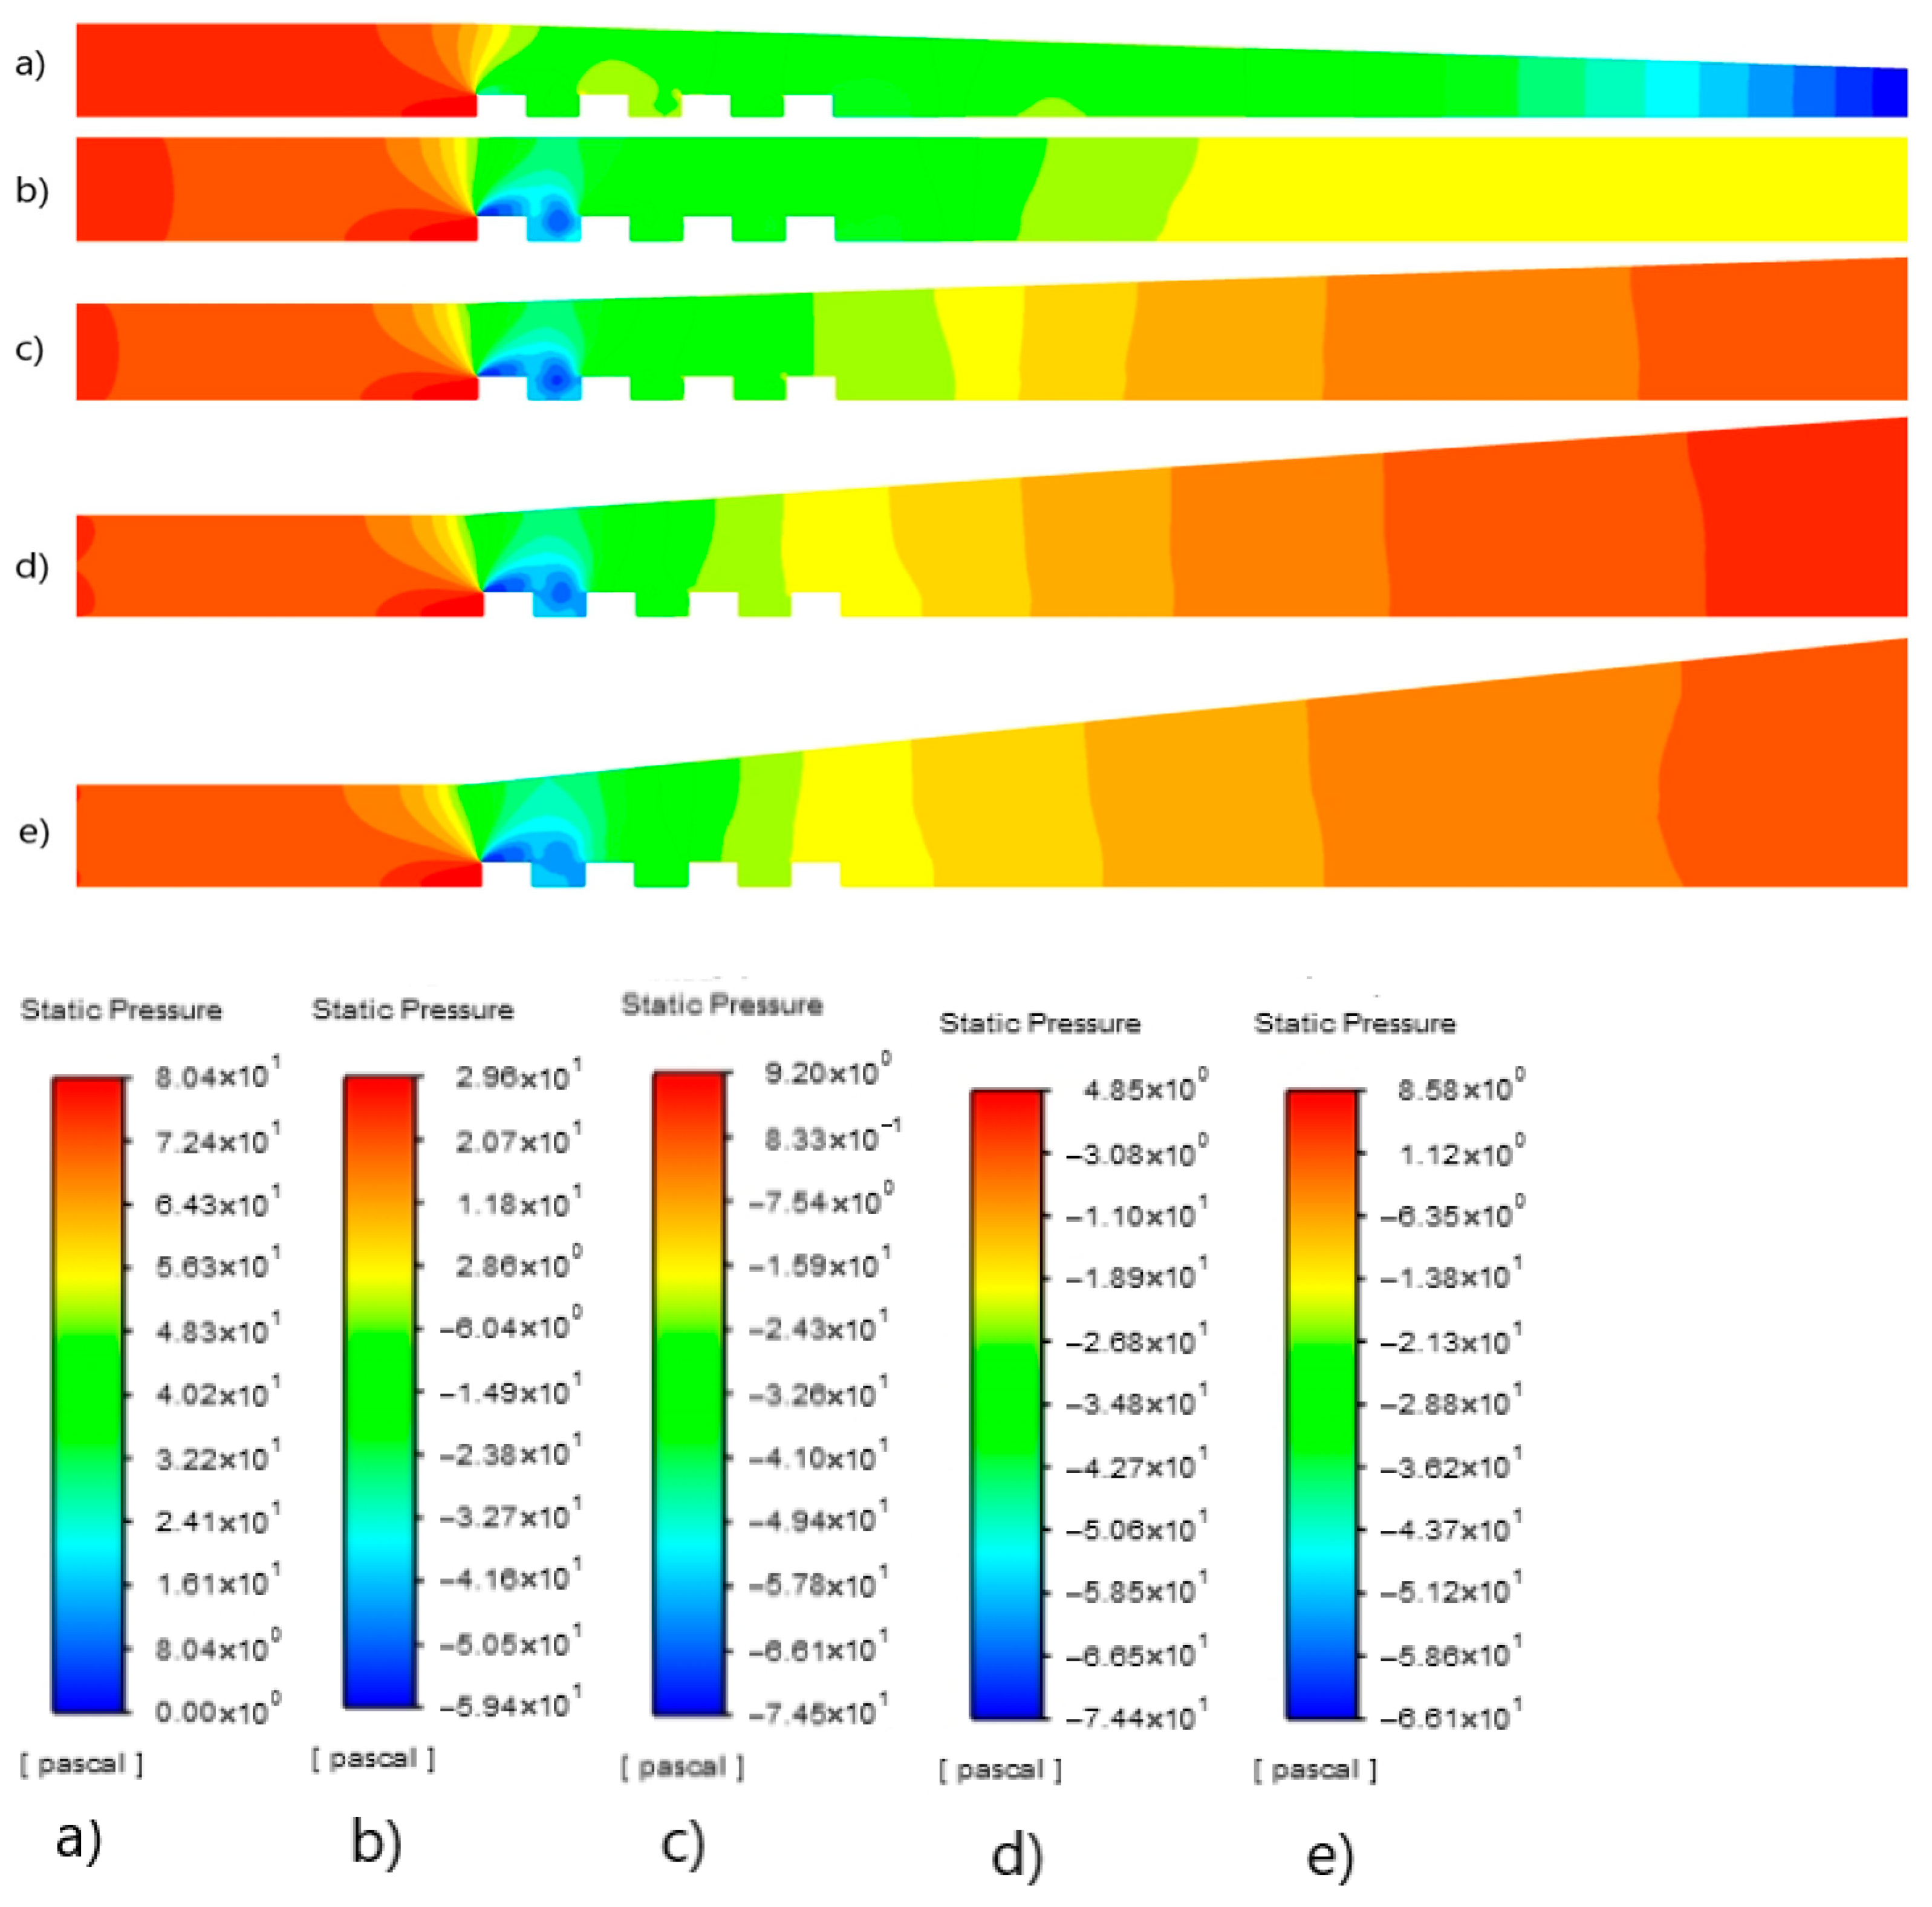
All analyses were performed for three different velocity values. Since quantitatively different but similar flow characteristics have been obtained for all three velocities of 3.607, 5.42, and 7.21 m/s, only the images for the intermediate value of 5.42 m/s were given as contour images. A comparison was made at different velocities in terms of local and average Nu numbers. As can be seen from Figure 7 and Figure 8, except for the converging geometry (Figure 7a), in all geometries, the velocity increases after the section narrowing after the 1st block, and the velocity increase rate decreases as the angle increases. This decrease slows down after 2°. In Figure 7b, the maximum velocity at 0° was 9.33 m/s, and is observed on the 1st chip after the flow hit the first chip. The maximum velocities at 2°, 4° and 6° were calculated as 9.14 m/s, 8.97 m/s, and 8.80 m/s, respectively. In the converging geometry (α = −2°), the maximum velocity was obtained at the exit, where the section narrowing was greater and was 12 m/s. As can be seen from Figure 8, a clockwise vortex is formed at the bottom corner before the first block in all geometries. After the blocks in the converging geometry and the base geometry, the lengths of the vortexes in the clockwise and counterclockwise directions are similar. However, in the diverging geometry, as the angle increases, the length of the vortex formed in the counterclockwise direction decreases. As can be seen from Figure 9, the increase in the angle increases the reattachment length. In Figure 10, the converging geometry decreases the reattachment length. The back of the last block resembles a backstep flow. In all cases except α = 6°, a second counterclockwise vortex forms at the lower end of the last block. The separation point of flow from the wall is defined as the point where the gradient of the velocity component parallel to the wall surface equals zero. This point also corresponds to the point where the shear stress is zero according to Newton’s law of viscosity. The adverse pressure gradient in the flow direction is therefore the most important parameter to determine the dimension of the recirculation zone [30]. In order to determine the reattachment lengths (RL) behind the last block, the shear stresses on the bottom wall after the last block are calculated by plotting them, as in Figure 9 and Figure 10, and the reattachment lengths at different velocities are compared and given in Table 6. The wall divergence increases the spreading rate of the shear layer, lengthens reattachment, and delays pressure recovery for separated flows [31].
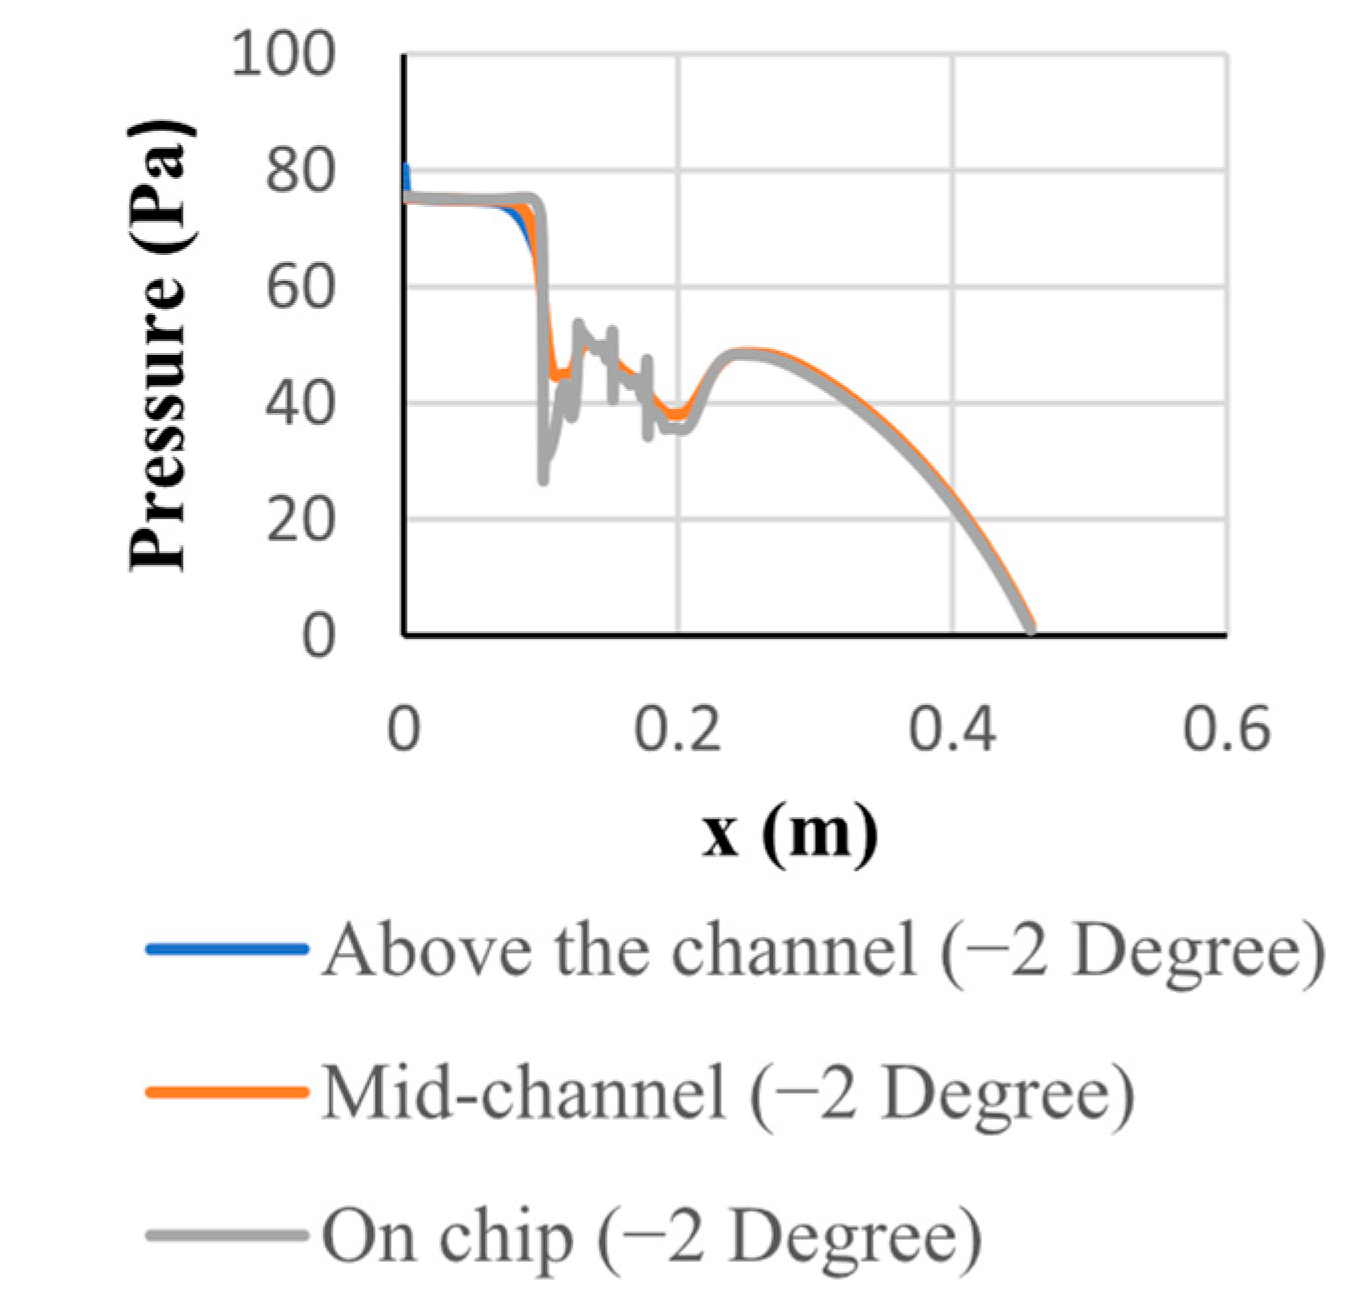
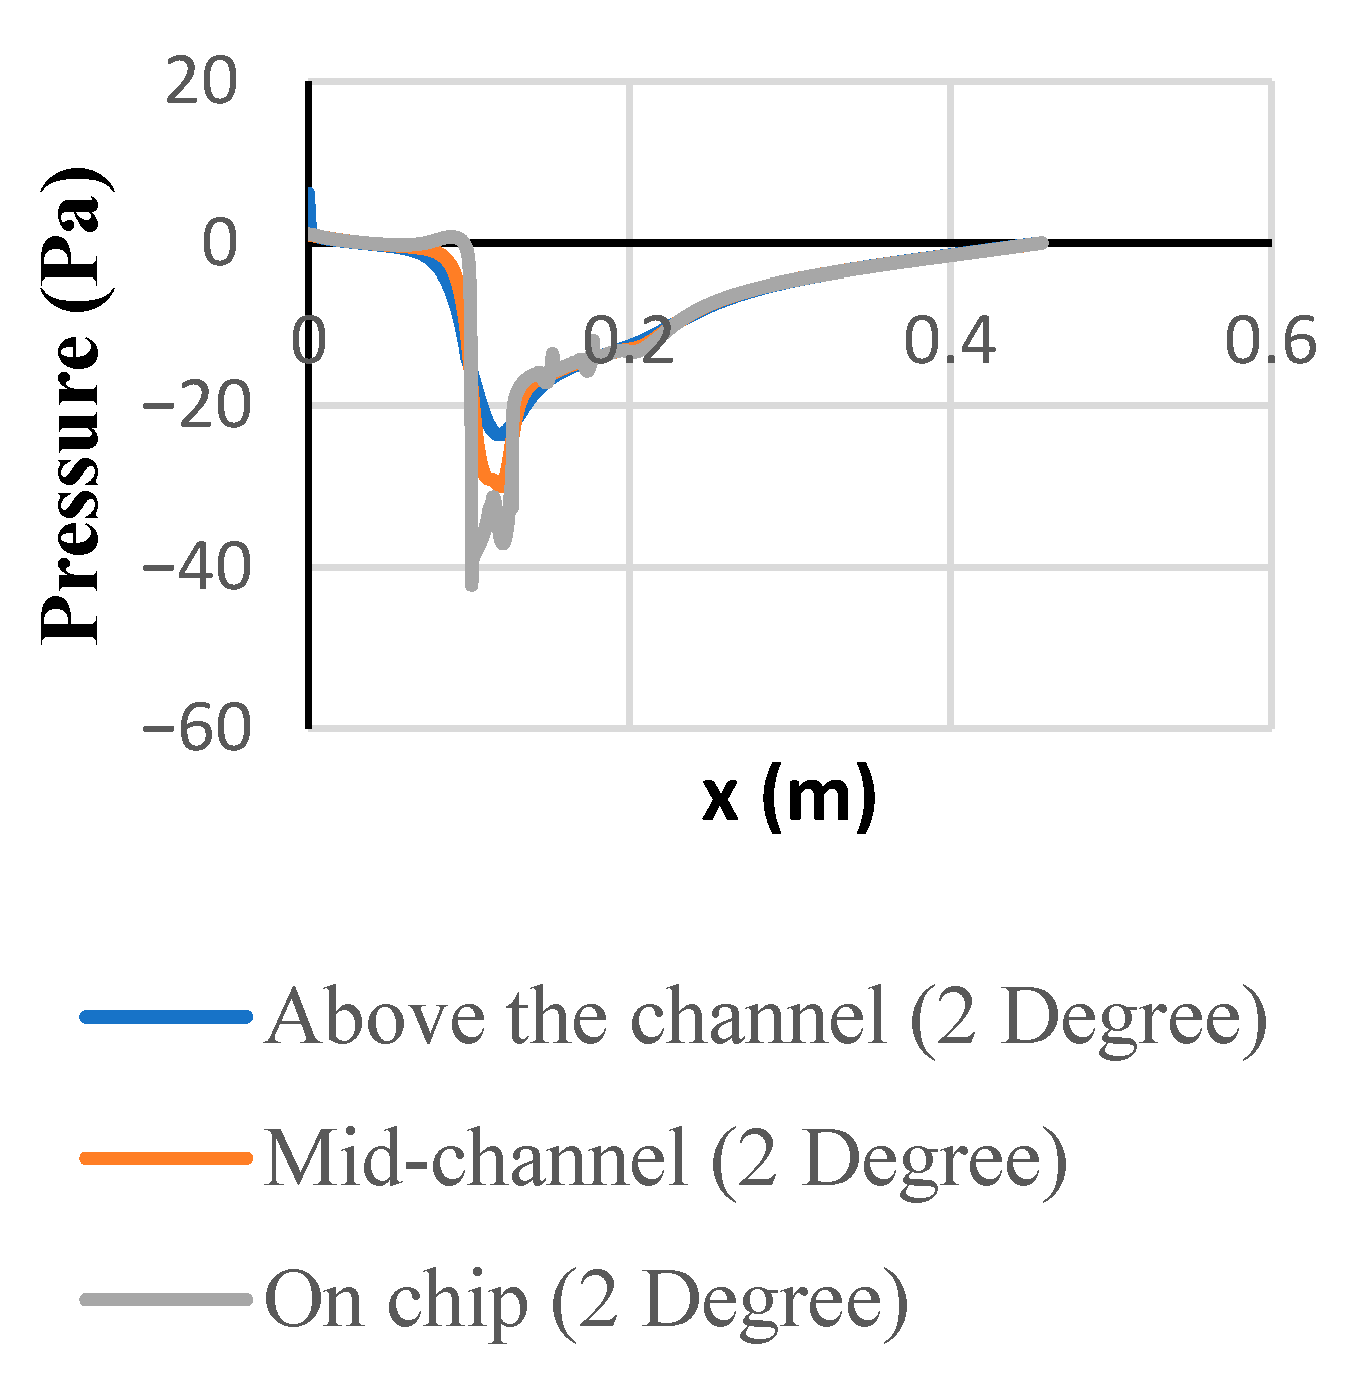
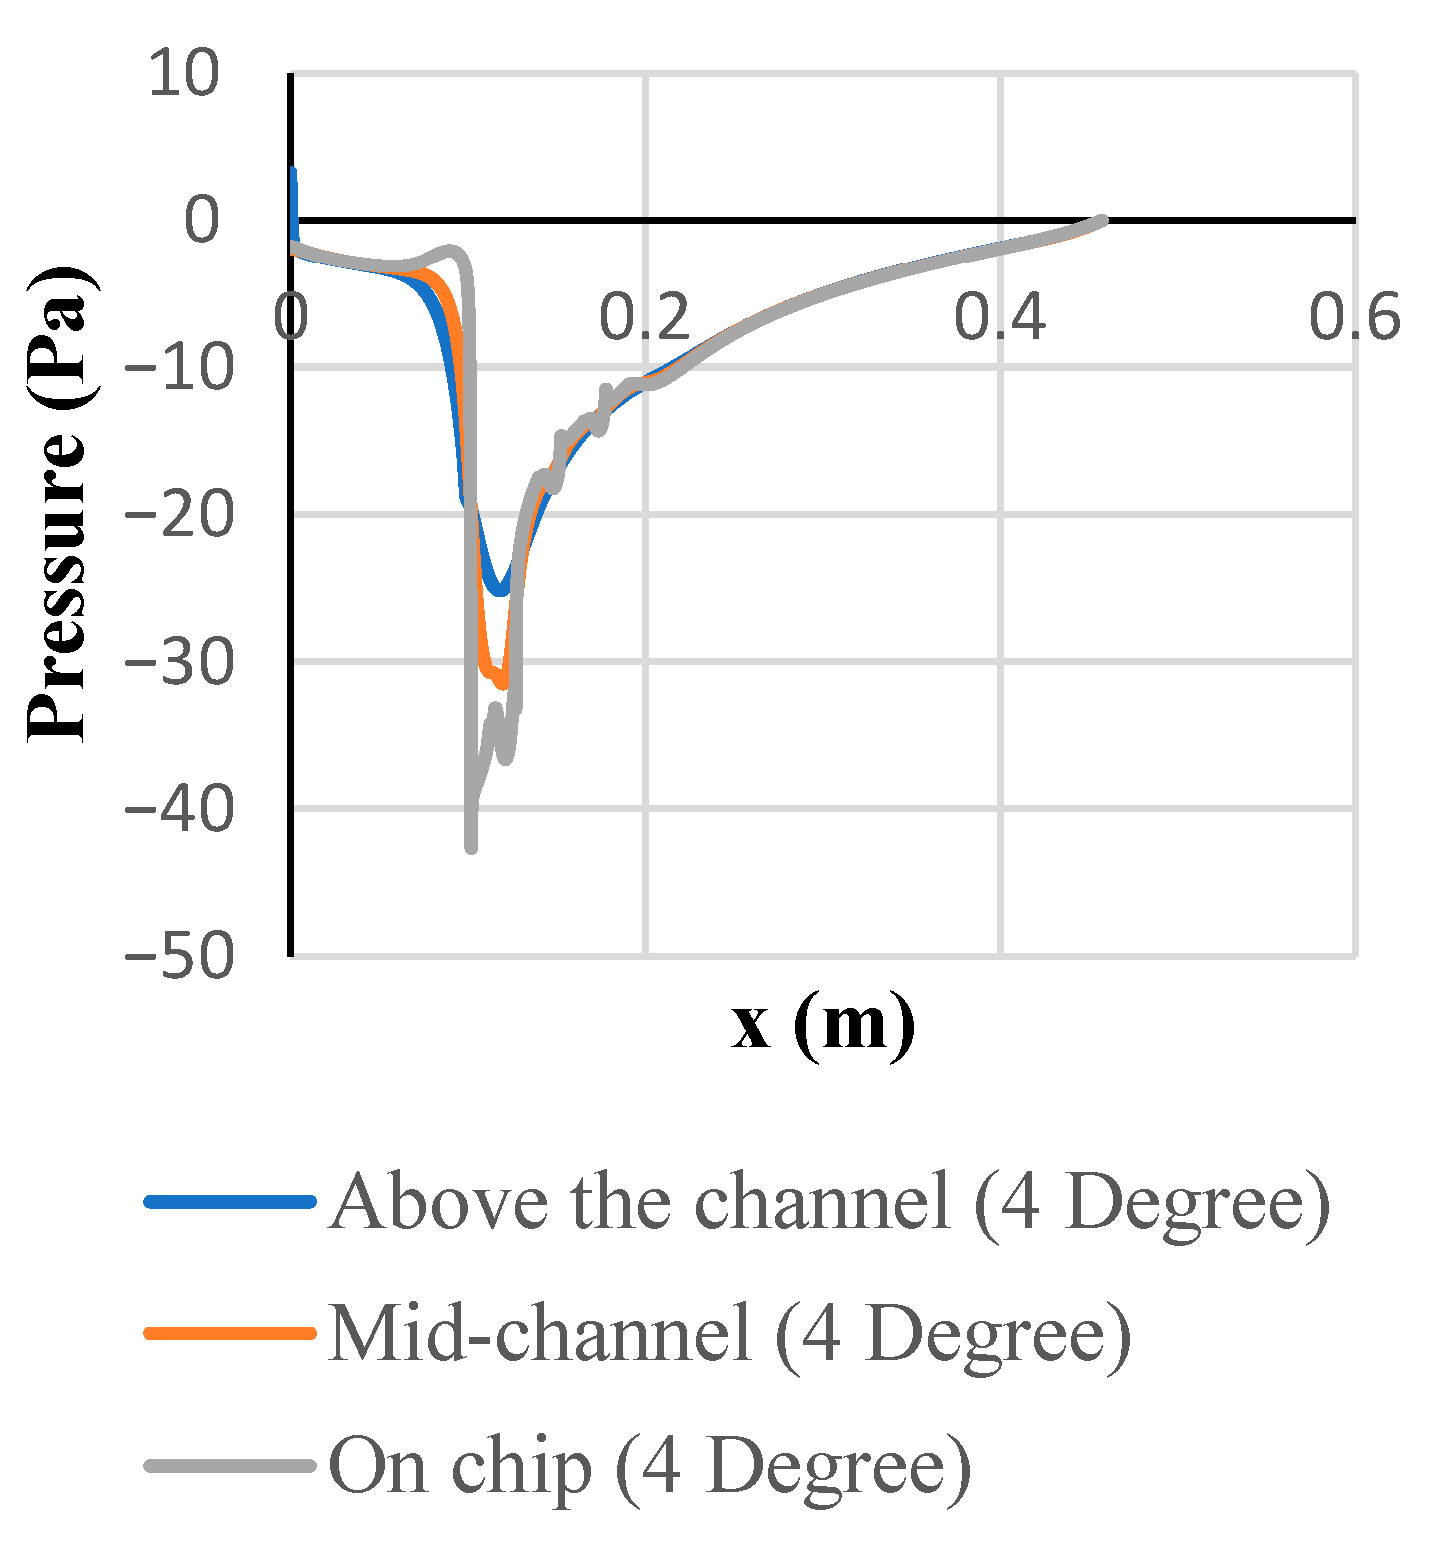
The pressure distributions as contours are given in Figure 11. In addition, in order to better understand the pressure changes caused by the blocks, the pressure values in the block top, channel middle, and channel top sections are plotted in Figure 12, Figure 13, Figure 14 and Figure 15. The lowest pressures occur on the first block except for the converging geometry. This situation should be attributed to the decrease in pressure according to Bernoulli’s principle, since the velocity increases on the block. In the converging geometry, the lowest pressure is obtained at the channel exit, with the highest velocity. In the converging geometry, the pressure gradient formed around the blocks is more homogeneous, and the low-pressure regions formed between the 1st and 2nd blocks in the diverging geometries do not occur. As can be seen from Figure 7, with the increase in the angle, the maximum velocity on the first block is 9.14 m/s for Figure 7c and decreases to 8.97 m/s and 8.80 m/s in d and e, and therefore, the pressures in Figure 11c–e have changed at almost the same rate as in Figure 7c–e. The minimum pressure in Figure 11c is −74.5 Pa, and the pressures in d and e are −74.4 Pa and −66.1 Pa. As the angle increases, as can be seen from Figure 13 and Figure 14, there is not much change in the inlet pressures in the middle of the channel. The inlet pressures are obtained as 0.92 for α = 2°, −1.95 Pa for α = 4° Pa, and −0.21 Pa for α = 6°. However, as the angle decreases, the inlet pressure increases (75.32 is obtained for α = −2°). In the base geometry, i.e., at α = 0°, this value is 12.73 Pa. The increase in pressure with the decrease in the angle increases the fan power that must be used.
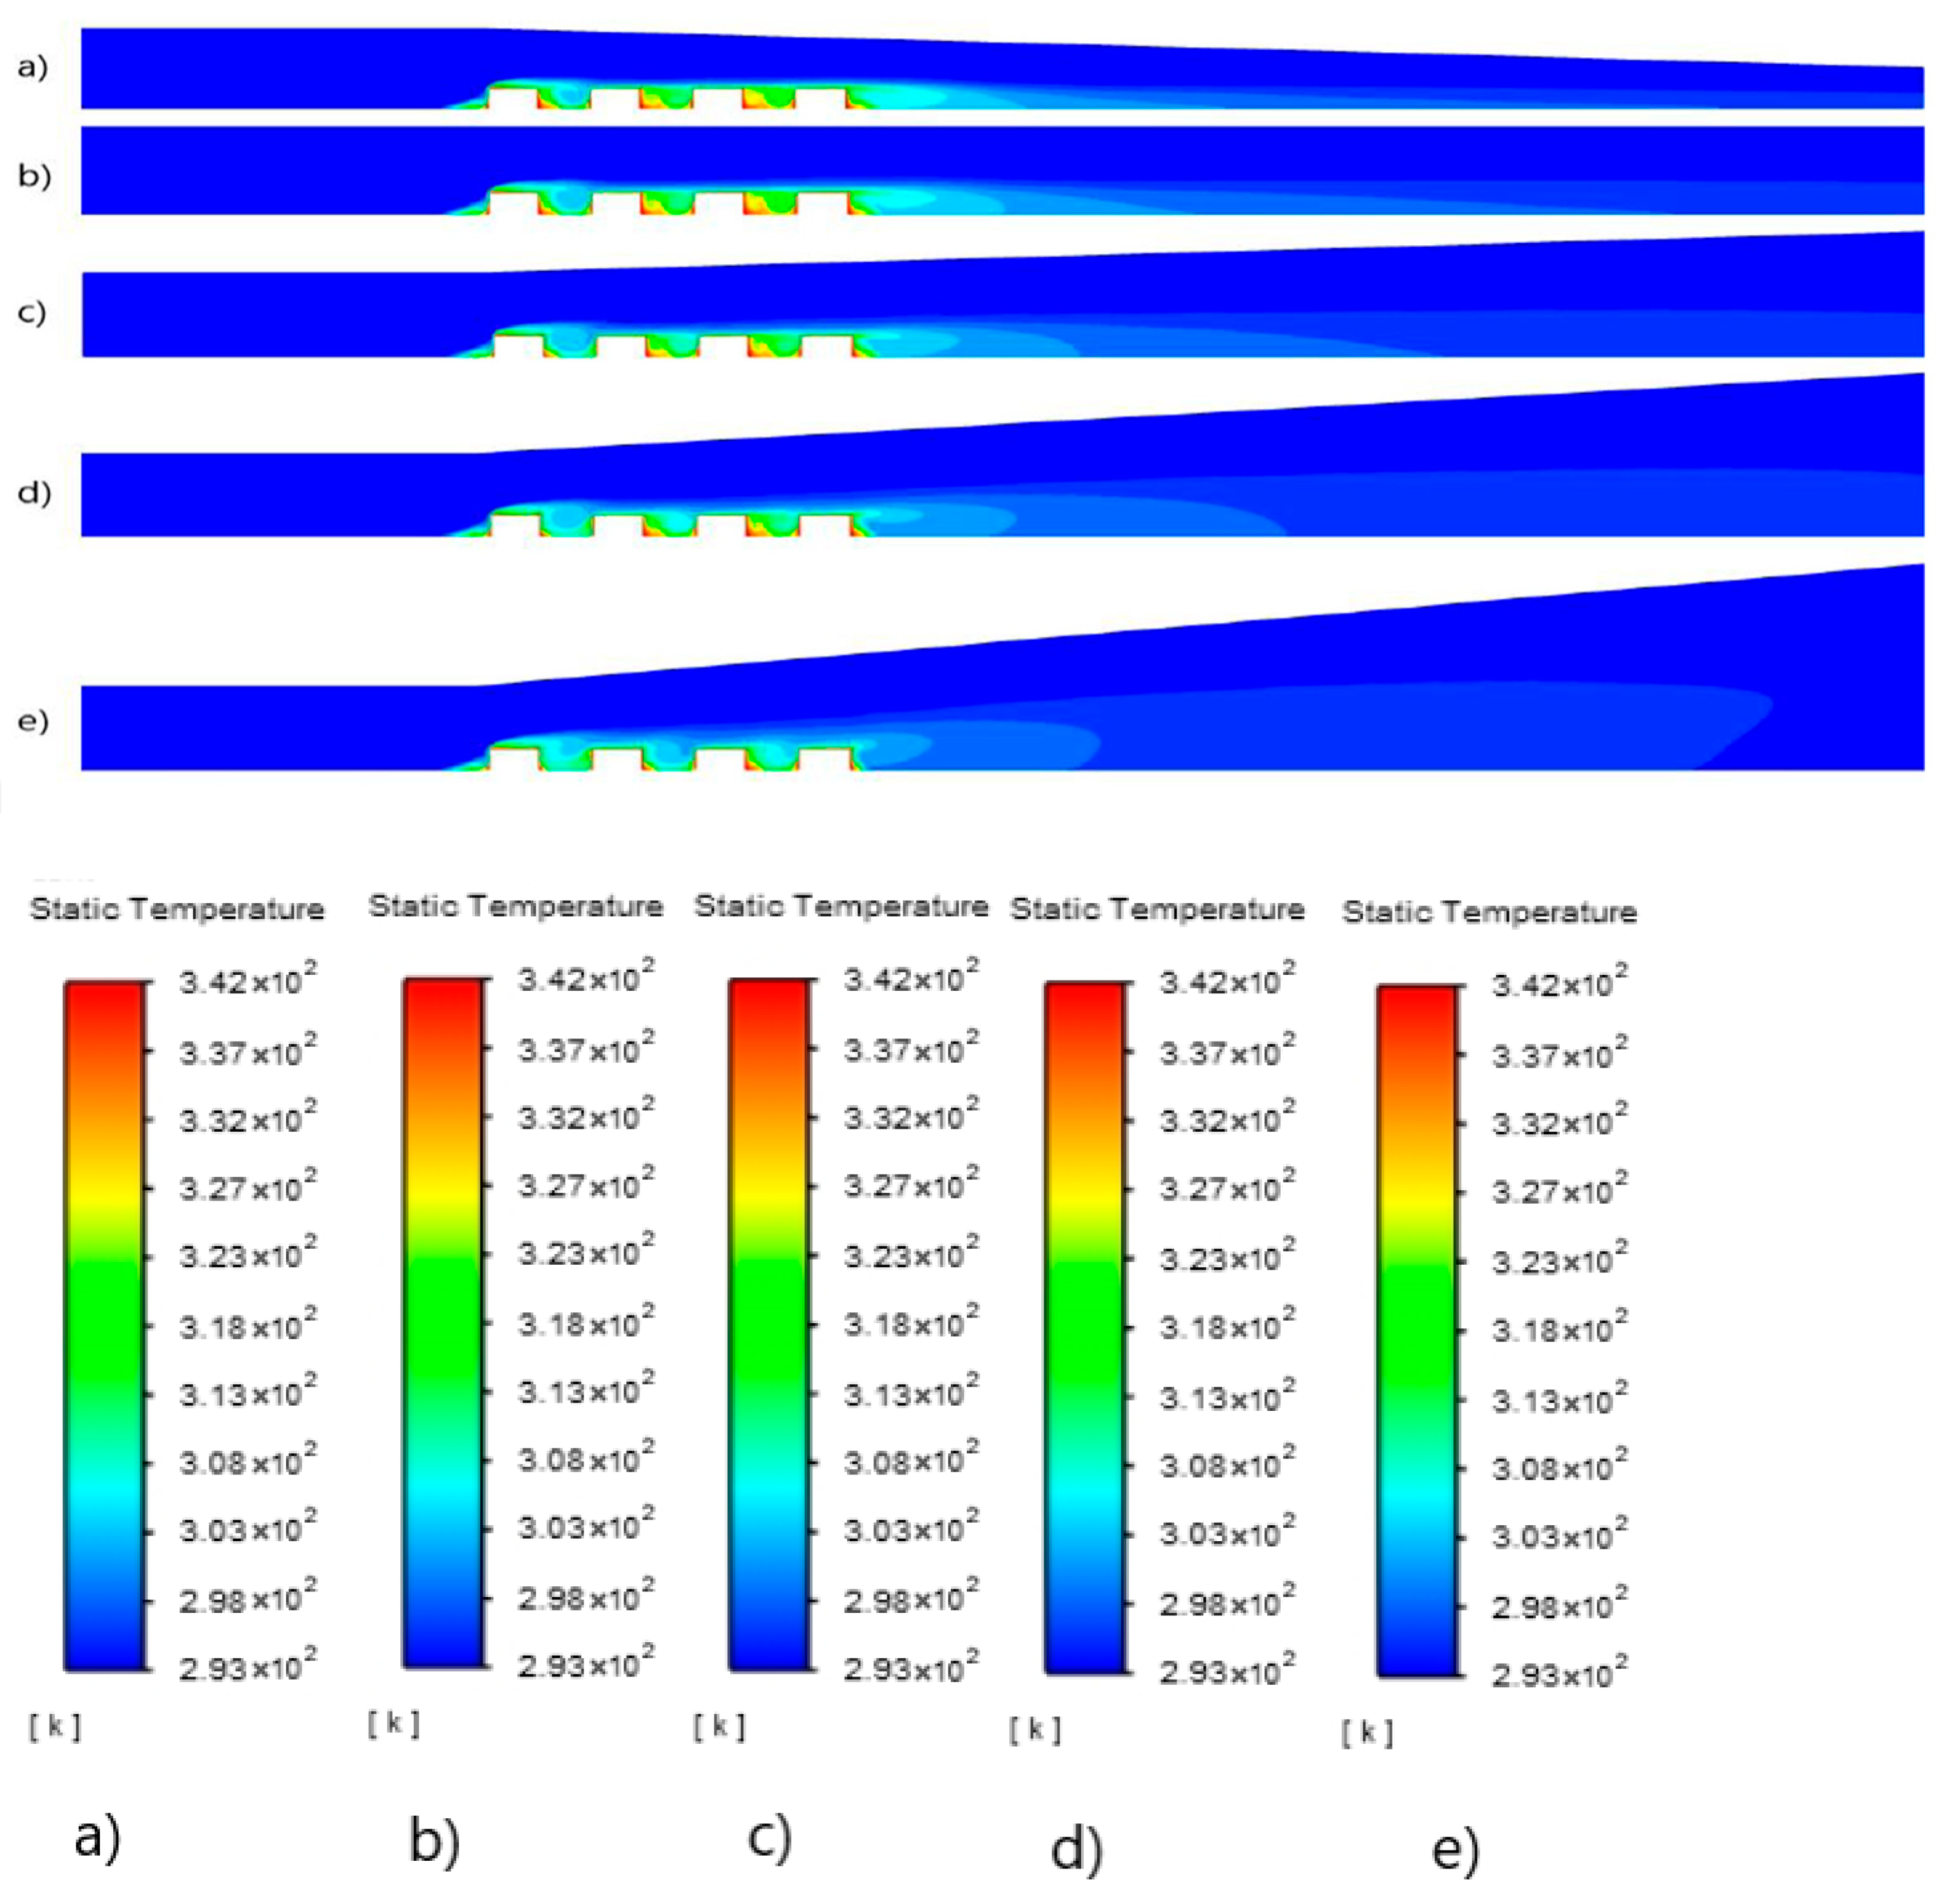
The temperature contours are given in Figure 16. Maximum temperatures occur at the front lower corner of the first block, between the blocks, and at the back lower corner of the last block. The vortex formed here hits the blocks and heats them up, and since the heated flow circulates again, the fluid temperature increases. The vortex formed behind the last block also heats up for the same reason, and the temperature spreads towards the middle of the channel. The temperature change shows its effect from the block surface to the channel bottom, and due to the inertia of the flow, the inlet temperature towards the channel ceiling does not change. In addition, the temperature effect at α = 6° does not reach the outlet. In all cases, the temperature effect is greater in the second and third and the pit after the chips. This situation can be attributed to the fact that the effect of the inlet air is greater in the pit after the second and third chips because it is heated in the first block. The area of effect of the temperature after the last block decreases with the increase in the angle.
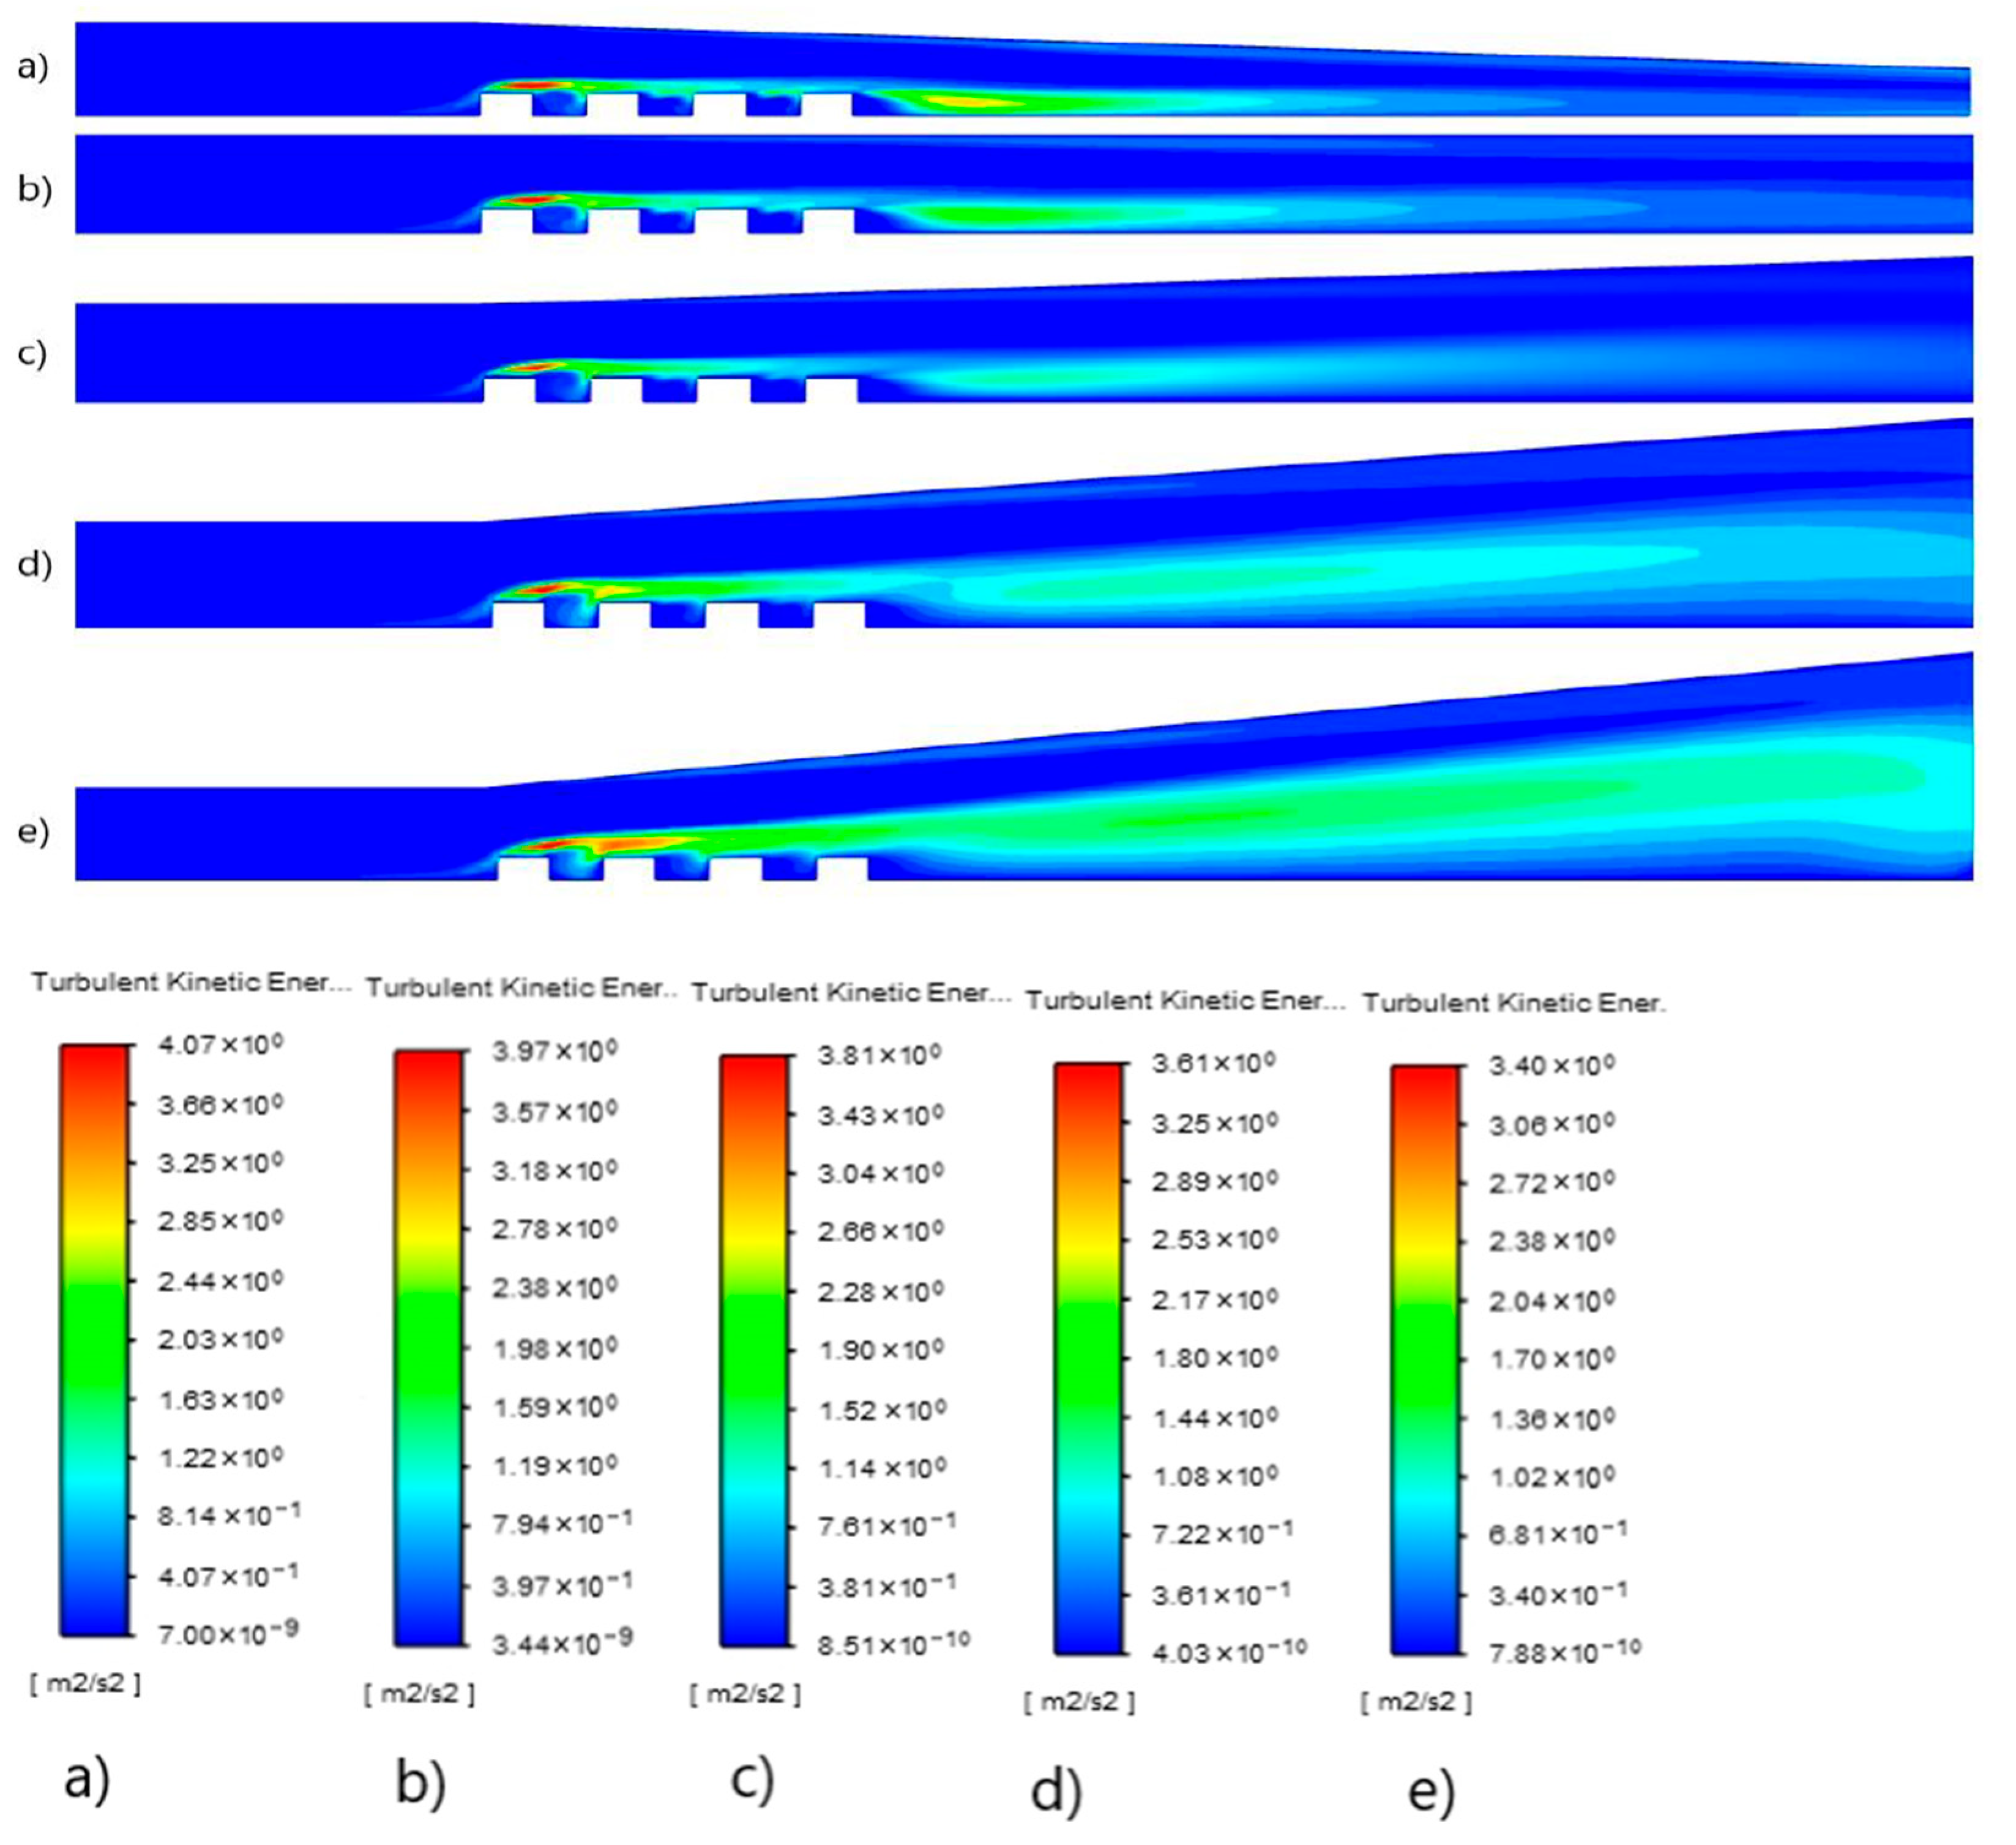
As can be seen from Figure 17, although the maximum kinetic energy occurs on the top of the first block, and spreads towards the top of the second block as the angle increases, the maximum value of their numerical values decreases with increasing divergence from 4.07 to 3.40 m2/s2. In addition, due to the vortex formed behind the last block, turbulent kinetic energies are high here and spread towards the exit and upper wall as the angle increases.

3.2. Local and Average Heat Transfer Coefficients

Calculations were performed for three different Reynolds numbers, which are defined as follows based on the channel inlet velocity and channel height (H):
R e = u H v
The convective heat transfer coefficient over heat sources is determined using Newton’s law of cooling, and the local convective heat transfer coefficient is given by:
h   =   q ( T     T s )
Average convective heat transfer coefficient is the arithmetic mean of the computed local heat transfer coefficients on the block surfaces. The local heat flux q is determined by applying Fourier’s law of heat conduction to the first mesh layer over the heat sources.
q = k   Δ T   Δ y
The Nusselt number (Nu) is a dimensionless parameter used in convection studies to reduce the total number of variables. The heat transfer coefficient h can be non-dimensionalized and converted into the Nusselt number, and it is defined according to the channel inlet height H as follows.
N u = hH k

3.3. Heat Transfer over Chips

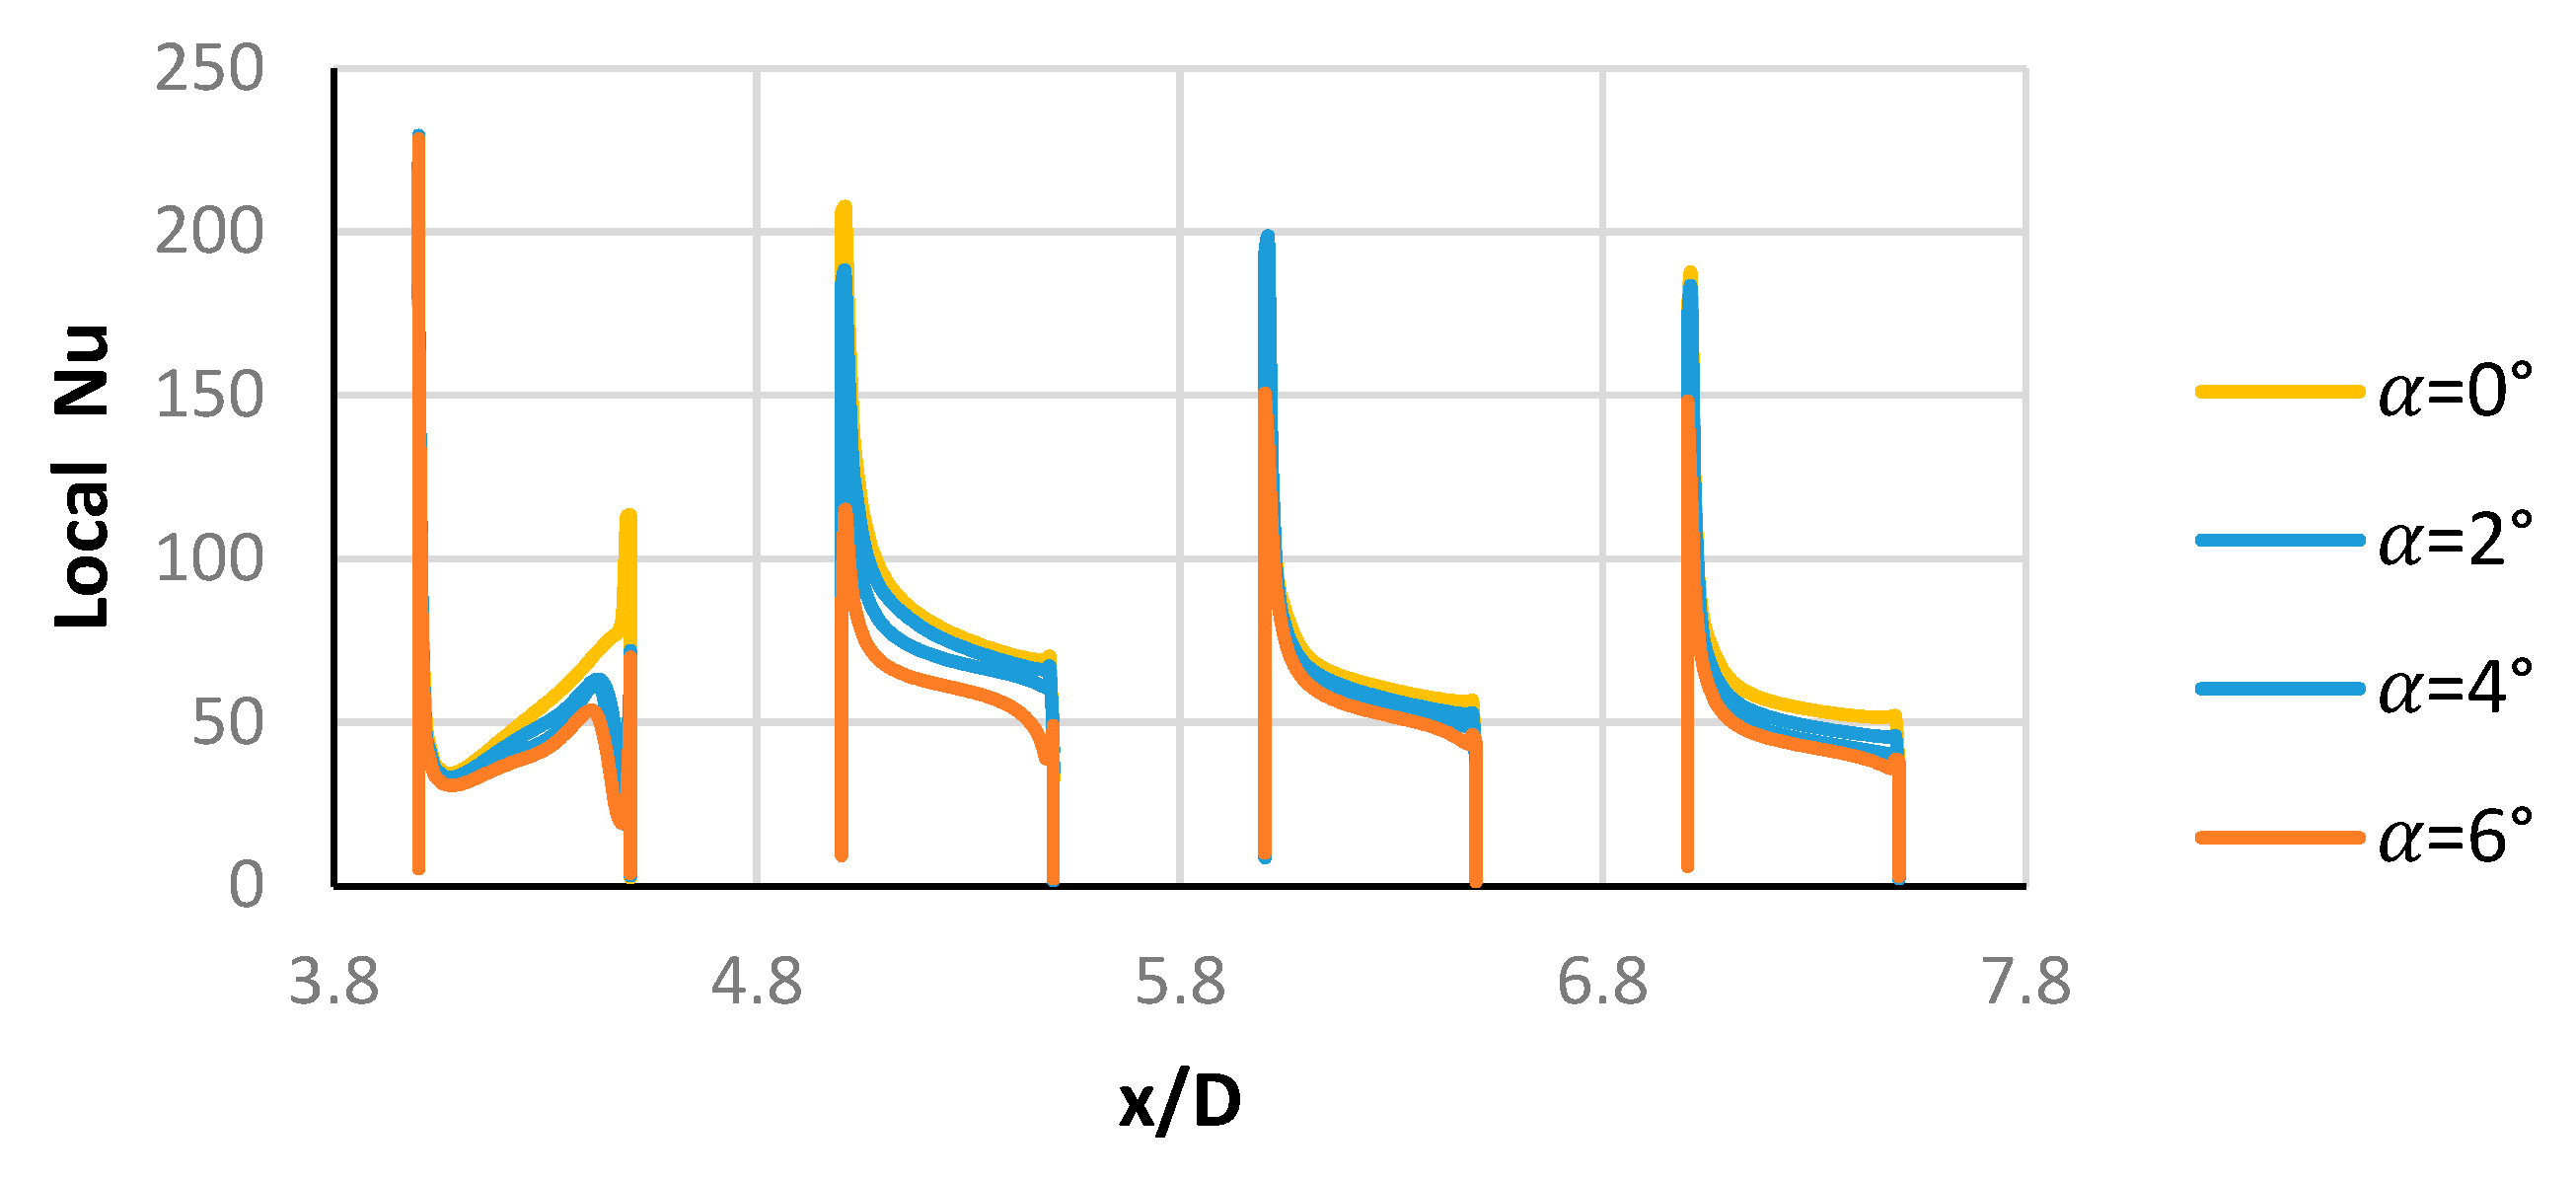
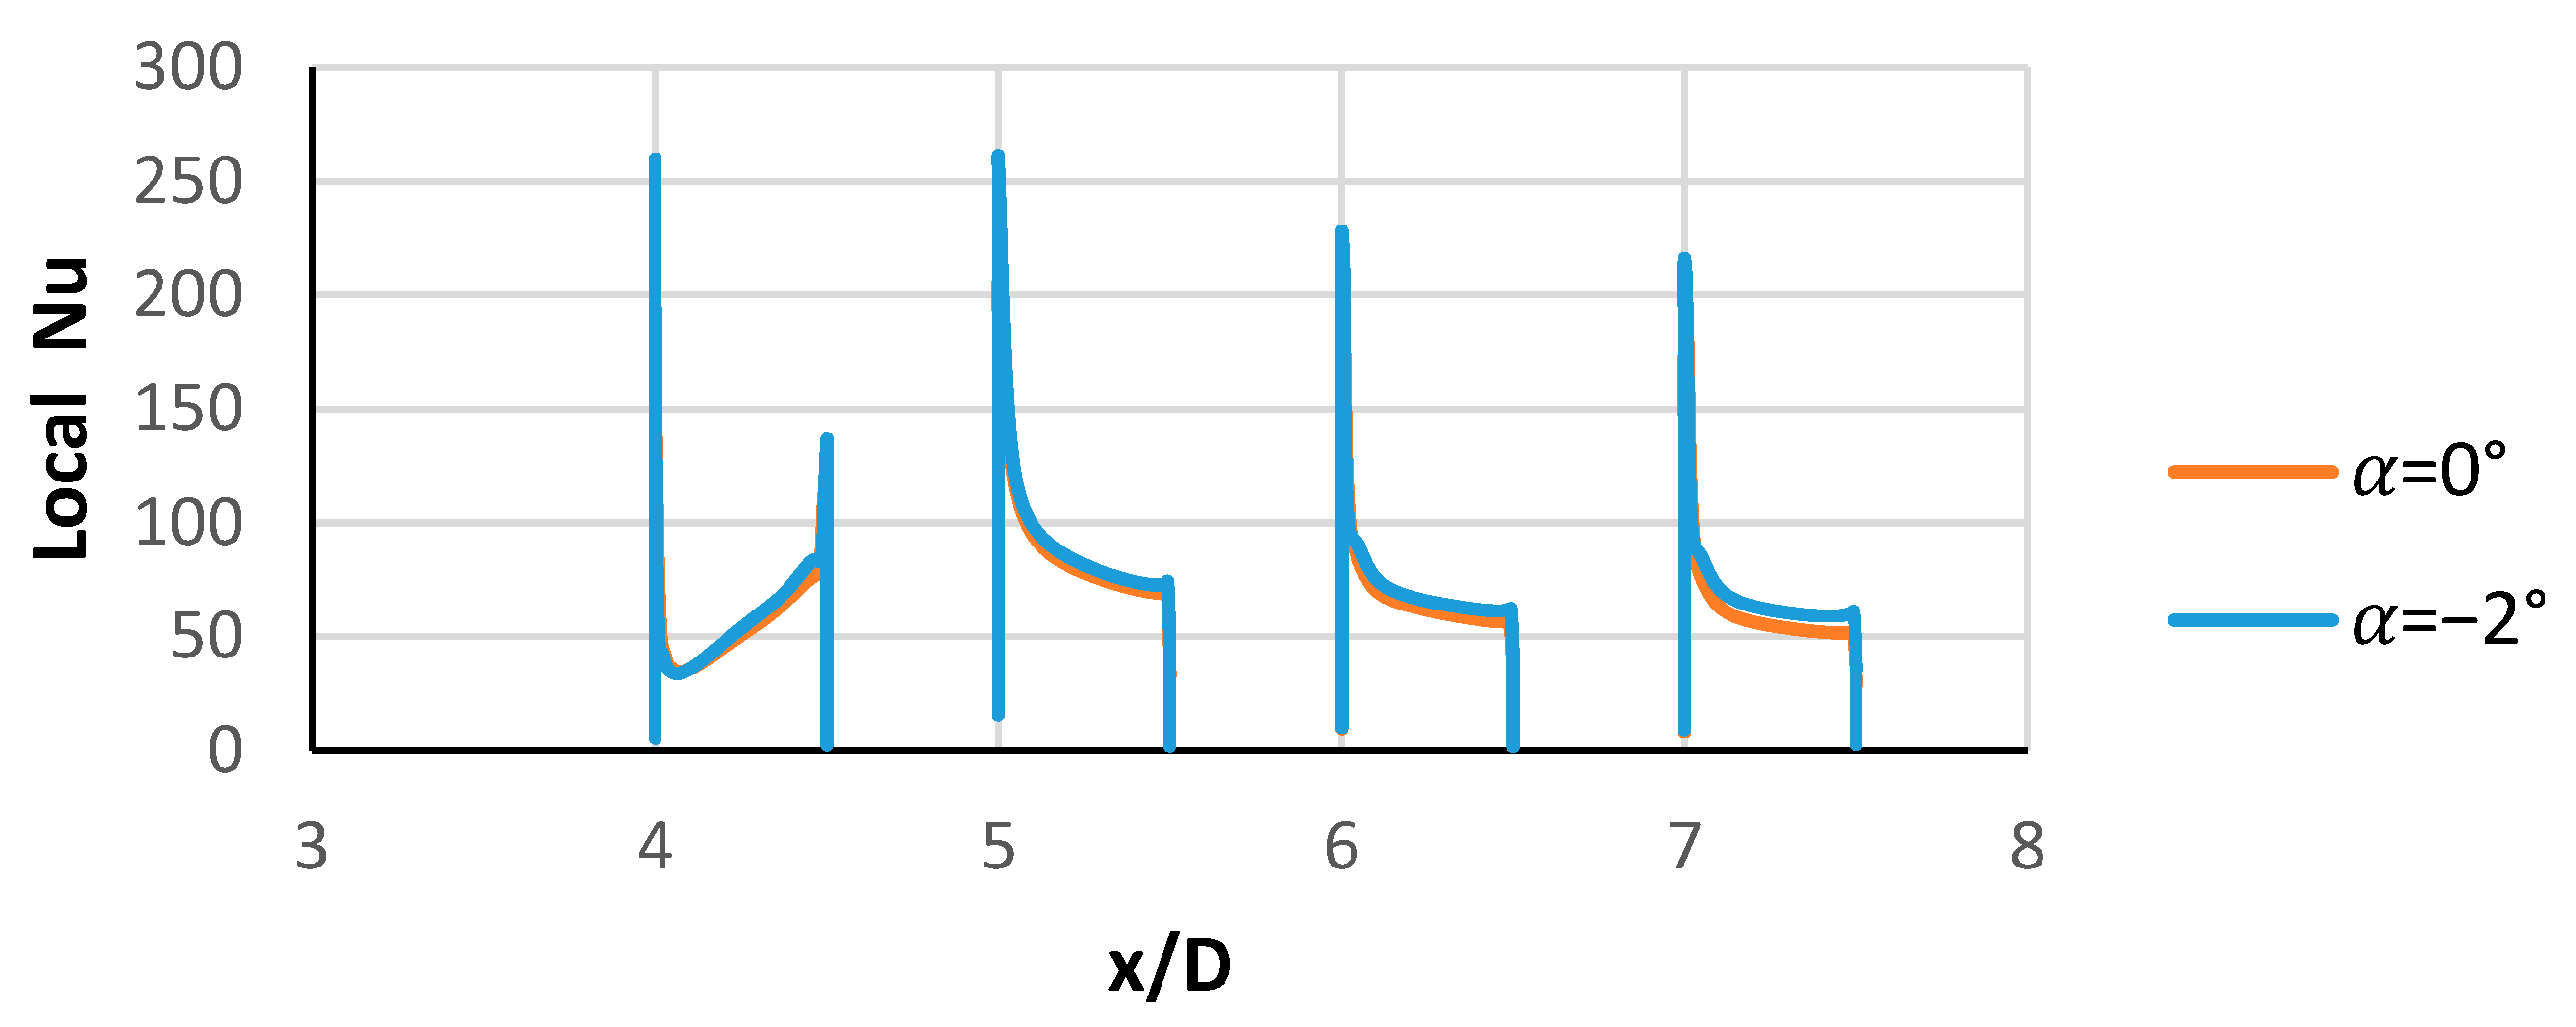
As seen from Figure 11, the lowest pressures occur on the first block except for the converging geometry. This situation should be attributed to the decrease in pressure according to Bernoulli’s principle, since the velocity increases on the block. In the converging geometry, the lowest pressure is obtained at the channel exit, with the highest velocity. That is, the increase in local velocity causes increased local heat transfer. The local heat transfer coefficients for the diverging (α = 2°, 4°, ve 6°) geometries are shown in Figure 18, while those for the converging (α = −2°) and baseline (α = 0°) geometries are presented in Figure 19. In Figure 18, the maximum local Nusselt number (Nu) for the diverging geometries is obtained at the leading edge of the first block. Figure 19 shows the maximum local Nu for the converging geometry on the second block. This phenomenon is generally attributed to the complex vortex structures around each block, which cause significant irregularities in the distribution of convective heat transfer [4]. Towards the end of the first block, the convective heat transfer coefficient increases in the converging geometry and exhibits a similar trend in the baseline geometry. On the second, third, and fourth blocks, the local convective heat transfer coefficient distributions resemble the flow behavior over a flat plate, as expected. A slight increase is observed towards the end of the blocks, which is attributed to a minor decrease in the fluid temperature. Regions with strong flow separation exhibit weak convective heat transfer, whereas areas where the flow reattaches demonstrate strong convective heat transfer. As seen in Figure 18, in diverging geometries (α = 2°, 4°, and 6°), the distribution of the local convective heat transfer coefficient decreases monotonically as the divergence angle increases. In diverging geometries, after an initial increase, the heat transfer coefficient at the rear edge of the first block drops sharply and then rises again, with this effect becoming more pronounced as the divergence angle increases. Unlike in the converging geometry, a similar pattern is also observed on the second block and, to a lesser extent, on the surfaces of the third and fourth blocks.
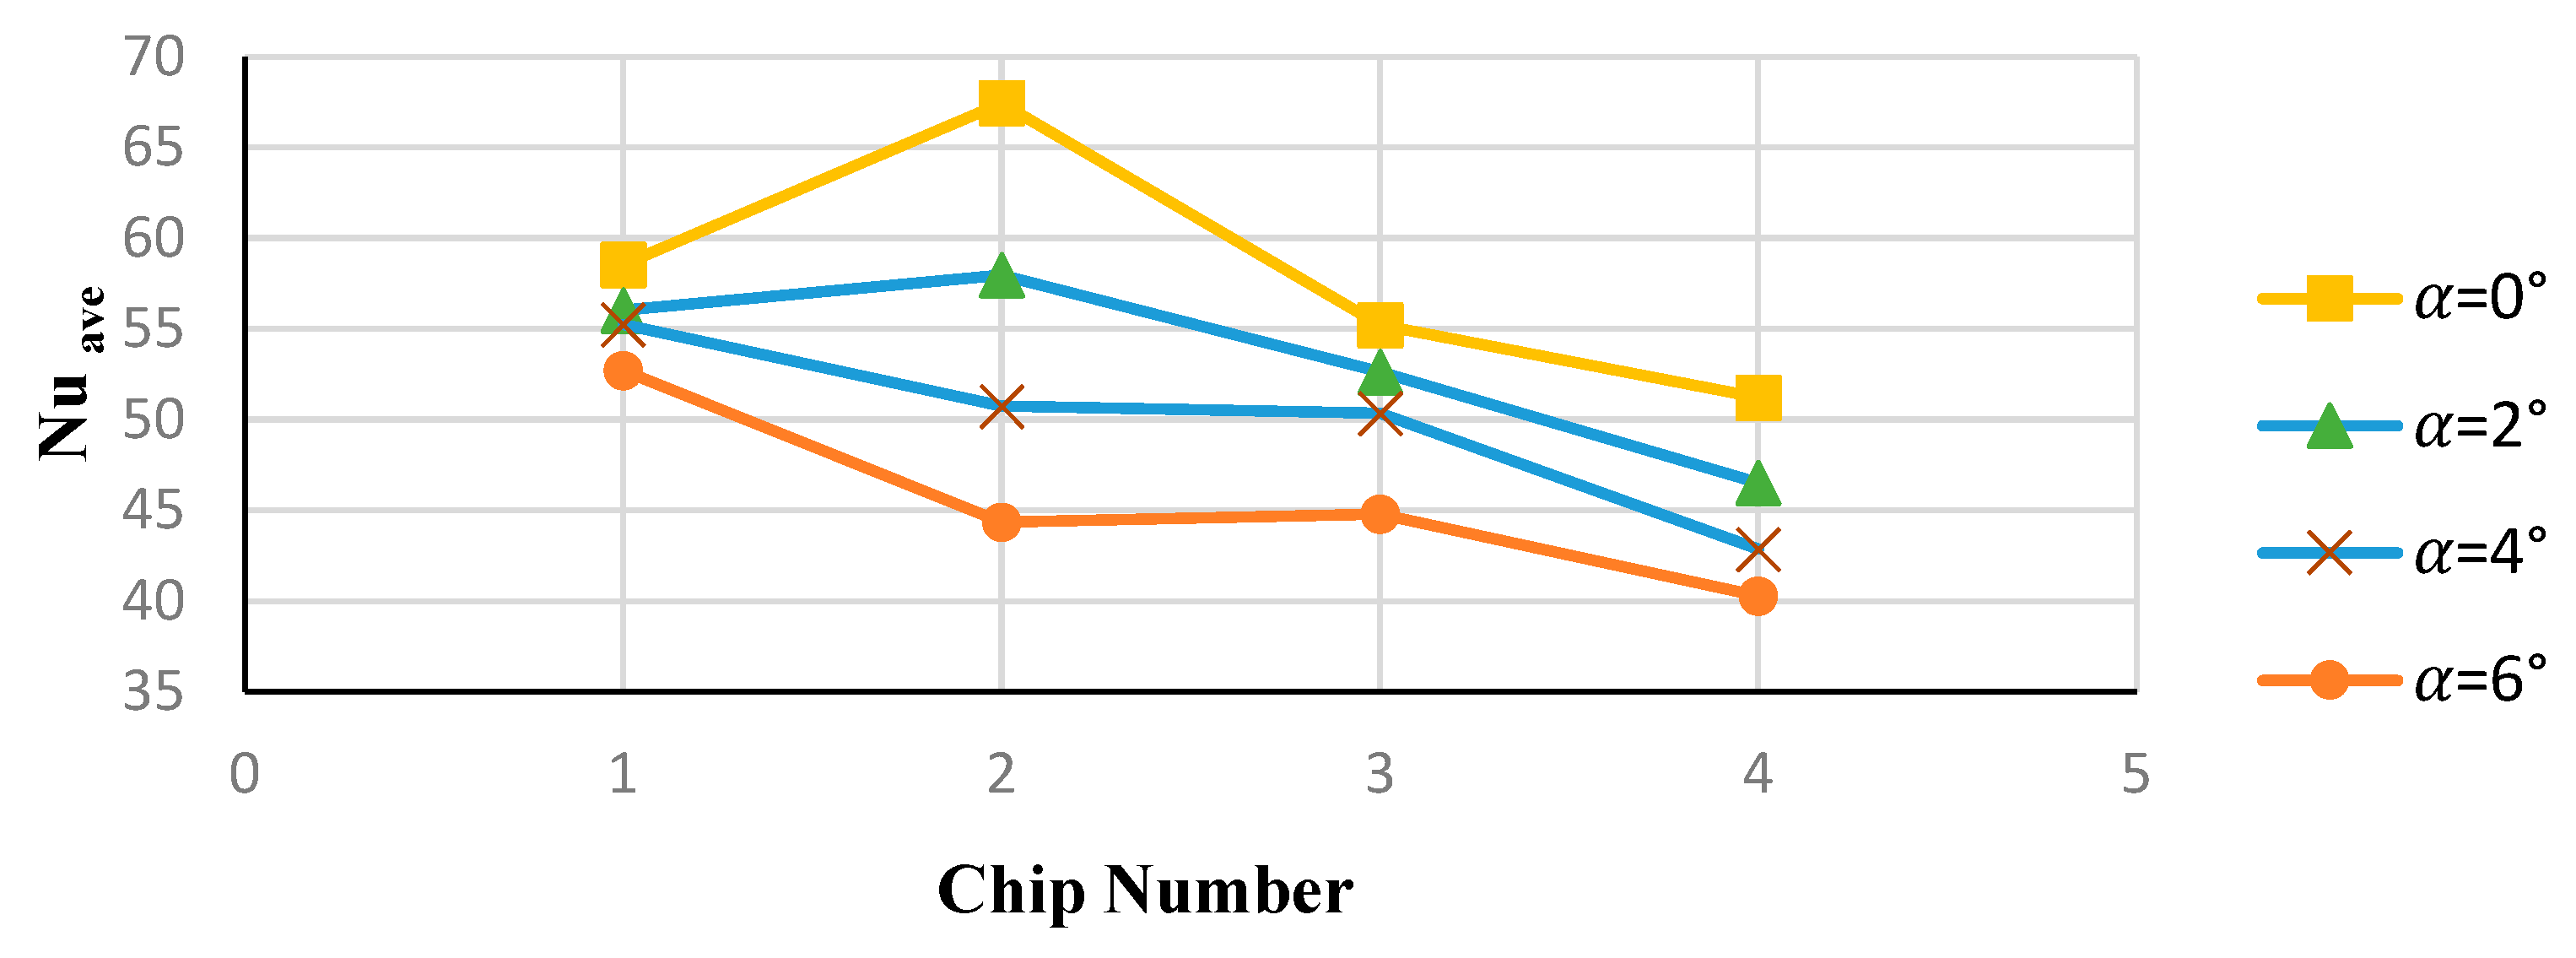
In Figure 20, the average Nusselt numbers for diverging geometries are provided, while Figure 21 shows the average Nusselt numbers for the converging geometry on the blocks. When calculating the average Nusselt number, not only the top surfaces of the blocks but also the front and rear surfaces were considered. The average Nusselt number is determined by taking the arithmetic mean of the local Nusselt numbers calculated at the mesh points closest to the surface. The first noticeable point in Figure 20 is the decrease in the average Nusselt number with the increasing divergence angle compared to the baseline geometry. For the baseline geometry and α = 2°, the highest Nusselt number is obtained on the second block, while for α = 4° and α = 6°, the highest average Nusselt number is obtained on the first block. In all cases, the lowest Nusselt number is observed on the last chip. Figure 21 shows the average Nusselt numbers for the converging geometry on the blocks. The convergence angle follows a similar trend to the baseline geometry. The highest average Nusselt number is obtained on the second chip. The converging angle increases the average Nusselt number. Table 5 provides the average Nusselt numbers for all angles, and as can be seen, the highest heat transfer rate (64.57) is achieved at α = −2°.
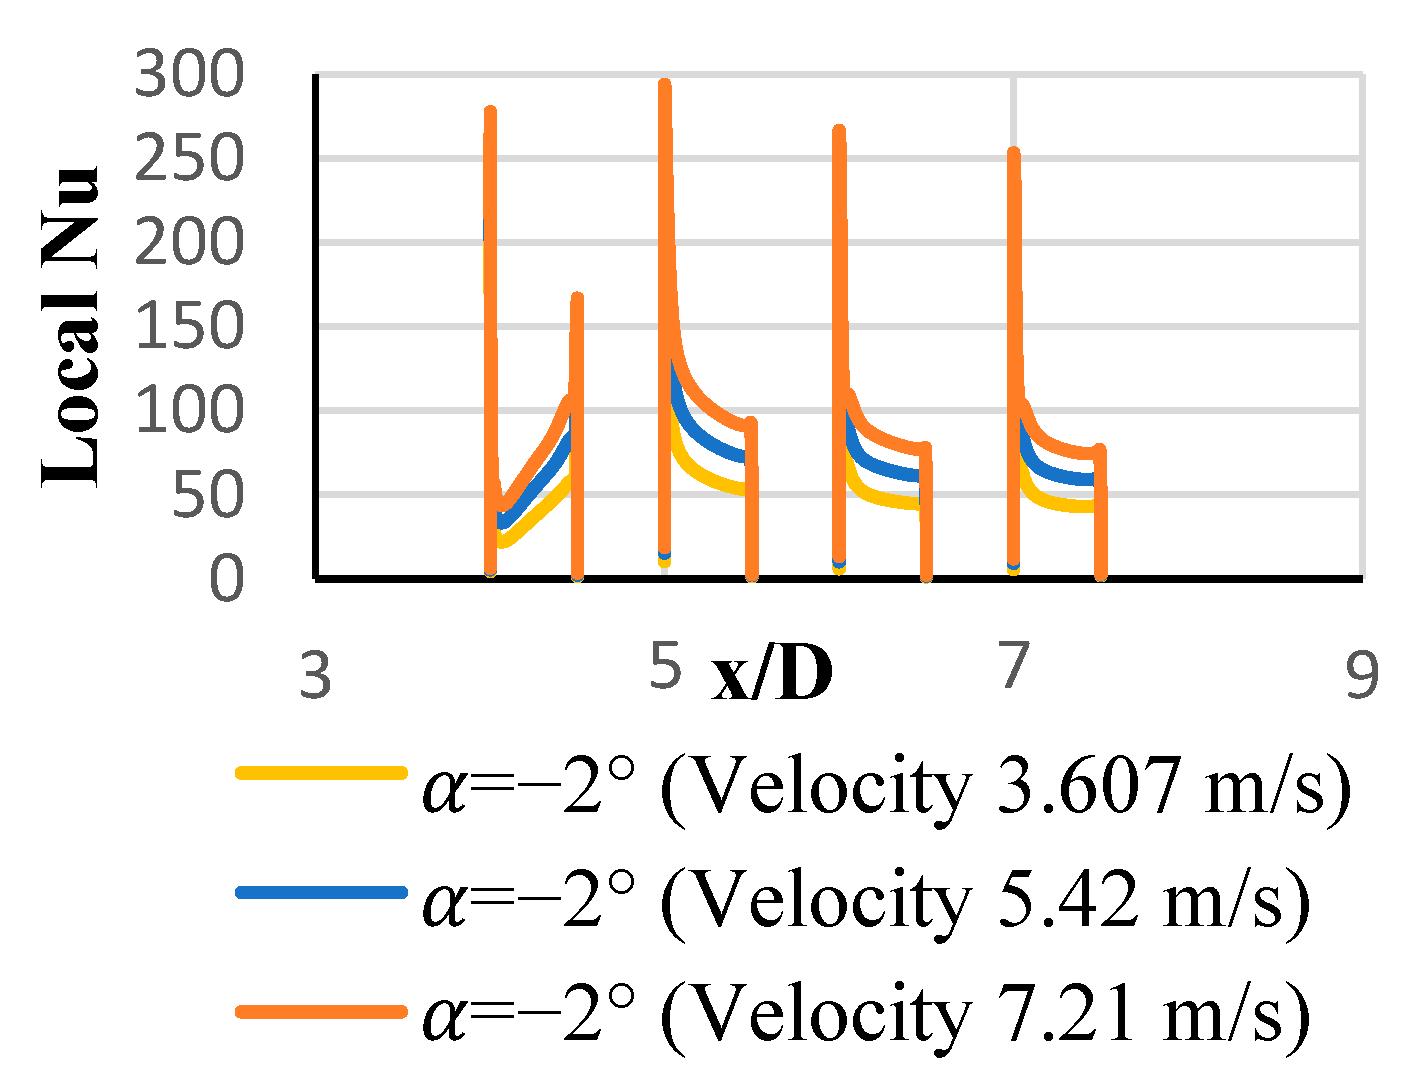
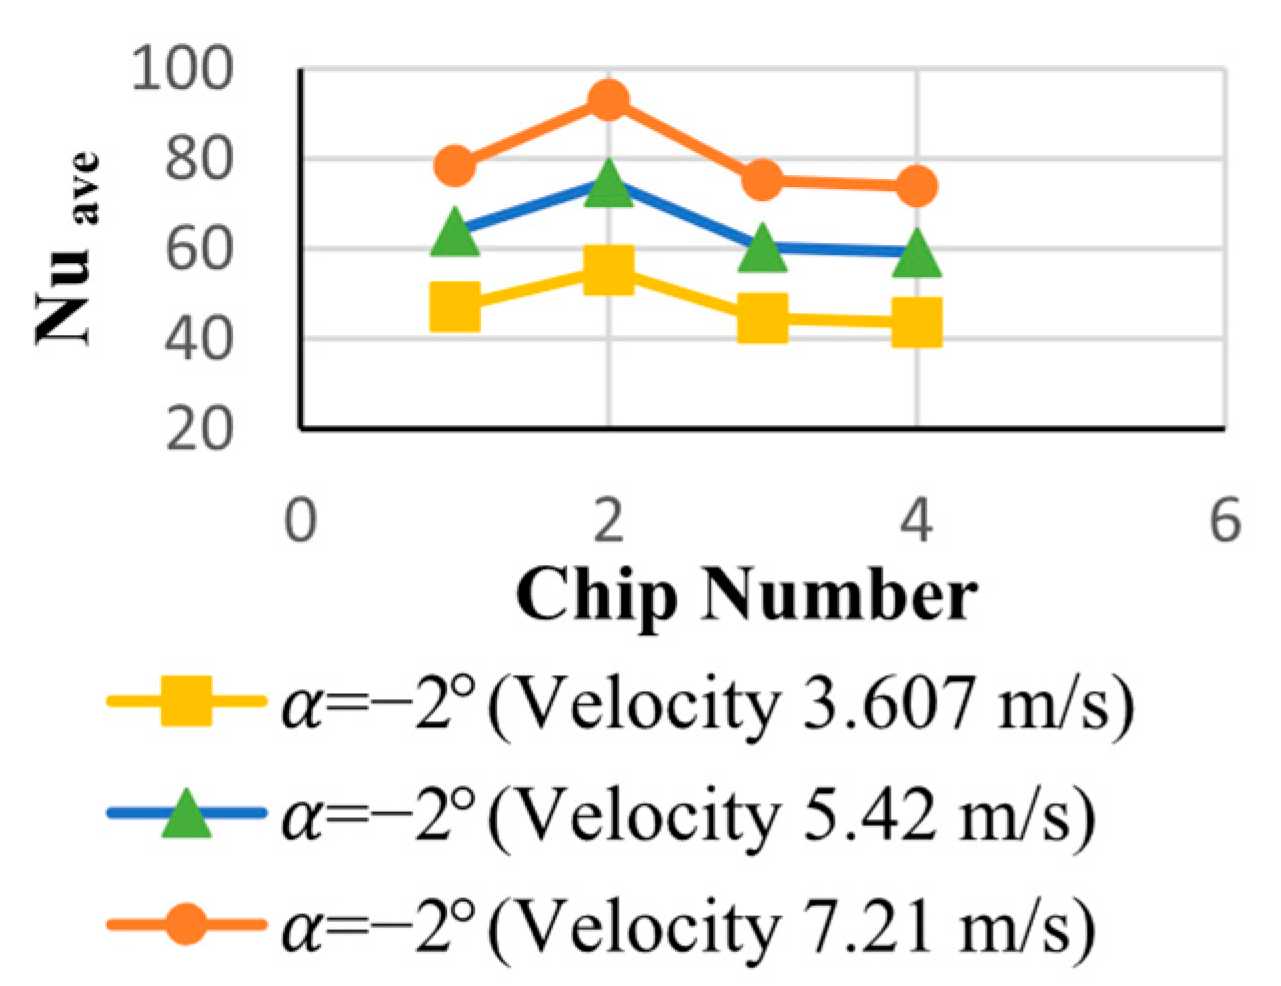
As seen in Figure 22 and Figure 23, increasing the velocity for α = −2° has led to an increase in both the local and average Nusselt numbers. At all velocities, the highest local and average Nusselt numbers are obtained on the second chip, while the lowest average Nusselt number is observed on the fourth chip.
In α = 0° (Base case), the flow attaches at the top of the second chip, and a high convective heat transfer rate at this face is attributed to this flow attachment by Meinders et al. 1998 [4]. This phenomenon for the second chip is also attributed to the interaction with the horseshoe vortex and main flow in the 3D flow [4]. In this 2D study, a high convective heat transfer rate in the second chip can be only attributed to the flow attachment at the top surface for α = −2°, 0°, and 2°. As is known, another heat transfer enhancement mechanism is the turbulence phenomenon. Maximum local turbulent kinetic energy appears on the second half of the top of the first block, and dissipates towards the second block, thereby maximizing the enhancement of local heat transfer on the second block, as seen in Figure 17. However, the maximum value of turbulent kinetic energy decreases from 4.07 to 3.40 m2/s2 with increasing divergence angle from 4 degrees to 6 degrees. For the divergence angles of 4° and 6°, since the corresponding turbulent kinetic energy decreases 3.61 and 3.40 m2/s2, by considering all surfaces of the second block, not only the top surface in the calculation of the overall heat transfer for the second block, this increase in heat transfer due to turbulence is not sufficient to maximize the average Nusselt number of the second block. Therefore, the average Nusselt number of the second block tends to be the highest for only the cases of divergence angles of −2°, 0°, and 2°.
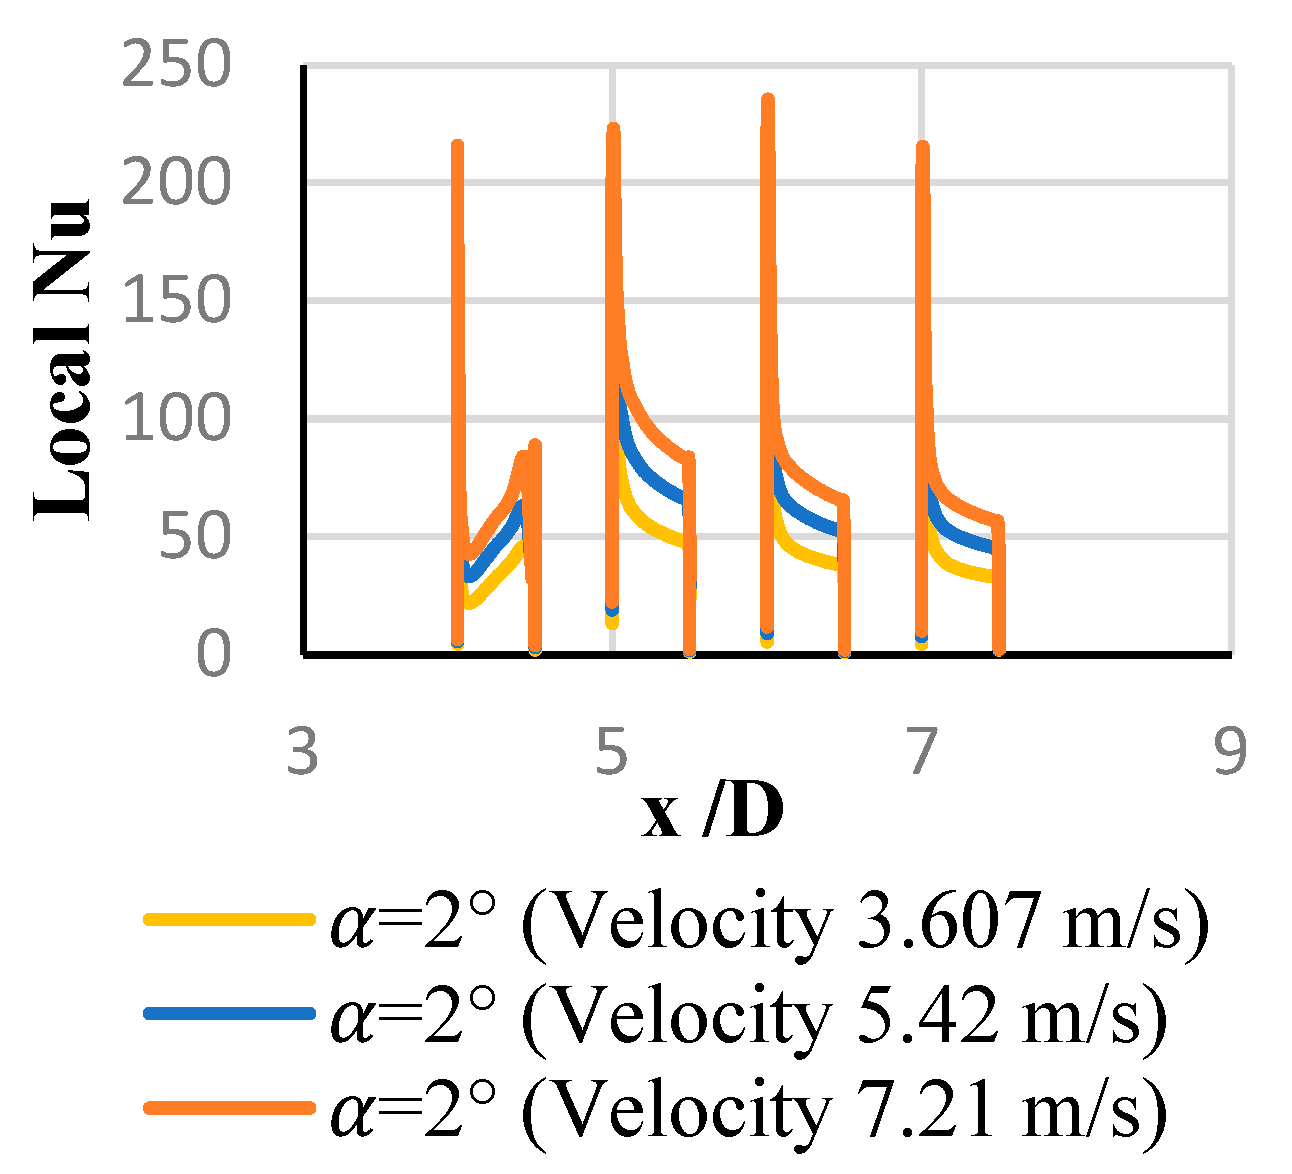
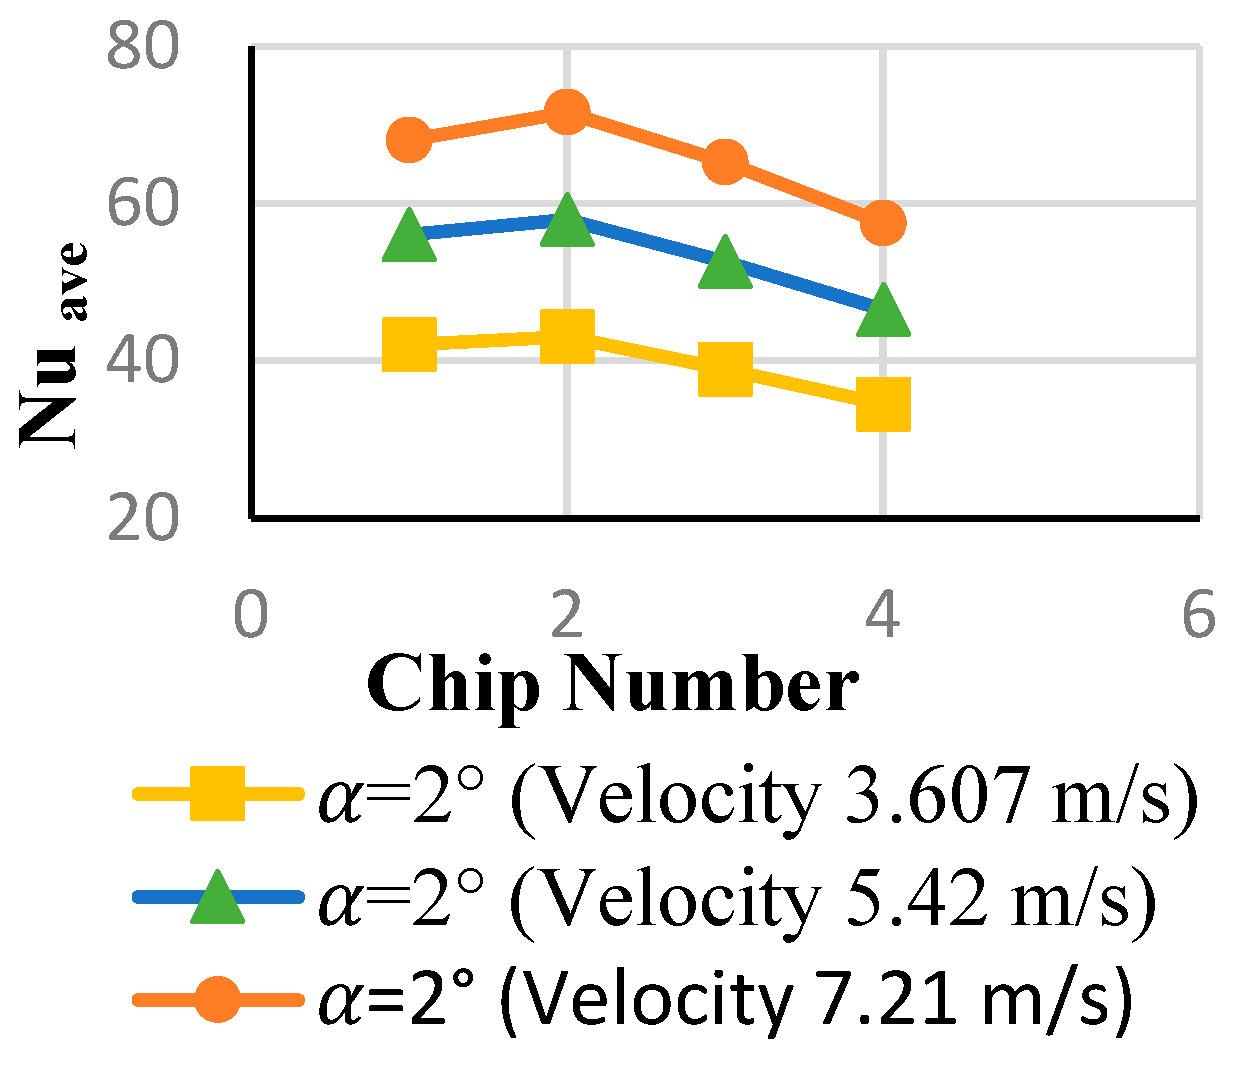
Increasing the velocity for α = 2°, as seen in Figure 24 and Figure 25, has led to an increase in both the local and average Nusselt numbers. At all velocities, the highest local Nusselt number is obtained on the third chip. The highest average Nusselt number is obtained on the second chip, while the lowest average Nusselt number is observed on the fourth chip.
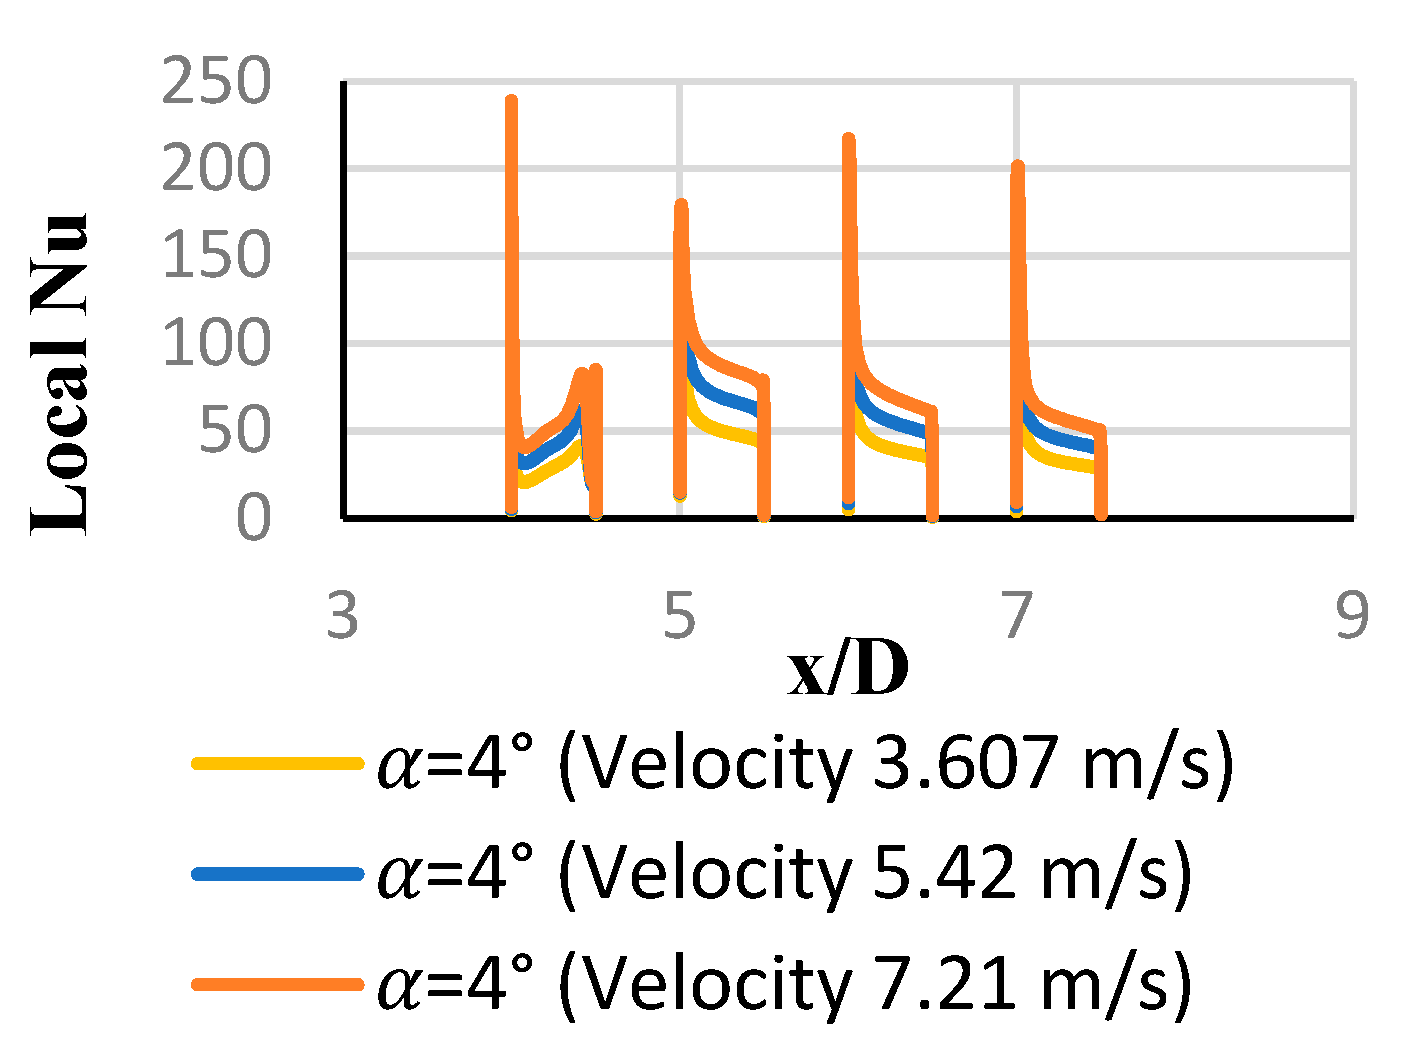
Increasing the velocity for α = 4°, as seen in Figure 26 and Figure 27, has led to an increase in both the local and average Nusselt numbers. At all velocities, the highest local Nusselt number is obtained on the first chip. Except for the velocity of 3.607 m/s, the highest average Nusselt number is obtained on the first chip, while 3.607 m/s is obtained on the second chip. In all cases, the lowest average Nusselt number is observed on the last chip.
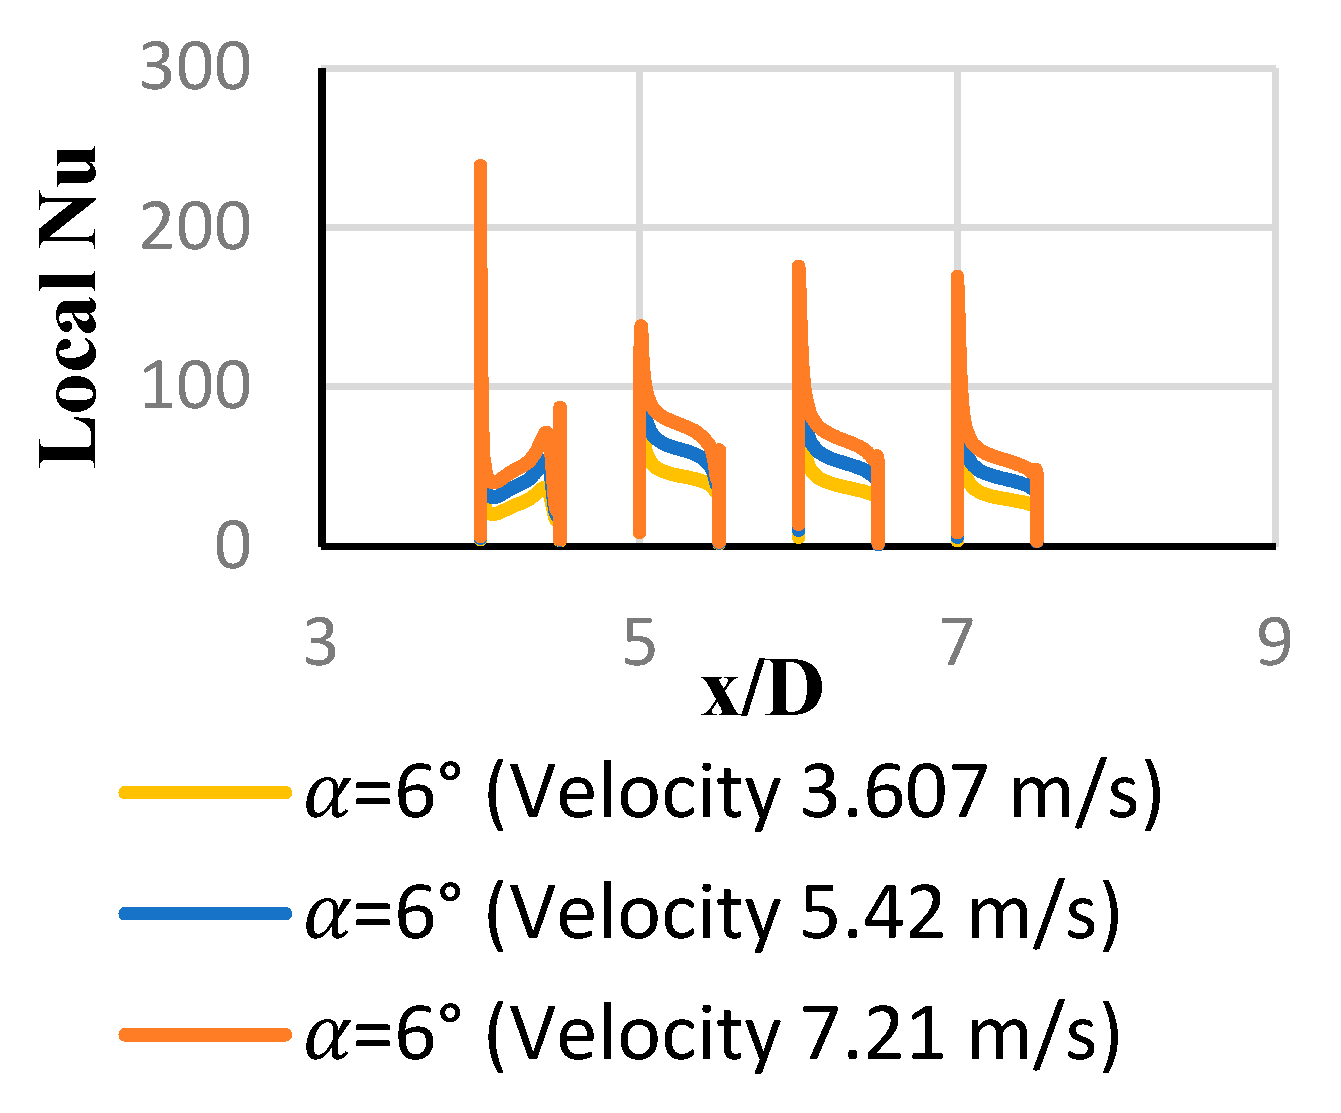
Increasing the velocity (Re number) for α = 6°, as seen in Figure 28 and Figure 29, has led to an increase in both the local and average Nusselt numbers. At all velocities, the highest local and average Nusselt numbers are obtained on the first chip. In all cases, the lowest average Nusselt number is observed on the last chip. In the 12 analyses conducted, the effect of the pressure gradient on heat transfer was examined, and the highest average Nusselt number was found to be 80.07 at Re = 11,993 (Velocity = 7.21 m/s) and α = −2°. It was observed that in the case of converging angles, heat transfer increased, while in the case of diverging angles, heat transfer decreased (Angles were taken as −2°, 0°, 2°, 4°, and 6°) [32].
As seen in Table 6, in all velocities, the increase in inclination angles has increased the reattachment lengths. In all velocities with convergence angles, the reattachment length has decreased. The increase in Reynolds number results in a slight change in the reattachment lengths. It was observed in their study that increasing the angle in divergent flows increases the reattachment length [31]. Ateş [33] found that increasing the angle in a positive direction increases the reattachment length in his study.

4. Conclusions

In the analysis of pressure gradient effects in two-dimensional geometries, it was found that, except for the converging geometry, there is an increase in velocity after the contraction at the first block, with the velocity increase gradually decreasing. In diverging geometries, the increase in angle led to an increase in the reattachment length, while in converging geometries, the reattachment length decreased as the angle increased. In converging geometries, the pressure increased slightly after the blocks and near the exit, then decreased toward the exit and reached its minimum. In diverging geometries, the pressure variation continued until the channel exited.
Maximum kinetic energy formed at the top of the first block, and as the angle increased, it spread toward the second block. Increasing the velocity in all angles led to an increase in both local and average Nusselt numbers. As seen in Table 5, increasing the diverging angle reduced heat transfer, whereas increasing the converging angle enhanced heat transfer compared to the baseline geometry. In conclusion, considering the effect of pressure gradient, the best heat transfer was achieved at α = −2°.

Author Contributions

Conceptualization, D.G. and E.P.; methodology, D.G. and E.P.; software, D.G. and E.P.; validation, D.G. and E.P.; formal analysis, D.G. and E.P.; investigation, D.G. and E.P.; resources, D.G. and E.P.; data curation, D.G.; writing—original draft preparation, D.G.; writing—review and editing, D.G.; visualization, D.G.; supervision, D.G. and E.P.; project administration, D.G. and E.P.; funding acquisition, D.G. All authors have read and agreed to the published version of the manuscript.

Funding

This research received no external funding.

Informed Consent Statement

Not applicable.

Data Availability Statement

The data used to support the findings of this study are included within the article.

Conflicts of Interest

The authors declare no conflicts of interest.

Abbreviations

CFDComputational Fluid Dynamics
Exp.Experimental
Num.Numerical
RLReattachment Length
RNG k-ɛRenormalization Group k-ɛ Turbulence Model
SIMPLESemi-Implicit Method for Pressure-Linked Equations
SIMLECSemi-Implicit Method for Pressure-Linked Equations Consistent
SST k-ω Shear Stress Transport k-ω Turbulence Model
2DTwo-Dimensional
3DThree-Dimensional
Symbols
Avg.Average
hChip height [m], local convective heat transfer coefficient [W/m2·K]
haveAverage heat transfer coefficient [W/m2·K]
HChannel inlet height [m]
kTurbulent kinetic energy [m2/s2], Conductivity [W/mK]
LChip (Block) length [m]
NuLocal Nusselt number [=hH/k]
NuaveAverage Nusselt number [=haveH/k]
ReReynolds number [=uH/ν]
SDistance between chips [m]
TChannel inlet temperature [K]
TsSurface temperature [K]
UUniform channel inlet velocity [m/s]
αUpper plate inclination angle (Divergence angle) [°]
ωSpecific dissipation rate [=ε/k]
νKinematic viscosity [m2/s]

References

  1. Bar-Cohen, A.; Watwe, A.A.; Prasher, R.S. Heat transfer in electronic equipment. In Heat Transfer Handbook, 2nd ed.; Bejan, A., Kraus, A.D., Eds.; Wiley: Hoboken, NJ, USA, 2007; pp. 947–1028. [Google Scholar]
  2. Barton, I.E. The entrance effect of laminar flow over a backward-facing step geometry. Int. J. Numer. Methods Fluids 1997, 25, 633–644. [Google Scholar] [CrossRef]
  3. Pulat, E. Simulation of Forced Convection Cooling of Microelectronic Circuit Components. Doctoral Dissertation, Bursa Uludağ University, Bursa, Turkey, 1997. [Google Scholar]
  4. Meinders, E.R.; Van Der Meer, T.H.; Hanjalić, K. Local convective heat transfer from an array of wall-mounted cubes. Int. J. Heat Mass Transf. 1998, 41, 335–346. [Google Scholar] [CrossRef]
  5. Xu, G.P.; Tou, K.W.; Tso, C.P. Numerical modelling of turbulent heat transfer from discrete heat sources in a liquid-cooled channel. Int. J. Heat Mass Transf. 1998, 41, 1157–1166. [Google Scholar] [CrossRef]
  6. Pulat, E.; Öge, A.İ.; Karagöz, İ. Three-dimensional simulation of flow and temperature distribution over a surface-mounted block. In Proceedings of the ULIBTK’99 12th Turkish National Conference on Thermal Sciences and Technologies, Conference Proceeding, Sakarya, Türkiye, 28–29 February 2000; Volume 1. [Google Scholar]
  7. Etemoğlu, A.B.; İşman, M.K.; Pulat, E.; Can, M. Analysis of cooling of single-chip electronic devices under laminar and turbulent flow. Eng. Mach. 2004, 45, 18–28. [Google Scholar]
  8. Mathews, R.N.; ve Balaji, C. Numerical simulation of conjugate, turbulent mixed convection heat transfer in a vertical channel with discrete heat sources. Int. Commun. Heat Mass Transf. 2006, 33, 908–916. [Google Scholar] [CrossRef]
  9. Ratnam, G.S.; Vengadesan, S. Performance of two-equation turbulence models for prediction of flow and heat transfer over a wall-mounted cube. Int. J. Heat Mass Transf. 2008, 51, 2834–2846. [Google Scholar] [CrossRef]
  10. Gavara, M. Natural convection in a vertical channel with arrays of flush-mounted heaters on opposite conductive walls. Numer. Heat Transf. Part A Appl. 2012, 62, 111–135. [Google Scholar] [CrossRef]
  11. Aylı, E.; Bayer, O.; Aradağ, S. Experimental investigation and CFD analysis of rectangular profile fins in a square channel for forced convection regimes. Int. J. Therm. Sci. 2016, 109, 279–290. [Google Scholar] [CrossRef]
  12. Durgam, S.; Venkateshan, S.P.; Sundararajan, T. Experimental and numerical investigations on optimal distribution of heat source array under natural and forced convection in a horizontal channel. Int. J. Therm. Sci. 2017, 115, 125–138. [Google Scholar] [CrossRef]
  13. Umur, H.; Yemenici, O.; Umur, Y.; Sakin, A. Flow and heat transfer characteristics over rectangular blocked surfaces. Exp. Heat Transf. 2017, 30, 192–204. [Google Scholar] [CrossRef]
  14. Güngör, M.A. Thermal Analysis of Multi-Chip and Variable Cross-Section Electronic Systems. Master’s Thesis, Bursa Uludağ University, Bursa, Turkey, 2020. [Google Scholar]
  15. Amghar, K.; Filali, A.; Louhibi, M.A.; Bouali, H.; Salhi, N.; Salhi, M. Numerical study of turbulent heat transfer in a horizontal channel provided with square blocks: Effect of the inter-blocks spacing. J. Therm. Eng. 2021, 7, 650–665. [Google Scholar] [CrossRef]
  16. Sherry, M.J.; Jacono, D.L.; Sheridan, J. Flow separation characterization of a forward-facing step immersed in a turbulent boundary layer. In Proceedings of the TSFP6 Sixth International Symposium on Turbulence and Shear Flow Phenomena, Seoul, Republic of Korea, 22–24 June 2009. [Google Scholar]
  17. Meinders, E.R.; Hanjalic, K.; Martunizzi, R.C. Experimental study of the local convection heat transfer from a wall-mounted cube in turbulent channel flow. ASME J. Heat Transf. 1999, 121, 564–573. [Google Scholar] [CrossRef]
  18. Defraeye, T.; Blocken, B.; Carmeliet, J. CFD analysis of convective heat transfer at the surfaces of a cube immersed in a turbulent boundary layer. Int. J. Heat Mass Transf. 2010, 53, 297–308. [Google Scholar] [CrossRef]
  19. Shaeri, M.R.; Yaghoubi, M.; Jafarpur, K. Heat transfer analysis of lateral perforated fin heat sinks. Appl. Energy 2009, 86, 2019–2029. [Google Scholar] [CrossRef]
  20. Davalath, J.; Bayazıtoğlu, Y. Forced convection cooling across rectangular blocks. J. Heat Transf. 1987, 109, 321–328. [Google Scholar] [CrossRef]
  21. Meinders, E.R.; Van Der Meer, T.H.; Hanjalić, K.; Lasance, C.J.M. Application of infrared thermography to the evaluation of local convective heat transfer on arrays of cubical protrusions. Int. J. Heat Fluid Flow 1997, 18, 152–159. [Google Scholar] [CrossRef]
  22. Menter, F.R. Two-equation eddy-viscosity turbulence models for engineering applications. AIAA J. 1994, 32, 1598–1605. [Google Scholar] [CrossRef]
  23. Changcharoen, W.; Eiamsaard, S. Numerical investigation of turbulent heat transfer in channels with detached rib-arrays. Heat Transf. Asian Res. 2011, 40, 431–447. [Google Scholar] [CrossRef]
  24. Gupta, S.K.; Rawat, M.K.; Kukreja, N. Analysis of heat transfer enhancement of electronic chip using CFD. Int. J. Sci. Technol. Res. 2019, 8, 1017–1020. [Google Scholar]
  25. Anwar-ul-Haque, F.A.; Yamada, S.; Chaudhry, S.R. Assessment of turbulence models for turbulent flow over a backward-facing step. In Proceedings of the WCE2007 World Congress on Engineering, London, UK, 2–4 July 2007; Volume II. [Google Scholar]
  26. Park, T.H.; Choi, H.G.; Yoo, J.Y.; Kim, S.J. Streamline upwind numerical simulation of two-dimensional confined impinging slot jets. Int. J. Heat Mass Transf. 2003, 46, 251–262. [Google Scholar] [CrossRef]
  27. Jaramillo, J.E.; Pérez-Segarra, C.D.; Oliva, A.; Claramunt, K. Analysis of different RANS models applied to turbulent forced convection. Int. J. Heat Mass Transf. 2007, 50, 3749–3766. [Google Scholar] [CrossRef]
  28. Lu, B.; Jiang, P.-X. Experimental and numerical investigation of convection heat transfer in a rectangular channel with angled ribs. Exp. Therm. Fluid Sci. 2006, 30, 513–521. [Google Scholar] [CrossRef]
  29. Bouchenafa, R.; Saim, R.; Abboudi, S. Numerical study of forced convection in a turbulent heat sink made of several rows of blocks of square form. Heat Mass Transf. 2015, 51, 1301–1311. [Google Scholar] [CrossRef]
  30. Guo, Z.-Y.; Li, D.-Y.; Liang, X.-G. Thermal effects on the recirculation zone in sudden-expansion gas flows. Int. J. Heat Mass Transf. 1996, 39, 2619–2624. [Google Scholar] [CrossRef]
  31. Driver, D.M.; Seegmiller, H.L. Features of a reattaching turbulent shear layer in divergent channel flow. AIAA J. 1985, 23, 163–171. [Google Scholar] [CrossRef]
  32. Gürses, D.; Pulat, E. Computational investigation of pressure gradient effects on heat transfer from electronic chips mounted on a surface under turbulent flow. In Proceedings of the ULIBTK’21 23rd Heat Science and Technology Congress, Conference Proceeding, Gaziantep, Türkiye, 8–10 September 2021; Volume 1. [Google Scholar]
  33. Ateş, M. Effects of External Turbulence and Pressure Gradient on Heat Transfer in Backward-Facing Step Flows. Master’s Thesis, Bursa Uludağ University, Bursa, Turkey, 2015. [Google Scholar]
Figure 1. Considered geometry with α = −2° (Geometry 1, convergent channel for comparison purposes), 0° (Geometry 2, base case), divergent channels: 2° (Geometry 3), 4° (Geometry 4), and 6° (Geometry 5).
Applsci 15 09099 g001
Figure 2. Computational domain and boundary conditions.
Applsci 15 09099 g002
Figure 3. Mesh structure used for (Geometry 2 for α = 0°).
Applsci 15 09099 g003
Figure 4. Mesh independence study by using local heat transfer coefficient distributions.
Applsci 15 09099 g004
Figure 5. Geometry used in the validation study.
Applsci 15 09099 g005
Figure 6. Comparison of average heat transfer coefficients with experimental study of Meinders et al. [17] and 3D numerical study of Shaeri et al. [19].
Applsci 15 09099 g006
Figure 7. Velocity contours and their magnitudes for Re = 9015 (5.42 m/s) (a) α = −2°, (b) α = 0° (base geometry), (c) α = 2°, (d) α = 4°, (e) α = 6°.
Applsci 15 09099 g007
Figure 8. Streamlines for Re = 9015 (5.42 m/s) (a) α = −2°, (b) α = 0° (base geometry), (c) α = 2°, (d) α = 4°, (e) α = 6°.
Applsci 15 09099 g008aApplsci 15 09099 g008b
Figure 9. Representation of shear stresses for Re = 9015 (5.42 m/s) (divergent geometries and base geometry).
Applsci 15 09099 g009
Figure 10. Representation of shear stresses for Re = 9015 (5.42 m/s) (convergent geometry and base geometry).
Applsci 15 09099 g010
Figure 11. Pressure contours and their magnitudes for Re = 9015 (5.42 m/s) (a) α = −2°, (b) α = 0° (base geometry), (c) α = 2°, (d) α = 4°, (e) α = 6°.
Applsci 15 09099 g011
Figure 12. Pressure change for α = −2°.
Applsci 15 09099 g012
Figure 13. Pressure change for α = 2°.
Applsci 15 09099 g013
Figure 14. Pressure change for α = 4°.
Applsci 15 09099 g014
Figure 15. Pressure change for α = 6°.
Applsci 15 09099 g015
Figure 16. Temperature contours and their magnitudes for Re = 9015 (5.42 m/s) (a) α = −2°, (b) α = 0° (base geometry), (c) α = 2°, (d) α = 4°, (e) α = 6°.
Applsci 15 09099 g016
Figure 17. Turbulent kinetic energy contours for Re = 9015 (5.42 m/s) (a) α = −2°, (b) α = 0° (base geometry), (c) α = 2°, (d) α = 4°, (e) α = 6°.
Applsci 15 09099 g017
Figure 18. Local Nusselt numbers for Re = 9015 (5.42 m/s) (diverging geometries and baseline geometry).
Applsci 15 09099 g018
Figure 19. Local Nusselt numbers for Re = 9015 (5.42 m/s) (converging geometry and baseline geometry).
Applsci 15 09099 g019
Figure 20. Average Nusselt numbers for Re = 9015 (5.42 m/s) (diverging geometries and baseline geometry).
Applsci 15 09099 g020
Figure 21. Average Nusselt numbers for Re = 9015 (5.42 m/s) (converging geometry and baseline geometry).
Applsci 15 09099 g021
Figure 22. Local Nu numbers for α = −2°.
Applsci 15 09099 g022
Figure 23. Average Nu numbers for α = −2°.
Applsci 15 09099 g023
Figure 24. Local Nu numbers for α = 2°.
Applsci 15 09099 g024
Figure 25. Average Nu numbers for α = 2°.
Applsci 15 09099 g025
Figure 26. Local Nu numbers for α = 4°.
Applsci 15 09099 g026
Figure 27. Average Nu numbers for α = 4°.
Applsci 15 09099 g027
Figure 28. Local Nu numbers for α = 6°.
Applsci 15 09099 g028
Figure 29. Average Nusselt numbers for α = 6°.
Applsci 15 09099 g029
Table 1. Flow and thermal boundary conditions.
InletBlock
Surfaces
Channel
Upper
Surface
Channel Lower
Surface
Outlet
Inlet velocity
(m/s, uniform profile)
3.607, 5.42,
7.21
000-
Inlet temperature
(K, uniform profile)
293 K342 KAdiabaticAdiabatic-
Pressure (Pa)----0
Table 2. The geometric factors for the base geometry (Geometry 2 for α = 0°) in comparison with Meinders et al. [4].
H = 4 h
(This Study)
H = 3.33 h
(Meinders et al., 1998 [4])
Blockage ratio [h/H]0.250.30
Expansion ratio [H/(Hh)]1.331.43
Aspect ratio [l/h]2.001.00
Packaging density [s/l]1.001.00
Table 3. Number of elements in the base geometry (Geometry 2 for α = 0°).
Mesh StructureCourse96,387
Medium141,317
Fine (chosen)194,892
Table 4. y + values for Re = 9015 (u = 5.42 m/s).
Mesh y a v g + y m i n + y m a x +
Fine1.52259590.02974.99845
Medium2.7044310.6250796.41723
Coarser3.5670.82377.3537
Table 5. Average Nusselt numbers for all chips and Reynolds numbers.
AngleAverage Nusselt No
Re = 6000Re = 9015Re = 11,993
α = −2°47.664.5780.07
α = 0°43.1258.171.4
α = 2°39.6453.2965.62
α = 4°36.849.861.66
α = 6°33.6545.5356.4
Table 6. Comparison of reattachment lengths (RL) at different velocities and inclination angles.
Velocity (m/s)Inclination Angle
(Degree)
RL 1 (cm)RL 2 (cm)
3.607α = −2°0.94773.9591
α = 0°0.89614.7579
α = 2°0.81366.5365
α = 4°0.688314.0766
α = 6°0.542219.6318
5.42α = −2°0.94773.9135
α = 0°0.91754.7153
α = 2°0.83456.3903
α = 4°0.667513.4918
α = 6°0.521320.0286
7.21α = −2°0.94773.8907
α = 0°0.91754.6726
α = 2°0.85546.2859
α = 4°0.709212.8443
α = 6°0.500420.2375
Disclaimer/Publisher’s Note: The statements, opinions and data contained in all publications are solely those of the individual author(s) and contributor(s) and not of MDPI and/or the editor(s). MDPI and/or the editor(s) disclaim responsibility for any injury to people or property resulting from any ideas, methods, instructions or products referred to in the content.