Article

Numerical Study of Irregularly Roughened Micro-Particles’ Drag in Laminar Flow

by
Eleni Papazoglou
1,*,
Konstantinos-Stefanos Nikas
1 and
Demetri Bouris
2
1
Heat Transfer Laboratory, Mechanical Engineering Department, School of Engineering, University of West Attica, Ancient Olive Grove Campus, 122 41 Egaleo, Greece
2
Laboratory for Innovative Environmental Technologies, School of Mechanical Engineering, National Technical University of Athens, 9 Heroon Polytechniou, 157 80 Zografou, Greece
*
Author to whom correspondence should be addressed.
Appl. Sci. 2025, 15(16), 9090; https://doi.org/10.3390/app15169090
Submission received: 29 July 2025 / Revised: 13 August 2025 / Accepted: 15 August 2025 / Published: 18 August 2025
(This article belongs to the Section Fluid Science and Technology)

Abstract

The effect of surface roughness in laminar flow has been the focus of recent research related to drag reduction. However, although particle transport is governed by laminar flow in most applications, the effect of surface texture on the drag of a sphere has mostly been addressed in the transitional and turbulent regimes. The aim of the present study is to explore the drag behavior of rough spherical micro-particles in laminar flow. The spheres’ roughness has been structured based on a 3D complex Weaire–Phelan model, as well as on a simpler orthogonal lattice one, and quantified as per various definitions. The emerging surface roughness comprises irregular elements in terms of shape and size. The investigation has been performed at Reynolds numbers ranging from 2 to 8. The drag coefficient is found to drop quadratically with increasing roughness. Relative roughness can reduce the total drag on the particle by over 21%. The key physical mechanism is explained by the particles’ surface cavities, which contain recirculating, nearly stagnant fluid, thus creating a self-lubricating effect that reduces skin friction, as the main flow skims over the top without entering the cavities. A reduction in total drag arises when skin friction drag reduction is larger than the increase in form drag. Understanding the drag behavior of spherical particles with irregular surface texture provides new and useful insight into low Reynolds number transport phenomena related to a variety of engineering applications.

1. Introduction

Micro- and nano-particle transport is a fundamental process encountered in many fields and applications, ranging from atmospheric sciences to sedimentation, suspension rheology, fluidized beds, particle processing, etc. [1]. In many cases, particle drag is a major factor in the physical process, and so its behavior, in relation to the particle and flow properties, may have significant natural, economic, and technological impact.
Drag force is the result of tangential and normal stresses acting on a solid body subjected to fluid flow. It is often difficult to determine the analytical distribution of shear stress and pressure over the solid surface, and therefore, the total drag coefficient is usually determined. Its variation depends on the flow regime, and investigation is classified according to Reynolds number as (a) creeping, (b) laminar, and (c) turbulent flow [2].
For a smooth spherical particle, creeping flow is considered at Re < 1 and defined as the Stokes regime, where the viscous effects dominate without flow separation. As Re increases, flow separation is initially observed at Re~10 and increases further until the limit of Re~1000, where drag is mostly a result of the pressure distribution rather than that of the viscous stress friction [3]. Although these regimes are well defined for smooth spheres, this is not the case for rough spheres, which are a closer representation of actual particles.
Moreover, in efforts to enhance particles’ performance in various fields, a great interest is also shown in their production with tailored morphology and size since these parameters are related to their properties [4,5]. This is achieved by controlling the process conditions of particles’ formation as well as their concentration and mixing sizes, and therefore, dense, hollow, porous, doughnut, raspberry, hairy, well-mixed component, and encapsulated particles can be produced, from nano to micron sizes, to suit specific applications.
Surface morphologies of experimentally synthesized micro- and nano-particles are captured by scanning electron microscopy, as reviewed in the literature [6]. In order to understand the complex flow phenomena, which may influence drag, different parameters may be quantified, among which are particles’ root mean square average of the profile height deviations from the mean line, known as root mean square (RMS) roughness, Rq.
In efforts to optimize parameters that lead to drag reduction, different surface textures on flat and curved solid bodies have been studied. Structures on solids’ surfaces in the direction of the fluid flow, called riblets, have been studied for their contribution to drag reduction in turbulent flow [7,8,9,10,11]. It is reported that riblets may efficiently reduce drag in applications where skin friction drag is dominant but will not have a measurable effect on objects where flow separation (form drag) is the main drag component [7]. Different dimple shapes, designed on a flat plate, alter the heat transfer and flow characteristics of turbulent flow in channels. Although the results are often contradictory in the literature, in general, it is accepted that dimples enhance heat transfer and increase the friction factor [12]. Other approaches to mimic surface roughness are bosses, randomly distributed over a smooth surface [13].
With reference to spherical particles, mainly their surface dimpling has been well studied in the transitional regime and found to affect drag considerably. The drag coefficient can be reduced by almost 50% in comparison with the smooth sphere in the critical region [14]. For dimpled particles, the laminar to turbulent flow transition is found to shift towards lower Reynolds numbers [15]. The mechanism is well explained on the basis of the small separation bubbles formed within the dimples, which, as a consequence, accelerate the flow between the dimples on the surface [16,17]. Depending on the Reynolds number, an appropriate dimple depth exists at which drag presents a minimum. Dimple depth influences the contribution of both dimples and the free area between dimples to total drag. It is also found that there is a limit of dimple coverage area (53%), beyond which any larger size dimples are ineffective in drag reduction. However, it is reported that in the case of multiple-size dimples or different types of distribution patterns, these findings may not be applicable [18]. Grooved spherical particles present a similar drag reduction to dimpled particles, which can be 50% less than that of a smooth particle, at no-spin conditions [19].
Dimpled phase change material capsules have been investigated for their enhanced flow and heat transfer characteristics at Reynolds numbers 50–300. Their drag coefficient was found to be 3.38% less than that of the conventional spherical particles. The dimples’ presence on the capsule delayed the separation of the boundary layer effectively, thus reducing the size of the wake trailing behind the particle and the differential pressure resistance [20].
Disk-shaped biconcave phase change material capsules, with a dent on each side, have also been investigated for their enhanced flow and heat transfer characteristics at Reynolds numbers 20–200. It was found that the drag coefficient is slightly higher for Reynolds numbers up to 80 and slightly lower at Reynolds numbers thereafter [21].
Experimental and numerical studies of the effect of roughness for spheres, either alone or combined with hydrophobic surface treatment, have been limited to laminar flow. In two of the few studies that the authors are aware of, experimental results at the macroscale and numerical ones at the microscale have shown that roughness alone can reduce the total drag. In these research studies, roughness has been modeled as either 2D rectangular or triangular protrusions or semi-circle bosses or as 3D truncated cones. In order for the total drag to be reduced, skin friction drag must be subjected to a larger decrease than the increase in form drag, and so, roughness cavities must be large enough to accommodate air flow recirculation in the Stokes regime [22,23]. The experimental measurements involved falling spheres in a vertical container filled with glycerin. The spheres were given a rough surface using a wet-oxidation process, creating needle-shaped roughness, and half of them were also coated with a hydrophobic Teflon layer. The Reynolds number remained below 0.1, ensuring Stokes’ flow. Terminal velocity was measured using two synchronized high-speed CCD cameras. The findings suggest that surface roughness alone can lead to a significant reduction in drag [23].
The mechanisms of reduced shear stress might also be expected to apply to the laminar flow past a rough spherical particle, which is a closer representation of an actual one. Any effects of surface roughness on friction drag will be combined with the pressure distribution to give the overall drag coefficient.
In the above research works on spherical particles, irregularities have been modeled mostly as a constant pattern comprising either dimples, 2D spikes, or 3D truncated cones. The nature and possible periodicity of the outer surface structure of actual particles depend on the particle formation mechanisms. For particles formed through a condensation and drying process, as in many natural and industrial processes, the small size of the particles indicates that the surface stresses can be expected to play a crucial role in the formation of the solid structure. Among the geometries possessing a low surface area and energy is the Weaire–Phelan (WP) one, which partitions space by means of two types of polyhedral equal volumes, of which one is an irregular dodecahedron with twelve pentagonal faces, and the other one is a tetrakaidecahedron with two hexagonal and twelve pentagonal faces [24]. The Weaire–Phelan structure has been found in physical systems, including liquid foams and metal alloys, and it is only just recently that the first polymeric structure has been produced in the lab at the micrometer scale [25]. This complex 3D structure has been selected in this study, being considered representative of the structure of spherical particles with irregular surface texture. The chosen structures are intended to represent surface tension-dominated processes of particle formation, achieved by different synthesis methods at certain conditions and substance concentration [26,27]. The final micro-particles can form Microencapsulated Phase Change Materials. Dispersing suitable Encapsulated Phase Change Materials (PCMs) as microscale powders into conventional fluids can produce advanced heat transfer fluids. These enhanced working fluids are promising for applications in energy and waste heat recovery systems—such as air conditioning, domestic hot water, solar thermal systems, and microchannel heat sinks—offering improved thermal efficiency, reduced energy consumption (e.g., pump power), and lower operational costs [28]. It is expected that these particles will present a reduced drag and an increased convection heat transfer, in comparison with smooth spherical particles, due to their increased surface-to-volume ratio.
For comparative purposes, an orthogonal lattice microstructure has also been used in 3D numerical simulations. To account for the different particles’ sizes, roughness is normalized by the particles’ diameter. In this study, particles’ average surface relative roughness ranges from 0.002 to 0.132, which is within the broad range of 3.3E-05 up to 0.735 particles’ RMS relative roughness, measured and reviewed in the literature [6].
The aim of the present study is to
  • Numerically investigate the influence of irregular roughness on the particle drag coefficient at low Reynolds numbers;
  • Understand the mechanisms of form and skin friction drag in relation to the geometrical characteristics of the particles’ surface texture;
  • Explore any other parameters affecting the total drag.
Simulations are performed at Reynolds numbers of 2, 4, 6, and 8, which were considered relevant and representative of particle sizes and flow conditions in a wide range of natural and industrial applications. Extension to other Reynolds numbers was beyond the scope of the present study.
The effect of surface roughness on the drag of spherical particles at low Reynolds numbers (Re = 2 ÷ 8) has not been extensively studied. Furthermore, the particles’ structures studied here differ from those found in the literature through the incorporation of irregular roughness elements in terms of shape and size, rather than a repetitive pattern of standard shapes (i.e., cones, spikes, or dimples), thus constituting a novelty of the present study. Engineering applications where the results may be useful include the micro-particles transfer phenomena, as well as the micro-particles’ industrial formation processes (i.e., spray drying), in which a desirable roughness and therefore drag may be achieved by controlling the raw materials’ concentration, sizes, and process conditions. Other particle shapes significantly deviating from a sphere, or cases of high concentration suspensions, which would include particle-particle interactions, have not been considered here so as to limit the number of parameters being investigated.

2. Methodology

In this section, the roughness definitions are first presented. Secondly, the numerical details, including the 3D physical model, its meshing, as well as the governing equations and the numerical method, are introduced.

2.1. Particle Roughness Structure

Two different particle geometries were generated in commercial software: one based on the Weaire–Phelan model of minimum surface energy [24] and another based on a Cartesian lattice. The concept was inspired by the formation of Micro-Encapsulated Phase Change Materials (MEPCMs), where the PCM, located inside the cores, is surrounded by a solid, forming polynuclear particles [29].
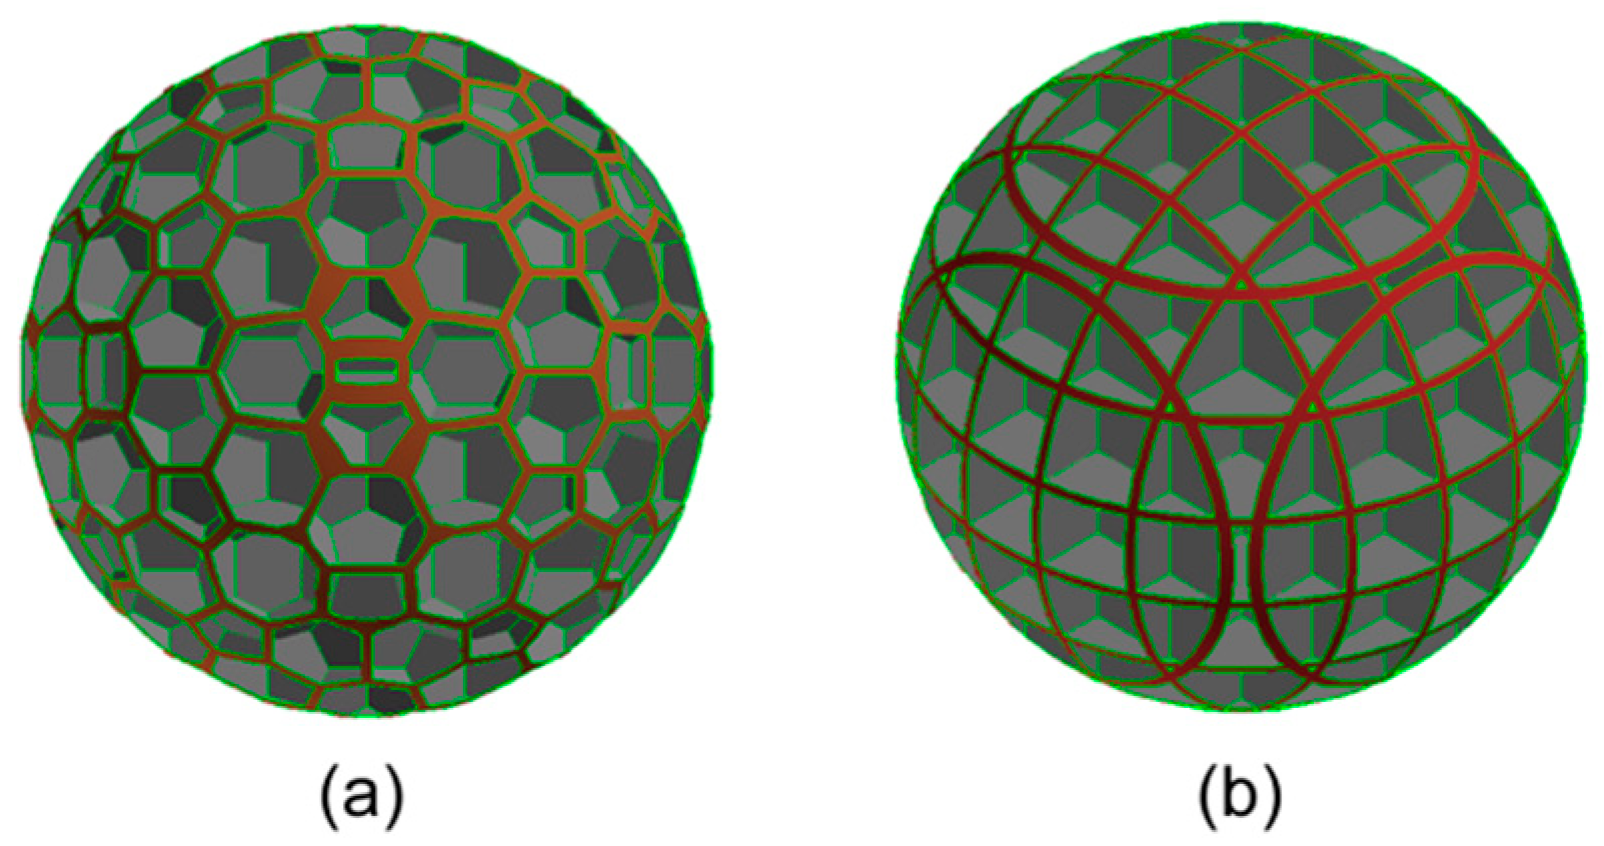
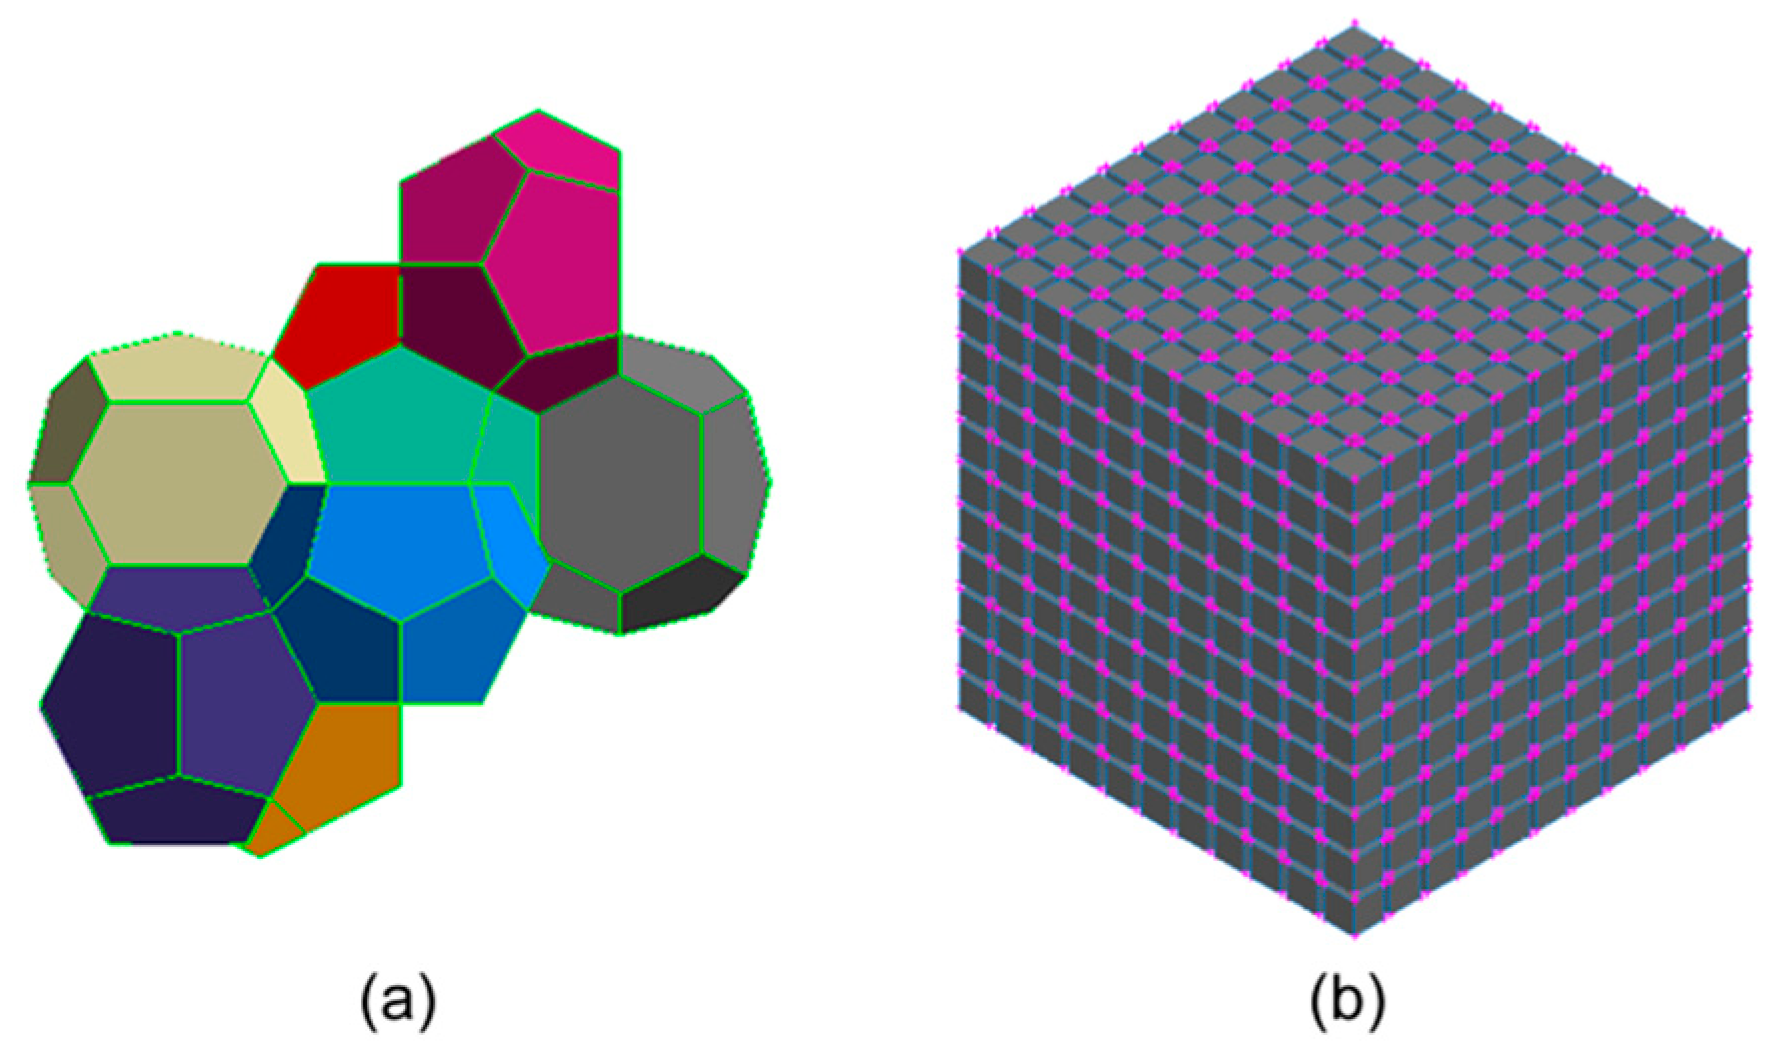
The sub-volumes comprising these two geometries correspond to a “closed cell” structure whereby an inner core is surrounded by polygonal faces that define an outer shell of six dodecahedra and two tetrakaidecahedra corresponding to the Weaire–Phelan structure or six square faces comprising the Cartesian lattice structure. The structure of the Weaire–Phelan type is shown in Figure 1a with the edges in green and the faces of the basic volumes colored differently for clarity. Figure 1b shows a repeated basic Cartesian unit volume that forms a lattice. In both cases, each single volume of both the Weaire–Phelan structure or the Cartesian lattice consists, initially, of a core surrounded by a shell of the same specific geometric shape, as illustrated in Figure 2, indicatively, for the Weaire–Phelan type. In most applications, materials production (e.g., MEPCM), cores, and shells are made of different materials, and in the present study, the cores are presumed empty. Varying the thickness of the shell while keeping the shell’s outer dimensions constant leads to different ratios of “core”-to-“shell” volumes, emulating a variable ratio of core–shell material combinations. In the present case, this ratio was intentionally varied from 0.036 to 2.559, wider than the one found in the literature [30], in order to investigate a wider range of roughness values.
To construct the repetitive spatial geometry, these “core and shell” volumes were spatially repeated (see [31] for a similar application of the Weaire–Phelan geometry), as illustrated in Figure 2 (for the Weaire–Phelan case), and then intersected with spheres of various diameters. External cavities are then formed by the empty cores at the particle surface. Due to the varying “core”-to-“shell” volume ratios [31], particles with different surface geometrical patterns were formed. The main steps of the particles’ creation are summarized in Figure 2 for the Weaire–Phelan case. A similar procedure has been followed for the creation of the Cartesian lattice irregular particles. The concept is based on polynuclear MEPCM particle formation, where substances in liquid state, forming the cores, are detached only from the outer surface of the particles, thus creating a rough surface (Figure 3).
Although Encapsulated Phase Change Materials (EPCMs) are found in both micro and nano sizes, all roughened particles created in this study belong to the micrometer range. Their diameters vary from 2.726 μm to 4.989 μm. For comparison reasons, a smooth sphere with a diameter of 4 μm has also been created. The particle size is based on the mean diameter of 3.9 μm particles formed by spray drying [30]. To account for the different particle sizes, roughness is normalized by their diameter.
There are several definitions of roughness in the literature. In order to quantify the particles’ surface irregularities in this study, several of these different dimensionless definitions were used. According to one, the arithmetical mean height of the scale limited surface, Sa, is defined as the arithmetic mean value of the absolute of the ordinate values of points on the rough outer surface with respect to the reference surface of area (As), defined by the mean diameter Dm. Mean diameter, Dm, is defined as the diameter that splits the total volume (Vrough) of particles’ outer cavities into two equal parts [32], while “outer particle” is defined as the one with a diameter that coincides with the highest peak of the rough particle. This parameter expresses, as an absolute value, the difference in height of each point compared to the arithmetical mean of the surface, and it is generally used to evaluate surface roughness. It is then calculated using the following Equation (1) [33]:
S a = 1 A s · A z x , y d x d y = V r o u g h π D m 2
The relative surface roughness of each particle is then defined as Sa/Dm. This can be considered similar to the definition of the relative roughness as the height of the roughness elements above the mean diameter per particle’s characteristic length, extensively used in internal and external flows, i.e., pipes, dimpled golf balls, and cylindrical particles [15,34].
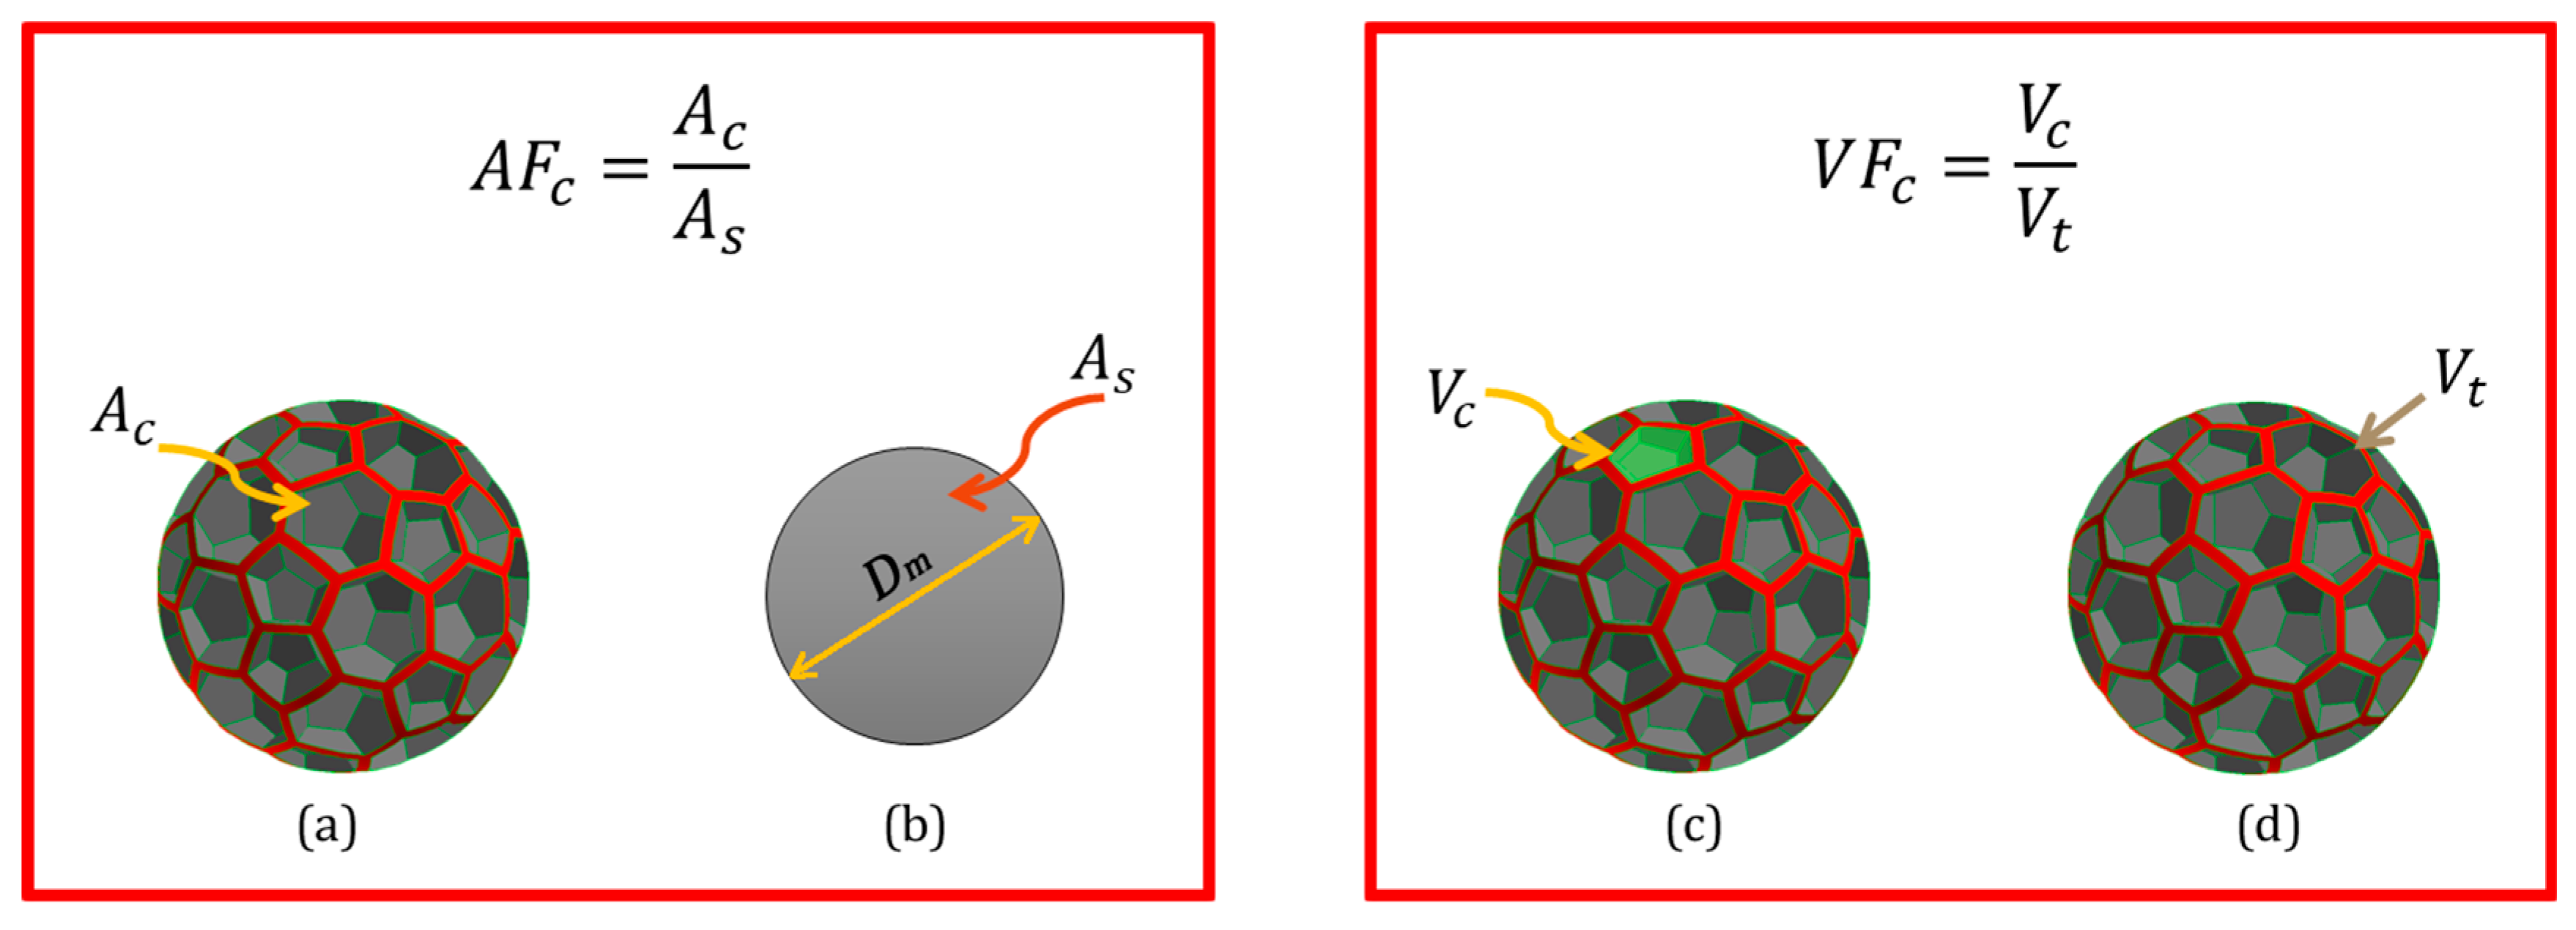
A second, alternative definition is based on the fraction of the particles’ surface area forming the cavities, Ac, divided by the surface area of the smooth sphere, As, having a diameter equal to the mean one, Dm, of the irregular particle. Figure 4a depicts Ac in grey color, and Figure 4b depicts the outer surface As of a smooth sphere with diameter equal to mean one, Dm, of the respective irregular particle. In this case, the ratio is defined as the cavities’ area fraction, AFc, and calculated with the following Equation (2):
A F c = A c A s
An analogous definition to AFc has been reported in order to define the percentage of the surface covered with solid, called solid fraction [35]. In that study, authors used baffles around a spherical particle to mimic roughness elements and defined solid fraction as the ratio of the plastron’s surface (the missing outer surface which would make the particle smooth) divided by the total particle surface.
A third definition of irregularities is that the cavities’ volumetric fraction, VFc, is calculated through the following Equation (3):
V F c = V c V t
where Vt is the solid volume of the rough particle, and Vc is the sum of cavities’ volumes. Figure 4c depicts the volume of one such representative cavity (marked with green), whereas Figure 4d depicts the total volume of the irregular particle.
Finally, the particles’ roughness may be quantified by different parameters, among which is Rq, which is the square root of the sum of the squares of the individual heights and depths from the mean line, indicating the standard deviation of the height distribution [36]. Square root roughness, Rq, could be further normalized by the particles’ radius, aeff, to account for the different particle sizes. Relative roughness (Rq/2aeff) of experimentally synthesized particles is found within the range of 3.3 × 10⁻⁵ up to 0.735, according to the available lateral force microscopy and angle of repose measurements reported in the literature [6]. In this present study, particles’ relative roughness (Sa/Dm) ranges from 0.002 to 0.132.
Since the cavities’ geometrical characteristics are not uniform on each particle and among the particles, their quantification can only be approached by adequate definitions as the ones mentioned above. Any other approach, i.e., height-to-width ratio, would be impossible to evaluate within the present investigation due to the cavities’ structure. All definitions of roughness stated above have been based on dimensionless parameters.
Due to the complexity of the particles’ creation, it is not feasible to investigate the possible influence of their roughness’ scaling (i.e., distribution of surface roughness volume) on drag results. Consequently, another set of six different particles, with scaled roughness elements, was created by subtracting orthogonal volumes of different shapes from a sphere’s surface, thus creating particles with surface cavities. In these particles, either the height, h, or the width, d, of the cavities was kept constant, while the initial sphere’s diameter and the volumetric fraction, as defined in Equation (3), were constant. The concept of mean diameter was also applied to these particles. Numerical drag results are compared among the particles with the same volumetric fraction. The equation, derived from the WP and orthogonal particles, estimating the drag coefficient based on their volumetric fraction, is also applied at Re = 4 for this set of particles in order to investigate the influence of roughness’ scaling on the results.

2.2. Numerical Details

2.2.1. Physical Model

A 3D box-like computational domain of adequate dimensions 20D × 20D × 20D has been introduced so as to avoid blockage effects. The particle center is at a distance of 5D from the inlet in the flow (x) direction, as illustrated in Figure 5.
Boundary conditions for the computational investigation were a prescribed uniform velocity (Uo) at the inlet corresponding to Re = Uo·Dm/ν = 2, 4, 6, and 8, a constant gradient outlet, and symmetry conditions on all other sides of the computational domain. The uniform flow inlet velocity (Uo) has been set on the basis of the mean diameter, Dm, of each rough particle in order to maintain a constant Reynolds number. Reynolds numbers of 2, 4, 6, and 8 have been studied for all different particles. Although non-dimensional quantities have been used in order to ensure dynamic similarity, the domain was still scaled so that the particles’ mean diameter was in the order of magnitude of ~4 μm.

2.2.2. Meshing

The domain has been meshed using mostly hexahedral cells of various sizes, whilst a cube with a side of ~1.2D surrounding the spherical particle has been meshed using unstructured tetrahedral cells. The overall number of grid cells in the mesh varied from 2.1 M to 12 M for the particles under investigation. In order to improve solution accuracy, grid refinement was applied to the area around the particle, where the velocity and pressure gradients are expected to be more pronounced. Correspondingly, larger grid cells were located near the outer limits of the flow field. Figure 6 illustrates a typical mesh generated and used in the simulations.

2.2.3. Governing Equations and Numerical Methodology

All the computations of mass and momentum conservation equations were performed assuming laminar, steady state conditions and incompressible air flow, whilst a second-order discretization scheme was used. The numerical simulations have been performed using the available commercial Computational Fluid Dynamics software ANSYS Fluent 2022.
The continuity and momentum equations are expressed as
· ρ V = 0
ρ V t + V · V = p + μ 2 V + ρ g
The gravitational force as well as other external body forces are neglected. There have been no further specific terms describing the particles’ behavior in the microscale range, and consequently, the non-dimensional results could be applied to other scales as well.
Convergence of the numerical solution was monitored by means of continuity residuals, the net imbalance between incoming and outgoing flow rates, as well as the drag coefficient stabilization.

3. Model Validation

To check whether the solution was independent of the grid created, the mesh was progressively refined in all planes, resulting in a higher number of cells, and the flow was recalculated. The difference between the two solutions was negligible. Indicatively, a 55% increase in the overall grid size resulted in a 0.012% change in the drag coefficient.
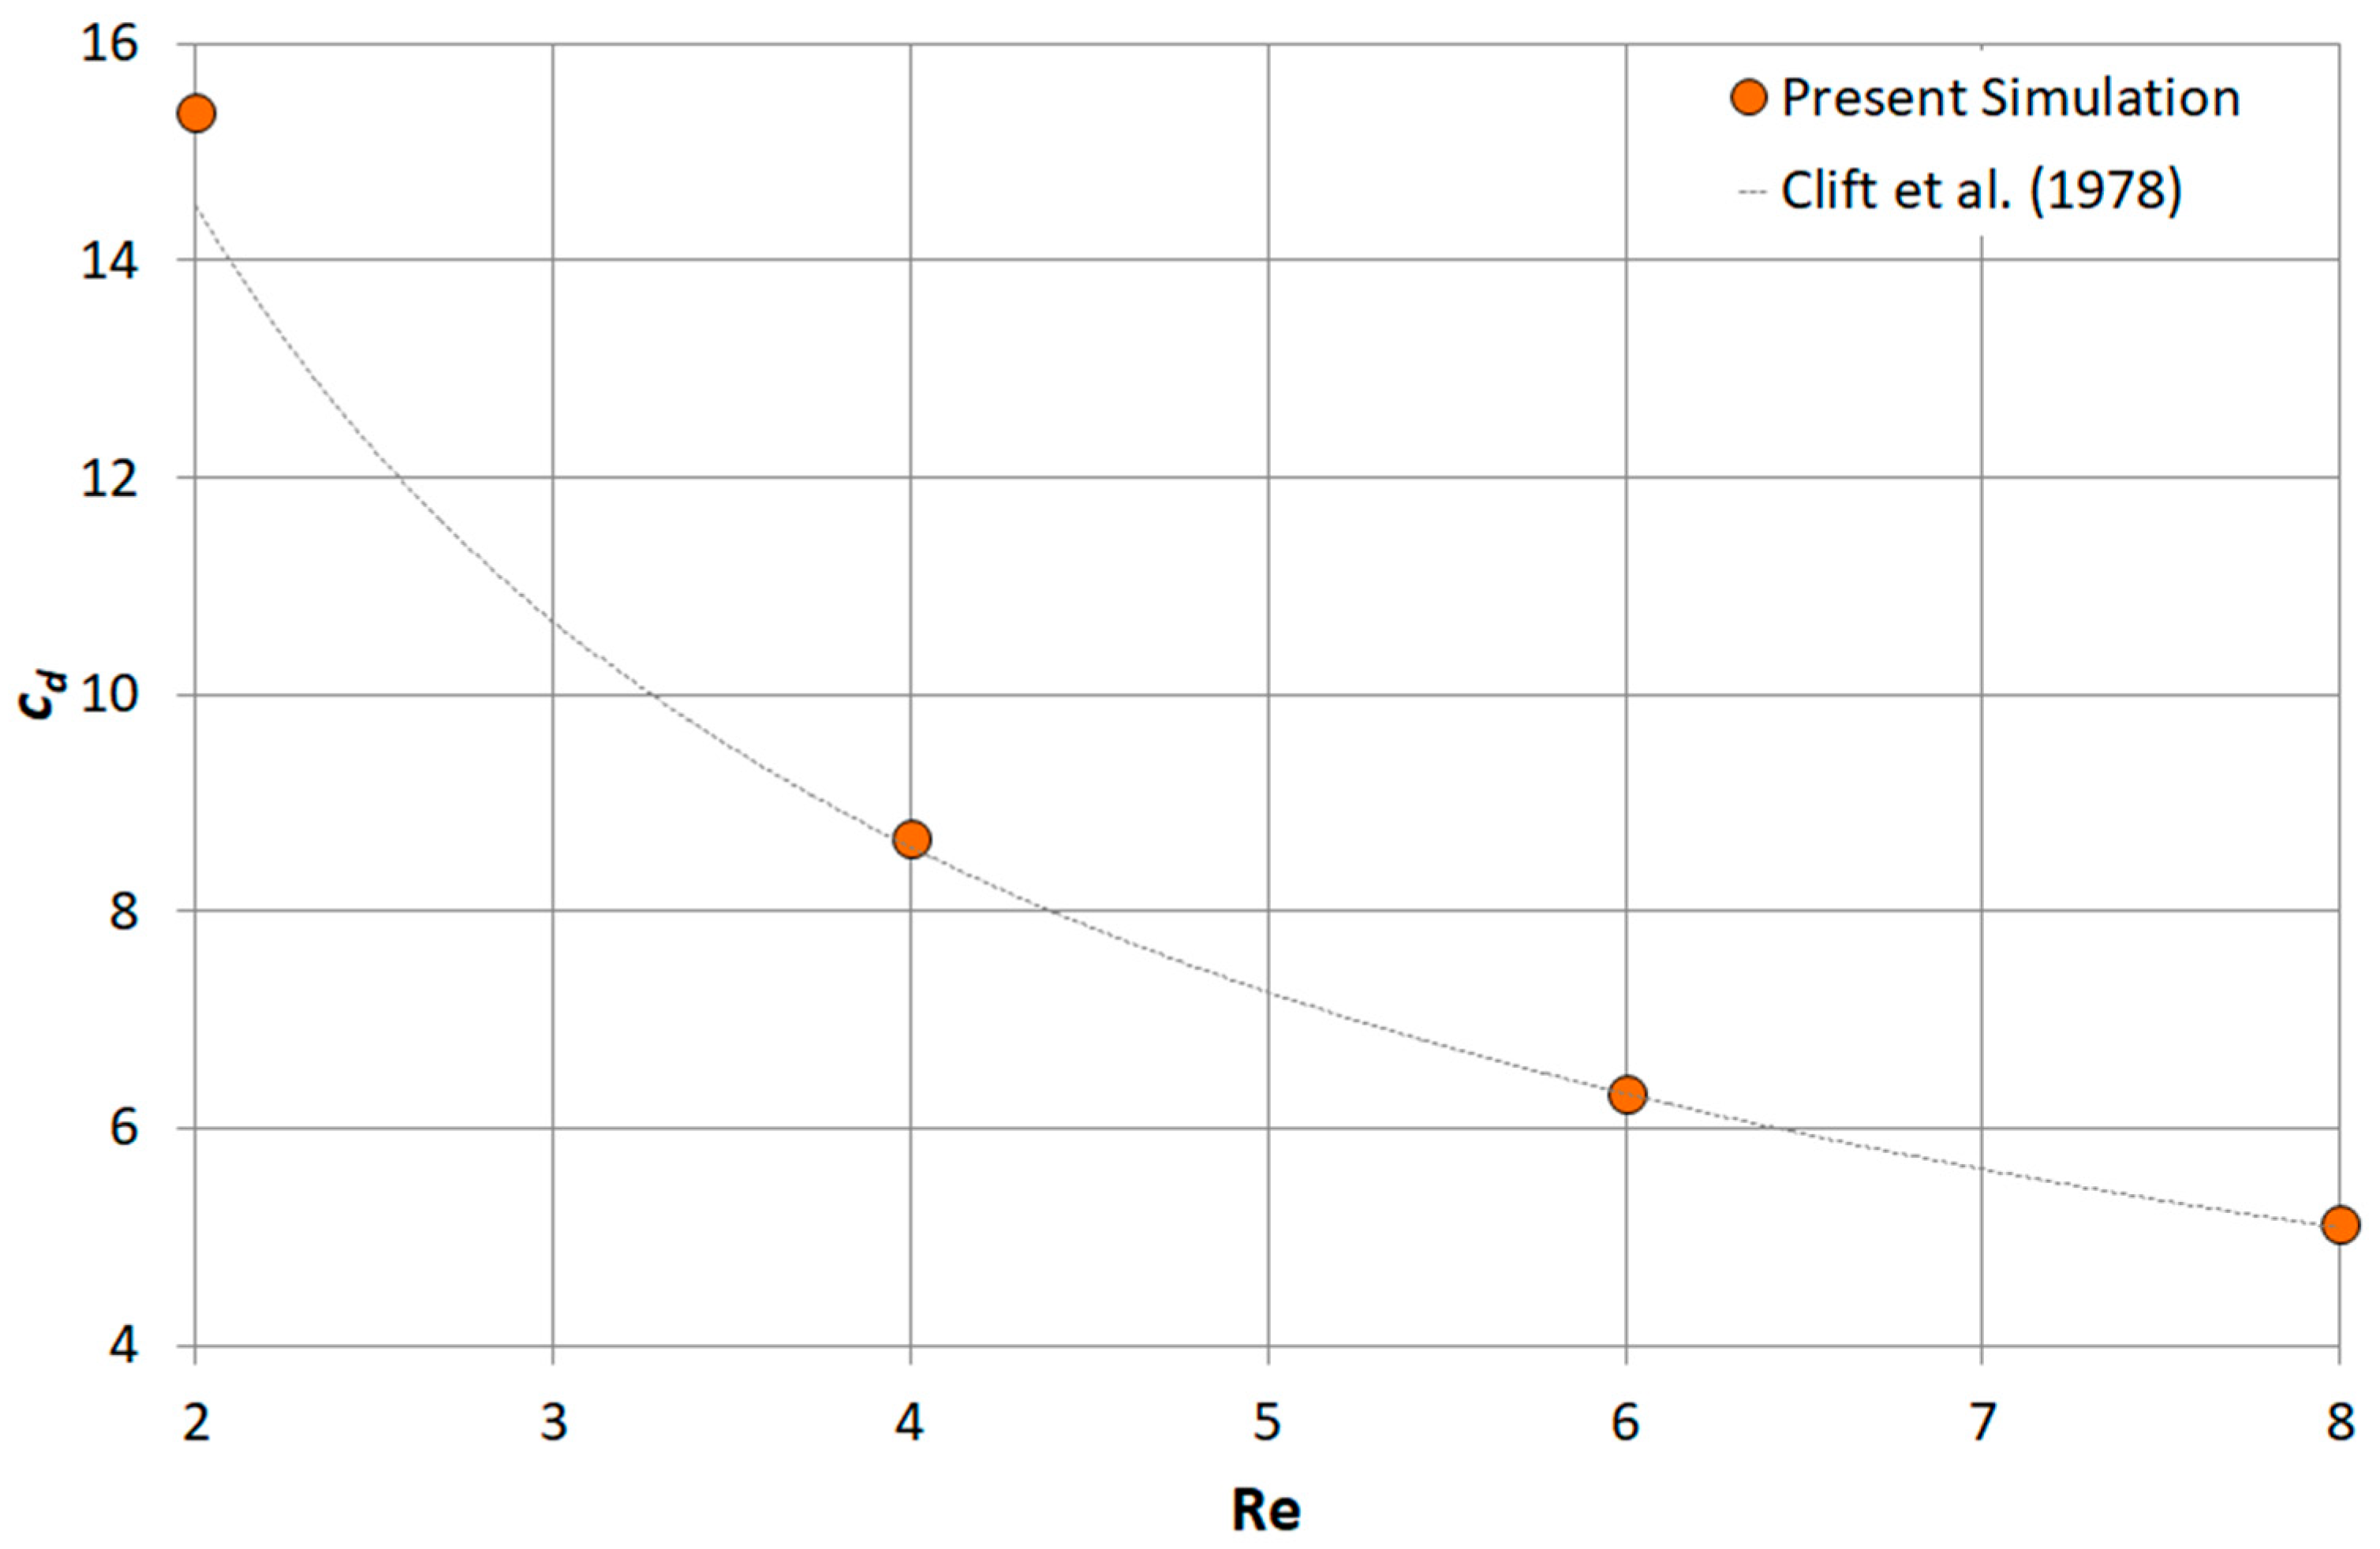
The capability of the model to simulate flow over the rough particles was validated by comparing the simulation results with previously published data for the case of the smooth sphere. Figure 7 shows the numerically calculated values of the drag coefficient compared to the ones calculated through the correlation of Clift et al. [37] for Reynolds numbers from 2 to 8.
There is a good agreement between calculated results and those in the literature, and consequently, the model may predict the flow characteristics past the rough particles accurately as well.

4. Results and Discussion

The predicted drag coefficient, cd, at Re = 4 is presented in Table 1 for all particles that were examined, together with the calculated mean diameter of each particle, its relative roughness, Sa/Dm, form drag, cdp, skin friction drag, cdf, cavities’ area fraction, AFc, cavities’ volumetric fraction (VFc), and particles’ structure (WP: Weaire–Phelan or C: Cartesian lattice). For Re = 4, the corresponding velocity range—calculated using each particle’s mean diameter—spans from 11.712 m/s (Particle ID 12) to 21.434 m/s (Particle ID 1). Results for the other Reynolds numbers can be found in the Mendeley database.
An investigation of the effect of particle orientation with respect to the flow was also performed by altering the orientation of a randomly selected particle for each geometry (i.e., particles with IDs 9 and 10) by different angles on the x and y axes, with respect to the mainstream. Rotation angles were selected so as to avoid symmetrical geometries before and after rotation. A negligible change of total drag is found at Re = 4, as illustrated in Table 2, which may be attributed to numerical errors.
Drag coefficients have been calculated by integrating normal and tangential forces on the particles’ surfaces, including cavities and protrusions in the case of the rough particles. Application of the conservation of momentum on a control volume surrounding the particle verified that the overall force differs from that calculated from the particle surface integration by <0.5%.
The drag coefficients, calculated from the numerical simulations at Re = 2, 4, 6, and 8, are plotted against the relative roughness in Figure 8.
According to the results, i.e., at Re = 4, the drag coefficient of rough particles is lower than that of the smooth particle (cd = 8.67). In absolute magnitude, the dependence is not as strong as the one appearing during the drag crisis in the transition regime. However, in relative values, the drag coefficient is noticeably reduced (up to 21.4% in comparison with the smooth particle) as the particle’s relative roughness increases. Furthermore, it seems that this reduction is independent of the geometry of the particles’ surface texture (either Weaire–Phelan or Cartesian one) since numerical results of both configurations follow the same trend in Figure 8.
The fact that roughness can generate a reduction in drag has been experimentally investigated in Stokes flow, for particles with and without a hydrophobic surface. It has been reported that micro-roughened copper macro-particles have a notably lower terminal velocity in comparison with those with a smooth surface [22]. In 2D numerical simulations of spherical micro-particles, the total drag reduction has been found to be up to 4% [22].
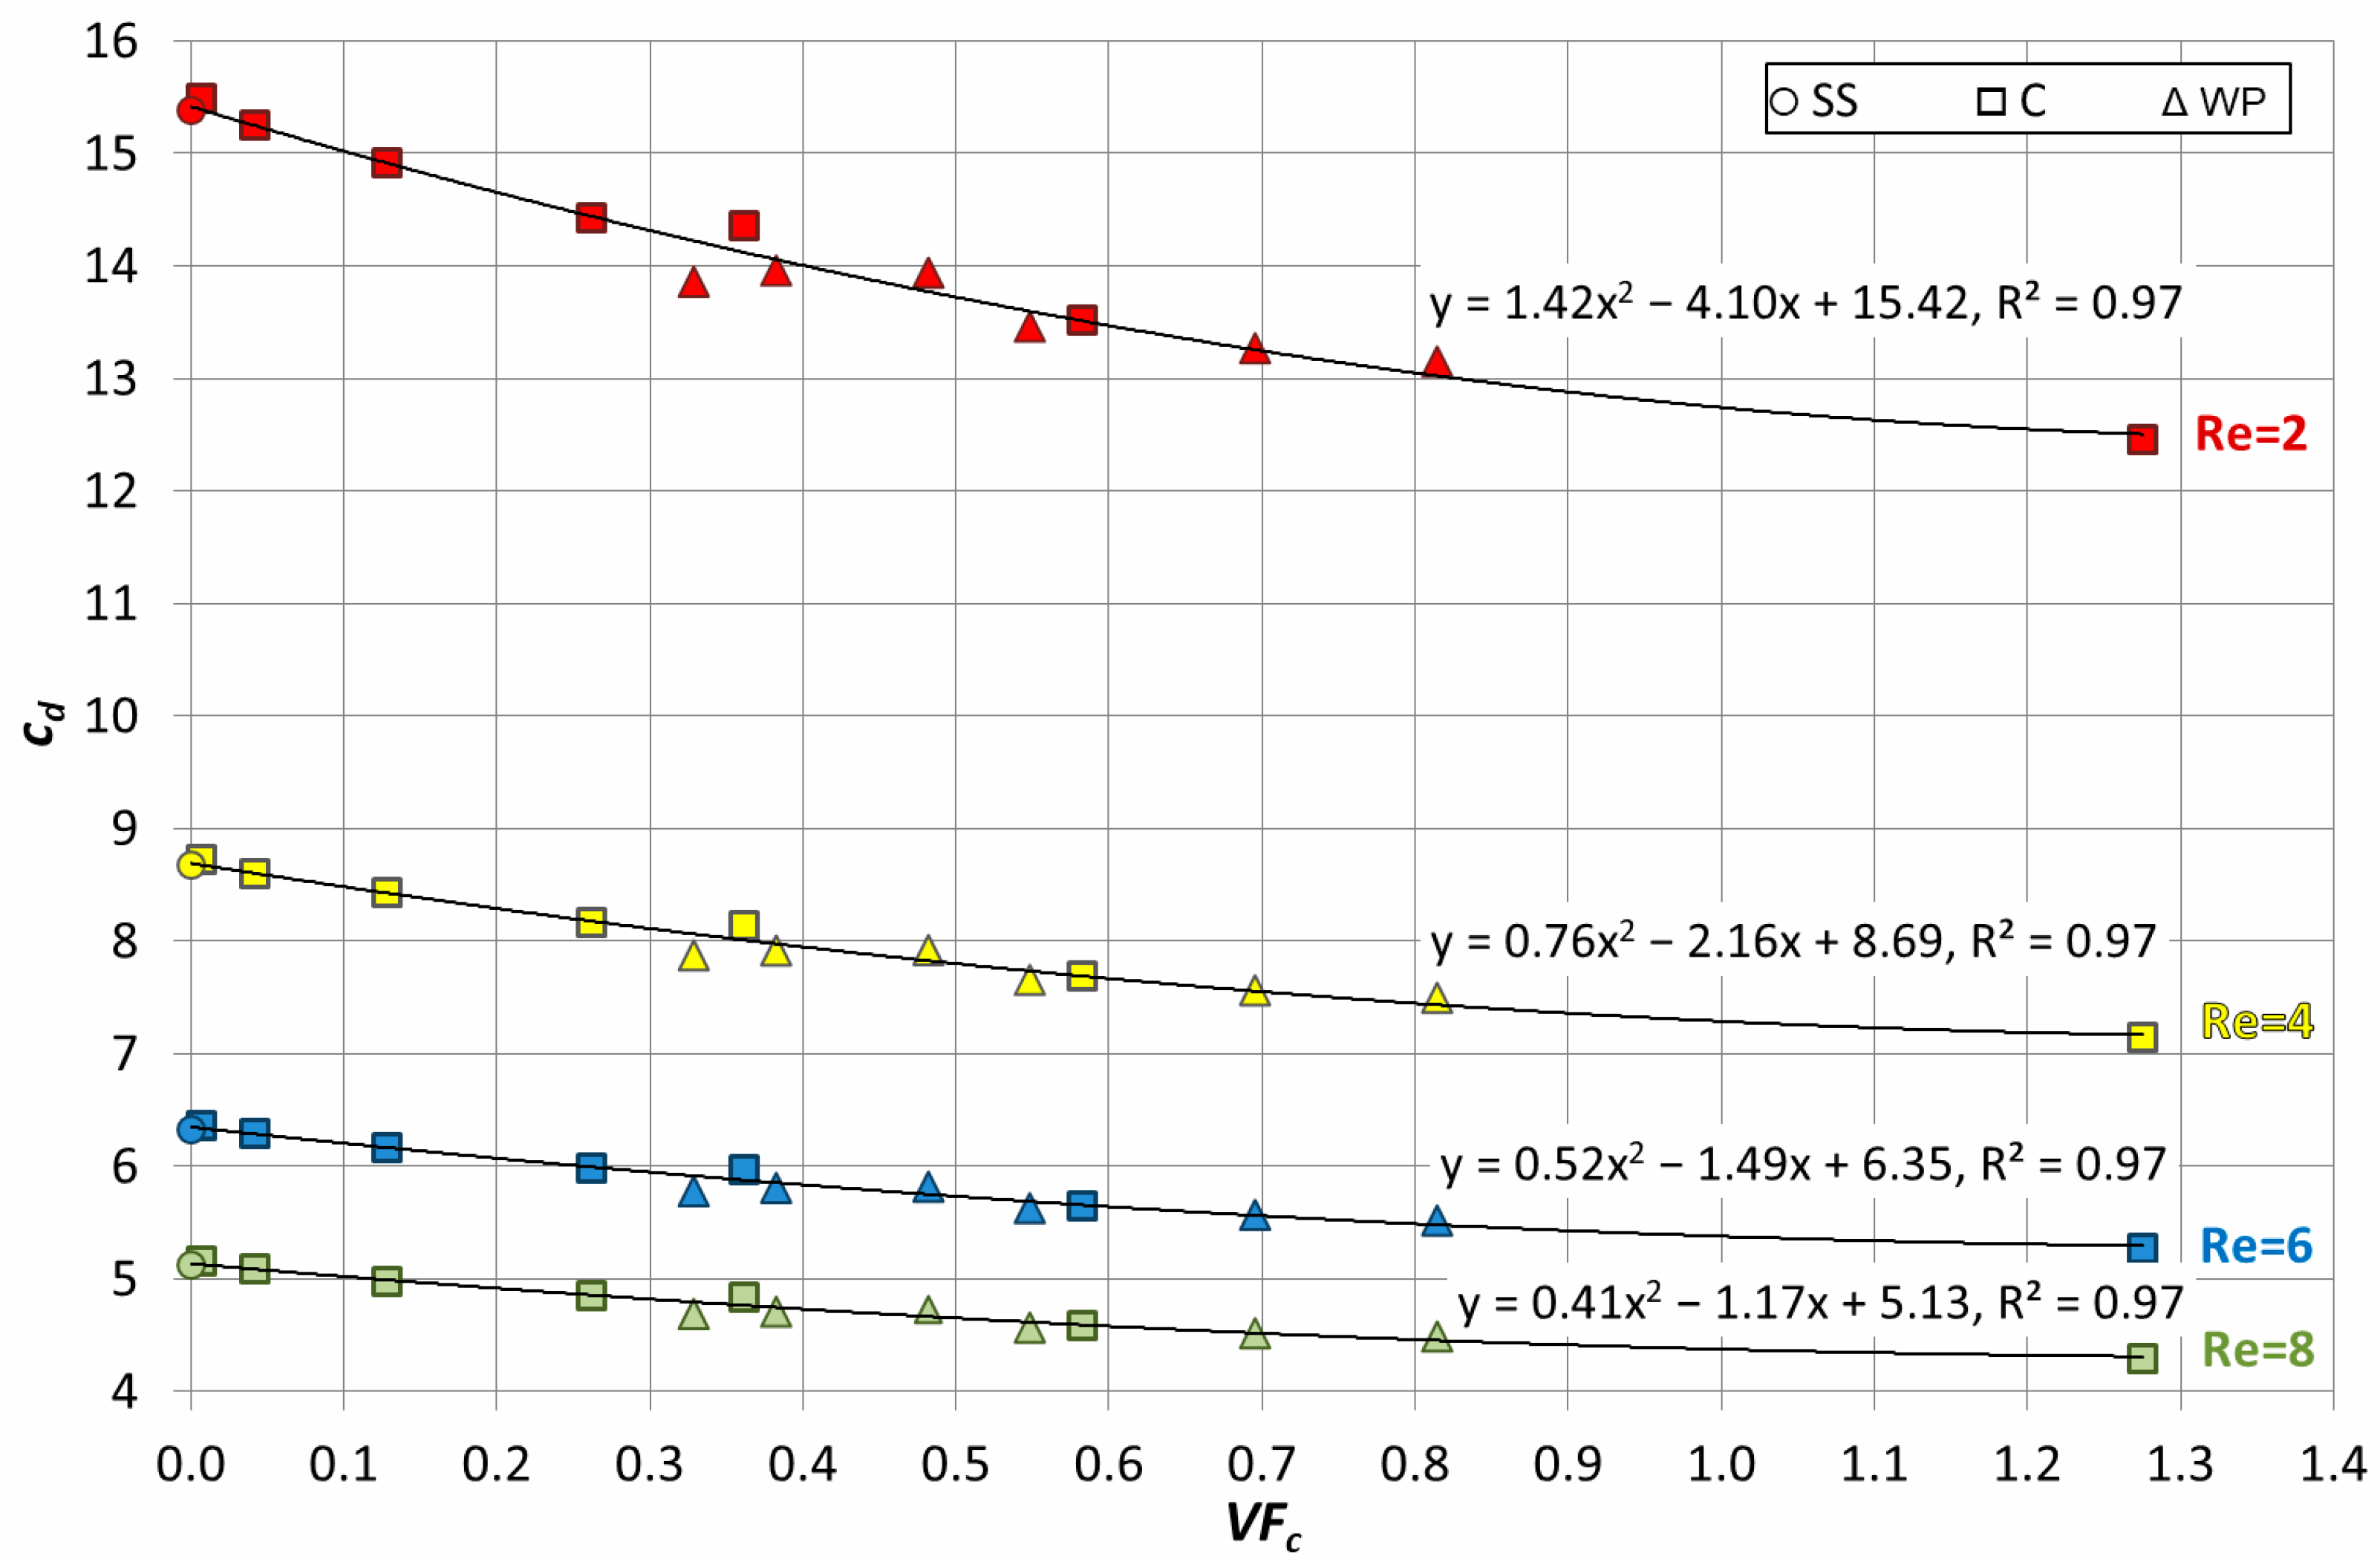
The influence of the cavities’ volumetric fraction, VFc, on the drag coefficient, cd, was also investigated, and results are plotted in Figure 9. It is obvious that, as long as the volume of cavities increases, the drag coefficient is reduced. A second-degree polynomial describes this relationship well:
c d = 1.42 V F c 2 4.10 V F c + 15.42 , R e = 2
c d = 0.76 V F c 2 2.16 V F c + 8.69 , R e = 4
c d = 0.52 V F c 2 1.49 V F c + 6.35 , R e = 6
c d = 0.41 V F c 2 1.176 V F c + 5.13 , R e = 8
The correlation coefficient R2 is found to be 0.97 in all cases, which indicates a very good correlation between the input and output variables.
Investigation of the effect of roughness’ scaling was performed by numerical calculations of the drag coefficient, at Re = 4, for particles with ID from A to F (Table 3). According to the results, the maximum absolute deviation of drag, cd, between numerical calculations and the ones resulting from Equation (7), is found to be 1.98%, which may be considered negligible. Therefore, although Equation (7) was derived from the results of Weaire–Phelan and orthogonal particles, it can also be applied for rough particles created by a different technique, under the application of the same definitions of mean diameter, Dm, and volumetric fraction, VFc. Table 3 presents the drag results, including the geometrical characteristics of the particles.
From the results in Table 3, it seems that particles with the same volumetric fraction values, VFc, but a different number and shape of cavities, exhibit the same drag coefficient. Although extreme values of cavity number (e.g., 1 or 2 cavities) or cavity size (e.g., extremely deep and narrow cavities) have not been considered, for the same volume fraction, the examples of Table 3 span a range of almost an order of magnitude for number of cavities and a factor of three for cavity side length, with a maximum variation of only 2.8%. Although further investigation is warranted for extreme cavity sizes and shapes, this is a strong indication that the number and shape of the roughness elements on the sphere’s surface do not alter the drag coefficient estimated by Equation (7), as long as the particles possess the same volumetric fraction. This conclusion is expected to be valid for Equations (6), (8) and (9), as well.
Although the dependence on volume fraction has been shown, drag is an interfacial phenomenon between the solid and the fluid, so the influence of the particles’ cavities’ area fraction, AFc, on the drag components is further investigated, as illustrated in Figure 10. Pressure and viscous drag components (cdp and cdf, respectively) are calculated as pressure and viscous forces divided by 0.5 ρ A u 2 , where ρ, A, and u are the density, projected area, and free stream velocity, respectively.
For the smooth spherical particle (AFc = Ac/As = 0), which means no cavities, the skin friction drag contributes the most to the total drag formation in comparison with the form drag. As roughness increases due to cavities presence, the skin friction drag decreases, and the form drag increases. At a value of approximately AFc = 57%, both form and skin friction drag components have almost the same contribution to the total drag. As AFc increases further, form drag becomes dominant in total drag. Similar observations about friction and form drag forces have been reported in the literature, e.g., in 2D numerical simulations [22]. More precisely, smooth particles induce a higher friction and a lower form drag than roughened particles. The same conclusion has been reported during axisymmetric numerical simulations of spherical particles with a hydrophobic surface and roughness created by baffles at Re = 10 [35]. More specifically, as long as the solid fraction area increases by increasing the width of the baffles around the particles, the form drag decreases and the friction drag increases, while the total drag increases, which is consistent with the above results. The dependence of cdp/cd and cdf/cd against Sa/Dm and VFc has also been studied but was found not to be as clear as with AFc.
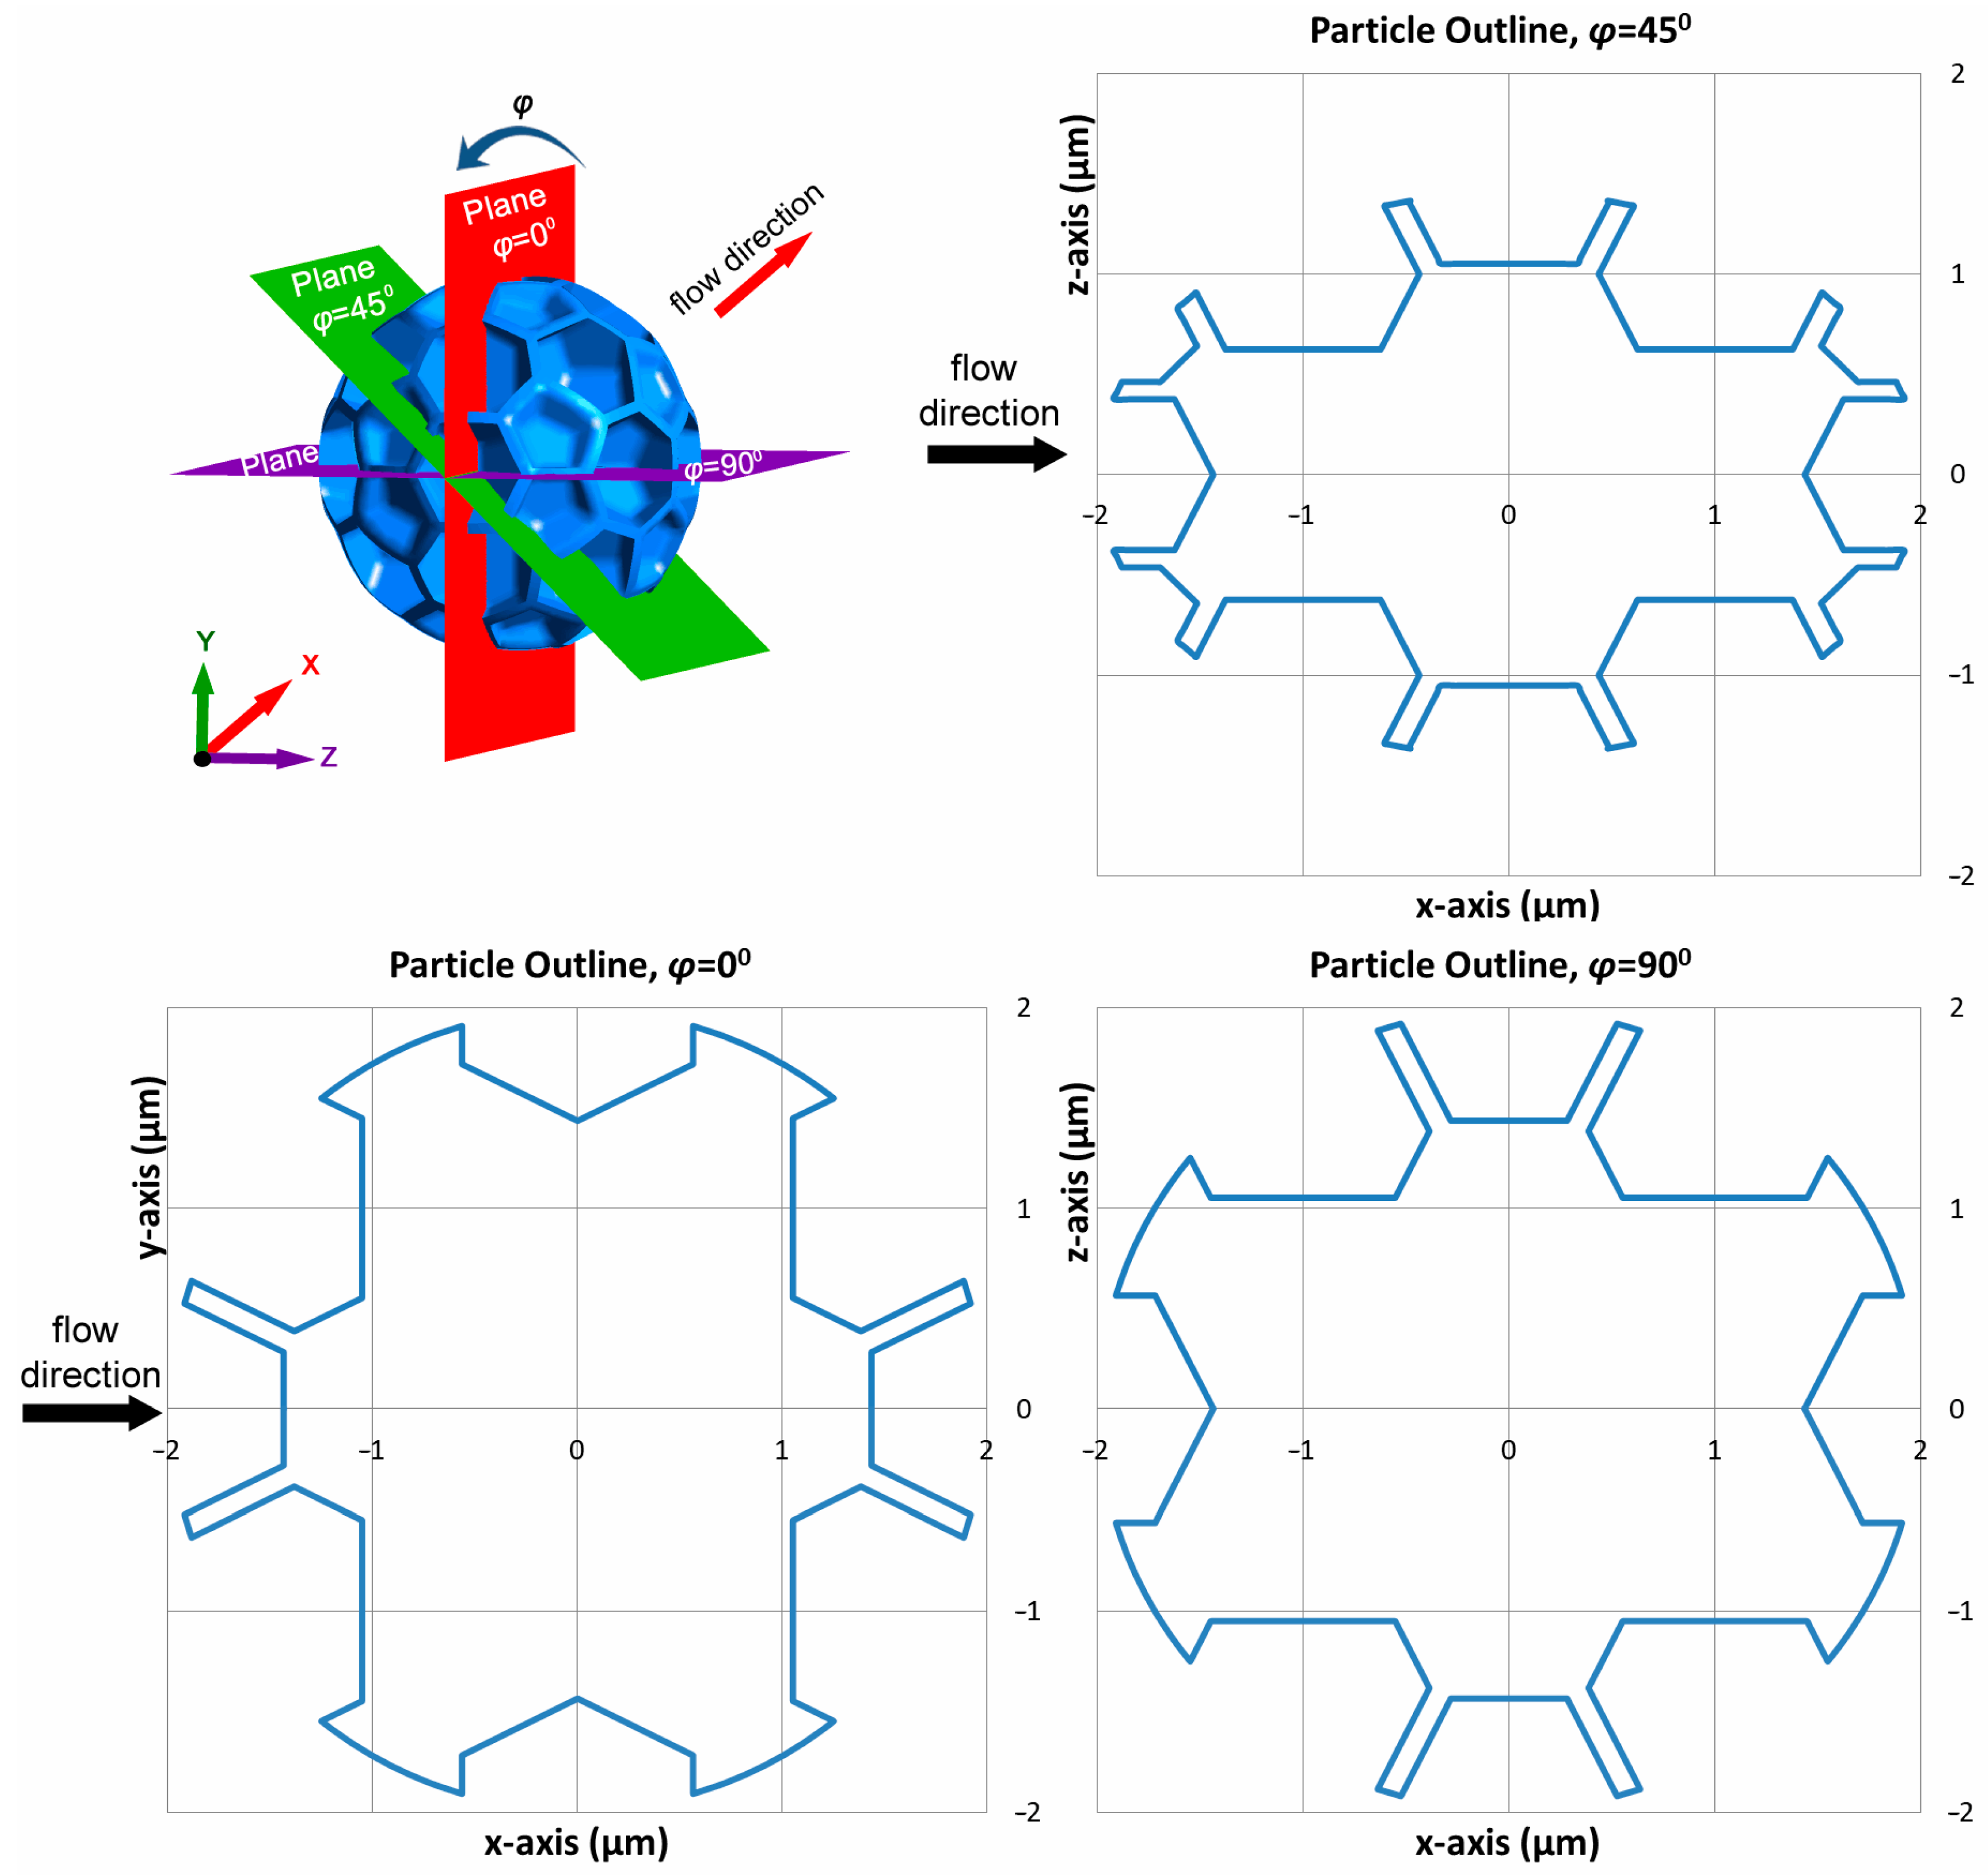
In order to explain the above-mentioned results more thoroughly and thus obtain a better understanding of the mechanisms inducing drag at rough spherical particles in laminar flow, a detailed examination of the local flow characteristics at the roughness scale is warranted. In Figure 11, outlines formed from the intersection of the Weaire–Phelan particle with ID6, with planes parallel to the flow, at different polar (zenith) angles of 0°, 45°, and 90° are presented, showing the irregularity of the roughness distribution.
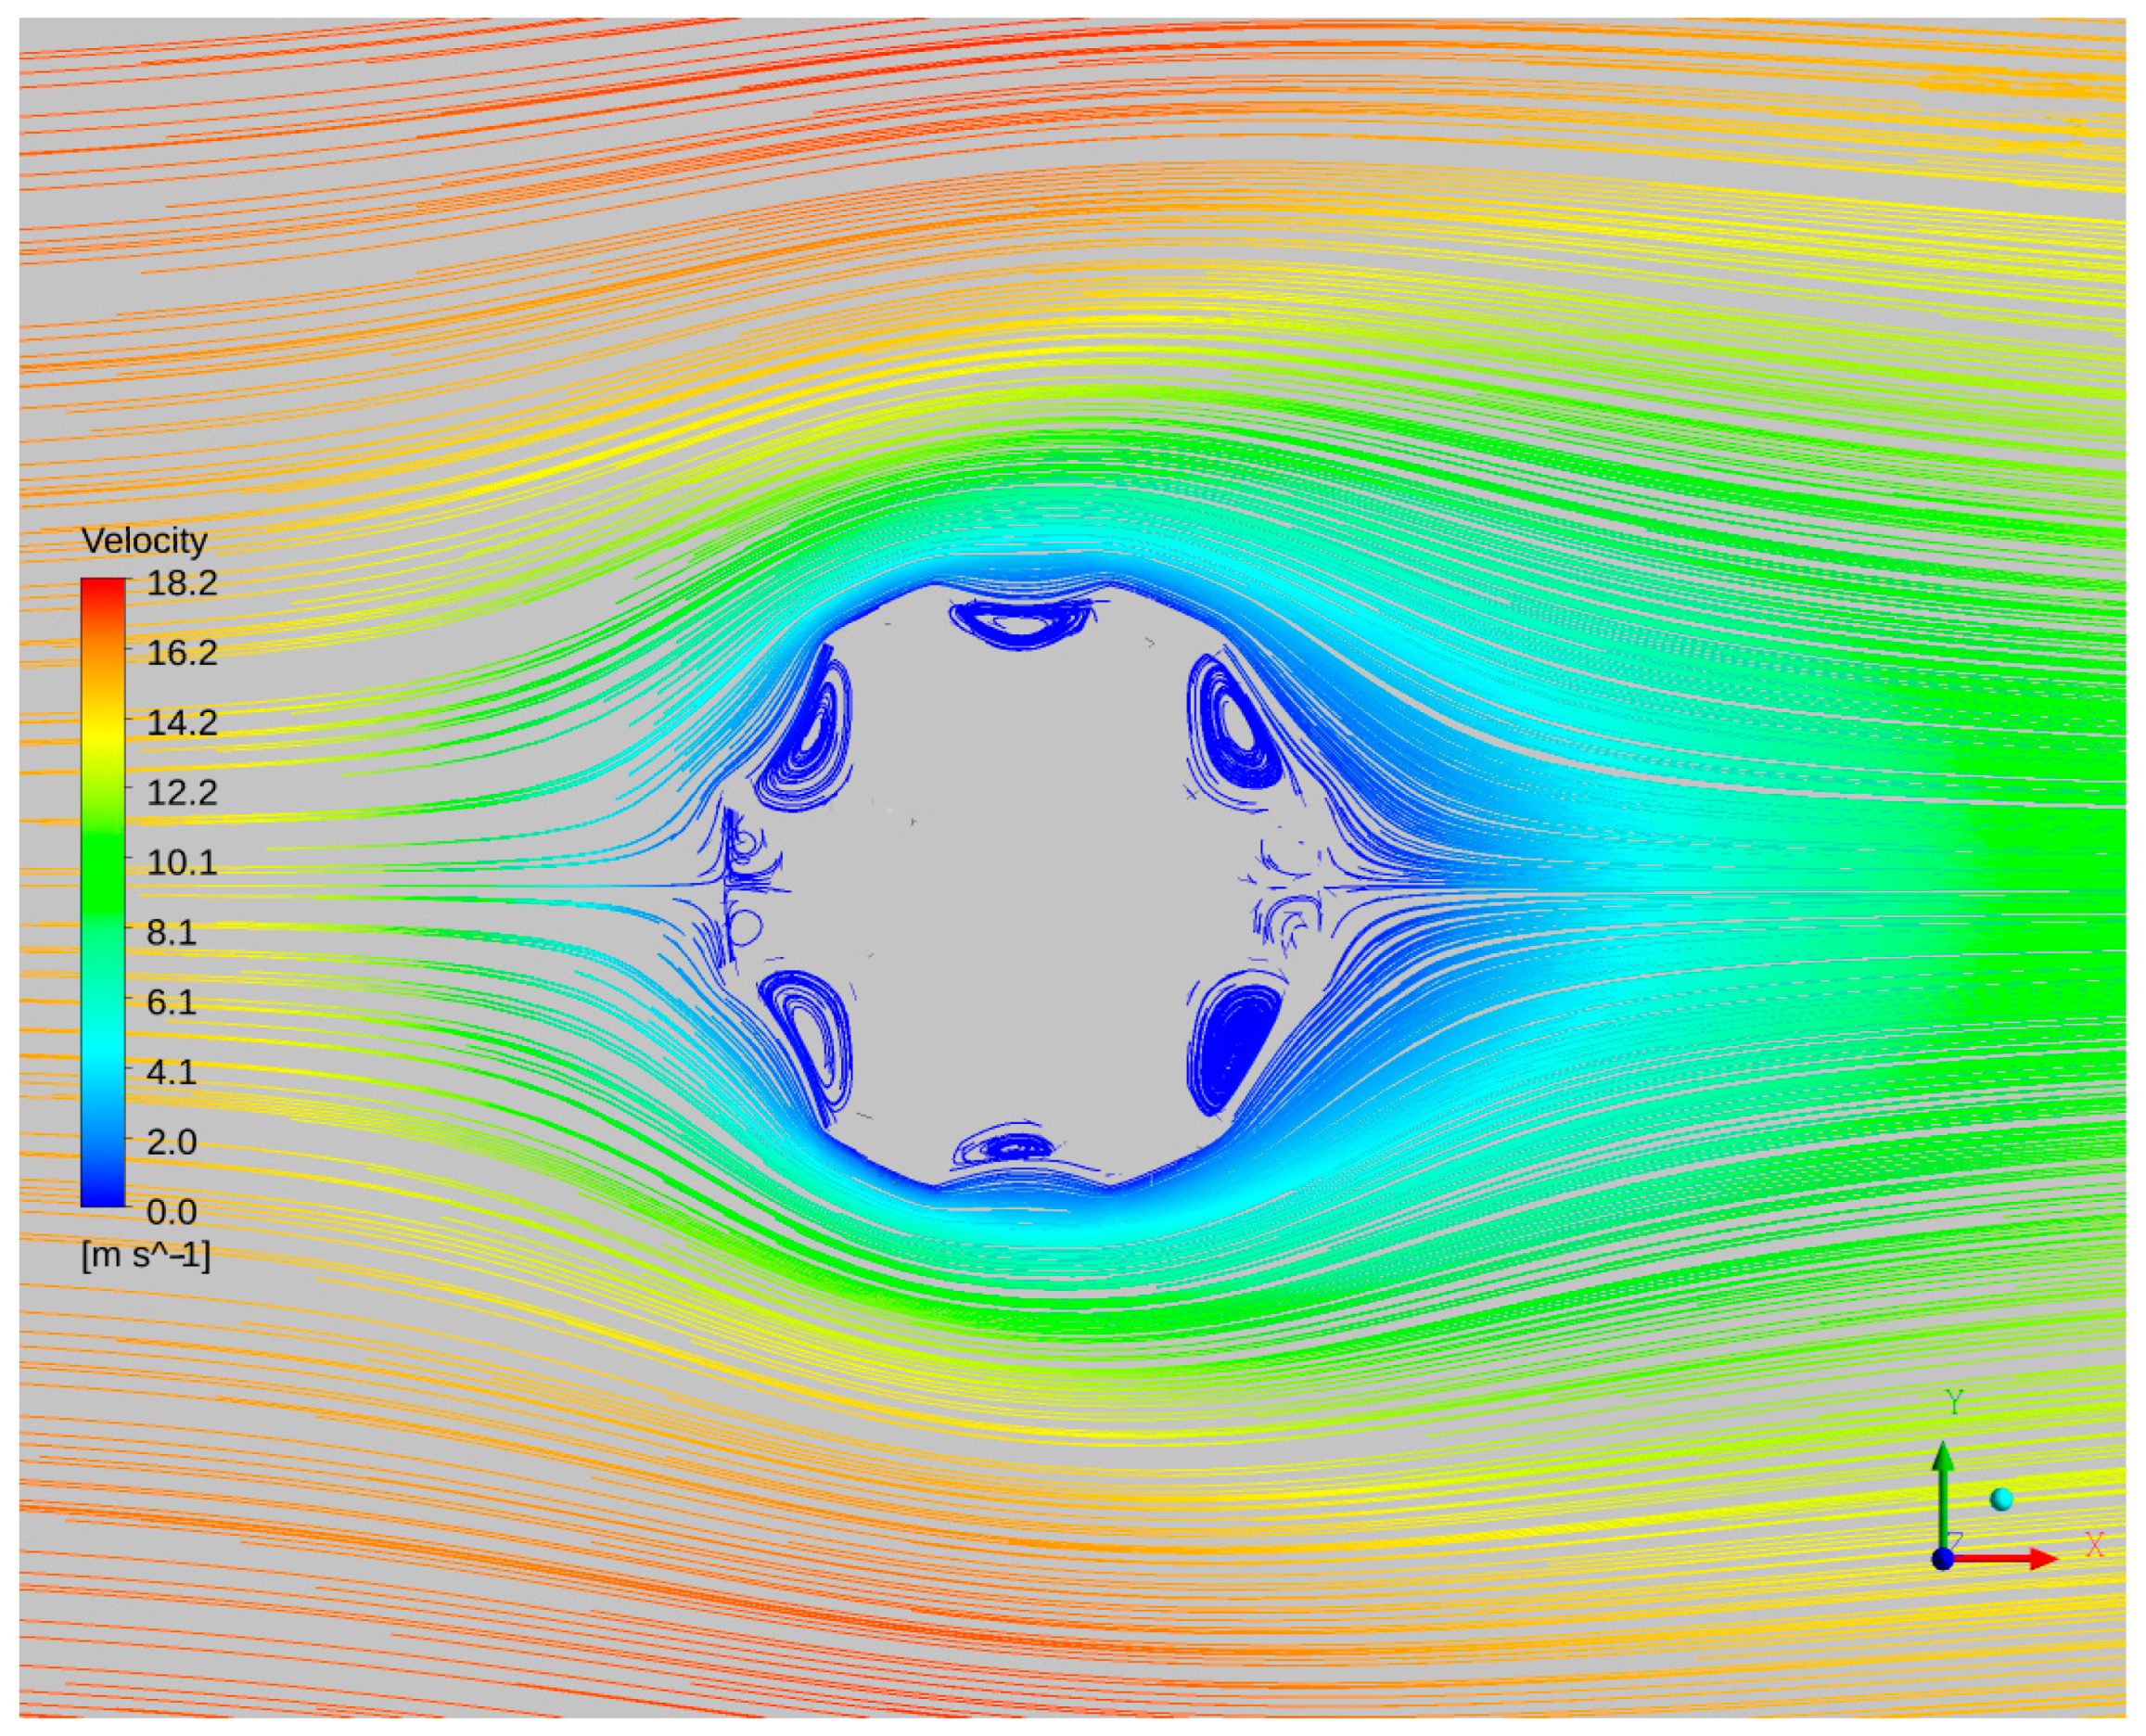
The particle’s irregularities consist of cavities, within which fluid flow recirculation occurs, as illustrated in Figure 12. Such recirculation zones are also observed in numerical simulations of rough particles, reported in the literature [22,23] and [35]. Therefore, the mainstream does not enter the cavities but skims over the particle’s top surface without reaching the base of the cavities, where the lower recirculation zone velocities dominate.
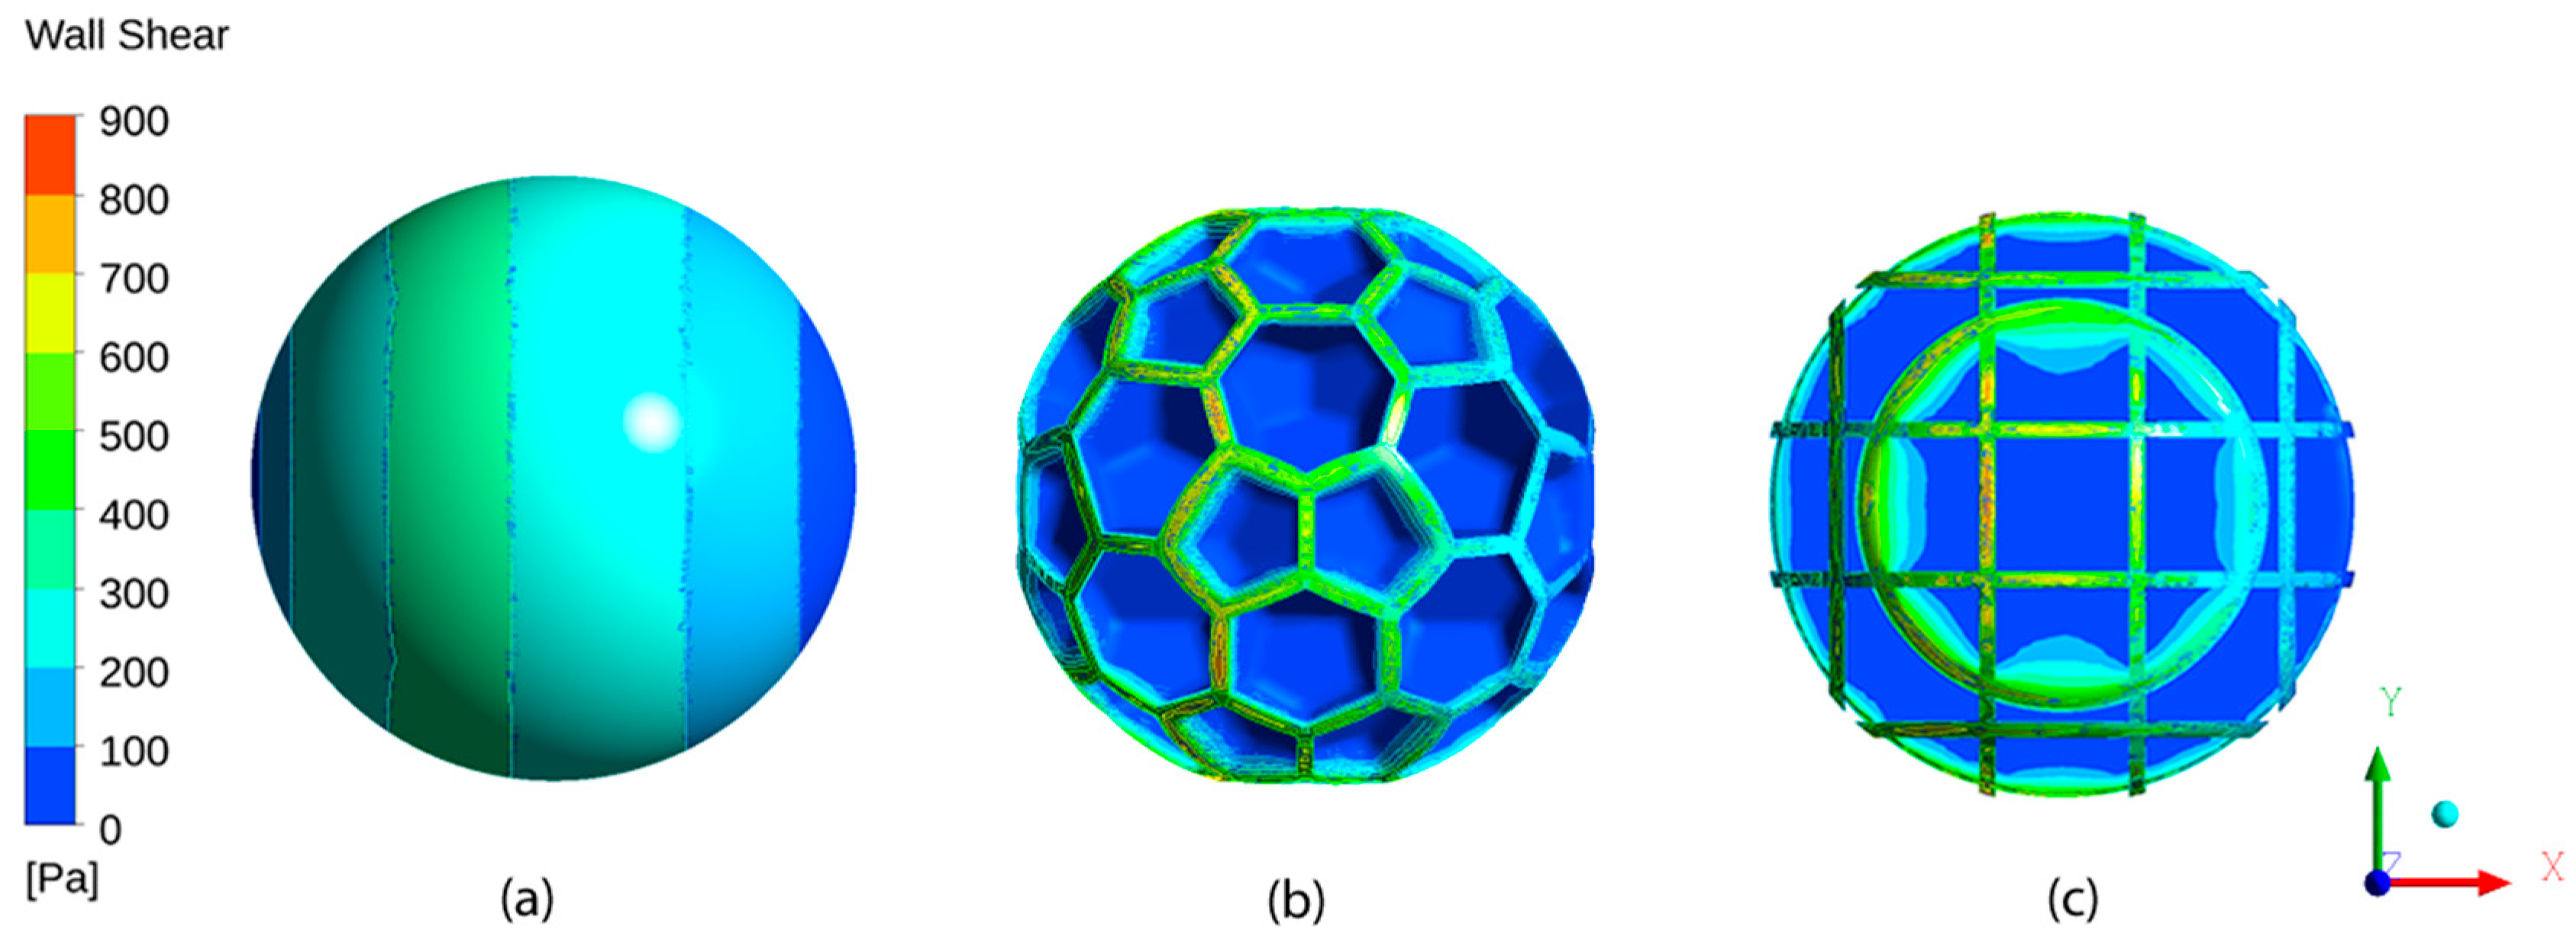
The nearly stagnant zones within the cavities serve as an efficient “self-lubrication” for the main fluid flow, decreasing the overall skin friction drag. The wall shear stress contours are presented in Figure 13 for the different cases of one smooth sphere and two rough particles at Re = 4.
Within the cavities, the wall shear stress is almost zero; however, it has a steep increase on the top wall surfaces. In Figure 14, the wall shear stress of particle ID6 is compared to that of a smooth sphere for different polar angles at Re = 4. Note that, in the figure, the shear stress curves for the rough particle follow the particle’s outer surface, rather than the x-axis and therefore indicate two values for the same x position when there is a protrusion. The oscillations observed in Figure 12 are attributed to the interpolation technique applied for the numerical solution at the cells’ centroids, which is based on the two-units-away cell face centers in both directions along each axis. This technique provides two independent solutions for the pressure field at one cell centroid, which leads to the known checkerboard oscillations.
Similar observations of the self-lubricating effect have been reported on riblets covering a solid surface, in laminar and turbulent flows, and, although riblets increase the total area, the skin friction drag is not significantly increased because the main flow remains above the riblets, interacting with their tips only. High shear stresses are thus observed on the riblets’ tips, but within the valleys, the velocity field is weak [7].
Another indication of the self-lubrication effect is through the normalized plot of the velocity profile above the particle at φ = 0° polar angle and θ = 0° azimuthal angle, illustrated in Figure 15, which is similar to that found in a previous research study [23]. The variable r* denotes the radial coordinate normalized by the particle’s radius (Dm/2), whereas u* is the circumferential velocity normalized by the free stream velocity.
For the smooth particle, the velocity gradient above the surface is finite, as the one expected according to theory, indicating a finite shear stress at the particle’s surface. For a rough particle, however, the velocity radial gradient approaches zero in the vicinity of the cavity, which starts to grow, as r* increases, meeting the smooth particle’s curve asymptotically. The zero gradient indicates a zero-shear stress and therefore the lubrication effects of the recirculation zone on the mainstream.
Figure 16 illustrates the vorticity contour surrounding a spherical particle and inside a representative cavity, revealing a slow swirling motion within the cavities and moderate vorticity along the upper surfaces of the protrusions.
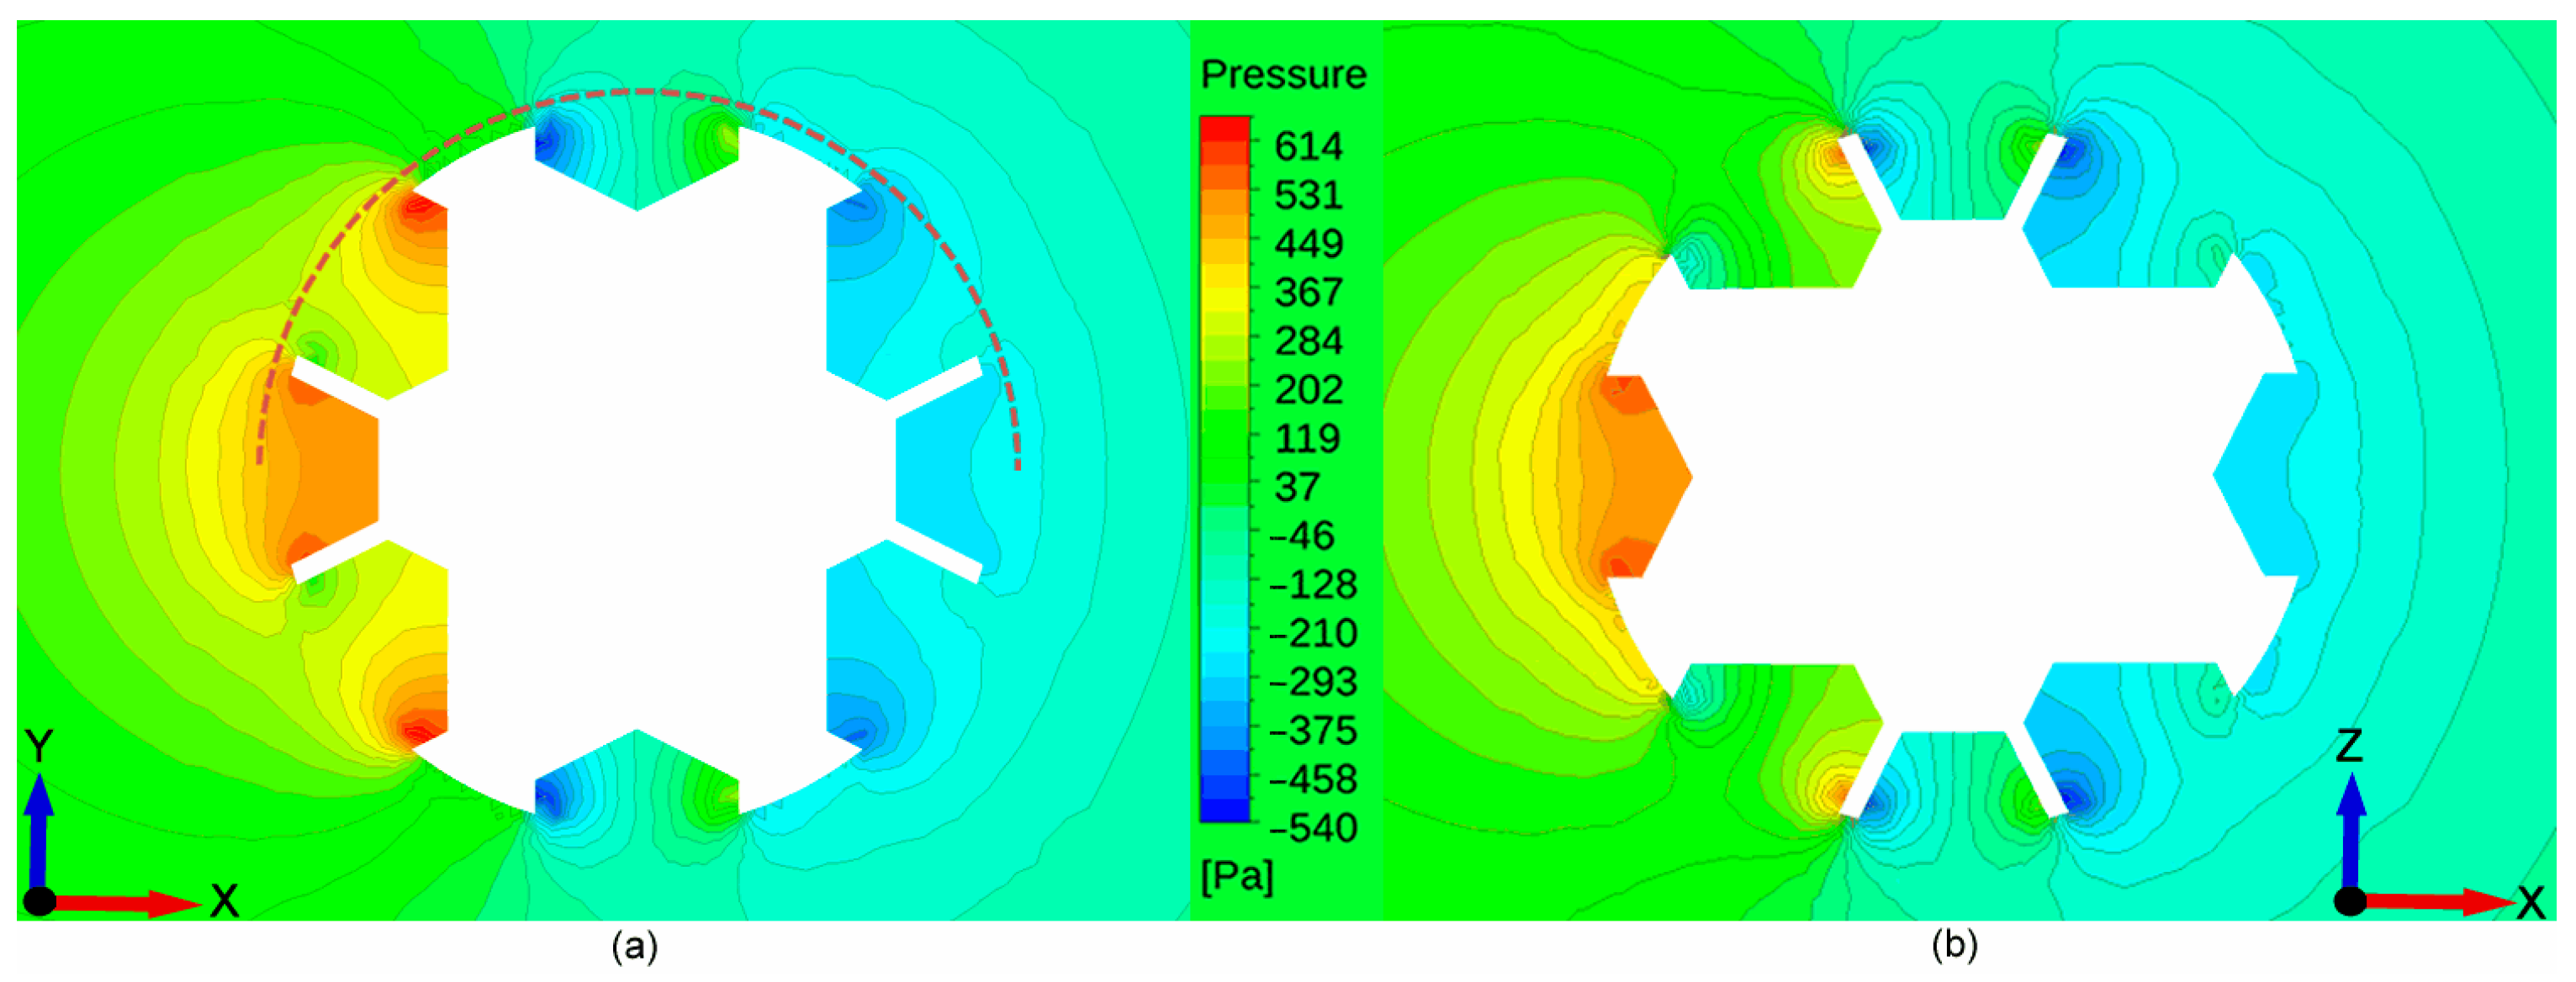
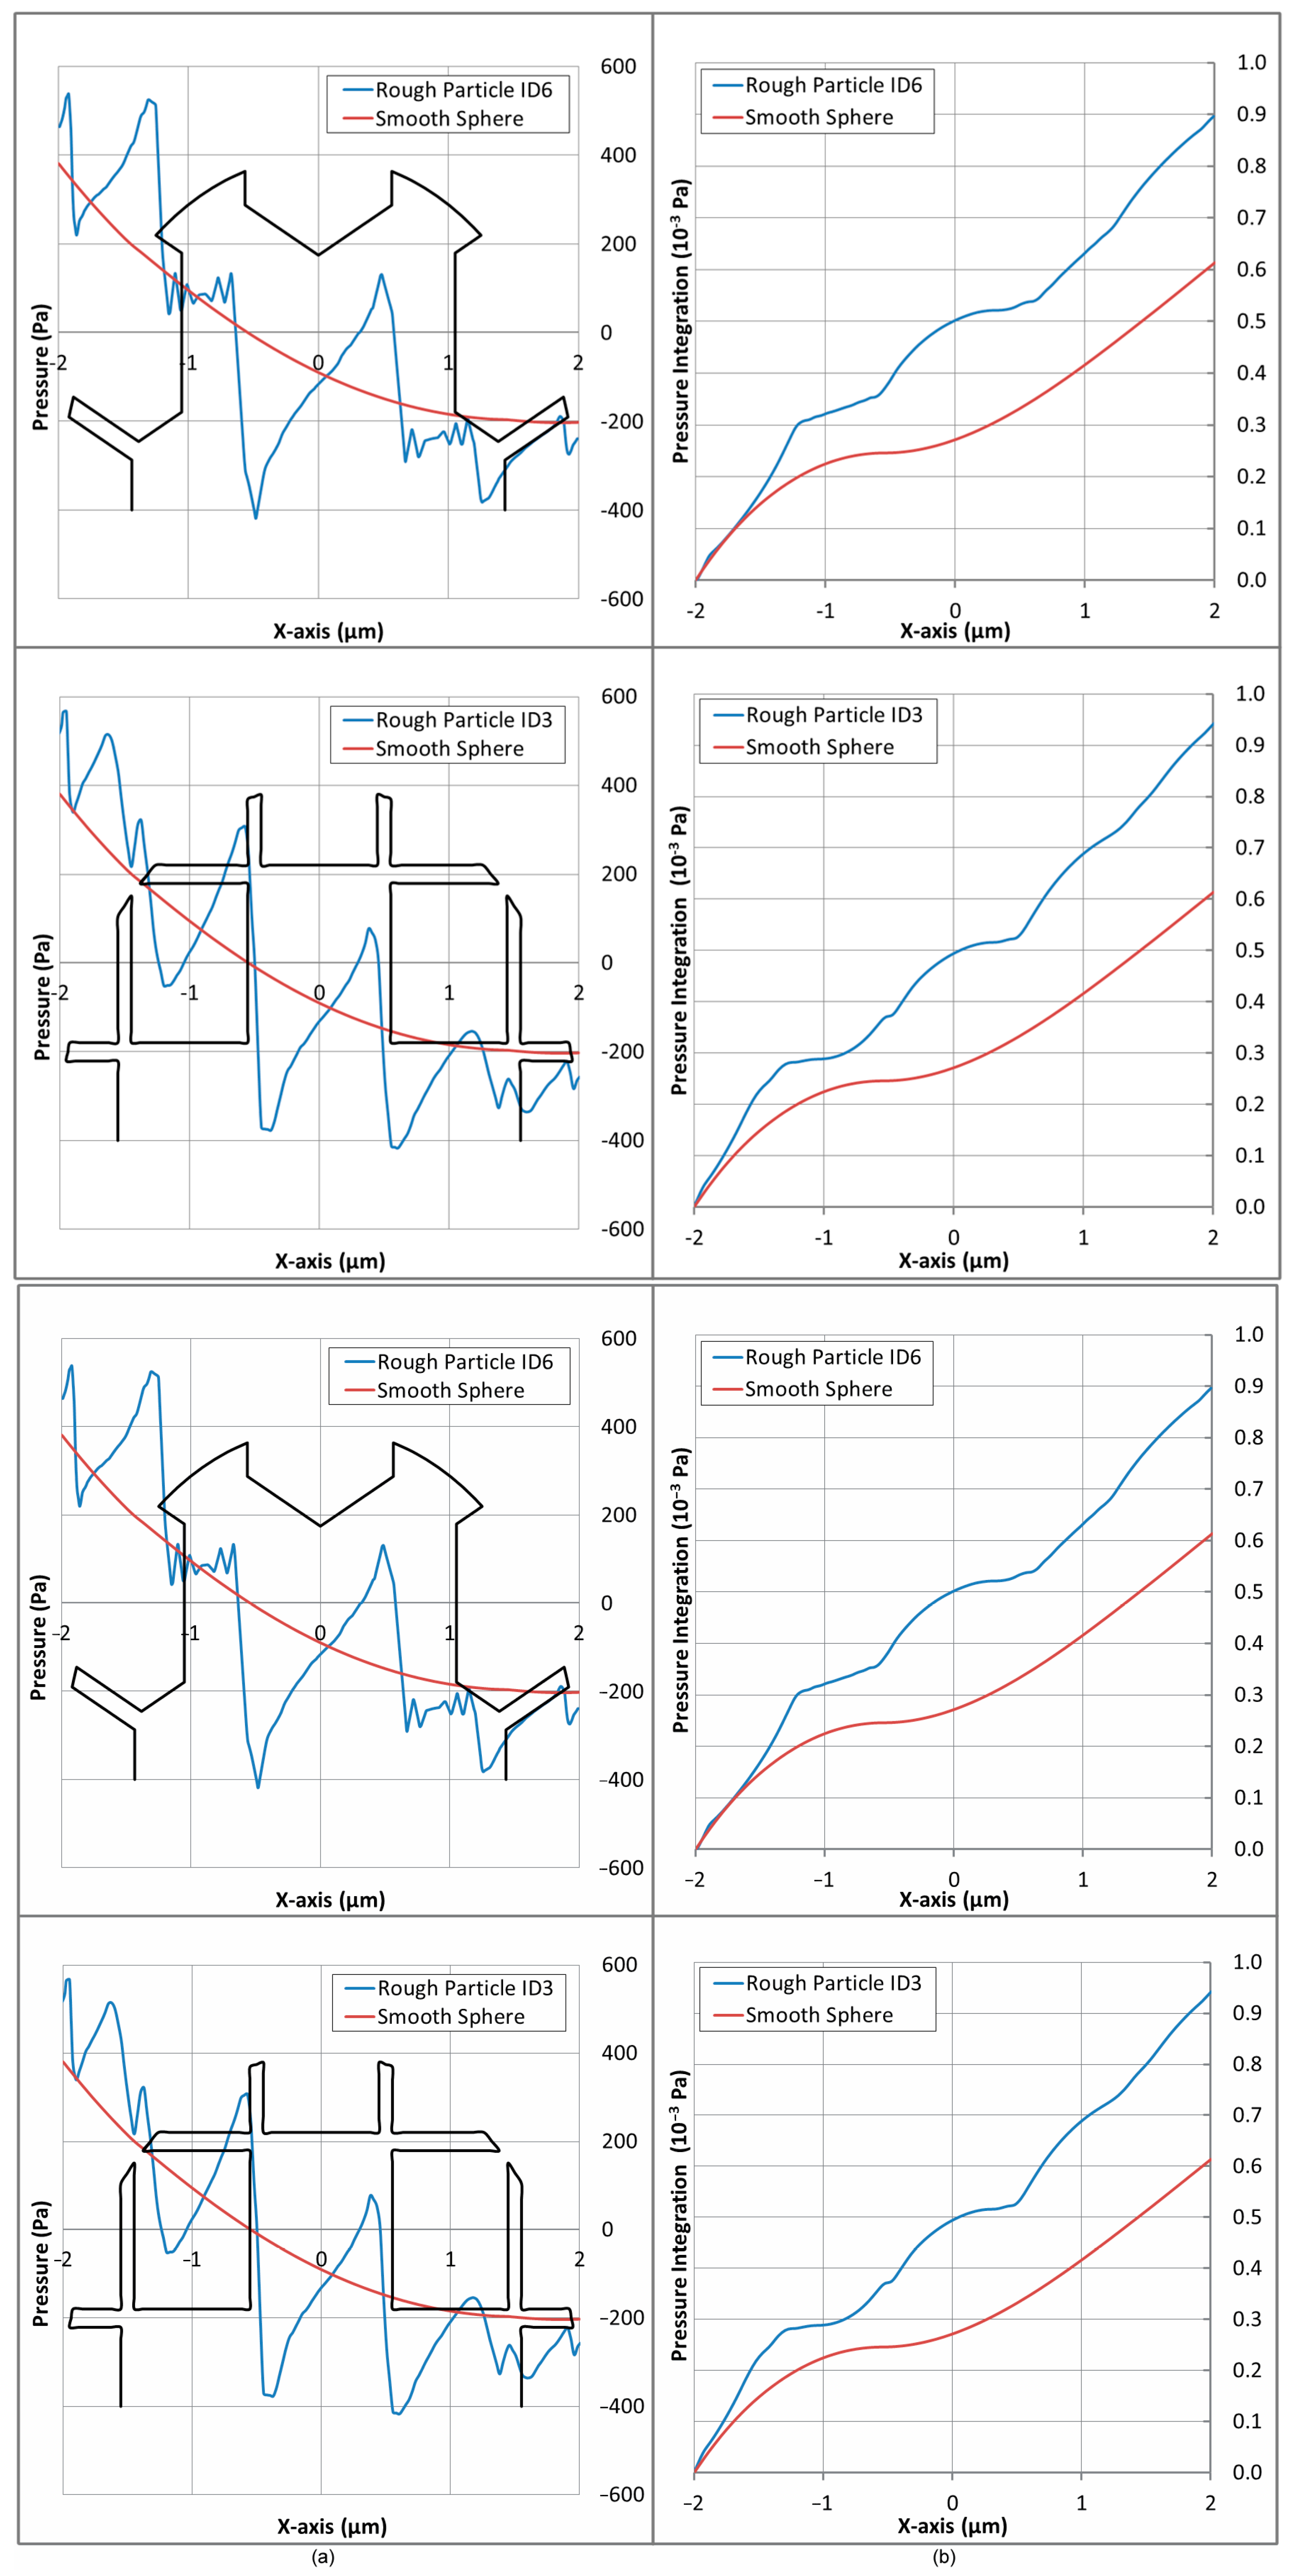
The particles’ roughness (cavities) creates local “blunt configurations” on the outer surface of the particles, which increase the pressure at the upstream side of the particle and therefore the pressure drop across the particle, thus augmenting form drag as shown in Figure 10. Figure 17 illustrates the non-uniform pressure distributions around these blunt configurations, along the particle, at the planes’ intersections of polar angles 0° and 90° at Re = 4 (see Figure 11).
This is also supported by the results at Re = 4, presented in Figure 18. Figure 18a shows the pressure distribution along an arc belonging to a plane at φ = 0° and extending from θ = 0–180°, i.e., aligned with the main flow in the x-axis and radius 1% higher than the particles’ (assuming the particles’ outer diameter coincides with their highest peak). An example has been drawn in Figure 17a for clarity. Integrating these pressure distribution curves along the x-axis, at unit width, results in the cumulative pressure forces that are plotted in Figure 18b. It is evident that the presence of roughness leads to a downstream increase in pressure after the stagnation point on the upstream side and to a pressure drop on the downstream (suction) side.
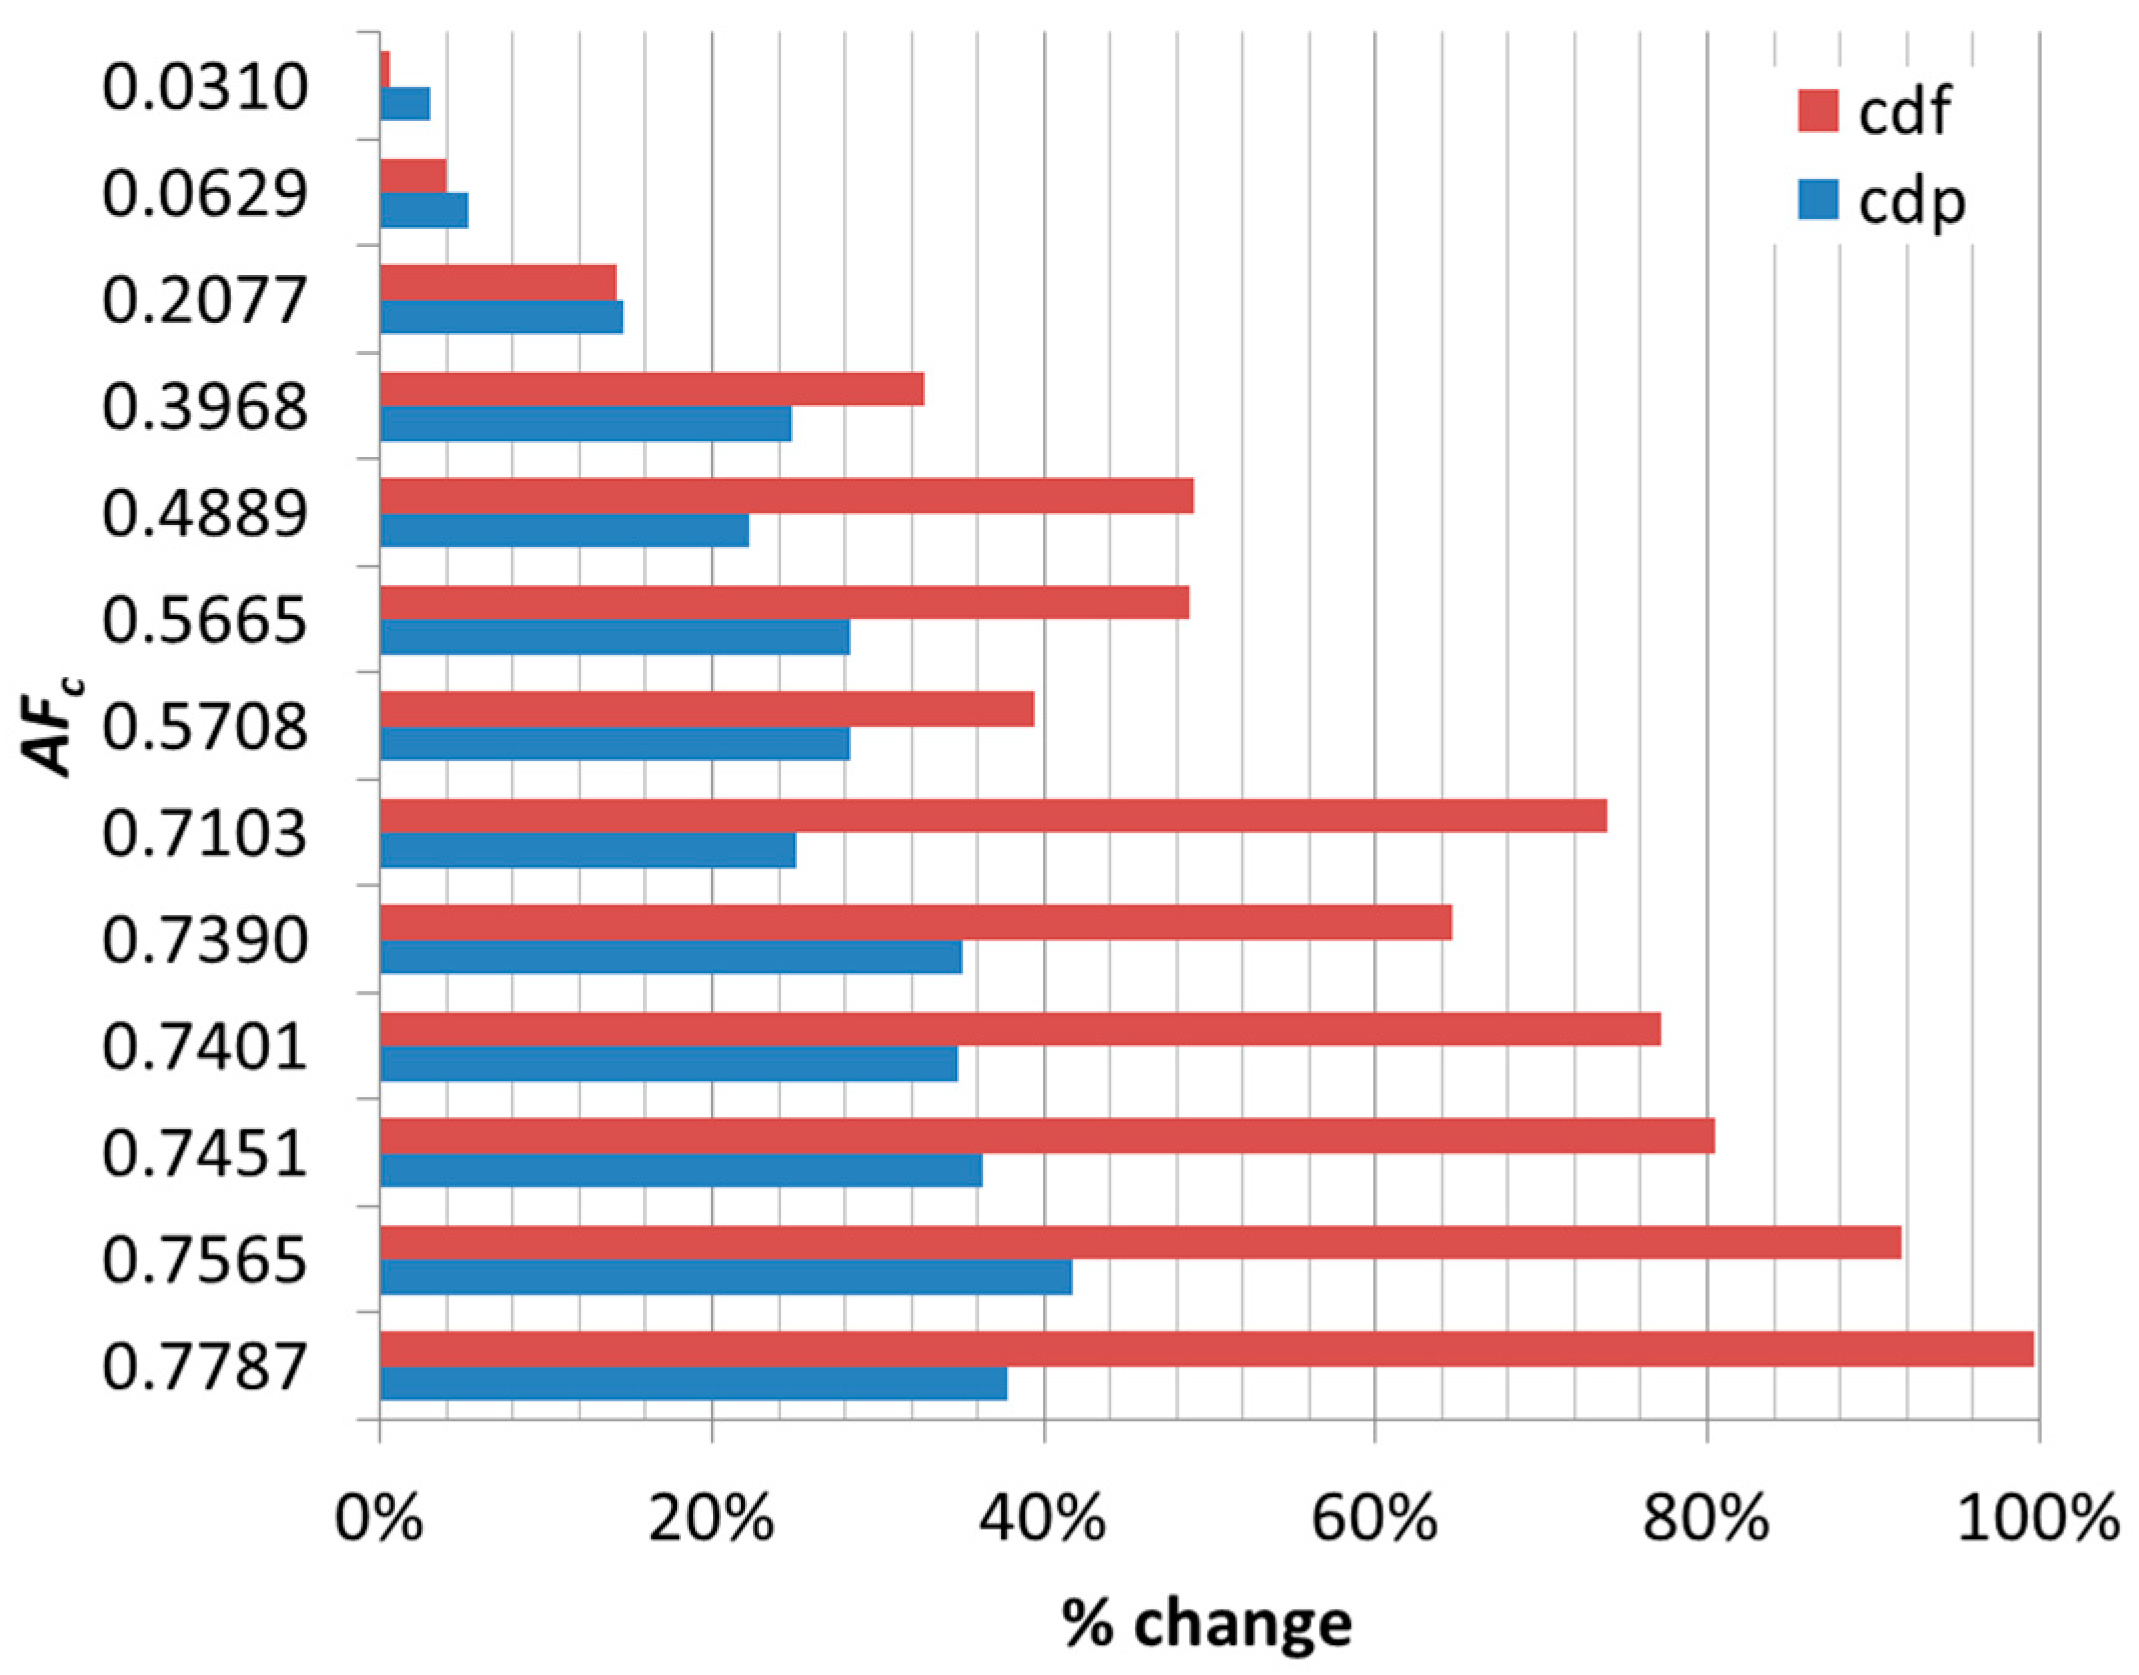
The percentage change of the drag components, cdf and cdp, at Re = 4, based on the smooth sphere’s coefficients, is illustrated in Figure 19, from where it is concluded that for AFc values higher than 0.2077, the skin friction drag reduction becomes greater than the form drag increase. The results are consistent with the previous qualitative findings in the literature [22,23]. Still, for these Reynolds numbers, skin friction drag remains as the larger contribution to total drag as the cavity’s area fraction increases, and only at values of AFc = 57% and above does form (pressure) drag dominate and contribute more to the total drag (Figure 10).
One of the primary concerns regarding these rough particles is the blockage of surface cavities by impurities present in the fluid. This cavity blockage can lead to performance degradation by diminishing the intended enhancements in heat and mass transfer. The impact of such blockage on flow resistance in laminar regimes lies beyond the scope of the current study and will be addressed in future research.

5. Conclusions

It is generally considered that roughness does not influence the drag coefficient in laminar flow over spherical particles, and most of the research studies are focused on the transitional and turbulent regimes. In the present study, it has been shown that increased micro-particles’ roughness reduces the drag coefficient at low Re numbers. The investigation has been carried out computationally at four different Reynolds numbers, ranging from 2 to 8, using spherical particles of different roughness patterns, created on the basis of (a) the Weaire–Phelan structure and (b) an orthogonal lattice one. Contrary to past studies found in the literature, where the roughness elements have been identical and periodic on the solid surface, the present investigation involves roughness elements of varying shape, size, and distribution. The particles’ roughness has been determined as per different definitions based on either the surface or volumetric characteristics of the particles, including the mean diameter concept used to evaluate relative roughness.
According to the present results, roughness could reduce the total drag up to 21.4% (at Re = 4), independently of the particles’ surface pattern and orientation. This result is based on the relative roughness definition (Sa/Dm) and is consistent qualitatively with other research work found in the literature at the Stokes regime. A second-degree polynomial has been found to represent the relationship between the drag coefficient, cd, and the cavities’ volumetric fraction.
Further analysis of the drag components has revealed that as long as the cavities’ area fraction increases, the initially dominant contribution of the skin friction drag decreases, and form drag takes over.
By visualizing the fluid streamlines at an intersected plane along the flow, low velocity recirculation zones within the particles’ cavities have been revealed. The 3D wall shear stress contours indicate that shear is almost zero within these nearly stagnant zones and has a steep increase on the top surfaces of the roughness protrusions. Both findings indicate that air recirculation within the cavities acts as a “lubricating layer” that reduces shear stress, as long as the cavities are large enough to accommodate it. A similar analysis of the pressure distribution contours shows that roughness elements create “blunt” configurations, which induce the form drag increase.
Macroscopically, the normalized radial velocity reveals a zero-shear stress gradient in the vicinity of the cavities, and the pressure integration curves show a higher pressure force in the case of rough particles than in that one of smooth spheres. In order for the total drag to be reduced, the skin friction drag must achieve a greater reduction than the increase in form drag, and this seems to occur, for the present results, at cavities’ area fraction AFc = 57%.
For certain applications, where there is a relative velocity between fluid and spherical particles, the present work could be helpful for either estimating the drag coefficient of particles or optimally controlling the production process of solid particles, whenever this is feasible, so as to control particle surface roughness and consequently drag and flight behavior.
Further investigation is currently underway for the energy transfer between the particles and the environment, assuming them at different temperatures, to investigate the effect of roughness on the convection heat transfer coefficient around the particles created.
Author Contributions

Conceptualization, D.B.; methodology, D.B. and K.-S.N.; validation, E.P. formal analysis, E.P., D.B. and K.-S.N.; investigation, E.P.; writing—original draft preparation, E.P.; writing—review and editing, E.P., D.B. and K.-S.N.; visualization, E.P., D.B. and K.-S.N.; supervision, D.B. and K.-S.N. All authors have read and agreed to the published version of the manuscript.

Funding

This research received no external funding.

Institutional Review Board Statement

Not applicable.

Informed Consent Statement

Not applicable.

Data Availability Statement

The data that support the findings of this study are available from Mendeley.

Conflicts of Interest

The authors declare no conflicts of interest.

References

  1. Happel, J.; Brenner, H. Low Reynolds Number Hydrodynamics; Martinus Nijhoff Publishers: Leiden, The Netherlands, 1983. [Google Scholar]
  2. Munson, B.R.; Okiishi, T.H.; Huebsch, W.W.; Rothmayer, A.P. Fundamentals of Fluid Mechanics; J. Wiley & Sons: Hoboken, NJ, USA, 2013. [Google Scholar]
  3. Barati, R.; Akbar, S.A.; Neyshabouri, S.; Ahmadi, G. Development of empirical models with high accuracy for estimation of drag coefficient of flow around a smooth sphere: An evolutionary approach. Powder Technol. 2014, 257, 11–19. [Google Scholar] [CrossRef]
  4. Nandiyanto, A.B.D.; Okuyama, K. Progress in developing spray-drying methods for the production of controlled morphology particles: From the nanometer to submicrometer size ranges. Adv. Powder Technol. 2011, 22, 1–19. [Google Scholar] [CrossRef]
  5. Tan, Y.; Ni, Y.; Xu, W.; Xie, Y.; Li, L.; Tan, D. Key technologies and development trends of the soft abrasive flow finishing method. J. Zhejiang Univ. Sci. 2023, 24, 1043–1064. [Google Scholar] [CrossRef]
  6. Hsiao, L.C.; Pradeep, S. Experimental synthesis and characterization of rough particles for colloidal and granular rheology. Curr. Opin. Colloid Interface Sci. 2019, 43, 94–112. [Google Scholar] [CrossRef]
  7. Dean, B.; Bhushan, B. Shark-skin surfaces for fluid-drag reduction in turbulent flow: A review, Philos. Transact. A Math. Phys. Eng. Sci. 2010, 368, 4775–4806. [Google Scholar]
  8. Walsh, M.J.; Anders, J.B. Riblet/LEBU research at NASA Langle. Appl. Sci. Res. 1989, 46, 255–262. [Google Scholar] [CrossRef]
  9. Bechert, D.W.; Bruse, M.; Hage, W.; Van der Hoeven, J.G.T.; Hoppe, G. Experiments on drag reducing surfaces and their optimization with an adjustable geometry. J. Fluid Mech. 1997, 338, 59–87. [Google Scholar] [CrossRef]
  10. Weiss, M.H. Implementation of drag reduction techniques in natural gas pipelines. In Proceedings of the 10th European Drag Reduction Working Meeting, Berlin, Germany, 19–21 March 1997. [Google Scholar]
  11. Matthews, J.N.A. Low-drag suit propels swimmers. Phys. Today 2008, 61, 32. [Google Scholar] [CrossRef]
  12. Rao, Y.; Feng, Y.; Li, B.; Weigand, B. Experimental and Numerical Study of Heat Transfer and Flow Friction in Channels with Dimples of Different Shapes. J. Heat Transf. 2015, 137, 031901. [Google Scholar] [CrossRef]
  13. Sarkar, K.; Prosperetti, A. Effective boundary conditions for Stokes flow over a rough surface. J. Fluid Mech. 1996, 316, 223–240. [Google Scholar] [CrossRef]
  14. Choi, J.; Jeon, W.-P.; Choi, H. Mechanism of drag reduction by dimples on a sphere. Phys. Fluids 2006, 18, 041702. [Google Scholar] [CrossRef]
  15. Chowdhury, H.; Loganathan, B.; Wang, Y.; Mustary, I.; Alam, F. A study of dimple characteristics on golf ball drag. Procedia Eng. 2016, 147, 87–91. [Google Scholar] [CrossRef]
  16. Aoki, K.; Muto, K.; Okanaga, H. Mechanism of Drag Reduction by Dimple Structures on a Sphere. J. Fluid Sci. Technol. 2012, 7, 1–10. [Google Scholar] [CrossRef]
  17. Bogdanovic-Jovanovic, J.B.; Stamenkovic, Z.M.; Kocic, M.M. Experimental and numerical investigation of flow around a sphere with dimples for various flow regimes. Therm. Sci. 2012, 16, 1013–1026. [Google Scholar] [CrossRef]
  18. Ting, L.L. Effects of Dimple Size and Depth on Golf Ball Aerodynamic Performance. In Proceedings of the ASME/JSME 2003 4th Joint Fluids Summer Engineering Conference, Honolulu, HI, USA, 6–10 July 2003; Volume 2, Symposia, Parts A, B, and C. pp. 811–817. [Google Scholar]
  19. Kim, J.; Choi, H. Aerodynamics of a golf ball with grooves. Proc. Inst. Mech. Eng. Part P J. Sports Eng. Technol. 2014, 228, 233–241. [Google Scholar] [CrossRef]
  20. Chen, X.; Li, C.; Yang, Z.; Dong, Y.; Wang, F.; Cheng, Z.; Yang, C. Golf-ball-inspired phase change material capsule: Experimental and numerical simulation analysis of flow characteristics and thermal performance. Energy J. 2024, 293, 130595. [Google Scholar] [CrossRef]
  21. Cheng, X.; Zhai, X.; Wang, X.; Lin, P. Numerical study of forced convection over phase change material capsules in a traditional spherical shape and a biomimetric shape. J. Energy Storage 2020, 31, 101526. [Google Scholar] [CrossRef]
  22. Byon, C.; Nam, Y.; Kim, S.J.; Ju, Y.S. The effect of Surface Treatment on the Drag Characteristics in Laminar Flow. In Proceedings of the International Conference on Micro/Nanoscale Heat and Mass Transfer, Shanghai, China, 18–21 December 2009; pp. 315–321. [Google Scholar]
  23. Byon, C.; Nam, Y.; Kim, S.J.; Ju, Y.S. Drag Reduction in Stokes flows over spheres with nanostructured superhydrophillic surfaces. J. Appl. Phys. 2010, 107, 066102. [Google Scholar] [CrossRef]
  24. Weaire, D.; Phelan, R. A counter-example to Kelvin’s conjecture on minimal surfaces. Philos. Mag. Lett. 1994, 69, 107–110. [Google Scholar] [CrossRef]
  25. Naga, N.; Jinno, M.; Wang, Y.; Nakano, T. The first space-filling polyhedrons of polymer cubic cells originated from Weaire-Phelan structure created by polymerization induced phase separation. Sci. Rep. 2022, 12, 19141. [Google Scholar] [CrossRef]
  26. Al-Shannaq, R.; Farid, M.M.; Ikutegbe, C.A. Methods for the Synthesis of Phase Change Material Microcapsules with Enhanced Thermophysical Properties—A State-of-the-Art Review. Micro 2022, 2, 426–474. [Google Scholar] [CrossRef]
  27. Li, W.; Song, G.; Tang, G.; Chu, X.; Ma, S.; Liu, C. Morphology, structure and thermal stability of microencapsulated phase change material with copolymer shell. Energy J. 2011, 36, 785–791. [Google Scholar] [CrossRef]
  28. Yang, L.; Liu, S.; Zheng, H. A comprehensive review of hydrodynamic mechanisms and heat transfer characteristics for microencapsulated phase change slurry (MPCS) in circular tube. Renew. Sustain. Energy Rev. 2019, 114, 109312. [Google Scholar] [CrossRef]
  29. Diaconu, B.M.; Cruceru, M.; Anghelescu, L. Phase Change Materials—Applications and Systems Designs: A Literature Review. Des. J. 2022, 6, 117. [Google Scholar] [CrossRef]
  30. Borreguero, A.M.; Valverde, J.L.; Rodríguez, J.F.; Barber, A.H.; Cubillo, J.J.; Carmona, M. Synthesis and characterization of microcapsules containing Rubitherm®RT27 obtained by spray drying. J. Chem. Eng. 2011, 166, 384–390. [Google Scholar] [CrossRef]
  31. Kopanidis, A.; Theodorakakos, A.; Gavaises, E.; Bouris, D. 3D numerical simulation of flow and conjugate heat transfer through a pore scale model of high porosity open cell metal foam. Int. J. Heat Mass Transf. 2010, 53, 2539–2550. [Google Scholar] [CrossRef]
  32. Papazoglou, E.P.; Bouris, D.; Nikas, S.P. Numerical investigation drag coefficient of micro-encapsulated roughened PCM particles in laminar flow. IOP Conf. Ser. Mater. Sci. Eng. 2018, 459, 012018. [Google Scholar] [CrossRef]
  33. ISO 25178-2:2012; Geometrical Product Specifications (GPS)—Surface Texture: Areal—Part 2: Terms, Definitions and Surface Texture Parameters. ISO: Geneva, Switzerland, 2012.
  34. Dierich, F.; Nikrityuk, P.A. A numerical study of the impact of surface roughness on heat and fluid flow past a cylindrical particle. Int. J. Therm. Sci. 2013, 65, 92–103. [Google Scholar] [CrossRef]
  35. Gruncell, B.R.K.; Sandham, N.D.; McHale, G. Simulations of laminar flow past a superhydrophobic sphere with drag reduction and separation delay. Phys. Fluids 2013, 25, 043601. [Google Scholar] [CrossRef]
  36. ISO 21920-2:2021; Geometrical Product Specifications (GPS)—Surface Texture: Profile—Part 2: Terms, Definitions and Surface texture parameters. ISO: Geneva, Switzerland, 2021.
  37. Clift, R.; Grace, J.R.; Weber, M.E. Bubbles, Drops and Particles; Academic Press: New York, NY, USA, 1978. [Google Scholar]
Figure 1. (a) Weaire–Phelan structure, (b) Orthogonal lattice structure.
Applsci 15 09090 g001
Figure 2. Main steps of Weaire–Phelan rough particles creation.
Applsci 15 09090 g002
Figure 3. (a) Weaire–Phelan rough particle and (b) Cartesian lattice rough particle.
Applsci 15 09090 g003
Figure 4. Definitions of AFc and VFc: (a) cavities surface area (Ac), (b) smooth sphere surface area (As), (c) typical cavity volume (Vc), and, (d) irregular particle total volume (Vt).
Applsci 15 09090 g004
Figure 5. Computational domain and boundary conditions.
Applsci 15 09090 g005
Figure 6. Computational grid in YX and YZ planes. Flow is always in the +X direction.
Applsci 15 09090 g006
Figure 7. Comparison of computed drag coefficient past a smooth sphere with literature data (Clift et al. [37]).
Applsci 15 09090 g007
Figure 8. Drag coefficient against relative roughness for smooth sphere (SS), Cartesian lattice (C), and Weaire–Phelan (WP) particles at Re = 2, 4, 6, and 8.
Applsci 15 09090 g008
Figure 9. Drag coefficient against cavities’ volumetric fraction for smooth sphere (SS), Cartesian lattice (C), and Weaire–Phelan (WP) particles at Re = 2, 4, 6, 8.
Applsci 15 09090 g009
Figure 10. Normalized drag components against cavities’ area fraction for all particles studied [smooth sphere (SS), Cartesian lattice (C), and Weaire–Phelan (WP) particles] at Re = 2, 4, 6, 8.
Applsci 15 09090 g010
Figure 11. Rough ID6 particle’s outlines at intersections with planes at different polar angles.
Applsci 15 09090 g011
Figure 12. Fluid streamlines at intersected plane of 0° polar angle (see Figure 7) for particle ID6 at Re = 4.
Applsci 15 09090 g012
Figure 13. Wall shear stress contours (a) smooth sphere, (b) rough particle WP ID6, and (c) rough particle C ID3 at Re = 4.
Applsci 15 09090 g013
Figure 14. Wall shear stress plots [Pa] along the top half of WP particle ID 6, at Re = 4, and different polar angles corresponding to those shown in Figure 11.
Applsci 15 09090 g014
Figure 15. Circumferential normalized velocity profiles (Re = 4) at 0° polar angle (along the vertical red line shown in insert).
Applsci 15 09090 g015
Figure 16. Vorticity distribution at intersected plane of 0° polar angle (see Figure 11) for particle ID6 at Re = 4.
Applsci 15 09090 g016
Figure 17. Pressure distribution at different intersected planes of polar angles (a) φ = 0° and (b) φ = 90° (see Figure 11) for particle ID6 at Re = 4. The dotted red line in (a) corresponds to the path of integration for Figure 18.
Applsci 15 09090 g017
Figure 18. (a) Pressure distribution along an arc of φ = 0° and θ = 0–180° at Re = 4 (See Figure 17a) and (b) pressure integration curve.
Applsci 15 09090 g018
Figure 19. Percentage change of skin friction drag and form drag at various AFc (Re = 4).
Applsci 15 09090 g019
Table 1. Results of drag coefficient at Re = 4.
Particle IDRoughness StructureDm (μm)Sa/DmAFcVFccdcdpcdf
1WP2.7260.0520.56650.32867.873.963.92
2C2.9170.0550.74510.58187.694.463.23
3C3.0440.1320.71031.27517.143.793.35
4WP3.1390.0420.75650.38257.924.883.04
5WP3.1630.0590.73900.48197.924.383.54
6WP3.2800.0730.77870.81437.504.572.92
7WP3.6810.0920.48890.69547.563.653.91
8C4.2170.0500.39680.26098.173.784.39
9WP4.3370.0640.74010.54827.664.363.29
10C4.5240.0590.57080.36148.143.964.18
11C4.9330.0130.06290.04148.613.005.61
12C4.9890.0020.03100.00698.732.935.80
13C4.8030.0320.20770.12788.433.335.10
14 (SS)Smooth sphere4.0000.0000.00000.00008.672.845.83
Table 2. Drag comparison at different particle orientations.
Particle IDcdcdpcdf
1.
ID 9
 (a) before rotation7.654.363.29
 (b) after rotation on x-axis: 25°, y-axis: 30°7.664.363.30
 (c) after rotation on x-axis: 45°, y-axis: 45°7.764.493.26
2.
ID 10
 (a) before rotation8.143.964.18
 (b) after rotation on x-axis: 55°8.163.894.27
 (c) after rotation on x-axis: 45°, y-axis: 90°8.113.814.29
Table 3. Roughness scaling results, at Re = 4.
Particle IDAΒCDEF
Graphical
Representation
Applsci 15 09090 i001Applsci 15 09090 i002Applsci 15 09090 i003Applsci 15 09090 i004Applsci 15 09090 i005Applsci 15 09090 i006
Dm (μm)3.653.643.663.653.93.88
No. of cavities1184622221446
Volume Fraction VFC0.310.310.310.310.080.08
h/l ratio1.670.830.51.620.830.27
cd
(Numerically)
8.028.058.258.088.508.46
cd
{Equation (7)}
8.098.098.098.098.528.53
Deviation (%)0.87%0.49%−1.98%0.12%0.23%0.82%
Disclaimer/Publisher’s Note: The statements, opinions and data contained in all publications are solely those of the individual author(s) and contributor(s) and not of MDPI and/or the editor(s). MDPI and/or the editor(s) disclaim responsibility for any injury to people or property resulting from any ideas, methods, instructions or products referred to in the content.