Abstract
The monitoring and prediction of air quality (AQ) is key to minimizing the negative impact of air pollution, as it enables the implementation of corrective measures. An IoT-based multi-purpose monitoring system has therefore been designed. To develop a reliable remote system, this study addresses three challenges: (1) design of a low-cost compact, robust, multi-sensor system, (2) model validation over several months to ensure accurate detection, and (3) the application of machine learning (ML) techniques to classify and predict AQ. The developed system demonstrates a significant cost reduction for regular monitoring, including effective data management under harsh environmental conditions. The prototype integrates pollutant sensors, as well as the detection of liquified petroleum gas, humidity, and temperature. A dataset with more than 30,000 entries per month (data recorded approximately every minute) was saved on the platform. Results identified the three highest pollution categories, highlighting the urgency of addressing AQ in densely populated regions. The ML algorithms allowed us to predict AQ trends with 99.97% accuracy. To summarize, by reducing monitoring costs and enabling large-scale data management, this system offers an effective solution for real-time environmental monitoring. It also highlights the potential of artificial intelligence-based AQ predictions in supporting public health initiatives. This is particularly interesting for developing countries, where pollution control is limited. Future research will develop the models to include data from different environments and seasons, exploring its integration into mobile apps and cloud platforms for real-time monitoring.
1. Introduction
The economic and urban development of cities has led to increased air pollution, which has become a major problem for human health. Worldwide, an estimated 4.2 million premature deaths are related to air pollution: 29% due to lung cancer, 17% to acute lower respiratory tract infections, 24% to stroke, 25% to heart disease, and 43% to chronic obstructive pulmonary disease [1]. According to the World Health Organization (WHO), the main air pollutants are CO, SO2, and NO2. In addition to these gases, volatile organic compounds (VOC) and particulate matter (PM) also pose a serious threat [2]. Exposure to these contaminants can cause minor problems, i.e., nose and eye irritation. In the long term, however, it can even cause deadly diseases, such as cancer. High levels of pollution increase the risk of acid rain, which can cause disease in humans [3]. Furthermore, the ecosystem is adversely affected, influencing the growth of trees and plants. The technology used in industrialized countries leads to an increase in industries and vehicles and, therefore, higher levels of air pollution. Air pollution is harmful to the environment, with some emissions contributing to global warming. Therefore, reducing air pollution is a crucial—albeit time-intensive—endeavor. One of the most important tasks in the fight against air pollution is the accurate measurement and prediction of air quality (AQ). This would enable the design of essential measures to prevent and minimize the effects of air pollution [4]. To gain knowledge about AQ levels in real time, technology is required that provides information and warnings and allows monitoring on the web. One of these technologies is the Internet of Things (IoT), which can transmit data through a network without human interaction. It is an internet-based system that facilitates links and interactions between the environment and users through the internet. The arrangement of a net of sensors, satellite information, and IoT devices has demonstrated the potential to acquire extensive AQ data over time. This enables scientists to study tendencies, classify pollution sources, and evaluate control measure feasibility. Complete air information is analyzed in the IoT cloud. With respect to IoT design, the system involves sensing, network, and application layers. With such extensive environmental data, accurate predictions can only be made through detailed evaluation, which can be successfully carried out by machine learning (ML) algorithms [5]. A standard IoT system typically involves four factors [6], as can be seen in Figure 1. These are IoT devices, IoT gateway and connectivity, cloud and data processing, and a user interface.

Figure 1.
Internet of Things system modules.
Several authors have assessed pollution levels using IoT technology. Witczak et al. provided an overview of IoT-based monitoring and control systems, discussing various aspects of these systems, including their architecture, applications, and challenges [7]. Edupuganti et al. designed an IoT-based methodology to measure, in real time, temperature, humidity, various gases, microbes, and light intensity. It included sensor nodes (MQ2, MQ135, DTH11, and LDR), a gateway (Arduino Uno), a Wi-Fi module (ESP8266) (Espressif Systems, Shanghai, China), an LCD, and a publicly accessible cloud server (ThingSpeak platform from The MathWorks, Inc., Natick, MA, USA). Graphs were built based on sensor information collected from the webpage, and were connected to Secure Digital (SD) cards for data storage. Pollution was monitored by connecting a Global Positioning System (GPS) module to the selected location before publishing the information on a public webpage [8]. To improve existing systems, Mohan et al. proposed a three-stage air pollution monitoring system. Using gas sensors (DHT-22, MG811, MQ-7) and Raspberry Pi 4, an IoT package was designed. To efficiently monitor air pollution (humidity, temperature, noise), data were stored in a public cloud for pattern analysis [9]. Ardebili et al. highlighted the role of IoT in enhancing the resilience of cyber-physical systems using real-time monitoring. A smart solar panel supported by digital twin technologies was used to demonstrate the effectiveness of this approach in assessing the resilience of systems during disturbances [10]. Finally, Bai et al. demonstrated that continuous checking was effective in a remote detection system, alongside rapid web association. Likewise, wireless sensor network (WSN)-checking frameworks were executed considering different types of contamination, i.e., water, soil, or radioactive pollution [11]. To meet monitoring air pollution challenges in resource-limited environments, Zhu et al. used low-cost, energy-independent sensor systems. One example is based on energy harvesting, which is a promising option for ensuring environmental monitoring sustainability [12].
ML techniques are among the most common AQ prediction methods. ML is a data evaluation technique that provides computerized analytical models. It is a form of artificial intelligence (AI) and is based on the ability of systems to learn from data, classify patterns, and make decisions with minimal human interaction. As a result, ML is now applied in almost every field of science and technology. ML steps are shown in Figure 2.
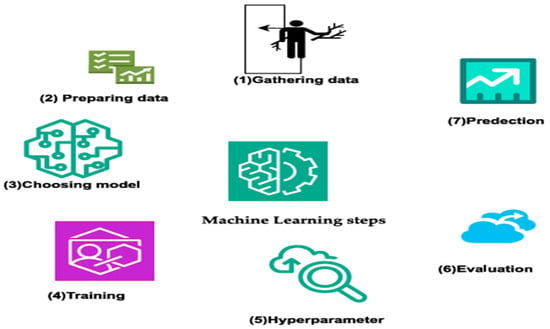
Figure 2.
Machine learning steps.
Pollution detection and forecasting modeling using ML combined with IoT techniques have also been studied. Rosca et al. examined the role of ML in improving autonomous IoT sensor performance in key areas, i.e., smart cities and healthcare. The study demonstrated an accuracy of up to 99.92% in both medical and industrial applications [13]. Imam et al. offered valuable insights into the effectiveness of ML algorithms for AQ prediction. To achieve the highest accuracy, they focused on hyperparameter tuning as the main innovation. To identify essential features and detect underlying patterns in data, detailed pre-treatment and data evaluation were considered. Five classic ML algorithms, namely logistic regression (LR), decision tree classifier, random forest classifier (RFC), support vector classifier (SVC), and naïve Bayes, were used to forecast and classify AQ into six AQI categories (highlighting wide-ranging hyperparameters adjusting for each model). The Rabindra dataset yielded the best-performing support vector machine (SVM) model with 97.98% accuracy. RFC provided the best prediction accuracy for the Victoria location (93.29%) [14]. Ghosh et al. conducted a comprehensive study to evaluate water quality using extrapolative ML. Their research emphasized the importance of ML models in successfully evaluating and categorizing water quality. Among the used models, RFC emerged as the most accurate (accuracy rate of 78.96%). In contrast, the SVM model lagged behind, registering the lowest accuracy (68.29%) [15].
The aim of this study is to both monitor and analyze the levels of the most influential gaseous pollutants, dust, temperature, and humidity in urban environments, applied to the highly polluted area of Dora (Baghdad, Iraq). The mechanism for monitoring pollutants in real-time from anywhere in the world will be incorporated into a system that combines AI and IoT. Prediction and forecasting of environmental impacts using AI learning algorithms will be addressed. ML will assist in the analysis of data collected from sensors over a long period of time. In addition, pollution levels will be predicted in places where AQ exceeds the allowed limit. Linking these data to maps could increase the population’s awareness of the situation and promote potential actions to improve AQ, such as reforestation, growing plants indoors, improving engine quality to reduce harmful emissions, and promoting the use of electric vehicles.
2. Materials and Methods
2.1. Study Area
Samples were collected in a residential area in a suburb of Baghdad, Iraq, called the Dora area, which is located south of the city center. This industrialized and densely populated area has become a significant residential neighborhood. Following urban expansion, it now falls within the boundaries of the Dora oil refinery, established in 1955 and previously located in an uninhabited area. The coordinates of the Dora area are approximately 33.3035° N latitude and 44.3928° E longitude. Currently, residents suffer from the refinery emissions, which contribute to various health issues, including skin diseases and cancer, as well as visual distortions due to volatile compounds [16]. A thermal power plant, built in 1976 and operated by the Iraqi Ministry of Electricity, is located approximately 10 km away from the refinery. These two facilities (Figure 3) emit a large volume of pollutants, adversely affecting AQ in the surrounding area. According to the Environmental Reality Report issued in 2017 by the Iraqi Ministry of Environment, the Al-Jadriya area, adjacent to these facilities, also suffers from elevated levels of SO2 and CO. Local residents have expressed concerns about the environmental and health effects stemming from both the refinery and the power plant, demanding their relocation to outside Baghdad border [17].
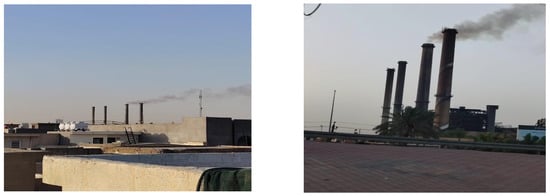
Figure 3.
Polluting facilities inside Baghdad. Left: Dora oil refinery; right: Dora power plant.
2.2. System Model
2.2.1. Block Diagram of Proposed System
The block diagram for the proposed system is shown in Figure 4. It consists of sensors, a microcontroller, and IoT-based monitoring units. The prototype designed to detect AQ comprises three types of sensors: gases, PM, and comfort. An ESP32 microcontroller (Espressif Systems, Shanghai, China) is used for data acquisition and processing, connecting all sensors, while a power unit supports system operation. Selected gas sensors are MQ7, MQ135, MQ2, MQ136, MQ5, and MG811. Additionally, the DSM501A PM sensor and DHT22 temperature and humidity sensor are included. These sensors interface with the microcontroller ESP32 via an analog-to-digital converter (ADC) and a logic level shifter, 3.3 V to 5 V. Gas sensors detect six gases present in polluted air, namely CO, CO2, H2, liquified petroleum gas (LPG), NH3, and CH4. PM concentration can be measured from 0 to 1.4 mg/m3, covering a broad spectrum of dust density. The sensor is specifically designed to detect PM2.5 and PM10 particles, which are among the most hazardous dust concentrations for AQ assessment. The comfort sensor measures humidity and temperature.
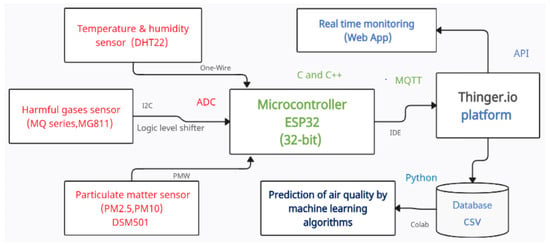
Figure 4.
Block diagram of the proposed system.
Data collected by sensors are processed by the microcontroller unit. Each parameter value is measured in place and transmitted via Wi-Fi module using the Message Queuing Telemetry Transport (MQTT) protocol. Then, they are displayed on the IoT cloud platform (thinger.io). Thinger.io IoT (Madrid, Spain) analytics software allows remote users to transmit data on the pollutant concentrations detected by sensors. The goal is to monitor and facilitate analysis using ML techniques.
2.2.2. Selected Hardware Components
Gas Sensors
Gas sensors are developed to detect and measure the concentration of dangerous gases. They are based on the variable resistance principle. If the content of oxygen in the atmosphere is elevated, electrons in the sensing material, SnO2, are attracted to the oxygen molecules, decreasing the movement of electrons. In the presence of a dangerous gas, the oxygen content is low. So, chemical bonding between oxygen and electrons is reduced, releasing electrons that return to their initial location. Thus, the higher the electron content, the higher the current flow. Gas concentration is proportional to the current flow, which is detected by the gas sensor.
MQ Series comprise a micro-Al2O3 ceramic pipe, a tin SnO2-sensitive layer, a gauging electrode and a heater secured to a cover comprising polymer and stainless steel [18]. MQ2 is a high-sensitivity and fast-reaction smoke sensor (Winsen Electronics, Zhengzhou, China). It detects smoke, flammable gases, LPG, CO, alcohols, CH4, and H2. To adjust its sensitivity and achieve accurate gas detection, it has a built-in potentiometer to vary the sensor resistance [19]. The MQ5 sensor is known for its sensitivity to natural gas and LPG, which makes it ideal for detecting gas leaks (Winsen Electronics, Zhengzhou, China). It exhibits a fast response time and offers high sensitivity, enabling quick detection of H2, CH4, and LPG. Different sensors that measure the same gases have been included, as their calibration differs. MQ5, like other sensors, includes an integrated potentiometer, which allows users to adjust sensor resistance, enabling precise adjustment of its sensitivity for accurate gas detection [20]. The MQ7 sensor is designed to detect CH4 and CO, depending on its calibration (Winsen Electronics, Zhengzhou, China). Known for its high sensitivity and rapid response, this sensor is suitable for environments where rapid detection of CO is critical. The sensor can detect CO concentrations in the range of 20 to 2000 ppm and responds to CH4, despite its low sensitivity [20]. The MQ135 sensor, also called the AQ sensor, uses SnO2 as a sensitive material (Winsen Electronics, Zhengzhou, China). The higher the level of contamination in the air volume, the higher the sensor conductivity, detecting gases that are harmful to health. Its most important feature is its low cost, and it is suitable for detecting NH3, CO2, NOx, alcohols, C6H6, and smoke [19]. The MQ136 sensor detects CO and H2S and is known for its high sensitivity to the presence of H2S and its fast response time (Winsen Electronics, Zhengzhou, China). Like other MQ sensors, MQ136 incorporates a potentiometer that enables the adjustment of the sensor’s sensitivity to ensure accurate detection of the target gas [20]. The MG811 sensor is more accurate in detecting CO2 concentration than the MQ135 (Winsen Electronics, Zhengzhou, China). For this reason, CO2 gas is detected using the MG811 sensor, with the same connection method as the MQ series. The higher the concentration in the air, the lower the output voltage of MG811. The concentration of CO2 in the air usually ranges between 300 and 1500 ppm, which corresponds to an output voltage of between 325 and 300 mV [21].
The characteristics of the sensors and selected parameters are described in Table 1. MQ sensors have four connection pins, and the VCC and GND power the MQ sensors. There is an analog pin that transfers data from the sensor to the ESP32, assisted by ADC. In the present work, the digital pin of ESP32 is not used. In this manuscript, several gases, i.e., NH4, LPG, CO, H2, and CH4, are identified by MQ sensors.

Table 1.
Sensor characteristics in the multi-parameter air quality monitoring system.
Particulate Matter Sensor
DSM501A is a low-cost compact sensor that measures PM concentration, specifically targeting PM10 and PM2.5 particles (DSM Microsystems/Omron, Tokyo, Japan). The sensor quantitatively measures particles larger than 1 μm in diameter, using the light scattering principle. It consists of several key components, namely a photodetector, a signal amplifier, a light-emitting diode (LED) lamp, and a heater. As particles pass through the detection chamber, an LED illuminates them and scatters light, which is detected by the photodetector. Particle concentration data are obtained by processing and amplifying the resulting signal. DSM501A features a PWM pulse width modulation output, which simplifies integration into various applications, including air cleaners. The inclusion of a heater inside the detection chamber helps stabilize sensor operation by maintaining a constant temperature, ensuring measurement accuracy [22,23].
Comfort Sensor
DHT22 is a low-cost digital sensor, designed for accurate measurement of humidity and temperature (Aosong Electronics, Guangzhou, China). It operates in a humidity range of 0–100%, with an accuracy of ±2% for relative humidity (RH), and in a temperature range of −40–80 °C, with an accuracy of ±0.5 °C. The sensor uses a capacitive sensor for humidity and a thermistor for temperature measurement. Data are transmitted via a single cable protocol, facilitating interfacing with microcontrollers. It requires a supply voltage of between 3.3 V and 5.5 V and has a read interval of at least two seconds, making it ideal for projects that require accurate environmental monitoring [24].
ESP32 Microcontroller
ESP32-WROOM-32 is a multitasking microcontroller developed by Espressif Systems (Shanghai, China). It is widely used in IoT applications due to its integrated Wi-Fi and Bluetooth capabilities, offering high performance for a variety of tasks. It features a dual-core Tensilica Xtensa LX6 processor, with a clock speed of up to 240 MHz. ESP32 supports IEEE 802.11 b/g/n Wi-Fi 2.4 GHz and Bluetooth 4.2, making it suitable for wireless applications in embedded systems. Additionally, it provides a set of peripherals, including I2C, UART, ADC, SPI, GPIO and PWM channels, all of them from Espressif Systems. It is equipped with 4 MB of flash memory, allowing it to interact with actuators and various sensors [25]. The low-power microcontroller has several power modes, making it ideal for battery-powered devices. It also includes built-in security features, i.e., hardware encryption and secure boot, which provide data protection. It is compatible with Arduino IDE and supports FreeRTOS, facilitating the development of complex applications. Different versions of modules, i.e., ESP32-WROOM-32, are available to meet different memory and performance requirements [26]. The gas sensor transfers data to the ESP32 using I2C communication, whereas the PM sensor uses the PWM protocol for data transmission. The comfort sensor uses a single-wire protocol.
Other Accessories
ADS1015 is an ADC for the microcontroller (Texas Instruments, Dallas, TX, USA). It provides 12-bit resolution and operates at a sample rate of 3300 samples per second, communicating via an I2C connection. ADS1015 features four single-ended or double-ended differential input channels, programmable gain amplifiers for better measurement range, and internal reference voltages to improve accuracy [27].
High-speed, full-duplex logic level shifter TXS0108E (Texas Instrument, Dallas, TX, USA) is an 8-channel converter designed to translate voltage levels between different logic standards. It provides bidirectional data transfer and can handle signals of 1.8–5.5 V (on the high-voltage side) and 1.2 V–3.6 V (on the low-voltage side). TXS0108E is suitable for communication between devices operating at various voltage levels, i.e., sensors and microcontrollers, ensuring reliable connections. The device has eight bidirectional channels, making it ideal for applications that require level shifting on various data lines [28].
2.2.3. Software Tools
Arduino IDE
Arduino Integrated Development Environment (IDE) v.1 is a user-friendly platform designed for uploading, writing, and compiling code to Arduino microcontroller boards. It is primarily based on C/C++ and supports multiple programming languages. It features a straightforward interface that includes a message area, code editor, and text console. IDE also provides access to extensive libraries that facilitate communication with various actuators, sensors, and other peripherals. It also includes an integrated serial monitor for real-time debugging and an ideal interface with devices [29]. It is compatible with the ESP32 microcontroller and supports its libraries.
Thinger.io Cloud Platform
The IoT is an interoperable technology that connects identified smart tools and interactive environments [19]. Thinger.io (Internet of Thinger S.L., Madrid, Spain) is an open-source platform created by a group of developers of IoT products. Its ready-to-go connection infrastructure allows users to manage devices, storing, monitoring and analyzing data from thousands of IoT sources [30], allowing them to set up devices to monitor and manage data remotely. ESP32 can be connected to thinger.io using the platform API keys and Arduino IDE libraries, enabling real-time data transfer for monitoring and analysis purposes. This integration supports various IoT applications, providing a robust environment for data visualization and device management [31]. This software can display real-time value digitally on the widget, helping to numerically indicate the gas content every second. With the use of an internet connection that is dependent on the MQTT protocol, users can access saved data from anywhere, at any time. Data, saved every minute, may also be transferred to a CSV file.
Collaboratory Environment
To analyze the dataset, ML algorithms with Collaboratory (Google Colab) were selected. Google Colab is an online platform that allows writing and running Python 3.12.5 code directly in the browser. It is particularly favorable for ML tasks due to its user-friendly, seamless interface, accessibility, and integration with popular ML libraries, such as NumPy, Pandas, Matplotlib, Sklearn, Seaborn, TensorFlow, PyTorch, and Keras. This platform also offers free access to tensor processing units (TPU) and graphics processing units (GPU), which makes it an excellent tool for training ML models [32].
Message Queuing Telemetry Transport Protocol v.5
It is a light messaging protocol built for effective communication between devices (released by Oasis Open, Woburn, MA, USA). It uses a subscribe–publish architecture. Device clients connect to a broker, where they can subscribe to topics to either receive or publish messages. This setup allows efficient and scalable communication, ensuring that devices only receive relevant data. MQTT is optimized for high-latency, low-bandwidth networks, making it feasible for IoT purposes, such as remote monitoring and sensor networks. It operates over TCP/IP and offers three levels of quality of service (QoS) to guarantee consistent communication submission: at most once, QoS 0; at least once, QoS 1; and exactly once, QoS 2. It is preferred in the IoT due to its ability to manage unreliable connections and its low resource consumption, providing an efficient solution for real-time communications [33].
2.3. Methodology
This section specifies the implementation of the designed prototype, including the system architecture, calibration of IoT components, and classification steps, which consist of three parts, as explained below.
- Physical layer—sensor integration and connections
The AQ monitoring system involves a compendium of gas sensors (MQ2, MQ5, MQ7, MQ135, MQ136, MG811) plus a temperature and moisture sensor (DHT22) and a dust sensor (DSM501A), all connected to the ESP32 controller. Due to the ESP32’s limited analogue inputs, an ADC ADS1015 was used to convert the sensor readings. To adjust voltage levels and ensure safe communication between 5 V sensors and the 3.3 V ESP32 module, the TXS0108E voltage switch was used. Digital sensors (i.e., DHT22 and DSM501A) were connected directly to 3.3 V, while gas sensors were connected via a voltage switch for higher performance stability.
- Software layer—Programming and Communication
The ESP32 module was programmed using the Arduino IDE environment. Analogue sensors were communicated via I2C protocol through the ADS1015 module, while digital sensors used standard GPIO terminals. Sensor readings were locally processed on the controller and then sent directly to the thinger.io cloud platform via Wi-Fi. The system supports continuous data collection, timestamp logging, and remote monitoring. To ensure data accuracy and system stability, sensor-specific libraries were used.
2.3.1. Developed Prototype Structure and Implementation
Figure 5 shows the complete hardware configuration of the AQ monitoring system, which integrates six harmful gas sensors and temperature, humidity, and PM sensors with a microcontroller. To ensure stable sensor readings, the system used both digital communication and analog-to-digital protocols. Sensors used analog signals, which were converted to digital values using the ADS1015 ADC connected to the ESP32. It communicates with sensors using the I2C inter-integrated circuit protocol, which includes two communication lines: SCL (clock) and SDA (data). In the communications configuration, ESP32 is the master, responsible for communication flow and time management. It sends requests to sensors and reads their feedback. The I2C protocol allows various devices to be connected using the same two lines, making it efficient for connecting multiple sensors to the microcontroller. Each sensor has a unique address, which the ESP32 uses to initiate communication and retrieve data from the sensor. The 8-channel bidirectional voltage-level translator TXS0108E is used to interface devices operating at different logic levels (3.3 and 5 V). 12-bit analog-to-digital converter ADS1015 converts analog sensor signals to digital data, via an I2C interface for microcontroller processing.

Figure 5.
Hardware setup of the air quality monitoring system.
The DHT22 sensor, which measures temperature and humidity, is connected directly to pin 23 of the ESP32 GPIO pins and operates at 3.3 V, avoiding the need for a level shifter or ADC. The DSM501A dust sensor measures PM2.5 and PM10 using pulse width modulation (PWM). PWM signals, which are proportional to PM concentration, are connected to pins 32 and 33 of the ESP32, which interprets the signals to determine PM levels. The DSM501A operates at 3.3 V and, thus, requires no level shifting.
The ESP32 is used to establish a Wi-Fi connection for data transmission. The software development involves programming a microcontroller using Arduino IDE v1. Thinger.io cloud platform IoT analytics software is used for data monitoring and storage purposes. ML techniques are applied to classify results and forecast contamination status, after preprocessing the data using the Colab platform.
The system costs are presented in Table 2, showing that the total system cost is below USD 149.5. These approximate costs may increase or decrease depending on location. Materials were purchased from a local electronics supply company, named Ardonic (Ardunic Store, Baghdad, Iraq, coordinates: 33.284926, 44.3850888) [34].

Table 2.
Component cost of the proposed system.
2.3.2. Detection Module
Detailed Operation of MQ Gas Sensors
MQ series gas sensors are broadly used to identify gases. The calibration process is crucial for the accurate detection and measurement of gas concentration. The process is as follows:
- Calculation of the resistance ratio (Rs/): For each known gas concentration, the ratio between the sensor resistance, Rs, in the presence of gas and its reference resistance, R0, in clean air is calculated, both measured in Ω, following Equation (1):
- Gas concentration calculation (ppm): The relationship between sensor resistance and gas concentration is described by the exponential Equation (2):
- and : Calibration constants, specific to gas detection.
To simplify the calibration and sensor reading process, the MQUnifiedSensor library was selected, making it ideal for ESP32 projects [35].
For the MG811 gas sensor, there is a linear relationship between the corresponding CO2 concentration and sensor voltage output that needs to be elucidated. Calculation depends on two known calibration points:
- : Voltage output at 400 ppm of CO2 baseline concentration, in clean air.
- : Voltage output at 40,000 ppm of CO2 used for high concentration calibration.
The linear calibration Equation (3) for converting the sensor voltage output into the CO2 concentration (ppm) is shown in Equation (3):
where:
- : Current sensor voltage output (V).
- : Sensor output voltage (V) at 400 ppm.
- : Sensor output voltage (V) at 40,000 ppm CO2.
- The constants 400 and 40,000 represent the known concentrations of CO2 at those calibration points.
Detailed Operation of Particulate Matter Sensor
The DSM501 dust sensors in this system detect particles based on light scattering caused by particles passing through the sensor. Key concepts are as follows:
- PM2.5 measures fine particles with a diameter of 2.5 μm, while PM10 measures particles with a diameter of 10 μm.
- The sensor operates by calculating the low pulse occupancy (LPO), which is the duration for which the sensor output remains low due to the presence of PM.
- The LPO ratio (r) is calculated by dividing the low pulse time by the total sample time (30 s, in this case). The ratio is then converted into mass concentration (mg/m3) using a polynomial formula. The LPO ratio is calculated as shown in Equation (4):
Mass concentration = 0.001915 r2 + 0.09522 r − 0.04884
- Coefficients 0.001915, 0.09522 and −0.04884 are constants determined through sensor experimental calibration.
- 4.
- The getParticlemgm3() function calculates PM mass concentration based on r, providing real-time data on air quality.
Detailed Operation of Comfort Sensor
The DHT22 sensor includes a thermistor for temperature measurement and capacitive humidity sensing. The sensor provides digital output, simplifying its integration into microcontroller-based systems. Key concepts are shown below:
- Humidity measurement:
DHT22 contains two electrodes with a moisture-holding dielectric material between them. As the ambient humidity changes, the capacitance between the electrodes changes proportionally. The internal circuit measures the capacitance and converts it into a digital signal representing RH (%), as shown in Equation (6).
where:
- C_measured: Capacitance measured based on current humidity levels (pF).
- Cmax: Capacitance at 100% humidity (pF).
- 2.
- Temperature measurement:
Thermistor resistance changes with temperature; then, the sensor converts this change into a digital output. The relationship between resistance and temperature in a thermistor is commonly represented by the Steinhart–Hart Equation (7), which is more relevant for thermistors:
where:
- T: Temperature (K).
- R: Resistance of the thermistor (Ω).
- A, B, C: Constants derived from calibration.
- 3.
- Data transmission:
DHT22 communicates using a single-wire protocol, sending humidity and temperature data as two separate 16-bit numbers. The microcontroller reads these values and directly interpret them as RH (%) and temperature (°C). Since DHT22 internally manages temperature and humidity measurements and calculations internally, there is no need to use external calibration formulas to convert raw data into meaningful measurements.
2.3.3. Internet of Things and Cloud Computing
Readings from physical sensors (harmful gases, PM, temperature, or RH) are translated into a visual format in real-time and from anywhere using IoT and cloud computing technologies. This is achieved through the collaboration and interconnection of several technologies, which will be explained later. The steps for connecting the ESP32 microcontroller using the IDE environment to the thinger.io platform rely on the MQTT protocol for efficient, real-time communication, which will be explained further below.
2.3.4. Applying ML Techniques
Five supervised ML classification algorithms have been used, as previously mentioned. Before starting the model training stage, detailed data preparation and feature engineering techniques were applied. Each procedure is thoroughly explained in subsequent sections. Figure 6 depicts the flow diagram for the AQI predictive model. Six different steps were followed, including data collection and pre-processing, feature engineering, data split, model training, and implementation assessment.

Figure 6.
Diagram for air quality index prediction model.
Dataset
The dataset contains observations made between 2 August and 2 September 2024, collected monthly, minute by minute, consisting of 10 columns. The dataset can be classified into three main groups. The main group includes pollutants that directly affect AQI, which are significantly characterized by PM, CO, etc. The second category includes parameters that have an indirect effect on AQ, namely temperature and RH. The third class includes information on the time and date of collection of each sample. PM data were measured from the platform in mg/m3, in accordance with sensor manufacturing standards. Therefore, PM values were multiplied by 1000 to convert them to µg/m3, ensuring alignment with global documentation standards. Table 3 provides a statistical evaluation of each characteristic that affects AQI. As mentioned above, each sample changed every minute, and data were collected monthly, resulting in approximately 37,000 rows.

Table 3.
Descriptive statistics of dataset.
Data Preprocessing
Data quality is an essential prerequisite for improving ML models. Data preprocessing plays a crucial role in generalization capabilities, as it reduces noise. This improves the speed and implementation of ML algorithms, especially in the case of large datasets. Data mining and supervision techniques include feature selection, outlier removal, and missing value imputation. In the case of accurately estimating AQI using ML, effective preprocessing is essential for refining datasets, thereby improving the reliability and accuracy of models [37]. Techniques, i.e., imputation and normalization, are critical to preparing input data for ML algorithms, ultimately contributing to more robust and accurate AQ predictions. By rigorously addressing outliers and biases, preprocessing facilitates the extraction of clearer information, which is essential for reliable AQI forecasting. Figure 7 shows the percentage distribution of pollutants at the study location.
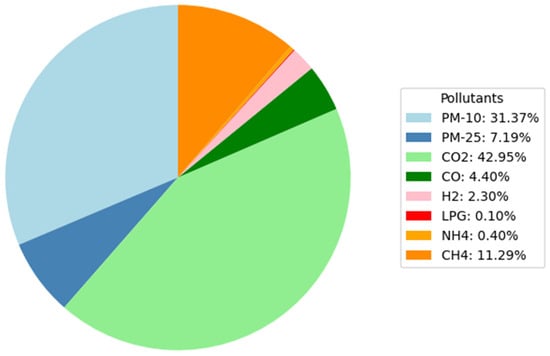
Figure 7.
Pollutant distribution (%) in Dora, Baghdad, Iraq.
Data preprocessing began with inspection of the dataset for null values. As evidenced, the dataset did not contain any missing (null) values for any of the features. This indicates that data were fully recorded without gaps or potential issues, i.e., without data collection errors or equipment failures, so there were no missing entries. Therefore, unlike scenarios in which a significant amount of missing data must be addressed using methods like median imputation, these data did not require such measures.
A dataset may include extreme values that differ from other data and fall outside the estimated range. These are considered outliers. Understanding and even removing outliers can often improve ML model quality. Outliers include noise and distortion, which lead to biased model training, reducing generalization ability. These abnormalities can disrupt the learning process, resulting in a model that may fail to provide consistent and accurate AQI forecasts, affecting the overall quality and reliability of predictions. The presence of outliers in the data can seriously compromise the accuracy of AQI predictions using ML models. Figure 8 shows a box plot displaying the outliers for each contaminant. As shown in Figure 8a, most outliers belong to feature 5 (PM10, PM2.5, CO, CO2). Outliers based on this characteristic have been removed, which means that outliers for all features have been significantly reduced. Figure 8b depicts the outliers that remain after deleting those outside the range of Q1 and Q3. The outlier identification methodology was applied using the first (Q1) and third (Q3) quartiles, where the interquartile range (IQR = Q3 − Q1) was calculated, and outliers were then described as those falling outside the range [(Q1 − 1.5 × IQR), (Q3 + 1.5 × IQR)]. To ensure improved data quality and enhance the accuracy of the results derived from the analysis, these values were omitted.
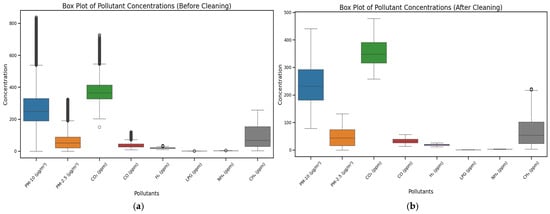
Figure 8.
Outlier prepressing contamination dataset. (a) Boxplot before outlier exclusion; (b) Boxplot after outlier exclusion.
Feature Engineering
Governmental organizations rely on AQI, a specific metric within the dataset being investigated. This metric is used both to transfer AQ data to the population and for the training of analysts. Industrial emissions from activities, i.e., refining and fossil-based power generation, significantly contribute to air pollution. To enhance the precision of AQ assessments, each pollutant is categorized as one of six classes, depending on its concentration, ranging from “good” to “hazardous”. Numerical values are also assigned to pollutants according to a classification system, ranging from (0–good) to (5–hazardous), to facilitate ML algorithms for real-time analysis and prediction.
The categorization of each pollutant according to its health risks is essential. CO is considered dangerous in concentrations above 30.5 ppm, according to Environmental Protection Agency (EPA) standards, due to the severe risk of poisoning, which can affect the body’s oxygen supply [38]. On the contrary, although CO2 is not toxic at normal levels, it becomes hazardous when its concentration exceeds 10,000 ppm, leading to symptoms such as unconsciousness and dizziness, particularly in indoor spaces [39]. Similarly, NH3 is classified as hazardous when its concentration exceeds 200 ppm, which may cause severe respiratory irritation and other health complications. CH4 is categorized as hazardous at levels exceeding 40,000 ppm, at which there is risk of ignition, as outlined by Occupational Safety and Health Administration guidelines (OSHA) [40]. Additionally, LPG and H2 are not inherently toxic. They are classified as hazardous at concentrations above 5000 ppm and 200 ppm, respectively, due to their potential for explosive reactions. Furthermore, both PM2.5 and PM10 are considered hazardous when their concentrations exceed 250.5 µg/m3 and 300 µg/m3, respectively, as they are closely linked to cardiovascular diseases and serious respiratory illness [41]. This classification framework facilitates risk management strategies. Table 4 provides a comprehensive breakdown of AQ classifications by assigning numerical values to each parameter, enabling ML models to analyze data efficiently and thus provide accurate AQ predictions.

Table 4.
Pollutant classification and concentration ranges.
AQI varies depending on the content of several air contaminants, including the well-known health hazards related to PM10 and PM2.5. In the present study, the higher the PM concentration, the higher the AQI value. The analysis of AQ data, derived from a dataset of 36,295 samples, provides important insights into the concentrations and classifications of pollutants (Table 3 and Table 4). Summary statistics indicate that the average concentration of CO is 34.32 ppm with a standard deviation (SD) of 11.28 ppm, while CO2 averages 361.32 ppm, with a SD of 55.65 ppm. Notably, the mean concentration of PM10 is 248.99 µg/m3, while PM2.5 averages 51.99 µg/m3, highlighting the significant presence of PM. The classification of pollutants into numerical classes (0–5) reveals concerning trends: the majority of CO measurements are classified as hazardous (15,915 instances), while CO2 samples predominantly fall into the “good” category (21,243 instances). In contrast, PM10 and PM2.5 exhibit substantial classifications of very unhealthy and unhealthy, with 11,560 and 11,526.0 cases, respectively. These results underscore the serious health risks associated with high levels of PM, emphasizing the need for effective monitoring and further public health interventions to improve AQ in affected areas (Table 5).

Table 5.
Instances found for each pollutant in Dora.
The correlation analysis among air pollutants, as depicted in Figure 9, reveals significant interrelationships. A moderate positive correlation (0.42) between CO and CO2 suggests that higher CO levels are associated with increased CO2 concentrations. In addition, LPG shows a strong correlation with both H2 (0.87) and CH4 (0.76). This indicates that these gases are often linked, likely due to similar emission sources. The moderate correlation between PM2.5 and PM10 (0.40) further highlights the synchronous presence of PM. These findings emphasize the importance of monitoring and understanding the interactions of pollutants, distinguishing emission sources to better assess AQ.
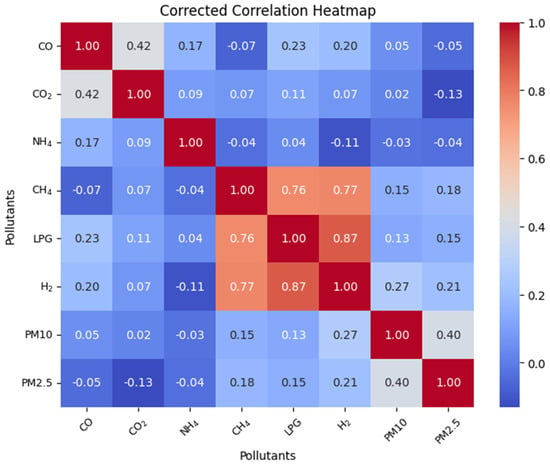
Figure 9.
Correlations among air pollutants. LPG: liquified petroleum gas.
Categorization, statistical analysis, and correlation steps help prepare data for ML models by improving communication, understanding health risks, and improving model performance. These processes are not only fundamental to data analysis but also ensure that the features used in models are effective and relevant for predicting AQ and its impacts.
Data Split
The initial dataset comprises 36,295 records collected by the developed sensor system. After implementing the stages of cleaning, outlier removal, and AQ data classification, 27,757 records were approved as model-ready data. To train the models on diverse data, while evaluating their performance with data not used during the learning process, the dataset was divided into a training set (75%, approximately 20,817 samples) and a test (validation) set (25%, approximately 6940 samples).
Model Construction
This section focuses on improving a predictive model for classifying AQ into levels based on several measured pollutants. The aim is to implement multiple ML algorithms to predict AQI categories derived from specific pollutant concentration ranges. The prediction task addresses a multi-class classification problem, in which AQ levels are classified into distinct classes, as mentioned above.
Classification algorithms function as supervised learning (SL) methods that require labeled input data (pollutant concentration), while the output corresponds to predefined AQI categories. This process allows the model to learn from observations and accurately classify new instances. Unlike regression models, which produce numerical results, classification models generate categorical results. The methodologies used in this study utilize labeled datasets, in which each observation is aligned with a known AQI category established during the feature engineering phase, facilitating the training of ML models to consistently assess AQ.
To categorize the resulting AQI, supervised dedicated algorithms, containing SVC, RFC, Gradient boosting classifier, K-Nearest neighbors (KNN), and LR, were used. When designing ML models, several architecture options are often offered. Defining the optimal architecture for a particular model may be difficult, as it requires exploring a range of options using different hyperparameters. This manuscript focuses on exploring and selecting the optimal model architecture through hyperparameter tuning.
GridSearchCV is a systematic technique for tuning the hyperparameter space in ML models. To determine which combination leads to the best model performance, it tests all possible combinations of a predefined set of values for each parameter. To ensure that performance results do not depend solely on a specific subdivision, GridSearchCV combines grid search with cross-validation. To do this, each combination of parameters is evaluated on multiple subdivisions of the training data, minimizing the risk of bias or overfitting. This process involves modifying the coefficients that make up the model structure to optimize performance. Five different algorithms were selected based on their effectiveness in environmental classification:
The gradient boosting algorithm is a highly efficient SL algorithm, primarily used for categorization roles, but also applicable to regression problems. It builds a set of weak learners, typically decision trees, trained sequentially, in which each subsequent tree is built to remove mistakes from the previous models. By leveraging gradient descent to diminish a loss function, the model iteratively refines its predictions, focusing on cases where previous models had more difficulty.
The RF algorithm is a widely used ML method that falls under the category of SL. This method is applicable to both regression problems and classification in ML. However, it is mainly used for classification tasks. RF operates according to the principles of ensemble learning, which involves integrating multiple classifiers to address complex issues and improve model performance. Essentially, RF is a classifier that aggregates the predictions of numerous decision trees trained on several subsets of a particular dataset. This approach improves the accuracy of predictions while mitigating problems related to overfitting. The expression denotes the estimation of RF(X) as the usual output of the individual decision trees Treei(X), being N the total number of decision trees in the group.
The SVM algorithm is one of the most powerful ML algorithms for regression and classification roles. It finds the hyperplane that best splits different classes in a high-dimensional space. The expression of the hyperplane is provided by f(x) =sign (w x +b), where w is the weight vector, x is the input vector, and b is the bias term. The objective of SVM is to maximize the margin between classes, ensuring robust generalization. The optimization problem involves minimizing 1 2 ||w||2 subject to yi (w xi+b) ≥ 1 for all training samples (xi, yi). The key is to detect a hyperplane that extends the margin between classes to a maximum value; the margin being the space between the hyperplane and the nearest point from each class. SVM is flexible, housing different kernel functions (e.g., linear, polynomial, radial basis function) to handle nonlinear separations. It shows robust overall functioning, although it provides sensitivity to parameter tuning.
The KNN algorithm is one of the simplest and most intuitive supervised ML algorithms used for both classification and regression problems. The KNN algorithm is based on the idea that comparable data are close to each other. When forecasting the class of a given point, KNN considers its K nearest neighbors in the training dataset and allocates the class based on the majority of those neighbors. In classification tasks, the result is a class membership. Predicted class is the most frequent among its nearest neighbors (measured using a distance metric, i.e., Euclidean or Manhattan distance). For example, if K = 5, the algorithm will consider the five closest points and assign the class that appears most frequently among them. A key aspect of KNN is that it is a nonparametric and lazy learning algorithm, denoting that it does not make any underlying expectations about data allocation (non-parametric) and stores all training data for predictions, performing calculations only when a prediction is requested. Although KNN is simple and effective, it can be computationally expensive as the size of the dataset increases, as it needs to analyze the distance to all data points for each prediction.
LR is one of the most widely used supervised techniques among all ML algorithms. This method uses a specific set of independent variables to predict a categorical dependent variable. The goal of this method is to predict the potential outcome of a categorical dependent variable, where the outcome is represented as a discrete value. It provides probabilistic values ranging from 0 to 1.
Performance Analysis and Model Insights
The models were evaluated using a series of performance metrics beyond overall accuracy, including precision, recall, F1-score, and number of samples per class (support). To avoid the impact of uneven class distribution, the work focused on performance per class. Confusion matrices and histograms were used to more clearly visualize results, as well as to analyze the relative importance of features, providing a thorough understanding of the role of each feature in the classification process.
3. Results and Discussion
The Section 3.1 and Section 3.2 outline the recorded database during the selected time and location. The Section 3.4 details the training and evaluation of the data using ML algorithms.
3.1. Real Time Data Monitoring
Figure 10 shows the interpretation of the data and the location of the scan on the thinger.io platform, which is connected with a unique key. The system displays data on an easy-to-use dashboard, allowing users to quickly interpret the status of AQ in real-time from anywhere. The dashboard includes readings from multiple sensors covering a wide range of gases and environmental parameters (Figure 10, left). It demonstrates that multiple sensors are integrated into a unified platform for continuous monitoring. It shows the performance of the sensors, providing a detailed view of environmental conditions. Figure 10 (right) highlights the continuity and stability of the system with precise geographical identification from which data are collected. This information is crucial to ensure continuous connectivity with the platform, which supports the documentation of collected data quality. Geographical location facilitates the correlation of environmental data with the areas being monitored. System stability is represented by a graph showing the system reliability over time. This is essential for validating the system’s robustness in collecting environmental datasets under challenging conditions. In sum, Figure 10 demonstrates the system reliability and robustness in real-time AQ monitoring. This comprehensive presentation enhances understanding of the importance of the collected data in the context of AQ monitoring.
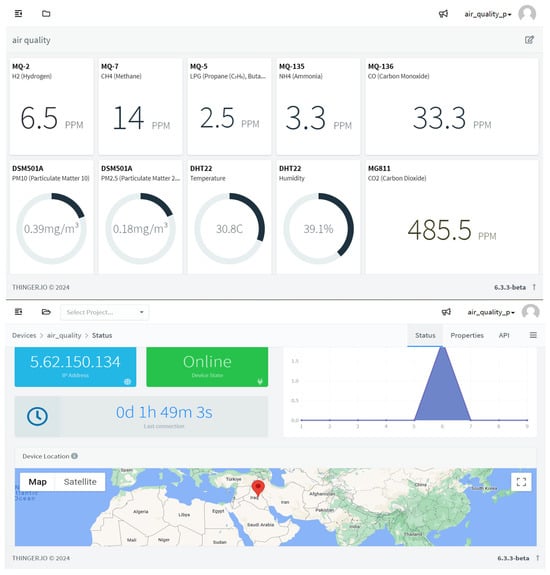
Figure 10.
Data representation stored in thinger.io platform; top: dashboard of the proposed system; bottom: location of study area.
3.2. Real Time Data Collection
Part of the database stored for the selected region is shown in Figure 11. The cloud IoT platform (thinger.io) grants mining of information gathered by sensors and saved into a file in CSV format. Authorized users only need to choose the sensors and time period to extract and export the desired data. Eventually, to generate data sets for ML algorithms, CSV files are processed using Python scripts.
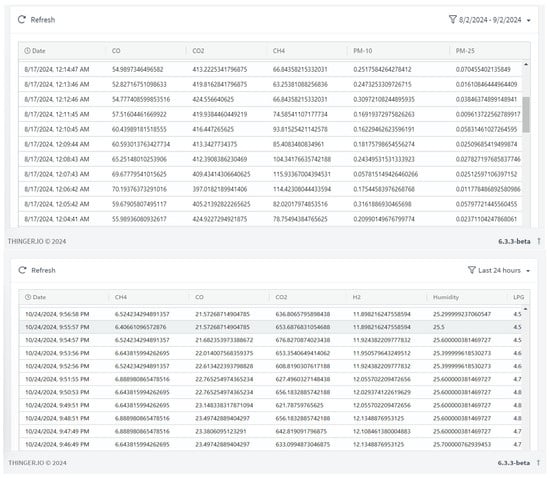
Figure 11.
Snapshot of the database stored for the selected region; top: data collection from August 2024; bottom: data collection from October 2024.
The dataset consists of approximately 37,000 rows recorded between 2 August and 2 September 2024, with intervals ranging from one to one and a half minutes between each row. There were occasional delays in data transmission due to the poor internet connection in the selected area, although delays were minimal—usually a few seconds—and did not affect the accuracy of the time intervals or continuity of data collection. Although composed of low-cost equipment, Figure 11 demonstrates the stability of the platform over time in an outdoor environment, even under adverse conditions (high temperatures and significant dust accumulation). This is a key finding of this study. These results are very important, as the next steps in data analysis, including forecasting and classification, depend on the platform’s ability to consistently collect and stabilize data over extended periods, whether quarterly or annually.
3.3. Hyperparameter Tuning Values
Hyperparameter tuning was performed using GridsearchCV from scikit-learn, iterating over a specific set of hyperparameters to determine which ones provide the best accuracy. The hyperparameters used after these tunings are listed in Table 6, along with their results.

Table 6.
Hyperparameters used for each model.
3.4. Evaluation of Classification Models
This section includes results from the performance evaluation of different classification models used to predict AQ in the study area. Table 7 provides a detailed analysis of the performance of several model categories for (AQI) estimations across different classes.

Table 7.
Performance metrics for different classes.
GBC shows excellent accuracy in high-risk AQI categories, achieving perfect precision, recall, and F1-score for both class no. 5 (hazardous) and class no. 4 (very unhealthy). Its strong performance in class no. 3 (unhealthy) further underscores its effectiveness in handling diverse AQ levels. However, the small number of cases in class no. 3 poses a challenge, although the model still maintains commendable performance. RFC follows a similar pattern, excelling in class no. 5 and class no. 4 with perfect scores across all metrics, indicating its strength in predicting severe AQ circumstances. Nevertheless, there is a notable drop in performance in class no. 3, where the F1-score drops to 0.87, reflecting the difficulties in predicting smaller classes with fewer samples.
SVC performs well in classes no. 4 and no. 5, with accuracy and recall above 90%, but struggles significantly in class no. 3, where both recall and F1-score drop to 0, indicating the model’s inability to capture cases in this category. This suggests possible limitations in handling imbalanced datasets, especially for smaller classes.
Similarly, KNN model performs well in predicting classes no. 4 and 5, although its performance drops sharply in class no. 3, where both recall and F1-score are zero. This highlights the model difficulties in dealing with minority classes and AQ distributions.
Finally, the LR model exhibits a reasonable performance in classes no. 4 and 5, although its scores are generally lower compared to GB and RF models. This model has more difficulty with class no. 3, in which it fails to predict any cases, exacerbating the difficulties it encounters in capturing this specific class. To assess the performance of several models used for AQ classification, the confusion matrix results were analyzed. Table 8 presents prediction results of the selected algorithms in the classification of the target categories (Classes no. 3, 4, and 5).

Table 8.
Confusion matrix results for each model.
In this study, real-time data were used, as optimization techniques (i.e., data augmentation, synthetic oversampling, or resampling methods like SMOTE) could not be applied. Consequently, relying on algorithms that can handle real-world datasets with the highest accuracy was mandatory. GBC and RFC demonstrated outstanding performance with minimal misclassifications in Classes no. 3 and no. 4, and a perfect classification in Class no. 5 samples. This highlights the strong ability of these models to effectively handle larger classes, particularly in scenarios where class imbalance is present, as shown in Figure 12. Their precision in distinguishing between closely related classes reflects their robustness in processing real-world, noisy datasets.
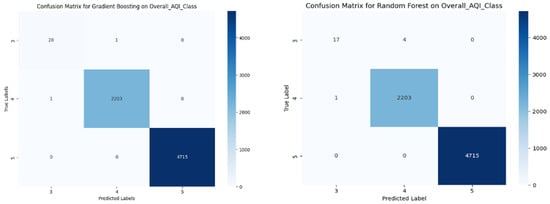

Figure 12.
Confusion matrices for used models.
In contrast, SVC faced considerable challenges in classifying Class no. 3, with all samples being misclassified as Class no. 4. However, it performed reasonably well in Classes no. 4 and 5, despite some misclassifications in these two classes. The confusion observed in SVC and KNN between Classes no. 4 and 5 suggests that these models may face difficulties with overlapping feature spaces or subtle differences between these categories, potentially requiring further tuning or feature engineering to enhance classification accuracy.
KNN showed weaker overall performance, with substantial misclassifications between Classes no. 4 and 5, and no correct classification in Class no. 3. This may be due to KNN’s sensitivity to the selection of neighbors and distance metrics, which can impact its ability to differentiate between imbalanced and small classes.
LR performed inadequately, particularly in Class no. 3. Furthermore, it showed a high rate of misclassification between Classes no. 4 and 5, indicating that linear decision boundaries are insufficient for this problem complexity.
Overall, GB and RF emerged as the most efficient and accurate models, excelling in the classification of larger and balanced classes. However, SVC and KNN exhibited notable weaknesses in handling smaller classes, like Class no. 3. Additionally, their inconsistent performance across larger classes, like Classes no. 4 and no. 5, further emphasizes the need for careful hyperparameter tuning or model selection, depending on the specific class distribution in the dataset.
Empirical design and further analysis were used to forecast AQI data based on the concentration of various air contaminants at a specific location. To facilitate model evaluation and validation, a dataset consisting of over 27,000 data points collected monthly was first divided into training (75%) and testing or validating (25%) subsets. The analysis was conducted using Python, leveraging essential libraries such as Scikit-learn, NumPy, Pandas, and Seaborn for data preprocessing, statistical analysis, training, and visualization. The experimental environment provided by Google Colab offered the necessary computational resources for model training and performance evaluation, including the use of its cloud-based GPU capabilities. Figure 13 displays the evolution of each pollutant change over time, directly responsible for the increase in AQI readings. As may be seen, each pollutant increases and decreases every minute with no discernible pattern. Since this dataset only spans a few weeks, no conclusions about how the weather affects pollutant levels can be drawn. This fact adds another reason to drop these two parameters, as was initially decided.
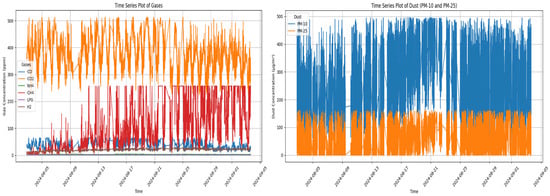
Figure 13.
Time series plot of pollutants.
Once the proposed models were trained with the most appropriate hyperparameter tuning and accuracy (Figure 14), it may be concluded that the GBC model provided the highest accuracy (0.9997), closely followed by the RFC model with an accuracy of 0.9993. SVC achieved a robust performance with a precision of 0.9669, while the KNN model provided an accuracy of 0.9124. In contrast, the LR model recorded the lowest accuracy (0.8952).
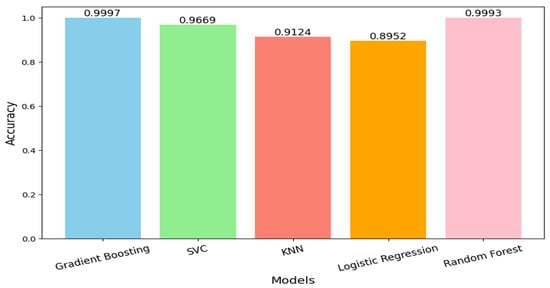
Figure 14.
Model accuracy comparison.
4. Conclusions and Future Work
The direct impact of contamination on life quality emphasizes the crucial demand for comprehensive air quality (AQ) supervision, specifically in densely populated urban areas, like Baghdad (Iraq). With over 9 million inhabitants and 4 million vehicles, pollution levels in the city require thorough investigation. However, due to the lack of attention and limited research on pollution, many regions suffer from a lack of adequate data, hindering efforts to address environmental health concerns. This work aims to fill this gap by developing a low-cost, internet of things (IoT)-based device for the real-time detection of harmful gases and particulate matter. It was installed in the neighborhood of Dora (Baghdad’s most polluted area) due to its proximity to an oil refinery and a power plant, coupled with vehicle emissions and dust accumulation. The main innovation of this project lies in the hybrid nature of the proposed monitoring and predicting system, combining both hardware and artificial intelligence (AI) components. The IoT-based device was integrated with the thinger.io platform, which has proven stability and effectiveness. This platform enabled stable, real-time data storage and transmission, providing cost-effective and reliable environmental monitoring. The system’s robustness and affordability present significant advantages, making it scalable for wider use in similar regions with budget constraints. Monthly data collection at one-minute intervals provided overall insight into the pollution levels, alongside humidity and temperature data. The dataset was classified using five machine learning algorithms, leading to important findings. The Gradient Boosting (GD) model reached the best precision, closely followed by the Random Forest (RF) model. The Support Vector Classifier (SVC) has proven to have a strong performance, while K-Nearest neighbors (KNN) achieved an acceptable accuracy. Logistic Regression (LR) exhibited relatively lower accuracy. Notably, the region recorded high pollution levels, with predominant classifications falling into the higher risk categories, from unhealthy and very unhealthy to hazardous. The results highlight the ability of machine learning (ML) techniques to accurately classify AQ data. The successful integration of IoT platforms with ML models demonstrates the potential for developing low-cost, scalable, and stable systems for real-time AQ monitoring. This hybrid approach is crucial, especially in developing countries with limited research on pollution and budget constraints, as it may help improve environmental management in highly populated and industrialized regions.
Future Work
- Using a longer time period for data analysis: Collecting data over an extended period will improve the accuracy of predictive and classification models, helping to detect seasonal patterns and the impact of other factors, such as temperature and humidity, on pollution levels.
- Increase the number of pollution parameters: Integrating additional pollution parameters, i.e., other gases and chemicals, will give a more complete and accurate understanding of environmental pollution. This will allow achieving more accurate estimates of pollution levels and associated health effects.
- Creating a network of pollution detection stations in different cities: By combining sensor stations in different cities on a single platform, data between different regions can be compared and analyzed. This network will help expand the scope of pollution monitoring and promote co-operation between cities to tackle environmental problems.
Author Contributions
Conceptualization, O.A., M.D.R.-M. and M.P.D.; methodology, O.A.; validation, O.A.; formal analysis, O.A., M.D.R.-M. and M.P.D.; data curation, O.A.; writing—original draft preparation, O.A.; writing—review and editing, M.D.R.-M. and M.P.D.; supervision, M.D.R.-M. and M.P.D. All authors have read and agreed to the published version of the manuscript.
Funding
This research was funded by the Spanish Ministry of Science and Innovation, grant numbers PID2019-105936RB-C21 and TED2021-130596B-C22.
Institutional Review Board Statement
Not applicable.
Informed Consent Statement
Not applicable.
Data Availability Statement
The raw data supporting the conclusions of this article will be made available by the authors on request.
Conflicts of Interest
The authors declare no conflict of interest.
References
- Méndez, M.; Merayo, M.G.; Núñez, M. Machine learning algorithms to forecast air quality: A survey. Artif. Intell. Rev. 2023, 56, 10031–10066. [Google Scholar] [CrossRef] [PubMed]
- Rajasekar, D.; Sekar, A.; Rajasekar, M. Air Quality Monitoring and Disease Prediction Using IoT and Machine Learning. Int. J. Innov. Res. Comput. Sci. Technol. 2020, 8, 389–395. [Google Scholar] [CrossRef]
- Nilesh, N.; Patwardhan, I.; Narang, J.; Chaudhari, S. IoT-based AQI Estimation using Image Processing and Learning Methods. In Proceedings of the 2022 IEEE 8th World Forum on Internet of Things, WF-IoT 2022, Yokohama, Japan, 26 October–11 November 2022. [Google Scholar] [CrossRef]
- Vasantha, S.V.; Mageswari, R.U.; Ramesh, K.; Vaishnavi, J. Air Quality Prediction System using ML and DL Techniques. In Proceedings of the 2022 IEEE North Karnataka Subsection Flagship International Conference, NKCon 2022, Karnataka, India, 16–17 December 2022. [Google Scholar] [CrossRef]
- Idrees, Z.; Zheng, L. Low cost air pollution monitoring systems: A review of protocols and enabling technologies. J. Ind. Inf. Integr. 2020, 17, 100123. [Google Scholar] [CrossRef]
- Rajashekar, R.C. IoT-based Air Pollution Monitoring: Algorithms and Implementation. Master’s Thesis, International Institute of Information Technology, Hyderabad, India, 2021. [Google Scholar]
- Witczak, D.; Szymoniak, S. Review of Monitoring and Control Systems Based on Internet of Things. Appl. Sci. 2024, 14, 8943. [Google Scholar] [CrossRef]
- Edupuganti, S.; Tenneti, N.S.S.; Iqbal, M.M.; Rajaram, G. An IoT Implemented Dynamic Air Pollution Monitoring System. EAI Endorsed Trans. Internet Things 2023, 9, e4. [Google Scholar] [CrossRef]
- Mohan, A.M.; George, A.M.; Baby, A.; Gopi, S. Real-time Air Quality Index Monitoring and Alert System using IoT Technology. Int. J. Emerg. Res. Areas 2023, 3, 76–80. [Google Scholar] [CrossRef]
- Ardebili, A.A.; Martella, C.; Longo, A.; Rucco, C.; Izzi, F.; Ficarella, A. IoT-Driven Resilience Monitoring: Case Study of a Cyber-Physical System. Appl. Sci. 2025, 15, 2092. [Google Scholar] [CrossRef]
- Bai, Z.; Hu, Z.; Bian, K.; Song, L. Real-time Prediction for Fine-grained Air Quality Monitoring System with Asynchronous Sensing. In Proceedings of the ICASSP, IEEE International Conference on Acoustics, Speech and Signal Processing—Proceedings, Brighton, UK, 12–17 May 2019. [Google Scholar] [CrossRef]
- Zhu, Q.; Zhu, L.; Wang, Z.; Zhang, X.; Li, Q.; Han, Q.; Yang, Z.; Qin, Z. Hybrid triboelectric-piezoelectric nanogenerator assisted intelligent condition monitoring for aero-engine pipeline system. Chem. Eng. J. 2025, 519, 165121. [Google Scholar] [CrossRef]
- Rosca, C.-M.; Stancu, A. Integration of AI in Self-Powered IoT Sensor Systems. Appl. Sci. 2025, 15, 7008. [Google Scholar] [CrossRef]
- Imam, M.; Adam, S.; Dev, S.; Nesa, N. Air quality monitoring using statistical learning models for sustainable environment. Intell. Syst. Appl. 2024, 22, 200333. [Google Scholar] [CrossRef]
- Ghosh, H.; Tusher, M.A.; Rahat, I.S.; Khasim, S.; Mohanty, S.N. Water Quality Assessment Through Predictive Machine Learning. In Lecture Notes in Networks and Systems; Springer: Singapore, 2023. [Google Scholar] [CrossRef]
- Environmental concerns surround Dora refinery and power station in Baghdad » 964media. Available online: https://en.964media.com/7756/ (accessed on 5 July 2024).
- Smoke Al-Doura Chokes Baghdad’s Skies: An Investigation—Al-Aalem. Available online: https://al-aalem.com/%D8%A3%D8%AF%D8%AE%D9%86%D8%A9-%D8%A7%D9%84%D8%AF%D9%88%D8%B1%D8%A9-%D8%AA%D8%AE%D9%86%D9%82-%D8%B3%D9%85%D8%A7%D8%A1-%D8%A8%D8%BA%D8%AF%D8%A7%D8%AF-%D8%AA%D8%AD%D9%82%D9%8A%D9%82/#_ftn1 (accessed on 10 September 2024).
- Tella, A.; Balogun, A.L.; Adebisi, N.; Abdullah, S. Spatial assessment of PM10 hotspots using Random Forest, K-Nearest Neighbour and Naïve Bayes. Atmos. Pollut. Res. 2021, 12, 101202. [Google Scholar] [CrossRef]
- Anitha, M.; Kumar, L.S. Development of an IoT-Enabled Air Pollution Monitoring and Air Purifier System. Mapan—J. Metrol. Soc. India 2023, 38, 669–688. [Google Scholar] [CrossRef]
- Micro AL2O3 Ceramic Tube, Tin Dioxide. Available online: https://www.hwsensor.com (accessed on 21 April 2024).
- Kong, L. Application of zigbee-wsn technology for indoor environmental parameter monitoring system. IAENG Int. J. Comput. Sci. 2019, 46, 1. [Google Scholar]
- Nandanwar, H.; Chauhan, A. IOT based Smart Environment Monitoring Systems: A Key to Smart and Clean Urban Living Spaces. In Proceedings of the 2021 Asian Conference on Innovation in Technology, ASIANCON 2021, Pune, India, 27–29 August 2021; Institute of Electrical and Electronics Engineers Inc.: Piscataway, NJ, USA. [Google Scholar] [CrossRef]
- Alsamrai, O.; Redel-Macias, M.D.; Pinzi, S.; Dorado, M.P. A Systematic Review for Indoor and Outdoor Air Pollution Monitoring Systems Based on Internet of Things. Sustainability 2024, 16, 4353. [Google Scholar] [CrossRef]
- Martín-Garín, A.; Millán-García, J.A.; Baïri, A.; Millán-Medel, J.; Sala-Lizarraga, J.M. Environmental monitoring system based on an Open Source Platform and the Internet of Things for a building energy retrofit. Autom. Constr. 2018, 87, 201–214. [Google Scholar] [CrossRef]
- ESP32 Series Datasheet Version 4.6 2.4 GHz Wi-Fi + Bluetooth® + Bluetooth LE SoC Including. Available online: www.espressif.com (accessed on 2 September 2024).
- Programming and Uploading Code on the ESP32 Board with Arduino IDE. Available online: https://ai.thestempedia.com/docs/getting-started-with-esp32-on-arduino-ide/ (accessed on 2 September 2024).
- Conversor Analógico Digital ADS1015 12 Bits 4 Canais ADC I2C—Usinainfo. Available online: https://www.usinainfo.com.br/conversor-ad-da-arduino/conversor-analogico-digital-ads1015-12-bits-4-canais-adc-4713.html (accessed on 2 August 2024).
- TXS0108E High Speed Full Duplex 8 Channel Logic Level Converter Buy Online at Low Price in India—ElectronicsComp.com. Available online: https://www.electronicscomp.com/txs0108e-high-speed-full-duplex-8-channel-logic-level-converter?srsltid=AfmBOooVRdh64nLeiAdo2zul3dU-zPZO40ORP7at_q6zMGaLEUJOviE_ (accessed on 2 September 2024).
- Arduino Integrated Development Environment (IDE) v1|Arduino Documentation. Available online: https://docs.arduino.cc/software/ide-v1/tutorials/arduino-ide-v1-basics/ (accessed on 29 April 2024).
- ABOUT|Thinger.io Documentation. Available online: https://docs.thinger.io/about (accessed on 12 August 2024).
- Arduino IDE|Thinger.io Documentation. Available online: https://docs.thinger.io/sdk-setup/arduino-ide (accessed on 2 September 2024).
- Welcome to Colab—Colab. Available online: https://colab.research.google.com/notebooks/intro.ipynb (accessed on 12 August 2024).
- Goos, G.; Bertino, E.; Gao, W.; Steffen, B.; Woeginger, G.; Yung, M. Lecture Notes in Computer Science 13147 Founding Editors Editorial Board Members. Available online: https://link.springer.com/bookseries/7409 (accessed on 27 May 2024).
- Ardunic||Build Anything. Available online: https://www.ardunic.com/ (accessed on 4 September 2024).
- miguel5612/MQSensorsLib: We Present a Unified Library for MQ Sensors, this Library Allows to Read MQ Signals Easily from Arduino, Genuino, ESP8266, ESP-32 Boards Whose References are MQ2, MQ3, MQ4, MQ5, MQ6, MQ7, MQ8, MQ9, MQ131, MQ135, MQ136, MQ303A, MQ309A. Available online: https://github.com/miguel5612/MQSensorsLib (accessed on 8 September 2024).
- ESPHome on ESP32 with DSM501: R/esp32. Available online: https://www.reddit.com/r/esp32/comments/18gcnvm/esphome_on_esp32_with_dsm501/ (accessed on 22 July 2025).
- Hassler, A.P.; Menasalvas, E.; García-García, F.J.; Rodríguez-Mañas, L.; Holzinger, A. Importance of medical data preprocessing in predictive modeling and risk factor discovery for the frailty syndrome. BMC Med. Inform. Decis. Mak. 2019, 19, 33. [Google Scholar] [CrossRef] [PubMed]
- Carbon Monoxide (CO) Pollution in Outdoor Air|US EPA. Available online: https://www.epa.gov/co-pollution (accessed on 11 October 2024).
- World Health Organization (WHO). Available online: https://www.who.int/home (accessed on 11 October 2024).[Green Version]
- Home|Occupational Safety and Health Administration. Available online: https://www.osha.gov/ (accessed on 11 October 2024).[Green Version]
- Particulate Matter (PM) Pollution|US EPA. Available online: https://www.epa.gov/pm-pollution (accessed on 11 October 2024).[Green Version]
Disclaimer/Publisher’s Note: The statements, opinions and data contained in all publications are solely those of the individual author(s) and contributor(s) and not of MDPI and/or the editor(s). MDPI and/or the editor(s) disclaim responsibility for any injury to people or property resulting from any ideas, methods, instructions or products referred to in the content. |
© 2025 by the authors. Licensee MDPI, Basel, Switzerland. This article is an open access article distributed under the terms and conditions of the Creative Commons Attribution (CC BY) license (https://creativecommons.org/licenses/by/4.0/).