Article

Research on Identification and Application of Joint Surface Characteristic Parameters

1
College of Intelligence Science and Technology, National University of Defense Technology, Changsha 410073, China
2
National Key Laboratory of Equipment State Sensing and Smart Support, National University of Defense Technology, Changsha 410073, China
*
Authors to whom correspondence should be addressed.
Appl. Sci. 2025, 15(16), 9040; https://doi.org/10.3390/app15169040
Submission received: 17 July 2025 / Revised: 11 August 2025 / Accepted: 15 August 2025 / Published: 15 August 2025

Abstract

The characteristic parameters of fixed joint surfaces, such as stiffness and damping, play a dominant role in determining the overall performance of various mechanical structures, especially in high-performance machine tools. However, accurate characterization of these joint parameters remains challenging, due to a lack of direct validation methods. In this study, we consider the deformation of the base caused by the interaction of micro-convex bodies based on the 3D Kogut and Etsion (KE) model, and modify the characteristic parameter model of joint surfaces. Interfacial fractal parameters were determined using the structural function method, which enabled direct experimental validation of the characteristic parameter model. Finally, a comprehensive dynamic performance analysis of the GP300 grinding machine was conducted, and the results revealed that the joint surface changed the various modes of vibration and the corresponding natural frequencies of the machine tool. These findings deepen our understanding of the characteristic parameters of the binding surface and their effects, and have important guiding significance for the performance analysis and design of machine tools.

1. Introduction

Computer Numerical Control (CNC) tools are known as the “mother machines of industry”, representing the core production base of the equipment manufacturing industry [1]. Machine tools are integrated systems composed of various components designed to meet functional, performance, and machining requirements. The overall stiffness and damping of a machine tool are predominantly determined by the contact stiffness and damping at the joint surfaces between the components. However, in conventional machine tool design and analysis models, the components are often either rigidly bonded together or connected via spring-damper elements based on empirical assumptions. This simplification leads to significant deviations between simulated and actual performance, forming a critical bottleneck that limits the improvement of machine tool operational performance [2,3,4,5]. Therefore, accurate identification of characteristic parameters such as stiffness and damping of joint surfaces is key to overcoming this limitation.
When the mating surfaces of machine tools interact, they exhibit a “flexible joint” characteristic that simultaneously dissipates and stores energy. This behavior involves nonlinear stiffness and damping, where the stiffness contributes to 60–80% of the overall machine tool stiffness, while damping accounts for as much as 90%, significantly impacting the machine’s overall dynamic and static performance [6,7].
For wafer-thinning grinders, the overall dynamic performance of the grinding machine is a critical factor influencing the vibration of the grinding spindle, which in turn affects wafer machining accuracy and surface quality. Therefore, in-depth research on the interaction mechanisms between mating surfaces and the establishment of characteristic parameter identification models for joint interfaces have become key challenges and research hotspots in the design, assembly, and optimization of ultra-precision machine tools such as wafer-thinning grinders [8,9,10,11,12].
The fractal theory of rough surface contact serves as the foundation for the theoretical modeling of joint surfaces [13,14,15]. During the interaction between joint surfaces, asperities undergo deformation through three distinct stages: elastic, elastoplastic, and plastic deformation [16]. Among these, the elastic and plastic deformation processes are analyzed using Hertzian contact theory and the Abbott and Firestone model, respectively [17,18]. The elastoplastic deformation process is complex, with the KE model serving as a classical analytical method for characterizing this transitional phase. Current research efforts predominantly focus on parametric modifications and conditional adaptations based on the foundational KE model framework [19,20,21,22,23,24,25]. In the identification of joint surface characteristic parameters, the conventional approach primarily relies on calculating these parameters through displacement measurements at the interfaces. However, identification accuracy is significantly influenced by measurement environmental conditions and instrument precision [26,27,28]. Liu et al. [25] developed an integrated approach combining modal testing with a co-simulation methodology, enabling rapid and precise identification of joint surface characteristic parameters, including stiffness and damping properties. Owing to the unavailability of actual fractal parameters for joint surfaces, current validation of theoretical models predominantly relies on indirect verification through the natural frequencies of joint surface structures. However, this approach suffers from solution non-uniqueness—different combinations of directional characteristic parameters may yield identical natural frequency values—significantly compromising the reliability of the method. Numerous studies have focused on analyzing the overall dynamic behavior of machine tools incorporating joint surface effects through finite element methods, yet the critical challenge remains the accurate identification of joint surface characteristic parameters [2,3,4,29,30].
In summary, the characterization and identification of surface feature parameters mainly suffer from the problems of incomplete consideration of factors during modeling and coupled solutions in indirect verification methods. To further improve model accuracy and directly validate characteristic parameters, we further refined the joint surface characteristic parameter model by incorporating substrate displacement induced by asperity interactions. A direct experimental validation method was subsequently proposed, followed by a systematic investigation of the global dynamic behavior of the GP300 grinding machine.

2. Refinement of the Joint Surface Characteristic Parameter Model

The modeling process of the characteristic parameters of joint surfaces is shown in Figure 1. Building upon the KE model, we extend the joint surface fractal parameters from two-dimensional to three-dimensional characterization for enhanced physical fidelity [18], while excluding the substrate deformation effects induced by asperity interactions.
The interaction between asperities is shown in Figure 1, revealing that substrate deformation conversely affects asperity deformation through mutual coupling effects. As illustrated, z is the distance from the peak of the micro-asperity to the mean plane of the micro-asperity prior to contact; d is the distance from the mean plane of the micro-asperity before contact to the ideal rigid plane; dn is the distance from the mean plane of the micro-asperity after contact to the ideal rigid plane; δ is the total deformation of a single micro-asperity; and δ is the distance that the mean plane of the micro-asperity falls. As shown in Figure 2, there is the following relationship:
z d = δ z d n = δ δ
The distance by which the average surface of the micro-asperity falls due to the interaction is
δ = F e a a E
where E denotes the elastic modulus of the joint surface material.
Thus, the actual deformation of a single micro-asperity is
δ = δ δ = 9 F e 2 16 E 2 R 1 3
The contact area of an individual micro-asperity is approximated as aπRδ, where R denotes the radius of curvature at the asperity summit. When accounting for interaction effects, the elastic load for a single micro-asperity can be expressed as
F e = π E G D 1 a 3 D 2 1 3 π 16
where D denotes the fractal dimension of the joint surface and reflects the roughness information at all scales; G denotes the characteristic length-scale parameter and determines the specific size of the Weierstrass–Mandelfort function. D and G are important influencing factors on the characteristic parameters of the joint surface.
Therefore, the normal stiffness of an individual micro-asperity in the elastic regime is modified as
K e = d F e d δ = 2 E 3 a 16
With reference to [18], the fractal dimension D is taken to be 3D. Therefore, the area distribution function n(a) is
n a = D 1 4 a l D 1 2 a D + 1 2
where a and al denote the contact area and critical contact area of the micro-asperity, respectively.
Therefore, the actual contact area of the joint surface is
A r = a c a l n a a d a = D 1 2 3 D a l
where ac denotes the critical contact area of the micro-asperity.
The total normal stiffness of the joint surface can be expressed as
K = K e + K e p 1 + K e p 2 = a c a l K e n a d a + 1 6 1 D 1 a c a c K e p 1 n a d a + 1 110 1 D 1 a c 1 6 1 D 1 a c K e p 2 n a d a = 0.433 E D 1 a c 2 D 2 a l D 1 2 a l 1 2 D 2   + 0.4894 2 0.225 D + 0.45 E 0.85 G 0.3 0.15 D H 0.15 a c 0.85 0.425 D a l D 1 2 k 0.15 D 1 π 0.075 D + 0.2 ln γ 0.075 D 2   + 2 0.792 D + 0.568 E 0.472 G 1.056 0.528 D H 0.528 a c 0.472 0.236 D a l D 1 2   × 0.2301 k 0.528 π 0.556 0.264 D D 1 ln γ 0.264 D 2
The fractal scale parameter G is set to 10−10, and Figure 3 illustrates the relationship curves between the normal stiffness K of joint surfaces and the real contact area Ar of micro-asperities for different models. The results demonstrate that the normal stiffness of all three models increases with both the real contact area Ar and the fractal dimension D. When the actual contact area is the same, the modified 3D KE model has the largest stiffness value, the 2D KE model has the smallest stiffness value, and the 3D KE model has an intermediate stiffness value, and the difference between the stiffness values of the three models becomes larger and larger as the fractal dimension D increases. All three models conform to the fundamental principles of joint surface contact mechanics [9], though their specific accuracy requires further experimental validation.

3. Direct Validation Methodology for Joint Surface Characteristic Parameter Models

The indeterminate nature of fractal parameters for joint surfaces precludes direct validation of characteristic parameter models. Current indirect validation approaches relying on modal parameters or friction factors demonstrate limited reliability. Here, we propose a direct experimental methodology for validating joint surface stiffness and damping properties, whose implementation critically depends on the precise determination of fractal surface parameters. To facilitate the verification, we have designed a joint surface device. As shown in Figure 4, a flat plate is connected by four M16 bolts to form a fixed joint surface, the initial tightening torque of each bolt is 20 N·m. The flat plate material is marble, with dimensions of 500 mm in length, 300 mm in width, and 50 mm in height. The excitation system used in the experiment was an LC02 type force hammer, which is used for modal testing analysis, structural health monitoring, and resonance point analysis. A 3A102 type force sensor (Honeywell International Inc, Charlotte, NC, USA) is installed on the force hammer to measure the excitation signal of the force hammer. The integrated force sensor of the impact hammer and the triaxial accelerometer 336D05 transmit force and acceleration signals, respectively, to the NI data acquisition system, which converts the analog signals to digital format before relaying them to the computational unit. According to the combined modal testing and joint simulation methodology proposed in [18], the normal stiffness and damping of the marble plate joint interface structure were determined to be 2.8667 × 10⁷ N/m and 1.2713 × 10⁷ N·s/m, respectively.
The W-M function is conventionally employed as a profile curve to characterize the contact state of joint surfaces [9,18], with its structural function expressed as
S τ = Z x + τ Z x 2 = C G 2 D 1 τ 4 2 D
where τ represents an arbitrary increment of x, 〈 〉 denotes the spatial averaging operator, and C satisfies the following relation:
C = Γ 2 D 3 sin 2 D 3 π / 2 4 2 D ln γ
where Γ denotes the Euler integral of the second kind, and γ is related to spectral density and self-affine properties. For randomly distributed surfaces, it typically assumes a value of 1.5.
Taking logarithms on both sides of Equation (7),
lg S τ = 4 2 D lg τ + 2 D 1 lg G + lg C
From Equation (9), S (τ) and τ are linearly related in logarithmic coordinates, the slope of the line is related to the fractal dimension D, and the intercept of the line is related to the fractal scale parameter G. The 2D fractal dimension and fractal scale parameter can be obtained by Equation (9), assuming that the slope of the line is k and the intercept is b, the following relationship is obtained:
D = 4 k 2 G = 10 b lg C 2 D 1
The joint surface is formed by two structures in contact, and the equivalent structure function is shown in Equation (11), where Sa (τ) and Sb (τ) are the structural functions of the two structural surface profiles, respectively.
S e τ = S a τ + S b τ
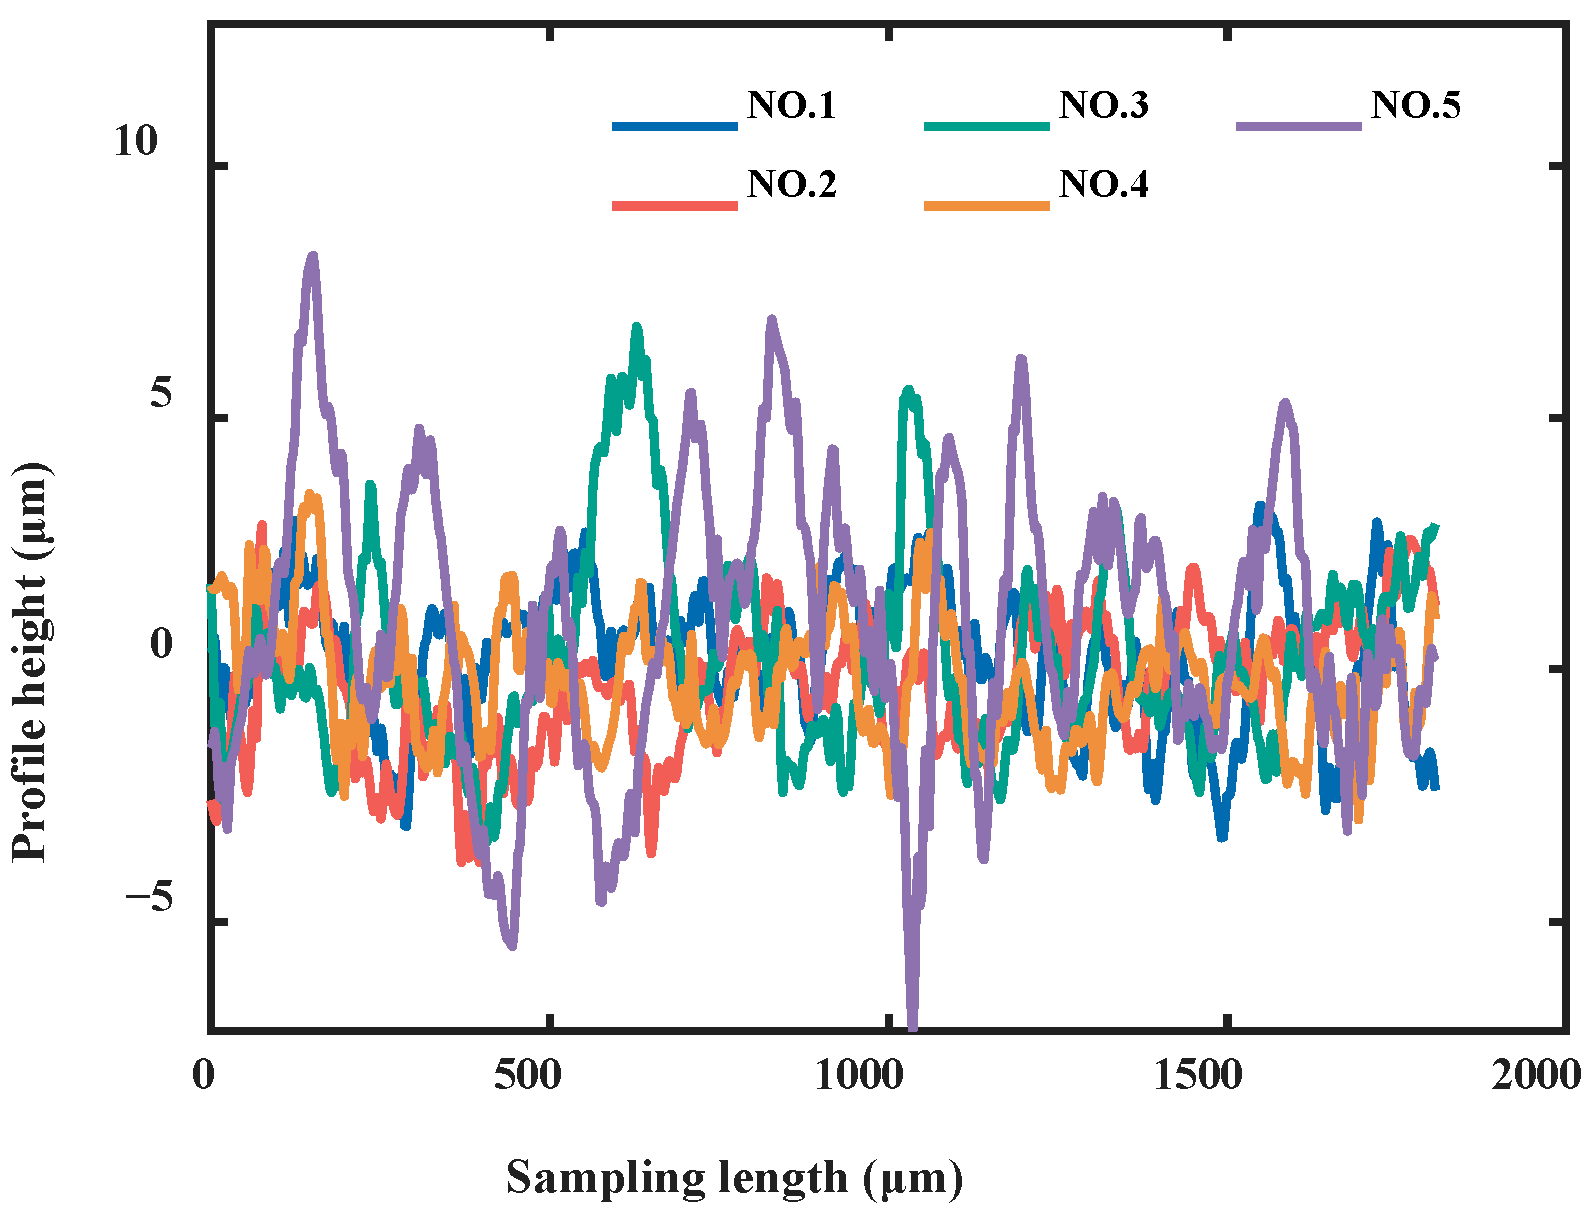
Accurate identification of fractal parameters for marble plate joint interfaces requires prior acquisition of surface roughness data. As shown in Figure 5, we employed a VK-X3000 laser microscope (Keyence Corporation, Osaka, Japan) to measure surface roughness at five distinct locations on each plate. The resolution and linear scale of the microscope were 0.01 nm and 0.1 nm, respectively, with a maximum scanning area of 50 mm square. The two-dimensional fractal dimension was then calculated for each measurement set using the structure function method, with the final interface fractal dimension determined as the arithmetic mean of these five values. Figure 6 shows the five acquired profile curves, each with a sampling length of 2 mm. These high-frequency contour datasets effectively characterize the microscopic surface roughness of the plates, thereby enabling accurate computation of fractal parameters.
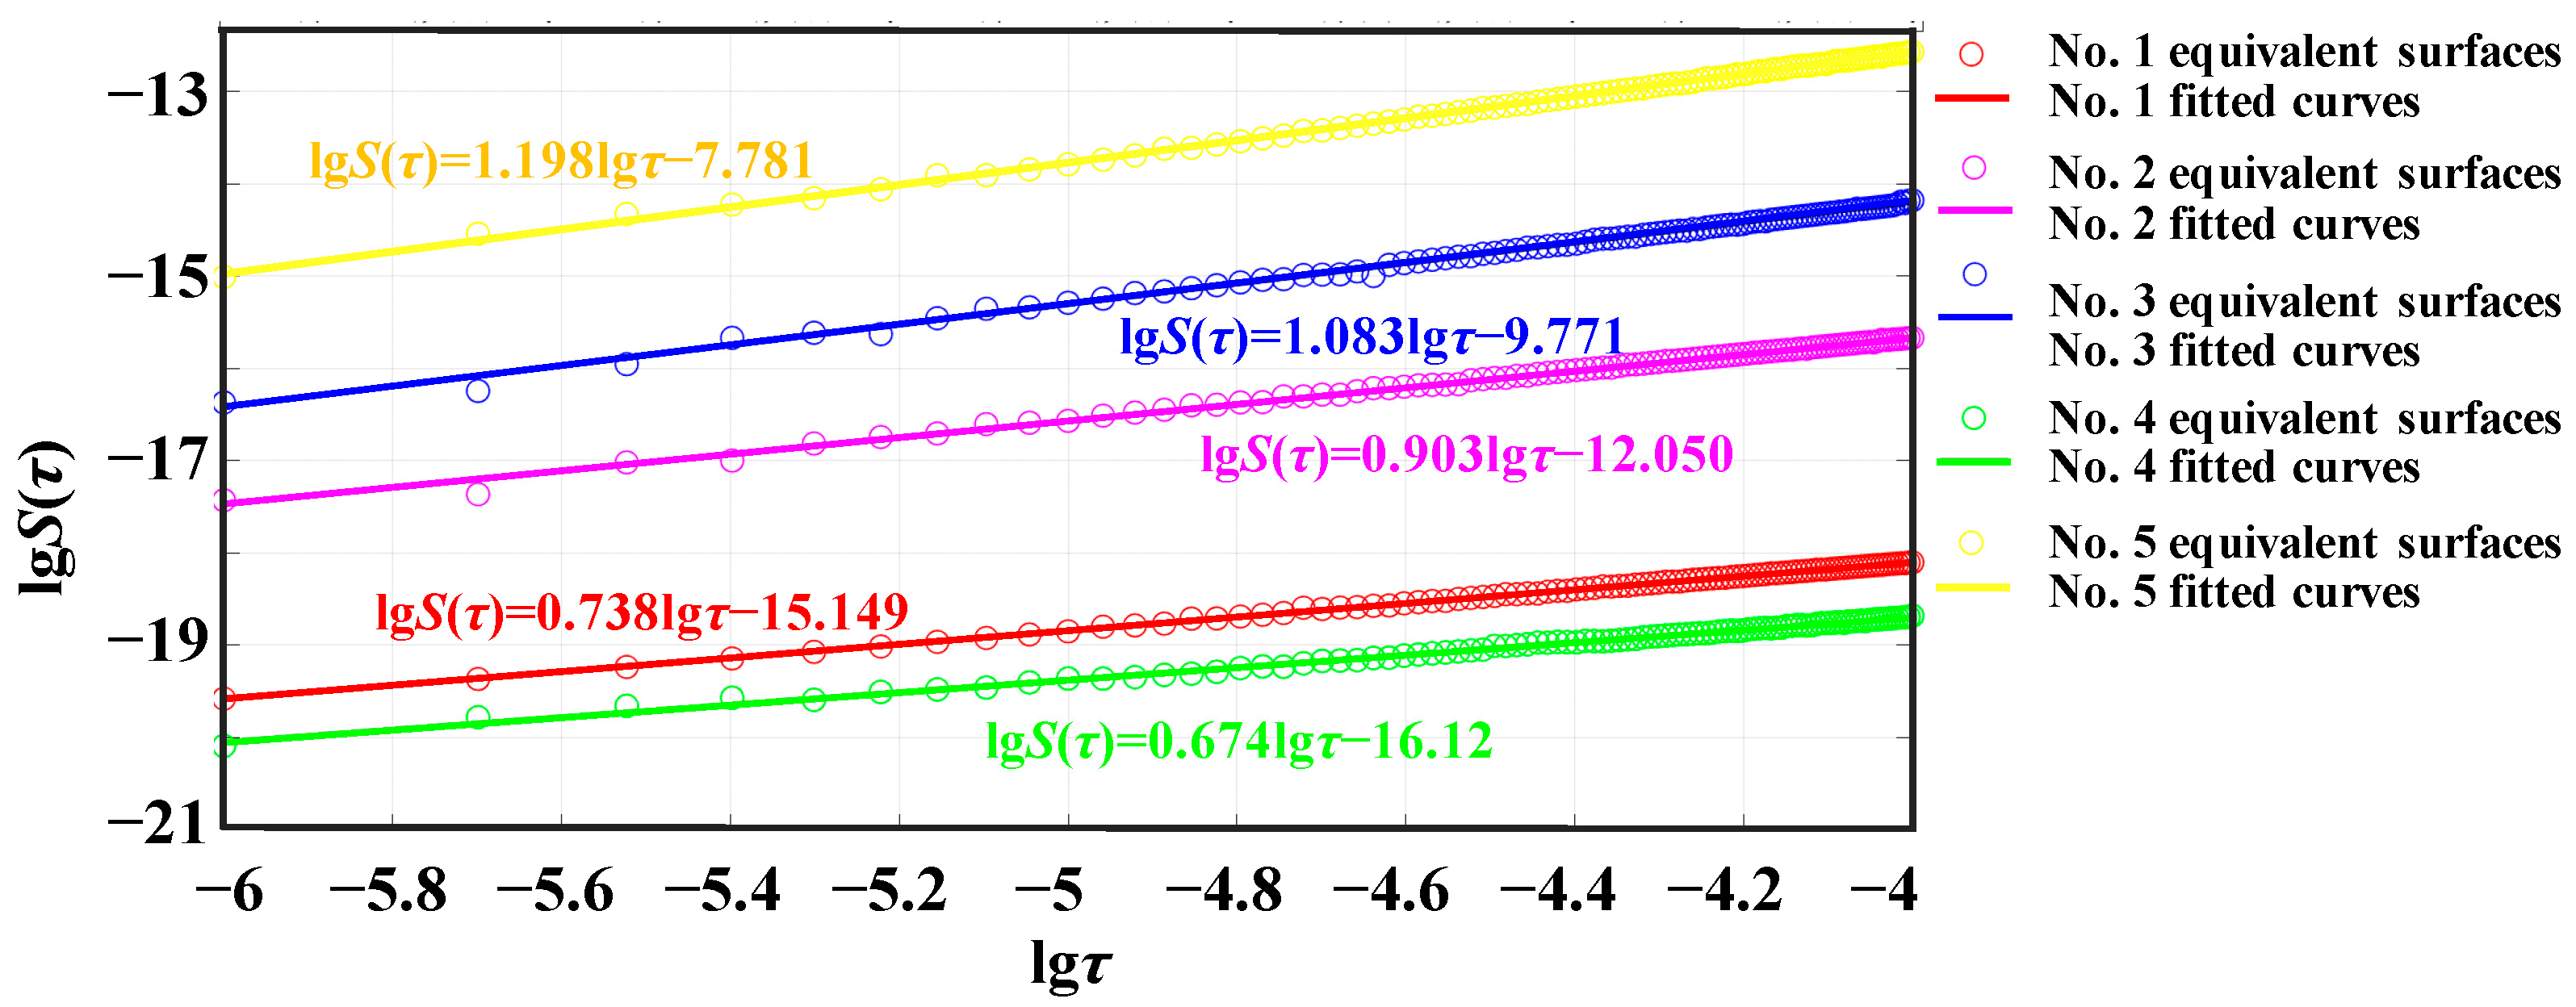
The two marble plates were manufactured under identical processing conditions, exhibiting statistically equivalent surface topography and roughness characteristics. Consequently, the corresponding structure functions are equivalent. As shown in Figure 7, the structure functions of the joint interface in double logarithmic coordinates exhibit linear approximations across all five measurement sets, confirming the fractal characteristics of the marble plate surfaces.
The five sets of linear equations fit in Figure 6 are
lg S τ = 0.738 lg τ 15.149 lg S τ = 0.903 lg τ 12.050 lg S τ = 1.083 lg τ 9.771 lg S τ = 0.6741 lg τ 16.12 lg S τ = 1.198 lg τ 7.781
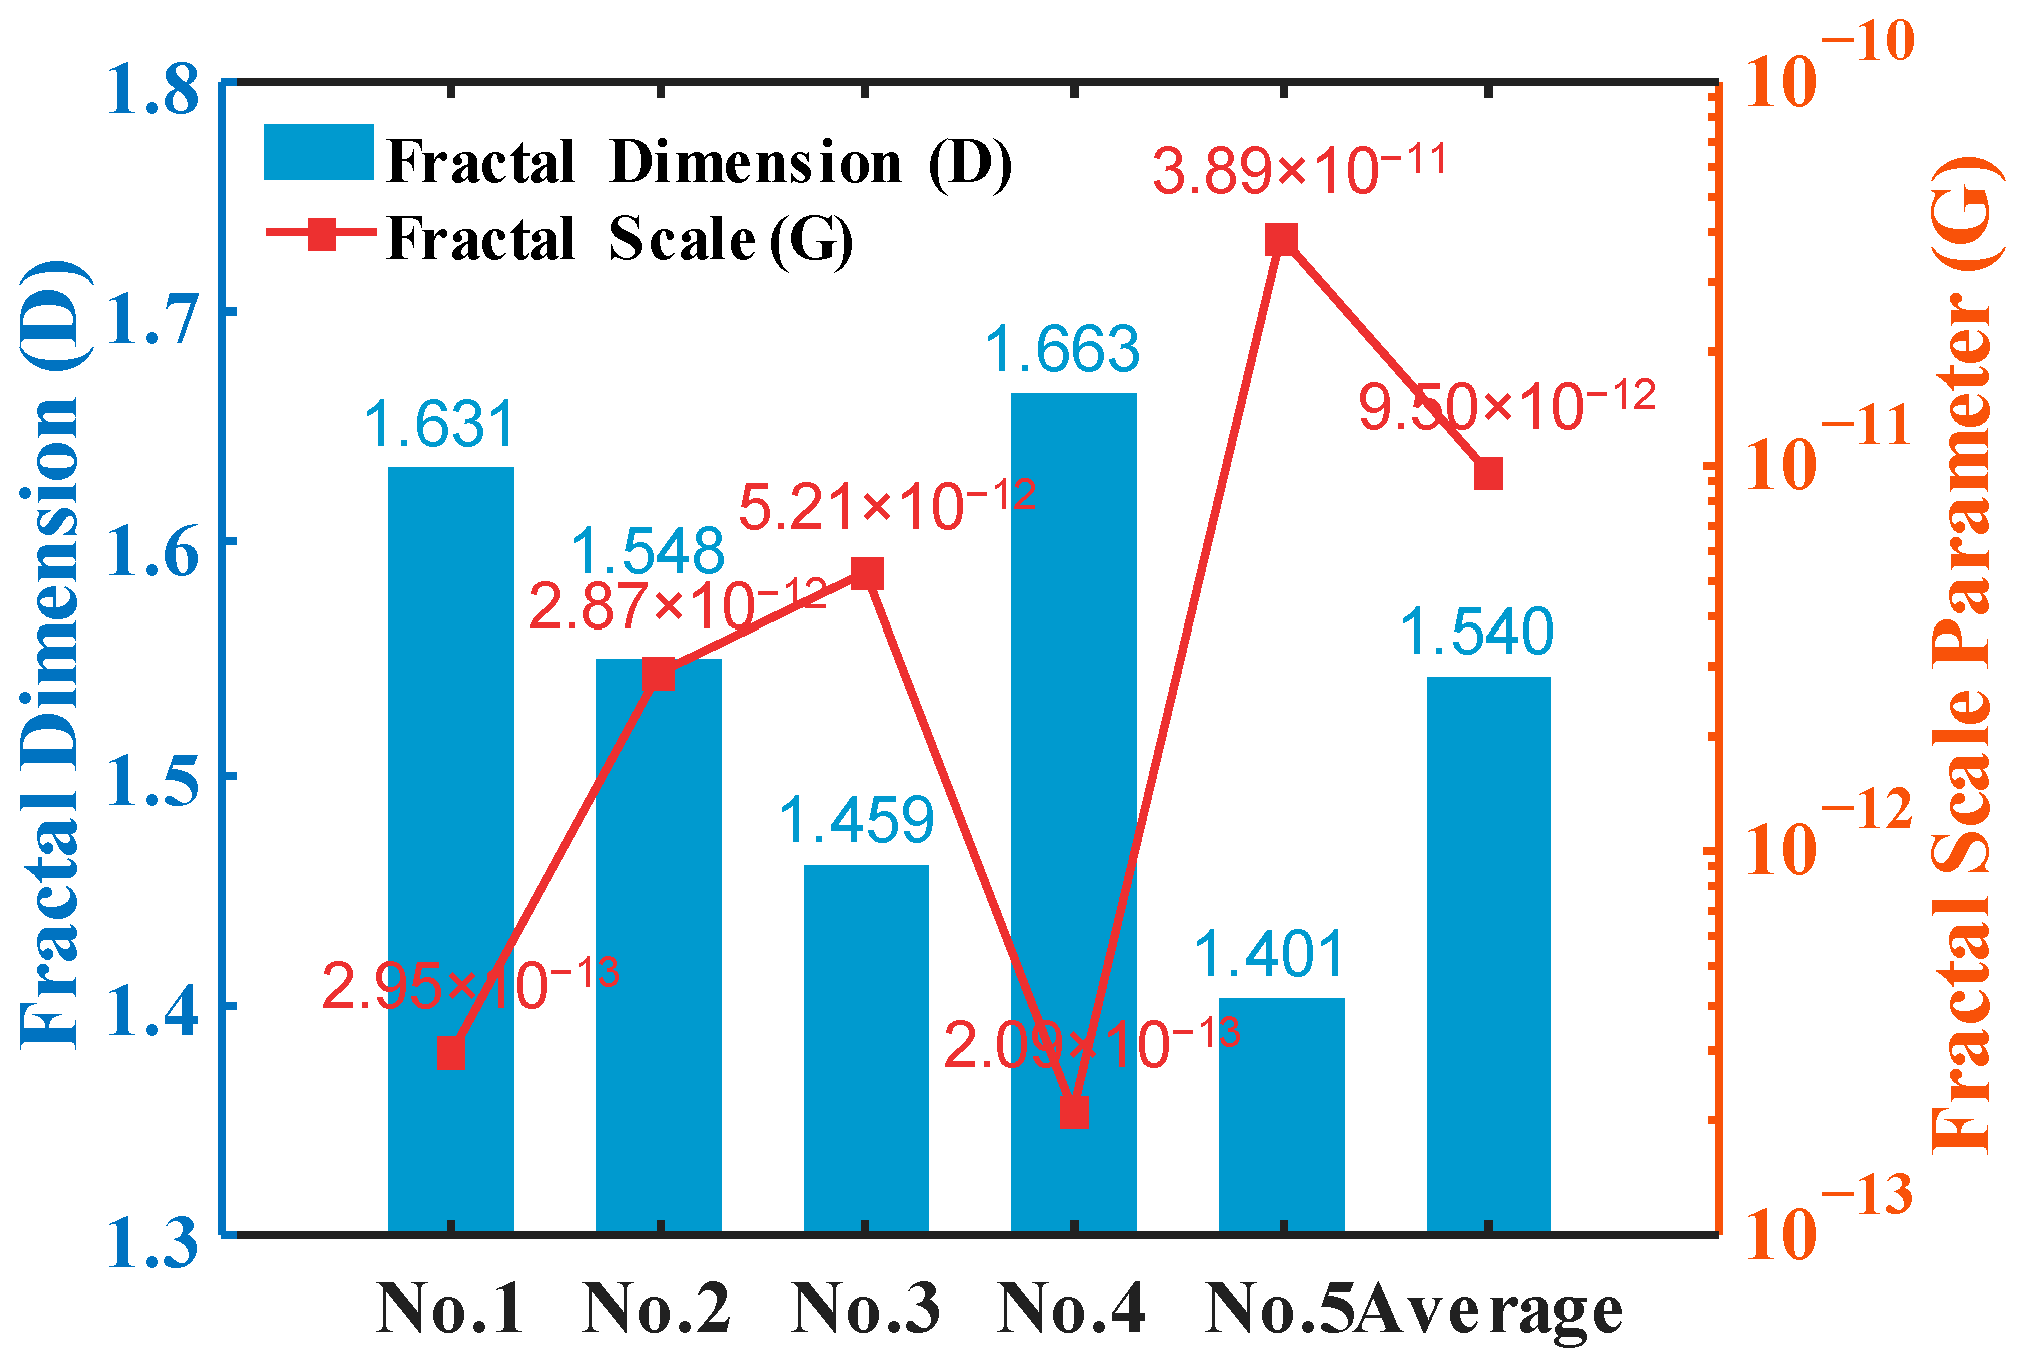
By combining Equations (9) and (10), the fractal parameters were determined for all five profile measurements. As shown in Figure 8, taking the average value, the equivalent 2D fractal dimension D of the marble plate joint surface is 1.5404, and the fractal scale parameter G is 9.497 × 10⁻¹². The marble surface is isotropic, hence its three-dimensional fractal dimension Ds = D + 1 = 2.5404.
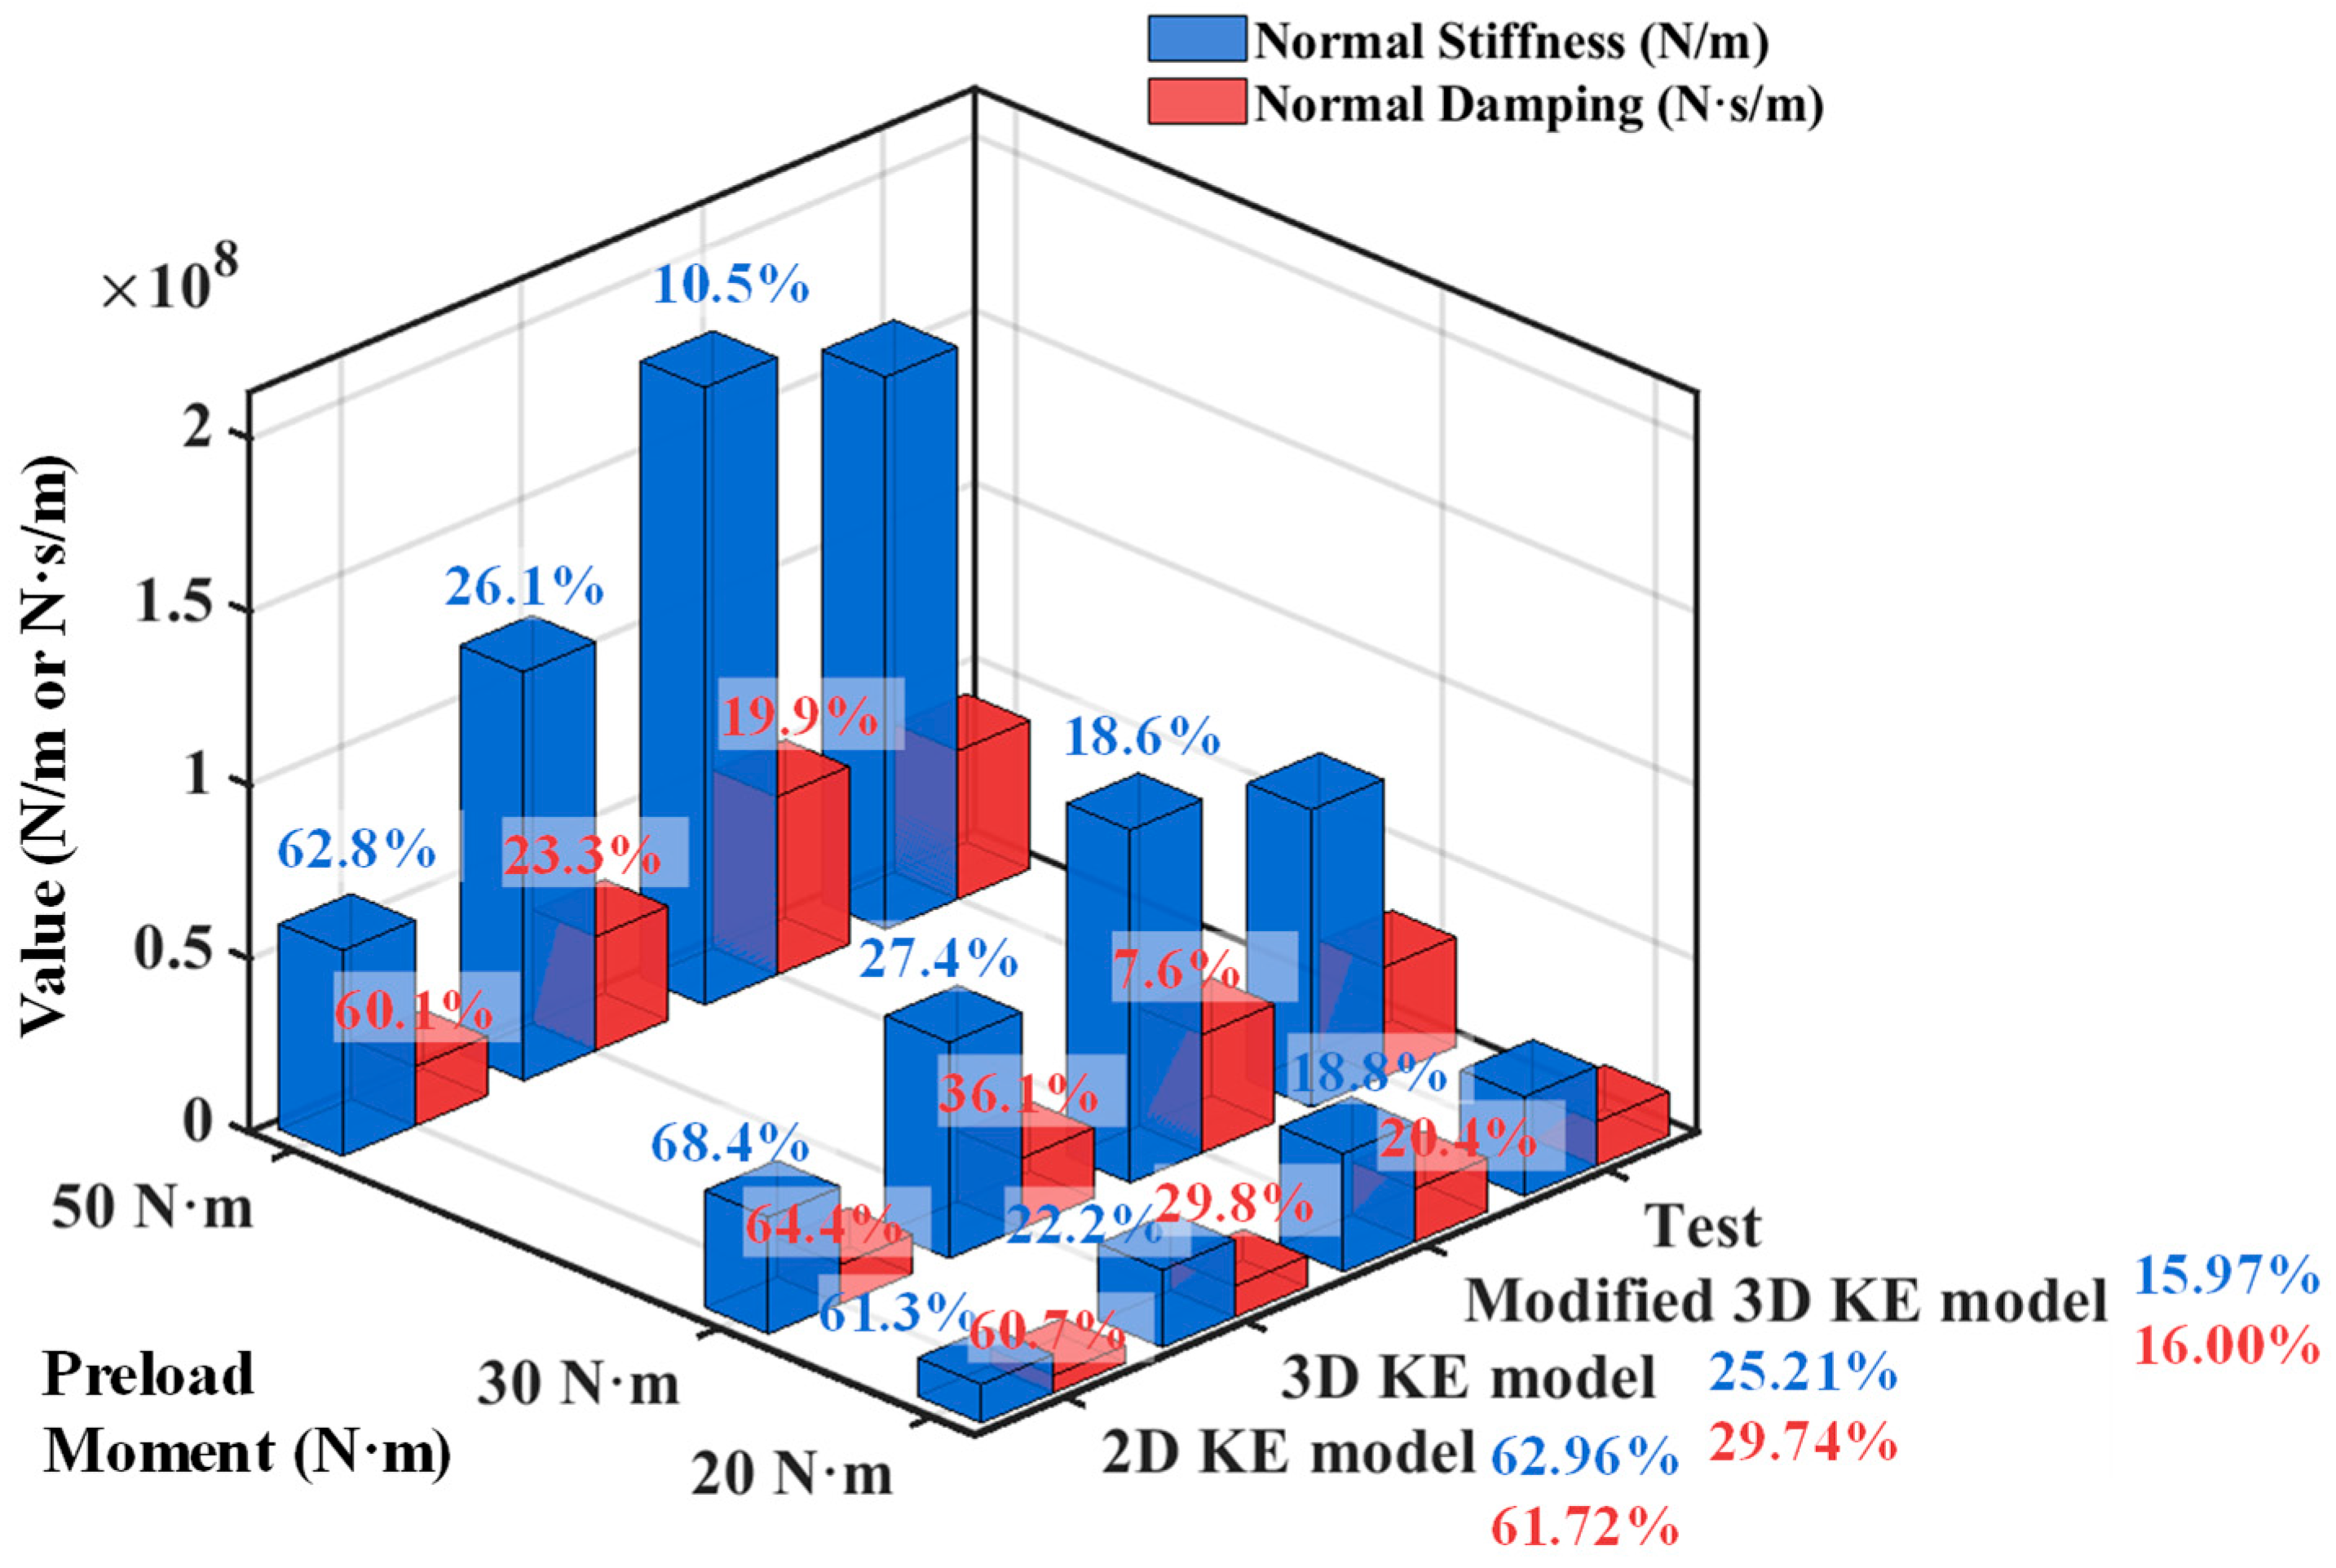
Substitution of the fractal parameters into the theoretical model yielded the characteristic parameters of the joint interface, including the stiffness and damping. To enhance the reliability of the verification, we compared three sets of data with bolt preload torques of 20 N·m, 50 N·m, and 80 N·m, respectively. Figure 9 shows that the average errors of the 2D KE model, 3D KE model, and modified 3D KE model normal stiffness and damping from the test values were 62.966%/61.72%, 25.21%/29.74, and 15.97%/16%, respectively. The KE model accuracy was substantially improved when the fractal dimension was expanded to a more realistic three dimensions, and was further improved when the micro-asperities interactions were taken into account.

4. Analysis of Machine Tool Integrated Dynamic Performance

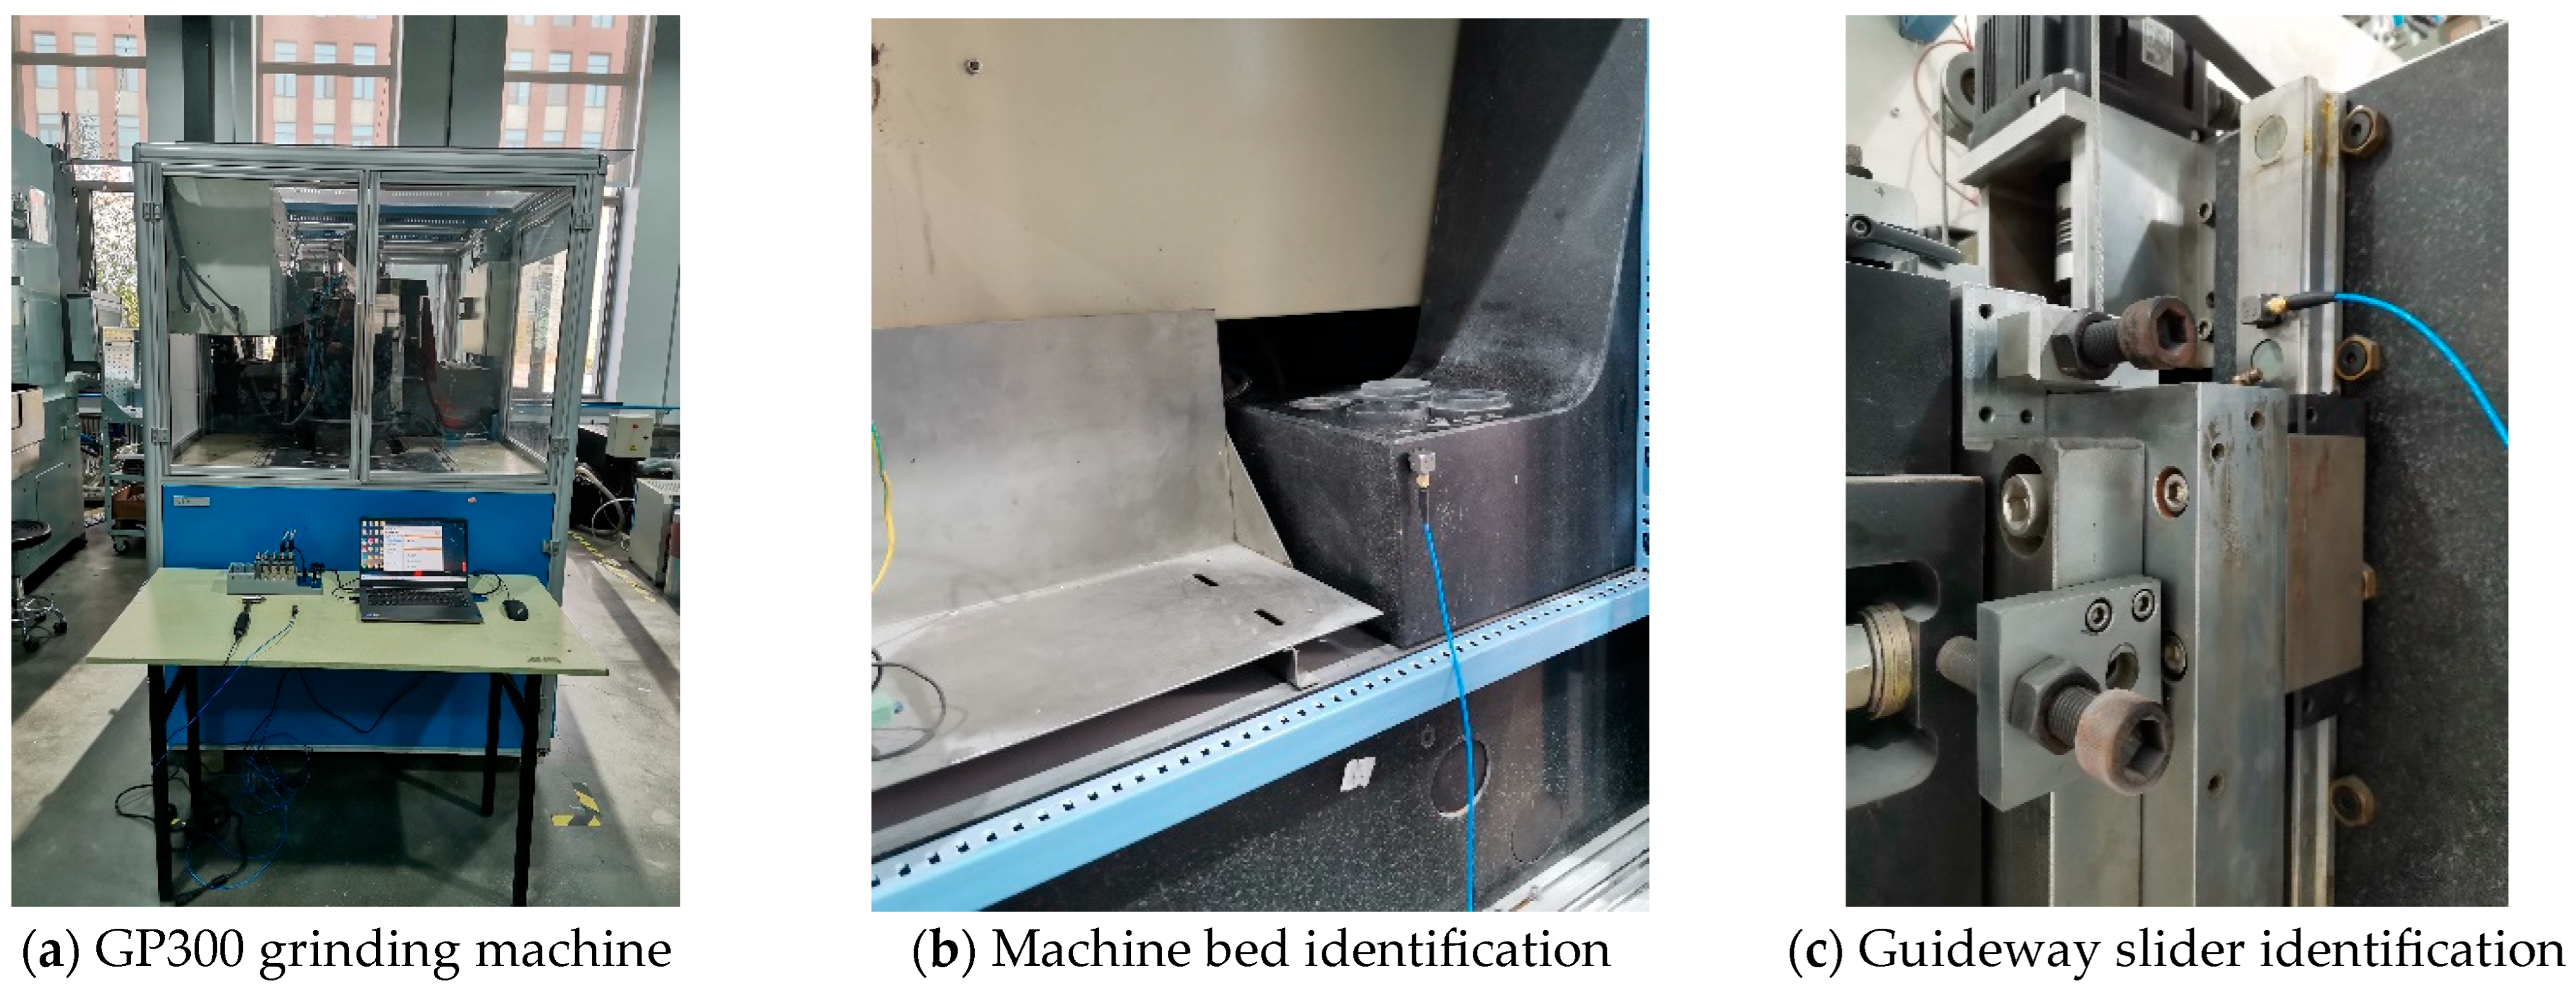
To analyze the role of joint surfaces in machine tools, we conducted a holistic dynamic analysis of a GP300 wafer-thinning grinder. As shown in Figure 10, according to the method in Section 3, the main combined parts of the machine tool bed, guideway slider, and other characteristic parameters were identified: the normal stiffness of the combined surface of the bed was obtained as 8.762 × 10⁹ N/m; the stiffnesses in the two tangential directions were 9.887 × 10⁶ N/m and 1.615 × 10⁵ N/m, respectively; the normal damping was 6.873 × 10⁵ N·m/s; the damping in the two tangential directions were 6.000 × 10⁵ N·m/s and 2.957 × 10⁵ N·m/s, respectively; the normal stiffness of the slide guide bonding surface was 5.003 × 10⁵ N/m; the stiffness of the two tangential directions were 8.977 × 10⁷ N/m and 5.197 × 10⁵ N/m, respectively; the normal damping was 5.753 × 10⁵ N·m/s; and the damping of the two tangential directions were 2.861 × 10⁵ N·m/s and 2.719 × 10⁵ N·m/s, respectively.
The experimentally identified joint surface characteristic parameters were incorporated into the finite element model via spring-damper elements to perform machine tool system-level dynamic analysis.
A geometric model of the grinding machine was established using SolidWorks (2018) software, where features negligible of importance in finite element analysis—such as chamfers, threaded holes, bosses, and other complex structures—were removed. Since directly meshing complex geometries in Ansys (18.0) APDL is cumbersome, HyperMesh (2022) software was first employed to generate the mesh for the grinding machine model. Material properties were assigned according to Table 1, and SOLID186 elements were used due to the complexity of the overall model of the machine tool, resulting in a total of 407,112 elements and 784,579 nodes based on the shape and size of the machine tools and their functional modules, and the material model adopted a linear elastic isotropic model.
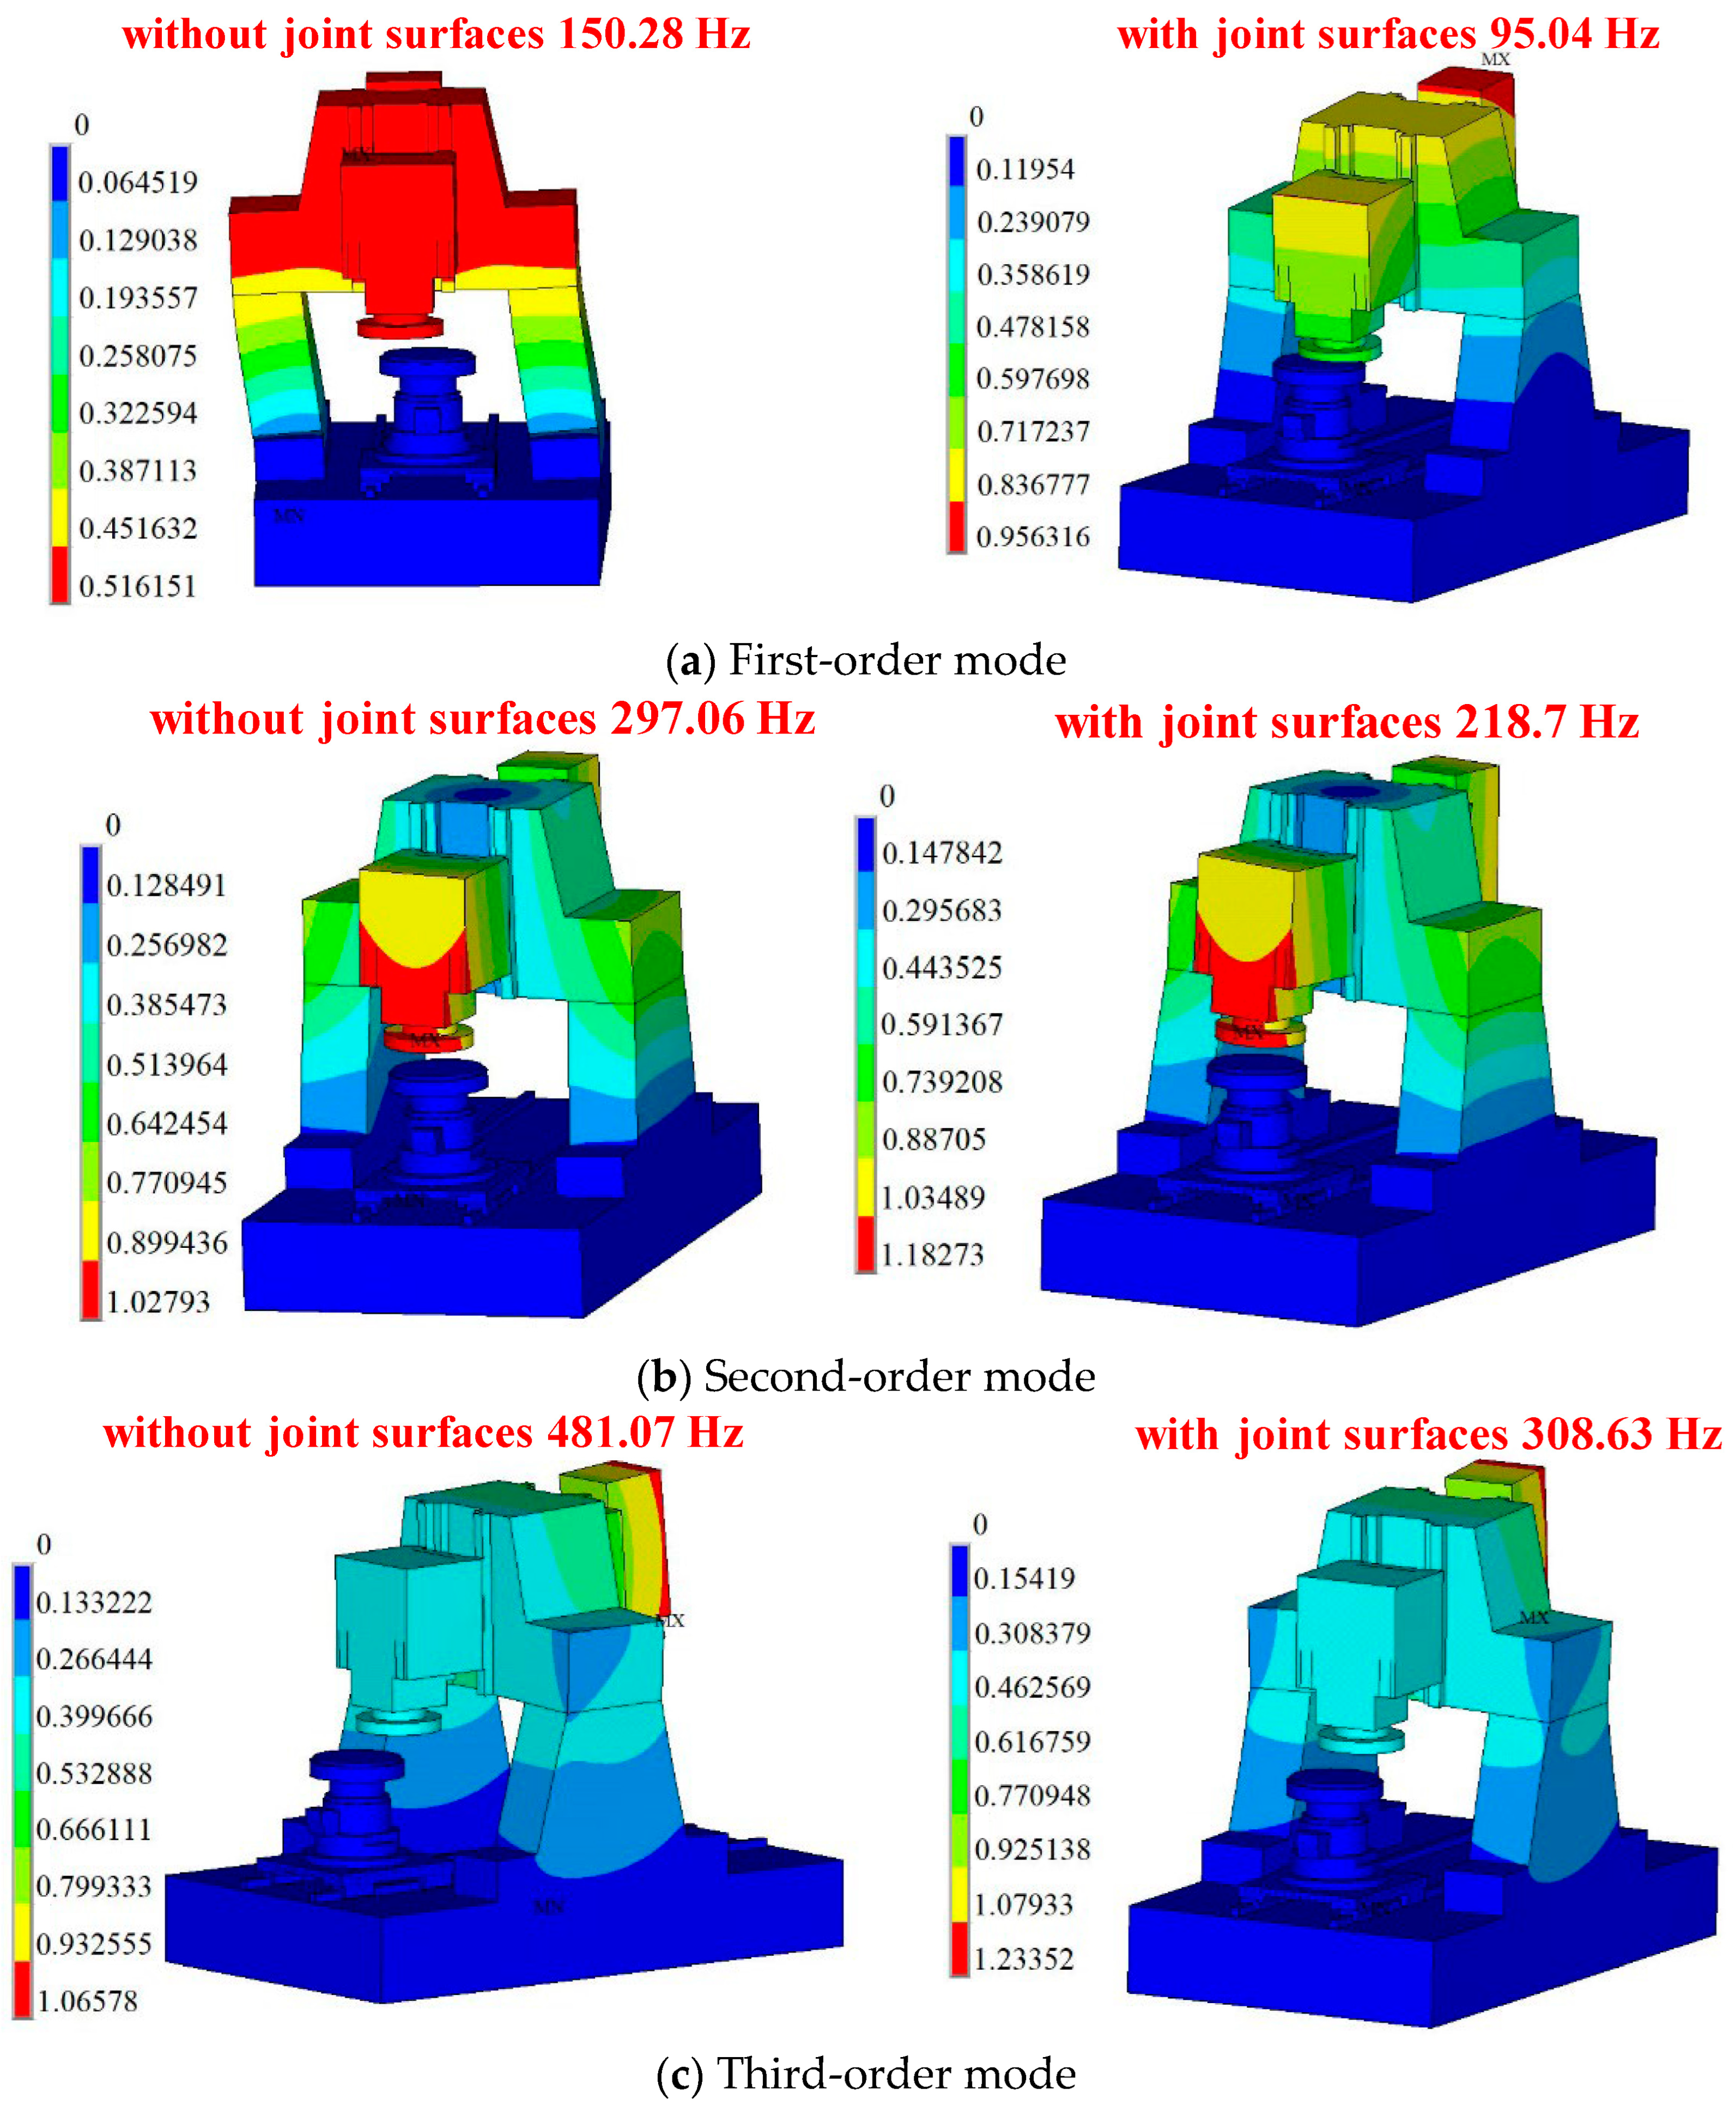
The finite element model was then imported into ANSYS APDL for dynamic analysis. It should be noted that in finite element simulation, the convergent solution is essentially an approximation, and its accuracy depends on numerical discretization, iterative algorithms, and user set convergence standards. To further ensure simulation accuracy, the convergence objectives of the modal and transient analysis were the mode shape and time step, respectively. The corresponding solving algorithms were the subspace iteration method and Newmark-βmethod, and the time step adopted an automatic time step algorithm. The GLUE operation was applied to bond all components of the grinding machine together, without considering the influence of joint interfaces. The base of the machine bed was treated as a fixed support surface, and boundary conditions were defined by fully constraining all degrees of freedom (DOFs) of the nodes at the bottom. Modal analysis was conducted to obtain the first three natural frequencies and corresponding mode shapes.
Figure 11 shows the first three modal modes of the machine tool system. The consideration of joint surface effects resulted in reducing the first three natural frequencies and modifying the corresponding mode shapes of the machine tool. The first-order mode shape reveals that incorporating joint surfaces shifted the machine’s weakest region from the column to the grinding wheel spindle-beam connection, which was critical for the subsequent grinding load analysis.
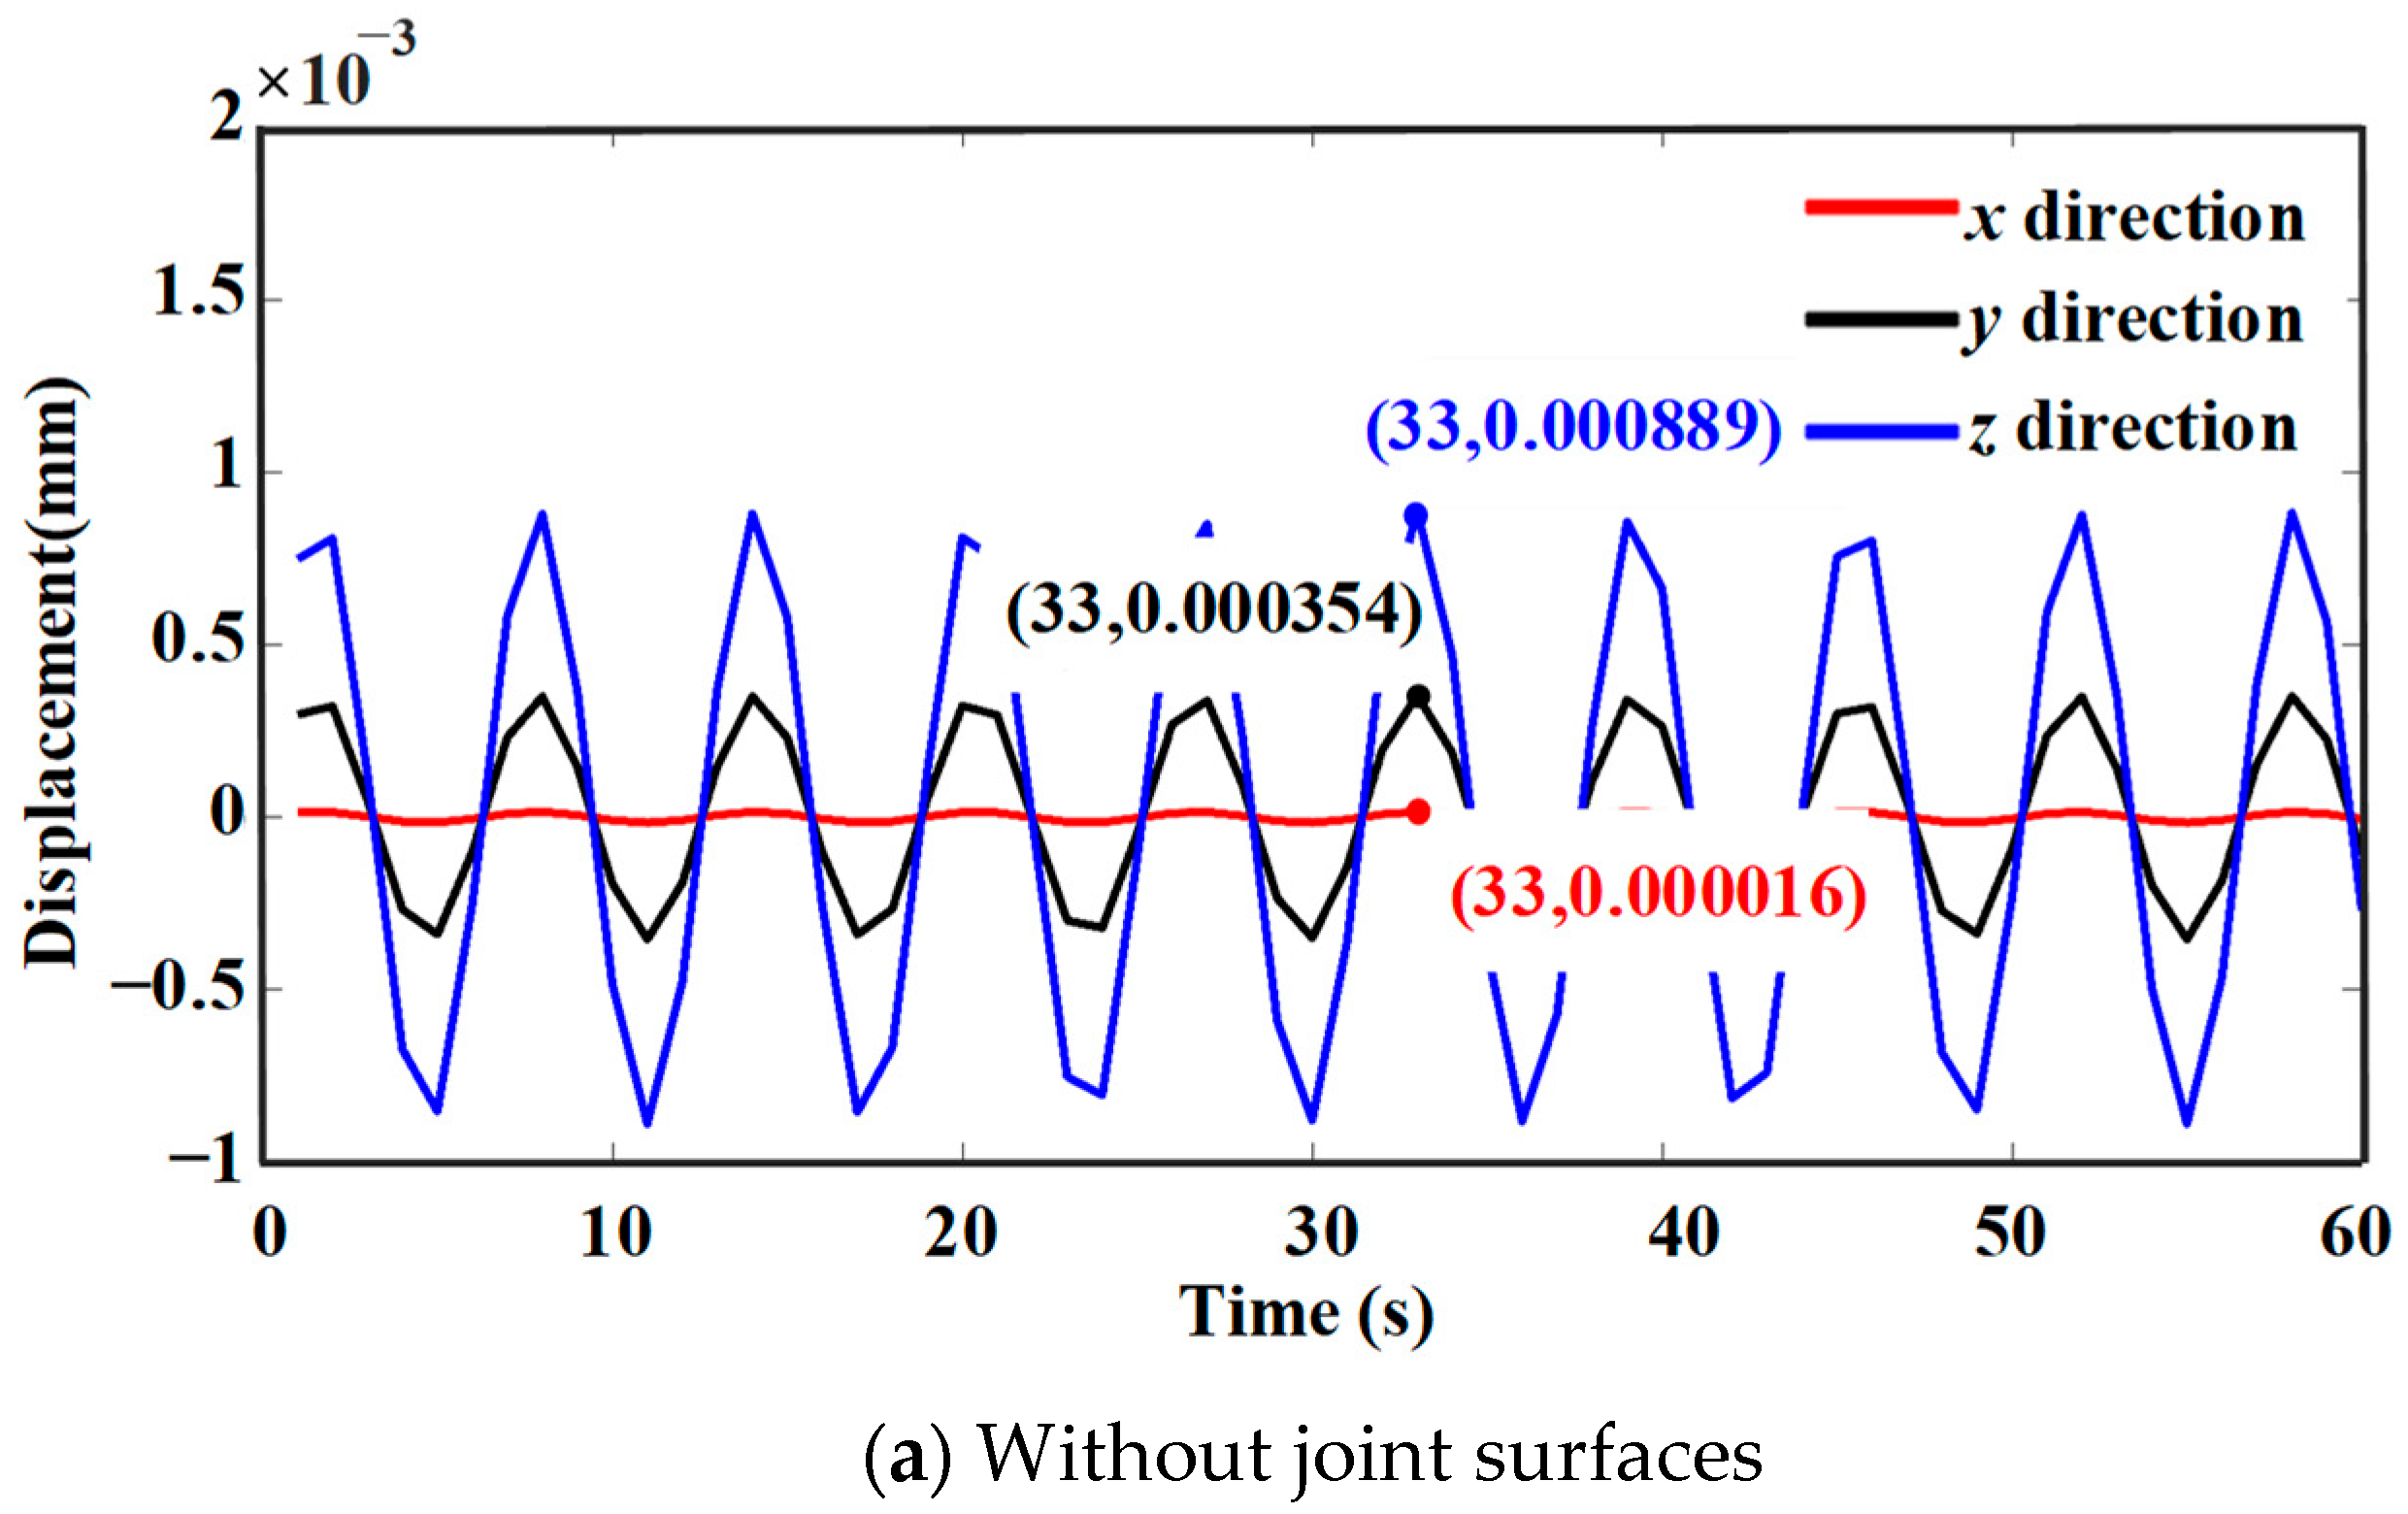
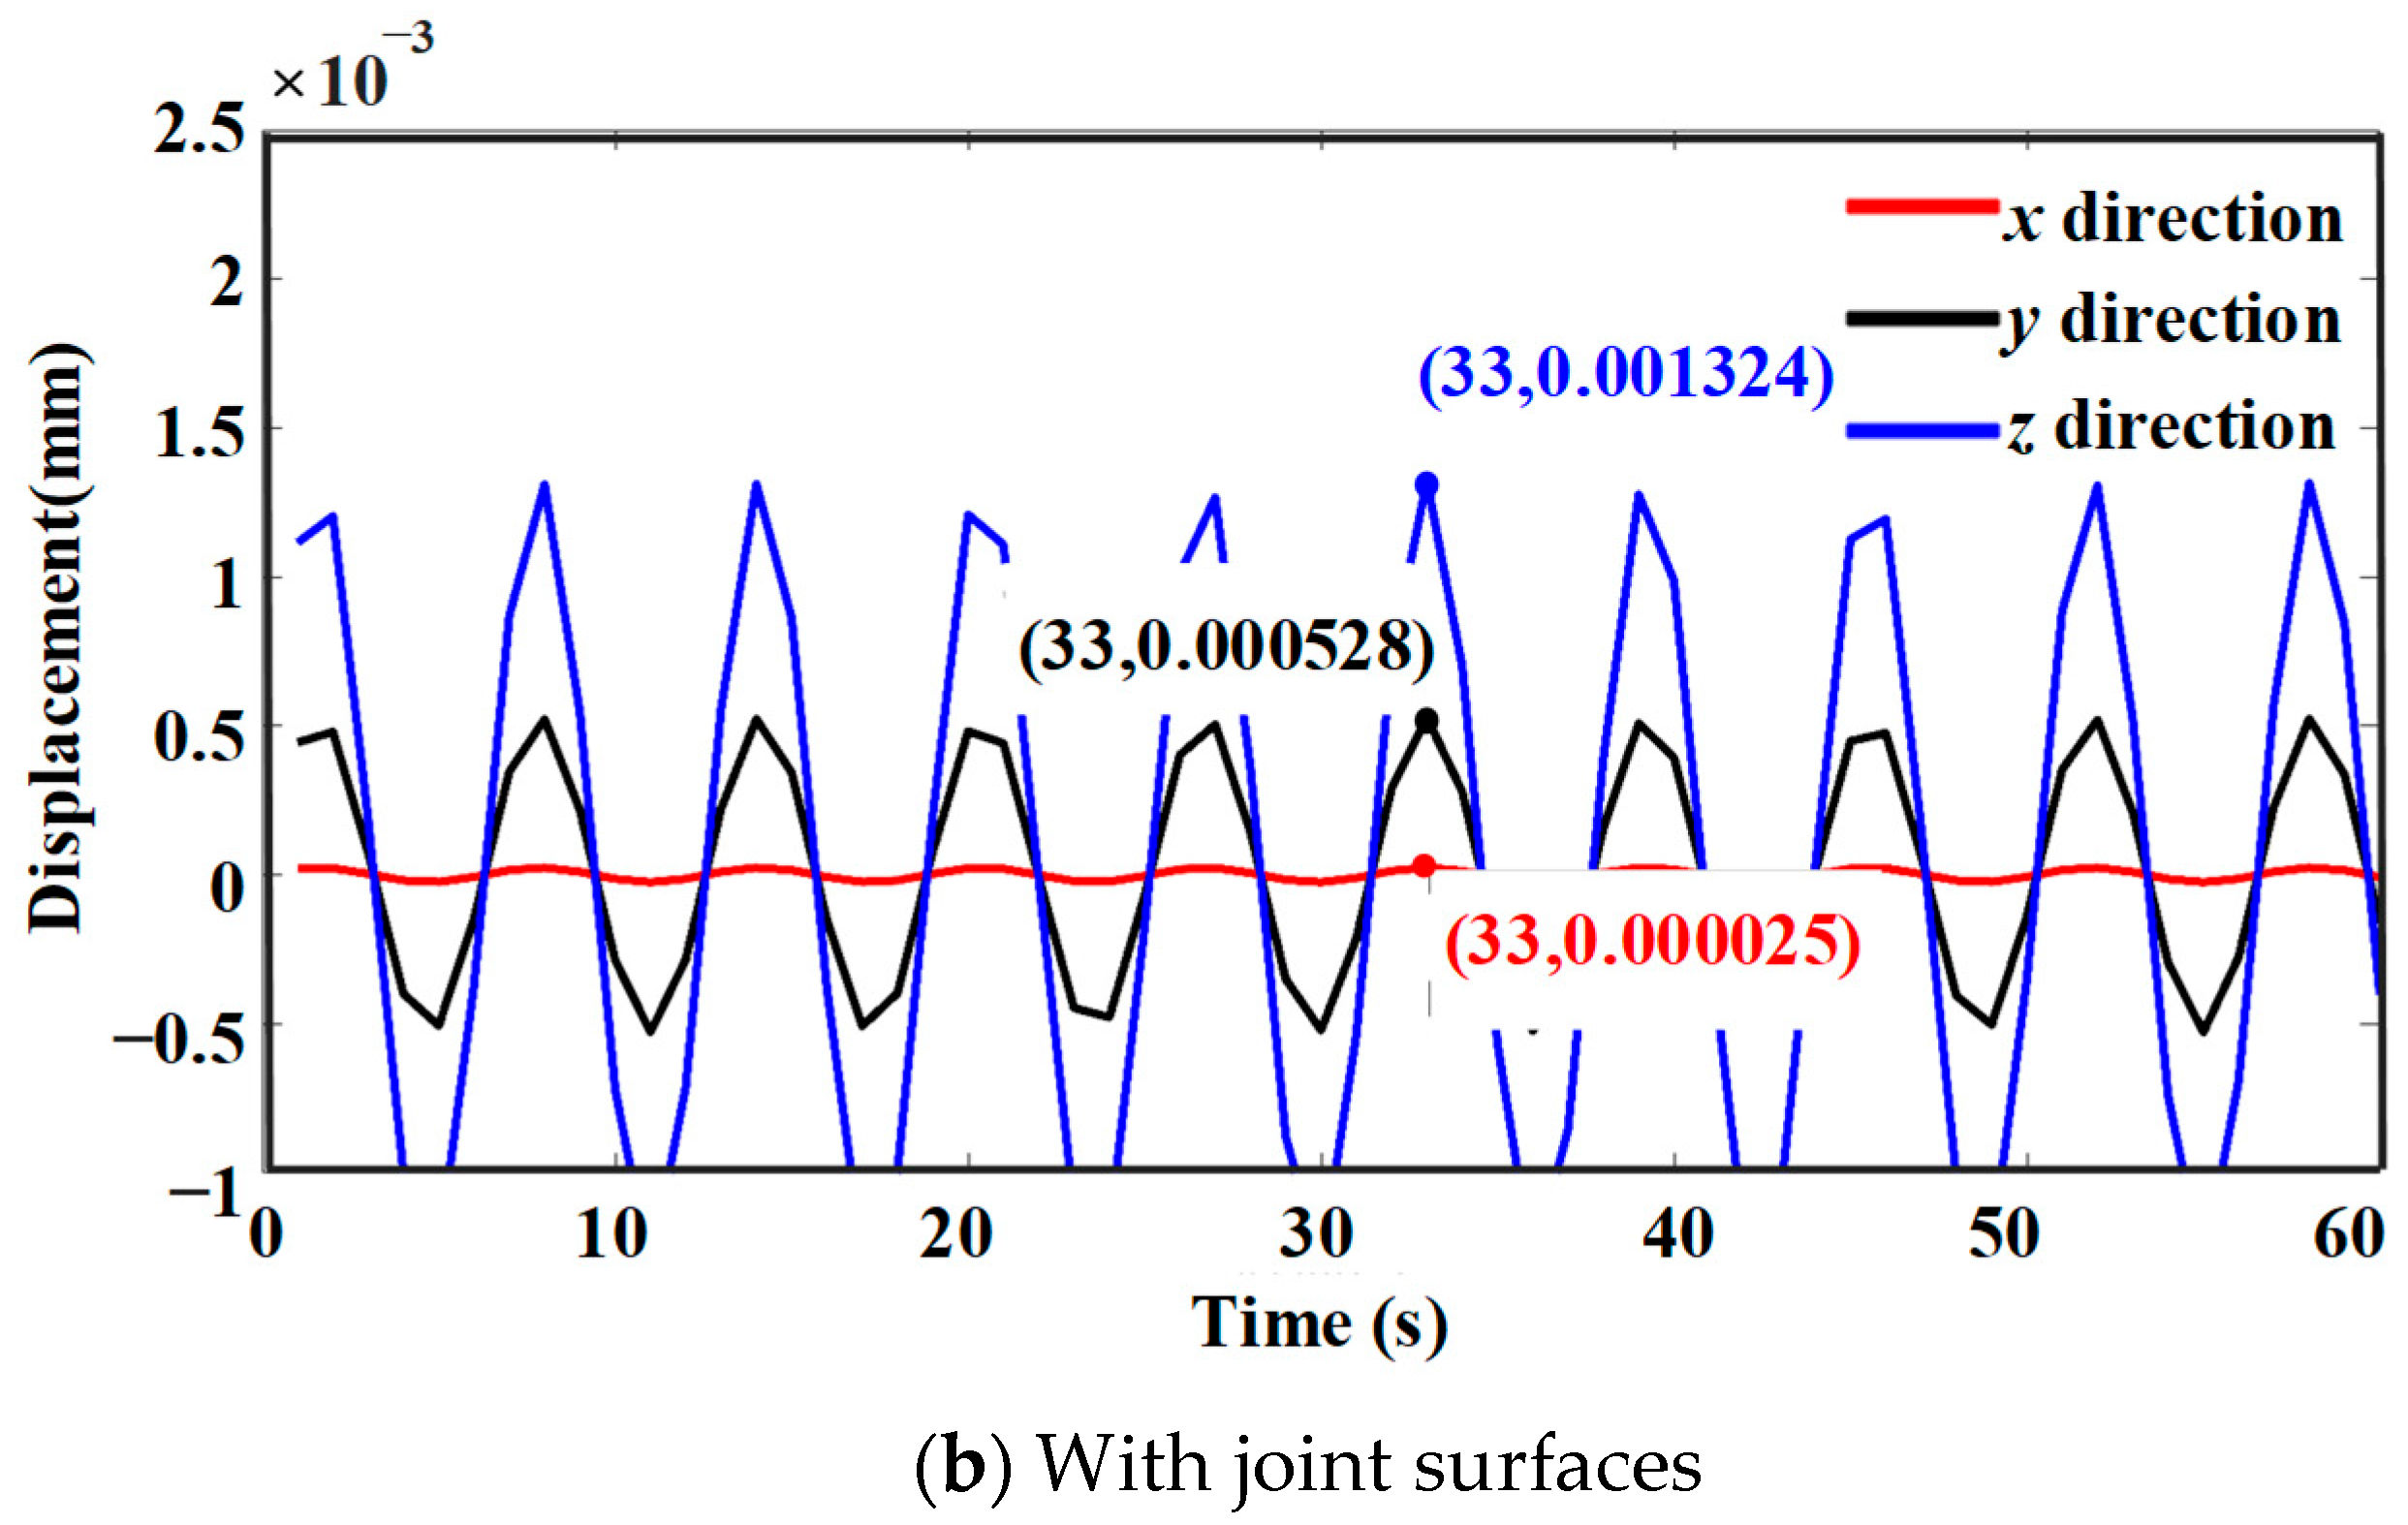
A force F = Fc sin 100 t was applied to the grinding wheel teeth, where Fc had a grinding component force Fx = 100 N in the x-direction, Fy = 120 N in the y-direction, and Fz = 280 N in the z-direction, with the time t set to 60 s. The response of the grinding wheel under grinding load is shown in Figure 12. Under identical loads, the models with joint surfaces included and excluded both exhibited maximum displacement at 33 s, with dominant z-direction deformation. Joint surface consideration amplified the vibrations in all directions, providing critical guidance for subsequent process optimization.

5. Conclusions

This study refined a characterization model of joint surface parameters by considering micro-asperity interactions, proposed a direct validation methodology, and analyzed the impact of joint surface characteristics on the global dynamic performance of machine tools. In addition, the following conclusions need to be pointed out:
(1)
The proposed model is applicable to mechanical fixed joint surfaces of various materials, and also has important guiding significance for the performance analysis of other complex mechanical structures outside machine tools.
(2)
Due to the limitations of traditional continuum mechanics theory in describing microscale deformation behavior, the accuracy of the proposed model still needs further improvement. Using microscale mechanics such as crystal plasticity theory or strain gradient theory to model the joint surface should be an effective means to further improve the accuracy of the model, but it is necessary to solve the uncertainties of parameters and boundary conditions, as well as cross-scale characterization problems.
(3)
The impact of precision maintenance on high-end machine tools is worth discussing, which requires in-depth research into characterizing and dynamically identifying the wear of key joint parts of machine tools under working conditions.

Author Contributions

Conceptualization: Y.Z., K.L., Q.L. and J.L.; Methodology: Q.L. and J.L.; Writing—original draft preparation: Y.Z.; Writing—review and editing: Y.Z., K.L. and J.L.; Visualization: Q.L.; Formal analysis: Y.L. and W.C.; Funding acquisition: J.L.; Resources: J.L.; Supervision: J.L. All authors have read and agreed to the published version of the manuscript.

Funding

This paper was financially supported by the Natural National Science Foundation of China (NSFC) (No. 52375473).

Data Availability Statement

The datasets generated and analyzed during this study are included in this published article. Additional data supporting the findings are available from the corresponding author upon reasonable request.

Conflicts of Interest

The authors declare no conflicts of interest.

Nomenclature

SymbolDefinitionUnitRelevant Section
D2D Fractal dimension (surface roughness)Section 2, Equation (6)
Ds3D Fractal dimension (Ds = D + 1Ds = D + 1)Section 3, Figure 8
GFractal length-scale parametermSection 2, Equation (4)
S(τ)Structure function of surface profilem2Section 3, Equation (9)
τSpatial shift in structure functionmSection 3, Equation (9)
γScaling constant (γ ≈ 1.5 γ ≈ 1.5)Section 3, Equation (10)
RRadius of curvature at asperity summitmSection 2, Equation (4)
aContact area of a single micro-asperitym2Section 2, Equation (6)
acCritical contact area for deformation transitionm2Section 2, Equation (7)
alLargest asperity contact aream2Section 2, Equation (6)
ArReal contact area of joint surfacem2Section 2, Figure 3
δTotal deformation of a micro-asperitymSection 2, Equation (1)
ΔdDisplacement of mean plane due to interactionsmSection 2, Equation (2)
EElastic modulus of joint surface materialPaSection 2, Equation (2)
νPoisson’s ratioTable 1
HMaterial hardnessPaImplicit (Section 1)
KNormal stiffness of joint surfaceN/mSection 2, Equation (8)
Kx, Ky, KzTangential stiffness componentsN/mSection 4, Figure 10
CDamping coefficientN·s/mSection 3
Cx, Cy, CzTangential damping componentsN·s/mSection 4, Figure 10
ηDamping loss factor (η = Wd/Weη = Wd/We)Implicit (Section 1)
zAsperity peak height from mean plane (pre-contact)mSection 2, Figure 2
dMean plane to rigid plane distance (pre-contact)mSection 2, Figure 2
dnMean plane to rigid plane distance (post-contact)mSection 2, Figure 2
FContact load on micro-asperityNSection 2, Equation (4)
FcGrinding force amplitudeNSection 4
Fx, Fy, FzGrinding force componentsNSection 4
tTimesSection 4

References

  1. Yao, K.; Chen, D.; Pan, C.; Lin, C.L. The development trends of computer numerical control (CNC) machine tool technology. Mathematics 2024, 12, 1923. [Google Scholar] [CrossRef]
  2. Tomassi, A.; Falegnami, A.; Romano, E. Unveiling simplexity: A new paradigm for understanding complex adaptive systems and driving technological innovation. Innovation 2025, 6, 100954. [Google Scholar] [CrossRef]
  3. Zhang, W.; Zhang, X.; Zhao, W. Research on the multi-physical coupling characteristics of the machine tool and milling process based on the systematically integrated model. J. Manuf. Process. 2023, 105, 46–69. [Google Scholar] [CrossRef]
  4. Cheng, Q.; Qi, B.; Liu, Z.; Zhang, G.; Zhang, C.; Chen, H. A Detachable Design Method of Large-sized Structure for Heavy Duty Machine Tool Based on Joint Surface Dynamics Characteristic Analysis. Proc. Inst. Mech. Eng. Part C J. Mech. Eng. Sci. 2019, 233, 4476–4489. [Google Scholar] [CrossRef]
  5. Zha, Y.; Zhang, J.; Yu, D.; Feng, P.; Lin, Z. Modeling Method for Bolted Joint Interfaces Based on Transversely Isotropic Virtual Materials. In Proceedings of the IEEE/ASME International Conference on Advanced Intelligent Mechatronics (AIM), Auckland, New Zealand, 9–12 July 2018; pp. 1118–1123. [Google Scholar]
  6. Yin, Q.; Dong, G.H.; Yin, G.F.; Heng, L.; Wang, L. Research on modeling and identification of machine tool joint dynamic characteristics. J. Adv. Mech. Des. Syst. Manuf. 2019, 13, JAMDSM0023. [Google Scholar] [CrossRef]
  7. Xiao, H.F.; Sun, Y.Y. On the normal contact stiffness and contact resonance frequency of rough surface contact based on asperity micro-contact statistical models. Eur. J. Mech. A Solids 2019, 75, 450–460. [Google Scholar] [CrossRef]
  8. Miao, H.H.; Wang, C.Y.; Li, C.Y.; Song, W.; Zhang, X.; Xu, M. Nonlinear dynamic modeling and vibration analysis of whole machine tool. Int. J. Mech. Sci. 2023, 245, 108122. [Google Scholar] [CrossRef]
  9. Ahmadian, H.; Mottershead, J.E.; James, S.; Friswell, M.I.; Reece, C.A. Modelling and updating of large surface-to-surface joints in the AWE-MACE structure. Mech. Syst. Signal Process. 2006, 20, 868–880. [Google Scholar] [CrossRef]
  10. Dreher, T.; Brake, M.R.W.; Seeger, B.; Krack, M. In situ, real-time measurements of contact pressure internal to jointed interfaces during dynamic excitation of an assembled structure. Mech. Syst. Signal Process. 2021, 160, 107859. [Google Scholar] [CrossRef]
  11. Parl, K.S.; Paynter, R.J.; Nowell, D. Linear relationship of normal and tangential contact stiffness with load. Proc. R. Soc. A Math. Phys. Eng. Sci. 2020, 476, 20200329. [Google Scholar] [CrossRef]
  12. Luo, W.; Lu, B.; Chen, F.; Song, Y. FRF prediction modeling and joint parameter identification of motorized spindle-tool handle. J. Braz. Soc. Mech. Sci. Eng. 2022, 44, 303. [Google Scholar] [CrossRef]
  13. Li, Y.; Zhang, G.; Lv, Z.; Chen, K. Tangential stiffness model of the joint surface considering contact angles between asperities based on fractal theory. Appl. Math. Model. 2025, 144, 116088. [Google Scholar] [CrossRef]
  14. Zhang, Q.; Liu, Q.A.; Mo, J.; Xiang, Z.; Wang, Q.; Zhai, C.; Zhu, S. Analysis of contact characteristics and dynamic response of joint interface with surface micro-grooved texture based on fractal theory. Mech. Syst. Signal Process. 2024, 218, 111553. [Google Scholar] [CrossRef]
  15. Sun, W.; Lan, G.; Zhang, X. Modeling of normal stiffness of mechanical joint based on anisotropic fractal theory. J. Mech. Sci. Technol. 2023, 37, 4193–4205. [Google Scholar] [CrossRef]
  16. Johnson, K.L. Contact Mechanics; Cambridge University Press: Cambridge, UK, 1985; pp. 1–15. [Google Scholar]
  17. Matthews, J.R. Indentation Hardness and Hot Pressing. Acta Metall. 1980, 28, 311–318. [Google Scholar] [CrossRef]
  18. Abbott, E.J.; Firestone, F.A. Specifying Surface Quality A Method Based on Accurate Measurement and Comparison. Mech. Eng. 1933, 55, 569–572. [Google Scholar]
  19. Kogut, L.; Etsion, I. A Finite Element Based Elastic-Plastic Model for the Contact of Rough Surfaces. Tribol. Trans. 2003, 46, 383–390. [Google Scholar] [CrossRef]
  20. Zirngibl, C.; Schleich, B.; Wartzack, S. Approach for the automated and data-based design of mechanical joints. Proc. Des. Soc. 2021, 1, 521–530. [Google Scholar] [CrossRef]
  21. Jamia, N.; Jalali, H.; Taghipour, J.; Friswell, M.I.; Khodaparast, H.H. An Equivalent Model of a Nonlinear Bolted Flange Joint. Mech. Syst. Signal Process. 2021, 153, 107507. [Google Scholar] [CrossRef]
  22. Liu, Z.; Jiang, K.; Zhang, C.; Zhao, Y.; Tian, Y. A Stiffness Model of a Joint Surface with Inclination Based on Fractal Theory. Precis. Eng. 2020, 62, 47–61. [Google Scholar] [CrossRef]
  23. Yin, D.; Zhang, X.; Chen, Y.; Lan, G.; Wang, Y.; Wen, S. Statistical Model of Normal Contact Stiffness of Fixed Joint Surface During Unloading after First Loading. Adv. Mater. Sci. Eng. 2021, 2021, 6626727. [Google Scholar] [CrossRef]
  24. Zhu, L.; Chen, J.; Zhang, Z.; Hong, J. Normal Contact Stiffness Model Considering 3D Surface Topography and Actual Contact Status. Mech. Sci. 2021, 12, 41–50. [Google Scholar] [CrossRef]
  25. Liu, K.; Liu, J.; Wang, L.; Zhao, Y.; Li, F. A Modified Model for Identifying the Characteristic Parameters of Machine Joint Interfaces. Appl. Sci. 2023, 13, 11680. [Google Scholar] [CrossRef]
  26. Arora, V. Structural Damping Identification Method Using Normal FRFs. Int. J. Solids Struct. 2014, 51, 133–143. [Google Scholar] [CrossRef]
  27. Kartal, M.E.; Mulvihill, D.M.; Nowell, D.; Hills, D.A. Determination of the Frictional Properties of Titanium and Nickel Alloys Using the Digital Image Correlation Method. Exp. Mech. 2011, 51, 359–371. [Google Scholar] [CrossRef]
  28. Mulvihill, D.M.; Brunskill, H.; Kartal, M.E.; Dwyer-Joyce, R.S.; Nowell, D. A Comparison of Contact Stiffness Measurements Obtained by the Digital Image Correlation and Ultrasound Techniques. Exp. Mech. 2013, 53, 1245–1263. [Google Scholar] [CrossRef]
  29. An, Q.; Wang, W.; Huang, M.; Suo, S.; Liu, Y.; Wang, S. A Novel Contact Resistance Model for the Spherical–Planar Joint Interface Based on Three Dimensional Fractal Theory. Fractal Fract. 2024, 8, 503. [Google Scholar] [CrossRef]
  30. Zhang, C.X.; Li, X.; He, J.L.; Cheng, Y.; Liu, Z.; Li, Y. Static friction coefficient model of joint surface based on the modified fractal model and experimental investigation. Int. J. Adv. Manuf. Technol. 2023, 124, 4415–4429. [Google Scholar] [CrossRef]
Figure 1. The modeling processing of characteristic parameters.
Applsci 15 09040 g001
Figure 2. Schematic diagram of the micro-asperity interaction model.
Applsci 15 09040 g002
Figure 3. Variation in stiffness with key parameters across different models.
Applsci 15 09040 g003
Figure 4. Experimental system for characterizing a marble plate joint interface.
Applsci 15 09040 g004
Figure 5. Measurement map of the surface topography of the plate.
Applsci 15 09040 g005
Figure 6. Surface profile curves at different locations of the joint interface.
Applsci 15 09040 g006
Figure 7. Structure functions of the joint interface.
Applsci 15 09040 g007
Figure 8. Two-dimensional fractal parameters.
Applsci 15 09040 g008
Figure 9. Comparison of relative errors in stiffness and damping between different models.
Applsci 15 09040 g009
Figure 10. Identification of characteristic parameters for primary joint surfaces in machine tools.
Applsci 15 09040 g010
Figure 11. Modal analysis of machine tool.
Applsci 15 09040 g011
Figure 12. Transient response of grinding wheel.
Applsci 15 09040 g012aApplsci 15 09040 g012b
Table 1. Parameters of the various structural materials of the grinding machine.
StructuralMaterialDensity (kg/m3)Elastic Modulus/GPaPoisson’s Ratio
Spindle, grinding wheel, slide tableStructural steel78502000.3
Bed, column, crossbeamMarble2600550.25
Disclaimer/Publisher’s Note: The statements, opinions and data contained in all publications are solely those of the individual author(s) and contributor(s) and not of MDPI and/or the editor(s). MDPI and/or the editor(s) disclaim responsibility for any injury to people or property resulting from any ideas, methods, instructions or products referred to in the content.