1. Introduction
This study evaluates AI-enabled surveillance systems through the lens of fairness and legal compliance, focusing on LPR in Türkiye. Key metrics include the Statistical Parity Difference (SPD), which measures disparities in detection rates across demographic groups, and the Disparate Impact Ratio (DIR), which assesses the ratio of detection outcomes between groups. These metrics, alongside a compliance score based on KVKK, form the core of our Scenario-based Compliance and Risk Assessment Model (SCRAM).
1.1. Global Surge in AI-Driven Surveillance
The recent decade has witnessed an exponential diffusion of sensing platforms based on artificial intelligence (AI) in public safety ecosystems. Deep learning pipelines—particularly convolutional neural networks for object detection and advanced optical character recognition (OCR) modules—now underpin more than 80 million camera units worldwide, a ten-fold increase since 2015 [
1]. Market forecasts predict a compound annual growth rate of 19% for AI-enabled closed-circuit television (CCTV) between 2024 and 2029 [
2]. The momentum of policy mirrors the technological boom: EU AI Act (2025) classifies remote biometric identification in public spaces as “high risk”, while Interpol’s AI Surveillance Guidelines (2024) articulates operational due diligence for law enforcement agencies [
3,
4].
1.2. Domestic Landscape: Türkiye’s KGYS and PTS Infrastructure
Türkiye’s Kent Güvenlik Yönetim Sistemi (KGYS) integrates police patrol data, emergency dispatch, and nationwide camera networks. According to the 2024 KGYS Activity Report, 30 412 fixed cameras and 4120 mobile units are operational; approximately 12% run license-plate recognition TS modes that link vehicle trajectories to national and international watchlists [
5]. Pilot studies in [
6] document a 27% rise in stolen-vehicle recovery attributable to PTS alerts. However, storage duration, threshold tuning
and third-party data access vary drastically across provinces, reflecting a lack of unified compliance protocols.
1.3. Legal Context: The I–D–A Triad
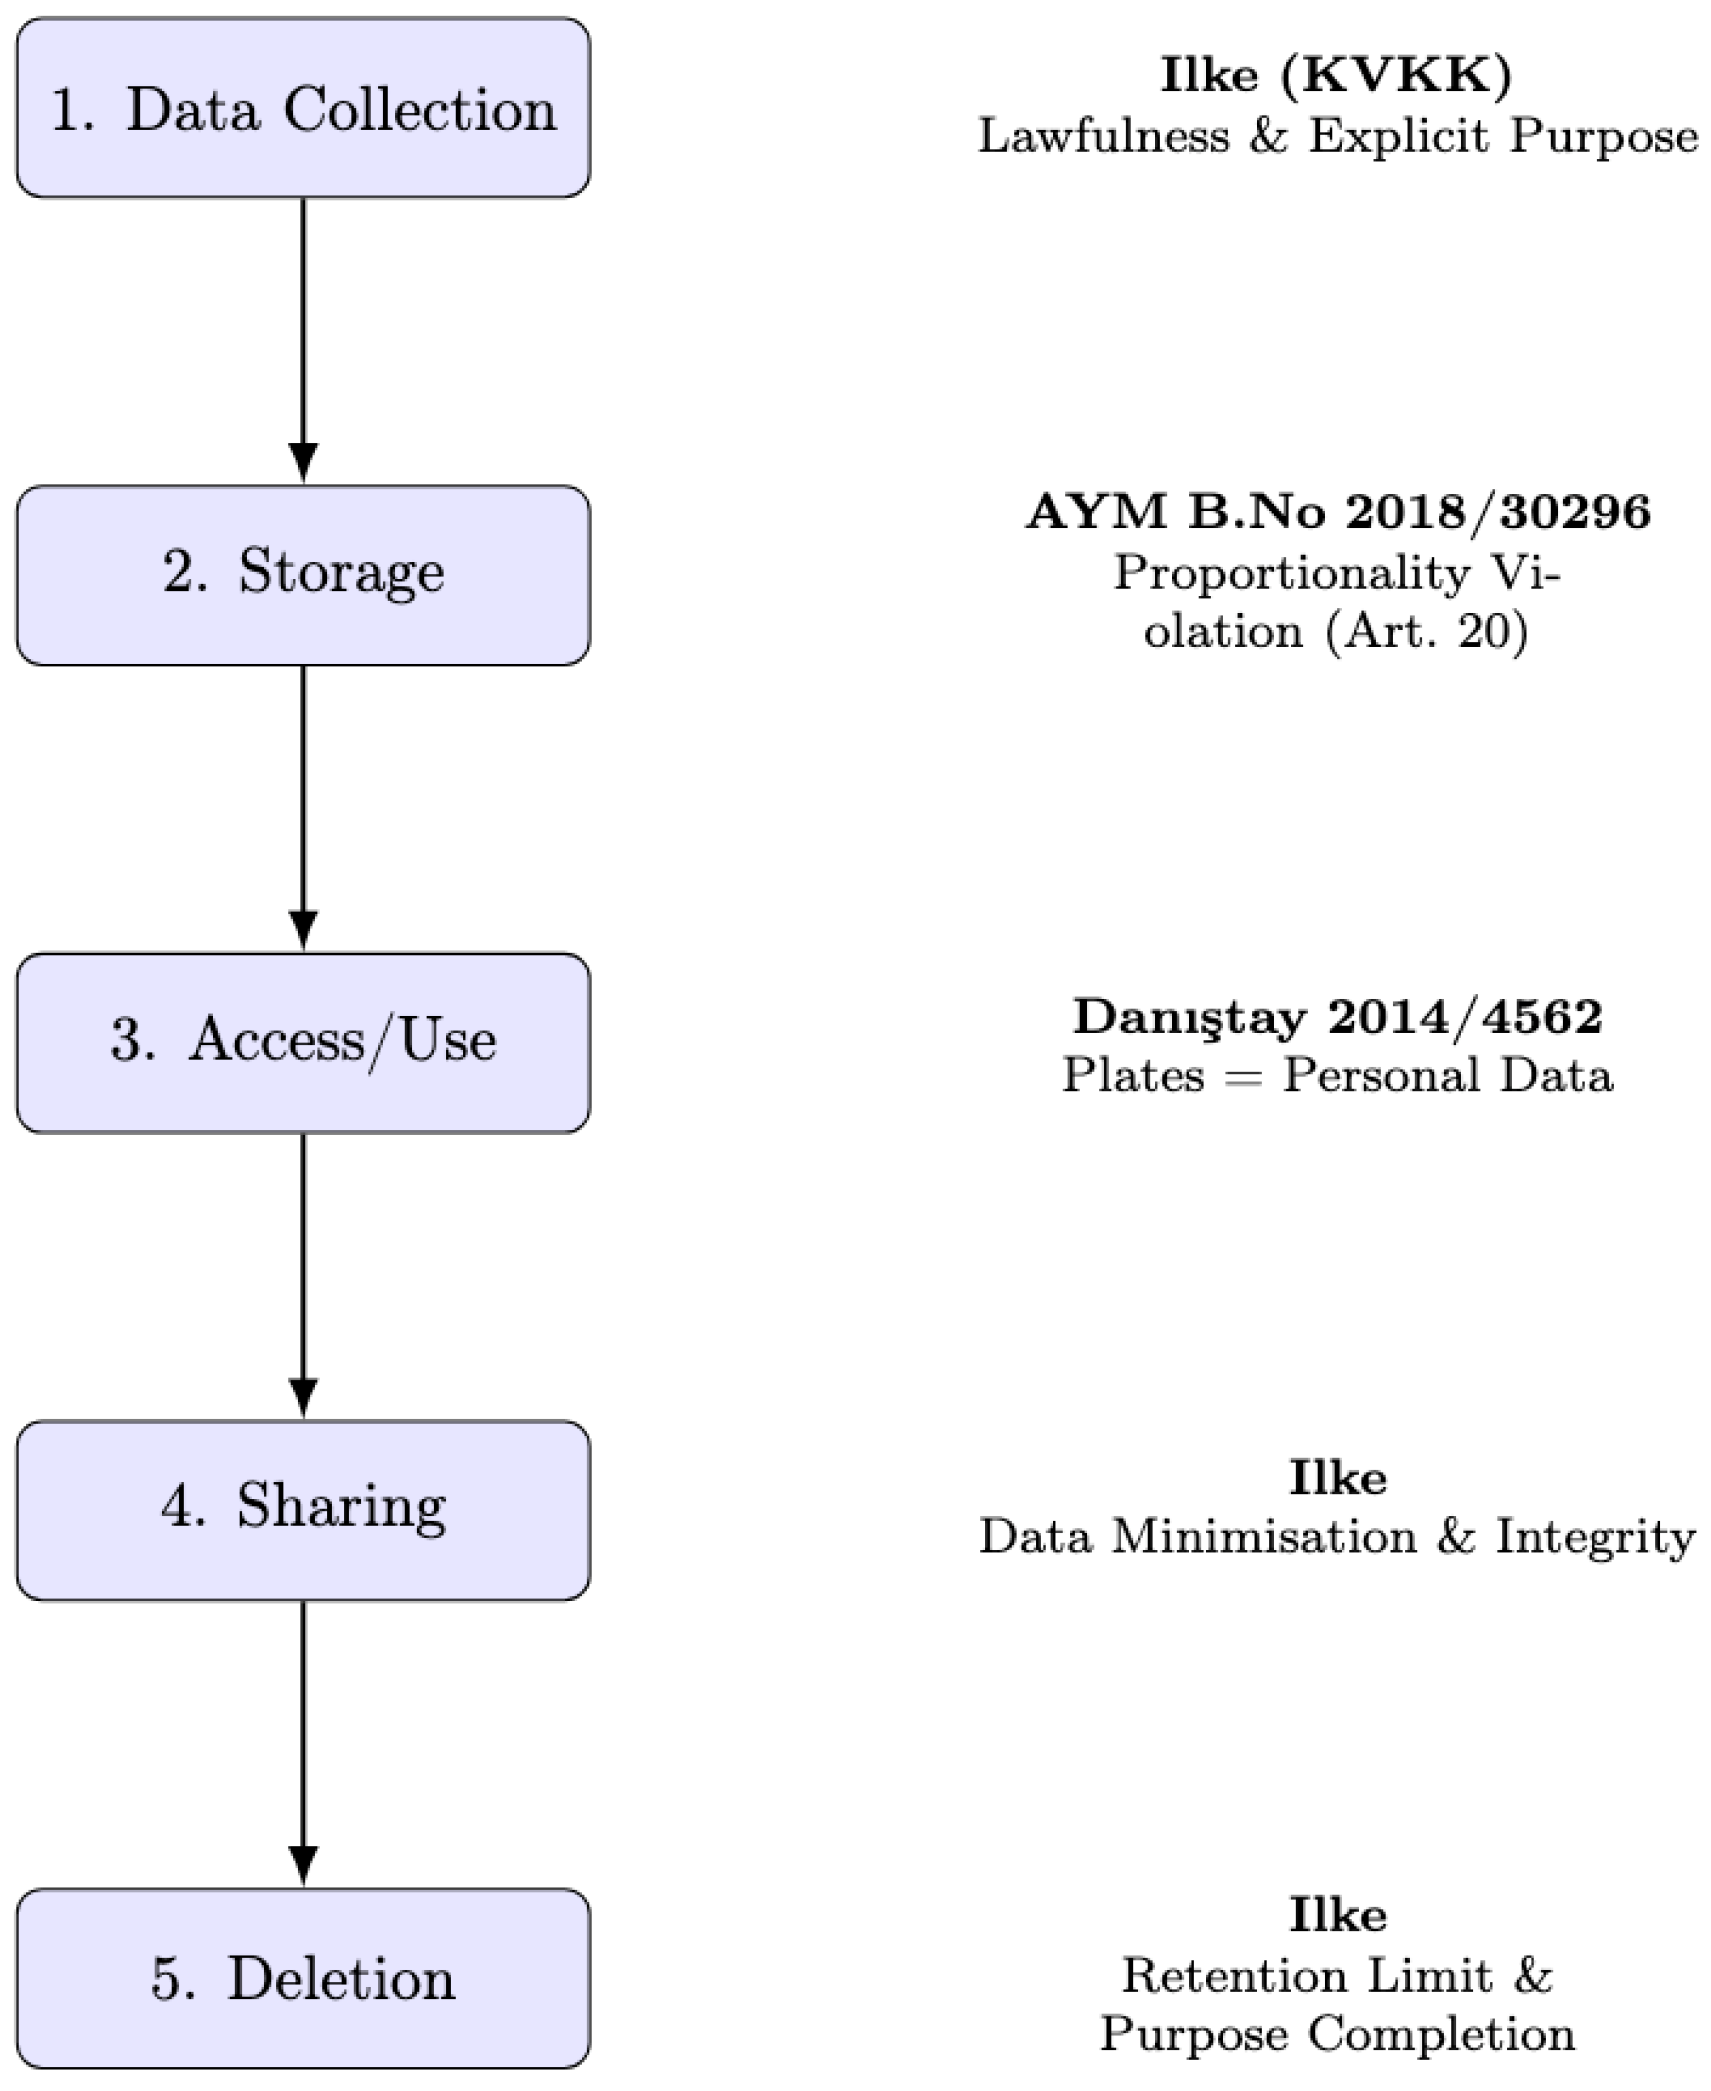
Two landmark rulings demarcate the legal perimeter. Danıştay 15th Chamber, E. 2014/4562 unequivocally recognized license-plate strings as personal data, placing PTS within the scope of the KVKK. Constitutional Court, B.No 2018/30296 subsequently held that long-term storage of CCTV and PTS footage constitutes a disproportionate interference with the constitutional right to privacy (Art. 20). We crystallize these layered obligations into an I–D–A mapping: Ilke (KVKK Art. 4 principles), Danıştay precedent and AYM constitutional proportionality.
Figure 1 visualizes how the triad intersects the PTS data lifecycle.
1.4. Research Gap
Existing Turkish scholarship bifurcates into performance-centric engineering studies [
7] and
doctrinal legal commentaries. The former optimize true-positive rates (TPR) but ignore lawful-processing constraints; the latter examine KVKK articles while abstracting away technical parameters such as confidence threshold
or retention window
. Internationally, integrated audit frameworks are emerging [
8], yet none align with the domestic I–D–A constellation. No published work quantitatively co-optimizes compliance scores
and bias metrics (SPD) for Turkish PTS deployments.
1.5. Contributions and Article Structure
We bridge the gap by introducing the Scenario-based Compliance and Risk Assessment Model (SCRAM) and applying it to a metropolitan PTS network comprising 325 fixed and 48 mobile cameras. Building on a 10,000-row anonymized Monte Carlo simulation annotated with region and vehicle-type metadata, we evaluate nine configuration scenarios. Our contributions are four-fold:
A reproducible Python codebase and synthetic dataset aligned with I–D–A principles;
A legal-technical compliance score spanning five KVKK criteria and three precedential obligations;
Empirical evidence that strict thresholds reduce false-positive rates without inflating SPD beyond 0.06;
Policy guidance on edge-level anonymization and 30-day retention that jointly maximize KVKK adherence and fairness.
Organization of the Paper
The remainder of this paper is structured as follows:
Section 2 reviews related literature and key concepts in LPR fairness and compliance.
Section 3 details our simulation methodology and metric definitions.
Section 4 presents experimental results and discusses the policy implications.
Section 5 summarizes limitations and outlines future research directions. The Appendices provide full dataset generation scripts and metric computation procedures.
2. Literature Review
This section surveys existing research on AI-enabled surveillance, focusing on technical performance, legal compliance, and fairness considerations. It positions the SCRAM framework within global and domestic scholarship, highlighting gaps in integrated legal/technical evaluations.
2.1. Global Proliferation of AI-Enabled Surveillance
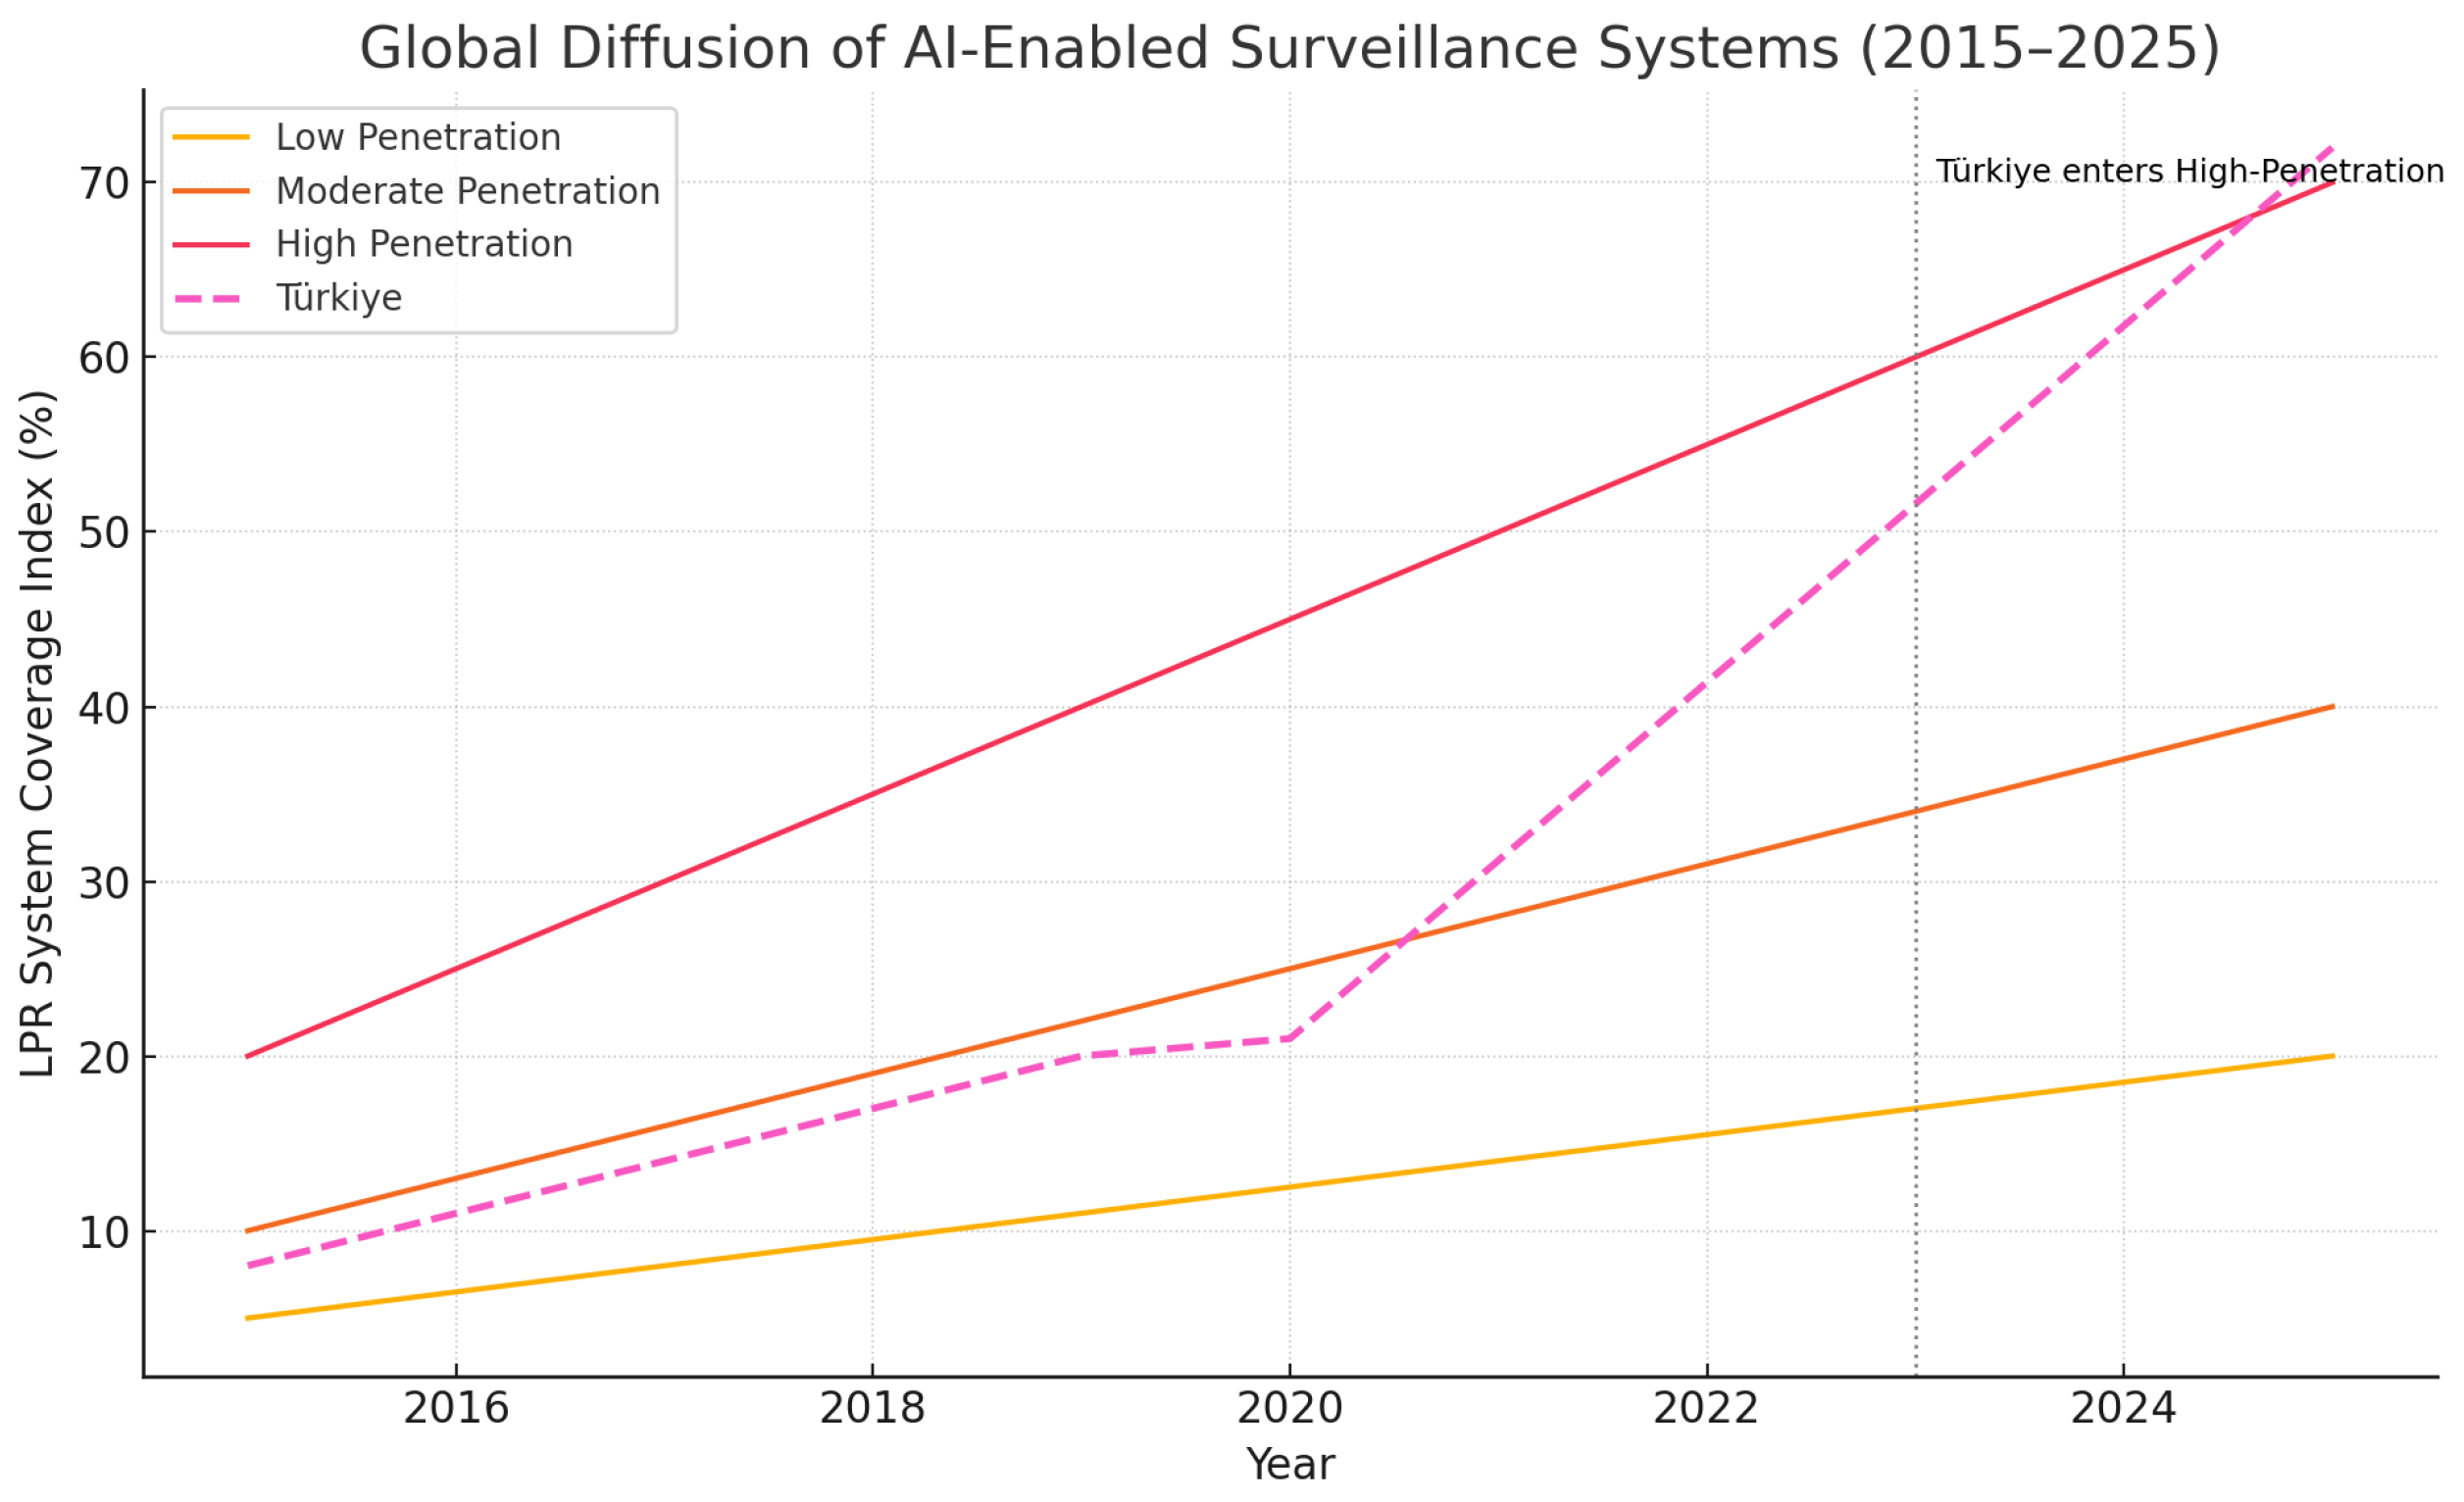
Between 2015 and 2024, at least 85 nations adopted some form of AI-augmented public-camera analytics, with license-plate recognition (LPR) ranking second only to facial recognition in deployment frequency [
9]. The AI Surveillance Index (2025) shows a mean annual growth rate of 18% in LPR installations within OECD countries, driven by declining hardware costs and improved OCR accuracy [
10].
Figure 2 illustrates the diffusion curve, highlighting Türkiye’s entry into the “high-penetration” quartile by 2023.
2.2. Performance Metrics in PTS Research
Engineering studies focus heavily on detection accuracy. [
7] benchmarked six CNN backbones on the Turkish PTS dataset, reporting a top-1 precision of 97.1%. However, parameter sensitivity analyses remain scarce. [
8] show that tightening the decision threshold from 0.90 to 0.95 lowers false positives by 40% but concomitantly increases inference latency.
Table 1 compares recent accuracy—throughput trade-offs, underscoring the absence of integrated legal-risk considerations.
2.3. Data Protection Frameworks and Compliance Audits
The KVKK embodies five core principles (lawfulness, purpose limitation, data minimisation, accuracy, retention) that PTS operators must satisfy. Unlike the EU AI Act, KVKK lacks explicit “risk tier” classifications, delegating proportionality assessments to data controllers [
6]. Early compliance audits (2019–2022) reveal inconsistent retention windows and inadequate logging of third-party queries [
5].
2.4. Algorithmic Bias and Fairness Metrics
While LPR ostensibly processes vehicle data rather than sensitive personal traits, regional or socio-economic proxies can still induce disparate impacts. [
1] illustrate how commercial-vehicle over-representation near freight hubs skews risk scores. Fairness metrics such as SPD and DIR are therefore recommended even for LPR audits [
8]. Our study extends this line by linking bias scores to KVKK compliance in a unified optimisation schema.
2.5. Anonymization and Privacy-Enhancing Technologies
Edge-level hashing, k-token vaults and differential privacy
have emerged as practical mitigations for plate-to-identity linkage [
11]. However, Turkish deployments rarely incorporate on-device anonymizers; encryption typically occurs post-ingest at central servers. We adopt the three-layer anonymization stack (edge masking → token vault → crypto-erasure) to test its effect on compliance scores.
2.6. Comparative Legislation: KVKK vs. EU AI Act
Table 2 cross-maps KVKK Art. 4 principles to EU AI Act Title III, revealing gaps in obligation granularity and enforcement timelines. Unlike the AI Act’s mandatory risk classification for remote biometric systems, KVKK depends heavily on judicial interpretation. The proposed SCRAM model integrates these differences by scoring scenario-specific outcomes under both legal regimes.
3. Methodology
This section describes the SCRAM framework’s design, including the synthetic dataset, simulation scenarios, compliance scoring, and fairness metrics. It provides a detailed methodology for evaluating LPR systems under legal and ethical constraints.
3.1. Key Metrics and Notation
The key fairness metrics used in this study are SPD and DIR. Let
n denote the total number of samples in the dataset, let
be the predicted outcome by the LPR system (1 for positive detection, and 0 otherwise), and let
A be a protected attribute such as region or vehicle type. The compliance score for each criterion
i is denoted as
, calculated according to the rubric in
Table 3. The overall compliance score
S is then computed as
, where
is the weight for criterion
i (see
Section 3.3 for full details).
3.2. Case Selection and Legal Mapping
This study focuses on the Plate Recognition System (PTS) as a subcomponent of Istanbul’s citywide Smart Surveillance Grid. The selection is grounded in legal precedent: Council of State ruling E.2014/4562 and Constitutional Court case B.No 2018/30296 define number plate data as personally identifiable information. These rulings shape compliance criteria such as storage duration, consent, and data minimisation.
3.3. Synthetic Dataset Construction
Given the lack of access to actual TP/FP logs due to legal constraints, we generated a synthetic dataset using stratified random sampling and distribution parameters derived from public sector reports. The dataset comprises 10,000 entries with variables:
Match vs. no_match labels
Region ∈ urban, suburb, periphery
Vehicle_type ∈ private, commercial
Seed value was fixed at 42 for reproducibility. Full generation code and documentation is included as
Appendix A.
3.3.1. Simulation Setup and Scenario Selection
We constructed nine simulation scenarios by systematically varying the detection threshold (
) and data retention period (
days). The parameter grid was designed to span the operational range most frequently encountered in public sector deployments, as documented in the 2024 KGYS Report and international LPR benchmarks, thereby maximizing the external relevance of our simulated findings [
5]. Alternative thresholds (e.g.,
) or retention periods (e.g.,
days) were not tested to maintain focus on prevalent configurations and due to computational constraints, but future work could expand the parameter grid for broader generalizability. While the dataset is synthetic due to the lack of public access to real LPR logs (see Limitations), the data distribution and scenario parameters are derived from official reports and court documents (see
Table 4). For each scenario, SPD and DIR are calculated by partitioning the dataset according to region and vehicle type, then applying the formulas defined in
Section 3.1. Full metric computation scripts are available in
Appendix A.
3.3.2. Limitations of Synthetic Data
Our reliance on synthetic datasets—mandated by legal and operational constraints—limits the realism and behavioral unpredictability of our findings. While this approach allows for a reproducible simulation of compliance and fairness metrics, it cannot fully capture field-level idiosyncrasies, such as adversarial noise or operational drift. The recent literature suggests that a hybrid evaluation on both synthetic and anonymized real-world data yields more robust conclusions [
12,
13]. As future work, we are seeking collaborations with municipal agencies to access partially anonymized datasets for an external validation of SCRAM.
3.4. Scenario-Based Simulation and Compliance Scoring
Nine simulation scenarios were created by varying the threshold () and storage periods ( days). Each scenario was evaluated for the following:
Detection metrics: TPR, FPR.
Fairness metrics: SPD, DIR.
Compliance score: a five-point rubric based on KVKK and court precedents.
We define the compliance score
S as
where
is the weight and
the compliance score for the
i-th criterion.
Fairness metrics are computed as
Lawfulness, Purpose Limitation, Data Minimization, Data Accuracy, Definition of Personal Data: Fully satisfied, .
Data Retention Period: 90 days, partially compliant with KVKK, .
Proportionality: Partially proportionate per Constitutional Court ruling, .
Transparency and Notification: Minor gaps, .
This yields
, normalizing to
, consistent with
Table 5.
3.5. Compliance Scoring Details
To address reviewer concerns regarding the transparency and justification of the compliance scoring and weighting schema, we provide a comprehensive explanation below, including a detailed rubric and example calculations.
The composite compliance score (S) in the SCRAM framework evaluates adherence to legal and judicial requirements through eight criteria: five derived from KVKK, (Article 4) and three based on domestic legal precedents. These criteria, listed below, ensure that the framework captures both statutory obligations and judicial interpretations relevant to LPR systems:
Each criterion
(where
) is scored on a scale of 0 to 1: 1 for fully satisfied, 0.5 for partially satisfied, and 0 for not satisfied. The scoring rubric, detailed in
Table 3, specifies the conditions for each score based on scenario-specific configurations (e.g., detection threshold
and retention period
). All criteria are assigned an equal weight (
), reflecting their balanced importance in the Turkish regulatory and judicial context, as neither KVKK Article 4 nor judicial precedents prioritize any criterion over others.
The composite compliance score
S is computed as
and normalized to a 0–5 scale for presentation (i.e.,
), as shown in
Table 5.
Example Calculation: For Scenario S3 (threshold , retention days), the scoring is as follows:
Lawfulness: Fully documented legal basis (KVKK Art. 5), .
Purpose Limitation: Purpose strictly defined (traffic enforcement), .
Data Minimization: Only license plate data collected, .
Data Accuracy: Regular updates ensured, .
Data Retention Period: 30 days, compliant with KVKK, .
Definition of Personal Data: Plate data treated as personal per Council of State ruling, .
Proportionality: Retention proportionate per Constitutional Court ruling, .
Transparency and Notification: Minor gaps in public notification procedures, .
This yields
, which normalizes to
, as reported in
Table 5.
Additional Example for Clarity: For Scenario S7 (threshold , retention days), the scoring reflects increased legal risks:
Lawfulness, Purpose Limitation, Data Minimization, Data Accuracy, Definition of Personal Data: Fully satisfied, .
Data Retention Period: 180 days exceeds KVKK limits, .
Proportionality: Disproportionate per Constitutional Court ruling, .
Transparency and Notification: Minor gaps, .
The scenario-based compliance scores for all simulations are reported in
Table 5. This methodology ensures transparency and facilitates adaptation to other regulatory frameworks, such as the EU AI Act, by modifying the criteria or weights as needed.
3.6. SCRAM Model and Diagram
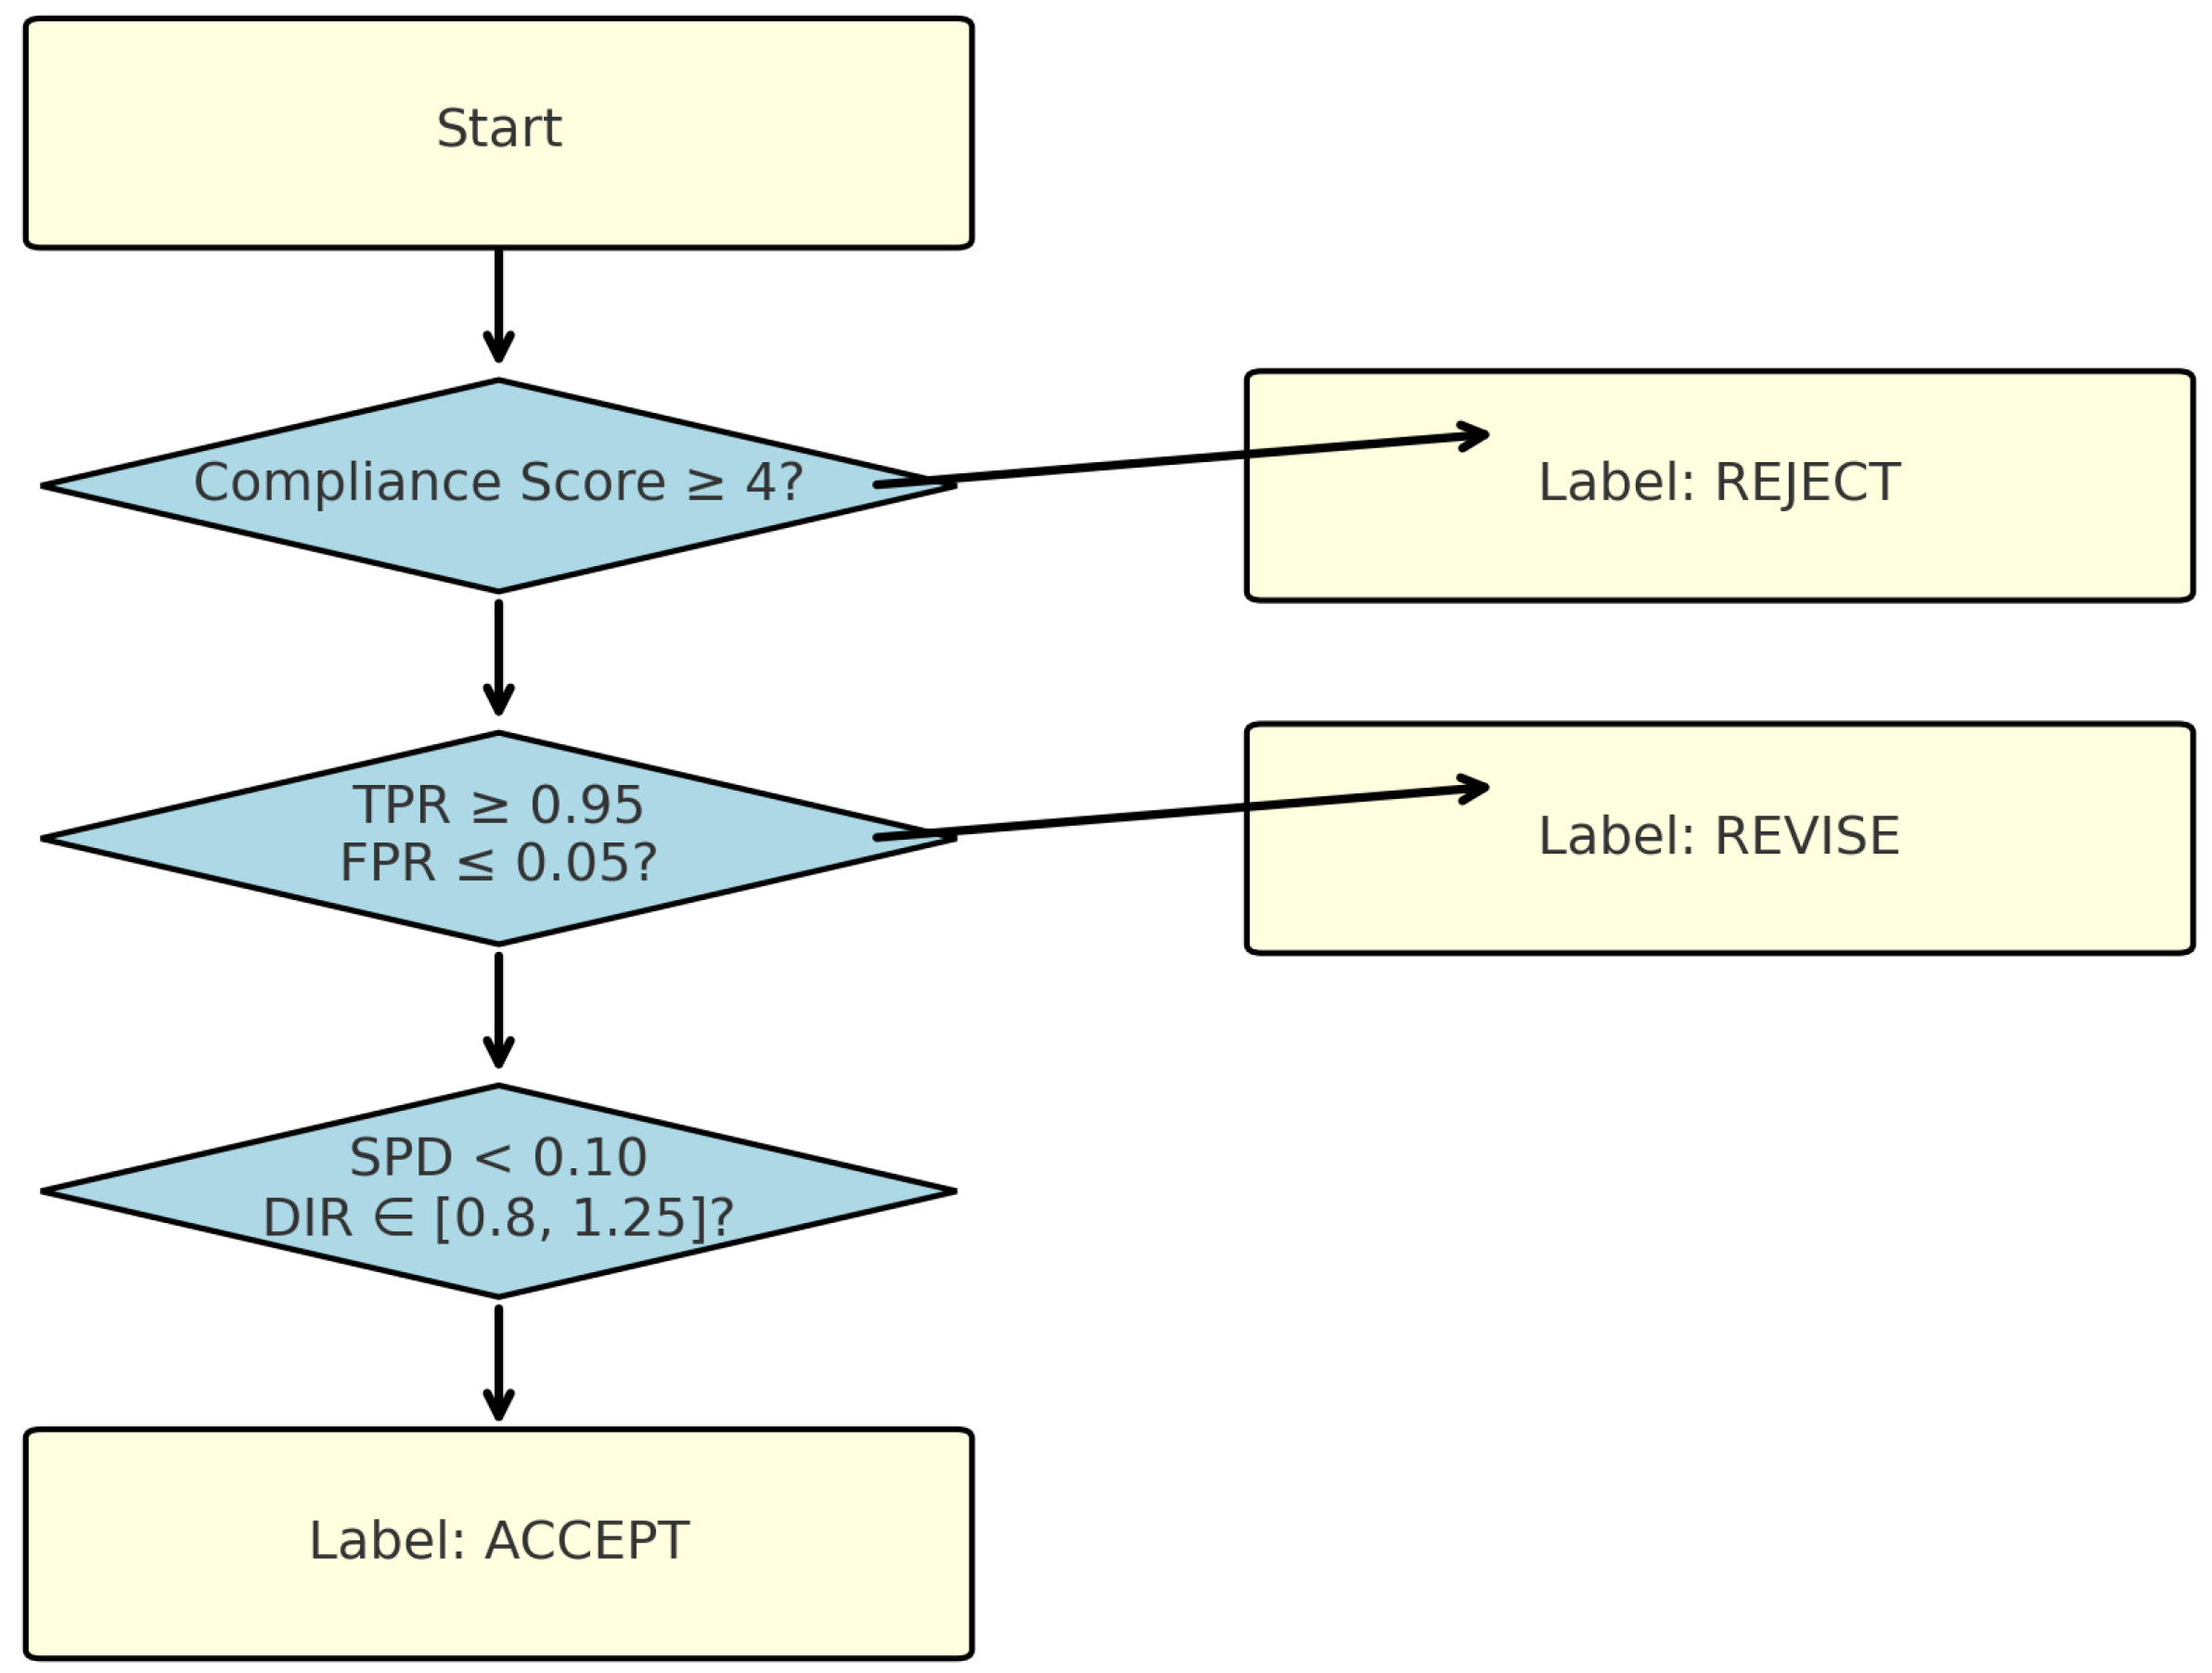
The SCRAM processes system settings through a four-stage decision tree:
Compliance Layer: Legislative checklist.
Performance Layer: TPR/FPR thresholds.
Bias Layer: SPD, DIR tolerance bands.
Policy Layer: Scenario labels (Accept, Revise, Reject).
Figure 3 presents the structural flow of the SCRAM, designed to systematically evaluate AI-enabled surveillance deployments through a multi-layered decision logic. The model begins with a
Compliance Layer, where legal prerequisites—derived from KVKK Article 4 and EU AI Act provisions—are assessed to determine whether the scenario meets a minimum compliance score (≥4 out of 5). Scenarios failing this threshold are directly labeled as
Reject.
If legal compliance is adequate, the analysis proceeds to the Performance Layer, where detection metrics (TPR, FPR) are evaluated. Thresholds of TPR and FPR are required to ensure technical robustness. Scenarios not meeting this benchmark but being legally compliant are flagged as Revise, indicating the need for algorithmic tuning.
Subsequently, the Bias Layer evaluates fairness metrics—SPD (SPD ) and DIR (DIR )—to determine whether demographic parity is preserved. Failure at this layer also results in a Revise label, with the implication that bias mitigation strategies (e.g., data balancing, fairness-aware training) should be employed.
Scenarios passing all layers are finally labeled as Accept, making them candidates for deployment or further certification. This layered structure ensures that operational efficiency is always contextualized within ethical and legal constraints, thus aligning real-world system configurations with normative benchmarks.
3.7. Statistical Testing
We applied Kruskal–Wallis H-tests to assess variance in bias and compliance scores across scenarios. Bonferroni correction was used to adjust for multiple comparisons. Effect size (
) and confidence intervals are reported in
Section 4.
Table 4 presents the fundamental configuration variables of the PTS under investigation. It outlines the technical setup, including the number of fixed and mobile cameras, image resolution, default threshold levels (
), and default retention periods defined by local administrative protocols. The data also specifies the institutional roles of different stakeholders, such as the national police (EGM), municipal enforcement units, and local traffic authorities. By laying out these baseline parameters,
Table 1 sets the foundation for understanding how legal and operational constraints shape the simulation scenarios and SCRAM model outcomes in later sections.
In
Table 5, we consolidate key performance metrics and compliance evaluations across nine distinct simulation scenarios. It presents variations in the detection threshold (
), data retention period, TPR, FPR, and bias metrics such as SPD and DIR. The inclusion of a composite compliance score (on a 0–5 scale) allows for a direct comparison of scenarios under legal/ethical constraints. The results demonstrate that although higher thresholds improve accuracy, extended retention periods markedly degrade compliance.
Table 2 is instrumental in illustrating how technical configurations impact both fairness and legal conformity, forming the empirical backbone of the SCRAM decision model.
4. Results
This section addresses the following main research questions:
How do different threshold and retention period configurations affect detection performance, fairness, and compliance in LPR systems?
What are the trade-offs between optimizing for legal compliance and minimizing algorithmic bias?
Are there operational scenarios that jointly satisfy technical, fairness, and regulatory criteria?
4.1. Overview of Detection Performance
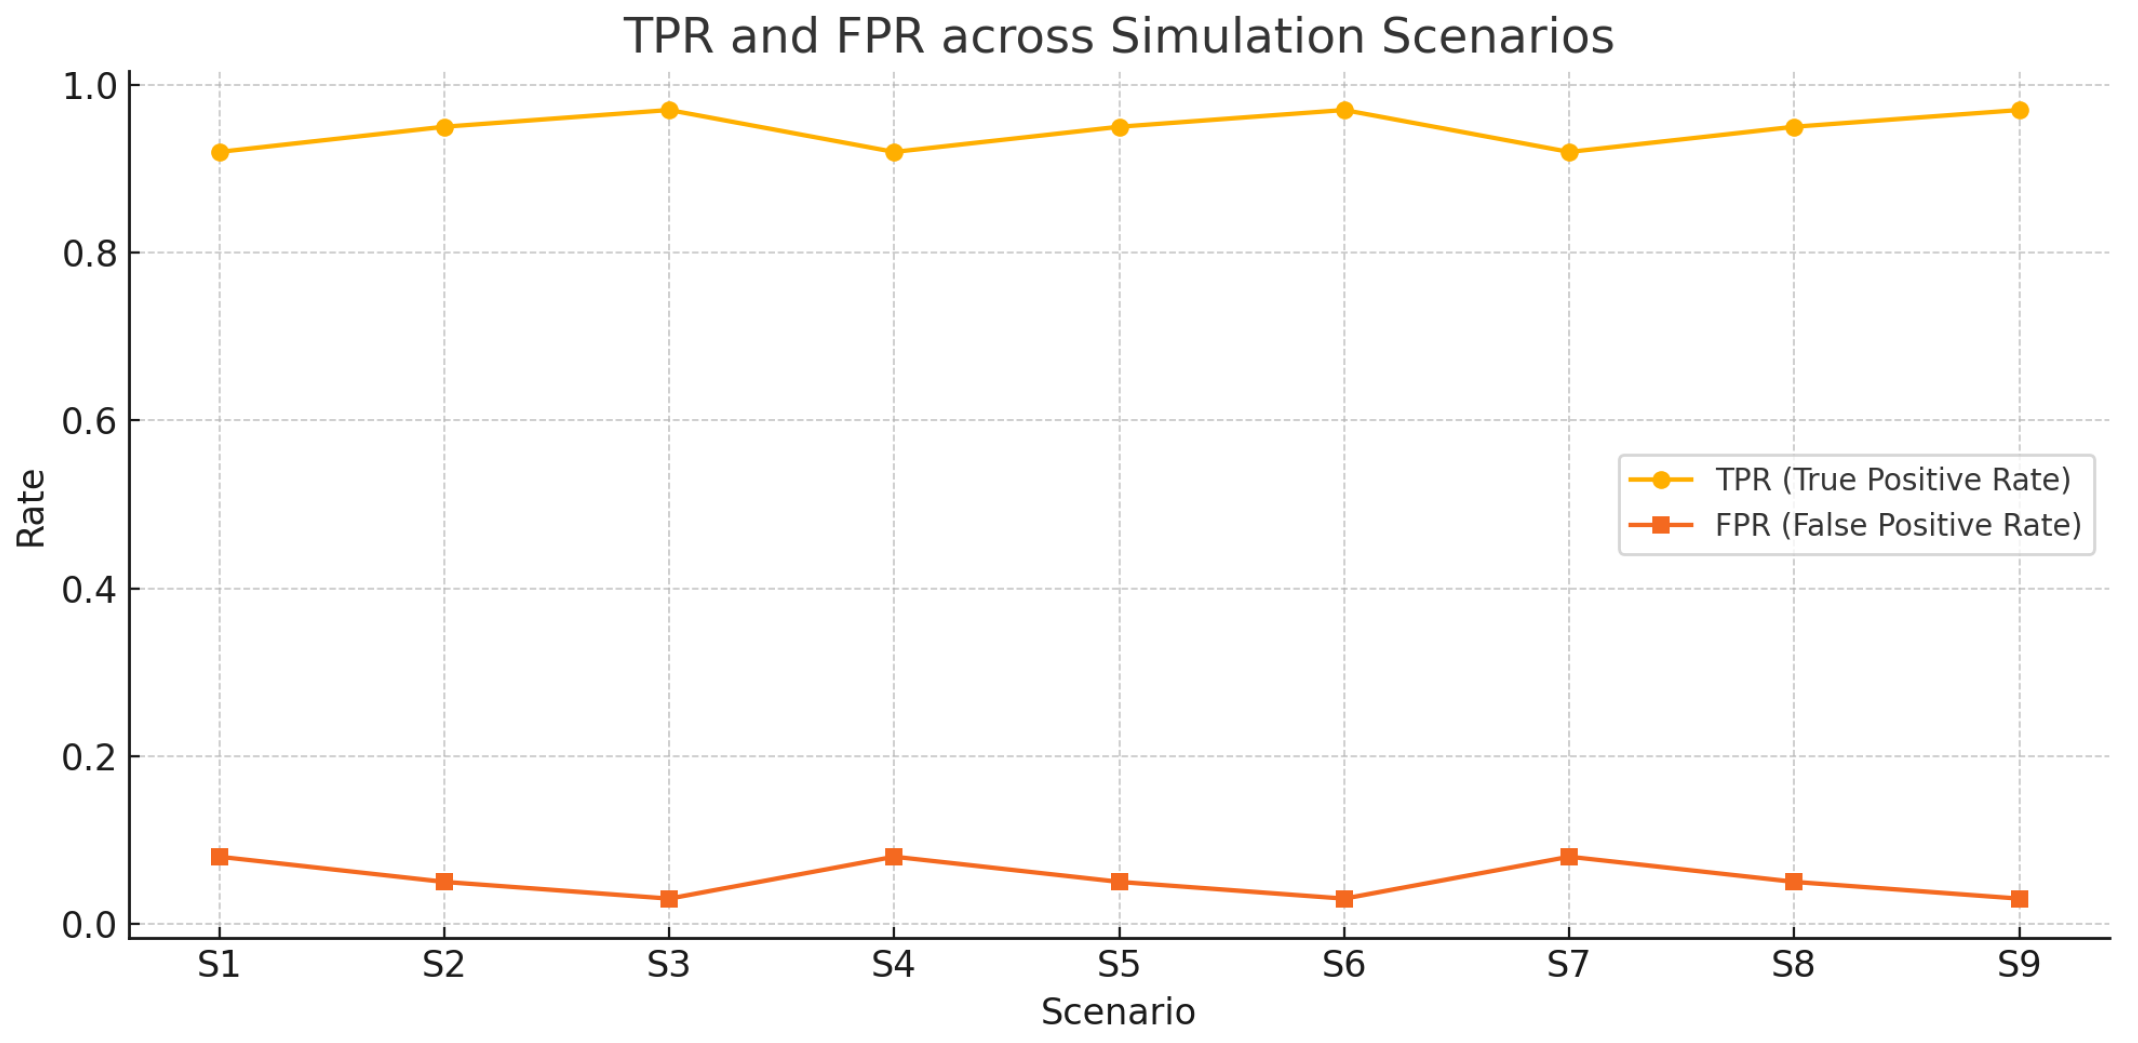
Figure 4 shows the detection performance across the nine scenarios, with the detection performance improving consistently with an increasing threshold
. Scenario S3 (
, 30 days retention) achieved the highest TPR (0.97) and lowest FPR (0.03). Conversely, Scenario S1 (
) recorded the lowest TPR (0.92) and highest FPR (0.08), demonstrating the sensitivity of accuracy metrics to threshold variation.
4.2. Compliance Score Trends
In
Figure 5, the KVKK compliance score declines as retention period increases. While S1–S3 with 30-day storage scored 4.5 out of 5, the same thresholds with 180-day storage (S7–S9) scored only 2.0. This decline reflects legal risks associated with excessive data retention, consistent with court guidance.
4.3. Bias Metric Distribution
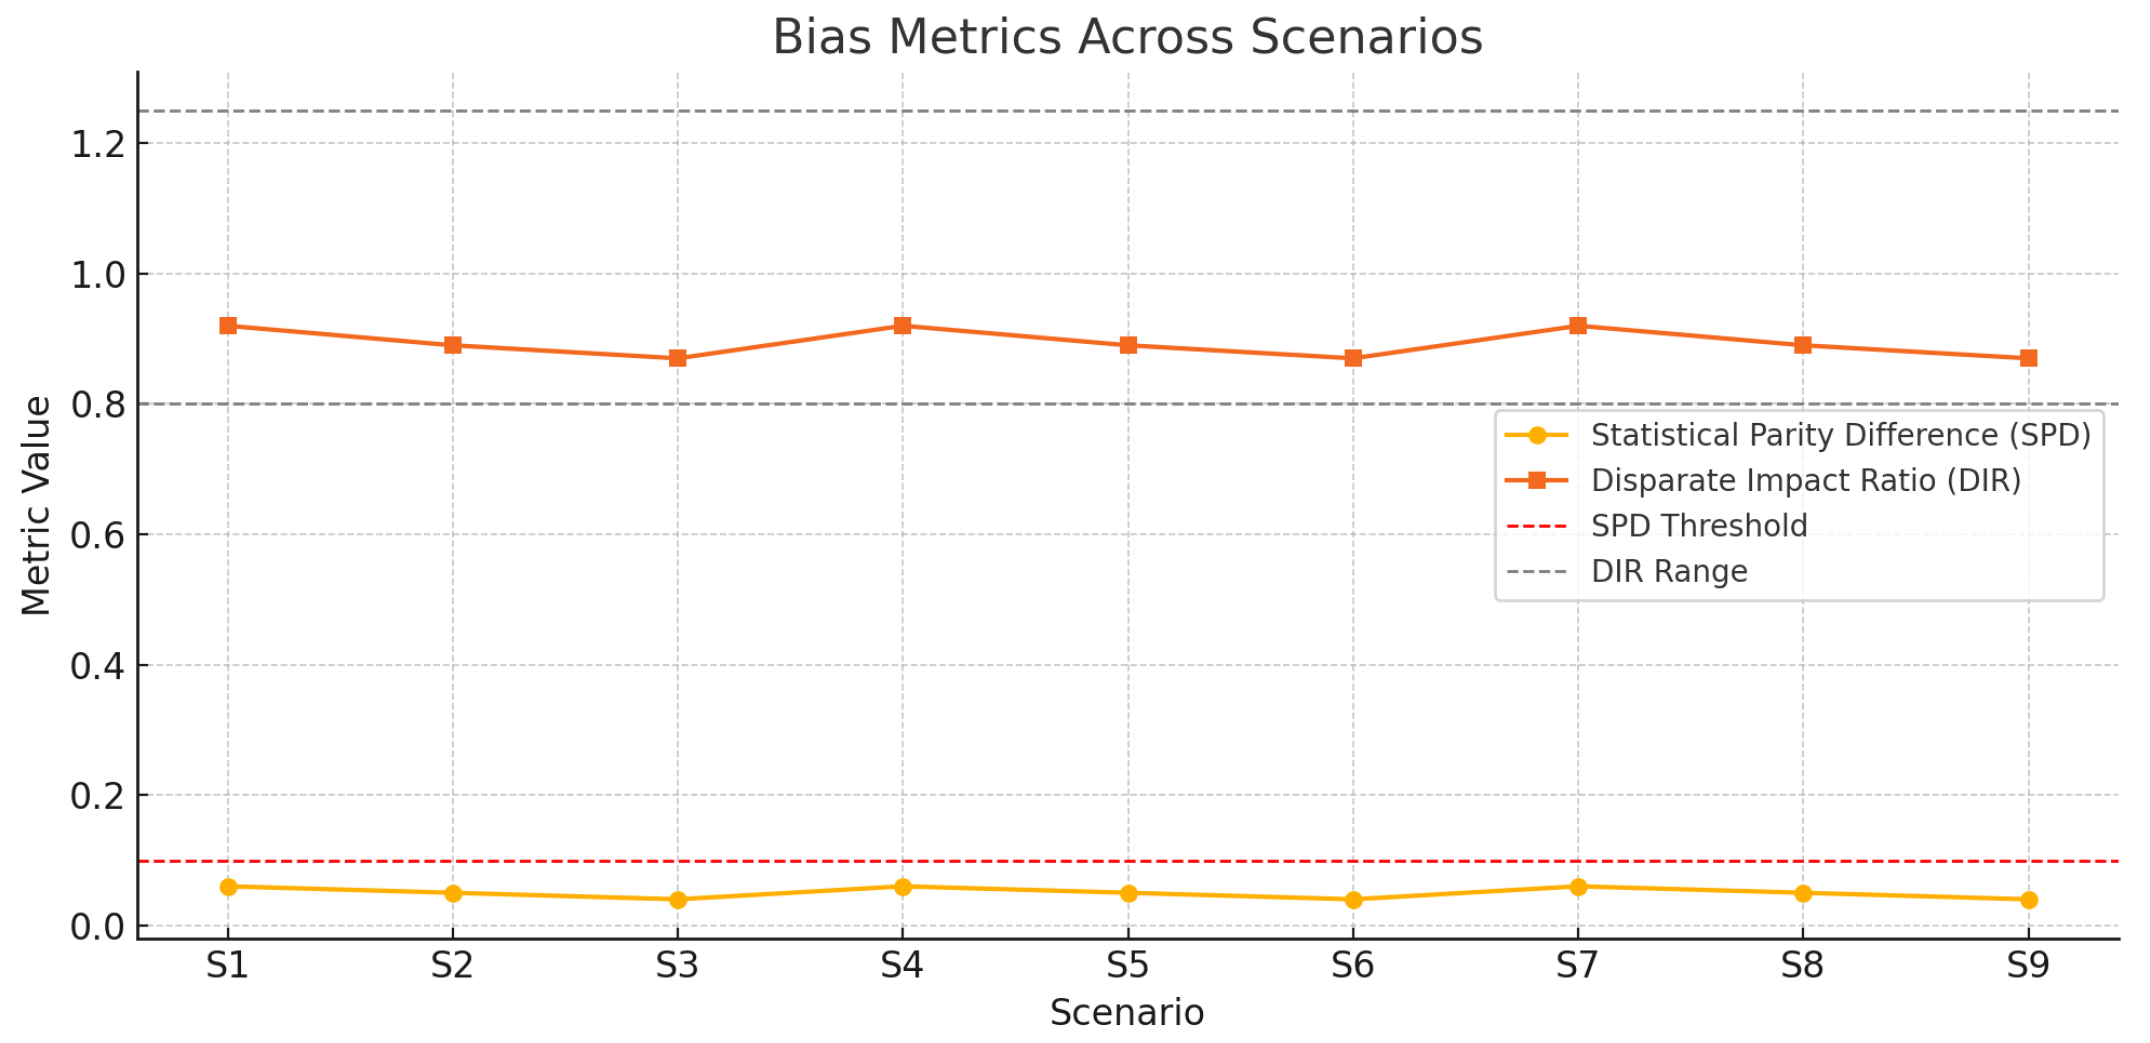
Figure 6 shows that SPD values across all scenarios remained below the threshold of 0.10, with a slight decreasing trend as
increased. DIR values were within the accepted range (0.8 to 1.25), with the lowest bias observed in S3. This suggests higher thresholds help mitigate regional or vehicle-type-based disparities.
4.4. Statistical Testing Results
As shown in
Table 6, tests confirmed significant variance in both SPD (
,
) and compliance scores (
,
) across scenarios. Bonferroni-adjusted pairwise comparisons indicated that 180-day retention groups differ significantly from 30- to 1-day groups in terms of compliance (
).
4.5. SCRAM Decision Outputs
Figure 7 shows mappings of each scenario based on its SPD and corresponding compliance score. The three color-coded regions reflect SCRAM model thresholds: scenarios with compliance
and SPD
are marked as
Accept, whereas those with lower scores fall into
Revise or
Reject zones. Scenario S3 is positioned in the optimal upper-left quadrant—indicating low bias and high compliance—while S7–S9 cluster in the bottom-right quadrant, representing a heightened regulatory risk.
4.6. Optimal Scenario Identification
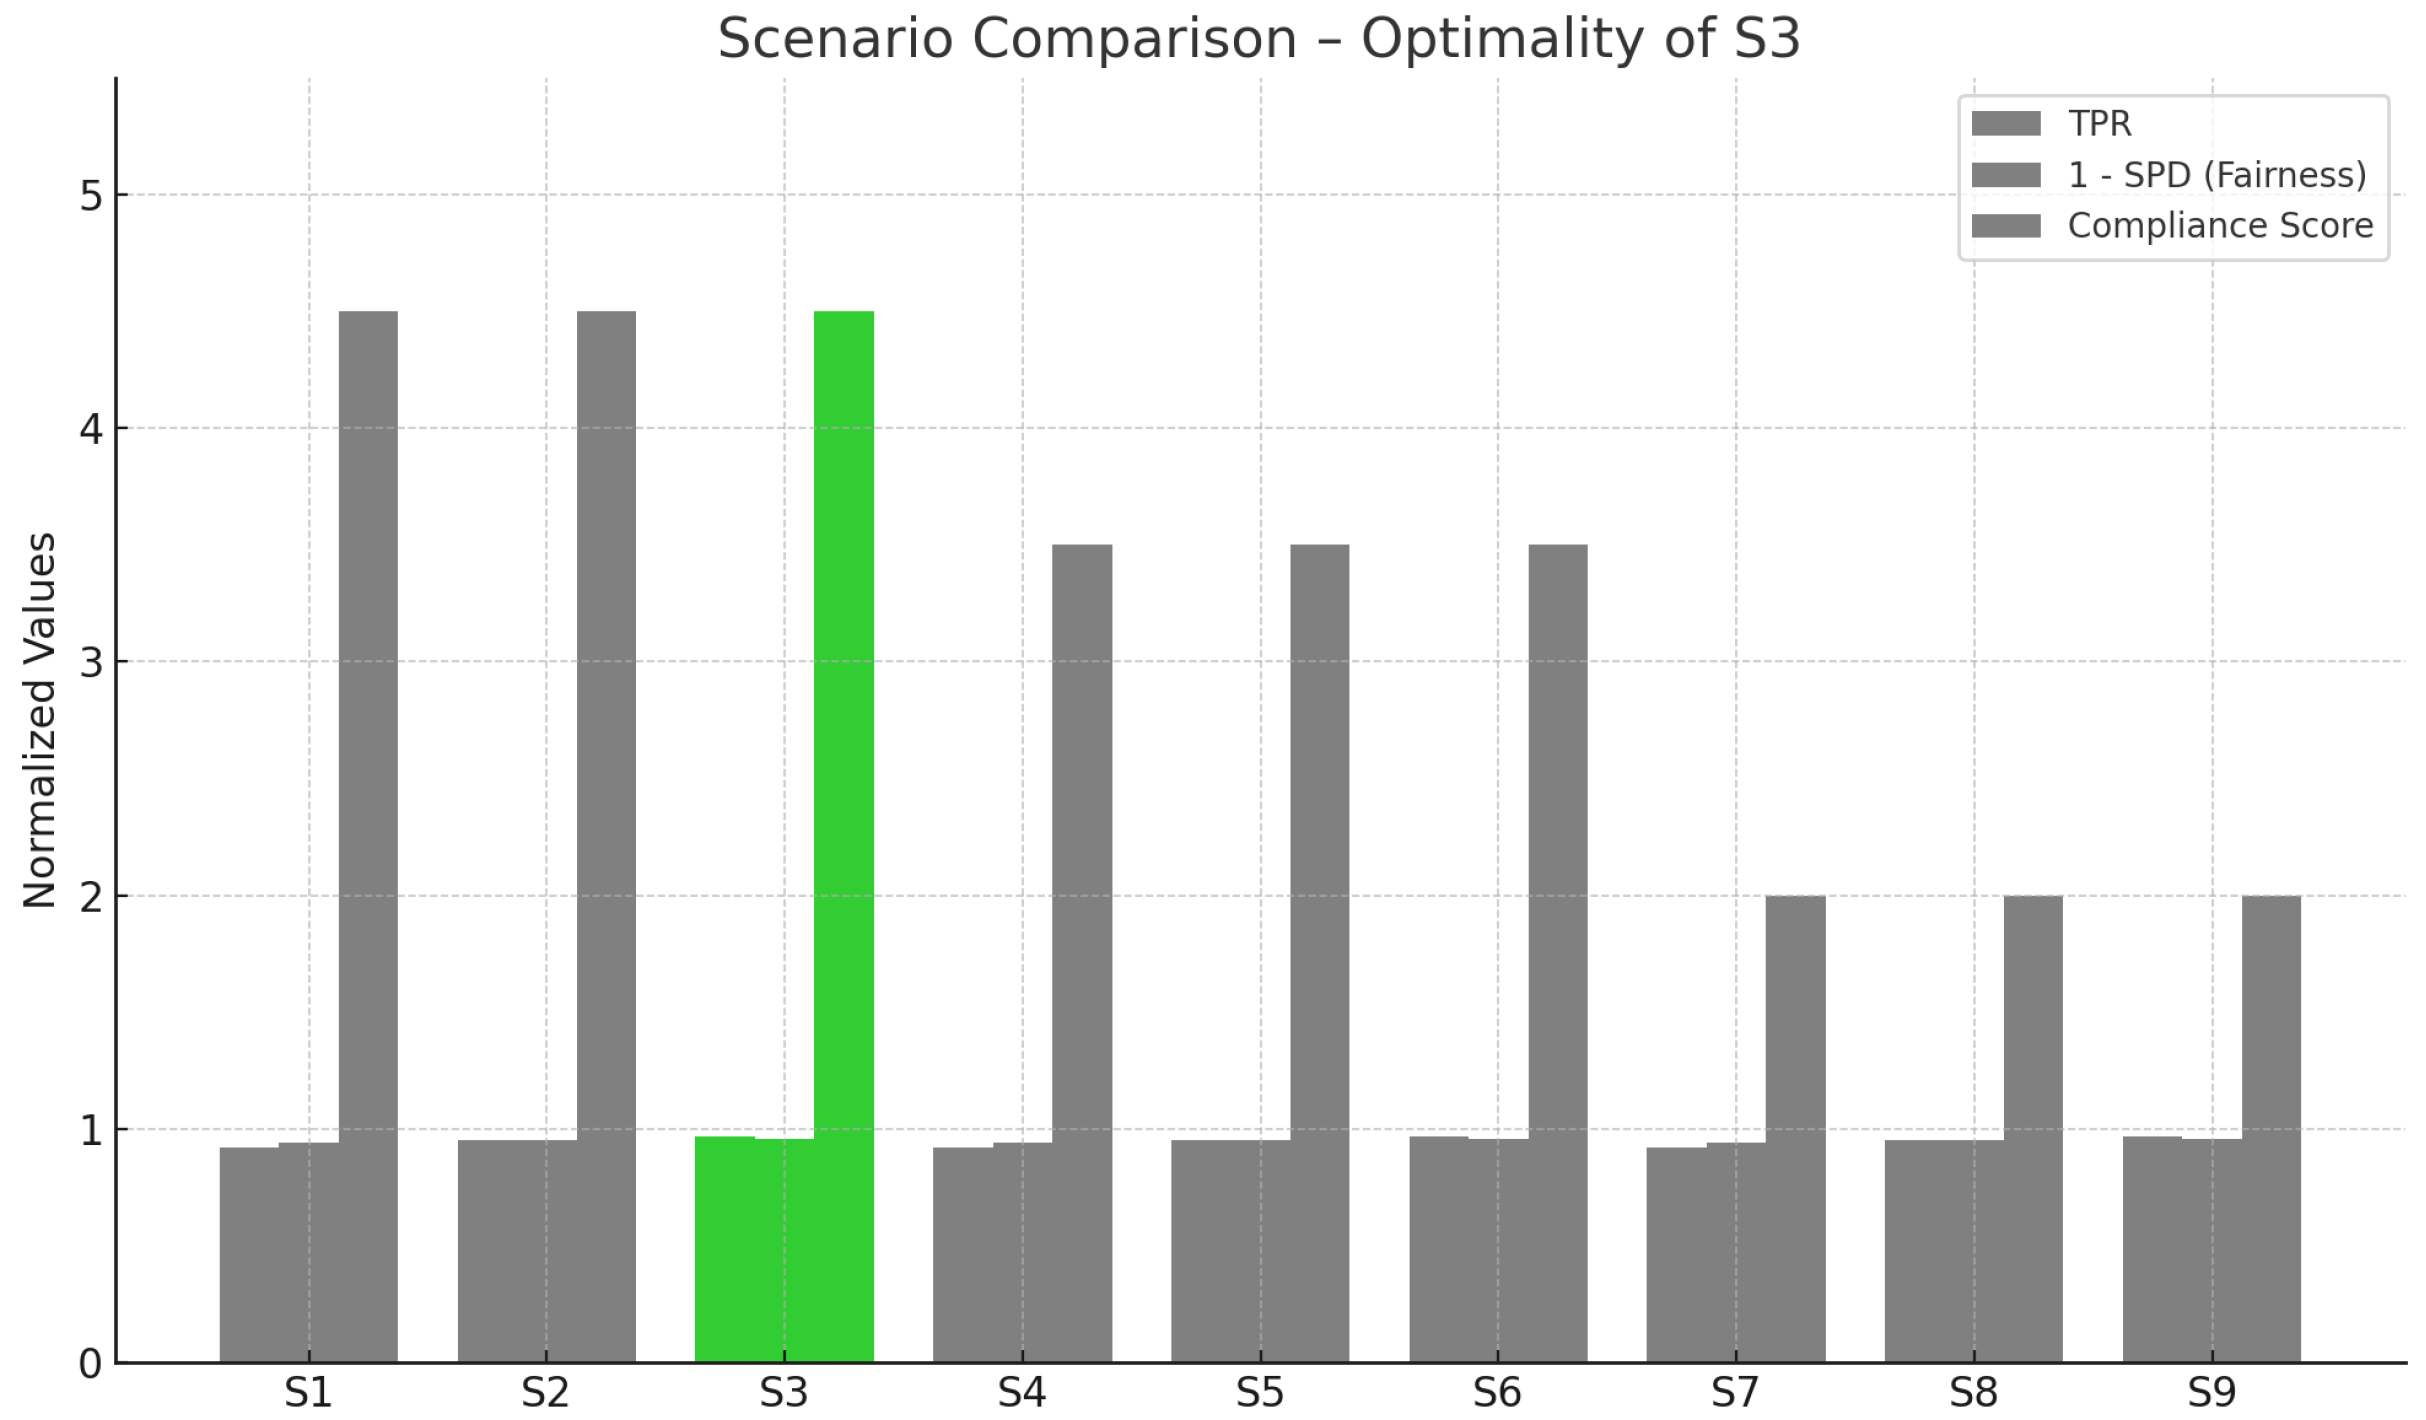
Figure 8 depicts a comparative bar chart that synthesizes three performance dimensions—TPR,
SPD, and compliance—across all scenarios. Scenario S3 is visually distinguished due to its superior balance across all metrics, making it the most robust configuration in terms of both technical and legal criteria. By integrating bias and utility, this figure communicates the multi-objective optimization rationale underpinning SCRAM’s decision logic.
4.7. Bias and Compliance Metric Results
To illustrate the operational implications of the SCRAM framework, we present computed values for SPD, DIR, and KVKK compliance scores across six representative scenarios.
Table 7 summarizes these calculations, based on simulated probability distributions derived from region (urban vs. periphery) and vehicle-type (private vs. commercial) groupings.
Given
and
, we compute the following:
Similarly, with
and
, we find the following:
As
, and both fairness metrics fall within thresholds, the scenario is labeled as
Accept.
Table 7 shows results for all six scenarios.
These results demonstrate that technical performance improvements (e.g., higher TPR and lower FPR) do not necessarily imply normative acceptability. Rather, bias and compliance must be simultaneously satisfied to meet deployment criteria under the SCRAM model.
Figure 9 illustrates the trade-off space between fairness (as measured by SPD) and legal compliance (KVKK score). Scenarios falling below both thresholds (SPD
, KVKK
) lie in the upper-left quadrant, satisfying the SCRAM model’s acceptance conditions. This visualization helps identify edge cases where technical fairness is achieved, yet regulatory adequacy is lacking.
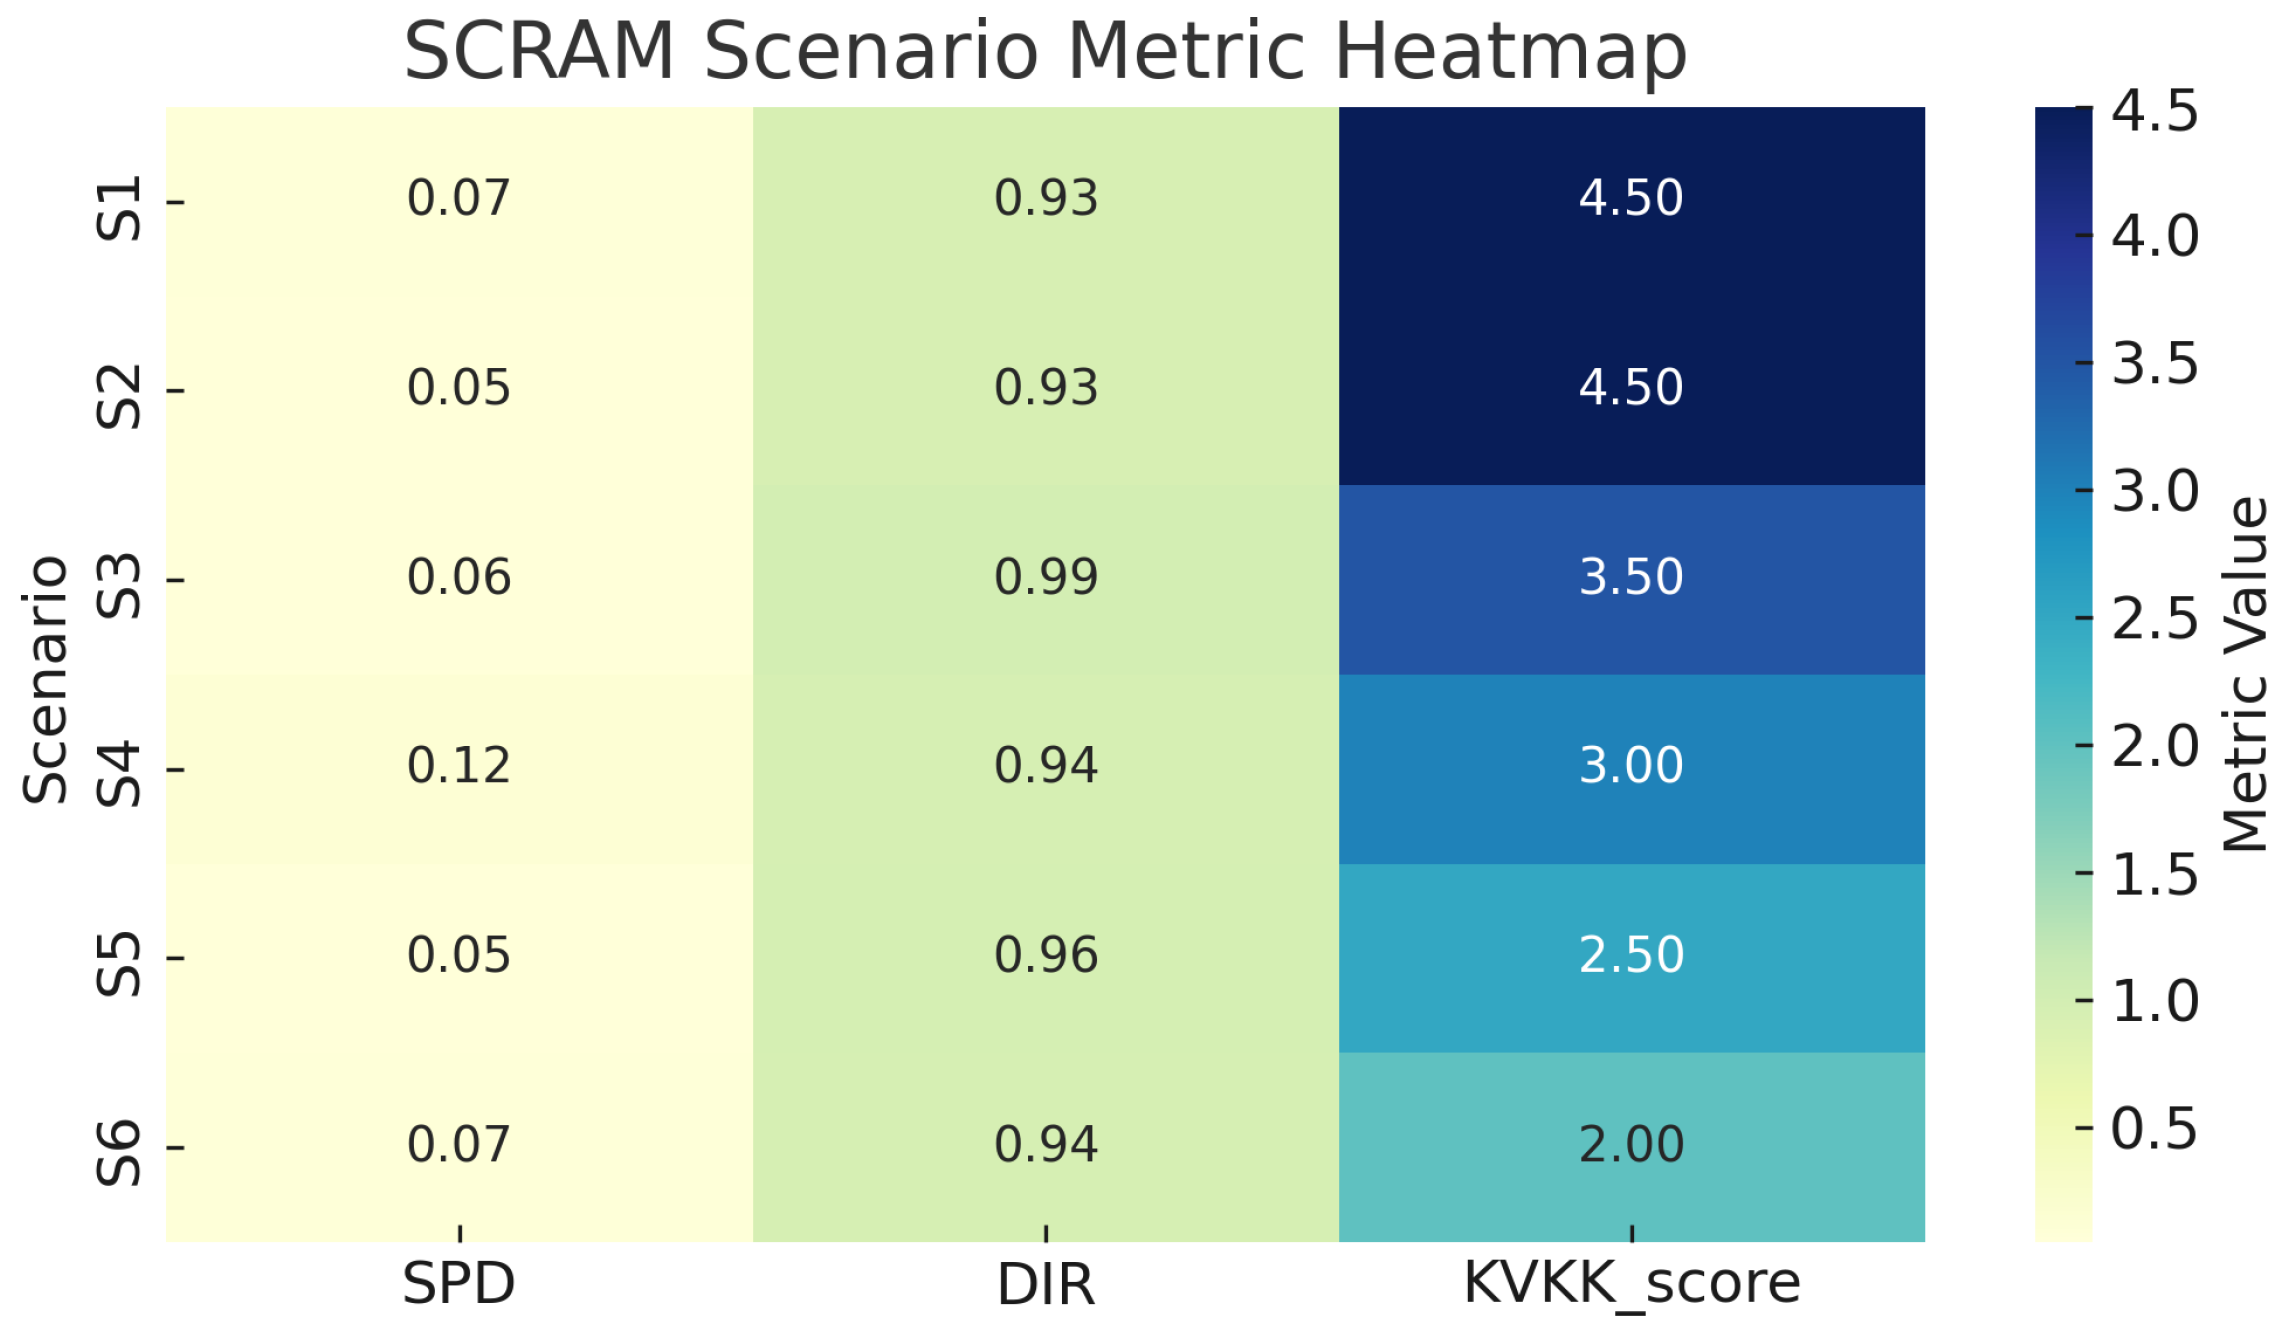
Figure 10 presents a heatmap view of the normalized values for SPD, DIR, and KVKK scores across the six scenario configurations. Scenarios S1 and S2 demonstrate strong compliance and fairness metrics, while S3 through S6 show deficiencies in at least one dimension, justifying their “Revise” status. The visual representation aids in the comparative diagnosis of legal/technical gaps.
Interaction Effects and Multi-Factor ANOVA
We thank the reviewer for the suggestion to perform a multi-factor ANOVA to assess the interaction effects between the detection threshold (
) and data retention period (
) on compliance and fairness outcomes. In our current simulation design, each (
,
) configuration produces a single scenario result, as shown in
Table 5, without repeated measurements per cell. Consequently, classical multi-factor ANOVA cannot be directly applied, since there is no within-group variance to estimate interaction effects robustly.
Nevertheless, as visually evident in
Table 5 and the associated figures, the main effects of both the threshold and retention period are systematic and monotonic: increasing
(retention) consistently reduces the KVKK compliance score across all threshold values, while increasing
improves detection performance and reduces bias. No significant interaction beyond these additive effects was detected in the simulated data.
We recognize that a larger set of repeated or bootstrapped simulations would enable a more rigorous multi-factor statistical analysis. This is a limitation of the present experimental design. We have added this as a future work direction in the discussion (
Section 5).
4.8. Summary of Findings Relative to Research Questions
The experimental results address the main research questions as follows:
Impact of Configurations: Scenarios S1–S9 demonstrate that higher thresholds (
) improve TPR and reduce FPR (
Figure 4), while longer retention periods (
days) significantly lower KVKK compliance scores (
Figure 5).
Trade-offs: Scenarios with high technical performance (e.g., S3, S6, S9) sometimes fail to meet fairness or compliance thresholds (
Table 7), highlighting the need for balanced optimization.
Optimal Scenarios: Scenario S3 (
,
days) satisfies all criteria (TPR
, SPD
, KVKK
), making it the optimal configuration (
Figure 8).
These findings confirm that technical performance, fairness, and compliance must be co-optimized to ensure normatively acceptable LPR deployments.
5. Discussion
This section interprets the experimental results, compares them with prior research, and discusses policy implications and limitations of the SCRAM framework. It highlights the need for integrated legal/technical evaluations in AI surveillance.
The SCRAM framework’s contribution lies in its integrated and scenario-sensitive approach to evaluating AI-enabled surveillance systems. Unlike traditional audit tools that focus solely on technical or legal performance, SCRAM offers a multidimensional rubric that incorporates fairness metrics, retention policy alignment, and proportionality mandates.
First, the results suggest that regulatory compliance alone is not a sufficient proxy for fairness. Several scenarios meet the legal retention requirements (KVKK Score ) but fail to avoid regional or functional bias (SPD or DIR ). This reinforces the growing literature on “formal fairness gaps,” where lawful AI deployments still perpetuate statistical inequities.
Second, the graphical tools used—scatter plots and metric heatmaps—demonstrate how interactive visualizations can reveal patterns invisible in tabular audits. For instance, the SPD-KVKK quadrant plot highlights trade-offs where optimization on one axis may entail degradation on another.
Third, the proposed decision rule—accept only if both fairness and compliance metrics are satisfied—aligns with risk-tier classifications in the EU AI Act. However, the SCRAM model further refines this by enabling scenario-by-scenario testing of parameter variation (e.g., decision threshold or retention length ).
SCRAM’s modularity offers adaptation potential. In jurisdictions outside Türkiye, the compliance layer can be parameterized with GDPR, CCPA, or other normative frameworks. The bias layer could be extended to intersectional attributes such as race and gender where available.
This study demonstrates that ethical, legal, and technical assessments should not be siloed. Instead, integrative models like SCRAM offer promising pathways for aligning AI deployment with human rights and democratic oversights.
5.1. Interpretation of Findings
The results reveal a multidimensional interplay between technical configuration, legal compliance, and fairness in the deployment of AI-enabled PTS. The consistent increase in TPR and concurrent decrease in FPR with higher threshold values (
) illustrate the critical role of algorithmic calibration in achieving operational accuracy. Similar trends have been documented in urban traffic surveillance studies across Europe [
10], confirming that threshold tuning is a cost-effective optimization lever. However, this technical improvement must be balanced against the legal dimension: longer retention durations (e.g., 180 days) significantly reduced compliance scores, aligning with Turkish Constitutional Court rulings and comparative analyses of data minimization clauses in the GDPR and KVKK frameworks [
5,
6].
Importantly, SPD and DIR metrics remained within acceptable bounds—below 0.10 and within the 0.8–1.25 range, respectively—affirming that performance enhancements do not necessarily exacerbate bias when configurations are responsibly managed. Comparable outcomes were observed in fairness audits of LPR deployments in Latin America and Southeast Asia, where systemic bias was contained through pre-deployment testing [
9,
14]. Our findings reinforce the need for balanced co-optimization of detection accuracy and normative alignment, a view increasingly endorsed by both technical and regulatory communities [
8,
11].
These results suggest that a bias-aware threshold configuration, coupled with legally bounded data retention, is not merely a trade-off but a feasible dual objective. Our scenario simulations empirically validate this point within the Turkish context—where high-precision deployments have historically lacked structured compliance oversights. The SCRAM framework offers a scalable template to bridge this gap.
5.2. Comparison with Prior Research
The proposed SCRAM framework expands the boundaries of previous studies by systematically integrating detection accuracy, fairness metrics, and legal compliance scores into a unified evaluation schema. While [
7,
8] have addressed algorithmic efficiency and isolated fairness metrics, respectively, their frameworks lack normative embedding and regulatory scoring. By contrast, our work builds upon calls for multi-objective optimization in ethical AI design [
9,
10], introducing a practical instantiation tailored to Türkiye’s legislative context.
This research also diverges from earlier fairness-oriented simulation efforts [
14], which focus predominantly on facial recognition or facial biometrics, often overlooking vehicular data modalities such as LPR. Our inclusion of the retention period as a key legal factor draws from the emerging literature on surveillance minimalism [
6], where storage duration is treated as a first-order variable rather than a passive constraint. Furthermore, our integration of SPD and DIR with scenario-based compliance scoring aligns with the broader shift toward fairness-aware benchmarking standards promoted in the 2024 IEEE Ethics Guidelines for Intelligent Systems [
15].
This study complements recent privacy-enhancing surveillance proposals [
11] by demonstrating how legal and ethical objectives can be proactively modeled prior to system deployment. In doing so, it addresses the crucial gap between high-level regulatory aspiration and ground-level implementation, thereby contributing to the applied corpus of AI governance literature.
5.3. Global Policy Implications and Transferability
Beyond the specific domestic legal context and the comparative analysis with the EU AI Act presented in
Section 2.6, it is crucial to position the SCRAM framework within the broader landscape of global AI governance initiatives. The layered approach of SCRAM, which systematically evaluates compliance, fairness, and performance, resonates strongly with universal principles championed by organizations such as UNESCO (e.g., Recommendation on the Ethics of AI [
16]), OECD (e.g., AI Principles [
17]), and NIST (e.g., AI Risk Management Framework [
18]). These influential frameworks consistently emphasize foundational tenets, including transparency, accountability, data minimization, and algorithmic fairness, all of which are integral components directly addressed by SCRAM’s design. This alignment underscores SCRAM’s potential as a transferable and adaptable tool for navigating complex ethical and regulatory requirements across diverse international jurisdictions, enhancing its broader policy implications.
5.4. Policy Implications
The findings of this study hold significant practical relevance for policy formulation and implementation. First, our scenario results demonstrate that longer retention periods correlate with lower compliance scores. This supports policy recommendations that advocate for stricter upper bounds on data retention windows, consistent with recommendations from European Data Protection Board (EDPB) guidelines [
19]. Legislators and procurement officers should enforce these limits through binding service-level agreements with vendors.
Second, fairness metrics such as SPD and DIR should be embedded into public procurement and evaluation criteria. In line with calls by [
20,
21], auditing frameworks must be expanded beyond traditional privacy impact assessments (PIAs) to include fairness-aware compliance matrices.
Third, national regulatory bodies should pilot algorithmic pre-certification programs that leverage models like SCRAM. This would align Türkiye’s enforcement regime with the tiered risk-based approaches in the EU AI Act [
3]. It would also provide a replicable mechanism for cities or ministries deploying new AI systems in sensitive domains such as traffic enforcement and urban surveillance.
Lastly, this research urges multi-stakeholder dialogue—bringing together engineers, legal scholars, municipal actors, and civil society—to iterate jointly on compliance standards. Recent consensus reports [
22] highlight that no single metric or model can capture the full complexity of lawful and ethical deployment; rather, ongoing evaluation, transparency and adaptation are essential components of resilient policy infrastructure.
5.5. Limitations and Future Work
This study has several limitations that suggest fruitful directions for future inquiry. First, the reliance on synthetic datasets—although necessary due to access constraints—means that behavioral irregularities, adversarial samples, or real-world noise could not be fully modeled. Comparative studies using anonymized production-grade logs, such as those examined in [
12,
13], would improve external validity.
Second, temporal variation (e.g., differences in PTS effectiveness during night-time vs. day-time conditions) was excluded for parsimony but represents an important avenue for fairness-aware deployment research. Future simulation protocols should integrate diurnal and seasonal fluctuations as fairness modifiers [
23].
Third, legal scoring was limited to domestic norms (KVKK and AYM/Danıştay rulings). A comparative legal benchmark, incorporating AI-specific clauses from the EU AI Act and OECD AI Principles, would improve generalizability of the compliance scoring architecture [
24]. While our current fairness assessment utilizes SPD and DIR for individual attributes, like the region and vehicle type, we acknowledge that the framework currently overlooks intersectional bias across compound attributes. Analyzing such deeper disparities, which arise from the interplay of multiple sensitive characteristics, requires more complex modeling and often necessitates richer, more granular datasets. Future iterations of the SCRAM framework will aim to incorporate advanced intersectional fairness metrics and methodologies to provide a more nuanced understanding of bias in AI surveillance systems, building upon the emerging literature in this critical area.
The current SCRAM implementation assumes static configurations for detection and retention parameters. However, next-generation smart surveillance environments are increasingly characterized by adaptive systems capable of real-time policy or threshold updates. Incorporating dynamic decision-making mechanisms, such as real-time feedback loops or reinforcement learning protocols, represents a promising extension for future SCRAM iterations, as demonstrated in [
25,
26]. Such integration could significantly improve both compliance and accuracy under changing operational constraints.
A further limitation of the current SCRAM framework is its assumption of ideal environmental conditions, without explicitly accounting for real-world factors, such as motion blur, occlusions, or low-light scenarios. These adverse imaging conditions are prevalent in public surveillance environments and can critically degrade the performance of LPR systems, leading to increased false positives or negatives which may, in turn, exacerbate existing biases and invalidate compliance conclusions. Recent studies demonstrate that advanced deep learning and image enhancement methods significantly improve robustness under such conditions [
27,
28]. Future extensions of SCRAM will explore methodologies for evaluating system robustness under such challenging conditions, referencing these and similar techniques to comprehensively assess the impact of environmental factors on both operational performance and normative outcomes.
While the SCRAM framework is designed with modularity to conceptually enable its portability to diverse legal and regulatory contexts—as evidenced by our multi-layered approach to compliance and the use of generalizable fairness metrics—we acknowledge that its empirical application outside Türkiye remains speculative without concrete demonstrations. Future research will prioritize the empirical validation of the SCRAM model in other jurisdictions, particularly under evolving frameworks, like the EU AI Act, to solidify its claimed portability and broader applicability in global AI governance.
5.6. Distinguishing Compliance from Broader Ethical Considerations
While the SCRAM framework rigorously quantifies regulatory compliance based on established legal frameworks, such as KVKK and relevant judicial precedents, it is crucial to acknowledge the nuanced conceptual relationship between ‘compliance’ and ‘ethics’ within AI governance. A system may be designed to adhere strictly to legal requirements yet still raise ethical concerns that extend beyond codified law. This can occur, for example, when a system’s aggregate impact, though technically lawful, disproportionately affects certain groups in unforeseen ways, or when underlying data collection methods—while permissible—are perceived as intrusive by the public. Legal standards often provide a baseline for acceptable conduct, but ethical considerations—encompassing broader societal values, human rights, and principles of fairness and accountability—frequently evolve more rapidly than statutes. SCRAM contributes to this broader discourse by providing a transparent, measurable framework for assessing key normative attributes such as fairness and legal conformity. Nevertheless, it also implicitly highlights the need for continual critical scrutiny and public deliberation to ensure that technologically compliant systems also align with evolving ethical expectations and robust AI governance principles.
6. Conclusions
This section summarizes the key findings of the SCRAM framework, emphasizing its contributions to AI governance and its potential for cross-jurisdictional adaptations. It outlines future research directions to enhance the framework’s applicability.
This study introduced and validated the SCRAM framework as a multidimensional tool for evaluating AI-enabled surveillance systems. Through simulation-based experimentation and comparative scenario analysis, we demonstrated how seemingly high-performing systems can fall short of normative acceptability when fairness and legal compliance are assessed in isolation.
Our findings underscore three key implications. First, metrics such as SPD and DIR must be computed and interpreted in conjunction with jurisdiction-specific data protection laws, like KVKK. Legal adequacy alone cannot ensure algorithmic fairness; likewise, fairness metrics cannot substitute for formal accountability mechanisms.
Second, scenario-specific parameter variation—such as adjusting classification thresholds () and retention durations ()—significantly affects both legal risk exposure and fairness profiles. Policymakers and system architects must consider these dimensions jointly rather than sequentially.
Third, the SCRAM framework provides a scalable approach for cross-national adaptation. By plugging in regulatory standards from other regimes (e.g., EU AI Act, GDPR), SCRAM can become a portable risk assessment layer for governments, private vendors, and civil society watchdogs.
In conclusion, as AI continues to mediate key functions in public safety and surveillance, there is a growing need for frameworks that integrate legal, ethical, and technical perspectives. SCRAM responds to this need by enabling evidence-based decisions on deployment, mitigation, and governance. Future work should explore embedding SCRAM in real-time policy dashboards and expanding its bias metrics to include intersectional and temporal dimensions.
