1. Introduction
Electric vehicles (EVs) play a key role in advancing environmental sustainability by addressing key ecological challenges [
1]. This new concept directly contributes to reducing greenhouse gases, noise, and visual pollution compared to traditional methods [
2,
3]. This reduction in emissions [
4], especially with the widespread use of electric vehicles, helps to combat global warming [
5] and climate change [
6]. In addition, electric vehicles contribute to improving air quality in urban areas by removing harmful pollutants such as nitrogen oxides and particulate matter, which are known to cause respiratory and cardiovascular health problems [
7]. According to the World Health Organization, urban air pollution is responsible for 3 million deaths and 85 million injuries [
8]. The quieter operation of electric vehicles also reduces noise pollution, providing a less noisy living environment in densely populated cities [
9]. Moreover, electric vehicles help to reduce the environmental impacts of extracting, refining, and transporting fossil fuels by reducing reliance on these fuels, while supporting the transition to renewable energy [
10]. As governments increasingly invest in electric vehicle infrastructure and sustainable mobility solutions [
11], the adoption of electric vehicles is encouraging the development of environmentally friendly urban areas with reduced pollution and traffic congestion [
12]. In this context, the provision of electric energy in charging infrastructures plays a critical role in the sustainability of this new and unconventional transportation alternative [
13].
In recent years, the trend towards electric vehicles has increased, especially with the environmental impacts and increasing costs of traditional vehicle fuels [
14], and the global transition to electric vehicles has accelerated [
15]. With the increasing popularity of electric vehicles [
16], many studies have been conducted on the deficiencies in charging EVs [
17]. However, infrastructure deficiencies create concerns for EV users or users considering switching to electric vehicles, slowing down the EV transition [
18,
19]. In addition, the high installation costs of EV charging stations and the provision of this infrastructure only in certain regions are not sufficient to meet the demand [
20,
21]. Effective optimization of EV charging stations is of great importance for both EV owners and charging station owners [
22]. Haphazardly installed EV charging stations will cause unnecessary costs for station owners and will not be able to meet customer demands sufficiently [
23]. The increase in the number of electric vehicles in recent years and future electric vehicle usage forecasts require multi-faceted optimization of electric vehicle charging stations [
24,
25].
Especially in recent years, with the increasing popularity of electric vehicles, there has been a rapid increase in academic studies on this subject [
26]. Tasdemir et al. (2025) focused on waiting time increases, particularly on intercity routes, with their portfolio capacity limit range coverage multi-objective model for the Istanbul–Ankara highway [
27]. However, this study does not solely address current demand but also includes demand increases or dynamic waiting times [
27]. The sequential forecasting-optimization method proposed by Zhuang et al. (2025) provides real-time system capacity assessment by making a time-series-based forecast of electric vehicle demand [
28]. While the method has a robust forecasting infrastructure, it does not directly address multi-objective station location problems [
28]. When the studies carried out are examined, location and capacities are generally taken as a basis. A genetic algorithm was used to determine the locations of electric vehicle charging stations based on distance for the city of Milan [
29]. Similarly, a genetic algorithm was used to determine the locations of electric vehicle charging stations, considering popular places and existing electric vehicle charging stations for the city of Valencia [
30]. Again, Vandet and Rich wanted to estimate the electric vehicle demand in the city of Copenhagen in 2023, and optimize the number and locations of electric vehicle charging stations with the help of the created model [
31]. Similarly, a mathematical model created to determine the locations of the electric charging stations of the city of Milan was solved with the evolutionary algorithm. Then, the obtained results were compared with particle swarm optimization, genetic algorithm, biogeography-based optimization, and social network optimization algorithms [
32].
Considering the studies carried out on public transportation, a model was created and a solution was provided to determine the locations of charging stations of electric vehicles used in public transportation in Beijing [
33]. Another study about public transportation was undertaken in 2020 by Türk, Deveci et al. The main goal of that study was to determine EV charging station locations for an electric bus axis in Istanbul [
34].
Novelly, the research investigated how the positioning of electric vehicle charging stations was adjusted to meet the charging demands of multiple residences. Analysis shows that charging stations are appropriately positioned to meet the charging needs of electric vehicle owners [
35]. Differently, Chraibi et al. used a hybrid metaheuristic algorithm in 2018. This study uses a hybrid metaheuristic method created with particle swarm optimization and Tabu Search algorithms to find a solution to the positioning problem of electric vehicle charging stations. The analyses show that the proposed hybrid metaheuristic method is effective in positioning electric vehicle charging stations [
36]. Similarly, a model is presented to determine the best locations of electric vehicle charging stations using metaheuristic optimization algorithms (Harries Hawk Optimization, Teaching–Learning-Based Optimization). The analyses show that the proposed method is effective and provides advantages in the multi-objective optimization process [
37]. Also, in 2011, Meng and Kai, presented a model to determine the optimal locations of electric vehicle charging stations using game theory. The analyses show that the proposed game theory-based model is effective in positioning electric vehicle charging stations [
38]. In 2025 Hsu et al. applied a multi-objective particle swarm optimization (PSO) method for optimal positioning of EVCS. The aim of study is minimizing power losses and improving the voltage profile on a standard IEEE-69 node distribution system. However, their proposed model does not consider future demand scenarios or dynamic demand accumulation, which are among the key components of our MINLP model [
39]. Subash and Narmadhai (2025) identified optimal locations for urban EV charging stations by integrating technical, environmental, and economic criteria using a COPRAS-based multi-criteria assessment method [
40]. However, this study based its assessment on quantitative weighting and did not include time-series demand projections or dynamic performance metrics such as idle time or residual demand [
40]. A two-stage optimization model implemented by Liu et al. (2025) in Wuhan attempts to balance charging efficiency with equity. Based on real-world usage data, this model focuses on social objectives such as accessibility and equitable distribution [
41]. However, the model does not include technical components such as idle times or capacity evolution, making it not directly comparable to our multi-objective MINLP approach [
41]. Additionally, some studies have developed robust models that consider uncertainties such as failures or maintenance requirements that may occur in EV charging infrastructure. For example, in 2022 Loaiza-Quintana et al. proposed a robust layout model for electric bus networks and evaluated scenarios that ensure service continuity with possible system failures. Such approaches are important for improving system reliability in dense urban networks with high operational uncertainties [
42]. However, since the focus of this study is on the facility planning phase, operational failure scenarios are excluded from the evaluation.
More similar studies can be given here as examples from the literature, but in summary, when the literature review was conducted and the governments, citizens, and policies developed on the subject, mostly in recent years, were examined [
43], it was seen that electric vehicles have become popular around the world and as a result, a number of studies have been conducted in the literature. These studies generally include the solution of the mathematical model established to optimize the location and capacity of electric vehicle charging stations in different world cities selected as application areas. In addition, in some studies, it has been observed that the mathematical model created was obtained by using different metaheuristic algorithms and the obtained outputs were sometimes compared with each other. Also, there are studies that use fuzzy logic for the optimization of EVCS.
Most studies focus on a single objective, whereas our model simultaneously considers multiple objectives. While many approaches in the literature focus solely on current demand, our model works with future demand projections and considers residual demand. Technical metrics such as waiting times and utilization rates have been neglected in many studies; our proposed model offers a more comprehensive and adaptable framework in these respects.
In this study, a MINLP mathematical model was created to optimize the location and capacity of EV charging stations, as well as the waiting times of vehicle owners, idle times of stations, service costs, and unmet demand, and not only for current demands but also for three different demand forecast levels in 2030 and 2035. It can be said that this study, unlike other studies in the literature, was conducted to meet not only the current demand but also the possible increasing future demands. Another difference between this study and the studies in the literature is the number of objectives which aimed to optimize the unique mathematical model formulated as so many criteria are combined in a MINLP (mixed-integer non-linear programming) model. Thanks to the combination of non-linear relationships and integer variables, the behavior of the system is modeled more realistically, because real-world problems like in this study often have a non-linear and complex structure. The created MINLP model uniquely addresses the trade-offs between unmet demand, idle times, service costs, and installation costs in comparison to earlier models. By doing so, the results become more practically applicable and effective.
The European side of Istanbul was chosen as the study area for the urban application of the mathematical model and a large-scale randomly generated region was chosen to see the performance of the model when the problem grew too large. At the point where the problem grew too large and could not be solved, the use of metaheuristic algorithms was needed. At this point, the genetic algorithm was chosen and used for the solution in places where the problem grew. The results obtained were compared and sensitivity analyses were performed to make the evaluation of the mathematical model easier.
In addition, the study makes several significant contributions, including the demonstration of the efficiency of EVCSs for owners or founders and the provision of high demand response rates for EV users. Thanks to this study, it is expected that if the necessary data sets are provided in regions, highways, axes, and urban areas where the optimization of EV charging stations is needed, a mathematical model that can meet this need has been put forward and will be ready for use.
2. Methodology
In this study, first of all, the need to create a mathematical model with high adaptability to axes, highways, urban areas, etc., was determined. Accordingly, a unique MINLP model was developed and with the collected data, the aim was to reach a solution with a genetic algorithm in the determined application areas.
2.1. Data Collection and Determination of Requests
It is important to correctly determine current demand and forecast future demand for the correct development and planning of electric vehicle infrastructure. In this way, the infrastructure needs of densely trafficked axes, highways, urban areas, and connecting roads can be determined optimally, and the capacities and efficiencies of charging stations can be planned to meet current and future demands. In addition, determining current and future demands plays an important role for charging station owners opening new stations, making investments in this direction, and making more accurate feasibility studies and profit calculations.
In order to implement the applications, demand points, station alternative points, distances between these points, and EV demand data are needed. In this study, it was determined that the data could be obtained from the General Directorate of Highways, TUIK, and the Ministry of Transport and Infrastructure.
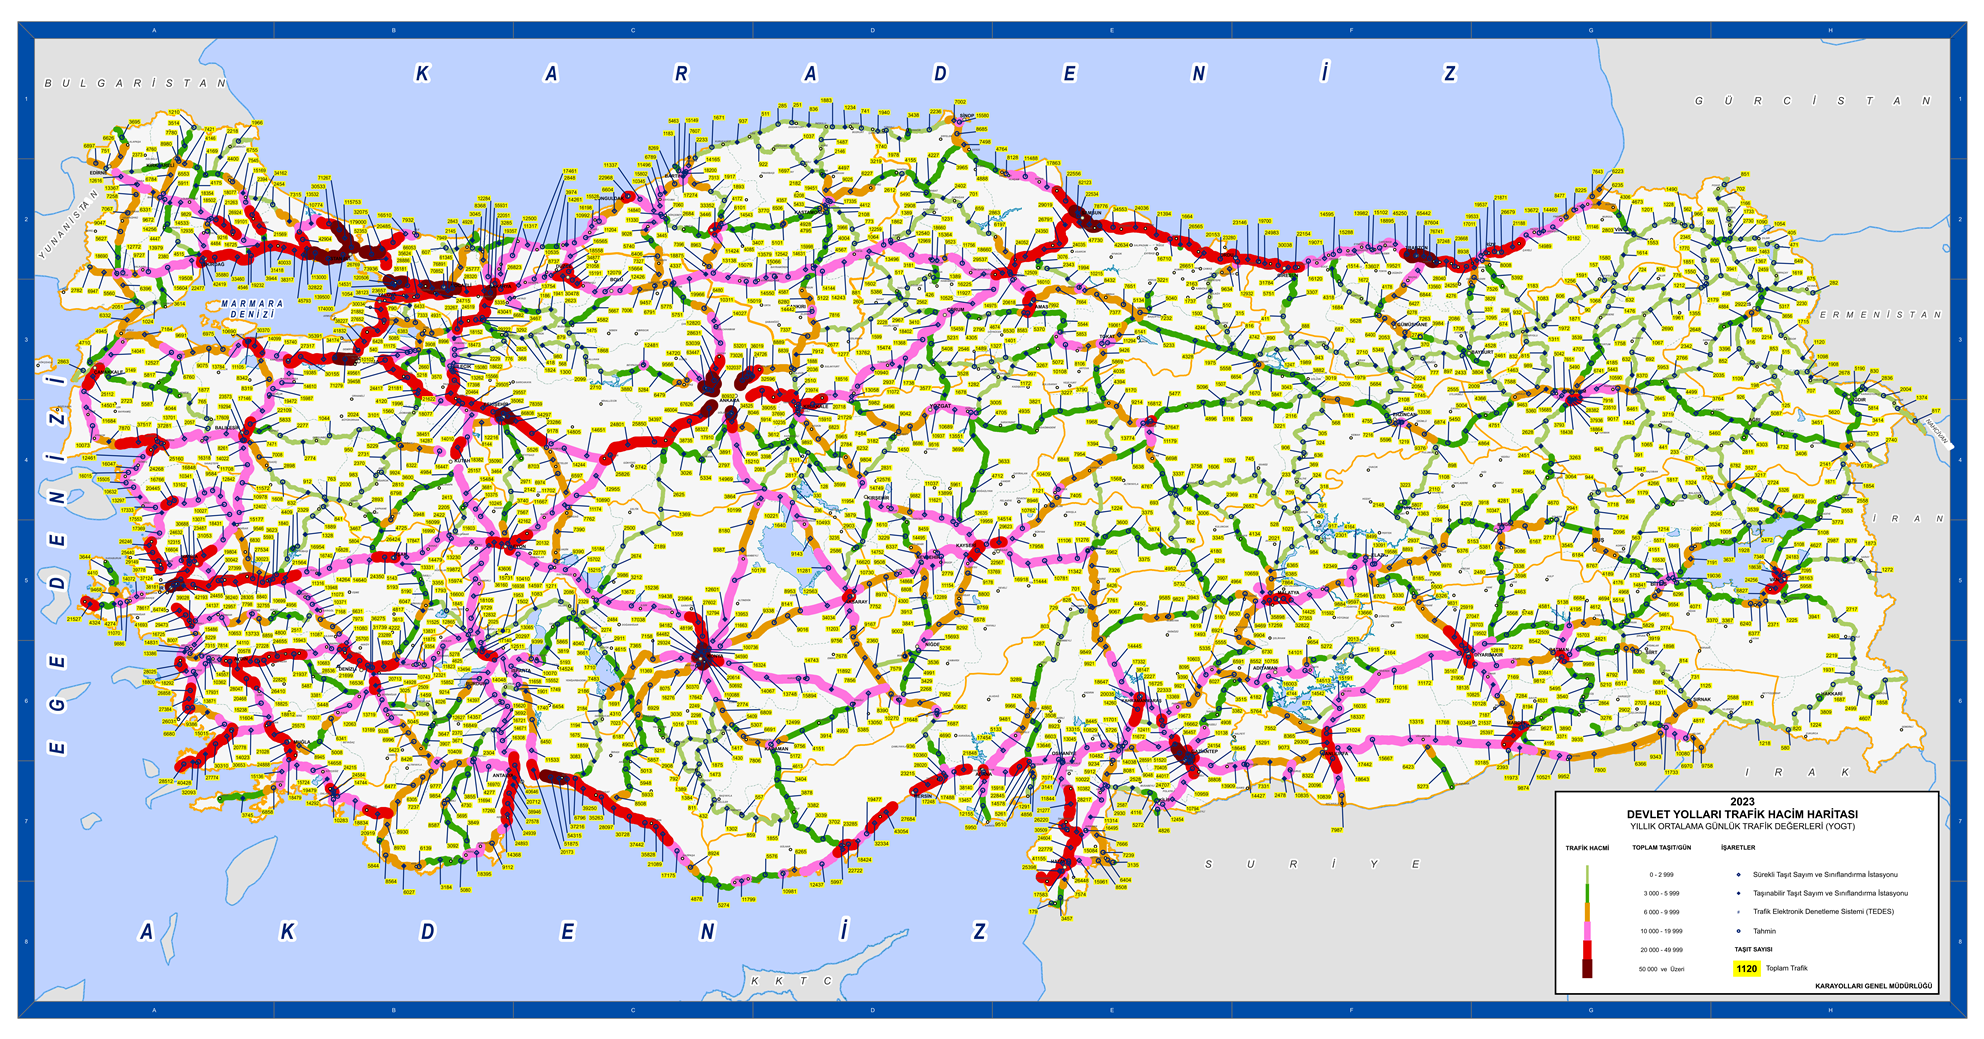
The average daily vehicle crossings of all axes in the country are found in numbers on a yearly basis from the General Directorate of Highways, as can be seen in
Figure 1.
Apart from this, TUIK reports the total number of vehicles in traffic and the total number of electric and hybrid vehicles in traffic. In this way, by calculating the number of vehicles, it is possible to find out what percentage of the total number of vehicles in traffic are electric vehicles.
Thus, by applying the ratio obtained from TUIK data to the desired axis on the map obtained from the General Directorate of Highways, the average number of electric vehicles passing through the specified axis can be found.
In order to determine the demands, the 2023 traffic density and daily passing vehicle map obtained from the General Directorate of Highways and the usage numbers of the European side of Istanbul were prepared.
In addition, in order to determine the future demand, EMRA (Republic of Turkey Energy Market Regulatory Authority) estimates of low-, medium-, and high-level electric vehicle numbers for the years 2030 and 2035 are also used. The Energy Market Regulatory Authority of the Republic of Turkey is responsible for supervising and regulating various aspects of the energy market, including electricity, natural gas, oil and other energy commodities. EMRA uses forecasting models and methodologies to assess the impact of EVs on electricity demand, grid stability, and energy consumption patterns.
After determining the demand of each point, these calculations were repeated according to EMRA’s 3 different scenario estimates for the years 2030 and 2035.
EMRA’s estimates for the number of EVs for the years 2030 and 2035 are shown
Table 1 with three different forecast levels.
For the application carried out on the European side of Istanbul, the General Directorate of Highways’ Volume Maps, TUIK, and EMRA data were used. The demand points for the European side of Istanbul were determined from the General Directorate of Highways’ Volume Map in
Figure 1. When determining the demands of these alternative locations, the electric vehicle rate found in line with the data obtained from TUIK (80,043/15,221,134) × 100 was used as approximately 0.5%. In addition, the data obtained from TUIK again reached the total average distance covered by a car during the year, which is 13,000–14,000 km. This number was divided by 12 for the monthly average. When the obtained value of 1080–1100 km was accepted as the average EV range of 400 km and divided by this number, it was concluded that EVs should enter charging stations 3 times a month, i.e., every 10 days. It also incorporates random demand generation, staying within a certain range using normal distribution. The 2023 demands obtained as a result of these calculations were repeated according to EMRA’s 3 different scenario estimates for 2030 and 2035. The relevant demand tables are given in the
Supplementary Materials.
Finally, in order to see how the mathematical model produces results when the number of alternative and demand points is increased, 250 alternative artificial locations and random demands of each location were determined. As in previous applications, EMRA data were used again when determining the demands for the years 2030 and 2035. The graphs containing these determined demands are also in the Application Section.
2.2. Mathematical Model
As mentioned in the introduction, optimizing EV charging stations is important for both EV users and owners. At this point, there are some factors that will be optimized when determining the capacities and locations of EV charging stations. One of these factors is customer waiting times which is important. If customers’ waiting times are long, this indicates that the opened EV charging stations are insufficient to meet the needs of EV users. Another important factor is stations’ idle times. On the contrary, if the idle times of the stations are too long, EV charging station owners are either opening too many charging stations or charging stations with too much capacity, incurring unnecessary expense. Of course, while trying to optimize these factors, unmet demand—which is the failure to meet the charging demand of the EV user coming to the EV charging station—should also be taken into consideration. This is also one of the important issues avoided in this study. The created MINLP model described involves the optimization of electric vehicle (EV) charging station deployment, considering factors such as location, capacity, customer waiting time, station idle time, unmet demand, and operational costs. Below is a breakdown of the model.
Sets:
- –
I: Alternative station locations.
- •
J: Demand points.
- •
T: Number of time periods.
Parameters:
M: Maximum initial capacity (per hour).
C: Station installation cost.
L: Remote demand fulfillment penalty coefficient.
G: Unfulfilled demand penalty coefficient.
H: Idle time penalty coefficient.
P: Impact coefficient of capacity in station installation.
D: Demand.
St: Service times.
E: Distance between stations and demand points.
Binary Variables:
Variables:
- •
Z: Objective function
- •
Y(i,j,t): Amount of demand from point j served by station at location i at time t.
- •
F(j,t): Unfulfilled demand at point j at time t.
- •
Td(t): Total demand at time t.
- •
Tf(t): Total unfulfilled demand at time t.
- •
Ty(t): Total fulfilled demand at time t.
- •
Dd(j,t): Demand amount at point j at time t.
- •
Kt(i,t): Capacity of station at location i at time t.
- •
Sc(i,t): Total service time at station i at time t.
- •
Ext(i,t): Remaining and accumulating demands at station i at time t.
- •
Yit(i,t): Demand served from station i at time t.
- •
Idlet(i,t): Idle time at station i at time t.
- •
Sct(t): Total service time at time t.
- –
K(i): Initial capacities at station i.
Objective Function:
The objective is to minimize the total cost, which includes installation cost, service cost, unfulfilled demand cost, waiting cost, and idle time cost.
In the created mathematical model, the objective function aims to optimize more than one goal, and each of these goals is multiplied by a certain weight value. These weight values reflect the relative importance of each objective in the overall optimization process. While determining the weight values which depend on the preference of the decision-maker in the objective function, care was taken to ensure that they were balanced with each other. Balanced weights ensure that no single goal is overly dominant over others. Therefore, if the weight values are not balanced, the results will not be realistic or complete. In this study, weight values were determined by paying attention to these issues. Care was taken to avoid situations that were contrary to reality, and the effect of changing weight values on the result was examined. For example, if the “g” value is much higher than the “h” value, the results will show that the idle times of the stations increase. A sensitivity analysis was performed for varying weight values and parameters. Details of these will be mentioned in the sensitivity analysis section.
3. Constraints
The constraints ensure that demand coverage is maximized; station capacities are respected, providing time periods for waiting customers’ transfer to the next time period at that station; and all variables are non-negative.
Our model has various parameters, variables, and equations to represent factors such as demand, service times, distribution costs, and penalties associated with idle time, waiting time, and unmet demand. The objective function aims to minimize the total cost, which includes installation costs, distribution costs, penalties for idle time, waiting time, and unmet demand.
The mathematical model considers factors such as the maximum initial capacity of charging stations, installation costs, penalties for idle time, waiting time, unmet demand, and distribution costs. It also incorporates random demand generation, staying within a certain range using probability distributions such as the normal distribution. Essential constraints are defined below.
- 1.
Demand Satisfaction Constraints
- –
The sum of met and unmet demands equals total demand:
- –
Total demand at time t:
- –
The sum of demands that cannot be met at time t:
- –
Defining demands as randomly varying according to a normal distribution at t = 1:
- –
Defining demands as randomly varying according to a normal distribution and unmet demand from previous t while t > 1:
- 2.
Station Activation and Capacity Constraints
- –
No service can be received from a station that is not open:
- –
At time t = 1, the station at location i cannot meet more demand than capacity:
- –
The covered demand cannot be greater than the station capacities:
- –
Calculation of station capacities at time t = 1:
- –
Calculation of station capacity when t is greater than 1:
- –
The capacity of stations that are not opened cannot be calculated:
- –
Maximum capacity limit:
- 3.
Fulfilled Demand Constraints
- –
The total amount of demand satisfied at station i at time t:
- –
Total demand met at time t:
- 4.
Service Time Constraints
- –
Calculating the total service time of the station at location i at time t:
- –
Calculation of total service times at time t:
- 5.
Idle Time Constraints
- –
Calculating idle time when t > 1:
- –
Calculating idle time when t=1:
- 6.
Residual Demand (Ext) Constraints
- –
Calculation of residual times for cases where the service time is greater than 1:
- –
Calculation of residual times for cases where the service time is less than or equal to 1:
- 7.
Non-Negativity Constraints
- –
Variable y must be greater or equal than “0”:
- –
Initial capacities must be greater or equal than “0”:
- –
Variable f must be greater or equal than “0”:
- –
Residual values cannot be less than “0”:
- –
The randomly generated demand amount cannot be less than “0”:
- –
Service times cannot be less than “0”:
- –
Demand quantities cannot be less than “0”:
- –
Station capacities at location i at time t are greater or equal than “0”:
- –
Idle time cannot be less than “0”:
Real-world problems often have a non-linear and complex structure. MINLP models directly model these non-linear relationships and constraints, increasing the accuracy and precision of the solution. Our mathematical model is formulated as a MINLP problem. In this way, the results obtained are more applicable and effective in practice. By integrating non-linear relationships with integer variables, the system’s behavior is modeled more realistically. The combination of non-linear relationships and integer variables expands the solution space and potentially allows better solutions to be found. This is an important advantage, especially in complex and multi-objective problems.
This model provides a comprehensive framework for optimizing the multi-directional optimization of EV charging stations, taking into account various cost factors and operational considerations. The model provides a balance of the trade-offs between unmet demand, EV waiting times, and charging station idle times with equations of constraints and objective functions. Also, the model prioritizes these conflicting objectives with parameter values which are changeable for the decision-maker.
Additionally, the mathematical model is created for axes, city districts, highways, and all kind of regions. If correct data is provided, the distances between demand points and station alternatives, demands, and service times can be arranged by the user for the application area being studied, and thus the created mathematical model can be operated in the desired region. This ensures that the mathematical model has versatile use and is suitable to easily modify for a desired city or country regardless of both seasonal and daily fluctuations in EV charging demand and the rise in electric vehicle numbers over the next years or decades.
Genetic Algorithm
The genetic algorithm (GA) is probably the most widely used evolutionary algorithm among metaheuristic algorithms. Many popular optimization problems can be solved using genetic algorithms [
46]. However, genetic algorithms are population-based [
47] and most modern evolutionary algorithms are directly based on genetic algorithms or have strong similarities [
48]. Genetic algorithms are a class of stochastic algorithms that are well suited to large-scale applications [
49]. They are widely used in solving scalable constrained and unconstrained single- and multi-objective optimization problems [
50]. Genetic algorithms are powerful tools for solving complex optimization and search problems. By mimicking the evolutionary processes of natural selection and genetics, they can explore large and complex solution spaces to find high-quality solutions that may be difficult to obtain with traditional methods.
In this study, the need for the use of metaheuristic algorithms arose when the mathematical model created for the multi-objective optimization of electric vehicle charging stations could not provide a deterministic solution in cases where the problem grew too large. At this point, the genetic algorithm was selected to be used in the solution of the mathematical model created because it can work with minimum problems in both large-scale problems and location planning problems [
51]. While the genetic algorithm was used to solve the mathematical model created, the genetic algorithm operators and populations were determined as follows.
In our genetic algorithm model, individuals in the population are represented by two components; x, a binary list representing whether a station is open or not, and k, a list representing the nonzero capacity assigned to each station that is open. The initial population is randomly generated using generate_x() and generate_k(x). Here, each station is assigned a zero or one for being open, and if open, a random capacity between one and the maximum capacity M is assigned. After the initial population is evaluated using the fitness function, the evolution process begins.
In each generation, individuals are selected using tournament selection. Here, a subset of individuals compete and the best are selected. This helps to balance exploration and exploitation. The selected individuals are then paired and can undergo crossover, where the x and k values are changed to give each gene a 50% chance of producing new offspring.
After crossover, with a specified mutation probability, individuals can undergo mutation, which randomly changes the on/off status of the stations and adjusts their capacities accordingly. After crossover and mutation, the fitness values of the modified individuals are re-evaluated and the new offspring replace the old population.
This cycle continues for a specified number of iterations. In this study, this number is set to 100. At the end of the process, the best individuals are selected according to the minimum fitness value, which represents the most efficient station configuration and capacity allocation, i.e., the minimum total cost.
4. Case Studies
In order to see the performance of the mathematical model created in both urban areas and large-scale situations, two different applications were made. The first of these was determined as the European side of Istanbul and the other as a randomly created area with 250 demand points and 250 station alternatives. In addition to the use of demands created with data from 2023 in the applications, demand data created using EMRA’s three different levels of electric vehicle number estimates for 2030 and 2035 were also used. In this way, it was observed whether the mathematical model created was inclusive not only for current demand but also for increasing demand. While the solution of the mathematical model was provided, as mentioned before, deterministic solutions could not be provided due to the excessive growth of the problem, and therefore, the use of the genetic algorithm from metaheuristic algorithms was deemed appropriate. The solution of the model created for both applications was provided with the genetic algorithm. The obtained results were subjected to necessary comparisons and sensitivity analyses were performed.
In the GAMS optimization software, a personal computer with a 12th Generation In-tel(R) Core(TM) i7-12700F, 2.10 GHz, 32.0 GB RAM was used to solve the mathematical model and deterministic solutions could be provided for very small problems. Since this study’s problem volume was too large, the problem could not be solved with this computer in the GAMS software version 46.2.0. For this reason, the model was revised for the use of genetic algo-rithms and solved in PyCharm version 2024.1.7 with different application areas and scenarios.
4.1. Urban Area Case Study—Istanbul’s European Side
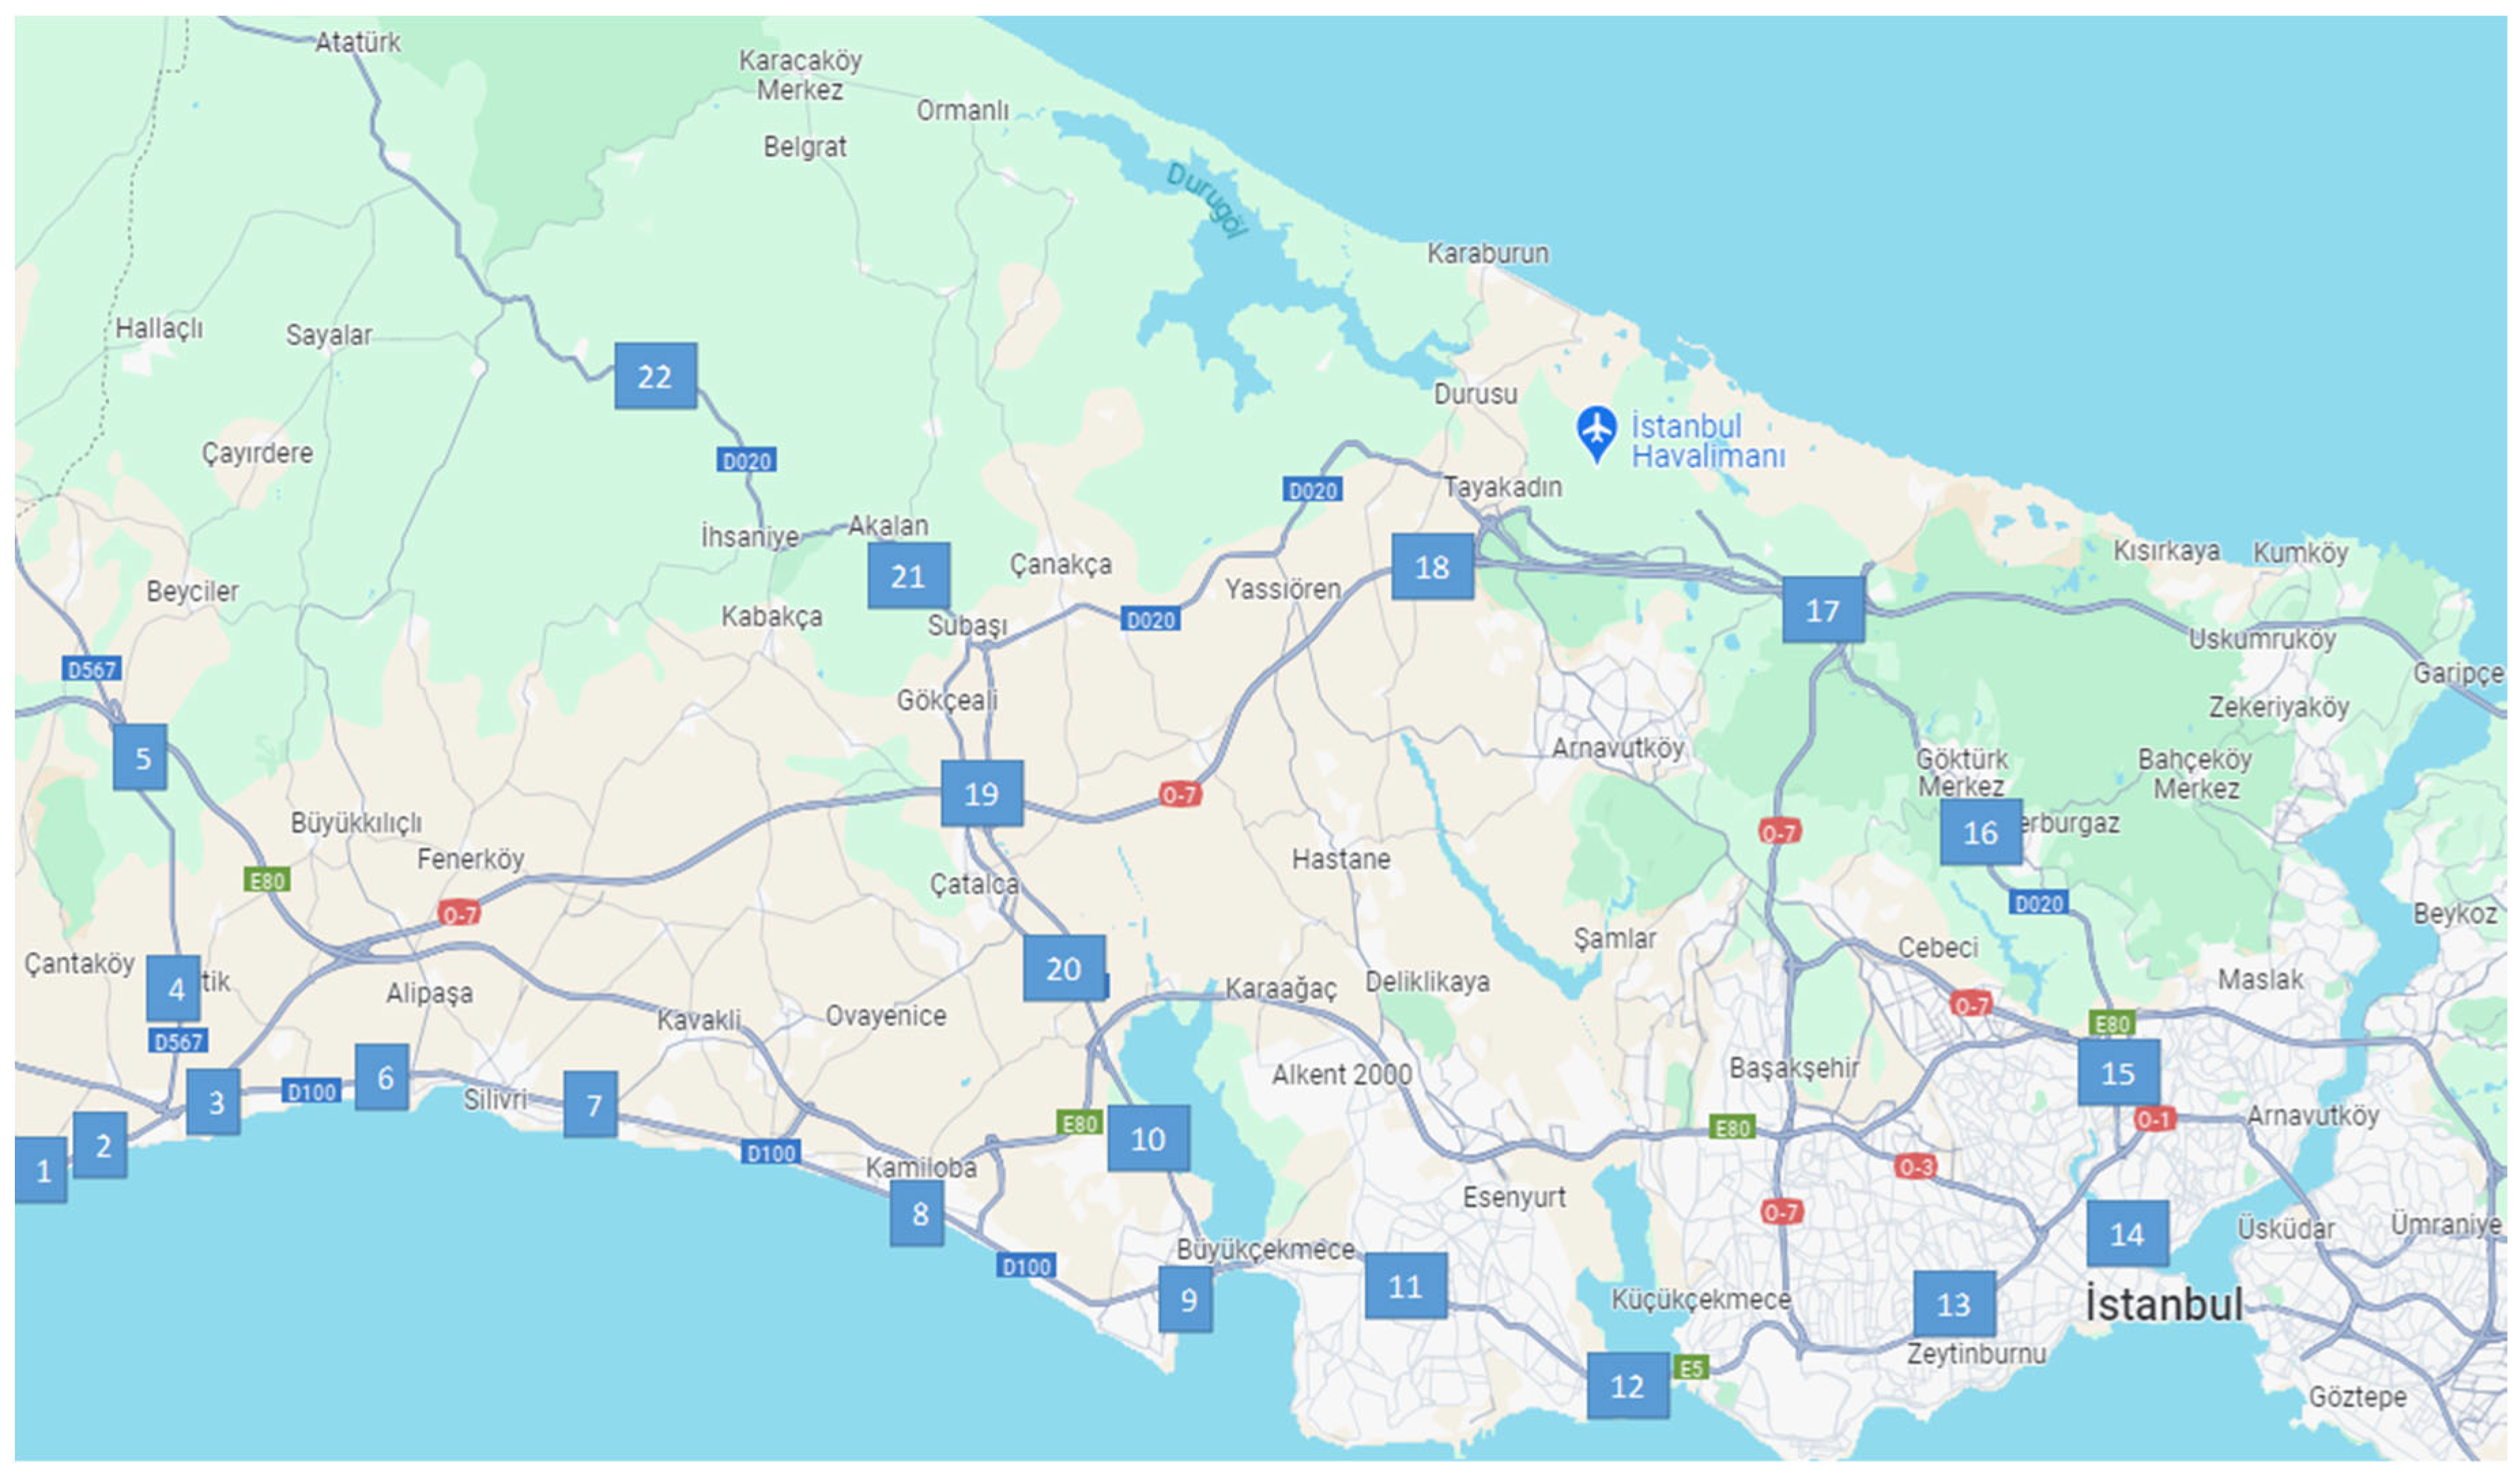
The first application area was determined as the European side of Istanbul in order to observe the urban performance of the mathematical model created. As explained in the data collection section, the vehicle crossing points on the volume map of the General Directorate of Highways were determined as demand points and also as charging station alternatives. The representation of these determined points on the map is given in
Figure 2.
The demands determined for these points according to the current and three different EV estimates of EMRA for the years 2030 and 2035 are presented in
Table S1 in the Supplementary Materials as combined for the years 2030 and 2035.
The determined demands were rounded and used as integers in the solution of the created mathematical model via PyCharm with the genetic algorithm.
4.1.1. Results Based on Current Demand
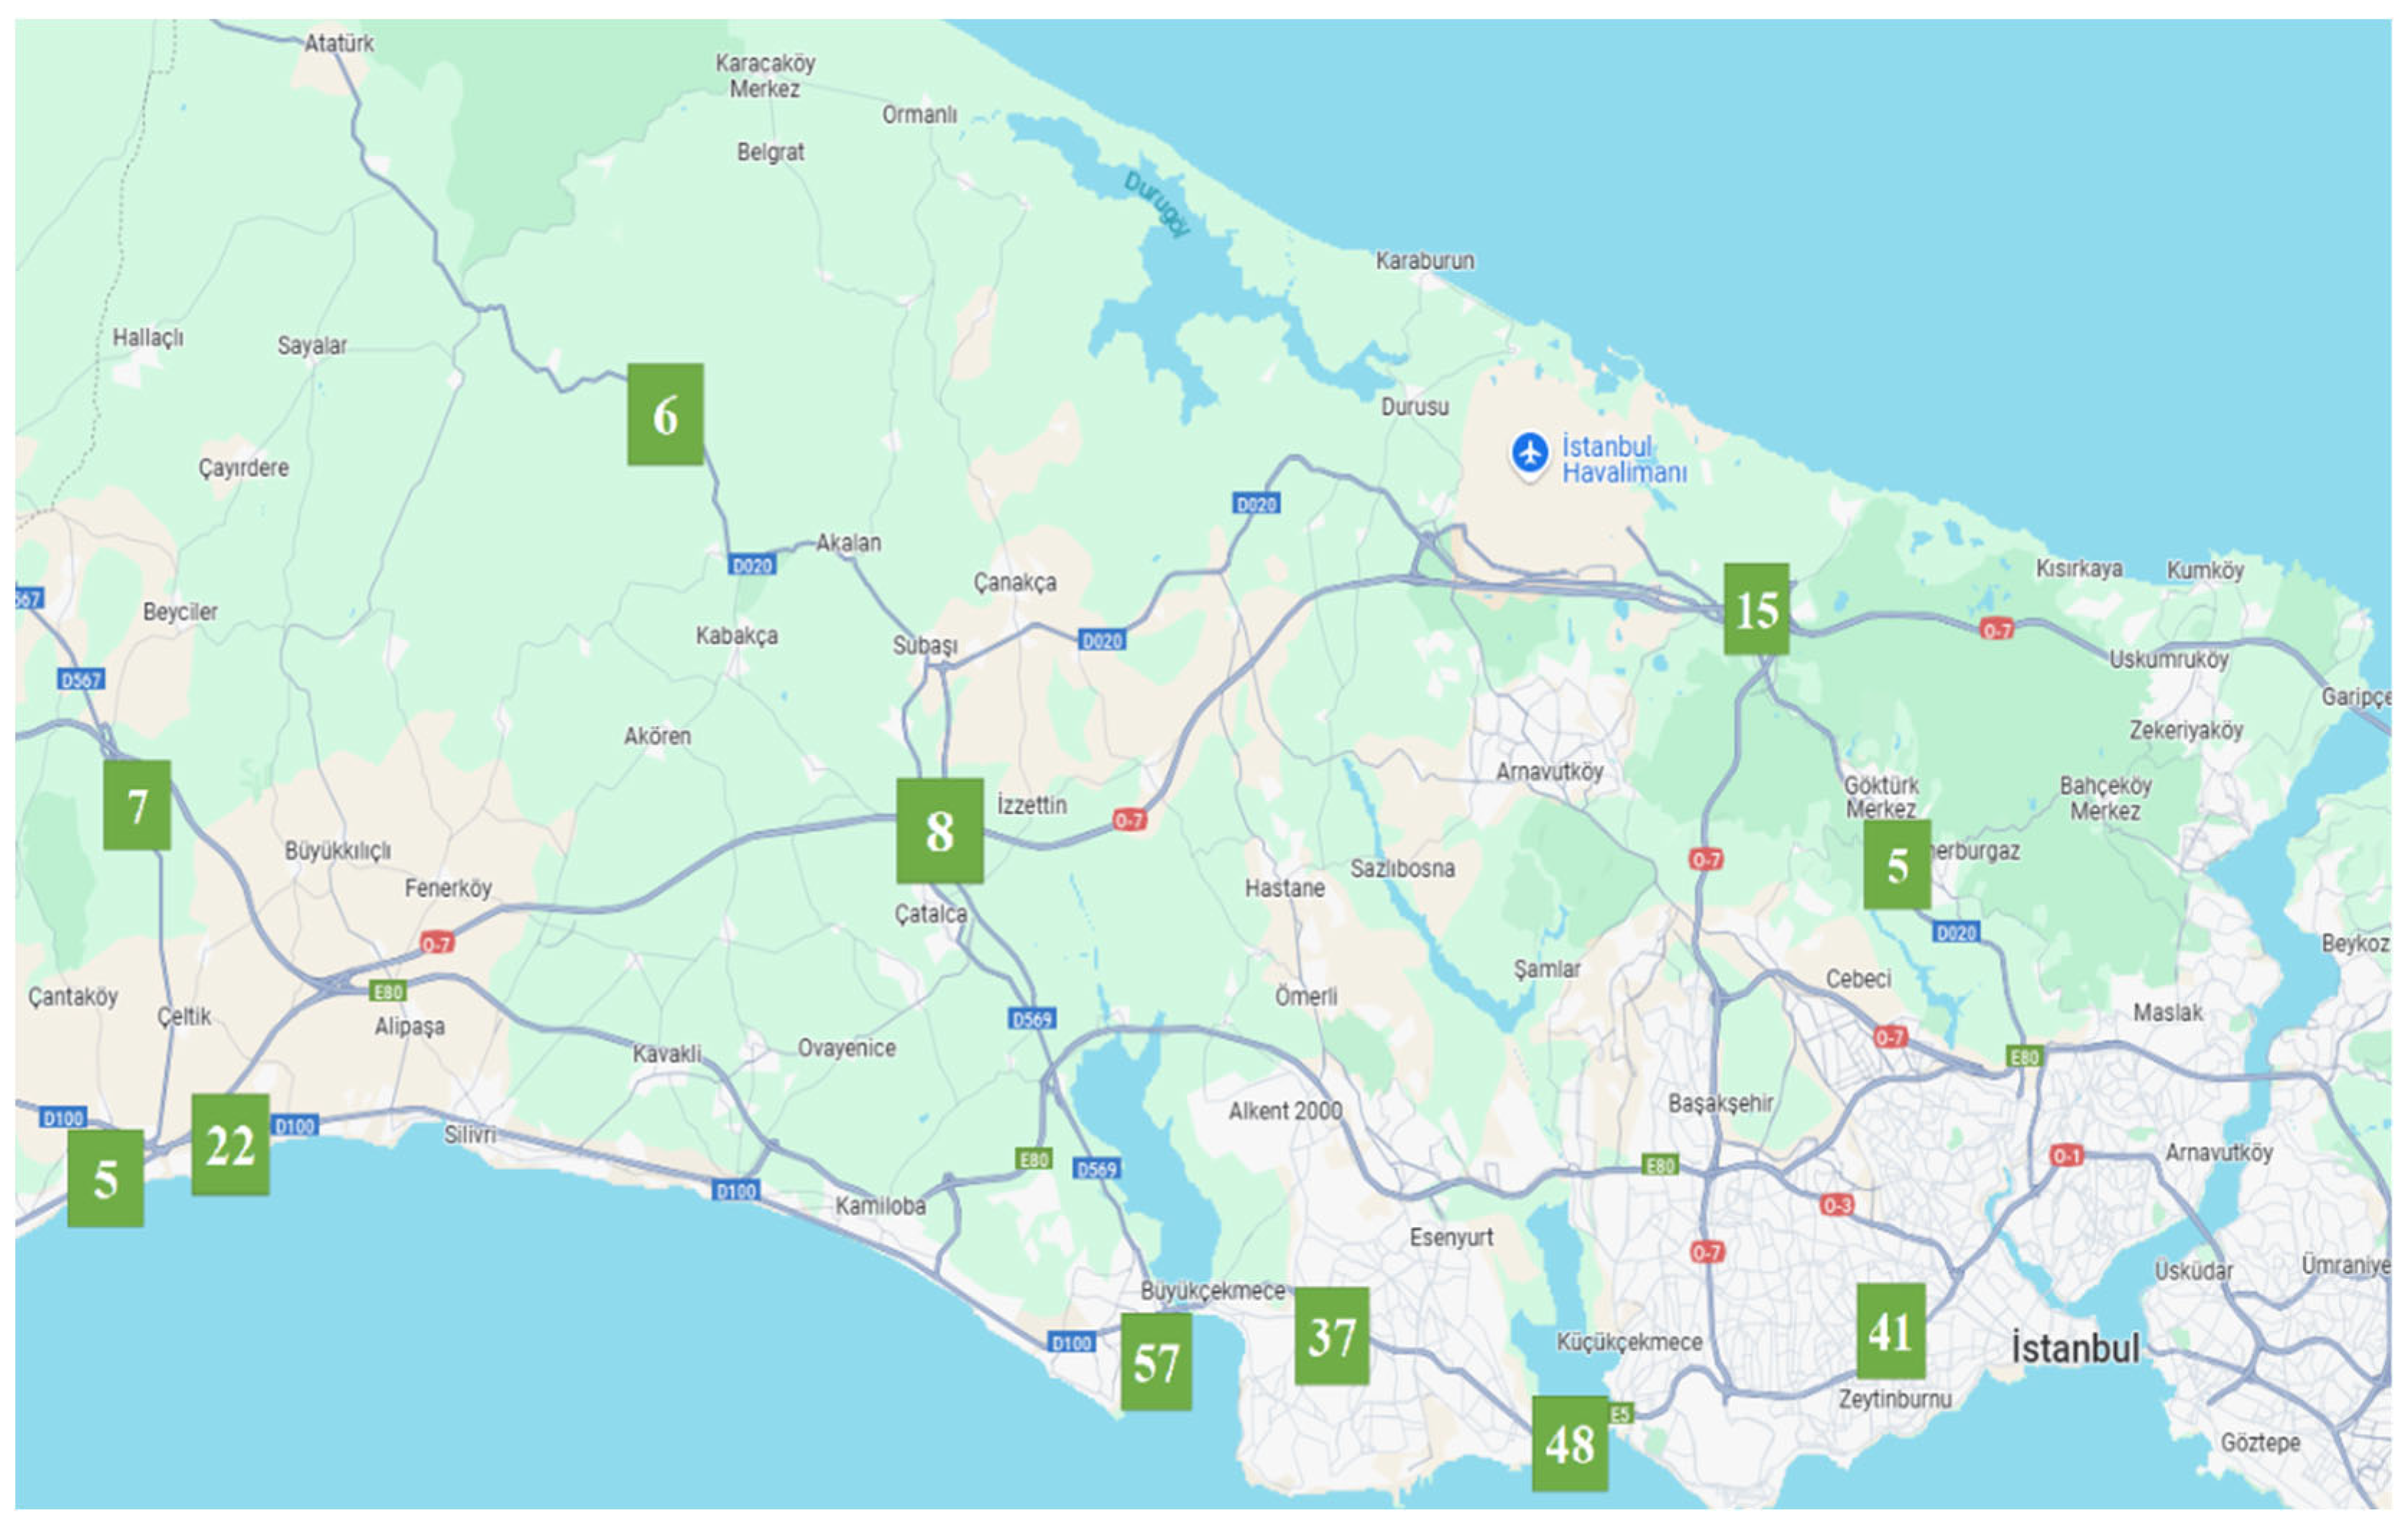
Using the estimated demands, the table below shows which locations were selected from the 22 charging station alternatives determined on the European side of Istanbul and the capacities of the selected alternatives in
Table 2.
Looking at the results, opening 11 charging stations with capacities of 5, 22, 7, 57, 37, 48, 41, 5, 15, 8, and 6, respectively, was sufficient to meet the demands while minimizing the cost. The location and capacity values given in the table are shown on the map below,
Figure 3.
Since the number of station alternatives is low considering the population and size of the European side of Istanbul, the outputs obtained as a result of the application show that the capacities of the opened charging stations are high.
4.1.2. Results Based on Future Demand Forecasts
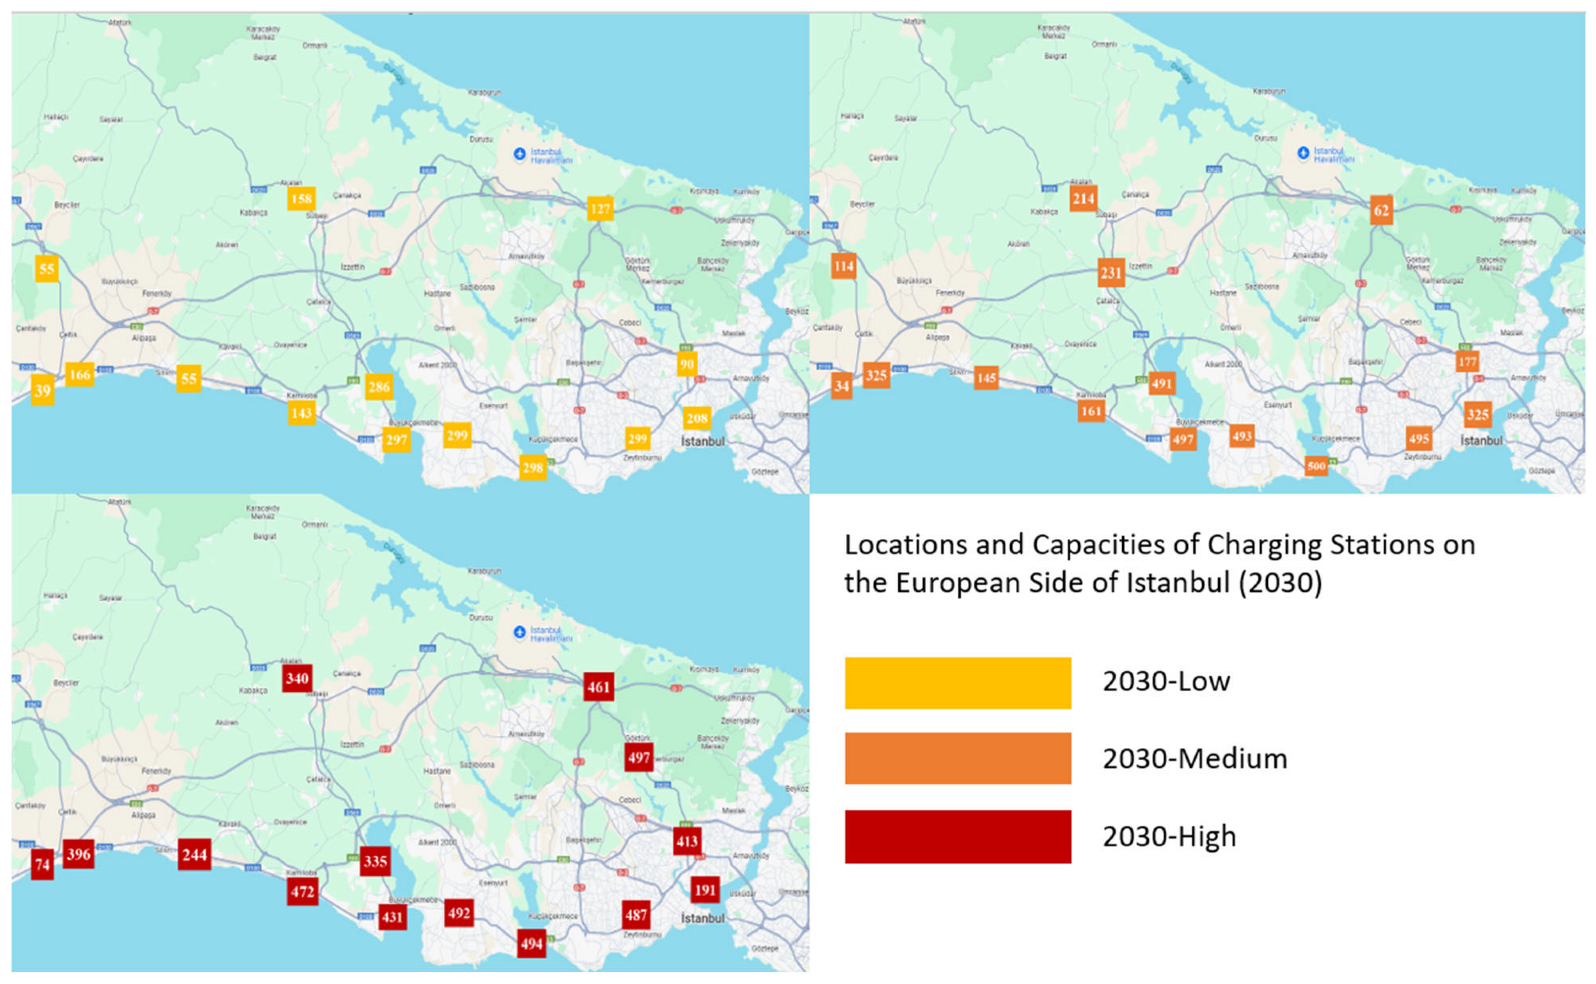
After solving the mathematical model according to current demands, the mathematical model created was solved with the genetic algorithm according to three different demand estimates, low, medium, and high, from EMRA’s estimates for 2030, and the results are shown
Table 3.
There is a significant increase in both the number of stations and their capacities. These results have occurred due to the high-demand growth forecast and, as expected, the demands are mostly met. The locations and capacities of the results obtained according to the low-, medium-, and high-demand forecasts for 2030 are shown on the maps
Figure 4.
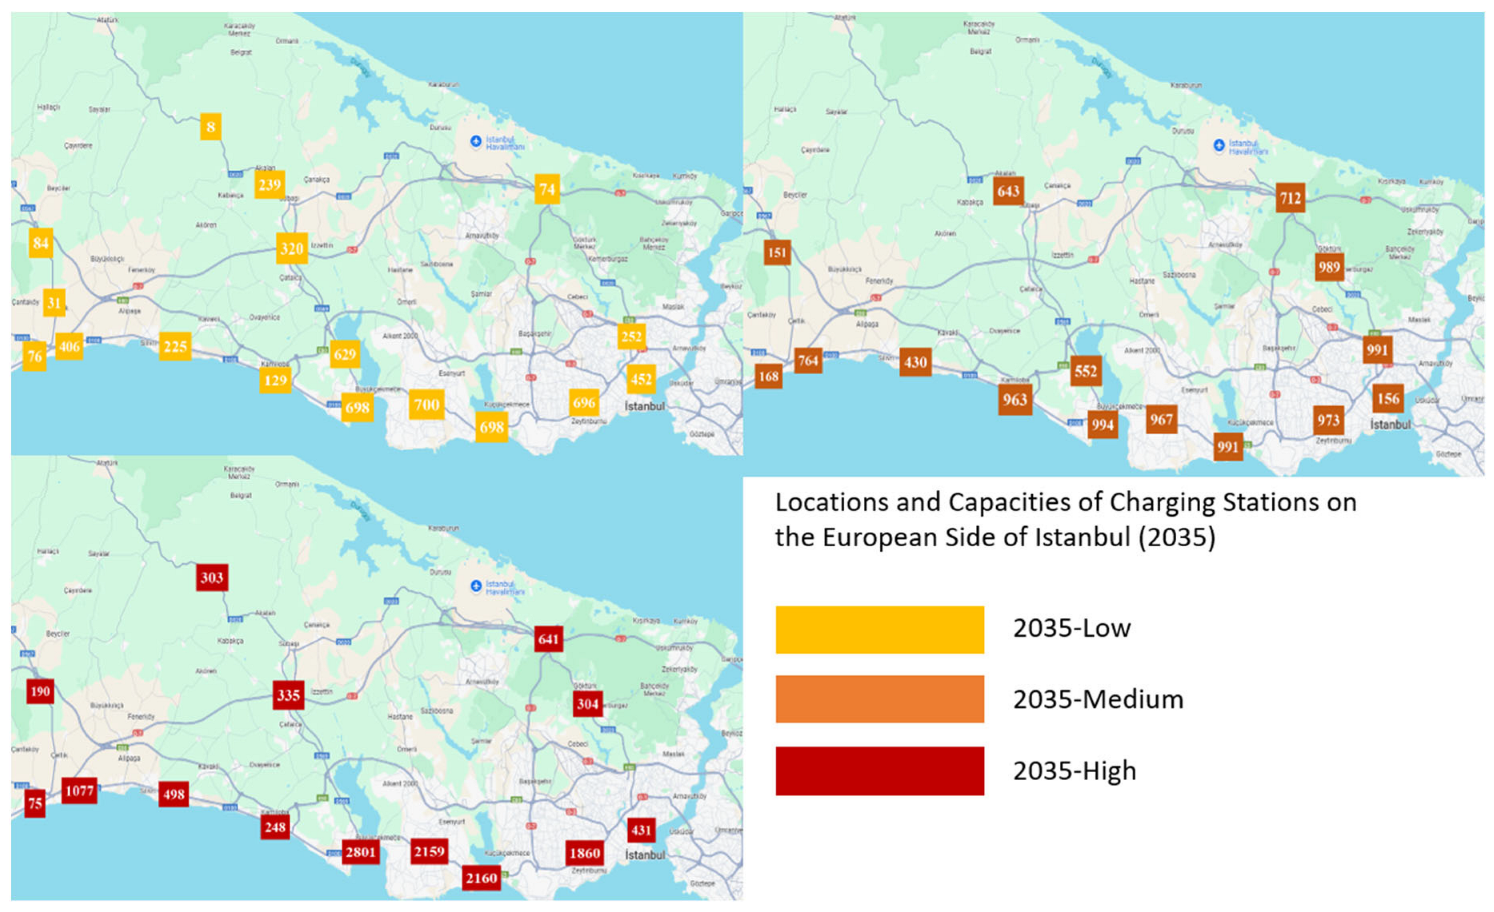
According to EMRA’s 2035 forecasts for three different demand estimates, low, medium, and high, the mathematical model was solved with the genetic algorithm, and the results are shown in
Table 4.
The locations and capacities of the results on the map for low-, medium-, and high-demand forecasts for 2035 are given in
Figure 5.
The capacity increase in previous demand increases is the same in the results solved with the 2035 demand estimates. The difference here is that the demand is at its highest level compared to previous years and, accordingly, the number of stations and capacities are at their highest level compared to previous years. Another reason for the capacities being so high is the previously mentioned low number of charging station alternatives. Since the number of alternatives is low, the model has determined the capacities as high in order to meet the demand. The fact that the number of alternatives is so low is due to the acceptance of the previously mentioned demand points and station alternatives according to the measurement points of the General Directorate of Highways.
Sensitivity analyses, efficiency analyses, and evaluation of the results were performed at the end of the Application Section.
4.2. Large-Scale Synthetic Case Study
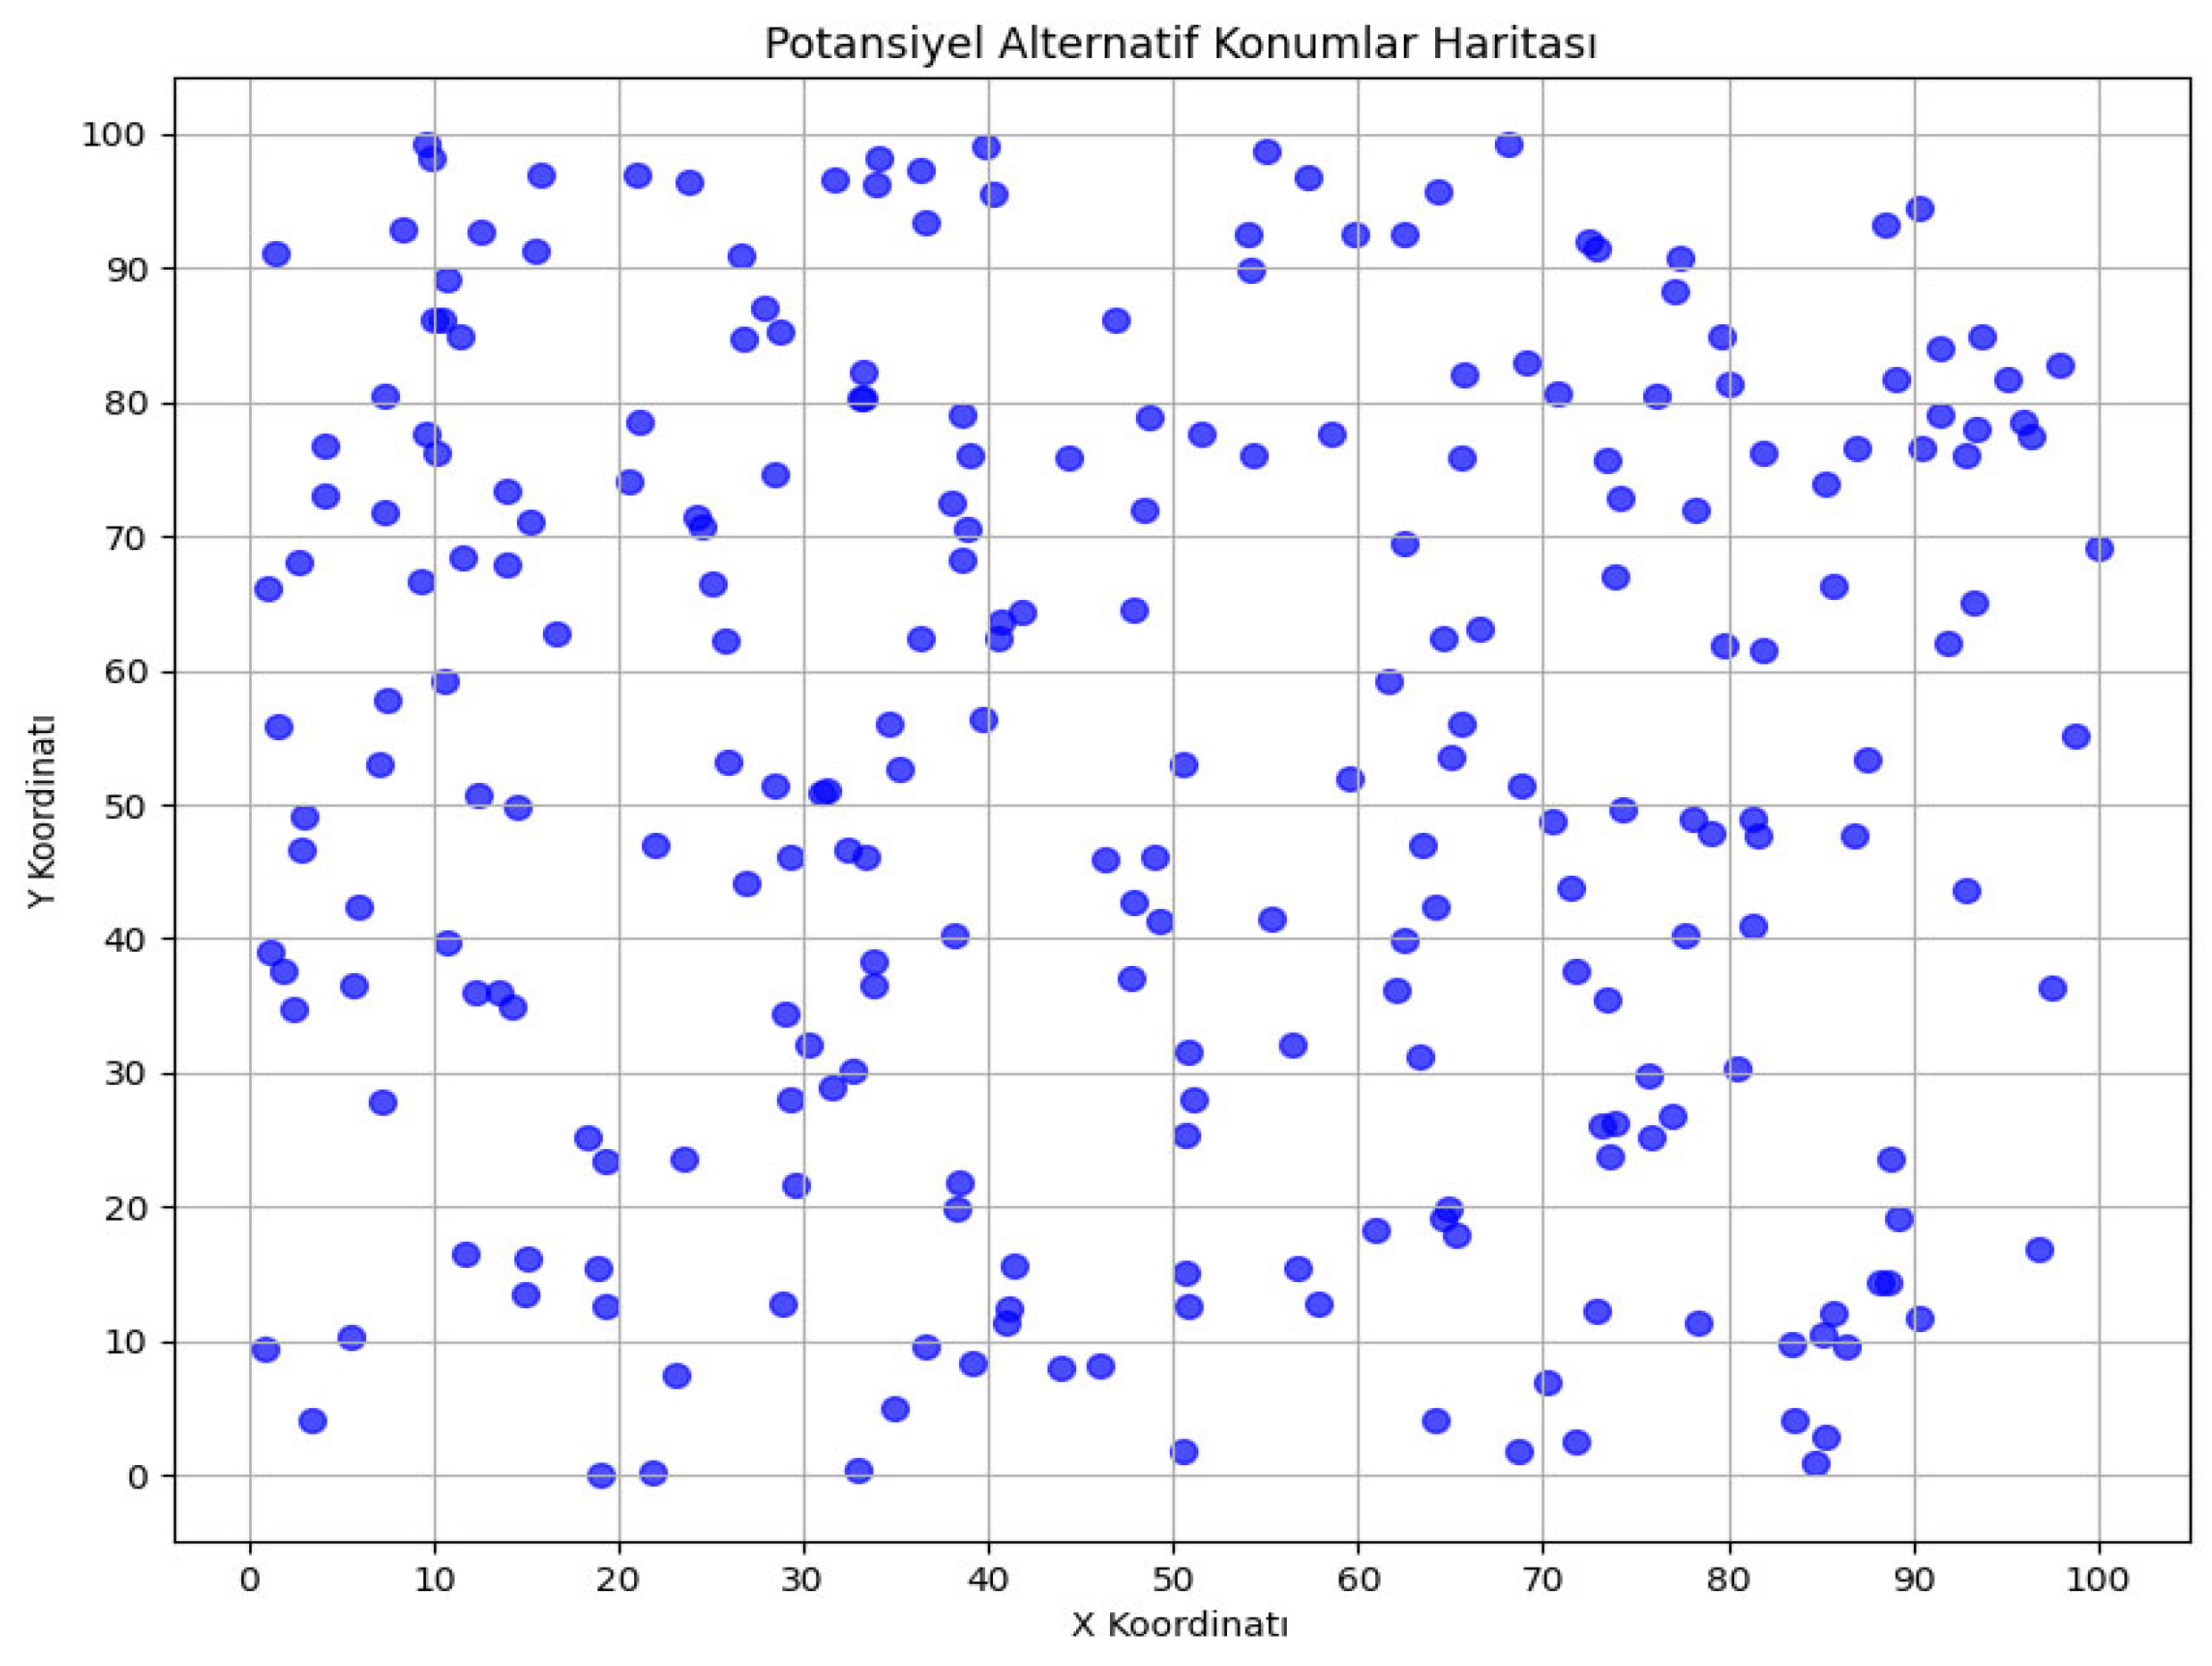
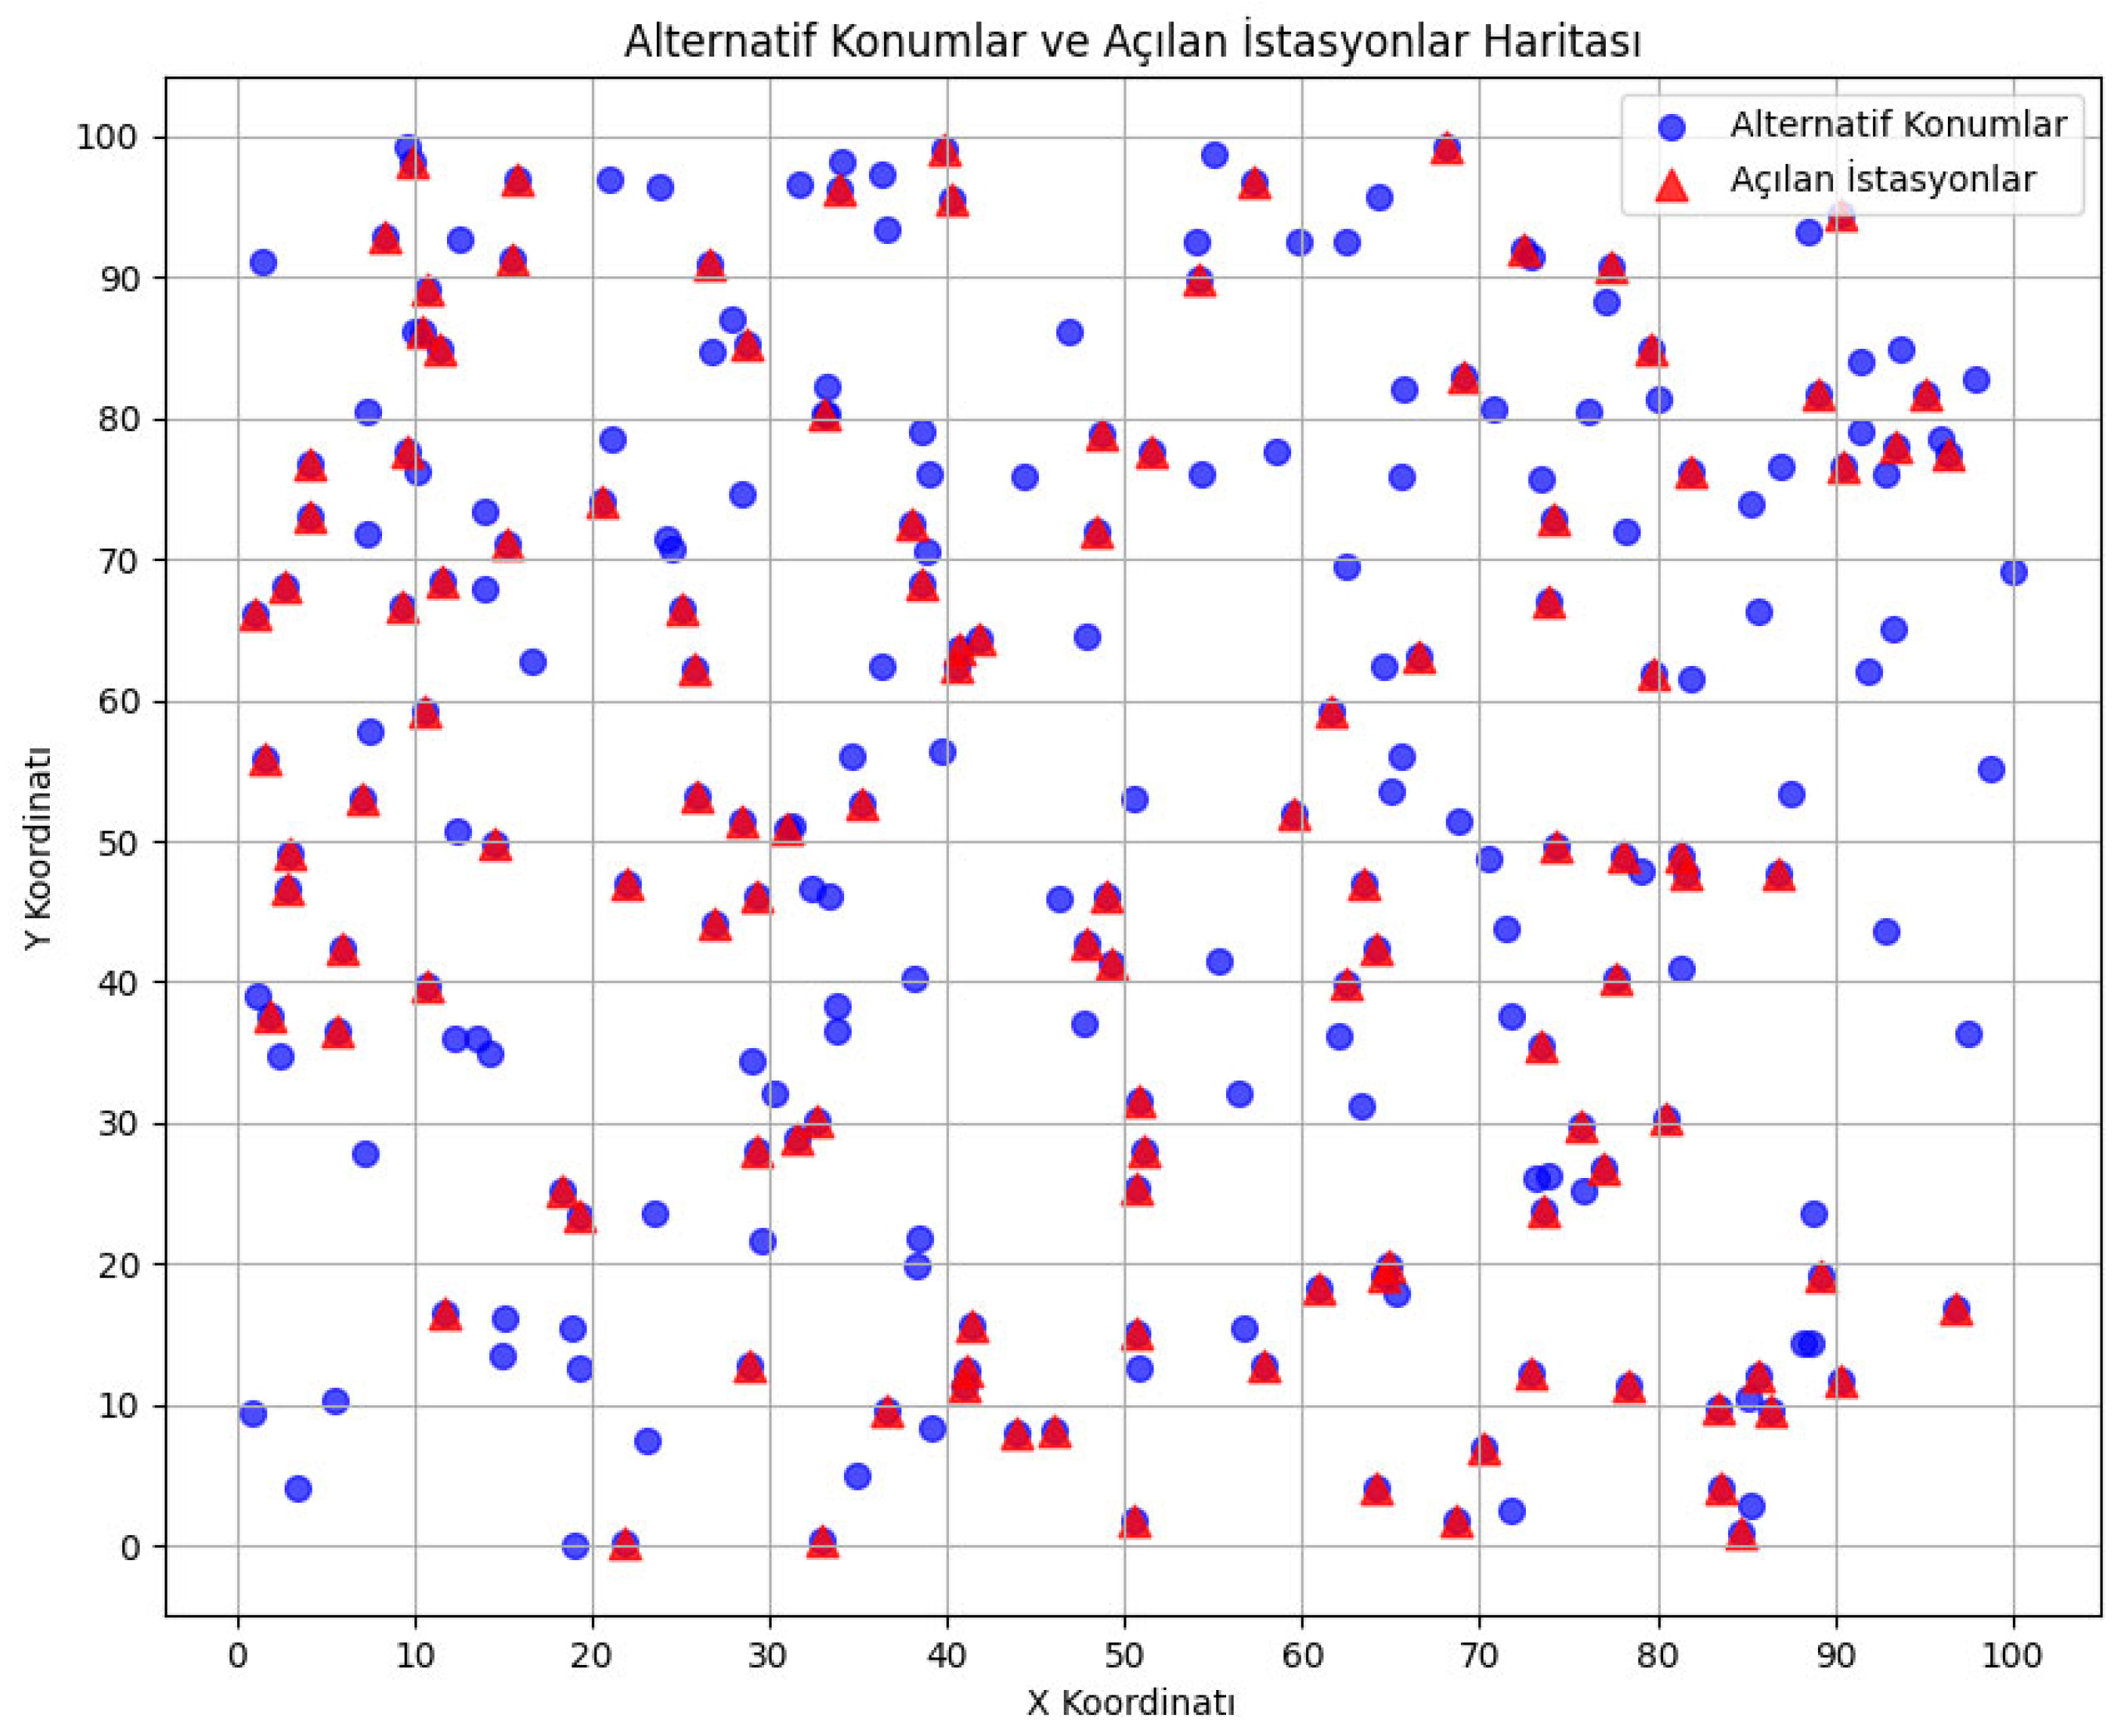
In this section, 250 demand points and 250 charging station alternatives were determined as explained in the Data Collection Section to determine how the mathematical model performed on larger-scale problems. The demand of each station alternative and the distances of the charging stations to each other were randomly generated within the specified limits. The determined demands were adapted to different forecast levels of 2030 and 2035, as in other applications, and each scenario was solved separately with the genetic algorithm.
The locations of the alternative stations created the demand densities at these locations, and the graphs showing which alternative locations the charging stations were opened in are given
Figure 6,
Figure 7 and
Figure 8, respectively.
Similarly, for the locations of alternative stations created according to EMRA’s low-, medium-, and high-level estimates for 2030 and 2035, the demand densities in these locations and the graphs showing which alternative locations’ charging stations are opened are readily available. However, since providing all of them here would lead to unnecessary crowding, these graphs are not presented in this article.
4.3. Sensitivity Analysis
The reliability and validity of any optimization model heavily depend on the careful selection of its parameters because these parameters directly influence the quality and realism of the results. The key parameters used in the model were carefully selected by taking into real-world data, the relevant literature, and user preferences. Some parameters were determined by comparing them to each other based on real data. For instance, the ratios of installation cost and operational cost were used as they would be in real life. Furthermore, some parameters were determined based on user preferences. For example, the penalty coefficient for unmet demand was kept high because it was undesirable for decision-makers. However, a similar increase in idle time was not desired, so a balance was struck between the two. In addition to the sensitivity analysis, the appropriateness of these parameters is demonstrated in this section.
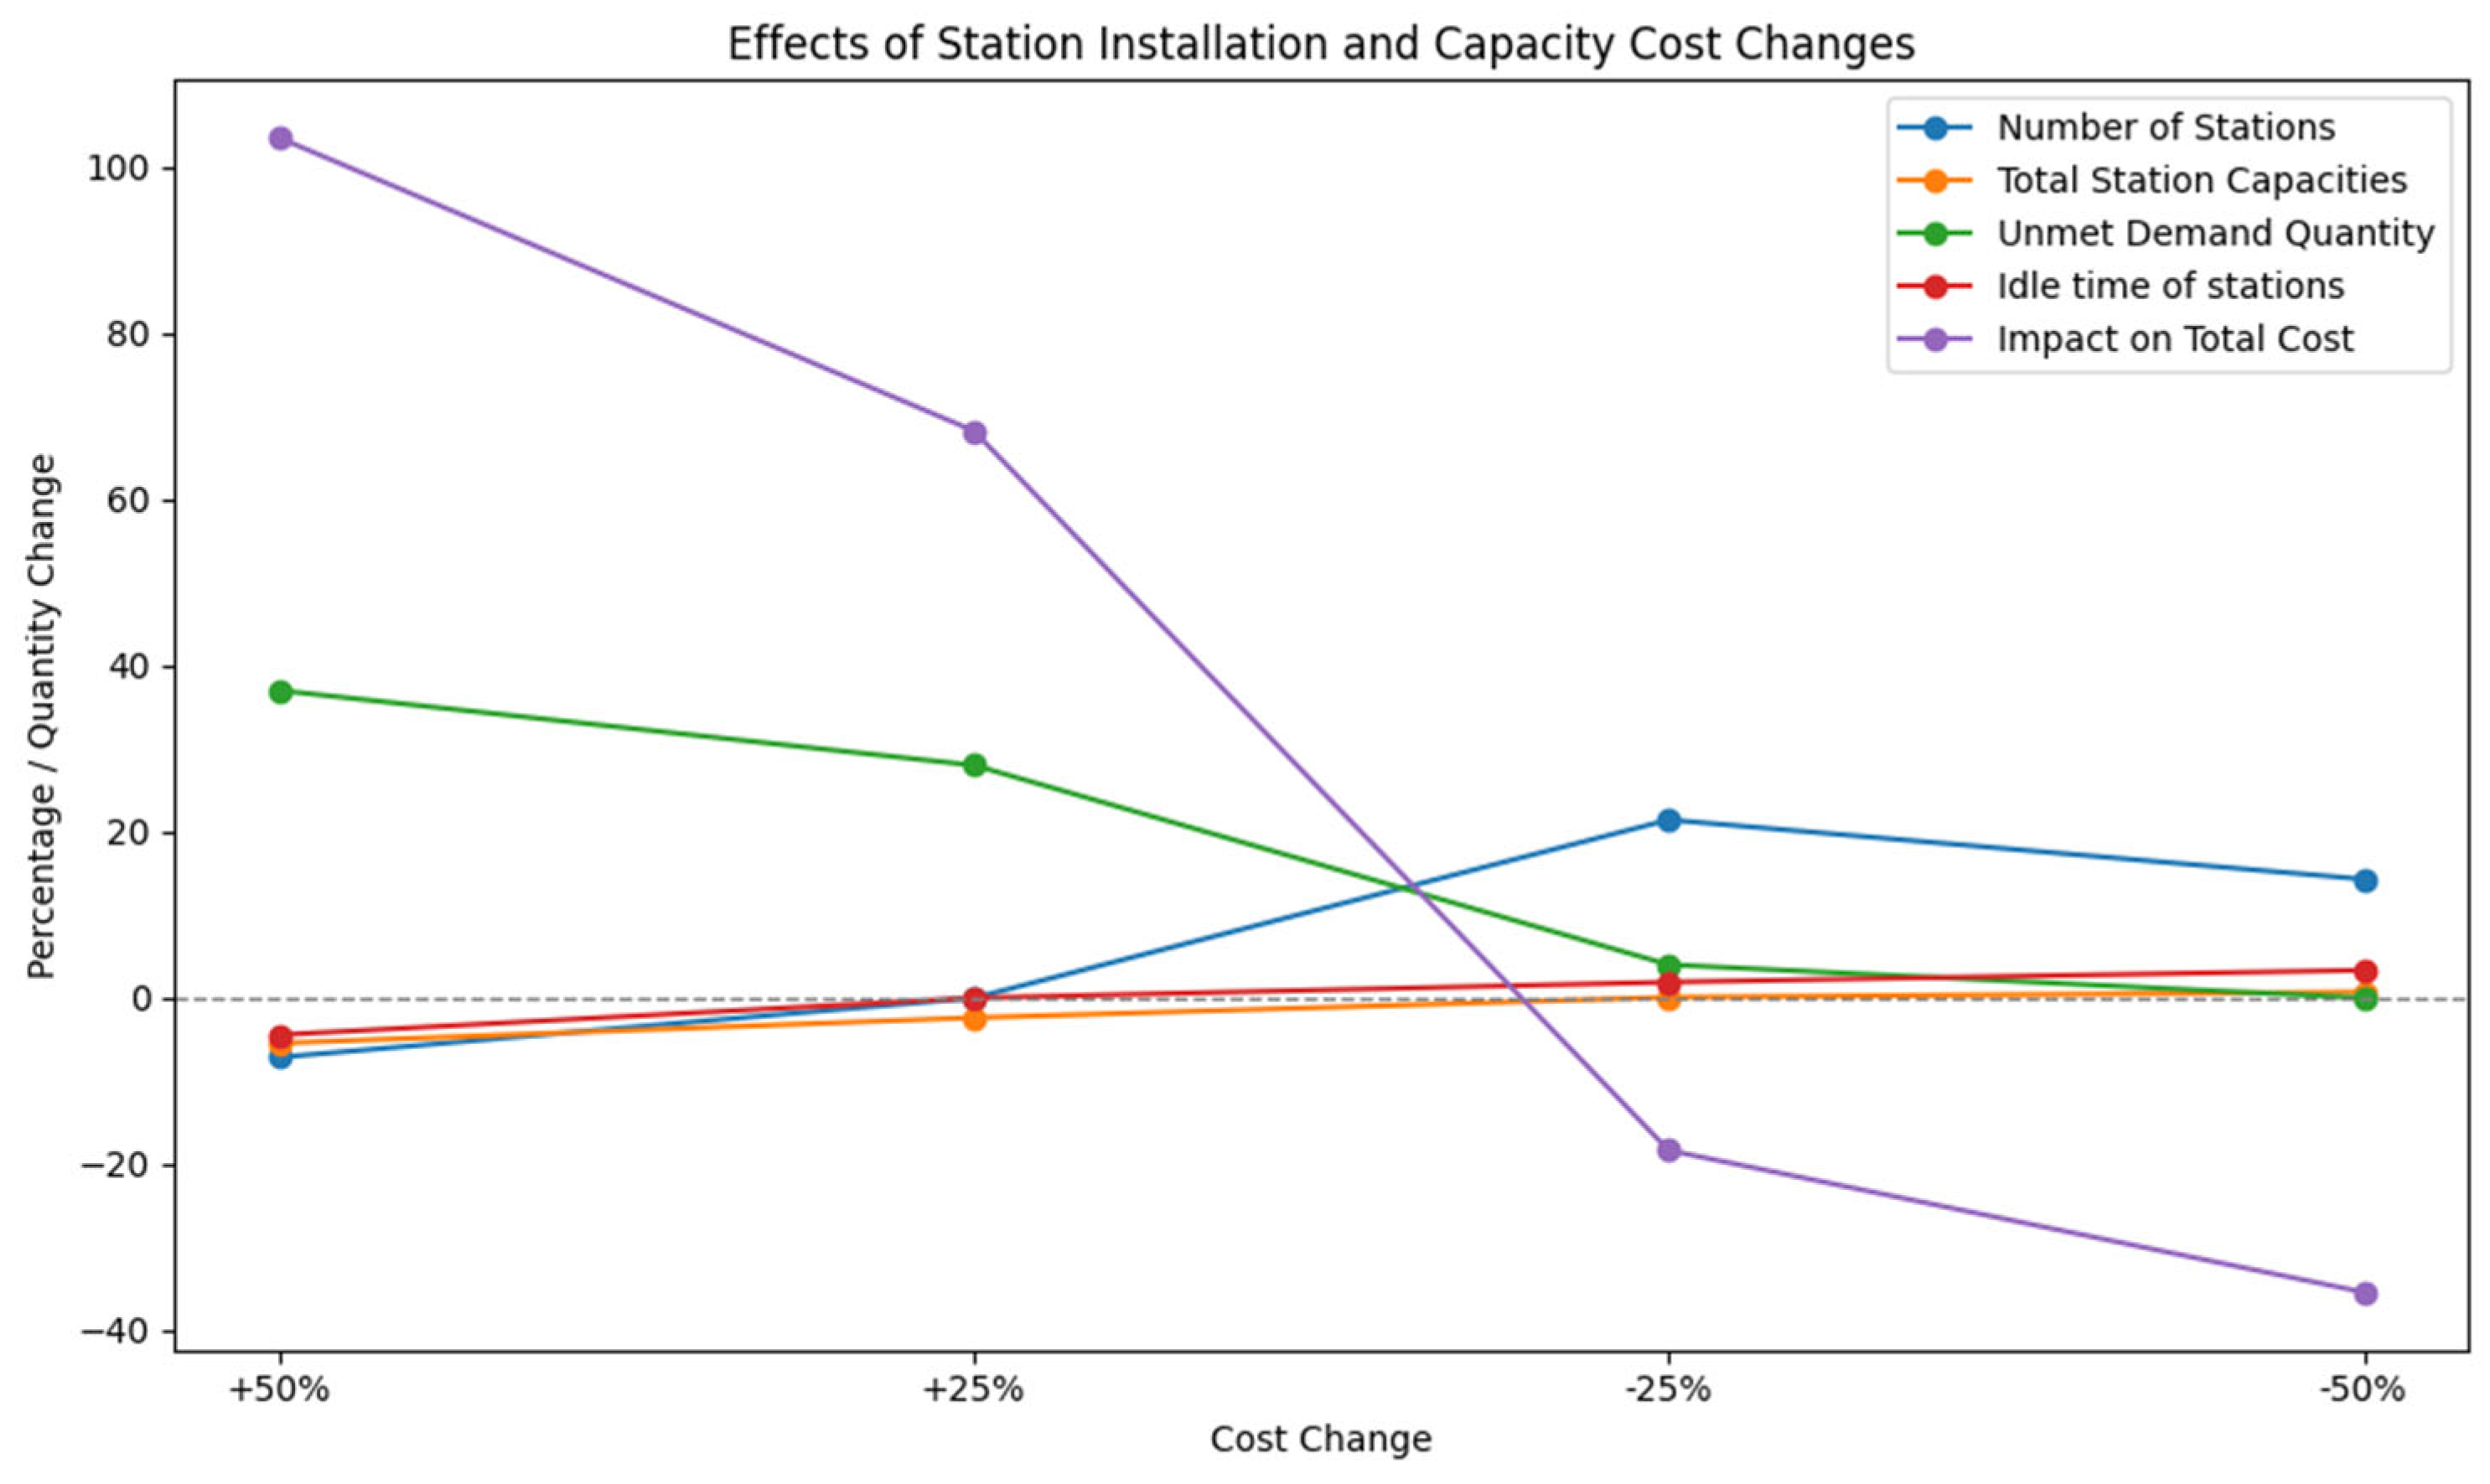
For the sensitivity analysis of the solutions implemented using the genetic algorithm, the low-level scenario for the European side of Istanbul in 2030 was determined. The sensitivity analysis table created based on the parameters and change rates determined for the analysis is shown in
Table 5.
According to the sensitivity analysis results, reducing station installation costs increases the number of stations opened while reducing the total cost. On the other hand, increasing station installation costs reduces the number of stations opened while increasing the amount of unmet demand and total cost. Apart from this, the change in station installation costs did not affect the total station capacities and the amount of station vacancy. Effects of station installation and capacity cost changes are shown in
Figure 9.
The increase in the unmet demand penalty coefficient did not have much effect in general because the amount of unmet demand was already zero. However, when the unmet demand penalty coefficient was reduced, it was seen that the amount of unmet demand increased considerably but the total cost changed slightly. Effects of unmet demand penalty changes are shown in
Figure 10.
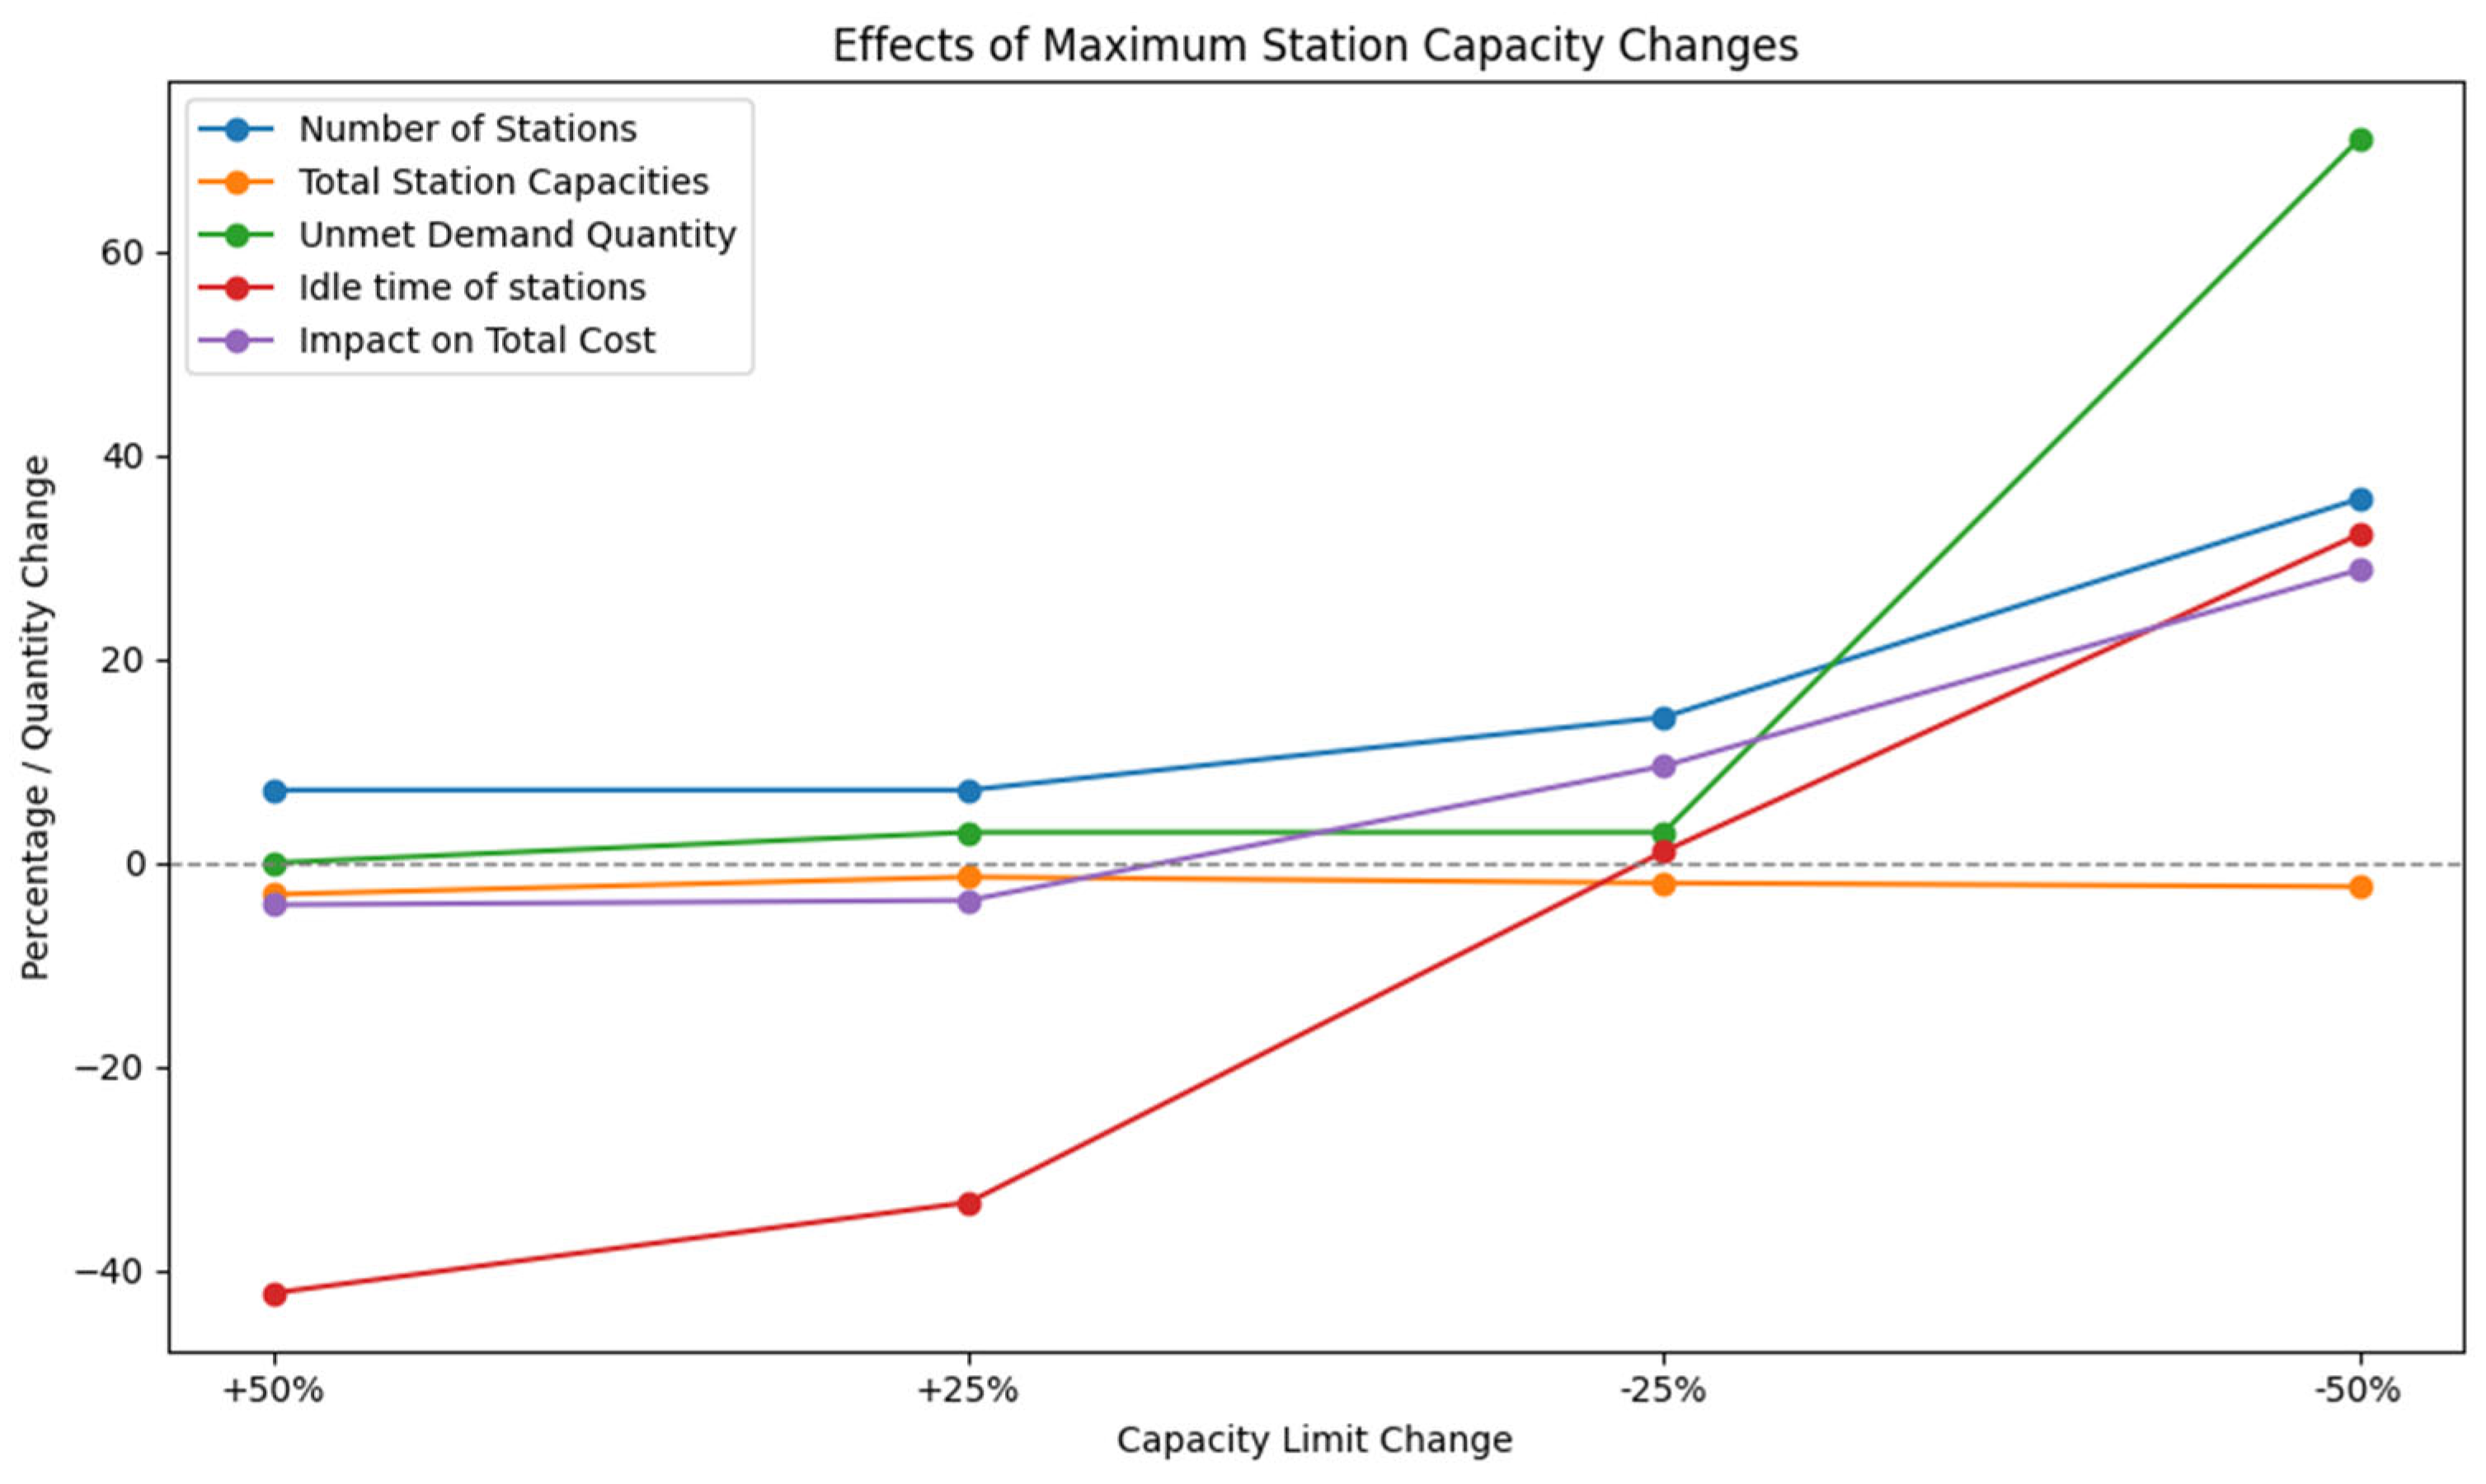
The decrease in maximum station capacity increased the number of opened stations as expected because the total capacity must remain at a certain level in order to meet the demand. However, when the maximum station capacity is reduced by 50%, it is observed that the amount of unmet demand increases significantly. Accordingly, the total cost also increases. Although these capacity changes seem to affect the percentage of the station vacancy rate, in fact, since the vacancy rates are very low, these percentage changes are not very important. Effects of maximum station capacity changes are shown in
Figure 11.
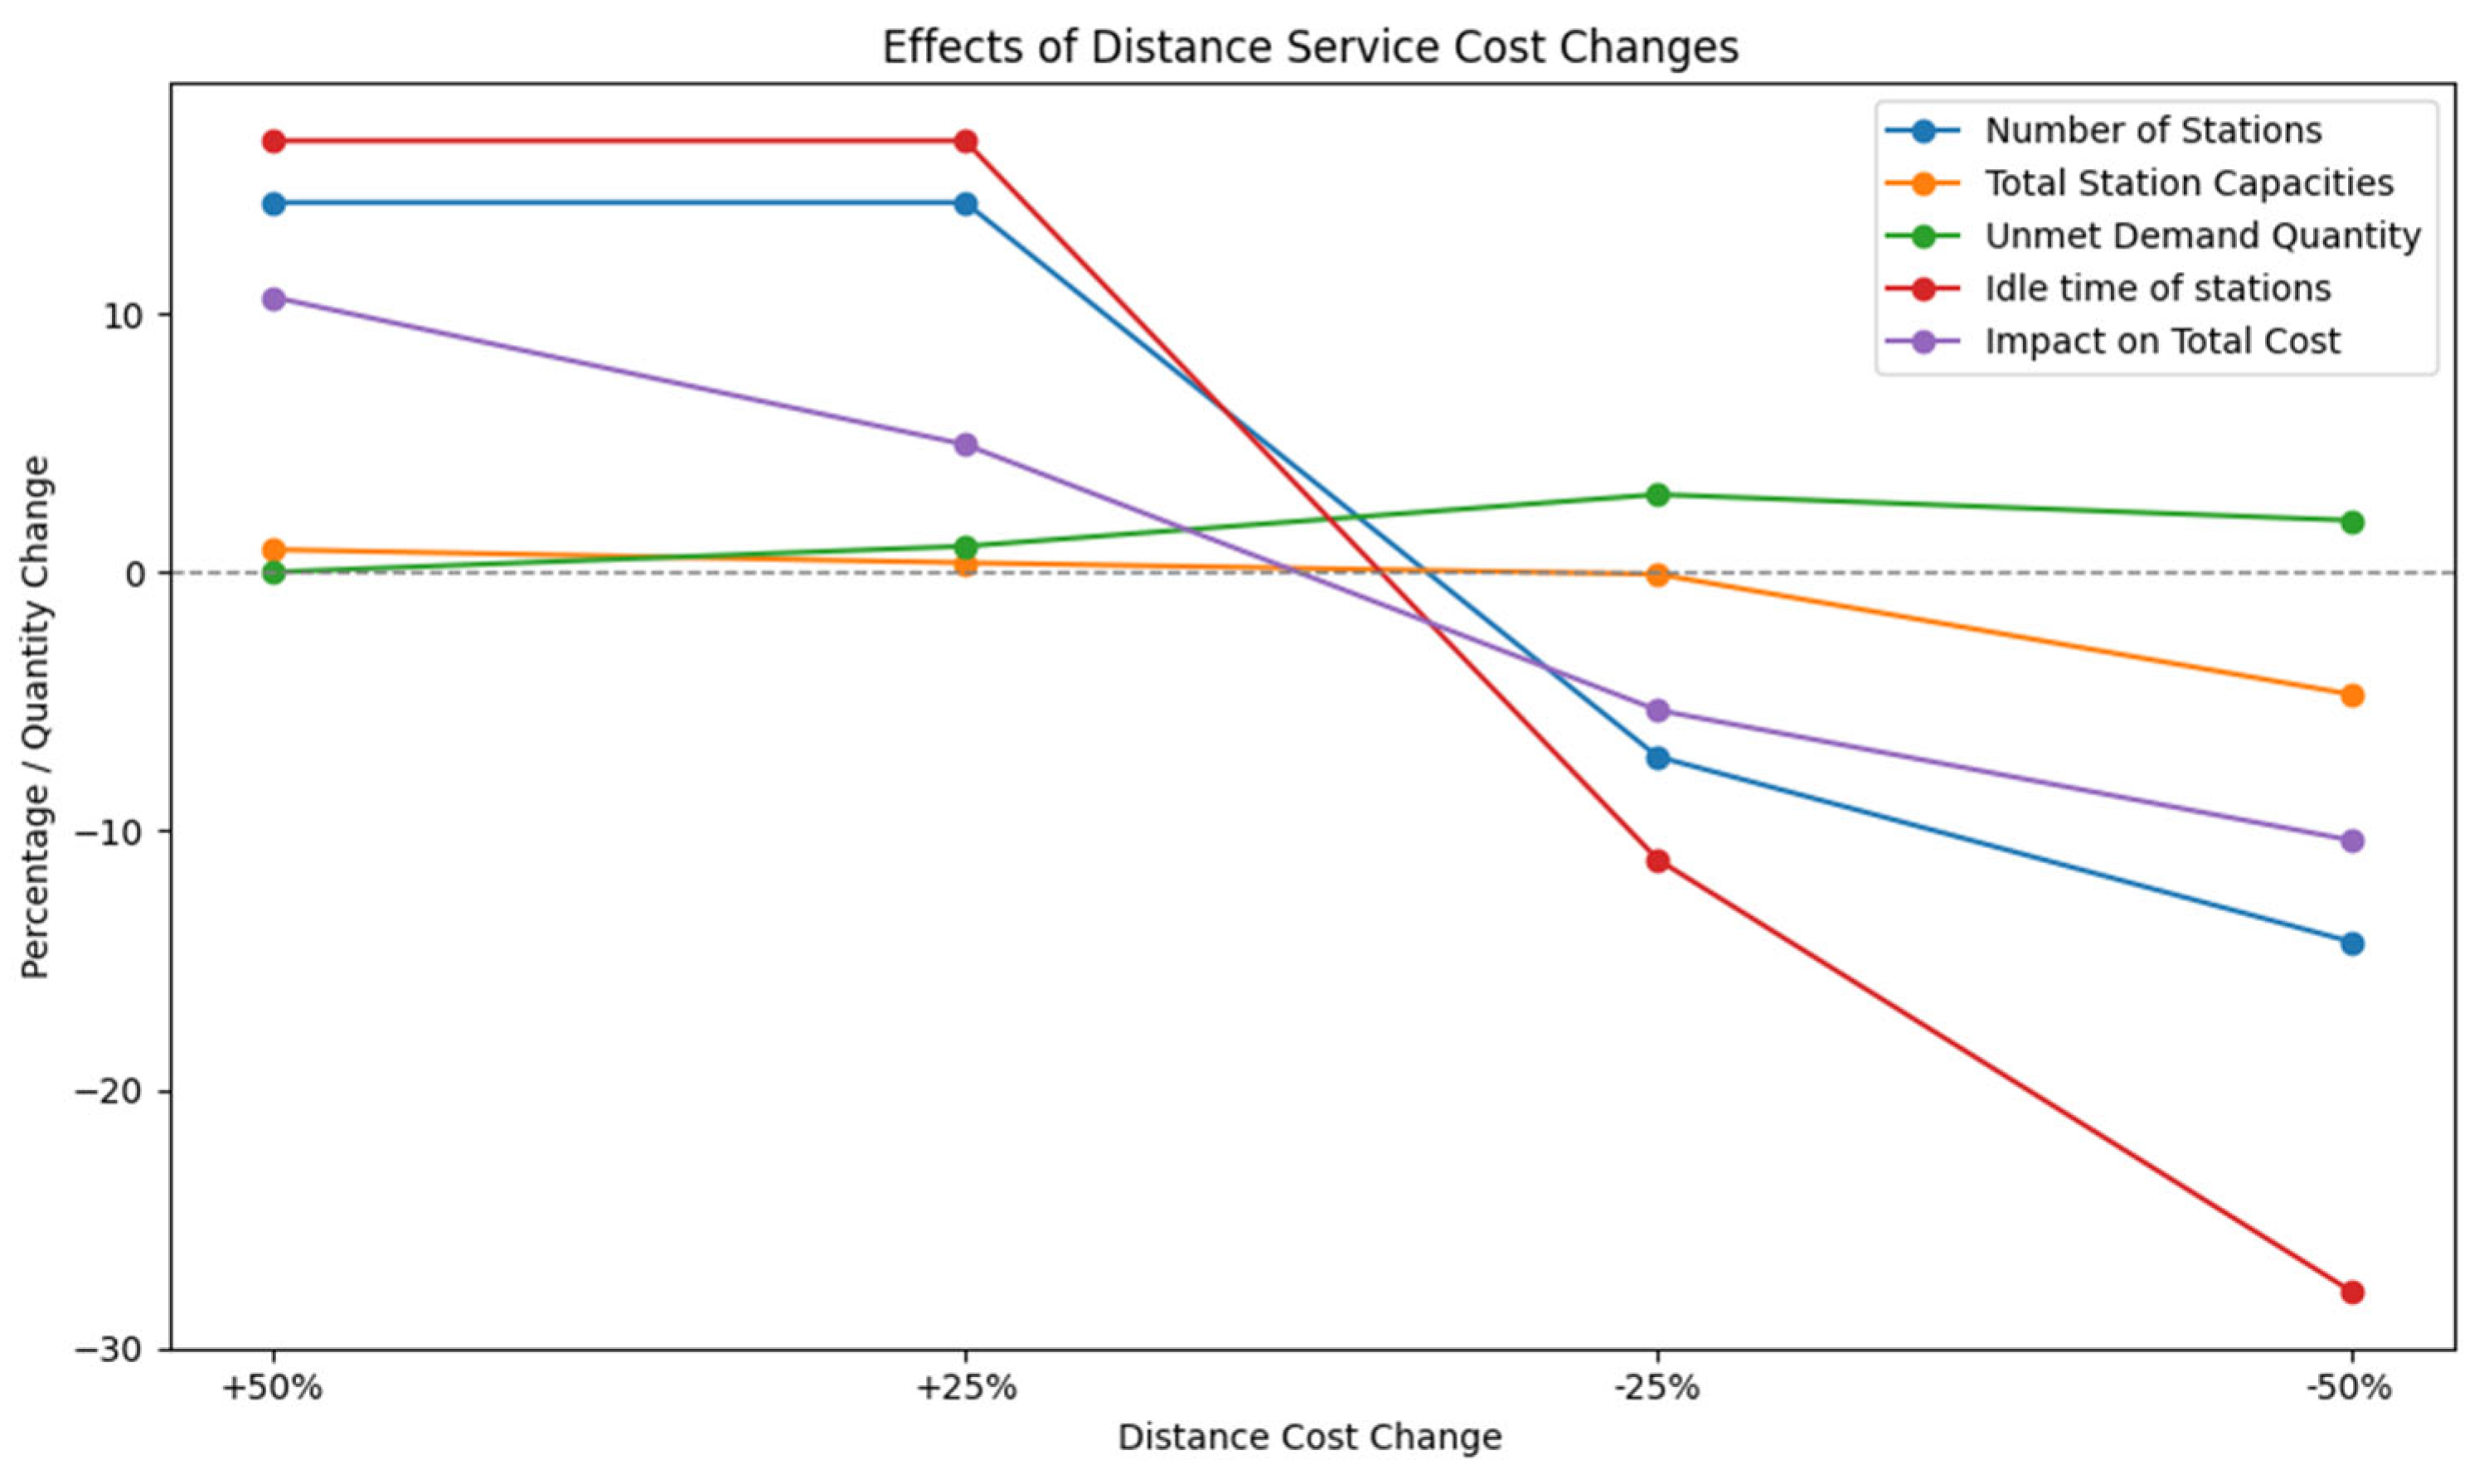
Finally, it was observed that the change in distance service costs progressed parallel to the number of stations opened. When the distance service cost was increased, the number of stations increased because it would be costly to provide service to distant locations. Similarly, the number of stations decreased because it would be easier to provide service to distant locations by reducing the distance service costs. The total cost increased and decreased depending on the increase and decrease in the number of stations. Apart from these, the effect of the change in distance service cost on other variables remained insignificant. Effects of distance service cost changes are shown in
Figure 12.
It can be said that the mathematical model, which was solved using the genetic algorithm with the sensitivity analyses performed, works consistently and its parameters are determined to meet the incoming demand while minimizing the total cost.
Compared to classical linear or integer programming-based models, our MINLP framework, solved with a genetic algorithm can reflect threshold dynamics in a more complex and realistic way. In particular, small changes in parameters such as demand levels, installation costs, or capacity limits can lead to changes in the number of stations, their locations, or the amount of unmet demand. This is due to the combinatorial and non-linear nature of the problem, which typically creates solution spaces containing numerous local optima. Metaheuristic methods such as genetic algorithms allow for more effective exploration in these complex solution spaces, where classical deterministic approaches are limited.
4.4. Evaluation of the Mathematical Model
In order to understand the success of the mathematical model created, two important indicators were examined in the results. The first of these is the idle times or occupancy rates of the EV charging stations established according to the results, and the other is the efficiency rates. At this point, the less time spent idle, the better it is considered for the model.
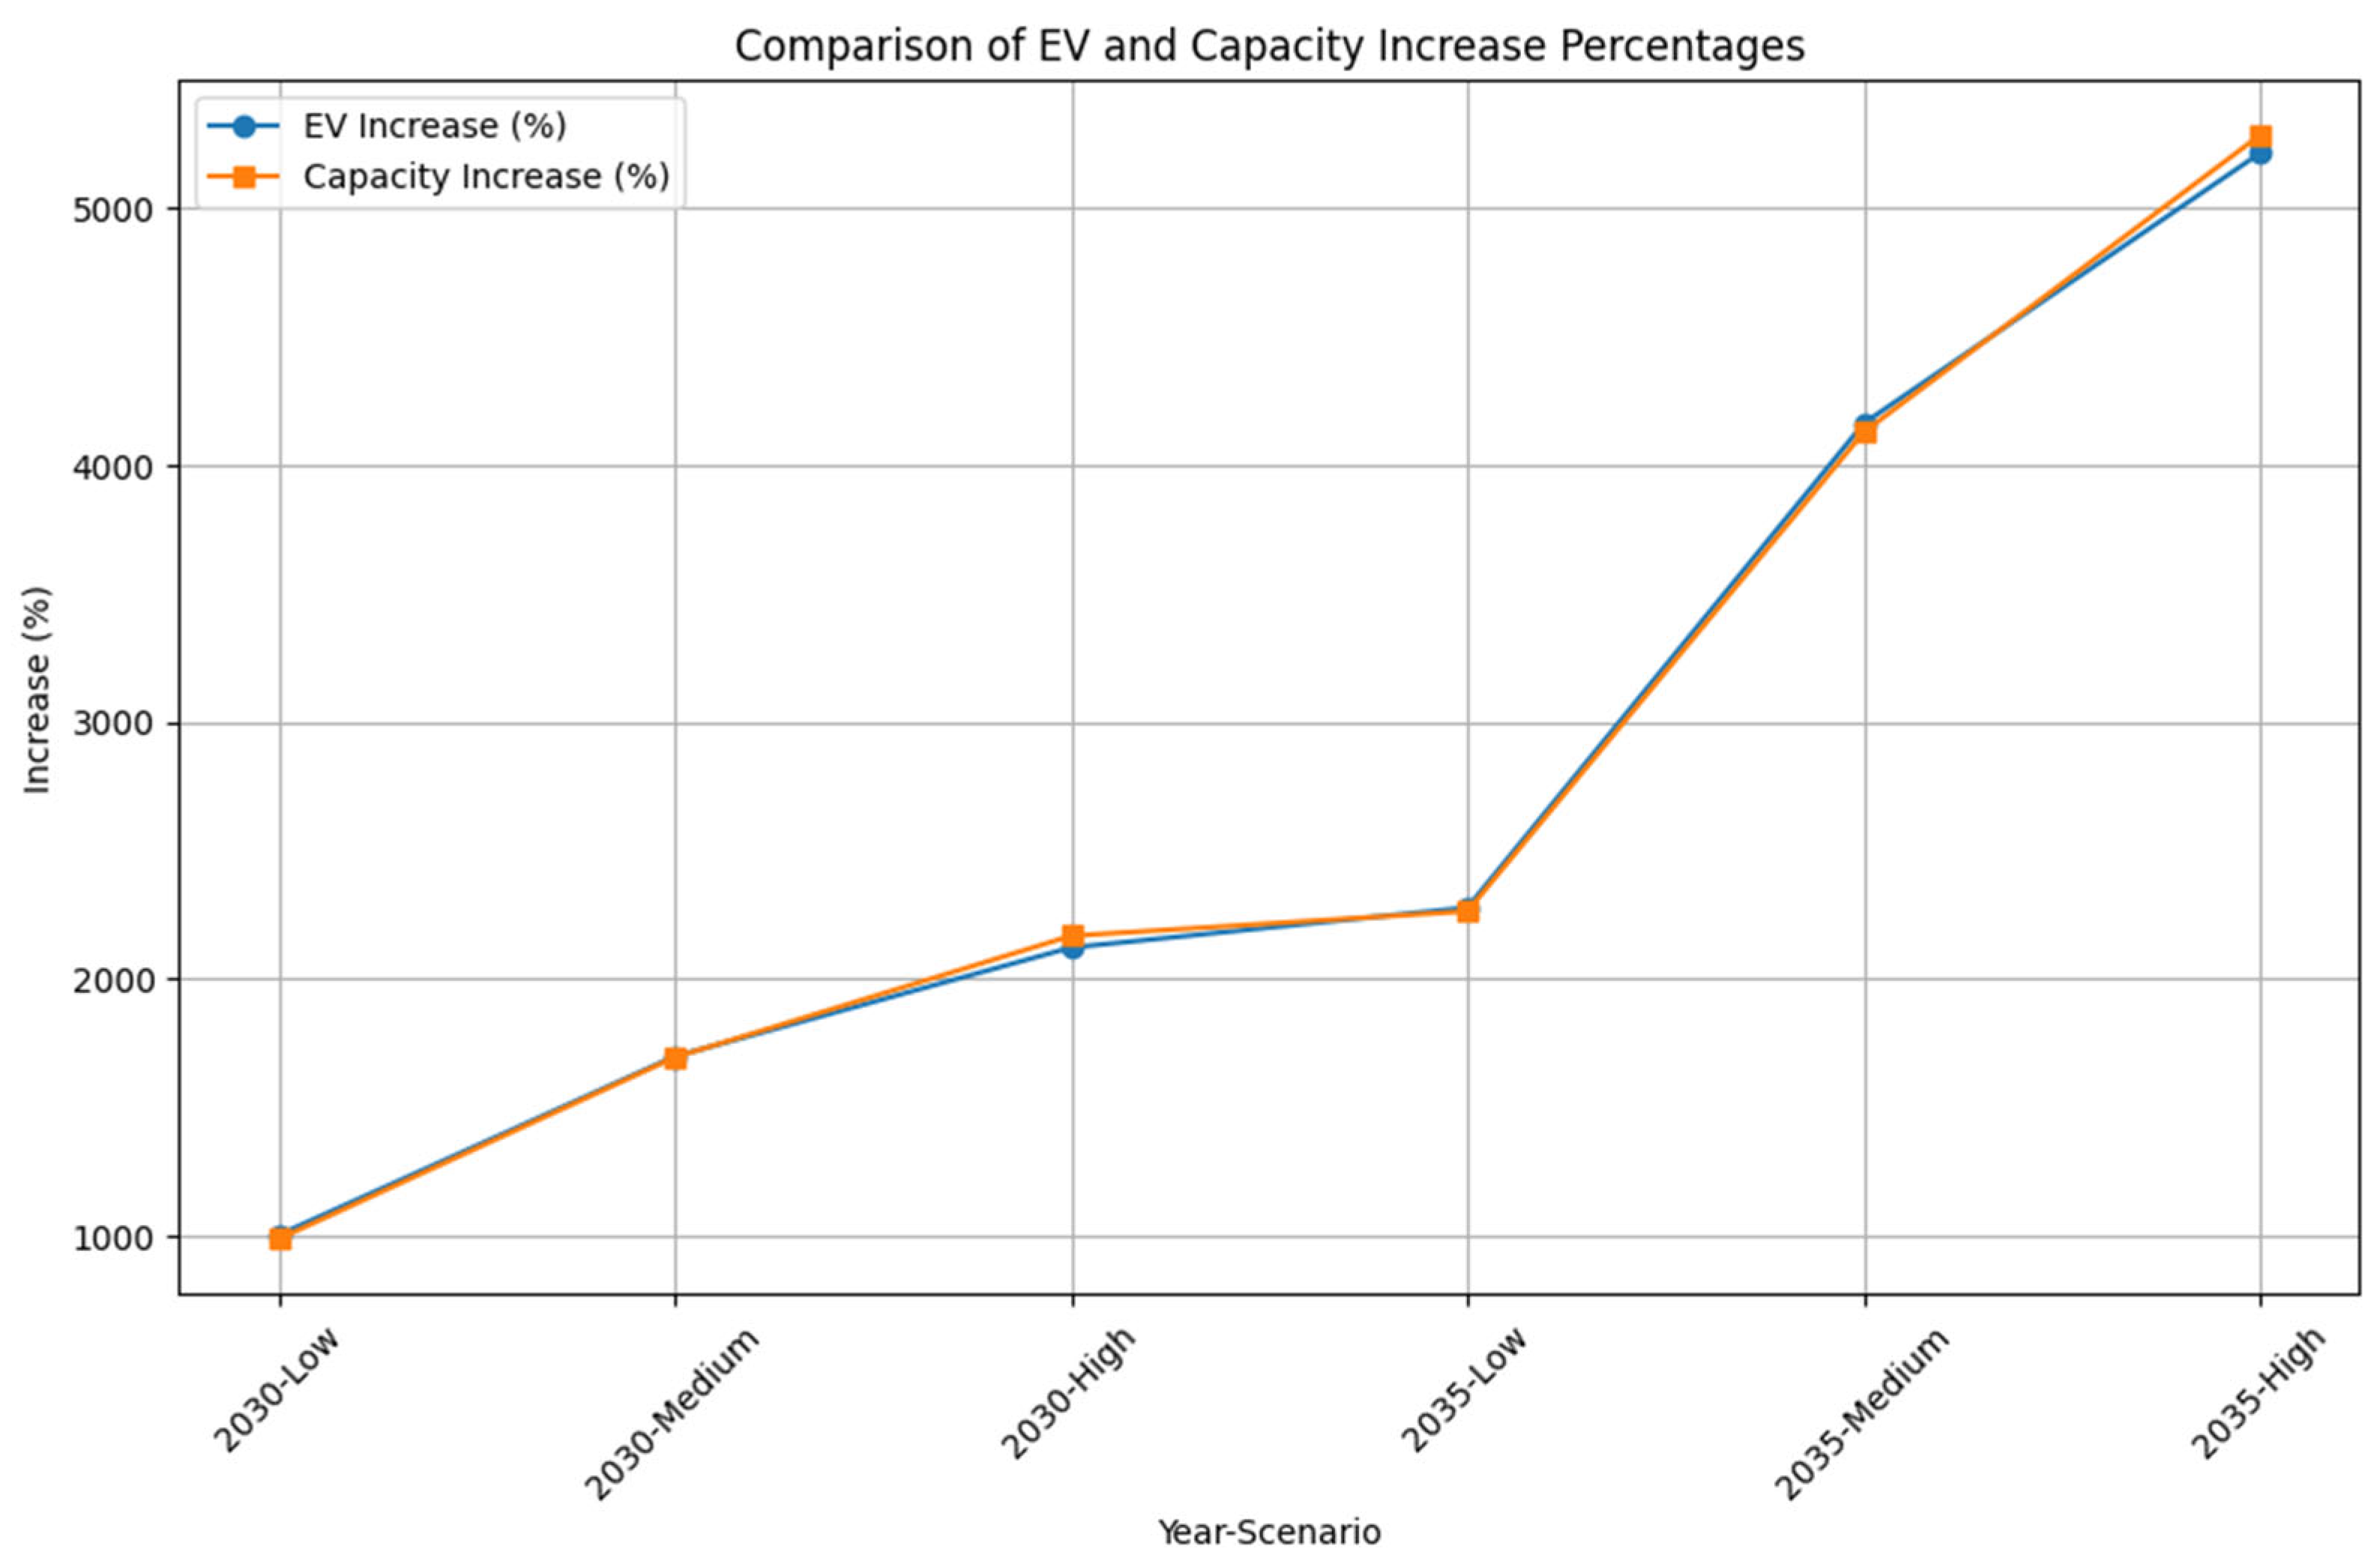
Another indicator to measure the success of the mathematical model is the efficiency rates. This shows how applicable the model is to real-life scenarios. It is an indicator that shows whether the model will provide an advantage to the decision-maker when applied. At the same time, it is important to understand whether the model will show the desired performance in cases where the problem is enlarged when the necessary infrastructure is provided. The efficiency of our mathematical model can be measured by comparing the increase in demand with the increase in charging station capacities.
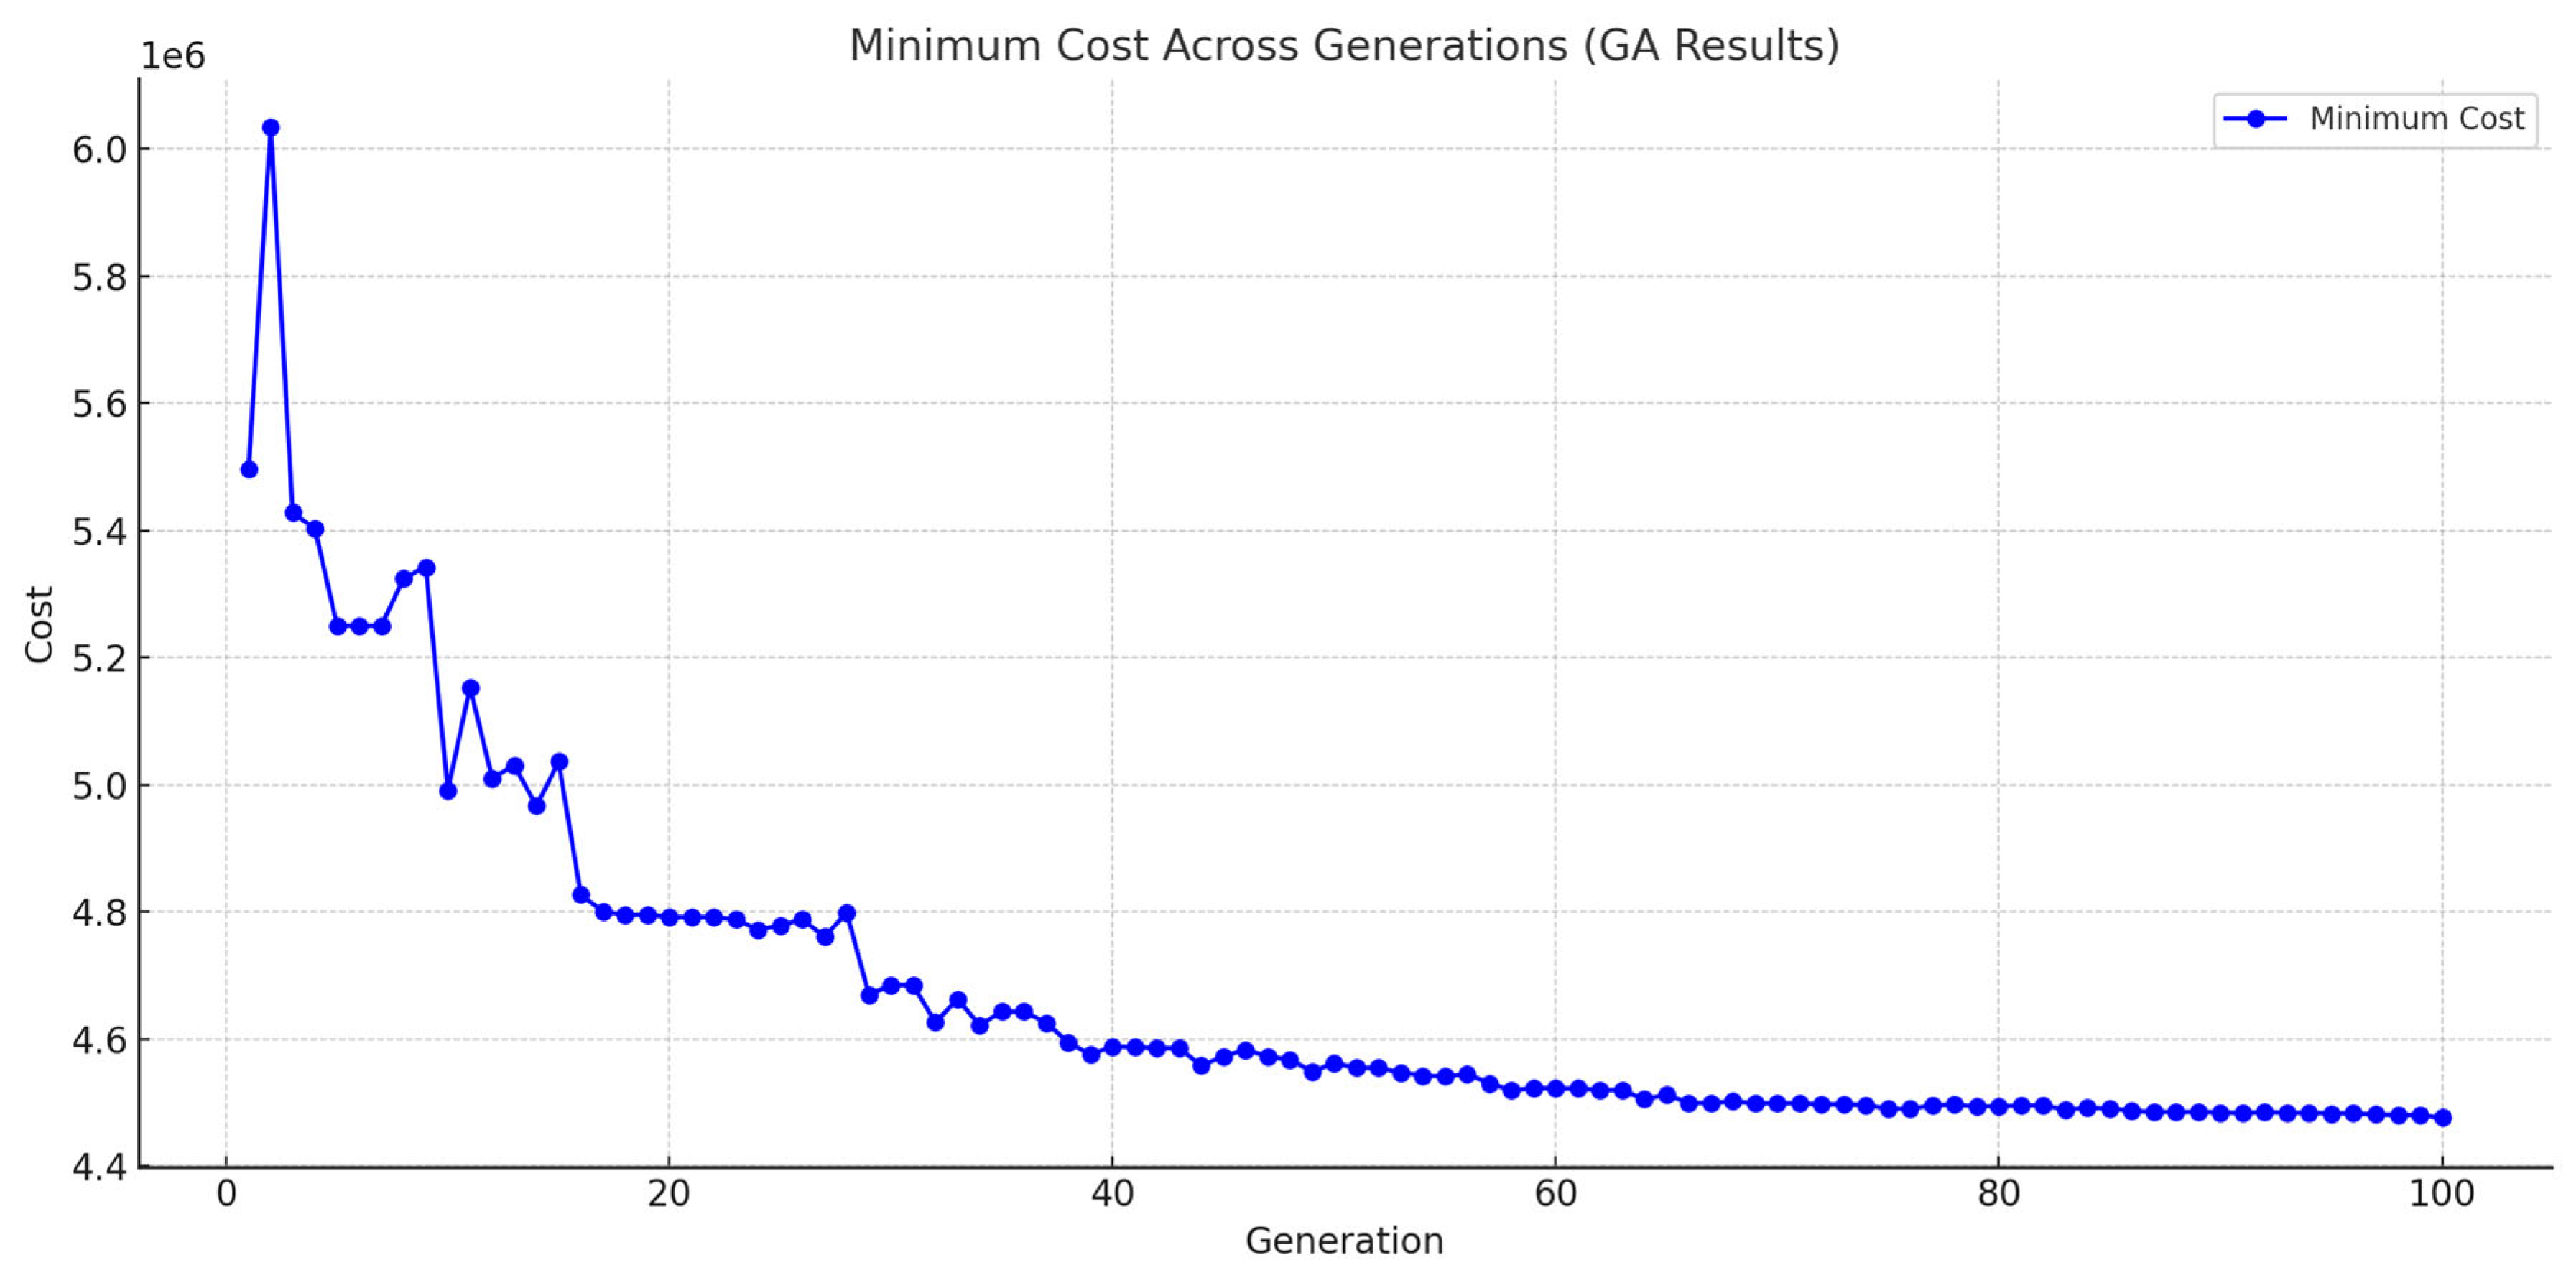
Additionally, the genetic algorithm gap is another factor that indicates how robust the results are.
Figure 13 below shows the genetic algorithm gap graph for the 2030—low scenario as an example.
As can be seen in the graph, the algorithm started out scattered, but as the generations progressed, it converged and reached the desired level.
The analysis and evaluation of the results obtained from the different applications were performed separately.
4.4.1. For Urban Area Case Study
In order to see the performance of the mathematical model in urban areas, the analysis data obtained after the solutions performed with the genetic algorithm are determined here. The
Table 6,
Table 7,
Table 8,
Table 9,
Table 10,
Table 11,
Table 12,
Table 13,
Table 14 and
Table 15, showing the idle time percentages, station occupancy percentages, capacity increase percentages, and efficiency values for the current, low-, medium-, and high-demand forecast scenarios of 2030 and 2035 are shown below.
As can be seen in
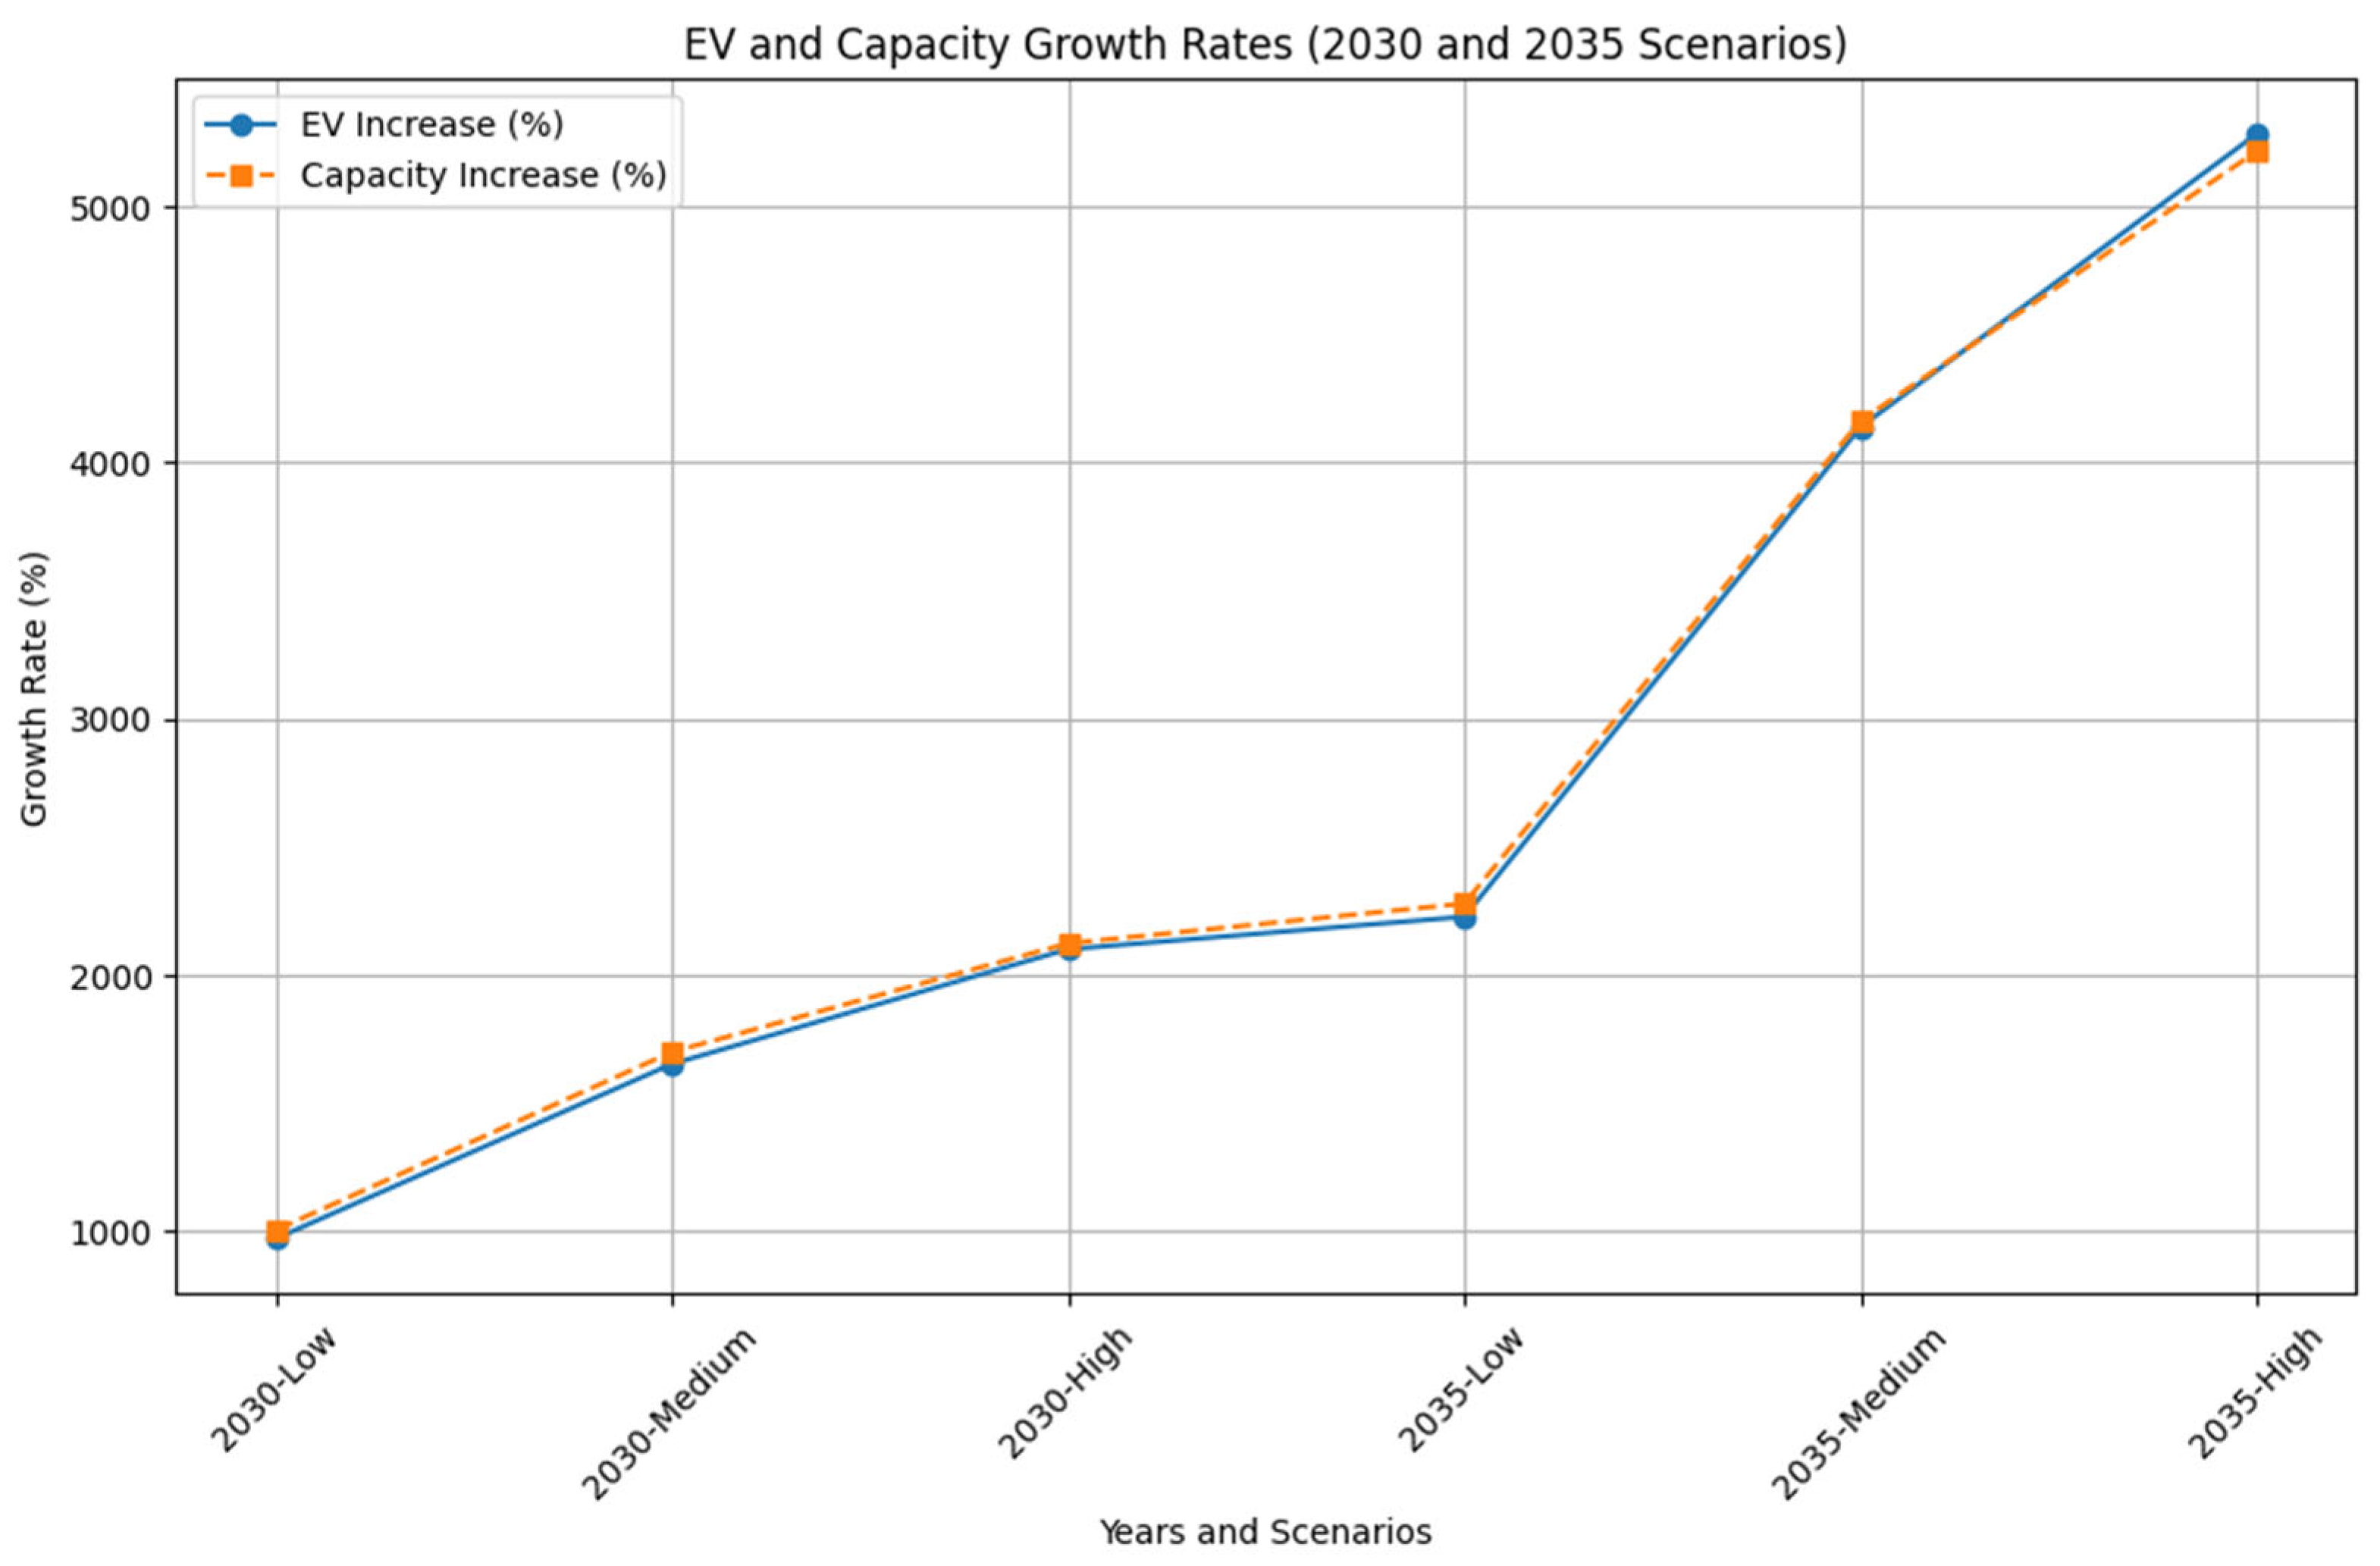
Table 15, the average efficiency percentages for both the current year and the years 2030 and 2035 are on average around 98%. Also, in
Figure 14 it can be seen that increasing EV number and station capacities occur together along the graph.
4.4.2. For Large-Scale Synthetic Case Study
Since the alternative numbers in the previously implemented urban application on the European side of Istanbul could be low for a possible application in real life, a regional application with 250 demand points and 250 station alternatives was implemented in order to understand how the performance of the mathematical model would be affected when the station alternatives and demand points were increased in any area. The
Table 16,
Table 17,
Table 18,
Table 19,
Table 20,
Table 21,
Table 22 and
Table 23 containing the idle time percentages, station occupancy percentages, capacity increase percentages, and efficiency values for the current low-, medium-, and high-demand forecast scenarios for the years 2030 and 2035 are shown below.
As can be seen, both the current and 2030 and 2035 station idle time percentages are below 1%. In other words, station occupancy rates are above 99%.
As can be seen in
Table 23, the average efficiency percentages for both the current year and the years 2030 and 2035 are on average around 98%. Also, in
Figure 15 it can be seen that increasing EV number and station capacities occur together along the graph.
5. Conclusions and Discussion
Electric vehicles play an important role in advancing environmental sustainability by addressing fundamental ecological challenges. In this period when users are switching to electric vehicles on a global scale, the biggest obstacle to the process is the lack of infrastructure. In order to use EV charging stations efficiently, the optimization of these stations has become important. In order for the optimization to be compatible with real life and useful at the same time, the optimization needs to be multi-faceted.
In this study, the multi-objective optimization of charging stations, which is one of the biggest needs of EV users, has been addressed. While determining the location and capacity of EV charging stations, a unique mathematical model formulated as MINLP has been created that minimizes the installation cost, service cost, unmet demand, waiting times, and idle times of the stations. The mathematical model in the study was created in a way that it can be used in highways, urban areas, axes, or desired regions regardless of settlement. The application areas were also selected to verify this situation. The European side of Istanbul was selected as the application area in order to observe the performance of the mathematical model in urban areas. Secondly, a randomly generated region with 250 demand points and 250 station alternatives was selected as the application area in order to understand how the model performs in large-scale regions. The data used were obtained from TÜIK, the General Directorate of Highways, EMRA, and the Ministry of Transport and Infrastructure. In the study, not only the current demands but also the mathematical model created using EMRA’s 2030 and 2035 electric vehicle numbers’ estimates at three different levels were applied to different scenarios. The deterministic solutions of the mathematical model created were intended to be implemented in the GAMS software, but as previously explained, they could not be solved. In such complex mathematical models, this situation becomes inevitable when the problem size is increased. When the deterministic solution cannot be obtained due to the problem size and model complexity, the genetic algorithm was used for the solution on the PyCharm software.
All of the current, 2030, and 2035 scenarios of the European side of Istanbul and the large-scale regional application have been solved with the genetic algorithm. The solution of these scenarios could not be reached with the deterministic approach. The average idle time rate of the stations does not even reach 1% for either case. The average efficiency rate is around 98–99%. If the application is implemented on a single-axis highway, efficiency rates will be higher. On a highway axis, demand points are typically linearly aligned and more sparsely distributed, allowing the genetic algorithm to meet demand with fewer, optimally placed stations, resulting in higher capacity utilization and overall efficiency. In contrast, urban areas present a more complex and dispersed demand distribution, requiring more stations with potentially underutilized capacity, which can reduce efficiency. Additionally, the solution space in urban environments is larger due to higher locational complexity, making it difficult for the algorithm to find globally optimal solutions. These structural and locational differences explain why highway-based applications yield higher efficiency rates than those in dense urban environments. The 98% efficiency achieved in urban areas is a very successful result for the model. The 98% rate, which shows that even in such a complex environment, the capacity increase almost exactly meets the demand increase, shows the high adaptability and effectiveness of the model. The fact that high efficiency is achieved while idle times at the stations are very low and these values do not change even in urban and large-scale synthetic scenarios where demand increases by up to 5280% shows that the created MINLP model exhibits a stable and strong performance even under difficult conditions.
In general, it is possible to say that the mathematical model created works stably in different types of application areas with low station idle time rates and high efficiency rates. The deterministic approach of the mathematical model created can be tested in the future on computers with very high system features. It is also worth mentioning that this study provides the basis for further developments through the use of various metaheuristic algorithms. At this point, the use of different metaheuristic algorithms will be useful both to solve large-scale problems and to improve the solution methodologies presented. Of course, at this point, it will be important to determine which metaheuristic algorithm will perform well in possible metaheuristic studies and what kind of results will be obtained in comparisons between them. Also, future studies can add robust optimization scenarios to the proposed MINLP model for facility planning, integrating operational uncertainties such as station failures or maintenance periods to make the model more sensitive to real-world conditions.
