Abstract
With the increasing requirements for speed and travel distance in tracked vehicles on various terrains and the increasing mass ratio of powertrains, the vibration problem of high-power powertrains becomes a critical challenge. In this paper, in order to reflect on the vibration transmission relationship between the powertrain and the complex carrier, the magnetorheological damping system of a powertrain is studied in a whole vehicle model. The transfer matrix and equations of each component, including the magnetorheological mount, are derived by the Rui Method. Then, the electromechanical coupling multibody dynamic model of the vehicle–powertrain magnetorheological damping system is established. Consequently, the fast solution of vehicle–powertrain vibration characteristics under various road excitations is realized. The dynamic and static coupling characteristics of the powertrain system and the factors affecting its performance are analyzed in a moving vehicle. The simulation results indicate that the vibration reduction performance is the worst in the X-direction, whereas the vibration reduction performance is the best in the Y-direction. Under the E-class road condition at 10 m/s, the RMS acceleration reduction in the powertrain is 41.63% in the Y-direction relative to the chassis. Both the resonant frequency of the powertrain and chassis are 86.93 Hz in the Y-direction. Finally, the accuracy of the results is verified by simulation and driving experiments. The research results can provide theoretical guidance for the design and optimization of the powertrain mount of a tracked vehicle. Moreover, it provides a new technical means of studying the vibration characteristics of a complex multibody system. The simulation results demonstrate notable directional variations in the vibration attenuation performance of the powertrain damping system. Specifically, the X-direction shows the poorest vibration attenuation, whereas the Y-direction exhibits the best damping characteristics.
1. Introduction
The powertrain, serving as the core power source of vehicles, inevitably transmits vibrations generated during its operation to the body structure. These vibrations directly impact ride comfort and health within the passenger compartment. Research indicates that the human body is most sensitive to vertical vibrations in the 4–8 Hz range, which can easily induce fatigue, discomfort, and even motion sickness. Vibrations in the 4–14 Hz range can cause resonance in the thoracic and abdominal organs, resulting in an oppressive sensation. Furthermore, vibrations in the 8–16 Hz range may lead to head discomfort and hand numbness. The vibrational energy of the powertrain is primarily distributed between ten and several hundred hertz [1,2,3,4], precisely covering the key frequency bands known for their significant impact on the human body. Prolonged exposure to such a vibrational environment not only significantly degrades ride quality but also poses potential long-term cumulative health risks to the occupants.
Researchers have developed multiple solutions to reduce powertrain–vehicle vibration transmission. Gkagkasa et al. [5] proposed a novel modeling approach for mesoscopic phenomena related to lubrication at the piston ring–cylinder liner contact interface, explaining the relationship between specific friction and velocity. Cardoso et al. [6] designed a passive balancing cam mechanism aimed at mitigating fluctuations in single-cylinder internal combustion engines. They ultimately achieved a reduction in torque pulsation amplitude of approximately 54% and a reduction in angular velocity fluctuation amplitude of approximately 43%. They optimized the internal structure of engines to improve combustion stability. The prevailing solution for vibration reduction remains the installation of elastic mounts or hydraulic suspensions between the powertrain and the chassis [7,8]. The stiffness and damping characteristics of the passive vibration-damping devices are pre-designed and cannot be adjusted according to actual conditions. Moreover, dynamic stiffening occurs at high frequencies. Its vibration-damping and noise reduction performance cannot meet the broadband vibration isolation requirements [9,10].
To address limitations of passive damping and enhance vibration reduction, researchers have developed suspensions using intelligent materials. These systems enable real-time parameter adjustments to minimize engine vibration transmission [11,12,13,14]. Magnetorheological (MR) devices with adjustable damping force are currently one of the most promising solutions for engine vibration isolation [15,16,17,18,19,20,21,22]. MR damping systems have clear advantages over passive systems. In practice, the vehicle–powertrain MR suspension system is a complex nonlinear multibody system. Developing its dynamic model is fundamental for vibration control implementation, system optimization, bench testing, and structural design. Scholars have established various models of powertrain mounting systems, ranging from simple single-degree-of-freedom (SDOF) to complex multi-degrees-of-freedom (MDOF) systems.
The two-degrees-of-freedom (2-DOF) vibration isolation model and its vertical vibration control characteristics were investigated through a single-layer vibration isolation system [23]. To clarify the control strategies for the studied semiactive hydraulic engine mount, the vibration isolation performance was simulated using an SDOF model [24]. A 2-DOF model of a hybrid powertrain considering both load excitation and engine excitation was established [25], followed by an analysis of the influence of excitation frequency and amplitude on the dynamic behavior of the hybrid powertrain using a dual-time-scale approach. The cabin vibration system incorporating a magnetorheological (MR) mount was modeled as an SDOF system [26], with subsequent analysis of vertical and horizontal vibration characteristics as functions of vehicle speed. The SDOF vibration isolation model is simple and only used to study the influence of the unbalanced force on the system. For a long time, researchers in China and abroad have stimulated the engine as a free-moving space with a rigid body using the 6-DOF vibration model of the powertrain mounting system [27,28]. On this basis, vibration isolation and various control methods have been studied in powertrains.
A four-mount powertrain mounting system (PMS) was represented as a 6-DOF dynamic model [29]. Subsequently, the design process incorporating mixed uncertainties was systematically investigated for the PMS. A systematic analysis of a transmission system incorporating novel magnetorheological variable stiffness and a damping torsional vibration absorber (MR-VSDTVA) was conducted [30]. The effectiveness of the proposed MR-VSDTVA in torsional vibration suppression was validated through numerical simulations performed on MATLAB/SIMULINK 2018b and experimental tests with a vibration table. Since the powertrain generally operates within the complex environment of a carrier, it is more practical to study the powertrain mounting system within the full-carrier vibration model in order to accurately characterize the vibration transmission behavior between the powertrain and the carrier. A 10-DOF dynamic model of a vibration isolation system was developed [31] to systematically evaluate the vibration isolation performance of a novel piezoelectric active suspension under multiple control strategies. In a parallel study [32], an equivalent 10-DOF dynamic model of an MR suspension system was constructed based on integrated vehicle dynamics. They regarded the body as rigid and considered the movement of the engine to have three degrees of freedom, including vertical, pitch, and roll. The movement of the suspension system, as well as the vertical movement of the four non-spring-loaded masses, the natural frequency, and the decoupling rate of the suspension system were calculated and analyzed. A 10-DOF vertical dynamic model for electric vehicles was developed [33], explicitly incorporating the integrated powertrain system. Numerical simulations based on the Runge–Kutta method revealed that suspension stiffness and powertrain mount damping coefficients have nonlinear effects on vehicle vibration characteristics.
Depending on the research content and focus, the dynamic models of the powertrain suspension system are also different, and there is currently no universal model. In this study, an MR mount is applied to reduce powertrain vibrations in tracked vehicles. An MDOF nonlinear dynamics model of the powertrain–MR mount-chassis system is established using the Rui method. This enables rapid solution of powertrain vibration characteristics under MDOF excitation. This study analyzes performance-influencing factors. The results provide design and optimization guidance for armored vehicle powertrain suspensions. In Section 2, the electromechanical coupling multibody dynamics model of the vehicle–powertrain is established. In Section 3, the static and dynamic coupling characteristics of the system and the factors affecting its performance are analyzed in a moving vehicle. Then, the accuracy of the results is verified by simulation and experiments. Finally, the conclusions are presented in Section 4.
2. Dynamics Model of a Tracked Vehicle with Powertrain
2.1. Working Principle of Powertrain
The powertrain system of a tracked vehicle represents a significant factor influencing the vibration level of the vehicle. This special subsystem serves as both an excitation source and a forced vibrator. The excitation of the engine is generated by its own rotor rotation, which is determined by the engine’s rotational speed. The engine rotates at 2100 r/min, with a maximum excitation frequency of 70 Hz and an operating frequency of 450–1650 r/min, encompassing a frequency range of 15–55 Hz. The external balancing performance of the engine under stable operating conditions is primarily determined by the reciprocating inertia force, centrifugal inertia force, and reciprocating moment of inertia, as well as the centrifugal inertia force moment of inertia.
From the working principle of a 12-cylinder diesel engine, it can be inferred that if the mass of the reciprocating motion components in each cylinder is equal, the second-order reciprocating inertia force is the main excitation for the entire engine. The excitation frequency range of the engine’s second-order reciprocating unbalanced inertial force is 50~250 Hz, and the excitation amplitude is relatively small, generally around 0.2 mm. Therefore, the vibration in the powertrain can be considered a harmonic vibration and is calculated as follows:
The structure of the powertrain is shown in Figure 1. Point C is the center of the mass of the powertrain, and the rear part, A, is connected to the chassis and the active wheel axle. Two vibration-damping devices are connected to the chassis and the front part, B, of the powertrain.
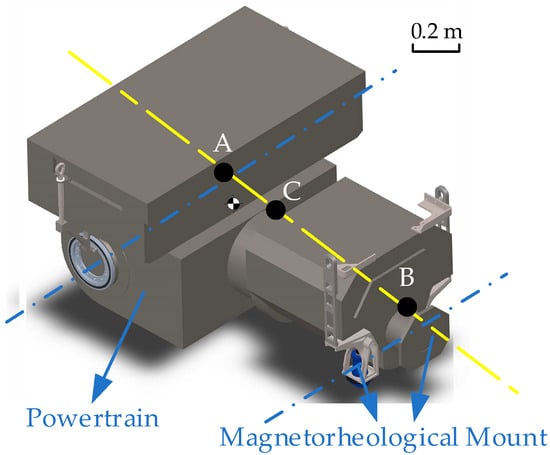
Figure 1.
Schematic diagram of powertrain force.
2.2. Characterstics of MR Mount
The main function of the powertrain mount is to support, limit, and isolate. Given that engine vibration is typically a broadband phenomenon, an ideal engine mount should have frequency and amplitude variation characteristics. Therefore, a high-load MR mount is applied in this study, as shown in Figure 2. By controlling the current of the excitation coil, the damping force of the engine mount system can be controlled rapidly in real time to adapt to different environmental excitation frequencies.
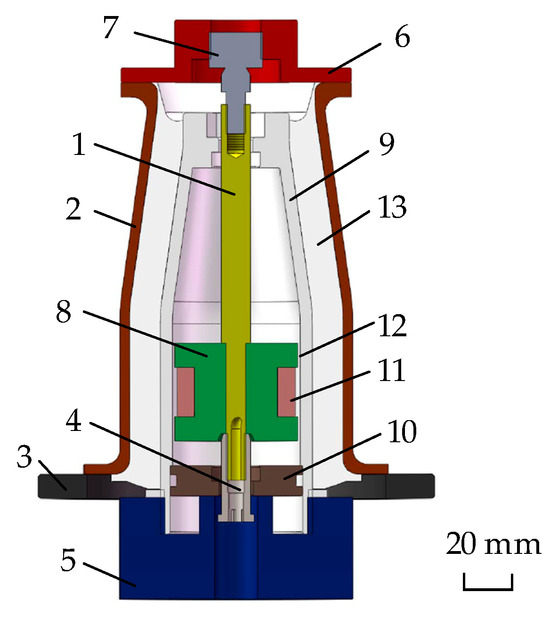
Figure 2.
Schematic diagram of the structure of the MR mount. Piston—1; casing—2; reinforcing plate—3; piston rod—4; transition seat—5; upper cover—6; ball hinge—7; piston—8; inner sleeve—9; injection end cap—10; excitation coil—11; damping channel—12; rubber—13.
When the vertical static stiffness of each MR mount reaches 3 kN/mm, the rated static load of each damper is 9800 N, and the natural frequency is about 8.7 Hz. The controlled characteristics of the stiffness and damping of the MR mounts were tested using the dynamic mechanical performance testing system shown in Figure 3, as follows
where and are the stiffness and damping ratio of the MR mount. is the current applied to the MR mount.
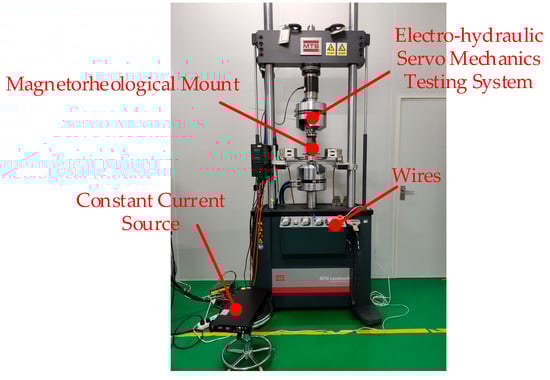
Figure 3.
Dynamic mechanical performance testing system.
2.3. Overall Transfer Equation of the Vehicle Body Subsystem
When using the Rui method to solve the dynamics of a certain type of tracked vehicle, it is divided into three subsystems: the left shoe belt subsystem, the right shoe belt subsystem, and the vehicle body subsystem. Among them, the modeling of the track subsystem can refer to reference [34].
The topology structure of the remaining tracked vehicle part (referred to as the body subsystem) after removing the tracks is shown in Figure 4.
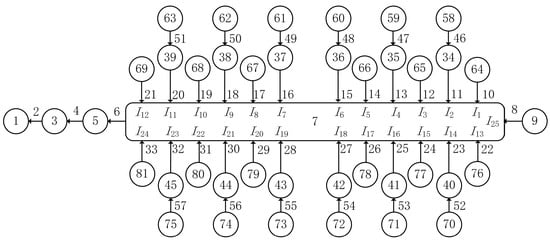
Figure 4.
Topology diagram of vehicle body subsystem.
In this model, the recoil section is designated as body 1, the gun mount is body 3, the turret is body 5, the shell is body 7, the powertrain is body 9, the counterbalance elbows are bodies 34–39 and 40–45, inducer wheels are bodies 69 and 81, and the load wheels are bodies 58–63 and 70–75. The carrier wheels are numbered 65–68 and 77–80, while the main wheels are numbered 64 and 76. The spatial movement hinge is defined by the assembly relationship between each body. The body elements 1 and 3 are connected by sliding hinge 2. The body elements 3 and 5 are connected by column hinge 4. The body elements 5 and 7 are connected by column hinge 6. Additionally, column hinges 10–33 connect body 7 with bodies 34–45, 64–69, and 76–81, while column hinges 46–57 connect body elements 34–45 with body elements 58–63 and 70–75, respectively.
The state vector of the connecting points of a rigid body moving in space with multi-input ends and a single output end (MISO) is defined as follows:
where , , , and are the projections of accelerations, angular accelerations, internal torques, and forces in the global inertial coordinate system, respectively. The “1” at the end of the state vector accounts for external forces, as well as centrifugal and Coriolis forces.
The interconnection between the powertrain and the chassis is illustrated in Figure 5. The powertrain is connected to the vehicle chassis by two MR mounts and two rubber mounts. These can be regarded as elastic damping hinges and column hinges, respectively. Assuming that the performances of the two mounts are identical and those of the two torsion springs are also identical, the two action points can be simplified to a single point at the center of symmetry. The MR mount action point is connected to the powertrain input point and the 26th input point of the body, respectively, while the torsion spring connects the powertrain and the body. In order to facilitate the calculation of the action of the multi-hinged subset, the action force at the 26th input point of the body is converted into the action force and moment at the 25th action point of the body in accordance with the force balance theorem. Accordingly, the connection between the body and the powertrain is regarded as a spatial column hinge, with the input end of the body element linked to the 9th output of the body element and the output connected to the 25th input of body element 7. and are the input and output coordinate systems of hinge element 8, respectively. The structural and dynamic parameters of the element, such as the position, stiffness, and damping of each joint end, are represented in . The direction cosine matrix in the global inertial coordinate system is represented by , and the angular velocity vector is represented by . The projections in and are denoted as and , respectively. It is agreed that the -axis of and is parallel; the relative rotation direction is the -axis direction; and the relative rotation angle is recorded as . is used to represent the position vector of the input end of the 9th body element relative to the 26th input end of the 7th body element, and its projections in the local coordinate system of the and the input end of the 7th body element are recorded as and , respectively. and represent the 26th input end of the 7th body element and the input end of the 9th body element of the magnetorheological damping device in the global inertial coordinate system.
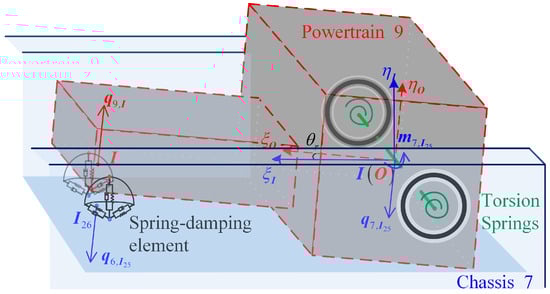
Figure 5.
Schematic diagram of the connection between the powertrain and the chassis.
According to Newton’s third law and the positive convention of the internal force and the internal torque at the connection end, the following can be calculated:
In these formulae, the projection of the position vector of the 26th input end of rigid body 7 relative to the 25th input end in the global inertial coordinate system is represented. In addition, the 26th input force of space body element 7 is the elastic restoring force, damping force, and control force applied in the direction of relative motion, recorded as follows:
where
Spatial moving column hinges 8 and 10–33 are a multi-hinge subset. Then, the transfer equations and geometric equations of the multi-hinge subset are derived. According to the derivation method of the overall transfer equation of the tree multibody system, it can be concluded that the overall transfer equation of the vehicle body subsystem is the following:
where
The boundary conditions of the vehicle body subsystem were as follows:
In the formula, the labels, i, of the system boundary end components are 1, 9, and 58–81, respectively.
The flowchart for calculating vibration characteristics of a tracked vehicle with a powertrain is shown in Figure 6.
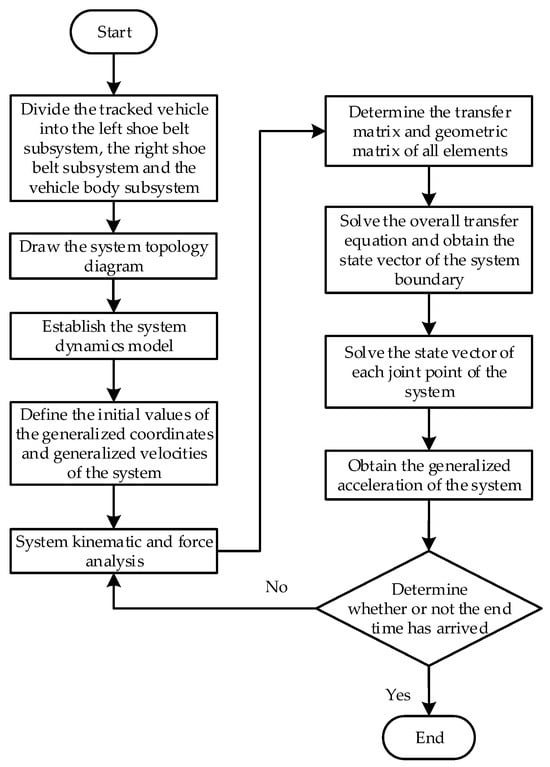
Figure 6.
Flowchart for calculating vibration characteristics of a tracked vehicle with a powertrain.
3. Vibration Characteristics Analysis of Powertrain Suspension System
3.1. Road Excitation
At a certain speed, the vertical displacement component of unevenness contained within the time frequency bandwidth corresponding to the spatial frequency bandwidth is the same. The power spectral density (PSD) can be converted to time frequency and is expressed as follows:
where n represents spatial frequency; f represents temporal frequency, which is the reciprocal of wavelength; and v represents vehicle speed.
This equation indicates that the influence of vehicle speed on road surface spectra is very important. As the vehicle speed increases, the Gd(f) value decreases and the excitation weakens. Therefore, on roads with long waves, increasing vehicle speed actually reduces vibration. The corresponding road roughness is as follows [35]:
When the speed is 20 m/s, Figure 7 shows a schematic diagram of the generated E-level road roughness curve.
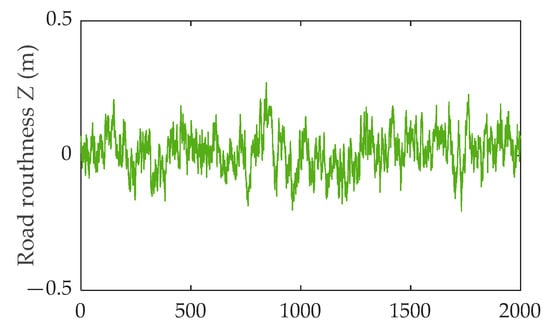
Figure 7.
Time frequency PSD curve of E-level road surface.
3.2. Results and Analysis of Powertrain Vibration Response
When the road spectrum level is E and the vehicle speed is 10 m/s, the acceleration response at the connection end between the rear of the vehicle and the powertrain, and the acceleration response at the input end of the powertrain are shown in Figure 8. From the graph, it can be seen that both the chassis and powertrain experience the most severe vertical vibration. The length direction is defined as the X-axis; the height direction is defined as the Y-axis; and the width direction is defined as the Z-axis. In the direction of the vehicle commander, the vibration level of the chassis and powertrain is equivalent, while in the other two directions, the vibration in the powertrain is slightly lower than that of the chassis.
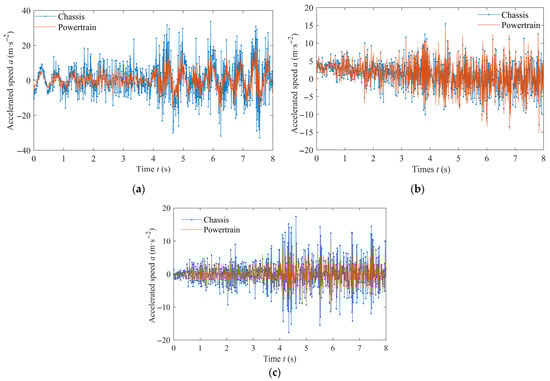
Figure 8.
Three directional acceleration responses of chassis and powertrain system. (a) X-direction; (b) Y-direction; and (c) Z-direction.
The PSD of the Y-axis acceleration response of the chassis and powertrain is solved through the Fourier transform, and its frequency domain response characteristics are shown in Figure 9. When the road spectrum level is E and the vehicle speed is 10 m/s, the peak vibration in the chassis and powertrain appears at 86.93 Hz. The second- and third-order vibrations of the powertrain have a significant impact on both the chassis and the powertrain. Due to the complex system composition, there are multiple peaks in its response.
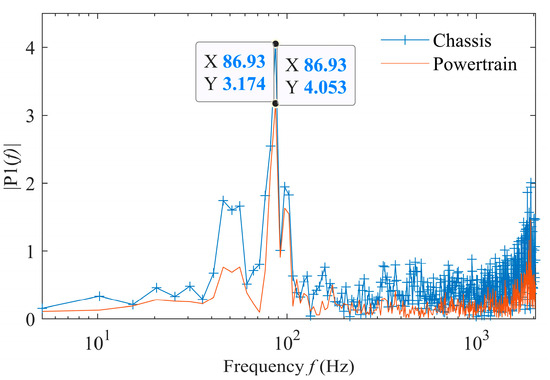
Figure 9.
Frequency domain vibration characteristics of chassis and powertrain.
Table 1 presents the root mean square (RMS) values of the acceleration responses in the chassis and powertrain for different road excitations and vehicle speeds. Figure 10 illustrates the changes in the RMS values of the three-direction acceleration response of the powertrain and the RMS values of the Y-direction acceleration response as a function of vehicle speed and road level. The vehicle speed is 10 m/s. The graphical results demonstrate that the installation of the vibration-damping device resulted in a reduction in the three-way acceleration response of the powertrain in comparison to that of the chassis. Optimal vibration-damping performance was achieved in the Y-direction, whereas the X-direction exhibited comparatively reduced effectiveness. The three-direction acceleration response of the powertrain and the chassis both increased with the increase in the vehicle speed but fluctuated with the increase in the road grade. In some cases, the vibration may even decrease. The vibration is most intense when the road grade is E and the vehicle speed is 20 m/s. This may be due to the road excitation at this time being caused by the resonance of the various components of the vehicle, resulting in the intensification of the vibration. Specifically, the Y-direction shows a substantial 41.63% reduction in acceleration RMS, while the Z-direction shows a moderate 23.8% decrease. In contrast, the X-axis displays an adverse 14.25% increase.

Table 1.
Root mean square (m/s2) of three-dimensional acceleration response of chassis and powertrain.
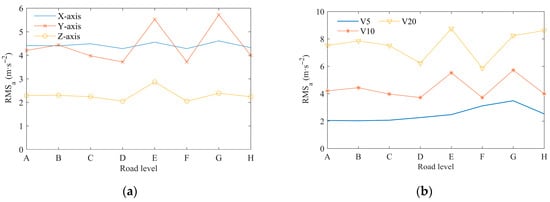
Figure 10.
Root mean square of acceleration response for powertrain (a) in three directions and (b) different vehicle speeds.
To verify the correctness of the simulation results, a simple ADAMS 2020 3D model was also established in this study [36]. The time-domain and frequency-domain characteristics of the acceleration vibration response of the chassis and powertrain at a speed of 10 m/s were calculated using this model, and are shown in Figure 11, respectively. The simulation required 2746 s, compared to 1397 s using the Rui method via Fortran 2010 programming. From the graph, it can be seen that the simulation results of ADAMS are relatively smooth, due to its simpler simulation model and fewer influencing factors compared to the multibody system transfer matrix method model. When the road spectrum level is E and the vehicle speed is 10 m/s, the peak vibration in the chassis and powertrain appears at 88.31 Hz, and its response also shows multiple peaks; however, the high-frequency component is significantly reduced. By comparing the simulation results obtained from the two methods, it can be concluded that using the Rui method can quickly achieve the calculation of the overall dynamic vibration response characteristics of the powertrain vehicle. More importantly, this approach enables the integration of control methods during the simulation. Notably, the computational efficiency of the Rui method depends solely on the degrees of freedom of the whole system [37].
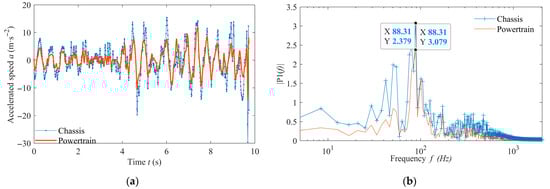
Figure 11.
Simulation of Y-axis acceleration response of chassis and powertrain system. (a) time-domain; (b) frequency-domain.
3.3. Vehicle Vibration Test in Motion
In order to further verify the correctness of the dynamic analysis results of tracked vehicles during travel, sports car tests with different vehicle speeds were conducted on a certain level of road surface. The acceleration sensors were installed at the upper and lower ends of the two shock absorbers, as shown in Figure 12. Using the on-board GPS to record the vehicle speed in real time, the RMS of the three-way acceleration of the chassis and powertrain for the vehicle at different speeds was obtained, as shown in Figure 13. It can be seen that the vibrations in the X and Y directions of the chassis and the powertrain are more severe. The vibration in the X direction of the powertrain is greater than that of the chassis, while the other two directions produce less severe vibrations than that of the chassis. Moreover, the vibration RMS of the chassis and powertrain both increase with the increase in the vehicle speed. At vehicle speed v3, the powertrain shows a 29.98% RMS acceleration reduction in the Y-direction and 35.17% in the Z-direction compared to the chassis, while exhibiting a 4.75% increase in the X-direction. Figure 14 shows the PSD curve of the vibration power of the powertrain and the Y-direction acceleration of the chassis at the speed v3. It can be seen that the chassis and the powertrain vibrate violently at 74.07 Hz and 69.18 Hz, respectively, which is consistent with the simulation results.
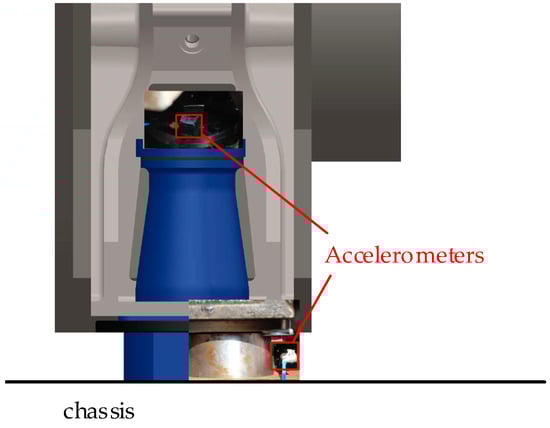
Figure 12.
Sensor installation diagram.
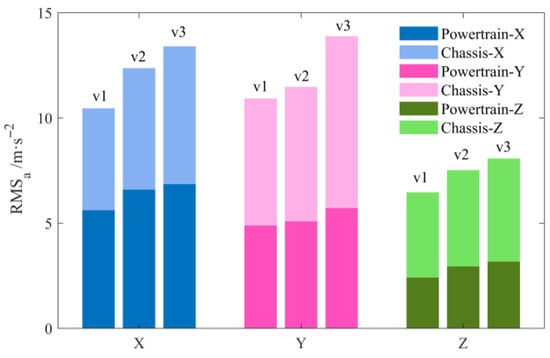
Figure 13.
Three-direction acceleration response of the vehicle at different speeds.
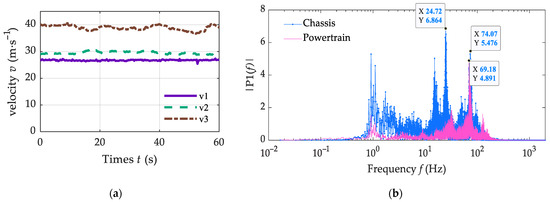
Figure 14.
Vehicle travel: (a) synthetic speed; (b) PSD curve.
4. Conclusions
As the requirements for tracked vehicles increase in terms of travel speed and distance in a variety of geographic terrains, the mass ratio of the powertrain also increases. This, in turn, gives rise to a growing prevalence of vibration issues affecting the vehicle’s high-power powertrain. In establishing a model for this system, the number of degrees of freedom determines the number of dynamic equations. In general, greater degrees of freedom allow for a more realistic reflection of a system’s motion state. However, this approach also results in a reduction in computational efficiency. Furthermore, an excessive number of state variables can also lead to a decline in control efficiency and have an adverse impact on the control effect. In order to reflect on the vibration transfer relationship between the powertrain and the complex carrier, this paper incorporates the powertrain–MR mount-chassis system into a vehicle model. The multibody system transfer matrix method is employed to derive the transfer matrices and equations for each component, including the MR mount. The electromechanical coupled multibody dynamics model of the vehicle–powertrain isolation system is established, and the vibration characteristics of the powertrain under MDOF excitation are analyzed. The method enables rapid determination of the vibration characteristics of the powertrain under MDOF excitation. It also facilitates the analysis of the static–dynamic mechanical coupling characteristics of the powertrain system and the factors influencing its performance under operational conditions.
The simulation results reveal significant directional variations in the vibration attenuation performance of the powertrain damping system. Specifically, the X-direction demonstrates the least effective vibration reduction, whereas the Y-direction shows optimal damping performance. Under the E-class road condition at 10 m/s, the powertrain exhibits a 41.63% RMS acceleration reduction in the Y-direction and 23.8% in the Z-direction relative to the chassis, while displaying a 14.25% increase in the X-direction. Notably, both the powertrain and chassis share an identical Y-direction resonant frequency of 86.93 Hz. The accuracy of the research results is validated through simulation analysis and field testing with tracked vehicles. The results offer theoretical guidance for the design and optimization of powertrain suspension in armored vehicles and provide new insights into the study of vibration reduction schemes and control methods for complex MR vibration reduction systems.
Author Contributions
Conceptualization, Y.T.; methodology, Y.T. and X.R.; writing—original draft preparation, Y.T. and J.S.; writing—review and editing, X.R., F.L. and J.Z.; supervision, X.R.; project administration, X.R.; funding acquisition, Y.T. and X.R. All authors have read and agreed to the published version of the manuscript.
Funding
This research received financial support from two individuals. Yu Tao funded the study under the auspices of the Young Talent Lifting Program of Xi’an Association for Science and Technology (Grant No. 0959202513022), while Xue Rui provided funding this study under the project of the Jiangsu National Science Foundation of China (Grant No. BK20247443).
Data Availability Statement
The data supporting the results presented in this paper are available upon reasonable request.
Conflicts of Interest
The authors declare no conflicts of interest.
Nomenclature
A full nomenclature of all the mathematical symbols used is provided.
| Symbol | Description |
| Stiffness matrix of the MR mount | |
| Damping matrix of the MR mount | |
| Damping ratio of the MR mount | |
| Current applied to the MR mount | |
| Label of rigid body | |
| Projection of acceleration vector | |
| Projection of angular acceleration vector | |
| Projection of internal torque vector | |
| Projection of force vector | |
| State vector at the input end of element i | |
| State vector at the output end of element i | |
| Input coordinate system of hinge element 8 | |
| Output coordinate system of hinge element 8 | |
| Global inertial coordinate system | |
| Input coordinate system of element i | |
| Control force | |
| Direction cosine matrix in | |
| Angular velocity vector | |
| Projection of angular velocity vector in | |
| Projection of angular velocity vector in | |
| Relative rotation angle | |
| Position vector of input end (9th body element) relative to 26th input end (7th body element) | |
| Projection of in . | |
| Projection of in . | |
| 26th input end of the 7th body element in . | |
| Input end of the 9th body element of the magnetorheological damping device in . | |
| Overall transfer matrix of the vehicle body subsystem | |
| Overall state vector of the vehicle body subsystem | |
| Transfer matrix of element j | |
| Product of transfer matrices | |
| Coefficient matrix in the geometric equations | |
| Power spectral density | |
| Spatial frequency | |
| Temporal frequency | |
| Vehicle speed |
References
- Danilevičius, A.; Karpenko, M.; Křivánek, V. Research on the noise pollution from different vehicle categories in the urban area. Transport 2023, 38, 1–11. [Google Scholar] [CrossRef]
- Karpenko, M.; Prentkovskis, O.; Skačkauskas, P. Analysing the impact of electric kick-scooters on drivers: Vibration and frequency transmission during the ride on different types of urban pavements. Eksploat. I Niezawodn.–Maint. Reliab. 2025, 27, 199893. [Google Scholar] [CrossRef]
- Kim, Y.D.; Jeong, J.E.; Park, J.S. Optimization of the lower arm of a vehicle suspension system for road noise reduction by sensitivity analysis. Mech. Mach. Theory 2013, 69, 278–302. [Google Scholar] [CrossRef]
- Karpenko, M.; Ževžikov, P.; Stosiak, M.; Skačkauskas, P.; Borucka, A.; Delembovskyi, M. Vibration Research on Centrifugal Loop Dryer Machines Used in Plastic Recycling Processes. Machines 2024, 12, 29. [Google Scholar] [CrossRef]
- Gkagkasa, K.; Ponnuchamyb, V.; Dašićc, S.; Miljan, I. Molecular dynamics investigation of a model ionic liquid lubricant for automotive applications. Tribol. Int. 2017, 113, 83–91. [Google Scholar] [CrossRef]
- Cardoso, D.; Fael, P.; Gaspar, P.; Espírito-Santo, A. Balancing cam mechanism for instantaneous torque and velocity stabilization in internal combustion engines: Simulation and experimental validation. Energies 2025, 18, 3256. [Google Scholar] [CrossRef]
- Yu, Y.; Naganathan, N.G.; Dukkipatit, R.V. Review of automotive vehicle engine mounting systems. Int. J. Veh. Des. 2000, 24, 299–319. [Google Scholar] [CrossRef]
- Kumar, A.; Kiran, A.R.; Hombalmath, M.; Mathad, M.; Rane, S.S.; Patil, A.Y.; Kotturshettar, B.B. Design and analysis of engine mount for biodegradable and non-biodegradable damping materials. J. Phys. Conf. Ser. 2020, 1706, 012182. [Google Scholar] [CrossRef]
- Zhang, J.; Feng, J.; Han, B. Design on vibration absorber for explosion-proof diesel engine and test analysis. Min. Process. Equip. 2020, 48, 19–24. [Google Scholar] [CrossRef]
- Santhosh, S.; Velmurugan, V.; Paramasivam, V.; Thanikaikarasan, S. Experimental investigation and comparative analysis of rubber engine mount vibration and noise characteristics. Mater. Today Proc. 2020, 21, 638–642. [Google Scholar] [CrossRef]
- Bian, Y.; Gao, Z.; Hu, J.; Fan, M. A semi-active control method for decreasing longitudinal torsional vibration of vehicle engine system: Theory and experiments. J. Sound Vib. 2019, 439, 413–433. [Google Scholar] [CrossRef]
- Dong, X.M.; Li, W.F.; Yu, J.Q.; Pan, C.W.; Xi, J.; Zhou, Y.Q.; Wang, X.H. Magneto-Rheological Variable Stiffness and Damping Torsional Vibration Control of Powertrain System. Front. Mater. 2020, 7, 121. [Google Scholar] [CrossRef]
- Elahinia, M.; Ciocanel, C.; Nguyen, T.M.; Wang, S. MR- and ER-Based Semiactive Engine Mounts: A Review. Smart Mater. Res. 2013, 2013, 1–21. [Google Scholar] [CrossRef]
- Ladipo, I.L.; Fadly, J.D.; Faris, W.F. Characterization of Magnetorheological Elastomer (MRE) Engine Mounts. Mater. Today Proc. 2016, 3, 411–418. [Google Scholar] [CrossRef]
- Chen, S.; Li, R.; Du, P.; Zheng, H.; Li, D. Parametric Modeling of a Magnetorheological Engine Mount Based on a Modified Polynomial Bingham Model. Front. Mater. 2019, 6, 68. [Google Scholar] [CrossRef]
- Deng, Z.; Cai, Q.; Li, Y.; Wei, H.; Yang, Q.; Dong, S. Magnetic circuit design and optimisation of magnetorheological mount with tapered channel under the flow mode. J. Intell. Mater. Syst. Struct. 2021, 32, 1614–1623. [Google Scholar] [CrossRef]
- Huang, J.C.; Li, S.Q.; Zhou, Y.X.; Xu, T.C.; Li, Y.C.; Wang, H.X.; Wang, S.G. A heavy-duty magnetorheological fluid mount with flow and squeeze model. Smart Mater. Struct. 2021, 30, 085012. [Google Scholar] [CrossRef]
- Kim, M.; Yoo, S.; Yoon, D.; Jin, C.; Won, S.; Lee, J. Numerical analysis of the vehicle damping performance of a magnetorheological damper with an additional flow energy path. Appl. Sci. 2024, 14, 10575. [Google Scholar] [CrossRef]
- Wang, Z.; Hu, H.; Yang, J.; Zheng, J.; Zhao, W.; Ouyang, Q. Experimental study on the skyhook control of a magnetorheological torsional vibration damper. Micromachines 2024, 15, 236. [Google Scholar] [CrossRef]
- Fu, J.; Huang, C.; Shu, R.; Li, X.; Chen, M.; Chen, Z.; Chen, B. Multi-objective optimization of magnetorheological mount considering optimal damping force and maximum adjustable coefficient. Machines 2023, 11, 60. [Google Scholar] [CrossRef]
- Wang, M.; Lu, D.; Xu, Y.; Guo, Y.; Li, B.; Wereley, N. Theoretical and experimental research on an optimal control for a magnetorheological shock mitigation system. Appl. Sci. 2024, 14, 7317. [Google Scholar] [CrossRef]
- Phu, D.X.; Choi, S.B. Magnetorheological Fluid Based Devices Reported in 2013–2018: Mini-Review and Comment on Structural Configurations. Front. Mater. 2019, 6, 19. [Google Scholar] [CrossRef]
- Si, Z.; Bai, X.; Qian, L.; Chen, P. Principle and Control of Active Engine Mount Based on Magnetostrictive Actuator. Chin. J. Mech. Eng. 2022, 35, 146. [Google Scholar] [CrossRef]
- Fan, R.; Fei, Z.; Zhou, B.; Gong, H.; Song, P.J. Two-step dynamics of a semiactive hydraulic engine mount with four-chamber and three-fluid-channel. J. Sound Vib. 2020, 480, 115403. [Google Scholar] [CrossRef]
- Hu, D.; Yan, Y.; Xu, X.; Wang, J. Dynamics analysis of the hybrid powertrain under multi-frequency excitations with two time scales. AIP Adv. 2018, 8, 065212. [Google Scholar] [CrossRef]
- Kim, S.H.; Yoon, D.S.; Kim, G.W.; Choi, S.B.; Jeong, J.Y.; Kim, J.H.; Kim, S.J.; Kim, I.D. Road traveling test for vibration control of a wheel loader cabin installed with magnetorheological mounts. J. Intell. Mater. Syst. Struct. 2021, 32, 1336–1348. [Google Scholar] [CrossRef]
- Xu, X.; Su, C.; Dong, P.; Liu, Y.; Wang, S. Optimization design of powertrain mounting system considering vibration analysis of multi-excitation. Adv. Mech. Eng. 2018, 10, 1687814018788246. [Google Scholar] [CrossRef]
- Zhou, H.; Liu, H.; Gao, P.; Xiang, C. Optimization Design and Performance Analysis of Vehicle Powertrain Mounting System. Chin. J. Mech. Eng. 2018, 31, 31. [Google Scholar] [CrossRef]
- Cai, B.; Shangguan, W.; Lu, H.; Tao, B. Hybrid uncertainties-based analysis and optimization design of powertrain mounting systems. Sci. China Technol. Sci. 2020, 63, 838–850. [Google Scholar] [CrossRef]
- Li, W.; Ge, X.; Liang, M.; Deng, X. Magneto-rheological variable damping and variable stiffness torsional vibration control of powertrain transmission. J. Mech. Sci. Technol. 2023, 37, 3887–3900. [Google Scholar] [CrossRef]
- Sun, G. Study on the Key Technology in Active Vibration Control of Automobile Power-Train. Ph.D. Dissertation, Jilin University, Changchun, China, 2007. [Google Scholar]
- Deng, Z. Optimal Design and Control Strategy Research of Automotive Powertrain Magneto-Rheological Mount. Ph.D. Dissertation, Chongqing University, Chongqing, China, 2015. [Google Scholar]
- Mo, S.; Chen, K.; Zhang, Y.; Zhang, W. Vertical dynamics analysis and multi-objective optimization of electric vehicle considering the integrated powertrain system. Appl. Math. Model. 2024, 131, 33–48. [Google Scholar] [CrossRef]
- Zhang, J. Study Transfer on Some Matrix Issues Method of the for New Version Mulitbody of Systems. Ph.D. Dissertation, Nanjing University of Science and Technology, Nanjing, China, 2017. [Google Scholar]
- Liu, X.; Zhang, X. A new load bearing capacity assessment method of the road pavement based on surface strain and the spectrum of the acceleration. SN Appl. Sci. 2024, 5, 169. [Google Scholar] [CrossRef]
- Adams Car. Available online: https://hexagon.com/products/adams-car (accessed on 20 June 2025).
- Rui, X.; Wang, X.; Zhou, Q.; Zhang, J. Transfer matrix method for multibody systems (Rui method) and its applications. Sci. China Tech. Sci. 2019, 62, 712–720. [Google Scholar] [CrossRef]
Disclaimer/Publisher’s Note: The statements, opinions and data contained in all publications are solely those of the individual author(s) and contributor(s) and not of MDPI and/or the editor(s). MDPI and/or the editor(s) disclaim responsibility for any injury to people or property resulting from any ideas, methods, instructions or products referred to in the content. |
© 2025 by the authors. Licensee MDPI, Basel, Switzerland. This article is an open access article distributed under the terms and conditions of the Creative Commons Attribution (CC BY) license (https://creativecommons.org/licenses/by/4.0/).