Article

Study on the Support Displacement Variation Pattern and Intelligent Early-Warning Methods for Kilometer-Level Railway Bridges

1
School of Civil Engineering, Southeast University, Nanjing 210096, China
2
China Railway Bridge & Tunnel Technologies Co., Ltd., 8 Panneng Road, Nanjing 210061, China
3
State Key Laboratory of Safety, Durability and Healthy Operation of Long Span Bridges, Southeast University, Nanjing 211189, China
4
School of Architecture and Civil Engineering, Jiangsu University of Science and Technology, Zhenjiang 212000, China
*
Authors to whom correspondence should be addressed.
Appl. Sci. 2025, 15(16), 8931; https://doi.org/10.3390/app15168931
Submission received: 19 June 2025 / Revised: 25 July 2025 / Accepted: 1 August 2025 / Published: 13 August 2025

Abstract

Bridge support displacement is a crucial indicator for evaluating the deformation states of supports and main girders. In this study, innovative methods were established based on long-term monitoring data from two kilometer-scale railway bridges, aimed at early warning of main girder deformation consistency and assessment of support wear conditions. First, outliers were identified and eliminated using a moving interval generalized Grubbs method. Second, the variation patterns of support displacement induced by temperature and train loads were systematically analyzed. Third, an early-warning method was proposed based on the optimal probability distribution model of support displacement difference to determine the warning threshold for main girder deformation consistency. Additionally, a method for evaluating support activity performance using jamming parameters was introduced to quantitatively assess support wear conditions. This research demonstrates that the proposed methods provide novel and effective approaches for the early warning and assessment of support and girder deformation, contributing to enhanced structural health monitoring and maintenance strategies.

1. Introduction

China’s high-speed railway (HSR) technology has advanced rapidly, driving the construction of kilometer-scale bridges to span major rivers and traverse complex terrains. However, these bridges are exposed to both anthropogenic and natural hazards, which can lead to structural damage and performance deterioration. Such issues may escalate into severe safety risks, including collapse, thereby threatening normal operations [1,2]. Additionally, emergencies like floods, earthquakes, and strong winds further compromise bridge integrity, with railway bridges being particularly vulnerable due to the intense stresses imposed by heavy-duty trains [3].
Bridge supports constitute a critical structural element that connects the superstructure and substructure of bridges [4]. These components typically demonstrate significantly shorter service lives compared with primary bridge elements when exposed to harsh environmental conditions. Documented cases include the Sidu River Bridge, where supports required replacement after merely 3 years of service due to severe deterioration, and the Jiangyin Yangtze River Bridge, which experienced bearing failures within 5 years of operation [5]. The economic impact of such degradation is substantial, with bearing maintenance alone accounting for 5–7% of total bridge maintenance expenditures [6]. The consequences of support jamming can be particularly severe. When bearing jamming occurs, thermal-induced displacements may produce excessive secondary stresses throughout the structural system, potentially leading to significant damage [7,8]. This phenomenon underscores the importance of comprehensive bearing displacement monitoring as an essential component of bridge health monitoring systems, enabling real-time assessment of support performance and early detection of structural deterioration [9].
To date, there are two primary methods to measure support displacement: contact measurement [10] and non-contact measurement [11]. The bridges under study in this paper adopts the contact magnetostrictive displacement sensors. Displacement sensors are installed at each movable support, with one end fixed to the pier or tower and the other to the main girder. Assuming negligible pier or tower deformation, support displacement not only reflects support mobility but also characterizes expansion–contraction behavior of the girder. The longitudinal deformation of the main girder is almost unrestricted during the initial stage of bridge operation. However, progressive support degradation leads to increased bearing friction, which gradually constrains this movement. In addition, for long-span railway bridges, large distances between girder joints often lead to mismatches between girder deformation and rail expansion devices under environmental and train loads. Consequently, precise monitoring of support displacement becomes essential for evaluating both bearing performance and rail expansion device functionality.
Many studies have focused on monitoring [12,13], early warning [14,15], and assessment [16,17] methods for support displacement. Furthermore, some research has demonstrated a significant linear correlation between support displacements and temperature [18,19]. Ni et al. [20] proposed a method to assess bridge expansion joints, which was based on the estimated displacement derived from the bridge effective temperature. Huang et al. [21] used a novel representative temperature for the purpose of issuing performance alerts regarding bridge expansion joints. Additionally, traffic loads also exert a considerable influence on support displacement [22,23,24]. Li et al. [25] conducted a comprehensive investigation into the structural response of extra-large-span steel truss girder suspension bridges under static loading conditions. Their work elucidated the characteristic patterns of longitudinal displacements at both support locations and girder ends across varying load configurations. Wang et al. [26] established a probabilistic framework for assessing sliding bearing wear through Monte Carlo simulation of cumulative displacements. In [27], the authors utilized measured displacement from a suspension bridge to calibrate the finite element model. Subsequently, a linear regression analysis was performed between the cumulative displacement of bearings and traffic flow, and wear condition in the sliding bearings was evaluated by comparing the cumulative displacement with critical thresholds specified in wear criteria. The above-mentioned research offers theoretical support for the monitoring, early-warning, and assessment applications concerning bridge bearings. However, limited research has been conducted on employing support displacement differences for early warning of the expansion–contraction consistency of the main girder. Furthermore, no quantitative assessment method has been reported for the jamming state of supports.
Considering the limitations in previous studies, a warning method based on the optimal probability distribution model and a method for evaluating support activity performance through jamming parameters were proposed in this paper based on two kilometer-scale railway bridges in China, which can provide novel approaches for the early warning and assessment of support and girder deformation. The framework of this study is organized as follows (see Figure 1). Initially, a moving interval generalized Grubbs method was utilized to identify and eliminate outliers in the raw data. Subsequently, the variation patterns of supports under the influence of temperature and train loads were analyzed. Finally, an intelligent early-warning and evaluation model for support and girder deformation was developed.
To address the limitations identified in previous research, this study proposes two innovative methodologies based on monitoring data from two kilometer-scale railway bridges in China: (1) an early-warning system utilizing optimal probability distribution modeling and (2) a quantitative assessment framework for support performance evaluation incorporating jamming parameters. These approaches offer novel solutions for monitoring and assessing both bridge support and girder deformation. The framework of this study is illustrated in Figure 1. Initially, an advanced moving interval generalized Grubbs test was employed for robust outlier detection and data preprocessing. Subsequently, the variation patterns of supports under the influence of temperature and train loads were analyzed. Finally, an intelligent early-warning and evaluation model for support and girder deformation was developed.

2. Data Preprocessing Method

Structural health monitoring (SHM) of bridges entails the identification and assessment of sudden or cumulative structural damage to ensure the continuous safe operation of bridges [28,29]. SHM is an integrated network of hardware and software components designed to assess structural integrity in real time [30]. Data acquisition initiates with front-end sensors, which act as the system’s “nerve endings,” measuring critical parameters such as strain, displacement, and vibration. These analog or digital signals are transmitted to an on-site data acquisition station, where they are converted into quantifiable structural response. Subsequently, the processed data are relayed to a centralized monitoring facility via wired or wireless communication networks for further analysis. At the monitoring center, the system software serves as the “brain,” autonomously executing a series of critical functions, including data logging, visualization, statistical analysis, anomaly detection, and structural health assessment, based on the vast volume of monitoring data. However, during real-time data transmission, anomalies may arise at any stage due to factors such as physical damage or performance degradation of front-end sensors, signal attenuation from aging transmission lines, hardware failures in data storage servers, or improper software parameter configurations.
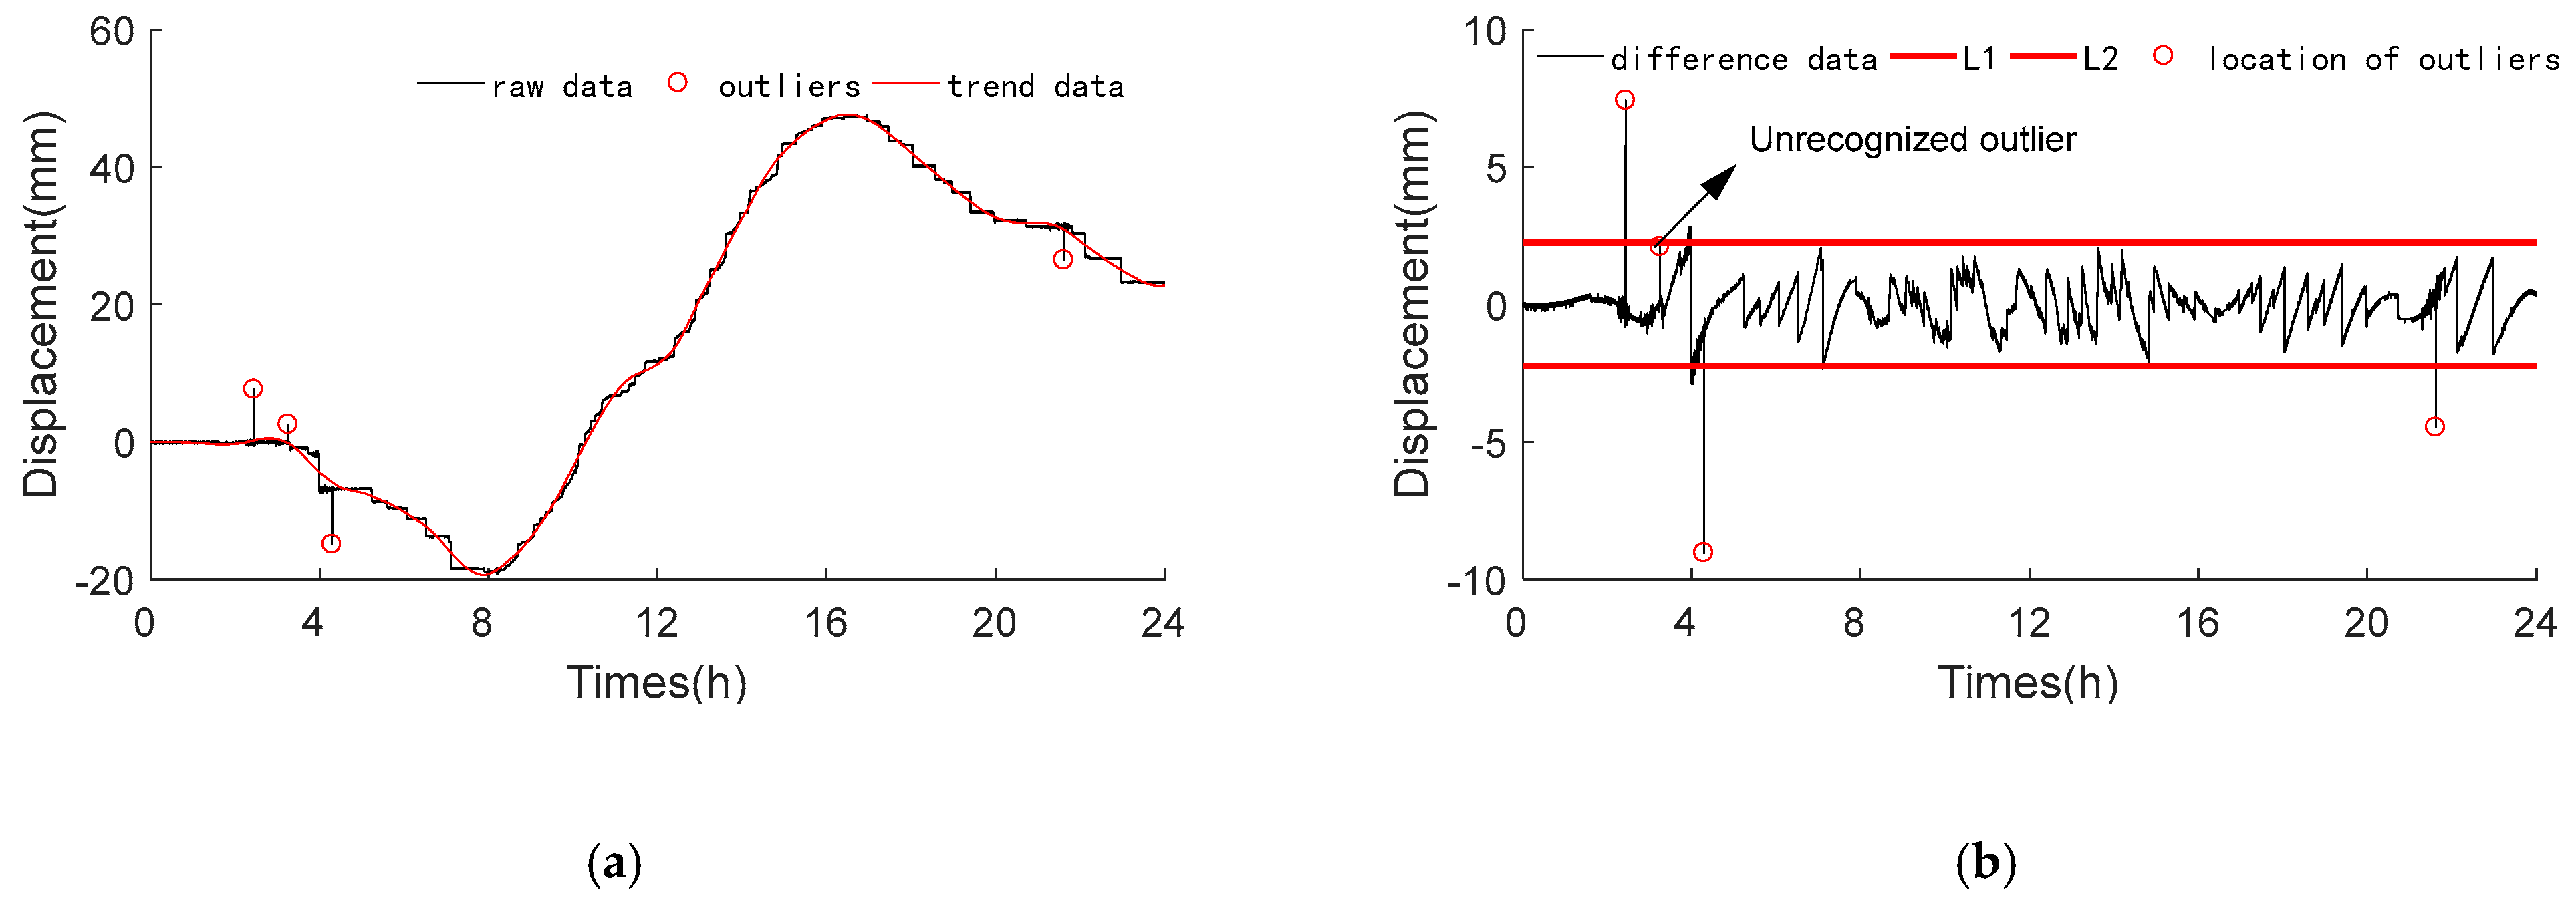
Given these challenges, abnormal data in bridge structural health monitoring systems are, to some extent, inevitable. While abnormal data occurrence cannot be entirely eliminated, their impact on system functionality can be minimized through proactive measures. Consequently, monitoring data must undergo rigorous preprocessing before extracting structural performance to ensure the reliability and accuracy of analytical results [31]. Therefore, data cleaning is a crucial step to ensure data quality and the proper functioning of system applications in SHM. There exist several criteria for outlier elimination in statistics, including the Pauta criterion, Chauvenet criterion, and Grubbs criterion. Among them, the Grubbs criterion stands out due to its theoretical rigor, adaptability to small samples, iterative detection capability, and strong resistance to interference, making it a significant method for anomaly data discrimination [32]. However, in bridge structural health monitoring systems, the relatively large volume of monitoring data, combined with the influence of long-term temperature trends, results in significant data dispersion, as shown in Figure 2a. Considering that trend data significantly influence the statistical characteristics of raw data, the Grubbs criterion is applied to the residual data after trend removal for outlier identification, as illustrated in Figure 2b. Here, L1 and L2 represent the upper and lower bounds for outlier detection. It can be observed that the traditional Grubbs criterion enables the localization and identification of outliers. Nevertheless, it struggles to capture outliers that deviate slightly from the true values. Consequently, it is difficult to achieve satisfactory results when applying the Grubbs criterion to handle outliers in a large volume of raw data.
To address the issues, this study proposes a novel moving interval generalized Grubbs method. The fundamental principles are as follows: Let the raw data be denoted as D . Wavelet transform (using Morlet wavelet, setting decomposition levels to 12) is used to decompose the raw data, and the low-frequency part of the signal is reconstructed as the trend data. The difference between the raw data and the trend data is calculated and denoted as d i f f = D D = x 1 , x 2 , , x n 1 .
On the basis of the difference d i f f = x 1 , x 2 , , x n 1 , add a window of length m , and then move the window in chronological order with a step size S from the front to the back. Let the window interval sample under the i-th step be x i , x i + 1 , , x i + m . Then, use the second-order difference of the window interval sample to describe the change characteristics of the difference, as follows:
d j = 2 x j ( x j + 1 + x j 1 ) , ( j = i + 1 , i + 2 , , i + m 1 )
where d ¯ is the interval mean value, and σ d ¯ is the mean square deviation.
d ¯ = j = 2 m 1 d j m 2 σ d ¯ = j = 2 m 1 ( d j d ¯ ) m 3
Interval data mean square deviation can be obtained using the following equation:
q j = d j d ¯ σ d ¯
When q j > a , the location of the outlier is j , where a is G p ( j ) in the Grubbs critical value table.
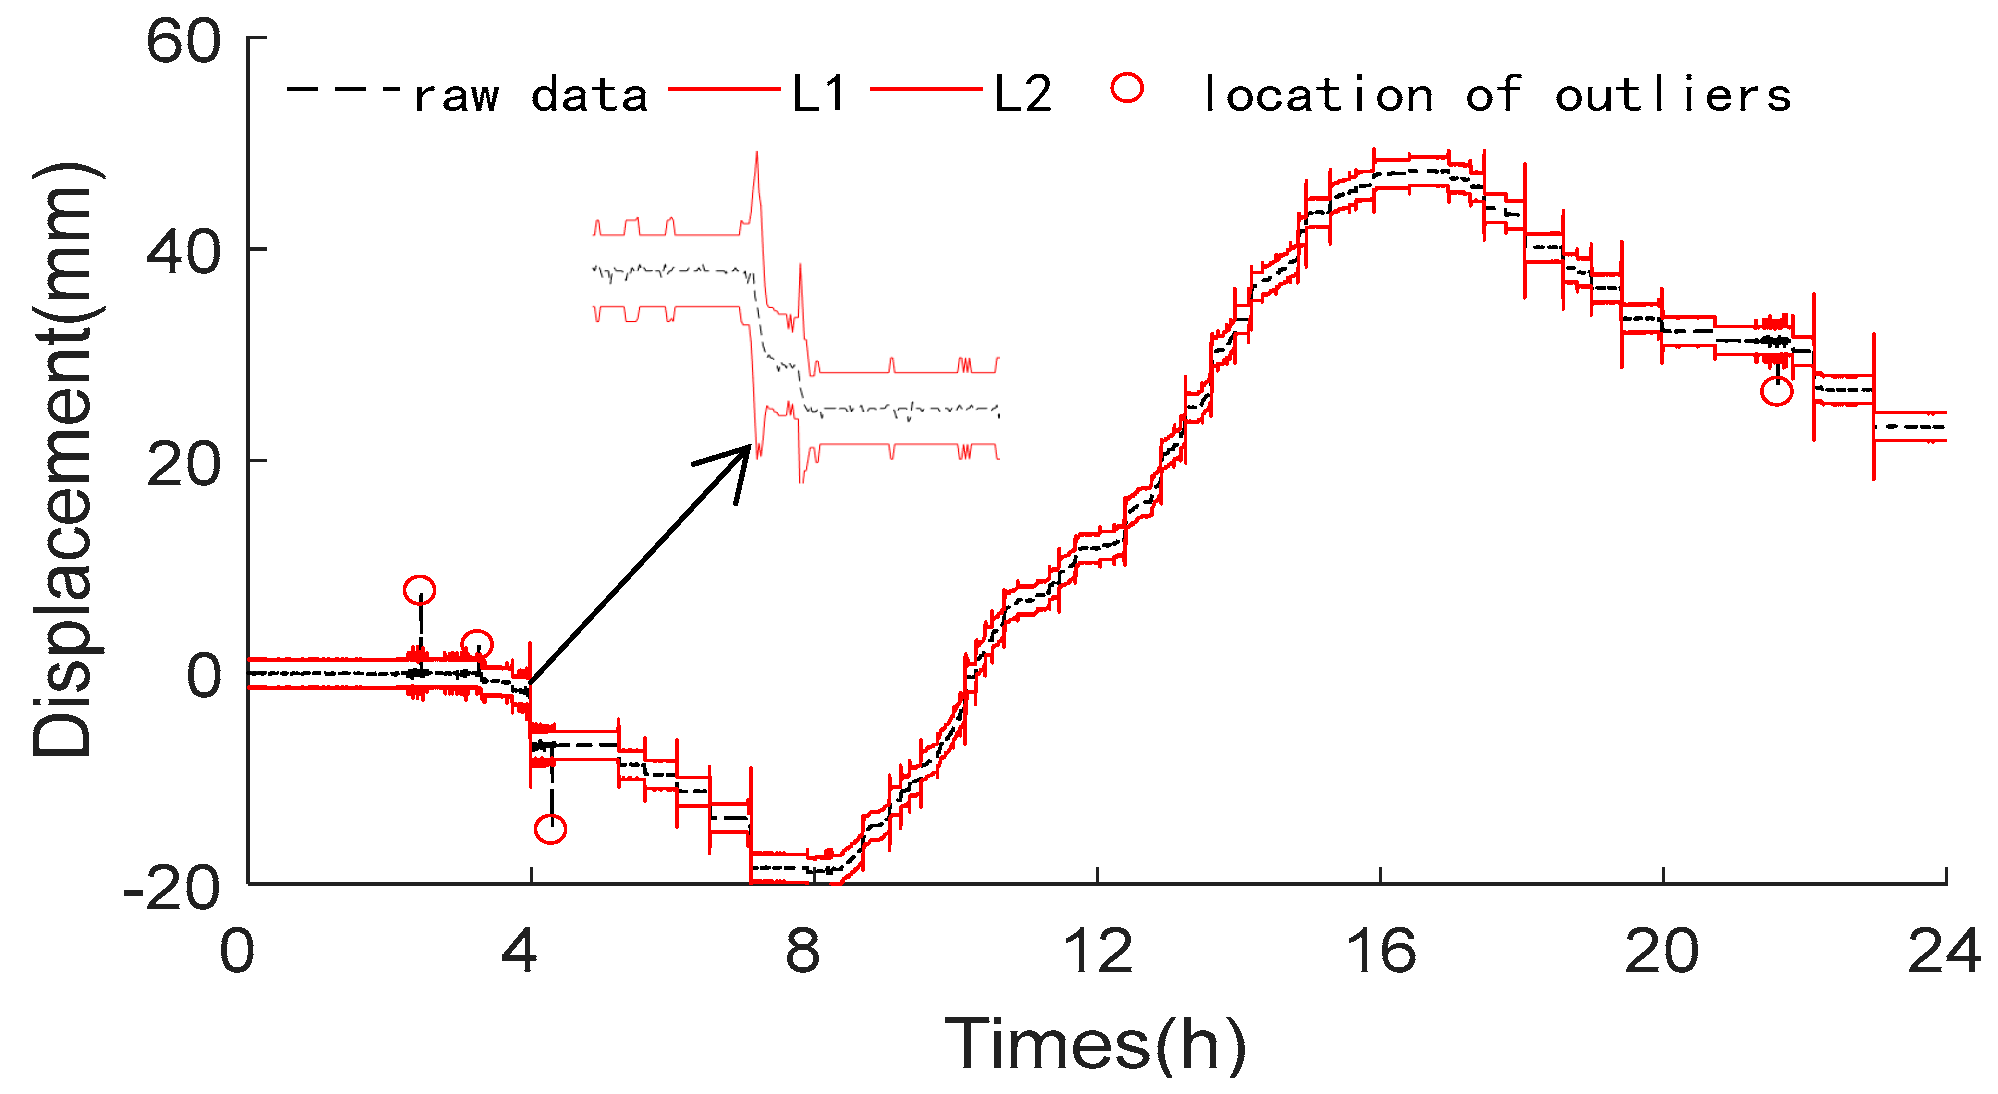
The moving interval generalized Grubbs method is versatile in data preprocessing. Wavelet analysis is employed to separate and reconstruct raw data, which can effectively mitigate the impact of the long-term trend in the data on the statistical eigenvalues. Meanwhile, detailed statistical characteristics of data changes are calculated between moving cells in the difference, facilitating the easier identification of outliers in the raw data, as illustrated in Figure 3.

3. Support Displacement Analysis

3.1. Bridge Description

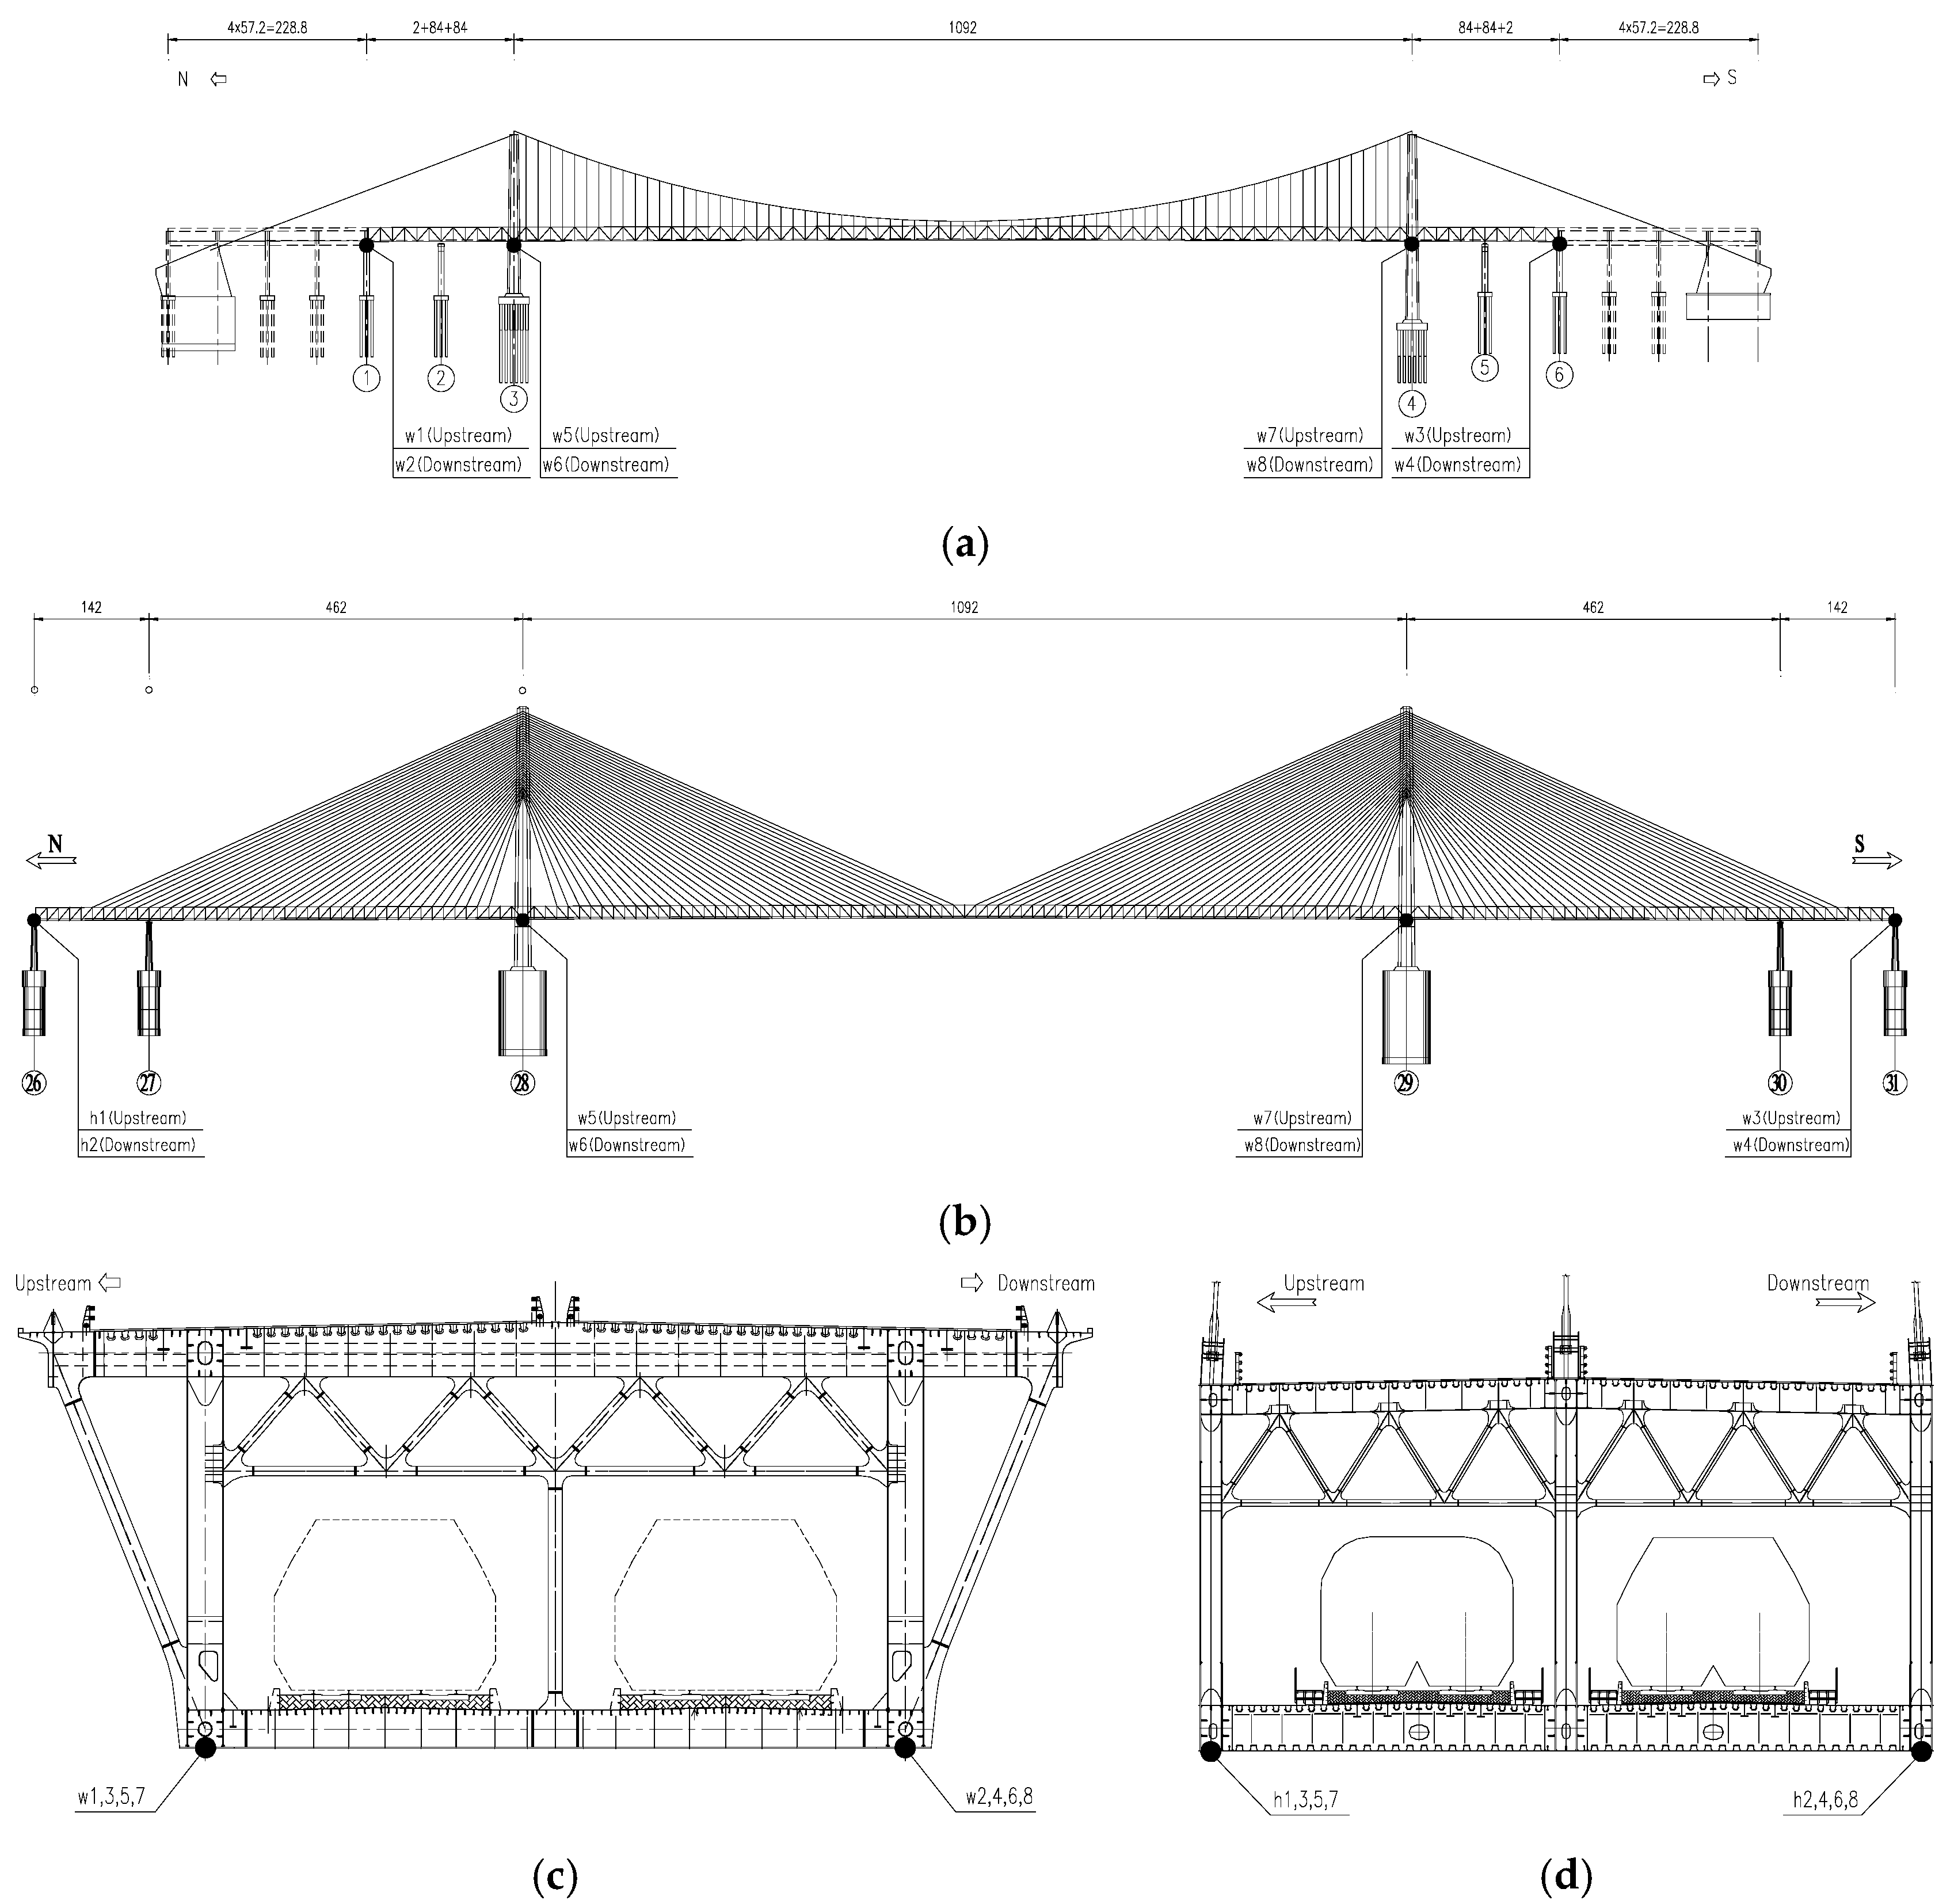
Bridge W is a railway suspension bridge with a five-span arrangement of (84 + 84 + 1092 + 84 + 84) m [33], as shown in Figure 4a. Bridge H is a railway cable-stayed bridge featuring a symmetrical span configuration of (140 + 462 + 1092 + 462 + 140) m [34] (see Figure 4b). Both bridges utilize steel truss girders, whose cross-sectional details are provided in Figure 4c,d. Displacement monitoring sensors were installed at the north and south girder ends and main tower locations.
The measurement points are represented as follows: w1/h1 denote the points located upstream of the north girder end; similarly, w2/h2 indicate the points downstream of the north girder end; w3/h3 represent the points upstream of the south girder end; w4/h4 signify the points downstream of the south girder end; w5/h5 are the points upstream of the north tower; w6/h6 correspond to the points downstream of the north tower; w7/h7 denote the points upstream of the south tower; and w8/h8 refer to the points downstream of the south tower.

3.2. Monitoring Results Analysis

To compare the support displacements of the two bridges, the monitored data from 2–11 January 2021 were preprocessed by normalizing the displacement measurements relative to the initial values. During the analysis period, the temperature at the W Bridge site varied from −8.92 °C to 9.60 °C, whereas that at the H Bridge site ranged from −8.82 °C to 9.11 °C. The daily temperature variation range was comparatively large, and the positive and negative temperature intervals exhibited a notable degree of symmetry, as illustrated in Figure 5. Furthermore, the lack of strong winds during this period offers favorable support for the analysis of the deformation patterns of supports under the combined influence of train loads and temperature.
The normalized displacements for the two bridges are denoted as w j and h j , respectively, where j represents the sensor point number. The monitoring data of support displacements are presented in Figure 6a,b, while their statistical characteristics are summarized in Table 1.
Throughout the analysis period, the absolute mean displacement differences between upstream and downstream supports at identical sectional positions of Bridges W and H ranged from 0.39 mm to 0.45 mm, demonstrating high consistency in displacement behavior. Both bridges exhibited quasi-sinusoidal daily displacement fluctuations, strongly correlated with temperature.
For Bridge W, the girder end and tower support showed minimal displacement differences, with near-identical statistical characteristics (maximum, minimum, mean, and amplitude), confirming structural and restraint system symmetry.
In contrast, the girder end and tower support of Bridge H exhibited significant displacement differences. The mean displacement amplitudes varied substantially: 229.94 mm (north girder end) vs. 173.87 mm (south girder end) and 140.6 mm (north tower) vs. 85.48 mm (south tower). It is likely that the abrasion of supports on the south side was greater than that on the north side, resulting in relatively large expansion and contraction deformations of the main girder on the north side.
Given that both bridges use steel truss girders with high stiffness, longitudinal deformations caused by vertical bending can be neglected in the analysis. We can employ the following empirical Formula (4) to calculate the thermal expansion and contraction of the main girders deformation:
L = α × L × T
where ∆L is girder deformation, L is the distance-to-bridge centerline, ∆T denotes temperature variation, and α is the material thermal expansion coefficient.
The thermal expansion coefficient of steel was taken as α = 1.2 × 10⁻² m/°C. During the monitoring period, the ambient temperature variations of W Bridge and H Bridge were ∆TW = 18.52 °C and ∆Th = 17.93 °C. Substituting these parameters into Formula (4) obtained the calculated thermal deformation functions: ∆Lw = 0.2222 × Lw and ∆Lh = 0.2152 × Lh. These functions represent the expected axial expansion/contraction of the main girders due to thermal effects. Figure 7 illustrates the spatial distribution of support displacement amplitudes relative to the bridge’s centerline. For Bridge W, the average displacement amplitudes during the analysis period were 154.07 mm (north girder end), 129.57 mm (north tower), 123.25 mm (south tower), and 148.81 mm (south girder end). These measured values align closely with empirical predictions, reflecting the high symmetry of its restraint system. In contrast, Bridge H exhibited significant asymmetries: 229.94 mm (north girder end), 140.07 mm (north tower), 85.48 mm (south tower), and 173.88 mm (south girder end), with notable deviations from empirical calculations. In addition, the temperatures at the bridge site of the two bridges were relatively close, yet there was a significant difference in the deformation of the main girders in the main span (1092 m). Among them, it can be observed that the deformation amplitude of the main girder of Bridge W was 251.13 mm, while that of the main span of Bridge H was 197.54 mm. Consequently, the deformation of the main girder of the cable-stayed bridge was relatively small, which indicates that the deformation of the main girder was restrained by the axial forces provided by the stay cables.
The asymmetry in the deformation of Bridge H, where the amplitudes on the north side were 35–64% larger than those on the south side, further reveals that there were certain differences in the restraint systems on the northern and southern sides of the structure. Given that the total length of the main girder of Bridge H was 2296 m and it experienced significant expansion and contraction deformation, the bridge end adopted the German BWG SA60-1800 rail expansion joint, with a designed expansion capacity of ±900 mm, which is the first application of its kind in the world. Since bridge commissioning, due to the relatively large longitudinal resistance of the expansion device and the presence of displacement asymmetries, problems such as concrete sleeper cracking, steel sleeper misalignment, and rail arching near the expansion joint have occurred, which, to a certain extent, have affected the traffic safety at the girder end [35].

3.3. Support Displacement Influenced by Train Loads

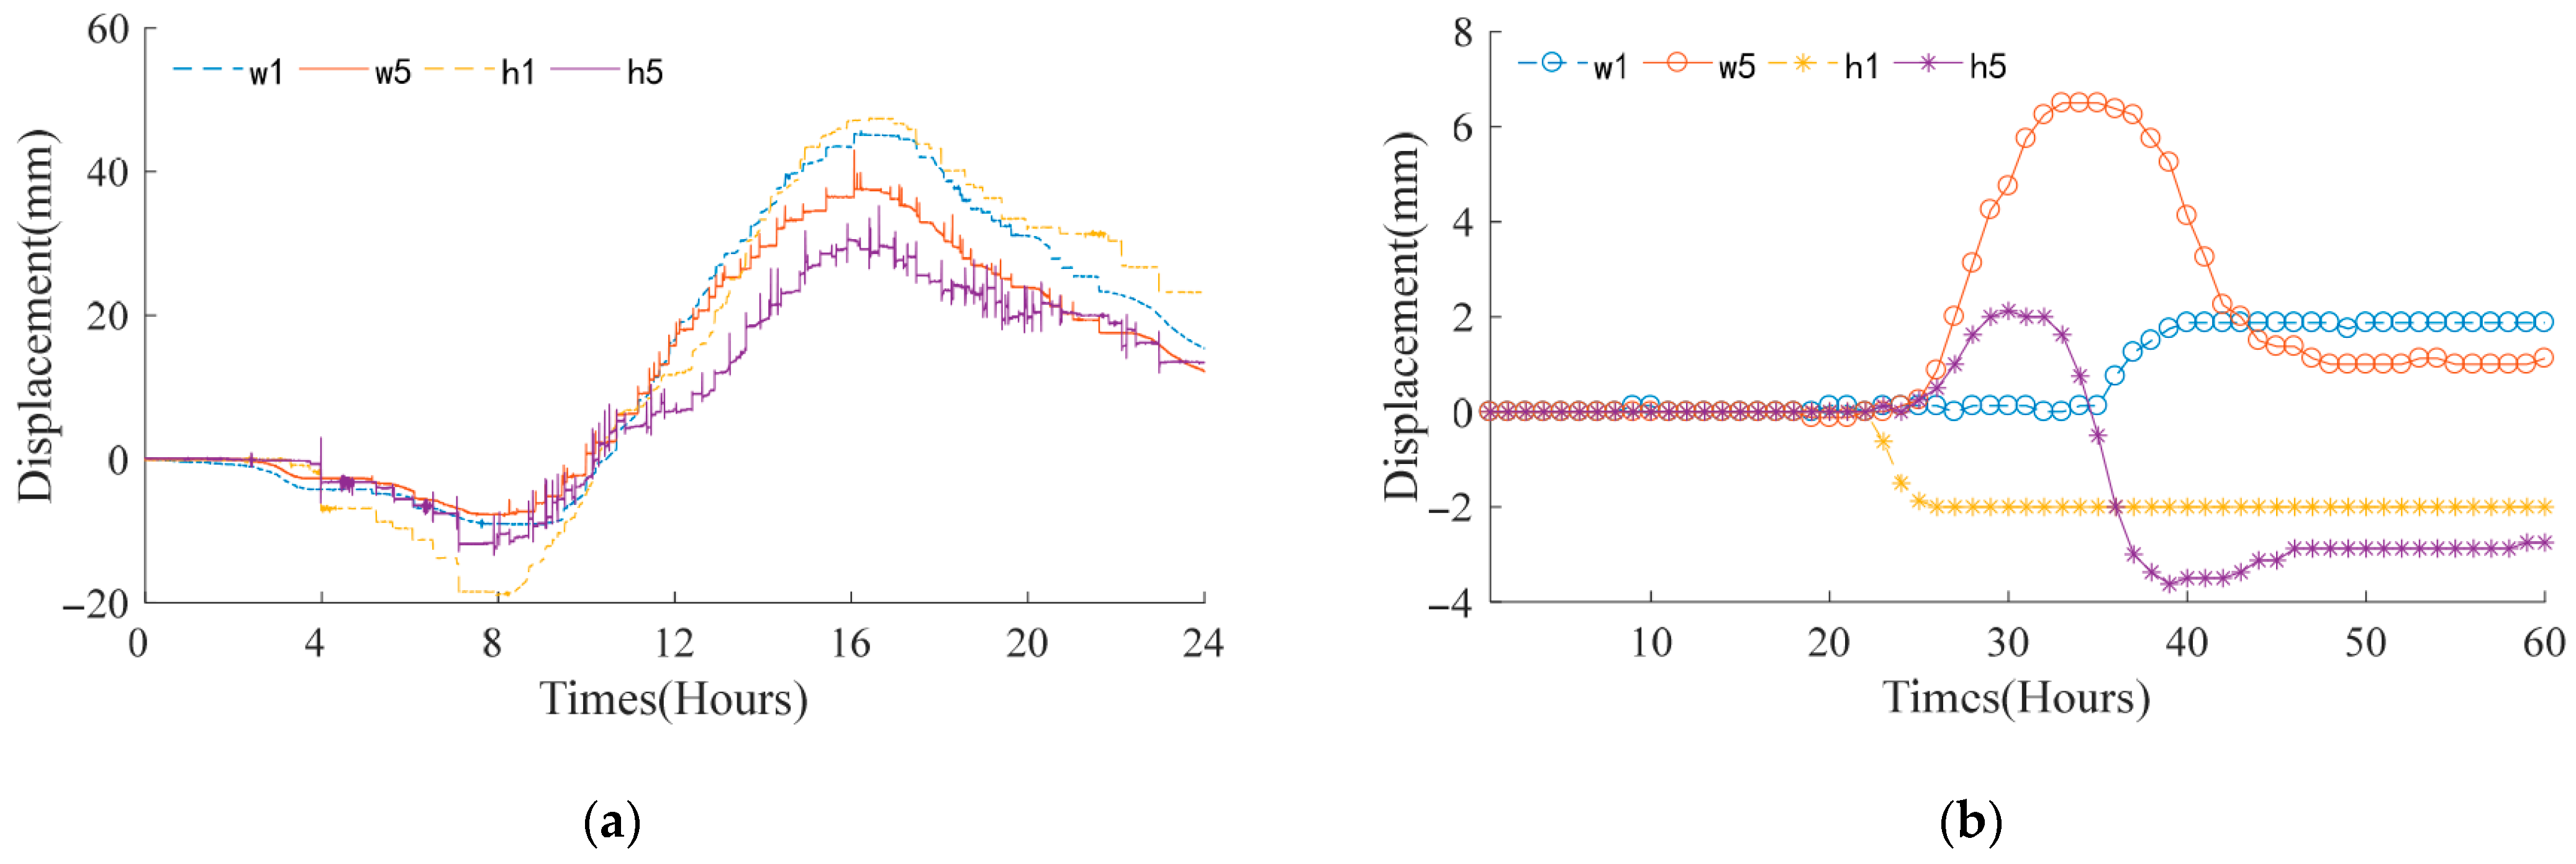
Analysis of the 2 January 2021 monitoring data reveals distinct support displacement patterns under train loads (Figure 8). Girder end support displacements show temperature-dependent behavior with superimposed train loads that temporarily relieve friction-induced deformations, causing instantaneous slip displacement (3–5 mm) whose direction correlates with temperature changing direction. Support displacements at the main tower exhibit greater sensitivity to train loads.
A further analysis was conducted on the variation mechanism of support displacements under the influence of train loads. As depicted in Figure 9, the pressure exerted by the bridge superstructure induces a specific frictional resistance between the main girder and its support. In this figure, N denotes the pressure from the superstructure, Z represents the support reaction force, T signifies the tensile force along the deformation direction, F indicates the frictional resistance at the support, F1 corresponds to the frictional resistance instantaneously released during sliding, and F2 is the residual frictional resistance retained within the support. During ambient temperature-induced deformation of the main girder, the frictional resistance F restricts minor deformations. When temperature fluctuations cause elongation or contraction exceeding F1, the support undergoes instantaneous sliding, thereby releasing the frictional resistance F1 generated by these minor deformations.

3.4. Support Displacement Influenced by Temperature

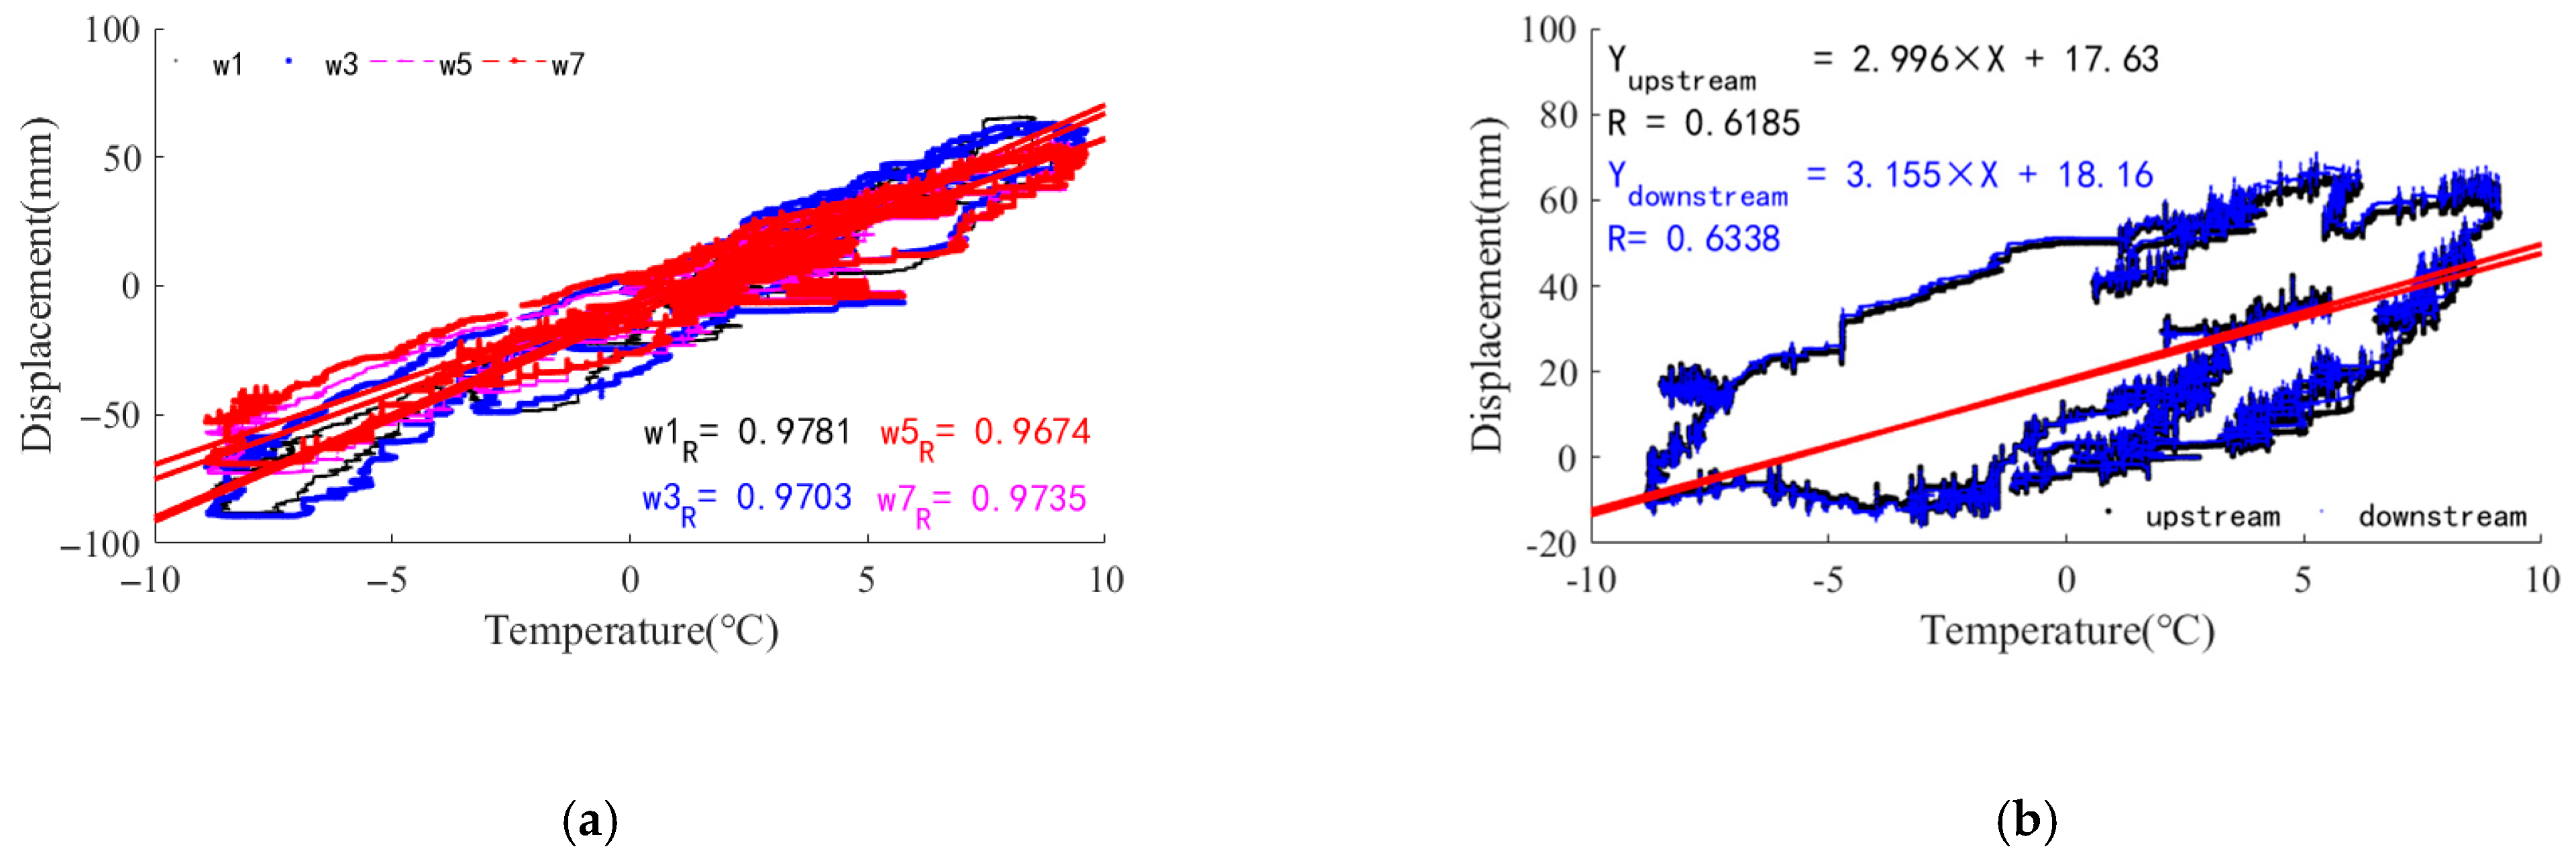
Since the effect of continuously varying temperature on the structure is more significant than that of other loads, the correlation between support displacements and temperature is analyzed. The correlation and statistical data between support displacement and temperature at the north girder end and north tower of W Bridge and H Bridge are presented in Figure 10 and Table 2. A positive correlation is observed between temperature and support displacement. Given that both variables generally vary synchronously, the linear fitting parameters (slope k and correlation coefficient R) for support displacement and temperature within the same section are nearly identical.
During the analysis period, the linear correlation coefficient between support displacement and temperature exceeds 0.9649 for W Bridge, indicating a highly significant relationship. Similarly, for H Bridge, the correlation coefficients at the north girder end and north tower support are above 0.9588, whereas those at the south tower support and south girder end average 0.8423 and 0.6261, respectively. The south-side supports exhibit weaker correlations compared with other measurement points. Additionally, the relationship between temperature and support displacement demonstrates hysteresis loop characteristics. This phenomenon occurs because temperature changes do not instantaneously induce uniform temperature variations in the main girder, resulting in a delayed structural response. Particularly for the south tower support of H Bridge, the time-lag effect is more pronounced, as shown in Figure 10b.

4. Intelligent Early Warning Method of Support Displacement

4.1. Establishment and Verification of Early-Warning Model

In railway bridges, extreme weather and uneven support wear conditions can induce uncoordinated deformation in girder sections, potentially resulting in track irregularities or joint jamming, which may lead to traffic safety [36,37,38]. To achieve early warning for uncoordinated deformation, a probability distribution model of support displacement should be built first. In this study, an optimal probability distribution algorithm based on support displacement differences at the same cross section was proposed to set early-warning thresholds.
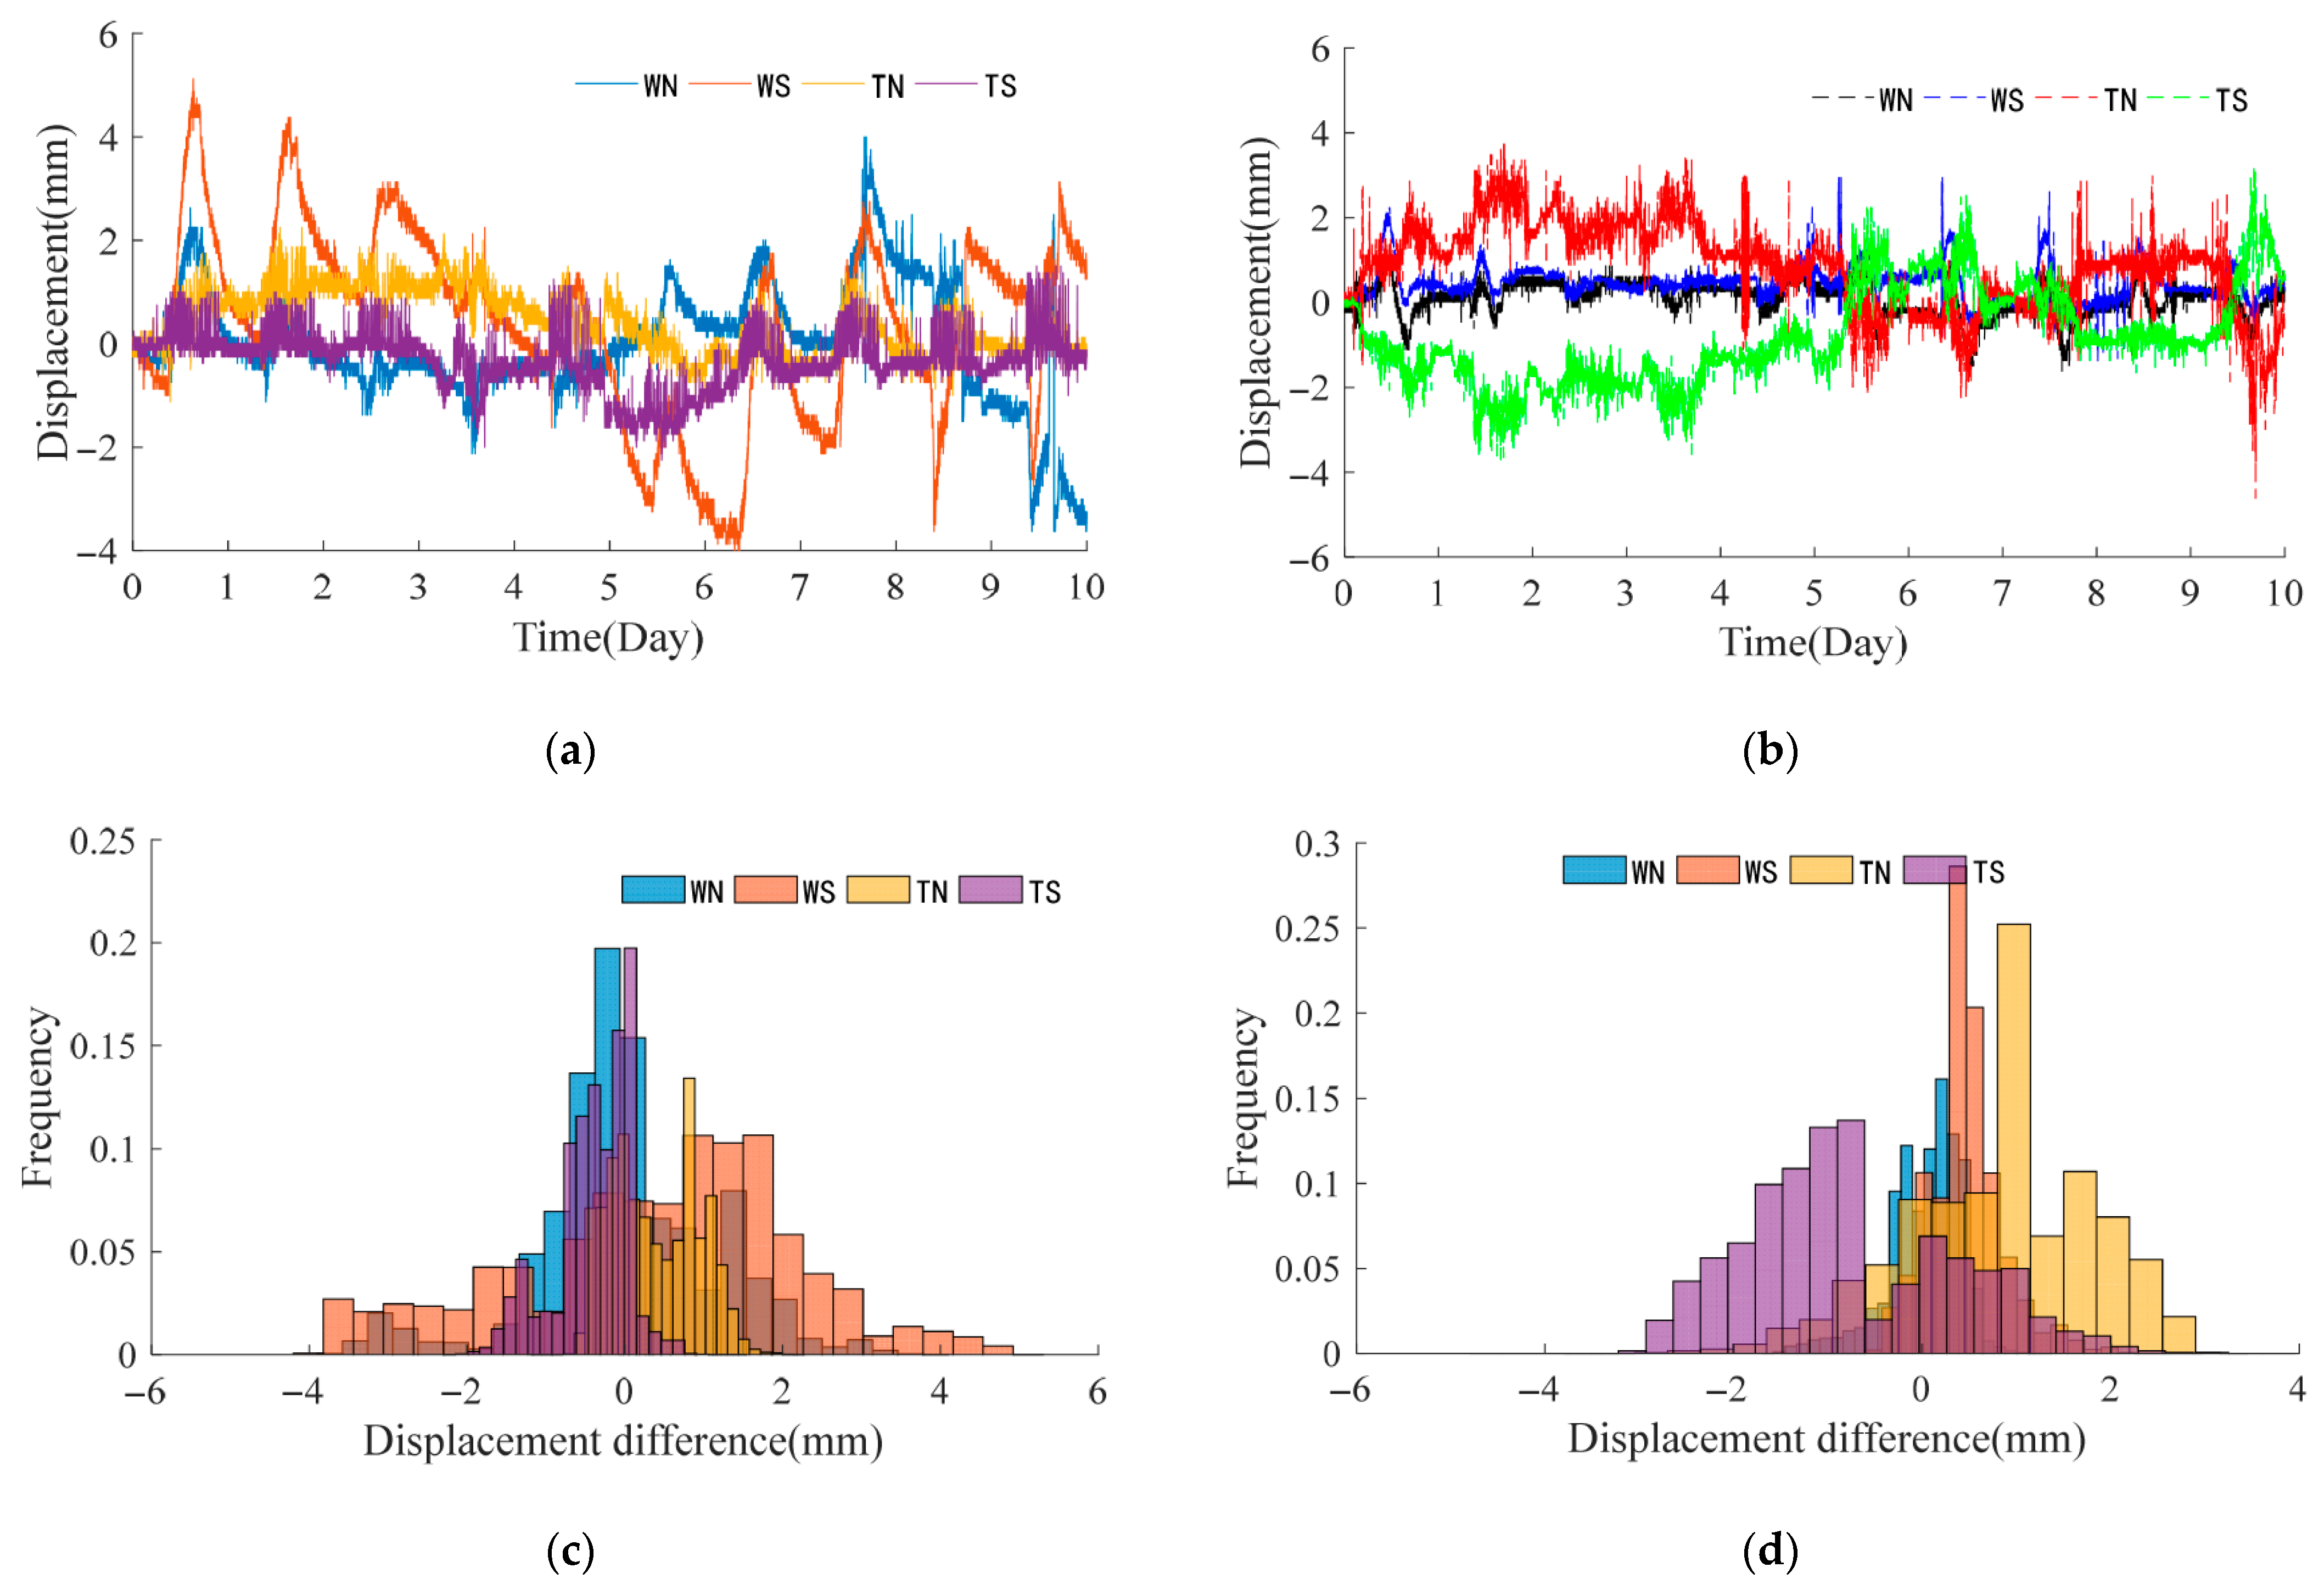
Figure 11 and Table 3 present the time histories and statistical data of displacement differences in Bridge W and Bridge H. It can be found that Bridge W exhibits periodic fluctuations in displacement differences, whereas Bridge H displays axisymmetric distribution around zero. Displacement differences across all sections remain within 10 mm, with girder end values exceeding those at the main tower. Long-term statistical analysis of these displacement differences can facilitate early warnings for girder asymmetric deformation state [39].
Furthermore, the early-warning threshold can be set by utilizing the probabilistic statistical characteristics of support displacement differences. Considering that there are certain differences in the parameters of different probability models [40], an optimal probabilistic statistical method is proposed in this paper. It is based on the criterion of minimizing the mean square deviation between the frequency values of data in each segment and the integral values of the probability distribution function. This is achieved by iteratively invoking all types of probability distribution functions in MATLAB (2016b). The principle of the algorithm is as follows:
(1)
Record the absolute value of the displacement difference as D i ,   i = 1 , 2 , , n , which is the data location.
(2)
Initialize the distribution function, select the Gaussian distribution function, and calculate the distribution characteristics and distribution function expression f of D i .
(3)
Divide the monitoring data D i into m intervals; calculate the frequency value p j of the displacement difference of the j-th (j = 1, 2, 3, …, m) interval, as well as the integral value f r e j of the distribution function.
(4)
Based on the principle of least squares, calculate the residuals between the frequency values p j and the distribution function integral values f r e j in each segment r i = p i f r e i , ( i = 1 , 2 , , m ) . Use the sum of the squares of the 2-norm of the vector to measure the degree of fitting model, denoted as a = i = 1 n r i 2 . A smaller a indicates that the distribution function is closer to the optimal probability distribution.
(5)
Iterate through all distribution functions in the MATLAB (2016b) toolbox, with the criterion of min ( i = 1 n r i 2 ) being the smallest; calculate the optimal probability distribution function f ; and obtain the statistical characteristics of the distribution function.
(6)
Calculate the quantile value of the optimal probability distribution function f at a 97.5% confidence level as the early-warning threshold for the displacement difference of the support.
In an ideal state, if the upstream and downstream expansions of the main beam are consistent, the displacement difference would be 0 mm. However, due to the influence of uneven temperature fields, trains, wind loads, and different frictional resistances of supports, there are certain discrepancies in the displacement of the upstream and downstream supports. If the support displacement difference is significant, it indicates that the main girder deformation is inconsistent. Prolonged exposure to such a state may give rise to problems including track irregularity and deterioration of expansion joints. Based on this, taking the displacement difference of H Bridge as a case study, the top 4 probability distribution characteristics are shown in Figure 12a,b. When it is observed that the subsequent analysis model deviates from the statistical model established under healthy conditions, it can be inferred that either the activity performance of the supports has deteriorated, or there is an inconsistency of the main girder deformation.

4.2. Evaluation of Support Wear and Jamming

Various types of diseases of supports are highly likely to restrict the movement of supports, resulting in jamming phenomena. As shown in Figure 13, when significant wear on the support and jamming occurs, the support constrains the deformation of the beam. Consequently, on the displacement-time history curve of the support, a prolonged stagnation phenomenon is highly likely to appear. Moreover, when temperature variations cause a relatively large amount of expansion and contraction deformation of the main beam, under the condition of support wear, the support will generate a relatively large amount of sliding deformation in a short period to release the compressive deformation of the beam caused by temperature effects. Thus, on the displacement-time history curve of the support, one or more relatively large instantaneous sliding displacements will be presented.
To quantitatively assess support wear and jamming conditions, a method for evaluating support activity performance through jamming parameters was presented. We define a dimensionless jamming parameter λ that characterizes support mobility performance. As shown in Figure 14, the support displacement time-history curve for Bridge H (h7) is presented, with the periods during which the support exhibits minimal change (change values are less than the precision) highlighted in red on the time-history graph. The λ calculation method is as follows:
Step1: Obtain the support displacement data, noted as D i , i = 1 , 2 , , I , in which I represents the total number of data.
Step2: Define the segment length A , divide the support displacement data into segments M , and record the segment data as D m , m = 1 , 2 , , M , I = A × M .
Step3: Calculate the data change amplitude of each segment, recorded as D m = max ( D m ) min ( D m ) , and calculate the position and number M , where the segment data change amplitude is less than the set parameter X .
Step4: Calculate the support displacement performance evaluation parameter λ = ( M × A ) / I × 100 % . The closer it is to 0, the better is the movement performance of the support, and the closer it is to 1, which means that the support is jammed seriously. When λ = 1 , it means that the support has lost its ability to move.
Using the upstream support displacement monitoring data from the south tower of H Bridge as a case study, we analyzed the support performance characteristics. Given the negligible ambient temperature variation observed within 1 min intervals, the displacement time series h 7 is divided into A = 60 segments for detailed evaluation; X sets 0.1 mm. Following the methodology described in Section 4, we calculate the displacement performance evaluation parameter λ 7 = ( 6596 × 60 ) / 864000 × 100 % = 45.81 % for each measurement location. Table 4 presents the comparative results for both bridge supports. As can be seen, the evaluation parameters indicate that the south tower and south girder end supports of H Bridge display significantly greater frictional resistance than the other supports.
To further validate the stability of jamming parameters, an analysis was conducted on the influencing factors of jamming parameters, namely, segments M and parameter X, based on H Bridge monitoring data. Utilizing the control variable method, segments M were initially held constant, while parameter X was varied from 0.06 mm to 0.14 mm with a step size of 0.01 mm, which is around an equipment precision of 0.1 mm. The variations in jamming parameters for each support were then recorded, as shown in Table 5. It can be observed that when parameter X takes values near the sensor precision, the jamming parameters for each support are identical. However, when parameter X is relatively small, the uncertainty in the monitoring data increases due to the influence of sensor precision. Conversely, when parameter X is relatively large, the jamming parameters cannot accurately reflect the jamming state of the supports.
Similarly, employing the control variable method, parameter X was initially fixed at 0.1 mm, while segments M were varied from 20 s to 100 s with a step size of 20 s. The variations in jamming parameters for each support were then recorded, as presented in Table 6. It can be observed that the segment length M exerts a relatively significant influence on the jamming parameters. Since the segment length represents time, generally, a shorter time duration allows for the neglect of temperature variations’ impact on the jamming parameters. However, within the same dataset, the jamming parameters for the supports at the main tower are consistently larger, indicating a consistent pattern in the wear state of the supports.

5. Conclusions

This study addresses limitations in conventional Grubbs criterion methods by developing an enhanced moving interval generalized Grubbs approach for accurate anomaly detection in large-scale, long-term monitoring datasets. Comprehensive analysis of bearing displacement patterns in suspension (W Bridge) and cable-stayed (H Bridge) bridges revealed distinct behavioral characteristics: W Bridge exhibits symmetrical support deformations, indicating balanced restraint, while H Bridge shows asymmetric deformation (north > south), suggesting differential wear states. Both bridges demonstrate strong correlations between girder end displacements and temperature variations (R ≥ 0.9649 for W Bridge; R ≥ 0.9588 for H Bridge), confirming thermal effects as a dominant factor alongside train loads.
To resolve critical gaps in expansion–contraction monitoring and bearing assessment, we developed two innovative solutions: (1) a probability distribution-based early-warning system for displacement differences and (2) a jamming parameter methodology for quantitative wear evaluation. These methods have been applied effectively in practical engineering projects, enabling early warning of abnormal main girder deformation and quantitative evaluation of bearing wear. These advancements provide engineers with reliable tools for the maintenance and safety management of bridges.
Given the data dependency of the proposed methodology, parameter calibration must be systematically performed using long-term monitoring data from bridge SHM systems. A representative case is the determination of warning thresholds for the consistency of expansion and contraction, where the optimal probability distribution model requires adaptive parameterization based on continuously updated monitoring datasets. To address inherent variations in statistical characteristics across different monitoring periods, the framework incorporates a dynamic updating mechanism that automatically recalibrates model parameters when new monitoring data become available, ensuring sustained accuracy in early-warning performance throughout the bridge’s service life.

Author Contributions

Conceptualization, X.L., T.G. and Z.C.; methodology, X.L. and T.G.; formal analysis, X.L. and H.Z.; investigation, X.L., Z.C. and H.Z.; data curation, X.L.; writing—original draft preparation, X.L., T.G. and Z.C.; writing—review and editing, X.L. and Z.C.; supervision, T.G.; funding acquisition, X.L., T.G. and H.Z. All authors have read and agreed to the published version of the manuscript.

Funding

This research was funded by the “National Key R&D Program of China” (No. 2023YFB3711500), “National Natural Science Foundation of China” (No. U23A20661), and “China Railway Engineering Corporation Science and Technology Research and Development Project” (2022-Key-44).

Institutional Review Board Statement

Not applicable.

Informed Consent Statement

Not applicable.

Data Availability Statement

The original contributions presented in this study are included in the article. Further inquiries can be directed to the corresponding authors.

Conflicts of Interest

Author Xing Liu was employed by the company China Railway Bridge & Tunnel Technologies. The remaining author declare that the research was conducted in the absence of any commercial or financial relationships that could be construed as a potential conflict of interest.

References

  1. Yanez-Borjas, J.J.; Valtierra-Rodriguez, M.; Camarena-Martinez, D.; Amezquita-Sanchez, J.P. Statistical time features for global corrosion assessment in a truss bridge from vibration signals. Measurement 2020, 160, 107858. [Google Scholar] [CrossRef]
  2. Deng, L.; Yan, W.; Nie, L. A simple corrosion fatigue design method for bridges considering the coupled corrosion-overloading effect. Eng. Struct. 2019, 178, 309–317. [Google Scholar] [CrossRef]
  3. Wang, B.; Wu, Y.; Zhao, W.; Wu, T. A visual measurement method of vibration displacement of railway bridge bearings based on phase correlation. Measurement 2025, 240, 115600. [Google Scholar] [CrossRef]
  4. Wu, G.M.; Yi, T.H.; Yang, D.H.; Li, H.N. Damage detection of tension pendulums in cable-stayed bridges using structural frequency variance. J. Perform. Constr. Facil. 2021, 35, 4020126. [Google Scholar] [CrossRef]
  5. Freire, L.M.R.; De Brito, J.; Correia, J.R. Management system for road bridge structural bearings. Struct. Infrastruct. Eng. 2014, 10, 1068–1086. [Google Scholar] [CrossRef]
  6. Freire, L.M.R.; De Brito, J.; Correia, J.R. Inspection survey of support bearings in road bridges. J. Perform. Constr. Facil. 2015, 29, 4014098. [Google Scholar] [CrossRef]
  7. Yarnold, M.T.; Moon, F.L. Temperature-based structural health monitoring baseline for long-span bridges. Eng. Struct. 2015, 86, 157–167. [Google Scholar] [CrossRef]
  8. Xia, Q.; Xia, Y.; Wan, H.P.; Zhang, J.; Ren, W. Condition analysis of expansion joints of a long-span suspension bridge through metamodel-based model updating considering thermal effect. Struct. Control. Health Monit. 2020, 27, e2521. [Google Scholar] [CrossRef]
  9. Sun, B.; Zheng, G.; Zhang, X. Application of contact laser interferometry in precise displacement measurement. Measurement 2021, 174, 108959. [Google Scholar] [CrossRef]
  10. Ribeiro, D.; Santos, R.; Cabral, R.; Saramago, G.; Montenegro, P.; Carvalho, H.; Correia, J.; Calçada, R. Non-contact structural displacement measurement using unmanned aerial vehicles and video-based systems. Mech. Syst. Signal Process. 2021, 160, 107869. [Google Scholar] [CrossRef]
  11. Hui, L.X.; Lei, G.; Yan, W.; Haoran, S.; Yong, H. Micro-displacement amplifier of giant magnetostrictive actuator using flexure hinges. J. Magn. Magn. Mater. 2022, 556, 169415. [Google Scholar] [CrossRef]
  12. Chu, X.; Zhou, Z.; Zhu, W.; Duan, X. Multi-point displacement synchronous monitoring method for bridges based on computer vision. Appl. Sci. 2023, 13, 6544. [Google Scholar] [CrossRef]
  13. Bhandari, P.; Jang, S.; Malla, R.B.; Han, S. ANN-based bridge support fixity quantifica-tion using thermal response data from real-time wireless sensing. Sensors 2024, 24, 5350. [Google Scholar] [CrossRef]
  14. Wu, G.M.; Yi, T.H.; Yang, D.H.; Li, H.N.; Liu, H. Early warning method for bearing displacement of long-span bridges using a proposed time-varying temperature-displacement model. J. Bridge Eng. 2021, 26, 04021068. [Google Scholar] [CrossRef]
  15. Ma, Y.; Zhang, B.; Huang, K.; Wang, L. Probabilistic prediction and early warning for bridge bearing displacement using sparse variational gaussian process regression. Struct. Saf. 2025, 114, 102564. [Google Scholar] [CrossRef]
  16. Cui, M.; Wu, G.; Dang, J.; Chen, Z.; Zhou, M. Deep learning-based condition assessment for bridge elastomeric bearings. J. Civ. Struct. Health Monit. 2022, 12, 245–261. [Google Scholar] [CrossRef]
  17. Kollar, D.; Kovesdi, B.; Volgyi, I.; Biro, I. Assessment of deformation in bridge bearing areas using measurements and welding simulation. J. Constr. Steel Res. 2022, 194, 107305. [Google Scholar] [CrossRef]
  18. Zhou, G.D.; Yi, T.H.; Chen, B.; Zhang, H. Analysis of three-dimensional thermal gradients for arch bridge girders using long-term monitoring data. Smart Struct. Syst. 2015, 15, 469–488. [Google Scholar] [CrossRef]
  19. Zhang, Y.; Gao, L.; Ding, J.; Qin, Y.; Zhong, Y.; Lu, B. Study on peculiar beam-rail interaction on road-cum-rail bridges with thousand-meter-scale main span. J. China Railw. Soc. 2023, 45, 80–87. [Google Scholar]
  20. Ni, Y.Q.; Hua, X.G.; Wong, K.Y.; Ko, J.M. Assessment of bridge expansion joints using long-term displacement and temperature measurement. J. Perform. Constr. Facil. 2007, 21, 143–151. [Google Scholar] [CrossRef]
  21. Huang, H.B.; Yi, T.H.; Li, H.N.; Liu, H. New representative temperature for performance alarming of bridge expansion joints through temperature-displacement relationship. J. Bridge Eng. 2018, 23. [Google Scholar] [CrossRef]
  22. McCarthy, E.; Wright, T.; Padgett, J.E.; DesRoches, R.; Bradford, P. Development of an experimentally validated analytical model for modular bridge expansion joint behavior. J. Bridge Eng. 2014, 19, 235–244. [Google Scholar] [CrossRef]
  23. Deng, Y.; Li, A.; Liu, Y.; Chen, S. Investigation of temperature actions on flat steel box girders of long-span bridges with temperature monitoring data. Adv. Struct. Eng. 2018, 21, 2099–2113. [Google Scholar] [CrossRef]
  24. Asad, A.T.; Kim, B.; Cho, S.; Sim, S.-H.; Jankowski, Ł. Prediction model for long-term bridge bearing displacement using artificial neu-ral network and bayesian optimization. Struct. Control. Health Monit. 2023, 2023, 6664981. [Google Scholar] [CrossRef]
  25. Li, X.; Xiao, J.; Liu, D.; Liu, Z. Performance Influence of Train Driving on Shanghai-Nantong Yangtze River Bridge Considering Additional Deformation. J. Railw. Eng. Soc. 2016, 33, 63–68. [Google Scholar]
  26. Wang, G.X.; Ding, Y.L.; Song, Y.S.; Wu, L.-Y.; Yue, Q.; Mao, G.-H. Detection and location of the degraded bearings based on monitoring the longitudinal expansion performance of the main girder of the dashengguan yangtze bridge. J. Perform. Constr. Facil. 2016, 30, 4015074. [Google Scholar] [CrossRef]
  27. Gao, W.; Li, G.; Su, Q.; Han, W. Impact of rigid central clamps on longitudinal deformation of long-span suspension bridges under vehicle excitations. Struct. Infrastruct. Eng. 2022, 18, 760–774. [Google Scholar] [CrossRef]
  28. Zhang, B.; Ren, Y.; He, S.; Gao, Z.; Li, B.; Song, J. A review of methods and applications in structural health monitoring (SHM) for bridges. Measurement 2025, 245, 116575. [Google Scholar] [CrossRef]
  29. Lee, T.; Jin, S.S.; Kim, S.T.; Min, J. Online anomaly detection for long-term structural health monitoring of caisson quay walls. Eng. Struct. 2025, 323, 119197. [Google Scholar] [CrossRef]
  30. Khan, S.M.; Atamturktur, S.; Chowdhury, M.; Rahman, M. Integration of structural health monitoring and intelligent transportation systems for bridge condition assessment: Current status and future direction. IEEE Trans. Intell. Transp. Syst. 2016, 17, 2107–2122. [Google Scholar] [CrossRef]
  31. Deng, Y.; Zhao, Y.; Ju, H.; Yi, T.-H.; Li, A. Abnormal data detection for structural health monitoring: State-of-the-art review. Dev. Built Environ. 2024, 17, 100337. [Google Scholar] [CrossRef]
  32. Xie, G.; Chen, W.; Liu, X.; Zheng, K.; Zou, B.; Sun, H. Research and application of verification error data processing of electricity meter based on grubbs criterion. In Proceedings of the 2019 International Conference on Smart Grid and Electrical Automation (ICSGEA), Xiangtan, China, 10–11 August 2019. [Google Scholar]
  33. Liu, X.; Sun, Z.; Guo, T. Deflection Prediction of a Rail-Cum-Road Suspension Bridge Under Multiple Operational Loads With Improved GPR and FSF. Struct. Control Health Monit. 2024, 2024, 8880157. [Google Scholar] [CrossRef]
  34. Gao, Z.; Xu, W.; Mei, X.; Zhang, Y.; Huo, X. Key construction technology of HuSuTong yangtze river bridge. Struct. Eng. Int. 2023, 33, 84–88. [Google Scholar] [CrossRef]
  35. Peng, L.L. Technical scheme and application of track-bridge integrated inspection and monitoring system for long-span bridges. Railw. Eng. 2023, 63, 33–37. [Google Scholar]
  36. Qin, S.; Gao, Z. Developments and prospects of long-span high-speed railway bridge technologies in China. Engineering 2017, 3, 787–794. [Google Scholar] [CrossRef]
  37. Yang, X.; Zhou, Y.; Li, X.; Zhang, J. Effect of temperature changes on bearing motion of long-span steel truss continuous girder bridge. Constr. Build. Mater. 2024, 430, 136440. [Google Scholar] [CrossRef]
  38. Liu, J.; Liu, Y.; Jiang, L.; Zhang, N. Long-term field test of temperature gradients on the composite girder of a long-span cable-stayed bridge. Adv. Struct. Eng. 2019, 22, 2785–2798. [Google Scholar] [CrossRef]
  39. Miao, C.Q.; Deng, Y.; Ding, Y.L.; Li, A.Q. Damage alarming for bridge expansion joints using novelty detection technique based on long-term monitoring data. J. Cent. South Univ. 2013, 20, 226–235. [Google Scholar] [CrossRef]
  40. Zhu, R.; Guo, T.; Xie, L.; Song, L.; Yang, K.; Tesfamariam, S. Seismic risk assessment of self-centering prestressed concrete frames with sliding and masonry infill walls: Experimental and numerical models. Bull. Earthq. Eng. 2024, 22, 4115–4141. [Google Scholar] [CrossRef]
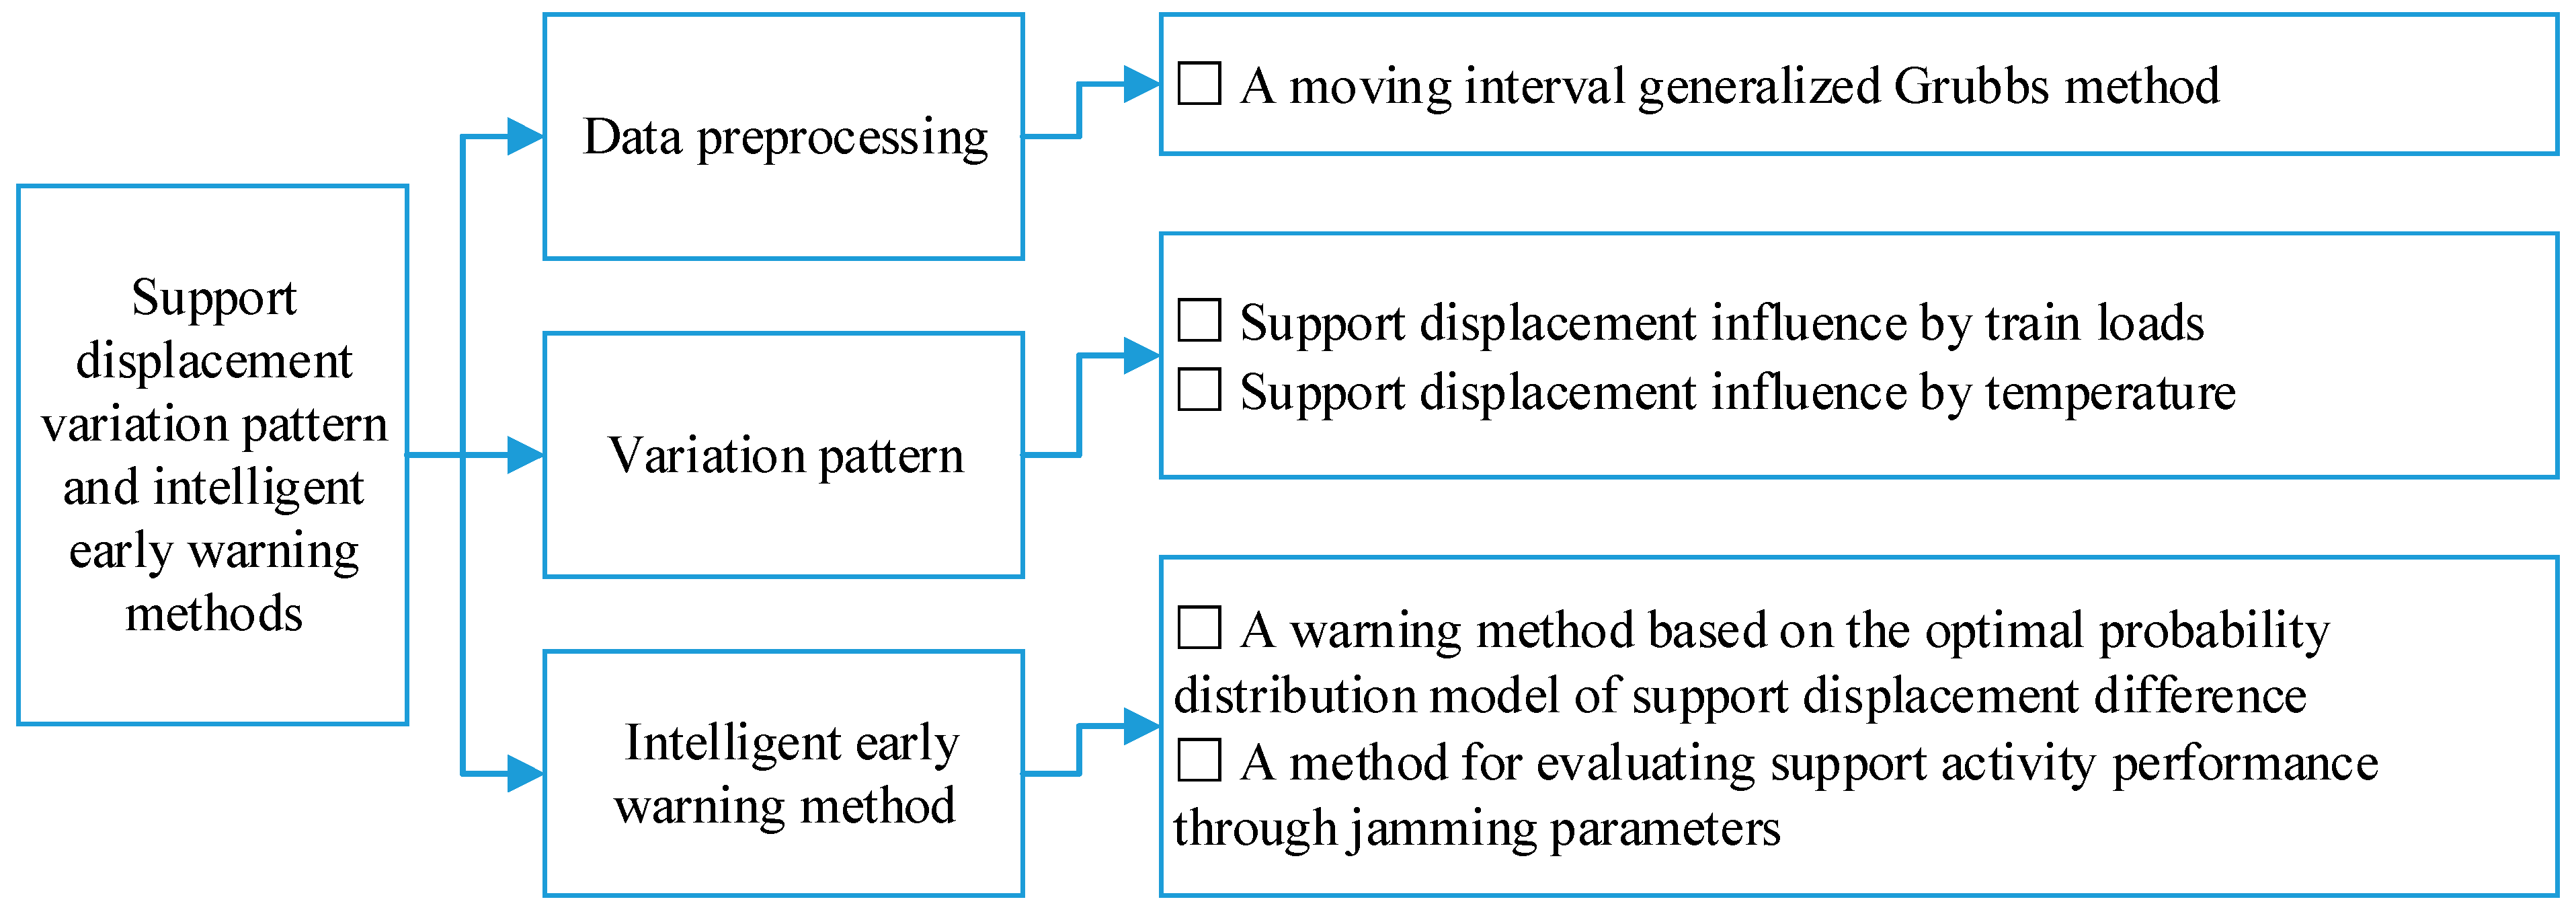
Figure 1. Technical route.
Applsci 15 08931 g001
Figure 2. Raw data and outlier identification by Grubbs criterion: (a) raw data and outliers; (b) outlier detection by Grubbs criterion.
Applsci 15 08931 g002
Figure 3. Raw data and outlier identification by the moving interval generalized Grubbs method.
Applsci 15 08931 g003
Figure 4. Elevation and section of bridges: (a) elevation measuring points layout of W Bridge, (b) elevation measuring points layout of H Bridge, (c) typical cross section of W Bridge, and (d) typical cross section of H Bridge. Note: Measurement points are composed of the bridge name, followed by the location. For instance, in w1, w represents W Bridge, and 1 represents location (upstream of north girder end).
Applsci 15 08931 g004
Figure 5. Temperature at bridge site.
Applsci 15 08931 g005
Figure 6. Time histories of support displacement: (a) W Bridge; (b) H Bridge.
Applsci 15 08931 g006
Figure 7. Spatial distribution of support displacement amplitude. Note: HN—north end of girder of H Bridge; WN—north end of girder of W Bridge; TN—north tower of H Bridge; M—center of the bridge; TS—south tower of H Bridge; WS—south end of girder of W ridge; HS—south end of girder of H Bridge; Wu—upstream of W Bridge; Wd—downstream of W Bridge; Hu—upstream of H Bridge; and Hd—downstream of H Bridge.
Applsci 15 08931 g007
Figure 8. Characteristics variation of support displacements: (a) support displacements; (b) support displacement caused by typical trains.
Applsci 15 08931 g008
Figure 9. Schematic diagram of support forces.
Applsci 15 08931 g009
Figure 10. Correlation analysis between support displacement and temperature: (a) W Bridge; (b) H Bridge.
Applsci 15 08931 g010
Figure 11. Analysis of support displacement difference: (a) W Bridge support displacement difference, (b) H Bridge support displacement difference, (c) displacement difference histogram of W Bridge, and (d) displacement difference histogram of H Bridge. Note: Support displacement difference = upstream support displacement − downstream support displacement.
Applsci 15 08931 g011
Figure 12. Optimal probabilistic statistical model and threshold: (a) H Bridge support displacement difference distribution (south tower), (b) H Bridge support displacement difference distribution (north tower), (c) H Bridge support displacement difference threshold (south tower), and (d) H Bridge support displacement difference threshold (north tower).
Applsci 15 08931 g012
Figure 13. Schematic diagram of support jamming.
Applsci 15 08931 g013
Figure 14. Support displacement (h7).
Applsci 15 08931 g014
Table 1. Statistical information of support displacement /mm.
No.Support Displacement of W Bridge/mmSupport Displacement of H Bridge/mm
MaxMinMeanRangeMaxMinMeanRange
w1/h165.88−88.250.13154.1370.00−160.13−17.88230.12
w2/h265.38−88.620.15154.0070.13−159.62−17.95229.75
w3/h363.00−89.500.09152.50105.17−68.2525.87173.42
w4/h459.25−85.87−0.30145.12104.58−69.7525.42174.33
w5/h557.50−72.75−0.71130.2538.13−103.75−19.57141.88
w6/h656.50−72.38−1.10128.8835.00−103.25−20.39138.25
w7/h754.75−69.251.55124.0068.29−15.3822.3083.67
w8/h854.00−68.501.94122.5071.04−16.2523.0887.29
Table 2. Support displacement correlation parameters.
Measuring PointW BridgeH Bridge
kRdkRd
Upstream of the north girder end (w1/h1)8.140.973517.5912.410.983819.93
Downstream of the north girder end (w2/h2)8.200.973215.8312.390.98415.88
Upstream of the south girder end (w3/h3)8.010.970312.518.350.841852.05
Downstream of the south girder end (w4/h4)7.680.970813.608.350.842754.78
Upstream of the north tower (w5/h5)6.620.973514.857.100.95989.27
Downstream of the north tower (w6/h6)6.540.97421.276.970.95888.69
Upstream of the south tower (w7/h7)6.320.967414.813.000.618545.81
Downstream of the south tower (w8/h8)6.250.964913.813.150.633818.16
Table 3. Support movement difference statistics/mm.
EigenvalueW BridgeH Bridge
WNWSTNTSHNHSTNTS
Max4.005.122.251.501.372.963.753.21
Min−3.63−4.00−1.13−2.25−1.63−1.46−4.62−3.71
Mean−0.020.390.39−0.390.070.450.82−0.78
Range7.639.123.383.753.004.428.386.92
Table 4. Jamming parameters.
Bridgew1/h1w2/h2w3/h3w4/h4w5/h5w6/h6w7/h7w8/h8
W17.5915.8312.5113.6014.8521.2714.8113.81
H19.9315.8852.0554.789.278.6945.8149.09
Table 5. Jamming parameters when M = 60 s.
Xh1h2h3h4h5h6h7h8
0.0619.9315.8832.6035.019.278.6928.9432.10
0.0719.9315.8832.6035.019.278.6928.9432.10
0.0819.9315.8832.6035.019.278.6928.9432.10
0.0919.9315.8852.0554.789.278.6945.8149.09
0.1019.9315.8852.0554.789.278.6945.8149.09
0.1119.9315.8852.0554.789.278.6945.8149.09
0.1219.9315.8852.0554.789.278.6945.8149.09
0.1386.2885.7483.2181.7569.2671.4478.3878.47
0.1486.2885.7483.2181.7569.2671.4478.3878.47
Table 6. Jamming parameters at X = 0.1 mm.
Mh1h2h3h4h5h6h7h8
2036.8833.4373.9375.8525.9425.8371.6572.74
4025.7721.8959.6762.1814.1913.8555.5758.07
6019.9315.8852.0554.789.278.6945.8149.09
8016.0012.1746.8949.286.065.8438.2441.92
10013.509.5743.0245.584.384.0633.0836.85
Disclaimer/Publisher’s Note: The statements, opinions and data contained in all publications are solely those of the individual author(s) and contributor(s) and not of MDPI and/or the editor(s). MDPI and/or the editor(s) disclaim responsibility for any injury to people or property resulting from any ideas, methods, instructions or products referred to in the content.