1. Introduction
In recent decades, road vehicles have undergone significant evolution, particularly in terms of vehicle electrification, automation, and a shift towards software-defined vehicles [
1,
2,
3]. Despite many positive effects, such as reduced greenhouse gas emissions; minimisation of traffic accidents, congestion, and parking demand; and providing mobility for an ageing population [
4,
5], there are also negative aspects. The negative impact of these innovations is a significant increase in vehicle prices [
6]. Consumers desire price reductions, indicating a need for OEMs to reduce operational expenses [
7]. One way to achieve this is by increasing virtual testing and reducing field tests through the use of digital twins (DTs) [
8].
The concept of DT was developed at the beginning of the XXI century [
9]. The development of DTs in the automotive sector enables the virtual simulation of vehicle prototypes, allowing researchers and engineers to test vehicle dynamics, control algorithms, and perception tasks in a simulated environment [
10,
11]. This approach accelerates development cycles; reduces costs; and enhances system efficiency, safety, and the driver experience through data-driven insights that are difficult to obtain during field tests [
10]. Using DTs diminishes the need for extensive physical testing on test rigs and proving grounds, thereby speeding up the certification process for new vehicles and components by allowing a wide range of tests to be performed in a simulation environment. DTs are especially crucial in developing and validating automated driving systems, as they facilitate the simulation of complex scenarios and learning environments [
12]. However, vehicle components must be modelled with high precision, capturing all the relevant effects that occur in real systems, not just mechanical aspects. Accurate and detailed models are essential because simulation results can sometimes reveal unexpected outcomes, providing new insights that researchers may not have anticipated.
Tyre and road contact, along with aerodynamic forces, are the primary means of force transmission between the vehicle and its environment [
13]. Accurately mapping a tyre is a key challenge in vehicle simulation, as it is the main component in direct contact with the road, transmitting all road excitations to the chassis. Mathematical modelling of tyres is crucial for understanding their dynamic behaviour and a vehicle’s performance under various driving conditions. The primary distinction between the existing TMs lies in their intended purpose. Some models aim to study the properties of the tyres themselves. In contrast, others focus solely on determining the contact forces between the tyre and the road surface, and are used for vehicle dynamics investigations and control tasks [
14].
Numerous studies have aimed to develop models that accurately describe the complex interactions between tyres and road surfaces. Models addressing longitudinal and lateral vehicle dynamics typically rely on mathematical trial functions and are often used in handling tasks. The simplest model is linear, where friction is estimated by multiplying slip by a constant coefficient for longitudinal force, and by multiplying the tyre’s sideslip angle by cornering stiffness for lateral force. This model’s practical application is limited, as friction is a highly nonlinear parameter. Other models for calculating longitudinal and lateral friction include those by Dugoff [
15], Burckhardt [
16], Ammon [
17], Bauer [
18], and the widely used Magic Formula and its modifications [
19]. All these models are suitable for real-time simulation. The Magic Formula TM provides a mathematical framework for predicting force and moment responses of tyres based on vertical load, slip angle, and slip ratio [
13]. Its simplicity and effectiveness in capturing nonlinear tyre behaviour have made it popular in both academic and industry [
20]. However, these models generally do not account for vertical dynamics.
Vertical dynamics models based on nonlinear force elements are typically used for comfort considerations [
21]. The single-point TM represents an initial attempt to incorporate vertical dynamics, including stiffness and sometimes damping elements. However, when combined with the Magic Formula, it is limited to low frequency ranges (<8 Hz), long wavelengths (>3 m), and minor slope irregularities (<5%) [
22]. This approach is suitable for vehicle dynamics investigations in XIL environments requiring real-time capability and is commonly used for developing control algorithms [
23].
Flexible ring models, such as the Delft TM (SWIFT) and the FTire model, represent the next principal model type. The SWIFT model allows for investigations in higher frequency ranges (<100 Hz). The SWIFT model is suitable for real-time applications. The most advanced is the FTire model, which is suitable for investigations in a range above 200 Hz; however, it is not suitable for real-time simulation [
24]. Both models can handle combined slip, camber, and turn slip of the tyre contact, as well as the effects of inflation pressure and transient responses, which is very important when using high-fidelity vehicle models that take kinematics and compliance into account. Such models are widely used in the development of traction control, anti-lock brake systems (ABS), active lateral (yaw) control systems (ESP), and semi-active/active suspension systems; however, their parametrisation is very complex.
For noise, vibration, and harshness (NVH) investigations, TMs that accommodate high-frequency ranges are required [
25]. A sufficiently detailed finite element (FE) TM to describe dynamics up to 350 Hz can possess over 100,000 degrees of freedom (DOFs) [
21,
26]. The main drawback of finite element method (FEM)-based models is the high computational power required and the complexity of integrating them into the entire vehicle model; additionally, they do not operate in real-time.
The currently widely used TMs, which have become almost an industrial standard, are facing challenges when needing to take into account the possibility of penetration of the tyre into the soil, or interaction between the tyre’s multiphase layer, such as water, snow, and the road [
27]. The proposed model can deal with such tasks. The contribution is formulated as follows: A novel TM is proposed, where relaxation is taken into account at the separate element level. The developed TM is suitable for investigating vehicle dynamics when the tyre penetrates soil or interacts with a multiphase layer.
The paper structure is as follows: In
Section 2, the TM is provided, and all the assumptions are presented. In
Section 3, the initial results are presented. A discussion is conducted, and conclusions are drawn.
2. Mathematical Approach of a Tyre’s Digital Twin
In this section, a mathematical model of a tyre is presented. The model includes the rim, the tyre filled with gas (air in the particular case), and the road pavement. The following assumptions are listed:
The wheel rim is considered a solid body;
Vehicle suspension kinematics and compliance are taken into account, considering rim displacements in X, Y, Z directions and rotation angles around these axes;
The physical and mechanical properties of the tyre are described using the proposed nonlinear rheological elements;
The geometry of the tyre is described using nine nodal discrete elements with variable thickness;
Each discrete element includes 12 rheological elements that operate under tension and compression, and four rheological elements to assess the bending stiffness of the discrete element;
Additional rheological elements are used to evaluate the physical and mechanical properties of the tyre carcass layers;
In the contact area between the tyre and the road surface, friction forces, total contact area, and the centre of friction forces are determined;
The variable volume and cross-sectional areas of the deformable tyre are identified;
The variation in gas pressure and temperature within the tyre is considered;
The current version of the model is not suitable for real-time simulations;
The main parameters of the TM are presented in
Appendix A.
The coordinate system is introduced at the geometric centre
,
,
of the rim. The general coordinate system is denoted by
,
,
. The vector defines the initial position of the rim in the general coordinate system
. A vector defines the rim centre displacement:
. Cardan angles are used to define the orientation of the rim in space:
. The tyre surface is described by a nine-node, isoparametric, finite element. At each tyre node
, the thickness is known and the displacement vector is described by the following Equation:
where
is a shape function matrix:
and
is a vector of displacements in the nodes.
The vector defines the coordinates of the rim centre in the general coordinate system:
The coordinates of the tyre node
are defined by the vector:
where
is a rotation matrix and
is a vector from the centre of the rim to point k in the rim coordinate system.
The velocity vector of the rim centre is described as follows:
The velocity vector of the tyre node
is equal to the following:
where
=
angular velocity vector in the general coordinate system and
is a skew matrix:
and
is a skew-symmetric matrix generated from a vector
.
The acceleration of the rim centre of mass is equal to
The acceleration vector of the tyre node
is equal to the following:
The relationship between the angular velocity vector
and the time derivative of the Cardan’s angle vector
is as follows:
where matrix
is described as follows:
The tyre
node acceleration can also be written as follows:
The variation in the vector
is equal to the following:
where
,
, and
are variations in vectors
,
, and
, respectively.
The system of equations of motion for a wheel is obtained by using D’Alembert’s principle:
Alternatively, Equation (13) can be expressed as follows:
Matrix
is further expanded to form the system of equations for the rim and the tyre nodes:
where
is the identity matrix (3 × 3);
is the tyre mass tensor; and
is the total number of nodes.
The force vector {
}, acting on the rim is described by the following:
where
=
is the total force vector acting on the rim (force acting between the rim and the tyre node).
The vector of generalised forces (torques) acting on the rim is described by the following:
where
is a torque on a rim and
is a force on a rim.
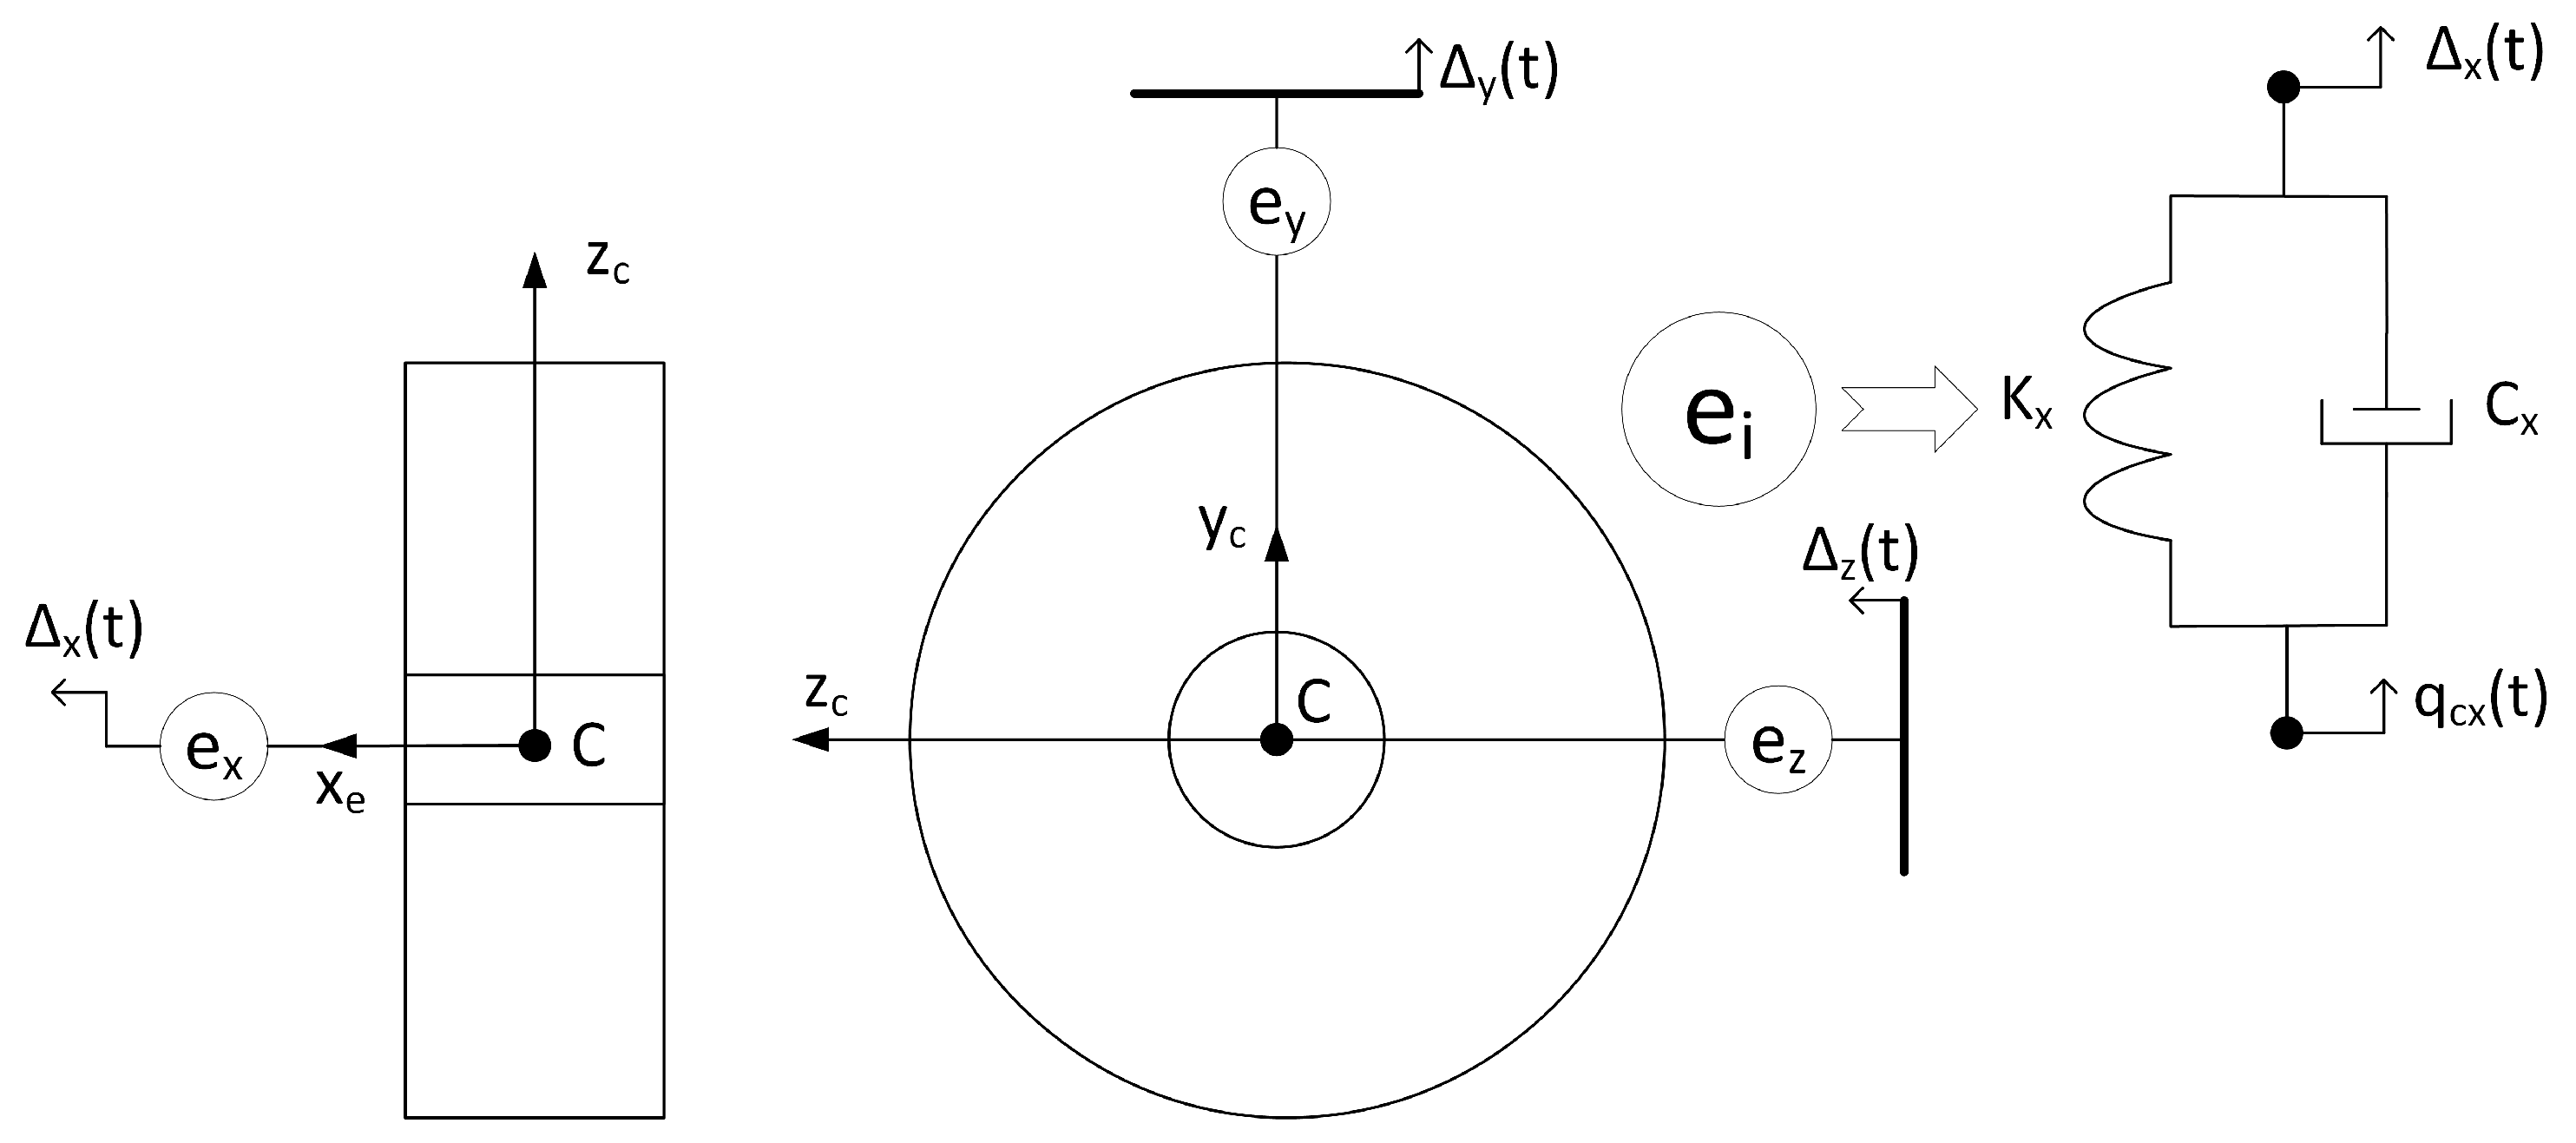
The rim is connected to the wheel hub in
Figure 1 using stiffness and damping elements:
,
are the stiffness and damping coefficients in
axes, respectively;
,
are the torsional stiffness and damping coefficients;
is the vector of the displacements of the wheel hub;
is the vector of the rotation of the wheel hub.
The force vector acting on node
is equal to the following:
where
are the external forces acting in the X, Y, and Z directions.
The tyre is connected to the rim using elastic and damping elements. The force acting on the node
which is connected to the rim at point
, is equal to the following:
where
is the distance between the
and
nodes;
—initial distance;
; and
;
,
, and
are the stiffness and damping coefficients.
The generalised force vectors, acting on points
and
are equal to the following:
The general force vector (torque) acting on the rim is equal to the following:
The force acting between tyre nodes
and
is equal to the following:
where
distance between the
and
nodes;
—initial distance between
i and
j nodes;
;
;
,
, and
—stiffness and damping coefficients; and
.
The variation in the distance
:
where
is a skew matrix generated using a vector
.
The variation in the mechanical work performed by the force
is equal to the following:
where
is a torque vector,
and
are the vectors of forces acting on the nodes
and
,
,
, and
.
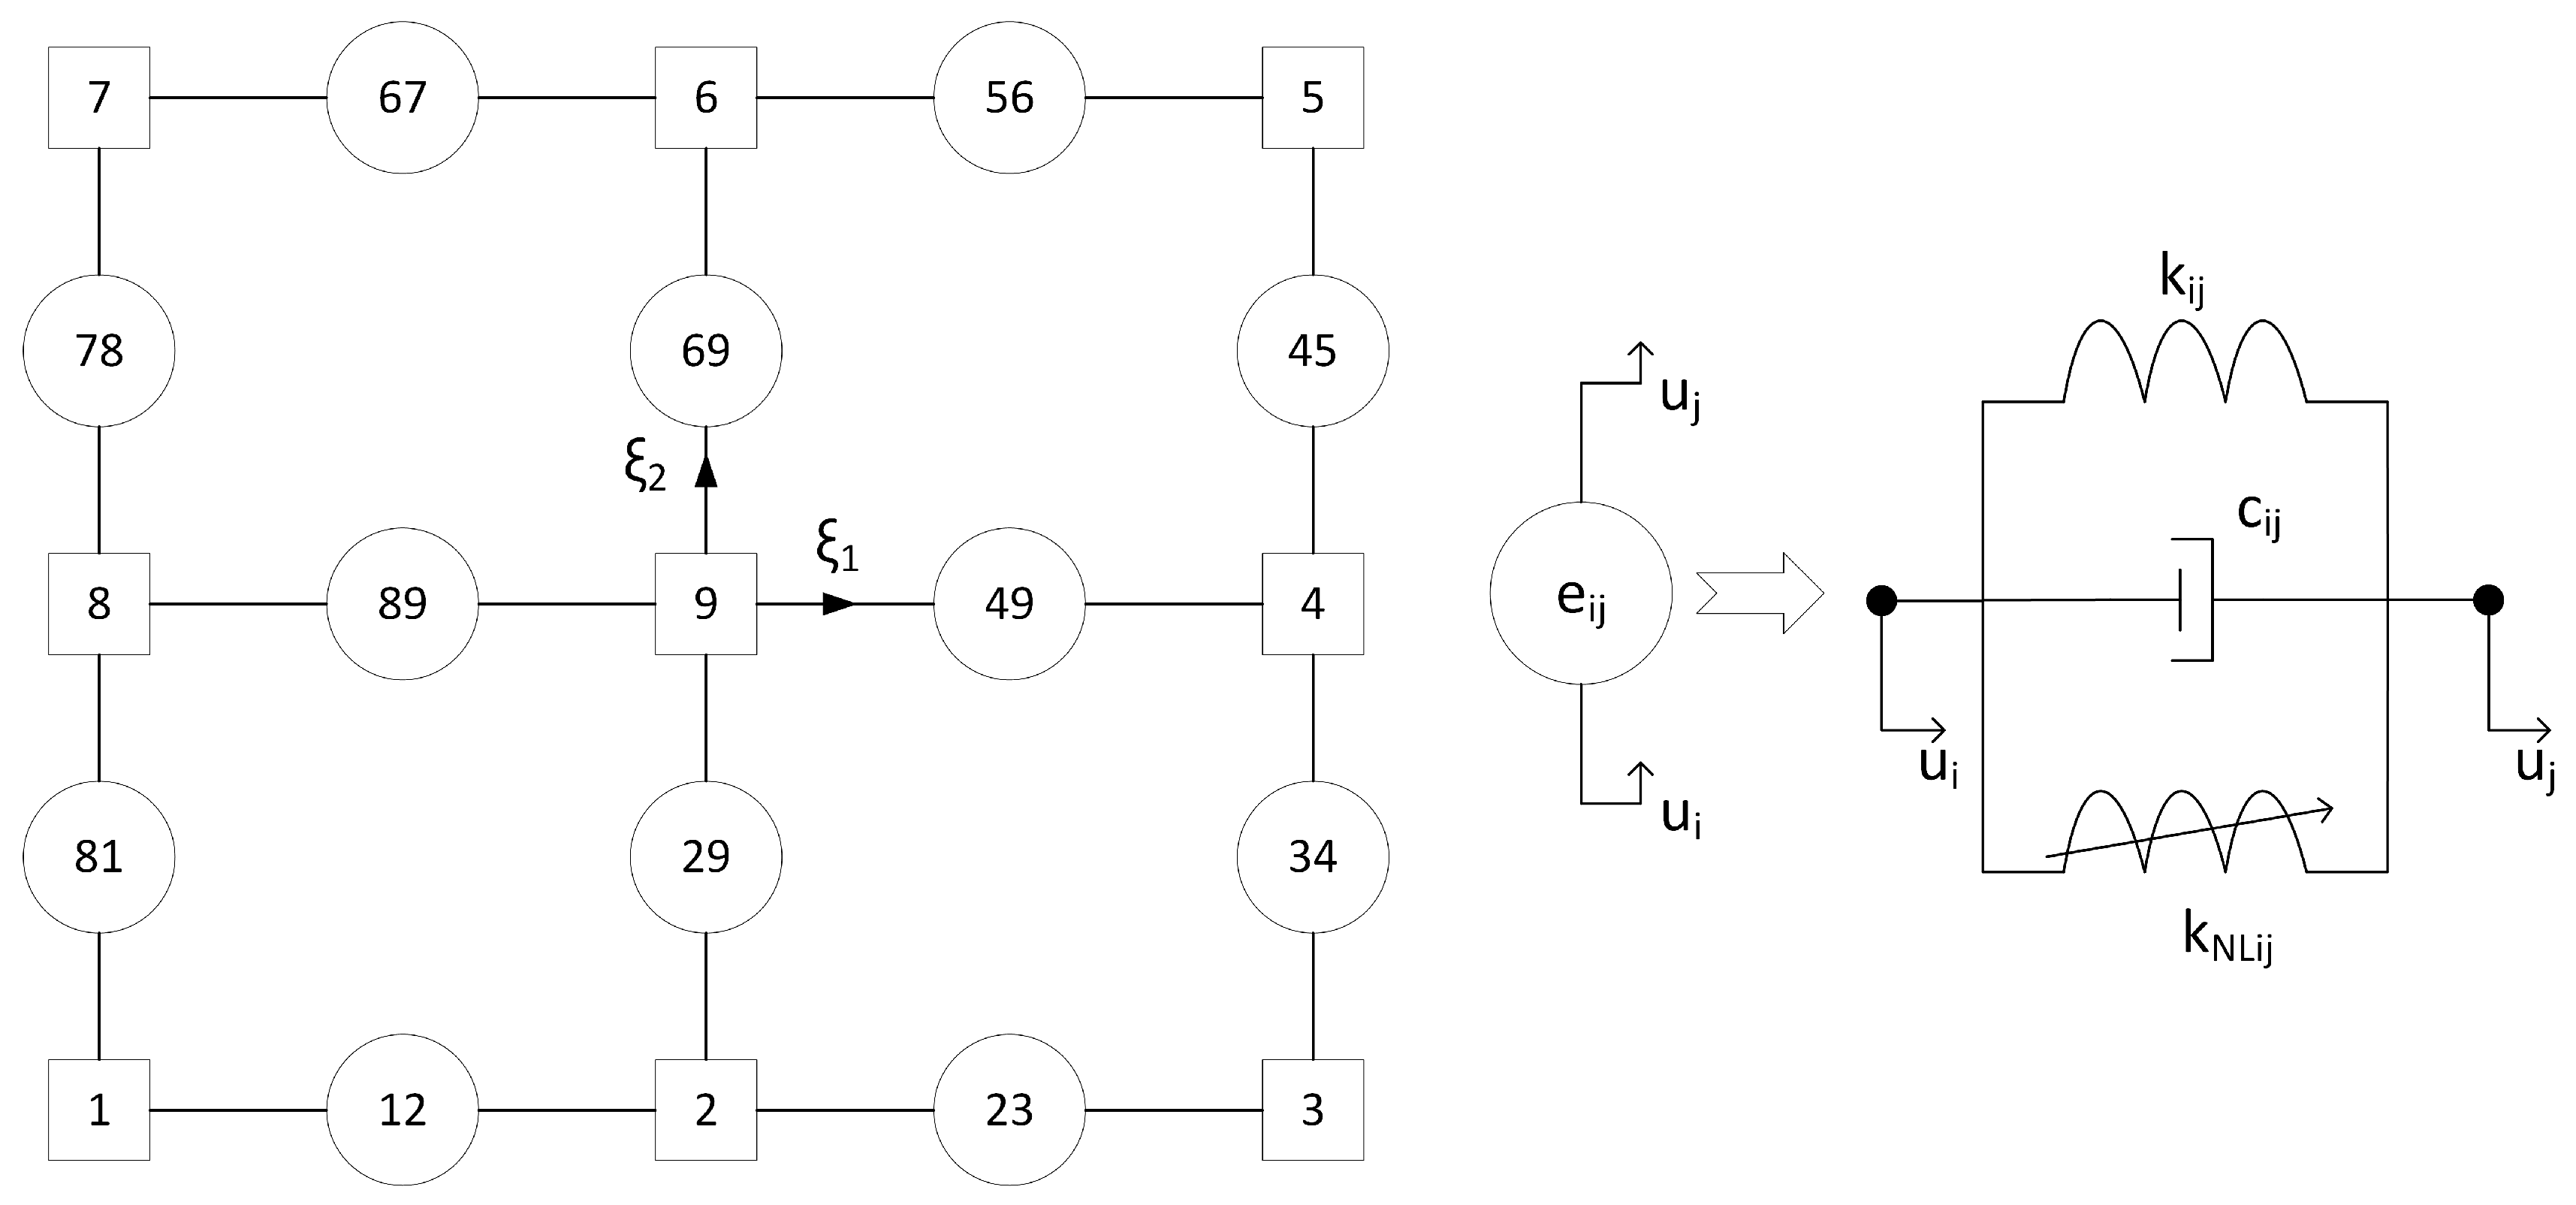
An isoparametric finite element with nine nodes has 12 internal force components, in which the forces acting are described by formula (25). Visual representation is provided in
Figure 2.
The total internal forces vector in this isoparametric finite element is equal to the following:
The internal vector of forces at each point is equal to the following:
The matrix
is defined as follows:
where
is a unit vector between
and
points
.
Using the internal force vector (26), the mechanical work generated by internal forces in the finite element is determined as follows:
where
is displacement and
.
The average mechanical work over the entire volume of the finite element is as follows:
where
is finite element volume:
where
is the finite element displacement vector,
,
,
, and
—tyre node coordinates vector.
Additional rheological elements are introduced into the finite element to evaluate the bending stiffness of the element. The rheological elements are introduced between the nodes 2–9, 4–9, 6–9, and 8–9.
The forces acting on nodes 4 and 9 in the finite element are equal to the following:
where
is the unit normal vector at node 9;
,
are unit vectors between nodes 9 and 4, and 9 and 6, respectively;
,
,
are displacement and velocity vectors in the nodes 4 and 9, and
and
,
and
are the damping and stiffness coefficients.
Certain tyre nodes interact with the road surface. A tyre component has contact with the road surface when the following condition is satisfied:
where
is node coordinate vector:
and
is the road surface Y coordinate and
is a unit vector along the Y axis.
The normal tyre contact force in point
i is determined by using the Lankarani and Nikravesh [
28] model:
where
is a coefficient considering the elastic properties and local geometry of the contacting area;
,
– penetration and velocity of penetration,
,
;
is the velocity vector of
i tyre point,
;
,
is the restitution coefficient,
is maximal penetration speed;
—Heaviside function.
Friction forces in the contact are equal to the following:
where
and
are the sliding velocities in the
(lateral) and
(longitudinal) directions;
and
are the friction coefficients in the
and
directions.
To describe the friction coefficient in the Z and X directions, the following expression is used:
where
is the friction parameter;
and
are the static and dynamic friction coefficients.
The total contact force vector at point
is equal to the following:
where
are unit vectors in X, Y, and Z directions.
Inside the tyre, the inflation pressure
is variable and loads each finite element. The inflation pressure force loading vector is equal to the following:
where
is a normal unit vector,
.
The Equation describes the inflation pressure variation in a tyre:
where
is the adiabatic index;
is the gas constant;
—input gas flow temperature;
—gas temperature;
and
are the input and output mass flows; and
is the volume of the tyre.
The Equation describes the temperature change in the tyre:
where
is the outer surface area of the tyre,
is the specific heat of a gas at constant pressure,
is the heat transfer coefficient, and
is ambient temperature:
where
is the total number of finite elements.
The system of Equation (14) is solved using the fourth-order Runge–Kutta method. For this purpose, a new vector of variables is introduced:
The acceleration vector is obtained from the system of Equation (14):
where
is the inverse of the mass matrix, which is determined as follows:
where
.
After introducing these notations, the system of equations of motion of the wheel is equal to the following:
To solve the pressure, temperature, and tyre volume first-order differential Equations (39) and (40) are used in the second-order Trapezoid rule:
where
and
are the right sides of first-order differential Equations (46) and (47) respectively;
is the integration parameter,
=
.
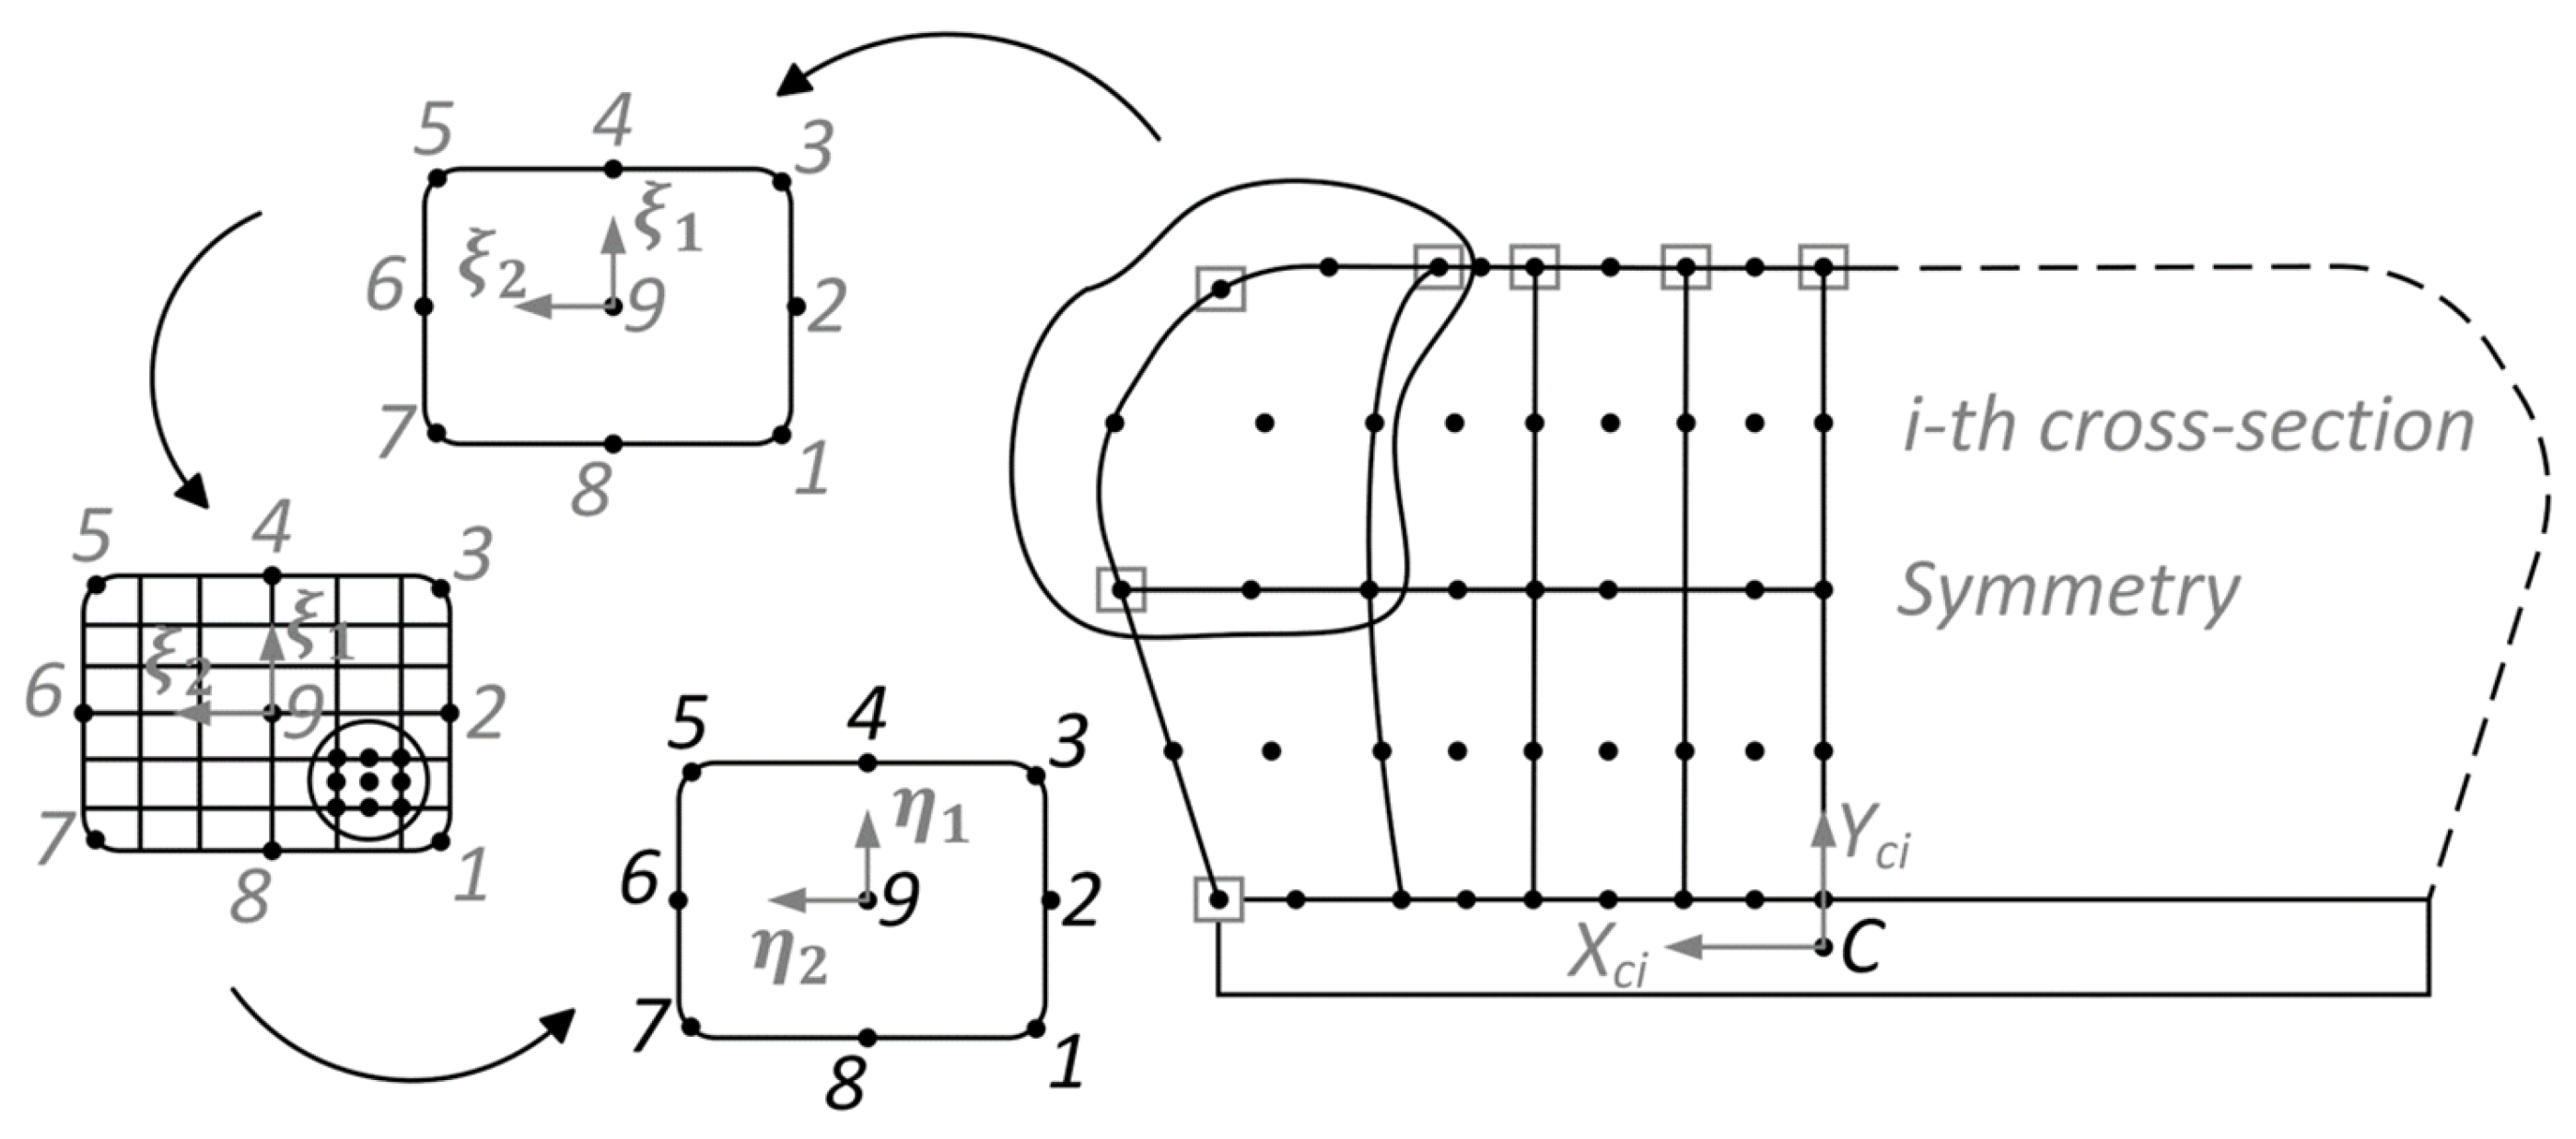
For tyre geometry generation, a certain number of points and their coordinates are introduced for the tyre’s cross-section. Using the initial discretised model of the tyre’s cross-section, the
i-th cross-section of the tyre is generated. The obtained cross-section is divided into a specified number (
) of finite elements consisting of nine nodes each (see
Figure 3). The cross-sectional area of the tyre is equal to the following:
where
is a determinant of the Jacobi matrix.
The total area of the
i-th cross-section is equal
. Having
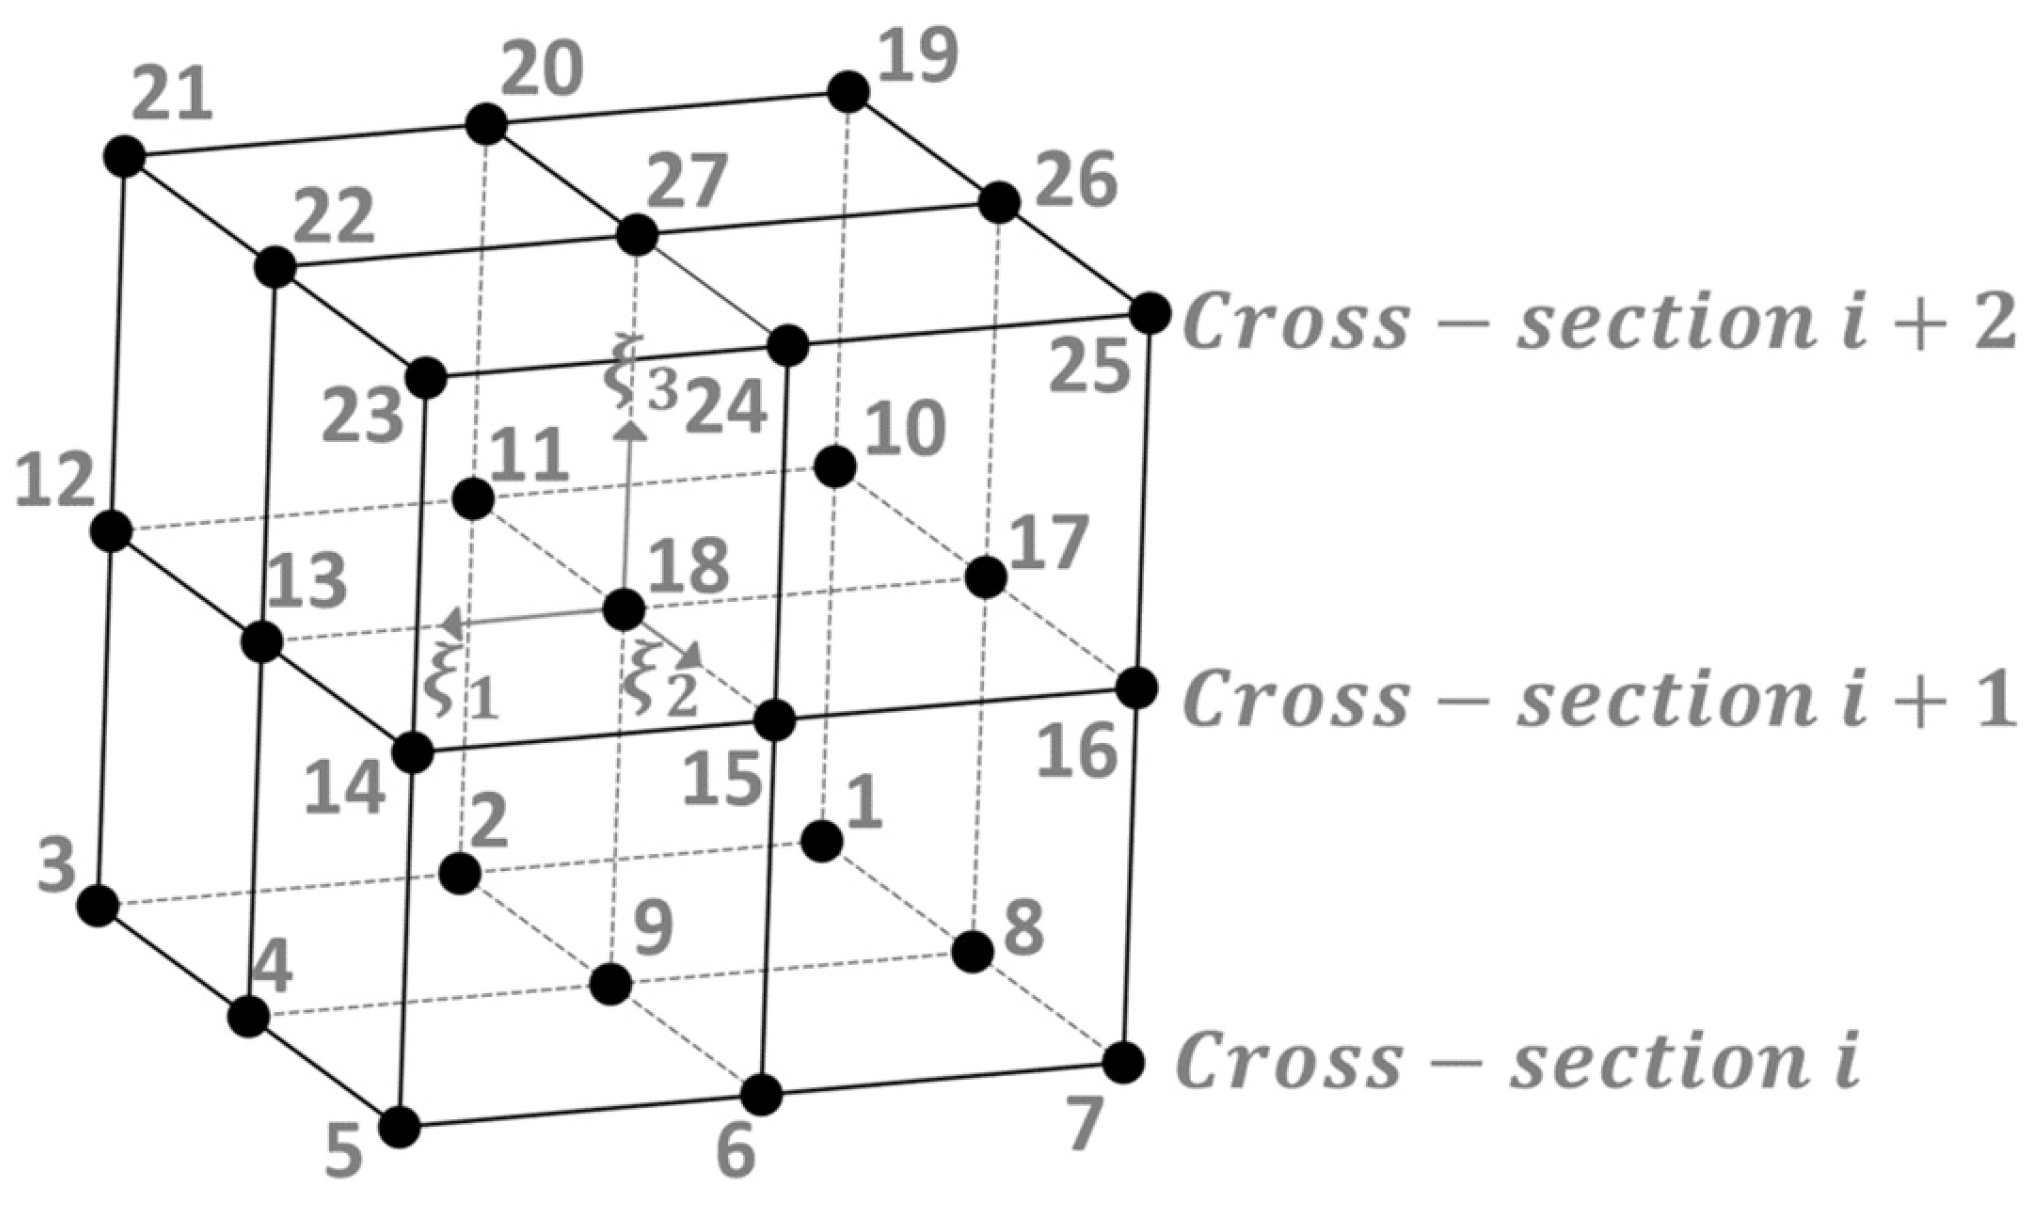
i,
i + 1, and
i + 2 cross-sections, the 27-node isoparametric finite element FE27 is generated (
Figure 4).
The coordinate vector
in such an element is approximated by the following:
where
is a shape function matrix:
and
is a vector of finite element nodes:
The volume of 3D finite element FE27 is equal to the following:
where [
] = [
is a Jacobi matrix.
Tyre volume between
i,
i + 1 and
i + 2 is equal to the following:
The total volume of the tyre is equal to the following:
The coordinates of the centre of frictional forces in the tyre–road contact area (
, where the torque generated by the frictional forces about the tyre’s vertical axis Yc is zero, are determined as follows:
where
are friction forces at the contact point
i;
N is the number of contact points; and
are the coordinates of the contact point i:
where
are vectors of global coordinates of points
i and
c.
The coordinates of the centre of the reactive forces acting in the tyre contact area (
are equal to the following:
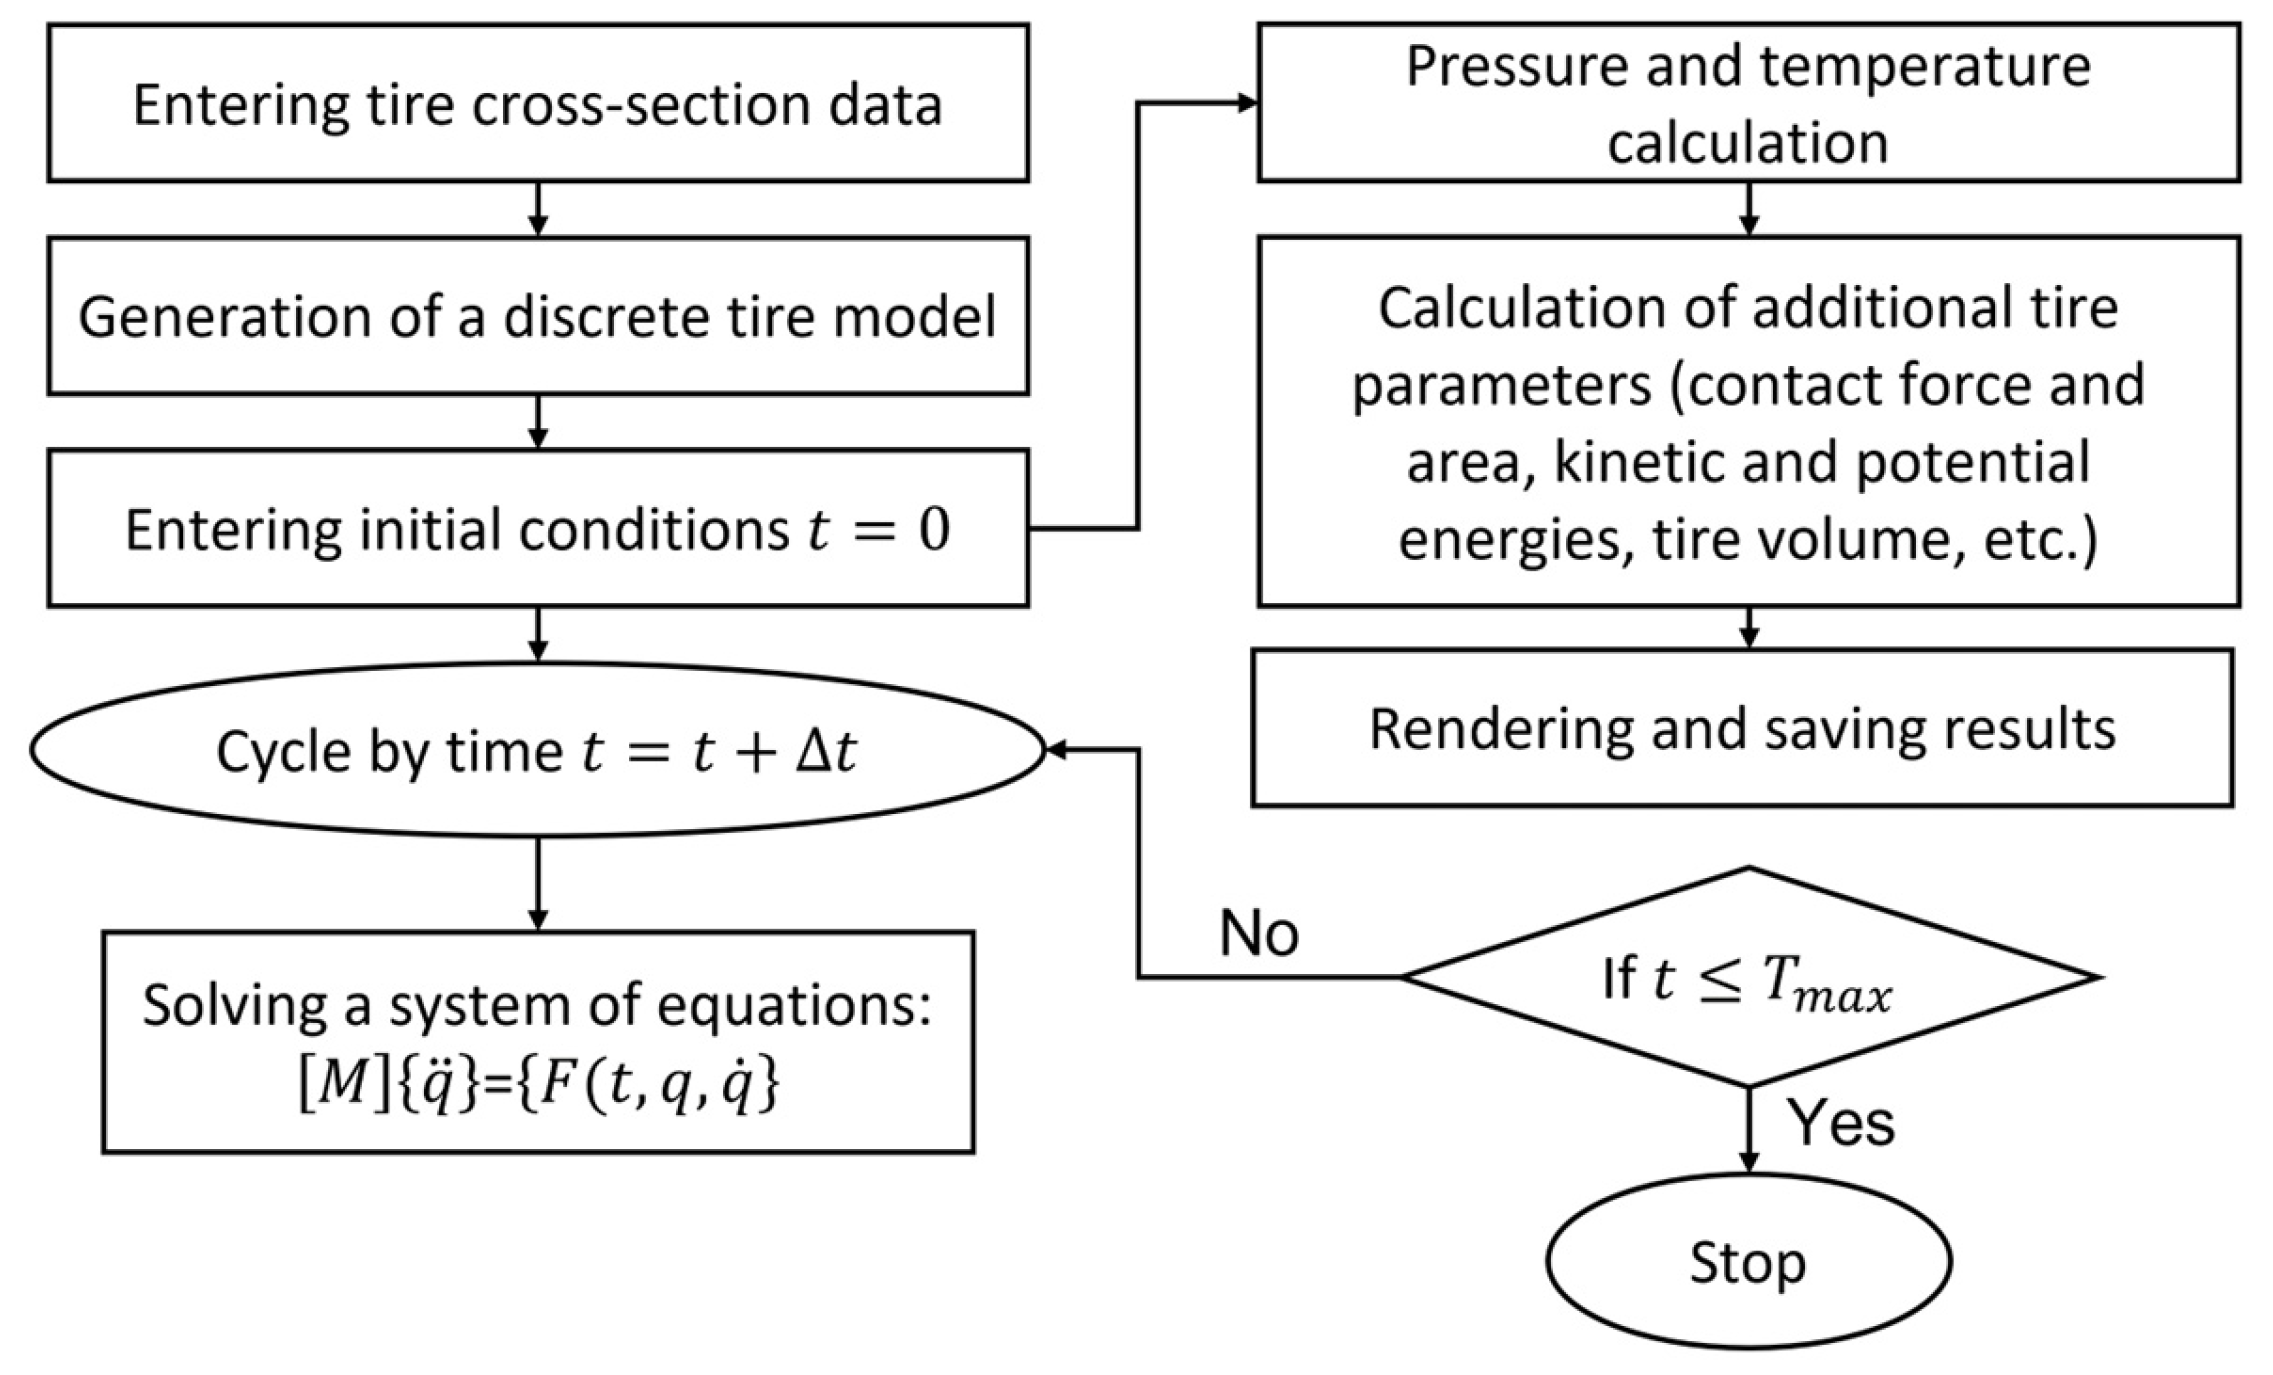
The TM has been realised with Microsoft Visual Studio 2008. A developed TM uses the tyre’s cross-section to generate a complete or partial discrete model of the tyre. It solves the tyre’s equations of motion and calculates additional parameters such as kinetic and potential energy, dissipation function, contact forces, contact area, cross-sectional areas, outer surface area, tyre volume, and others. The overall algorithm is presented in
Figure 5.
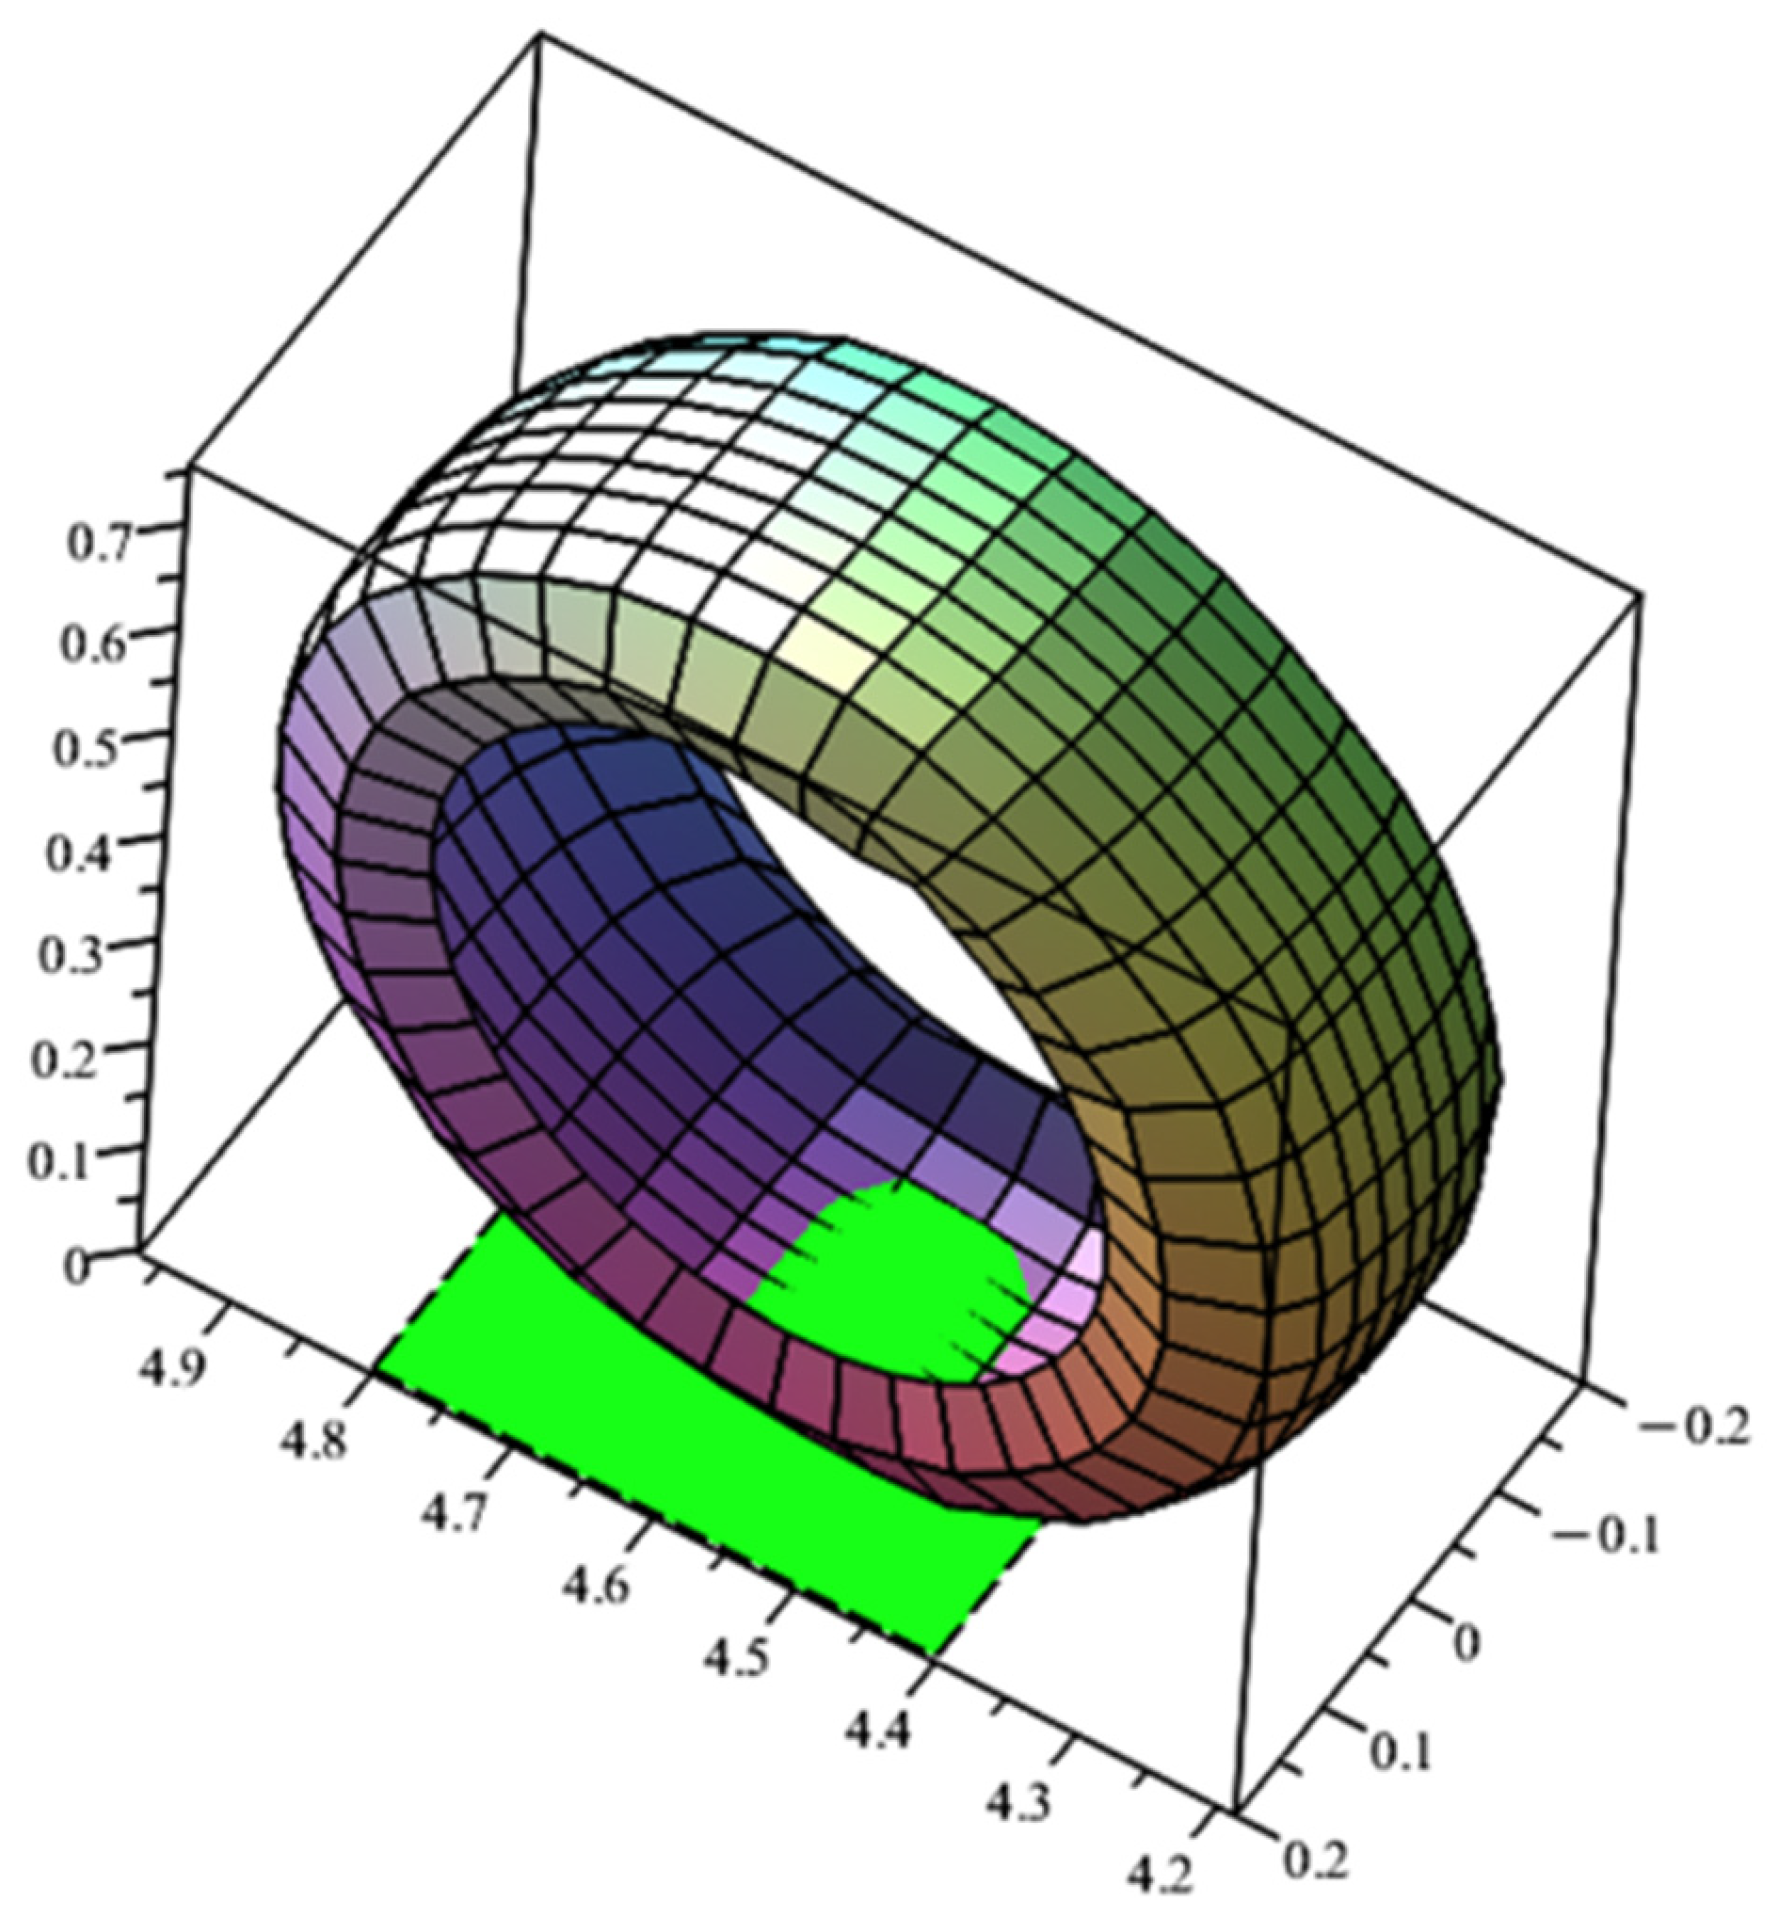
The discretised model of the tyre is shown in
Figure 6. The total number of nodes is 520. The total number of 9-node finite elements is 120, and the total number of variables is 1560.
3. Results
This section presents initial results of the developed TM of the tyre presented in
Section 2, along with a comparison between the TM and the validated MF-Swift TM. The investigation was conducted using a Pirelli Scorpion 235/55/R19 105V tyre. In a mathematical model, the X direction represents longitudinal displacement, the Y direction corresponds to vertical displacement, and the Z direction also indicates lateral displacement.
Using the developed “rim–tyre” system model, the transient deformation process of the tyre, lasting for 1 s, is analysed. This short-duration analysis allows assessment of the capabilities of the created mathematical model. The rim can rotate freely around the Z axis (lateral direction).
Initial conditions are as follows: at the starting time
, the vertical displacement
; the initial tyre inflation pressure is
; the initial tyre operating temperature is
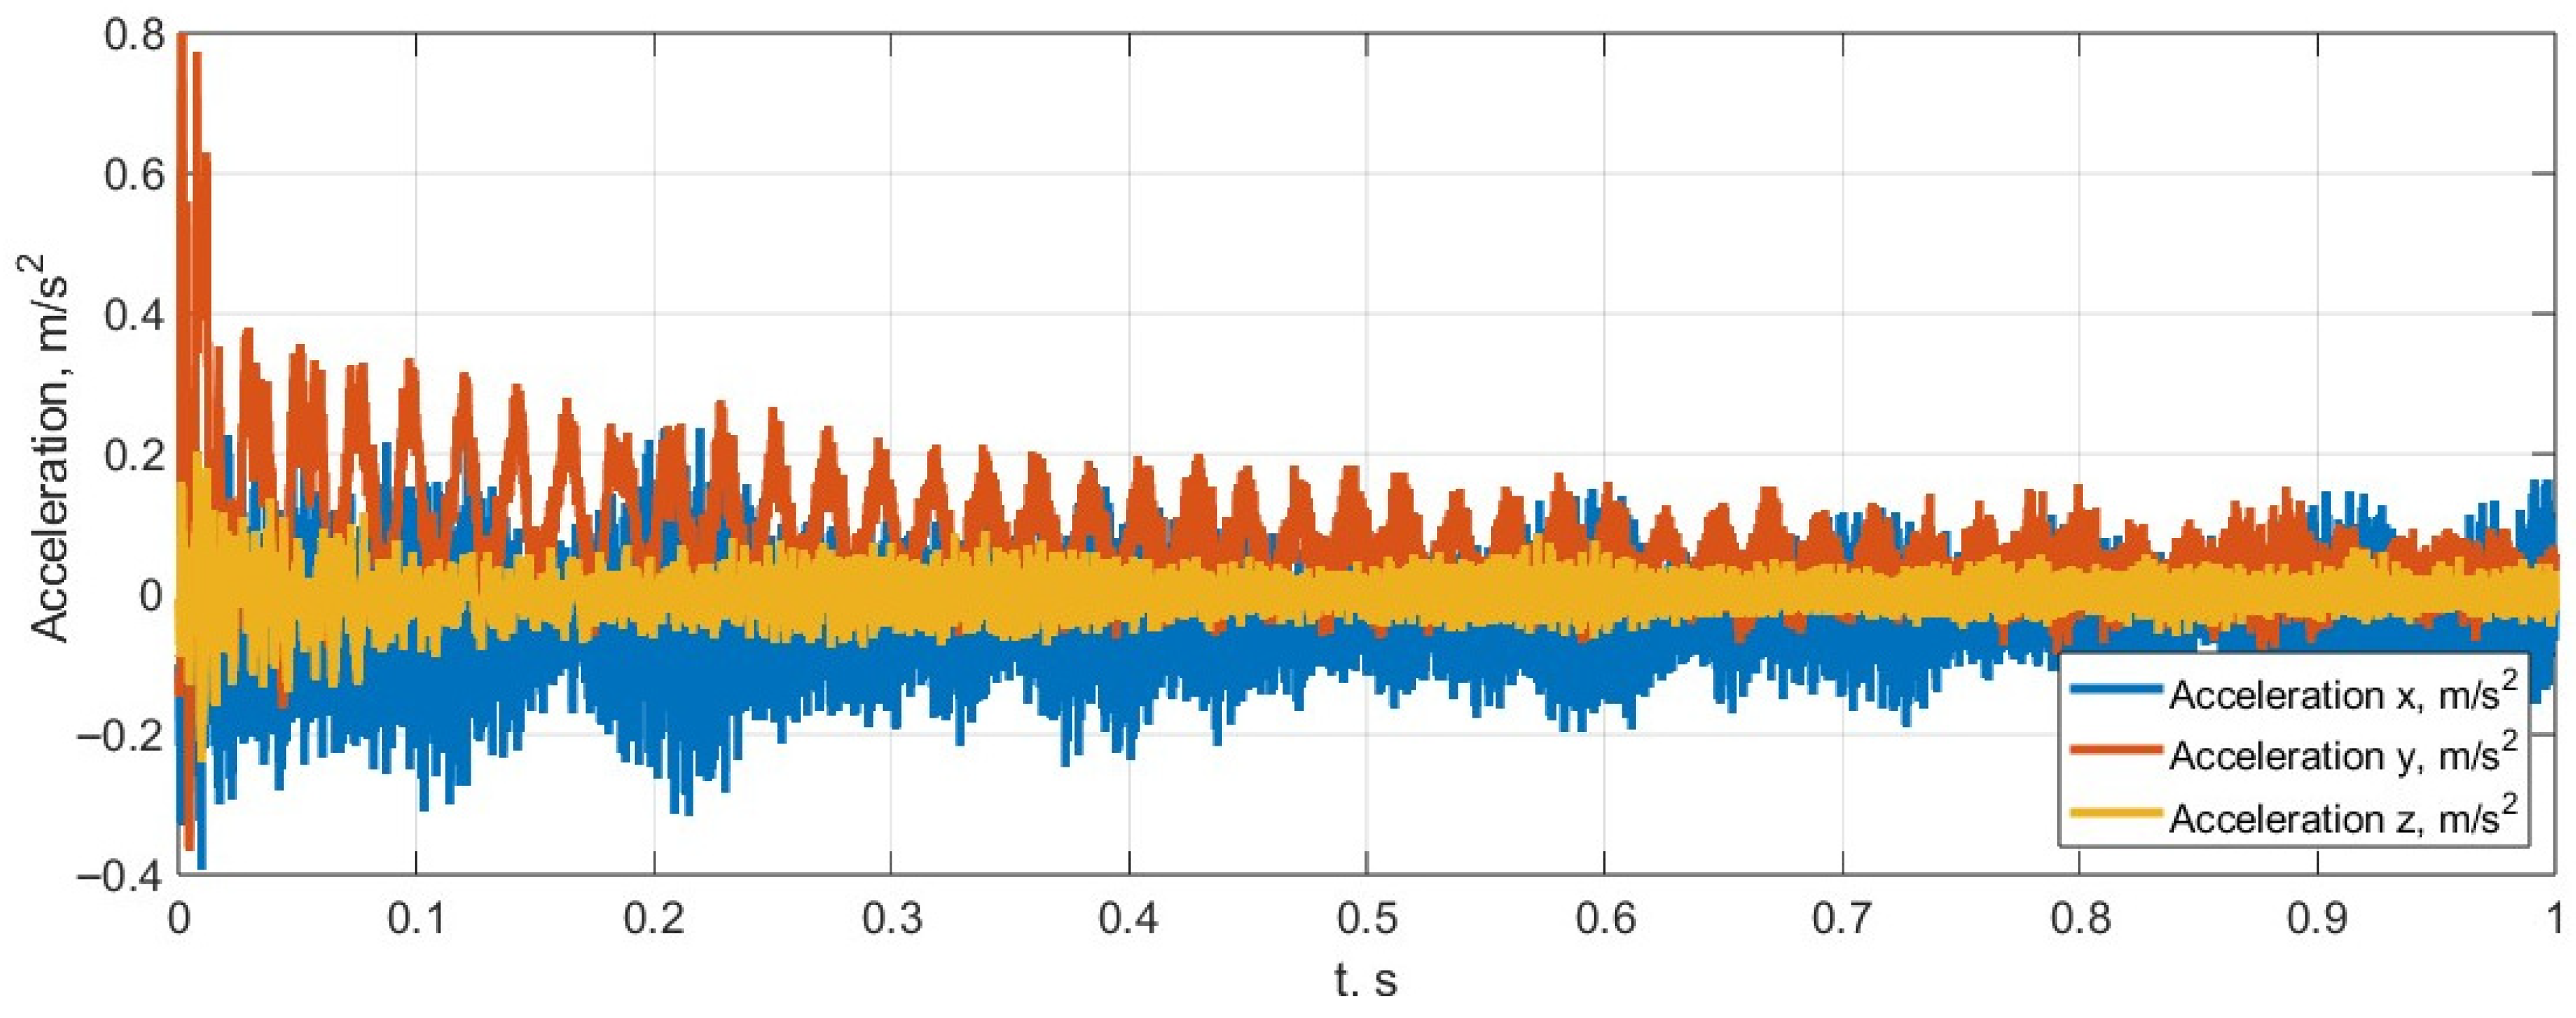
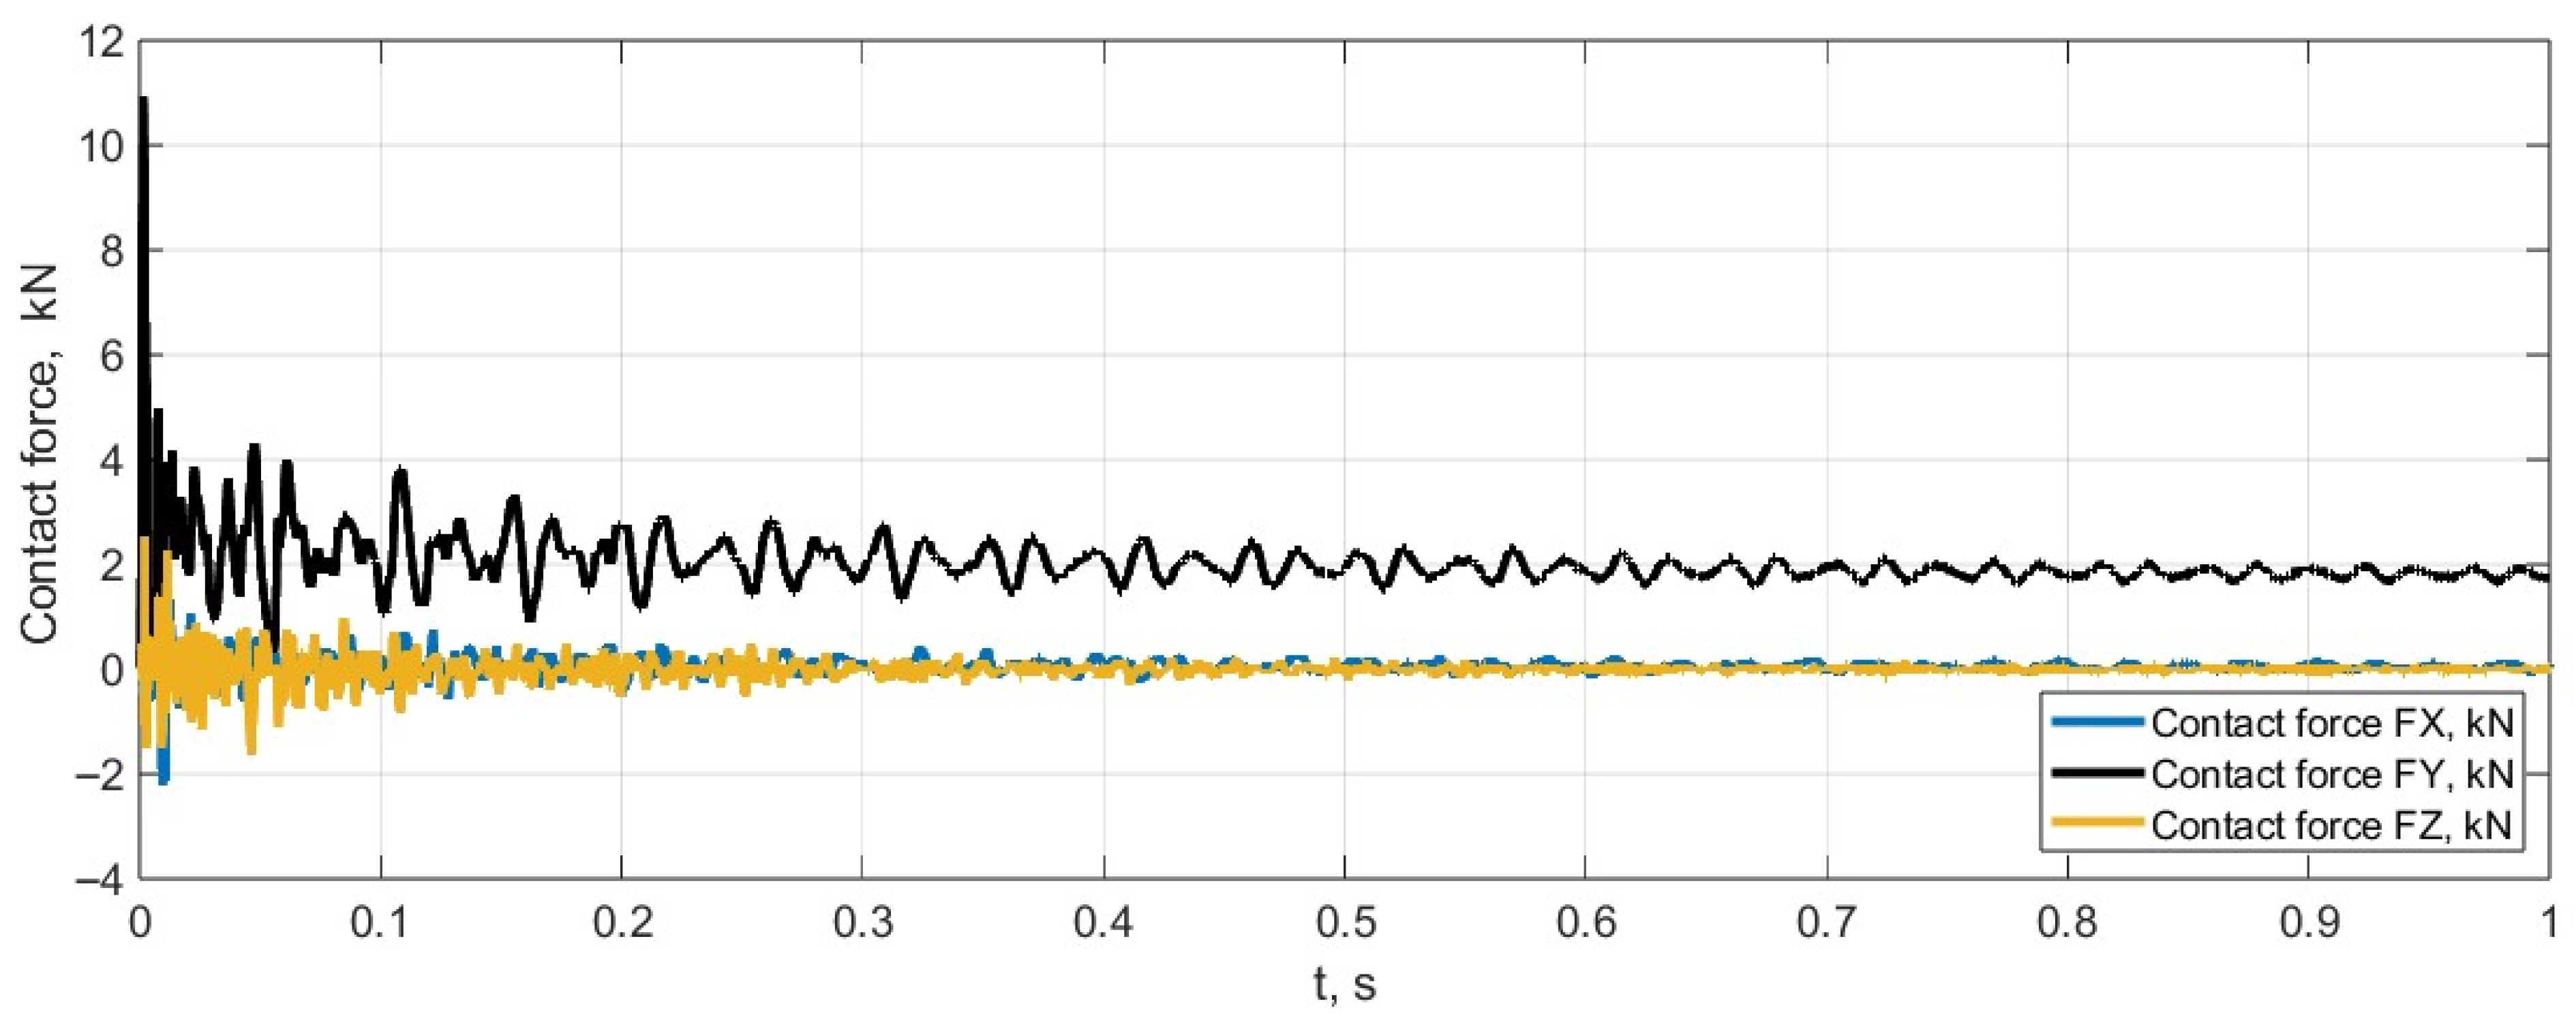
; and the applied vertical force is 2100 N. At the starting point, the tyre is undeformed. After applying the force, accelerations develop (
Figure 7), and the total forces in the longitudinal, lateral, and vertical directions at the contact surface are calculated (see
Figure 8).
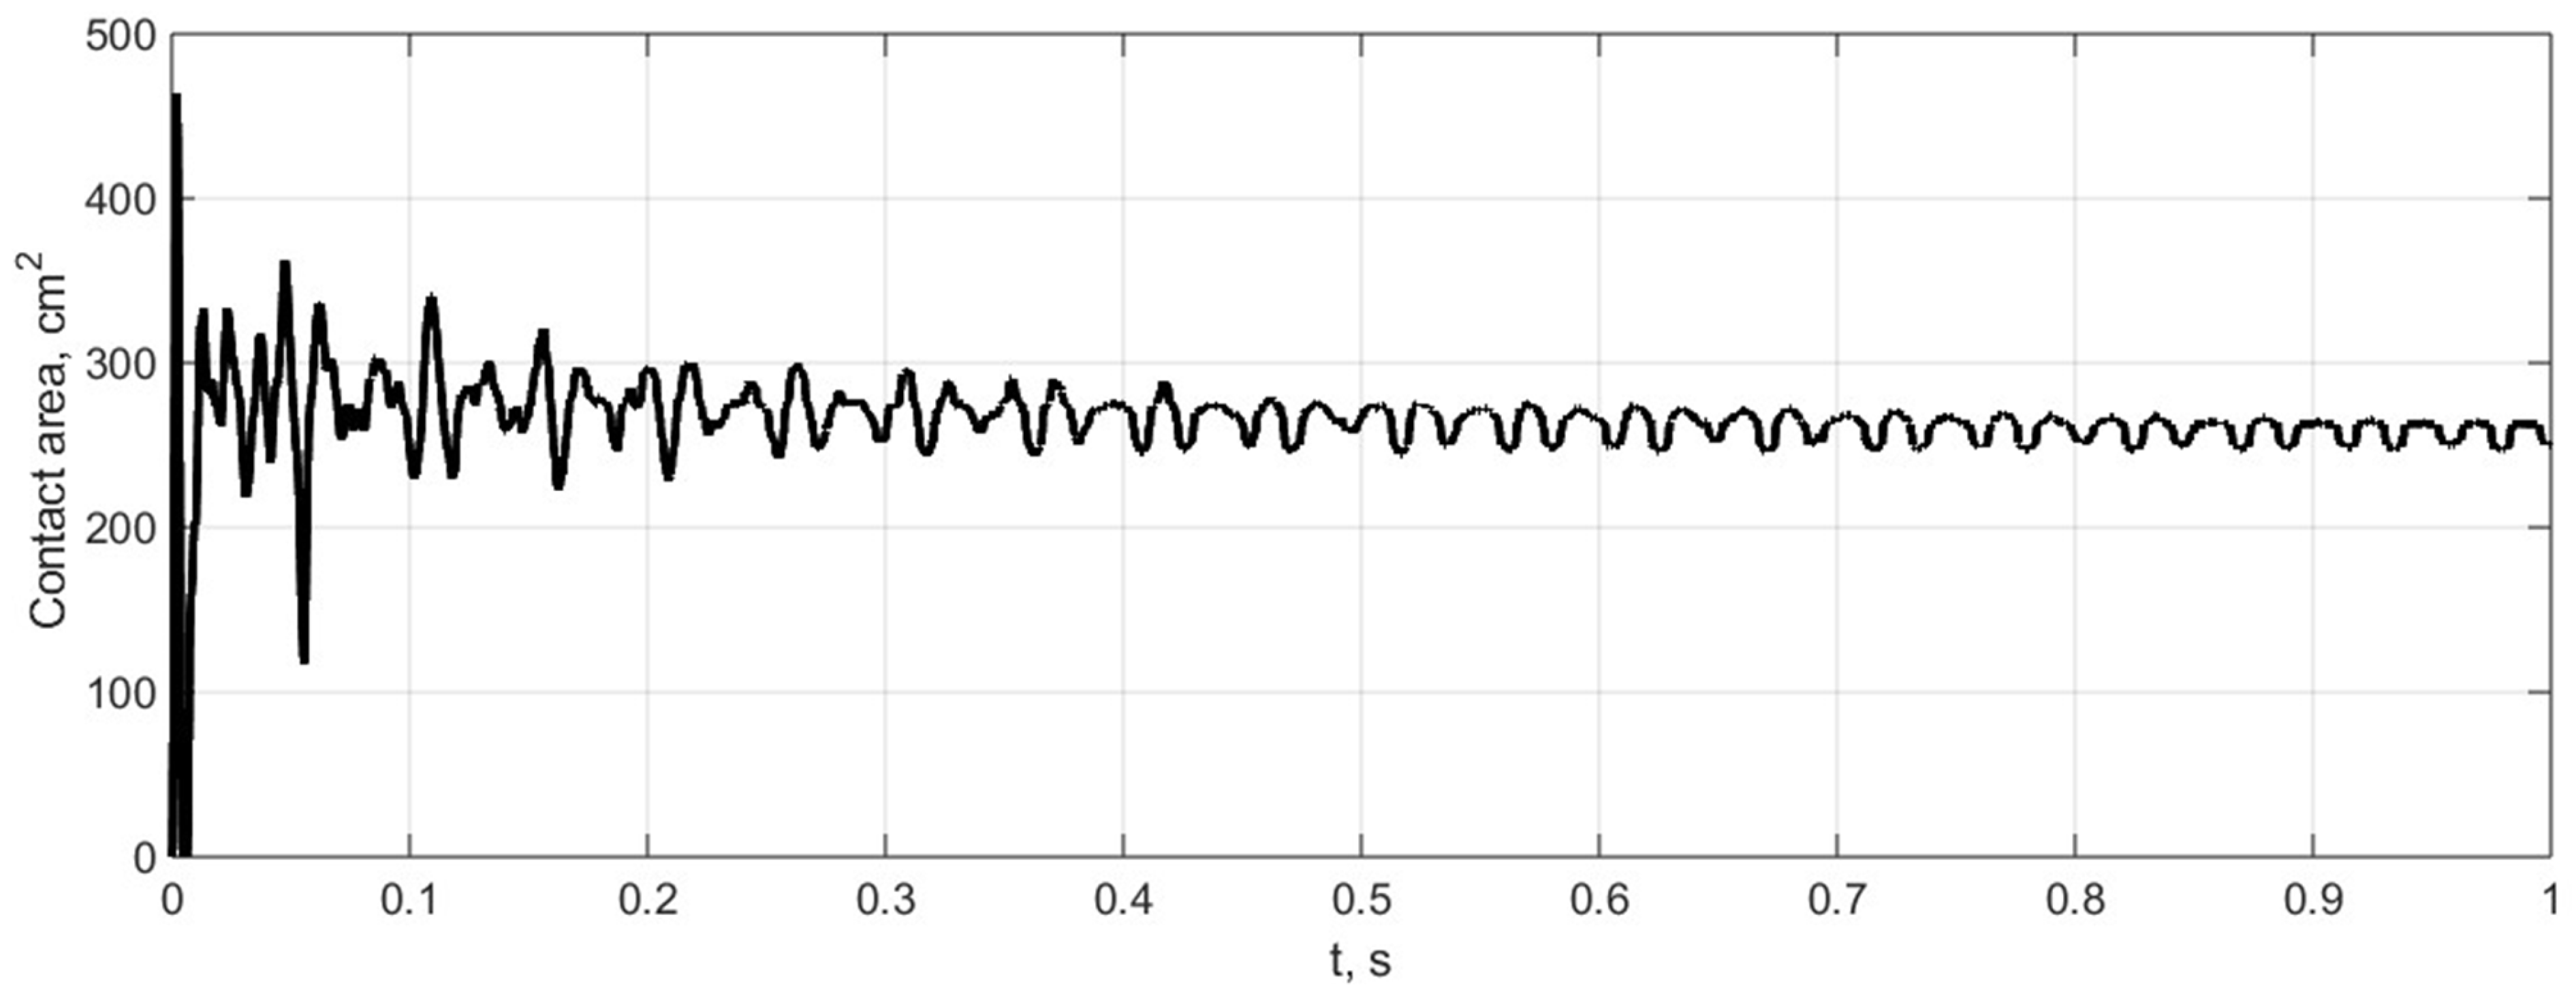
The variation in the tyre contact area with the road surface is shown in
Figure 9. It can be observed that the trend of the contact area is similar to the changes in the vertical contact force. During the initial process, the contact area decreases to zero, indicating that contact is lost.
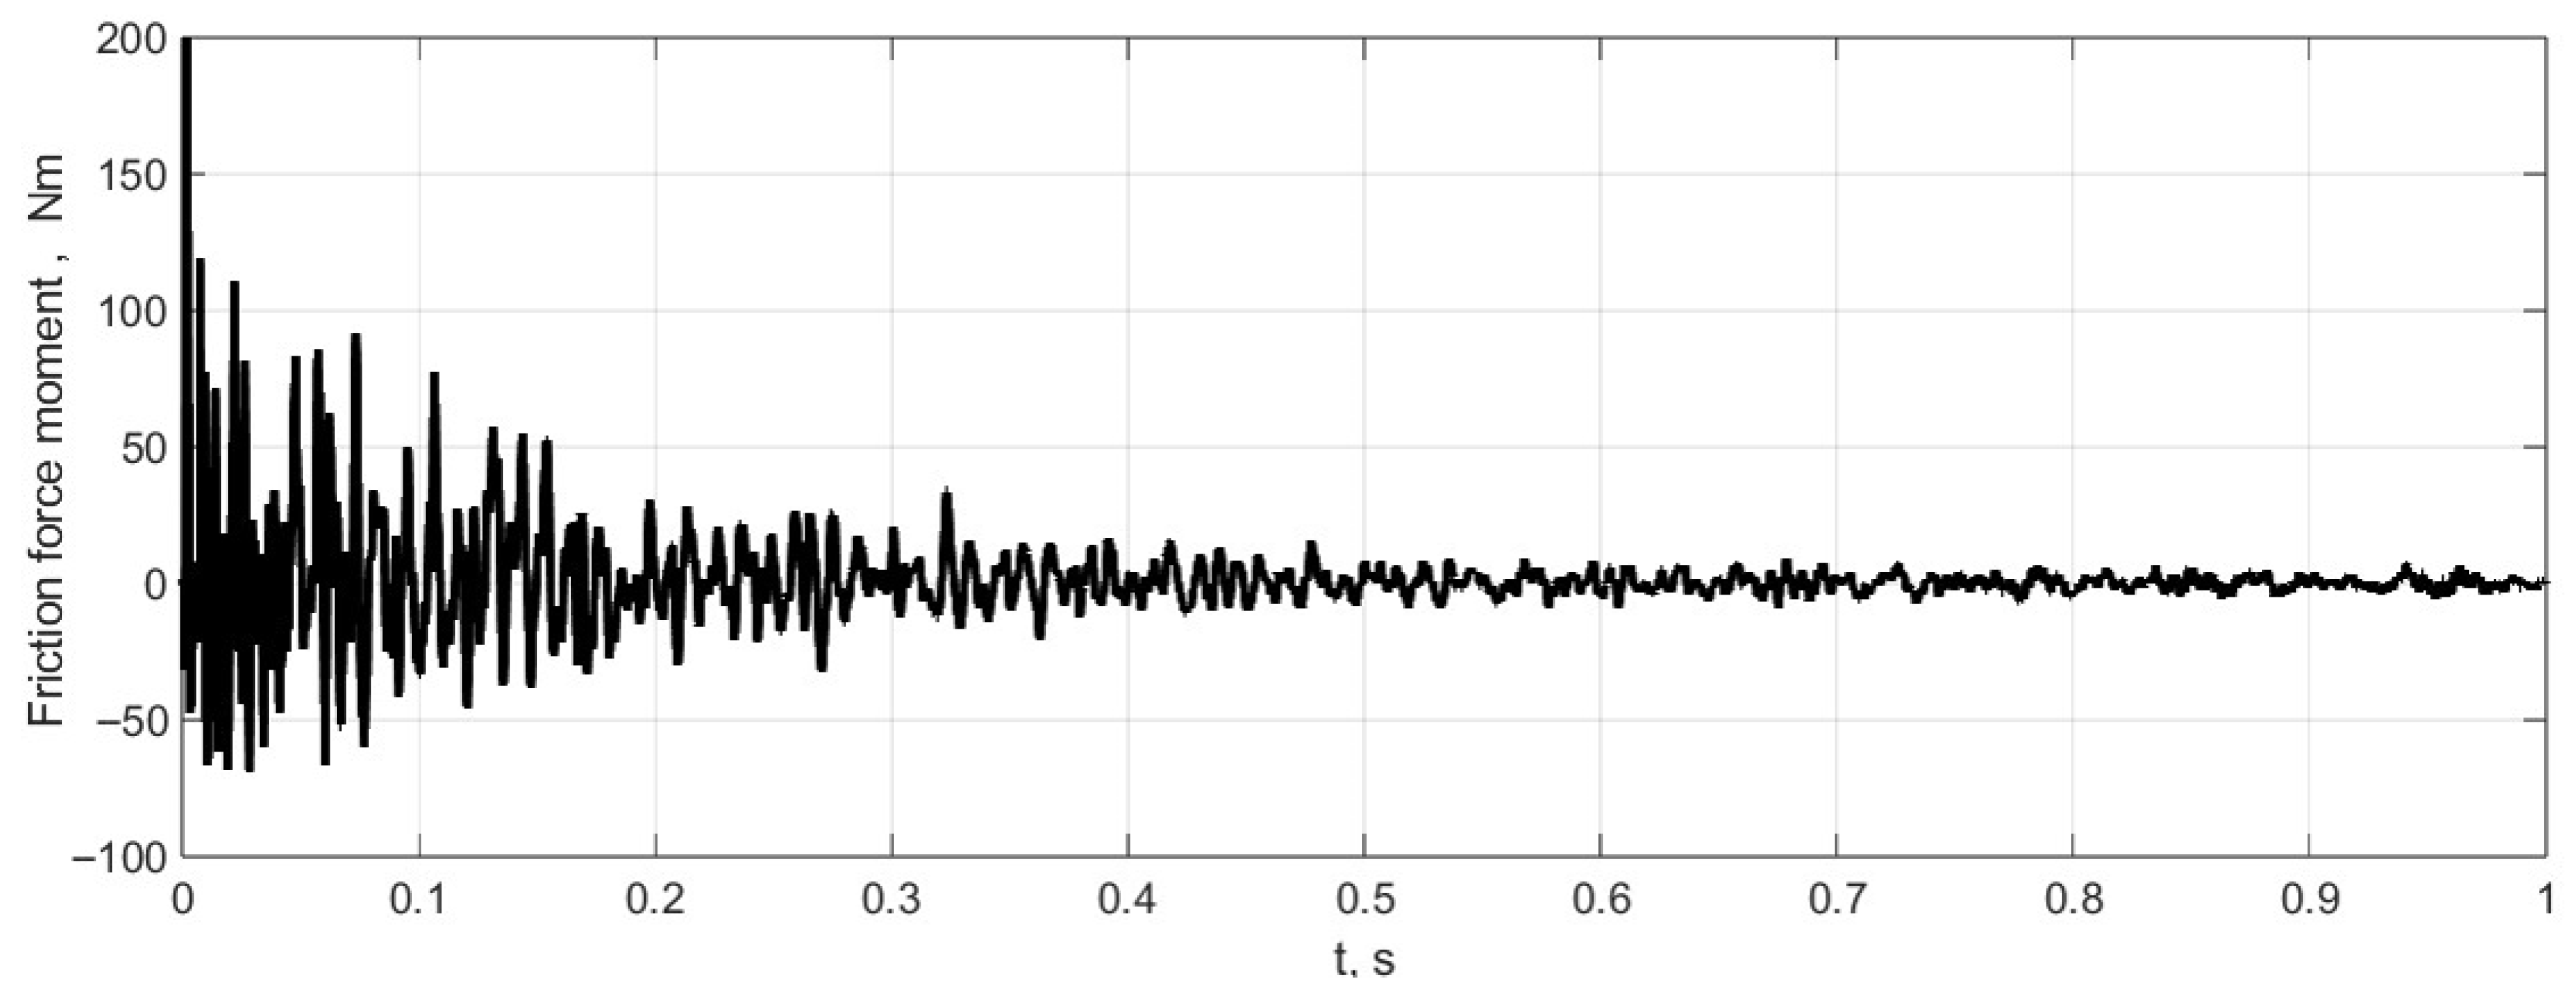
Since contact forces are calculated over the entire contact surface, it is possible to determine the torque of the friction forces acting on the tyre contact patch around the vertical axis Y (see
Figure 10).
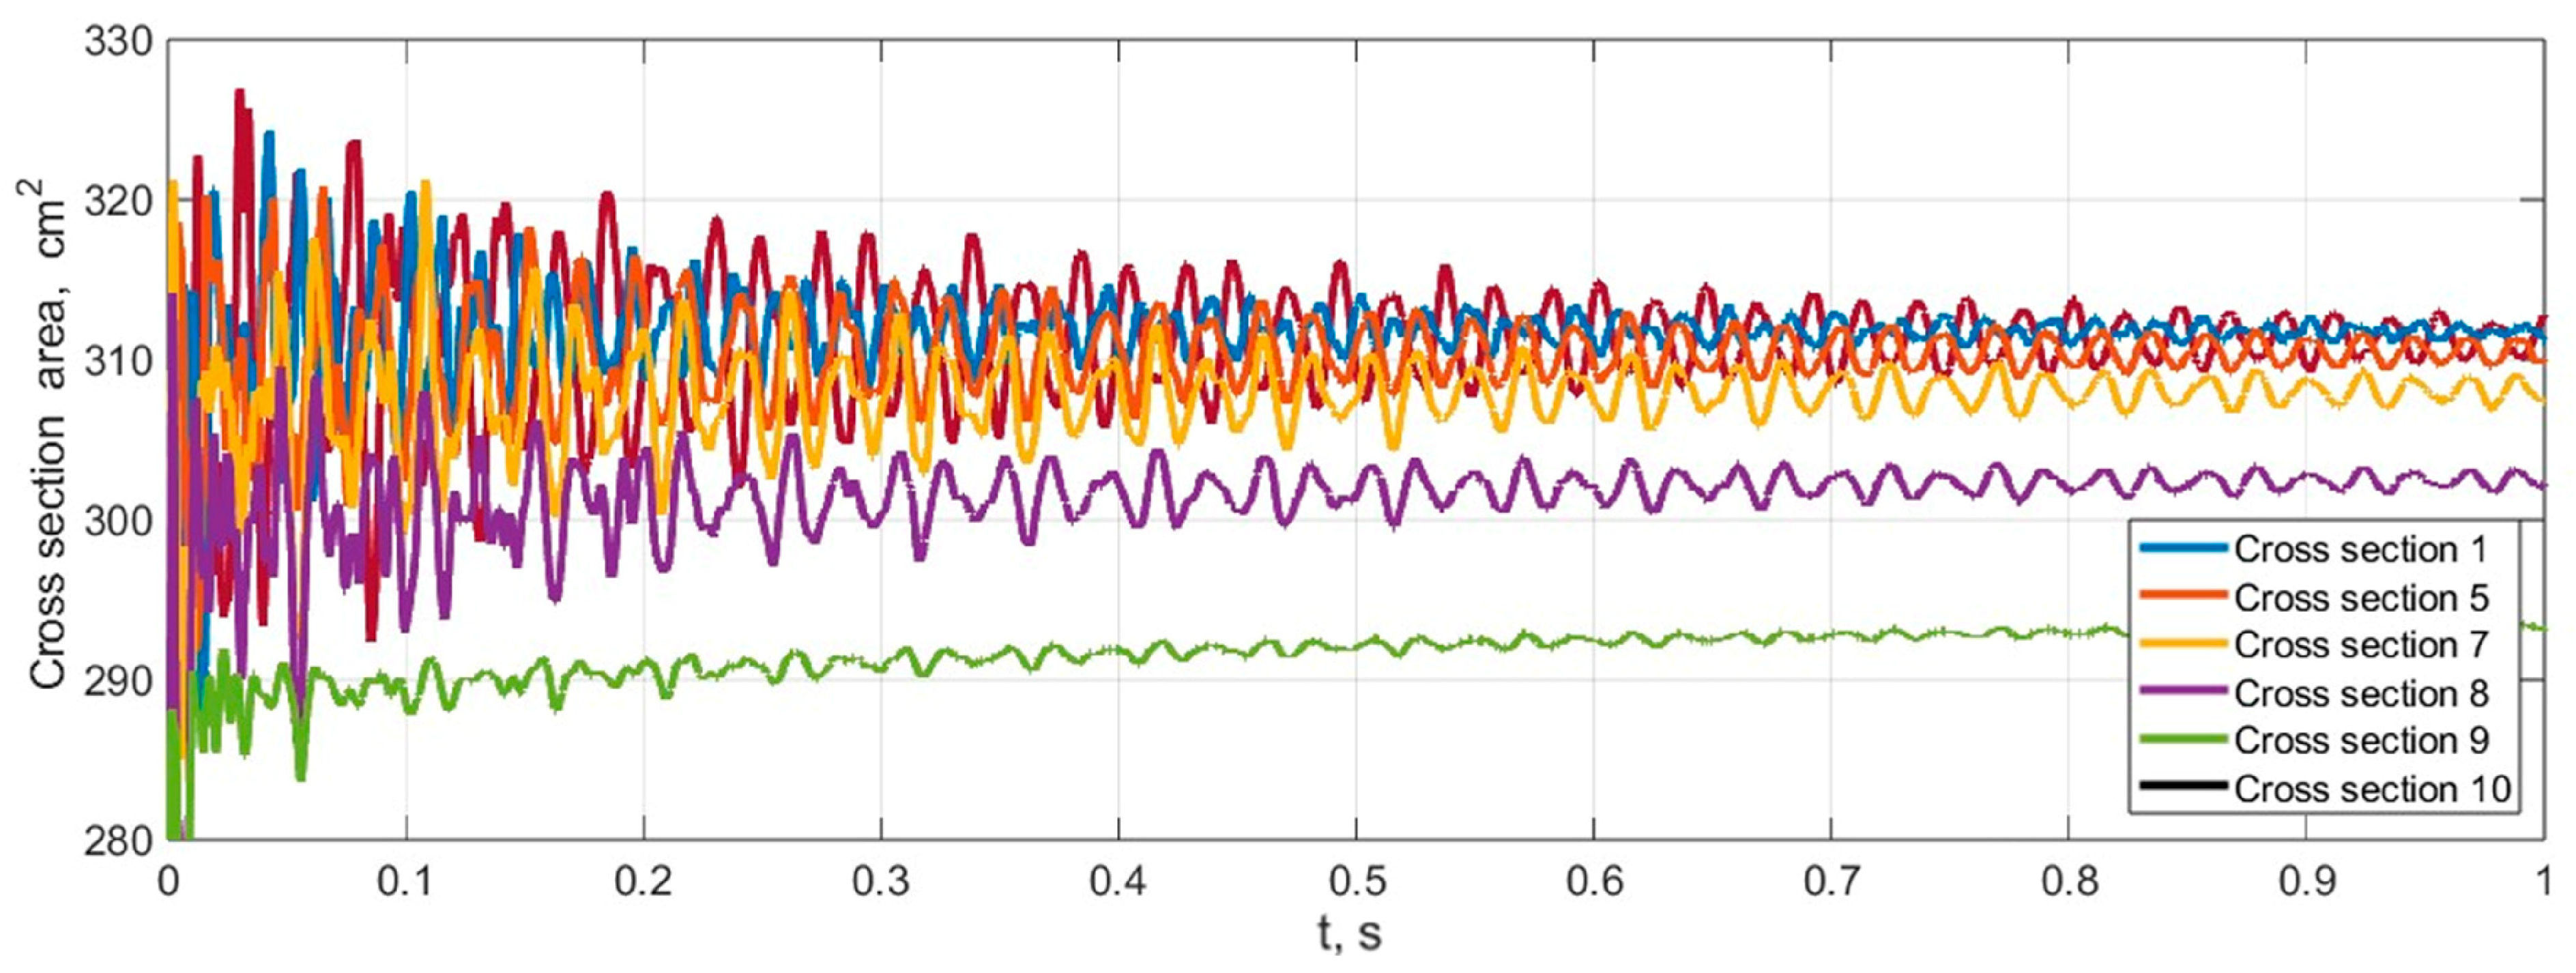
Additionally, using the developed model, variations in the tyre’s cross-section and outer surface areas can be calculated (see
Figure 11). In this graph, the cross-sectional areas are shown at different sections (from 1 to 10), and the cross-sectional areas at sections from 11 to 20 vary in the same way as at sections 1 to 10, because the physical and mechanical properties of the surface and the load are symmetrical to the vertical axis.
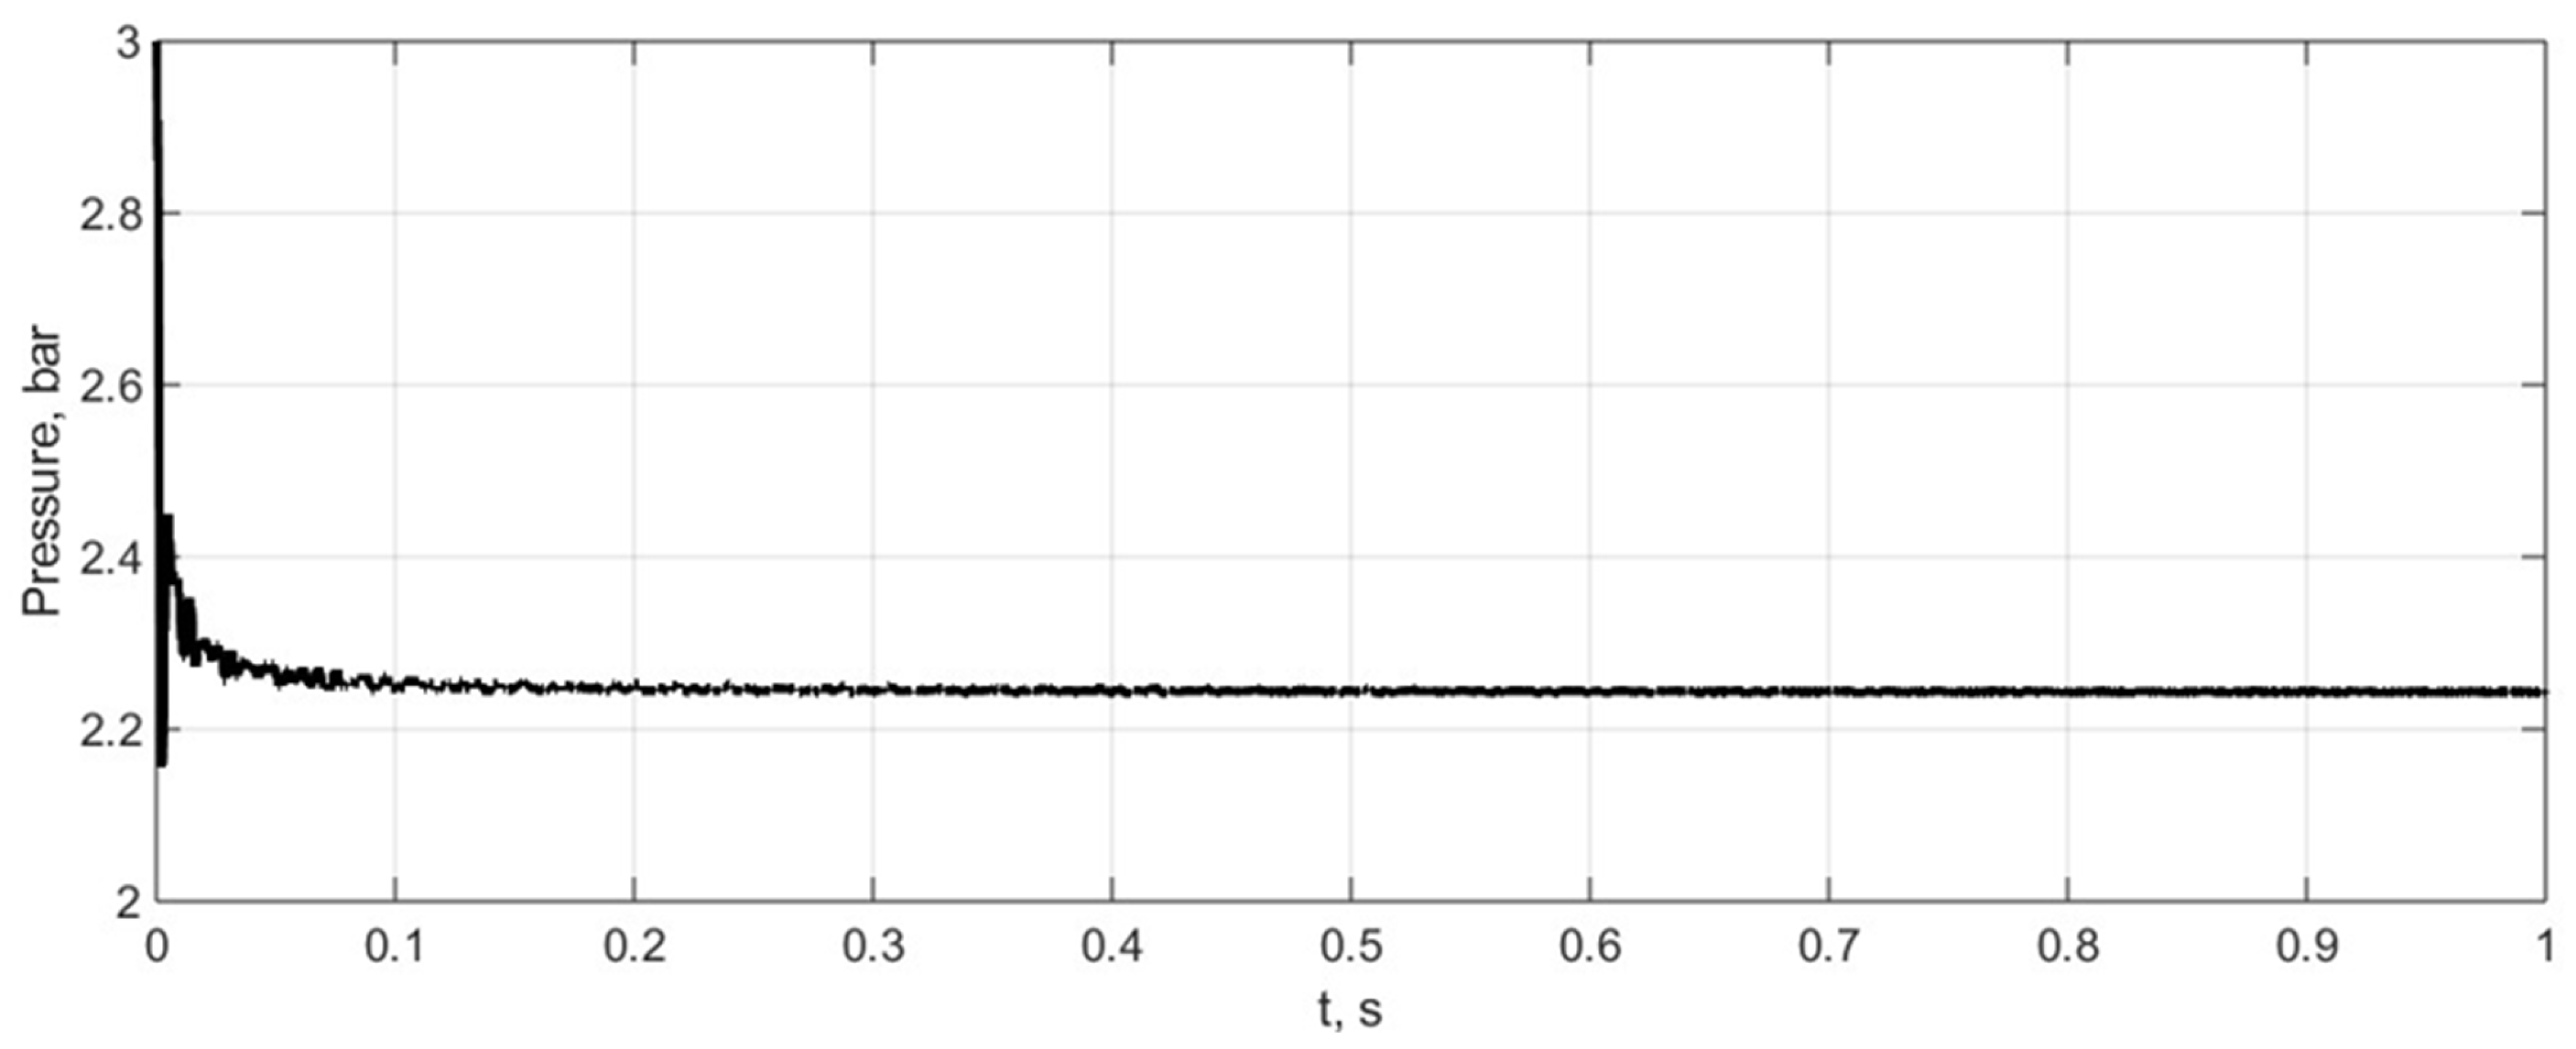
The variations in tyre pressure are shown in
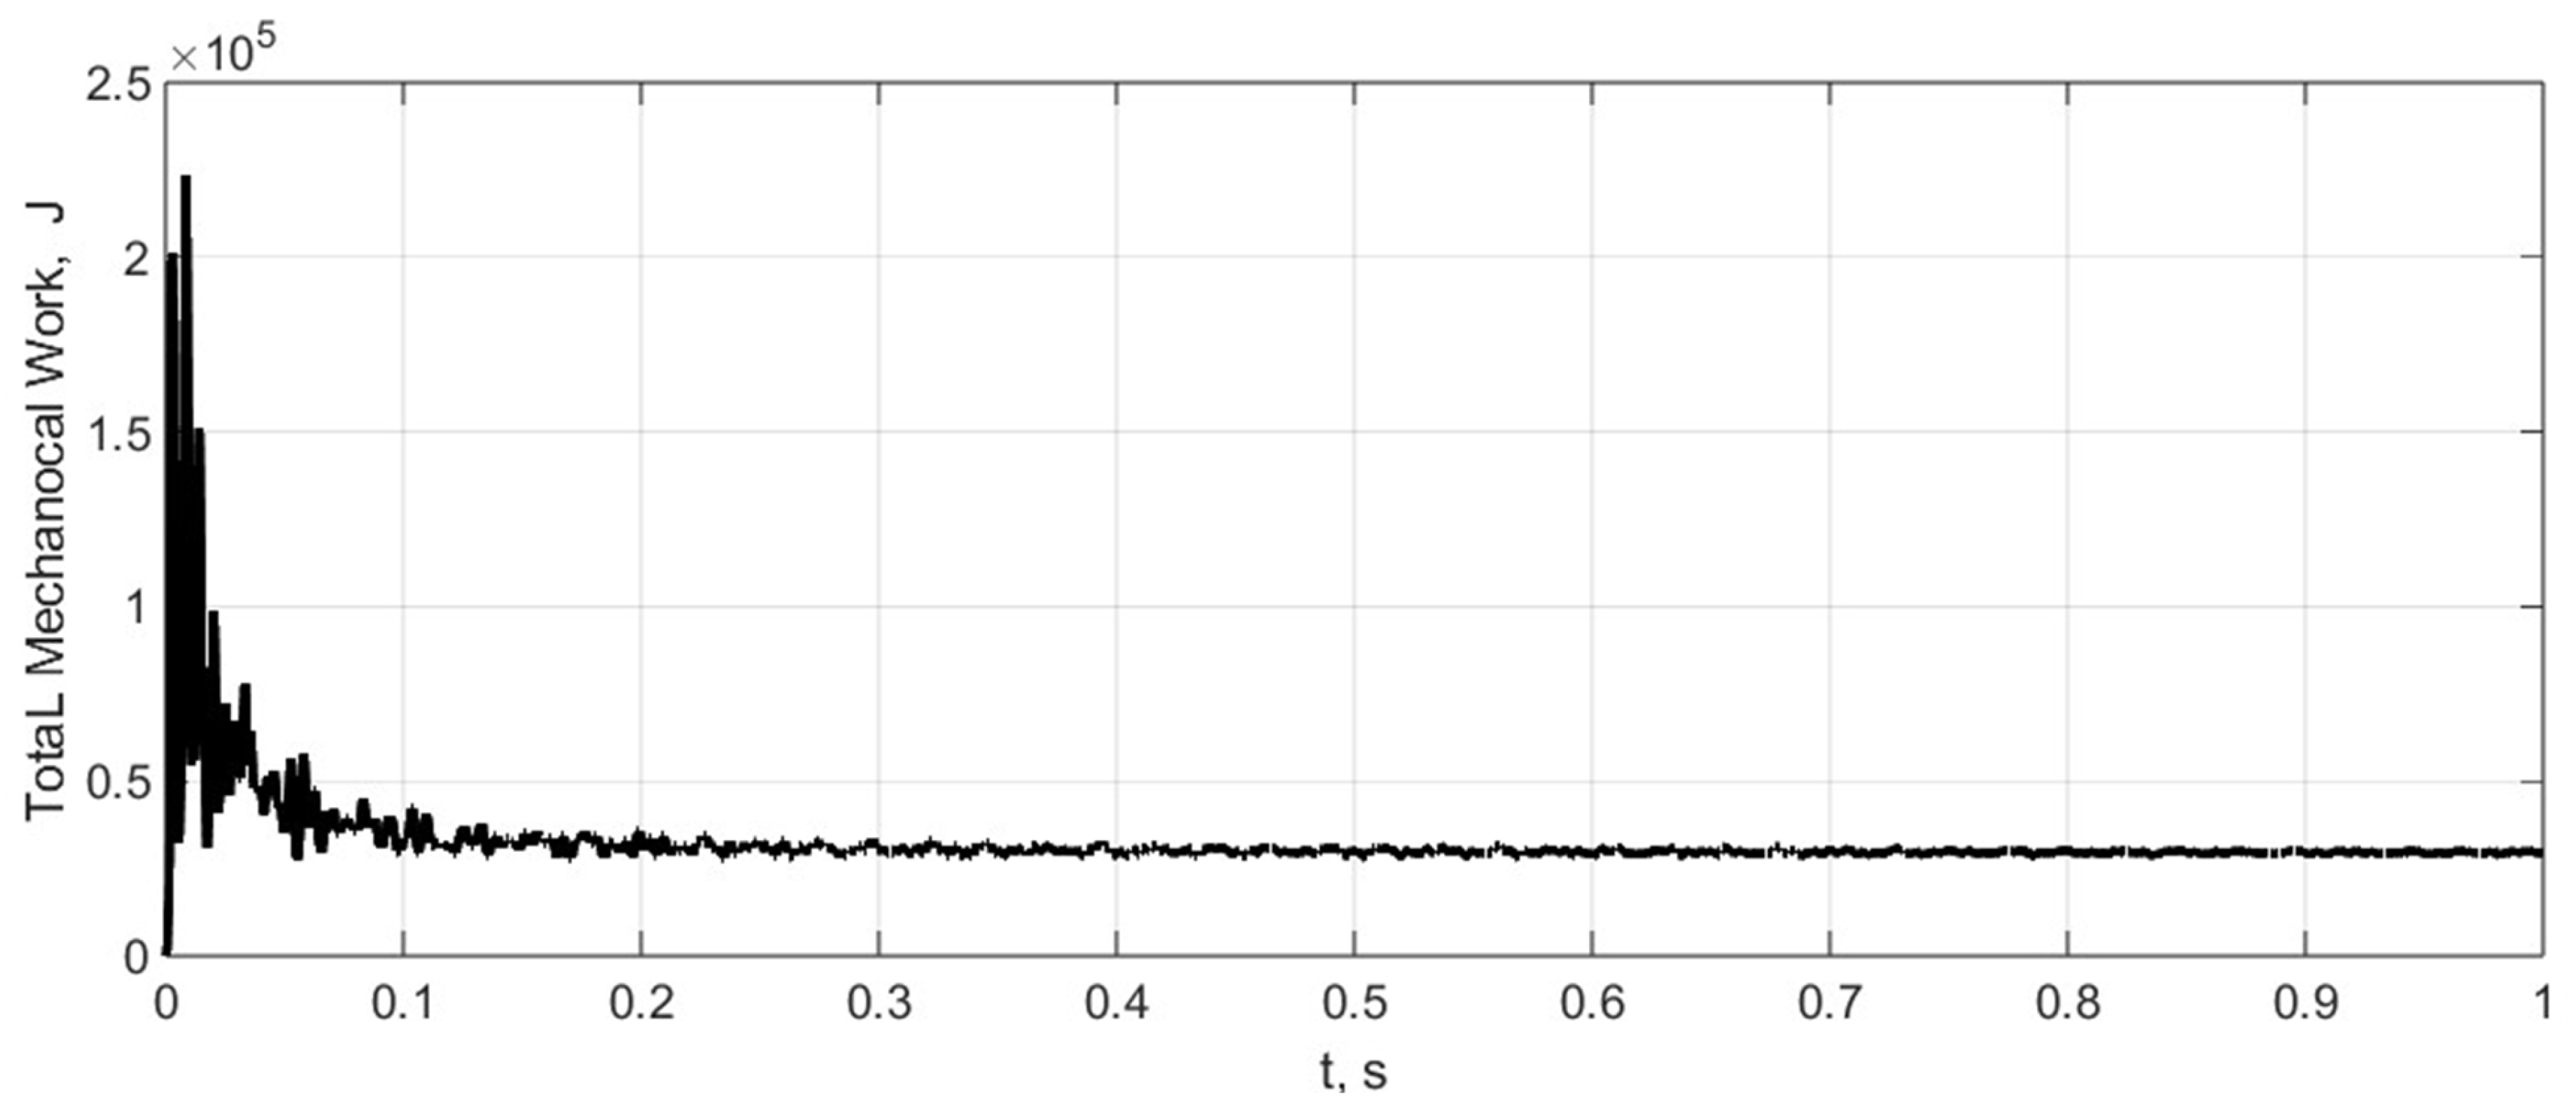
Figure 12. Finally, the kinetic energy of the tyre and the variations in the mechanical work of internal forces are presented in
Figure 13 and
Figure 14.
The tyre wear process can be further investigated using the kinetic energy and mechanical work data.
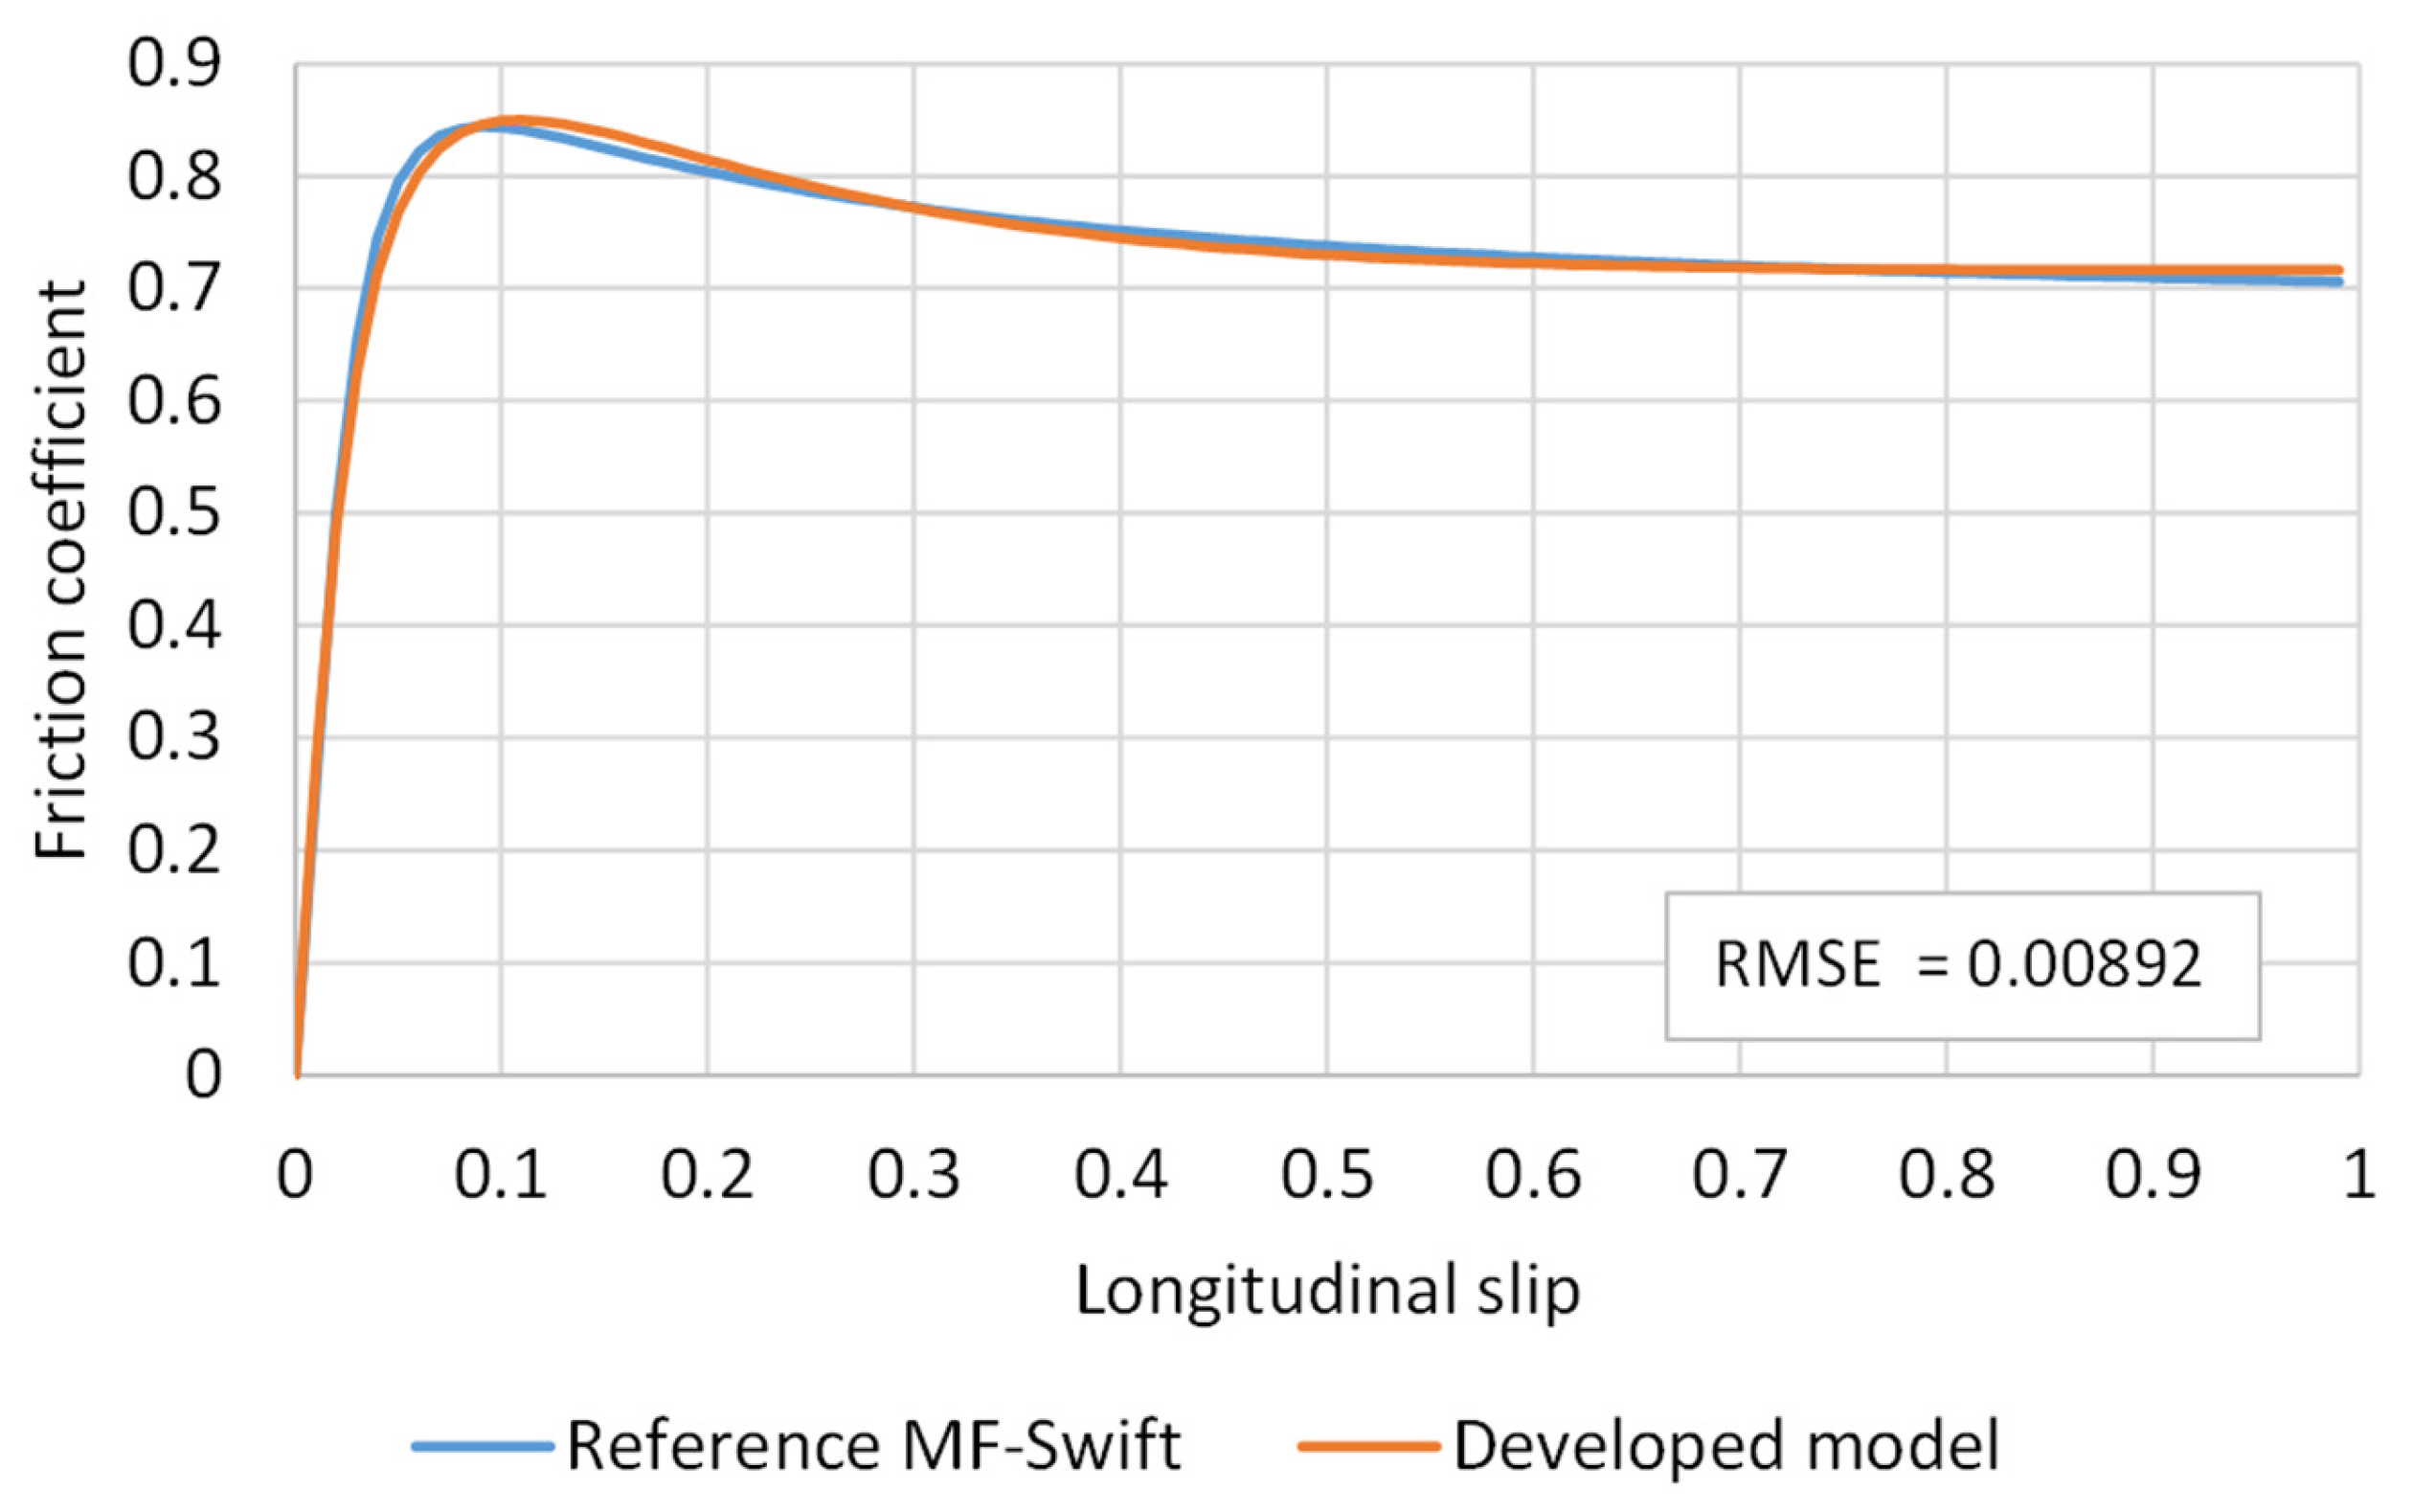
Finally, the developed TM was compared to the previously validated MF-Swift TM. Root mean square error (RMSE) was used as an objective evaluation metric. The representation of the typical friction coefficient in the longitudinal direction (under a vertical load of 5000 N) is shown in
Figure 15.
It can be seen that the developed model yields very similar results (RMSE = 0.00892) to those of the experimentally validated MS-Swift model. At the same time, the developed model can provide much more information by considering different parameters, which could be used for a very detailed investigation of contact interaction.
