Article

Influence of Wetting and Drying Conditions on the Mechanical Behavior of Brittle Sandstone Containing Folded Cracks

1
College of Applied Sciences, Taiyuan University of Science and Technology, Taiyuan 030024, China
2
School of Civil Engineering, Central South University, Changsha 410075, China
*
Author to whom correspondence should be addressed.
Appl. Sci. 2025, 15(16), 8905; https://doi.org/10.3390/app15168905
Submission received: 17 June 2025 / Revised: 25 July 2025 / Accepted: 30 July 2025 / Published: 13 August 2025

Abstract

Compressed air energy storage in aquifers (CAESA) offers advantages of wide availability and low cost, but natural cracks in aquifers may initiate, propagate, and coalesce under mechanical fields, posing potential security risks for CAESA projects. Most previous research has predominantly addressed straight cracks, while folded cracks, which are commonly encountered in geological formations, remain insufficiently studied. This gap in understanding the mechanical behavior of brittle rocks with folded cracks under wetting conditions presents a critical challenge to ensuring the stability of CAESA operations. In this study, uniaxial compression tests were carried out on sandstone specimens with different crack inclination angles (β) and crack folded numbers (n) under wetting and drying conditions using the MTS 815 testing system combined with an acoustic emission system and digital image correlation system. The deformation behavior, peak strength, crack initiation, and coalescence modes under wetting conditions were comprehensively investigated and compared with those under drying conditions. It can be found that the peak strength increases with β (with the maximum peak strength at 1.59–3.44 times the minimum for the same n), while the effect of n is relatively minor (only 1.09–1.21 times variation); the peak strength under wetting conditions is consistently lower than that under drying conditions (all wet/dry strength ratios < 1). Six distinct crack initiation modes and two coalescence patterns were identified. These findings provide valuable insights into the failure mechanisms of brittle rocks containing folded cracks under varying moisture conditions, offering practical references for anti-cracking design and risk assessment of CAESA cavern structures.

1. Introduction

Long-term energy storage technologies not only balance the volatility of renewable energy and improve the reliability of the power grid, but also reduce energy costs, enhance energy autonomy, and support the development of emerging technologies, such as distributed energy [1]. Compressed air energy storage (CAES), a representative long-term energy storage technology, has demonstrated broad development potential due to its advantages, including a large storage capacity, high operational safety, long service life, low cost, and environmental protection. This technology involves components such as compressors, heat exchangers, expanders, and underground caverns [2]. The safety and stability of underground caverns are crucial to the long life of the CAES system.
Table 1 lists the categories of CAES caverns, which include salt caverns [3], artificial lining caverns [4], depleted oil and gas fields [5,6], abandoned coal mines [7], and aquifers [8]. Among them, there are no mature commercial compressed air energy storage in aquifers (CAESA, Figure 1) power stations, but they have been validated by the practical cases of the Pittsfield site in the United States [9]. CAESA has garnered increasing attention due to its ability to minimize thermal energy loss, reduce geological transformation costs, and operate with fewer geographic constraints [10,11]. However, non-straight natural cracks in aquifers are subjected to mechanical fields (inner cavern pressure and in situ stress). They are likely to have been initiated, propagated, and coalesced, which could result in a potential security risk [12,13]. Therefore, it is crucial to investigate the mechanical behavior of brittle rocks containing folded cracks, as this provides a fundamental basis for the anti-fracture design and risk mitigation of CAESA systems.
Currently, experimental studies on the mechanical characteristics of cracks in rocks primarily focus on straight cracks, including single straight cracks [18] and multiple straight cracks [19,20,21]. By contrast, relatively few studies have addressed non-linear cracks, such as curvilinear and folded cracks. For curvilinear cracks, Zhu et al. [22] used sandstone specimens with arc fissures to conduct uniaxial compression tests for investigating the effect of arc angle on mechanical properties, failure mode, and the fracture evolution process. Ma et al. [23] and Yang et al. [24] conducted uniaxial compression tests on 3D-printed specimens with S-shaped concerns and sandstone specimens with S-shaped concerns to investigate their strength, deformability, and failure behaviors. Dong et al. [25] and Wu et al. [26] carried out uniaxial compression tests using marble samples containing intermediate double S-shaped masses and granules with straight and arc masses for studying crack extension patterns and categorized failure modes. For folded cracks, Fan et al. [27], Zhou et al. [28], and Liu et al. [29] utilized Portland cement specimens containing folded cracks of different inclination angles and undulation angles, sandstone specimens containing a single dentate folded crack, and rock-like specimens containing a fold crack created by 3D sand printing with different undulation angles to conduct uniaxial compression tests for investigating folded-crack mechanical properties and fracture behaviors. Wang et al. [30] further extended these investigations by employing rock-like materials containing two pre-existing folded fissures at varying inclination and undulation angles to analyze peak strength, coalescence patterns, and failure modes under uniaxial loading. However, most of these studies were conducted under dry conditions and did not account for the influence of underground water, which plays a critical role in altering the mechanical response of fractured rock masses.
To sum up, although the effects of underground water on rock deformation and strength have been explored in previous studies, there remains a need for a more detailed investigation into its influence on the mechanical behavior of rocks containing folded cracks, particularly with varying crack inclination angles and folded numbers. In this study, a series of uniaxial compression tests were conducted to examine the influence of underground water on the deformation behavior, peak strength, crack initiation, and coalescence modes of sandstone specimens with folded cracks of different geometrical configurations. These results were compared with those obtained under drying conditions. The findings offer new insights into how moisture conditions affect the mechanical response and fracture evolution of folded-crack rocks. Furthermore, they provide valuable guidance for practical engineering applications in water-rich geotechnical environments involving fractured rock masses.

2. Materials and Methods

2.1. Specimen Preparation

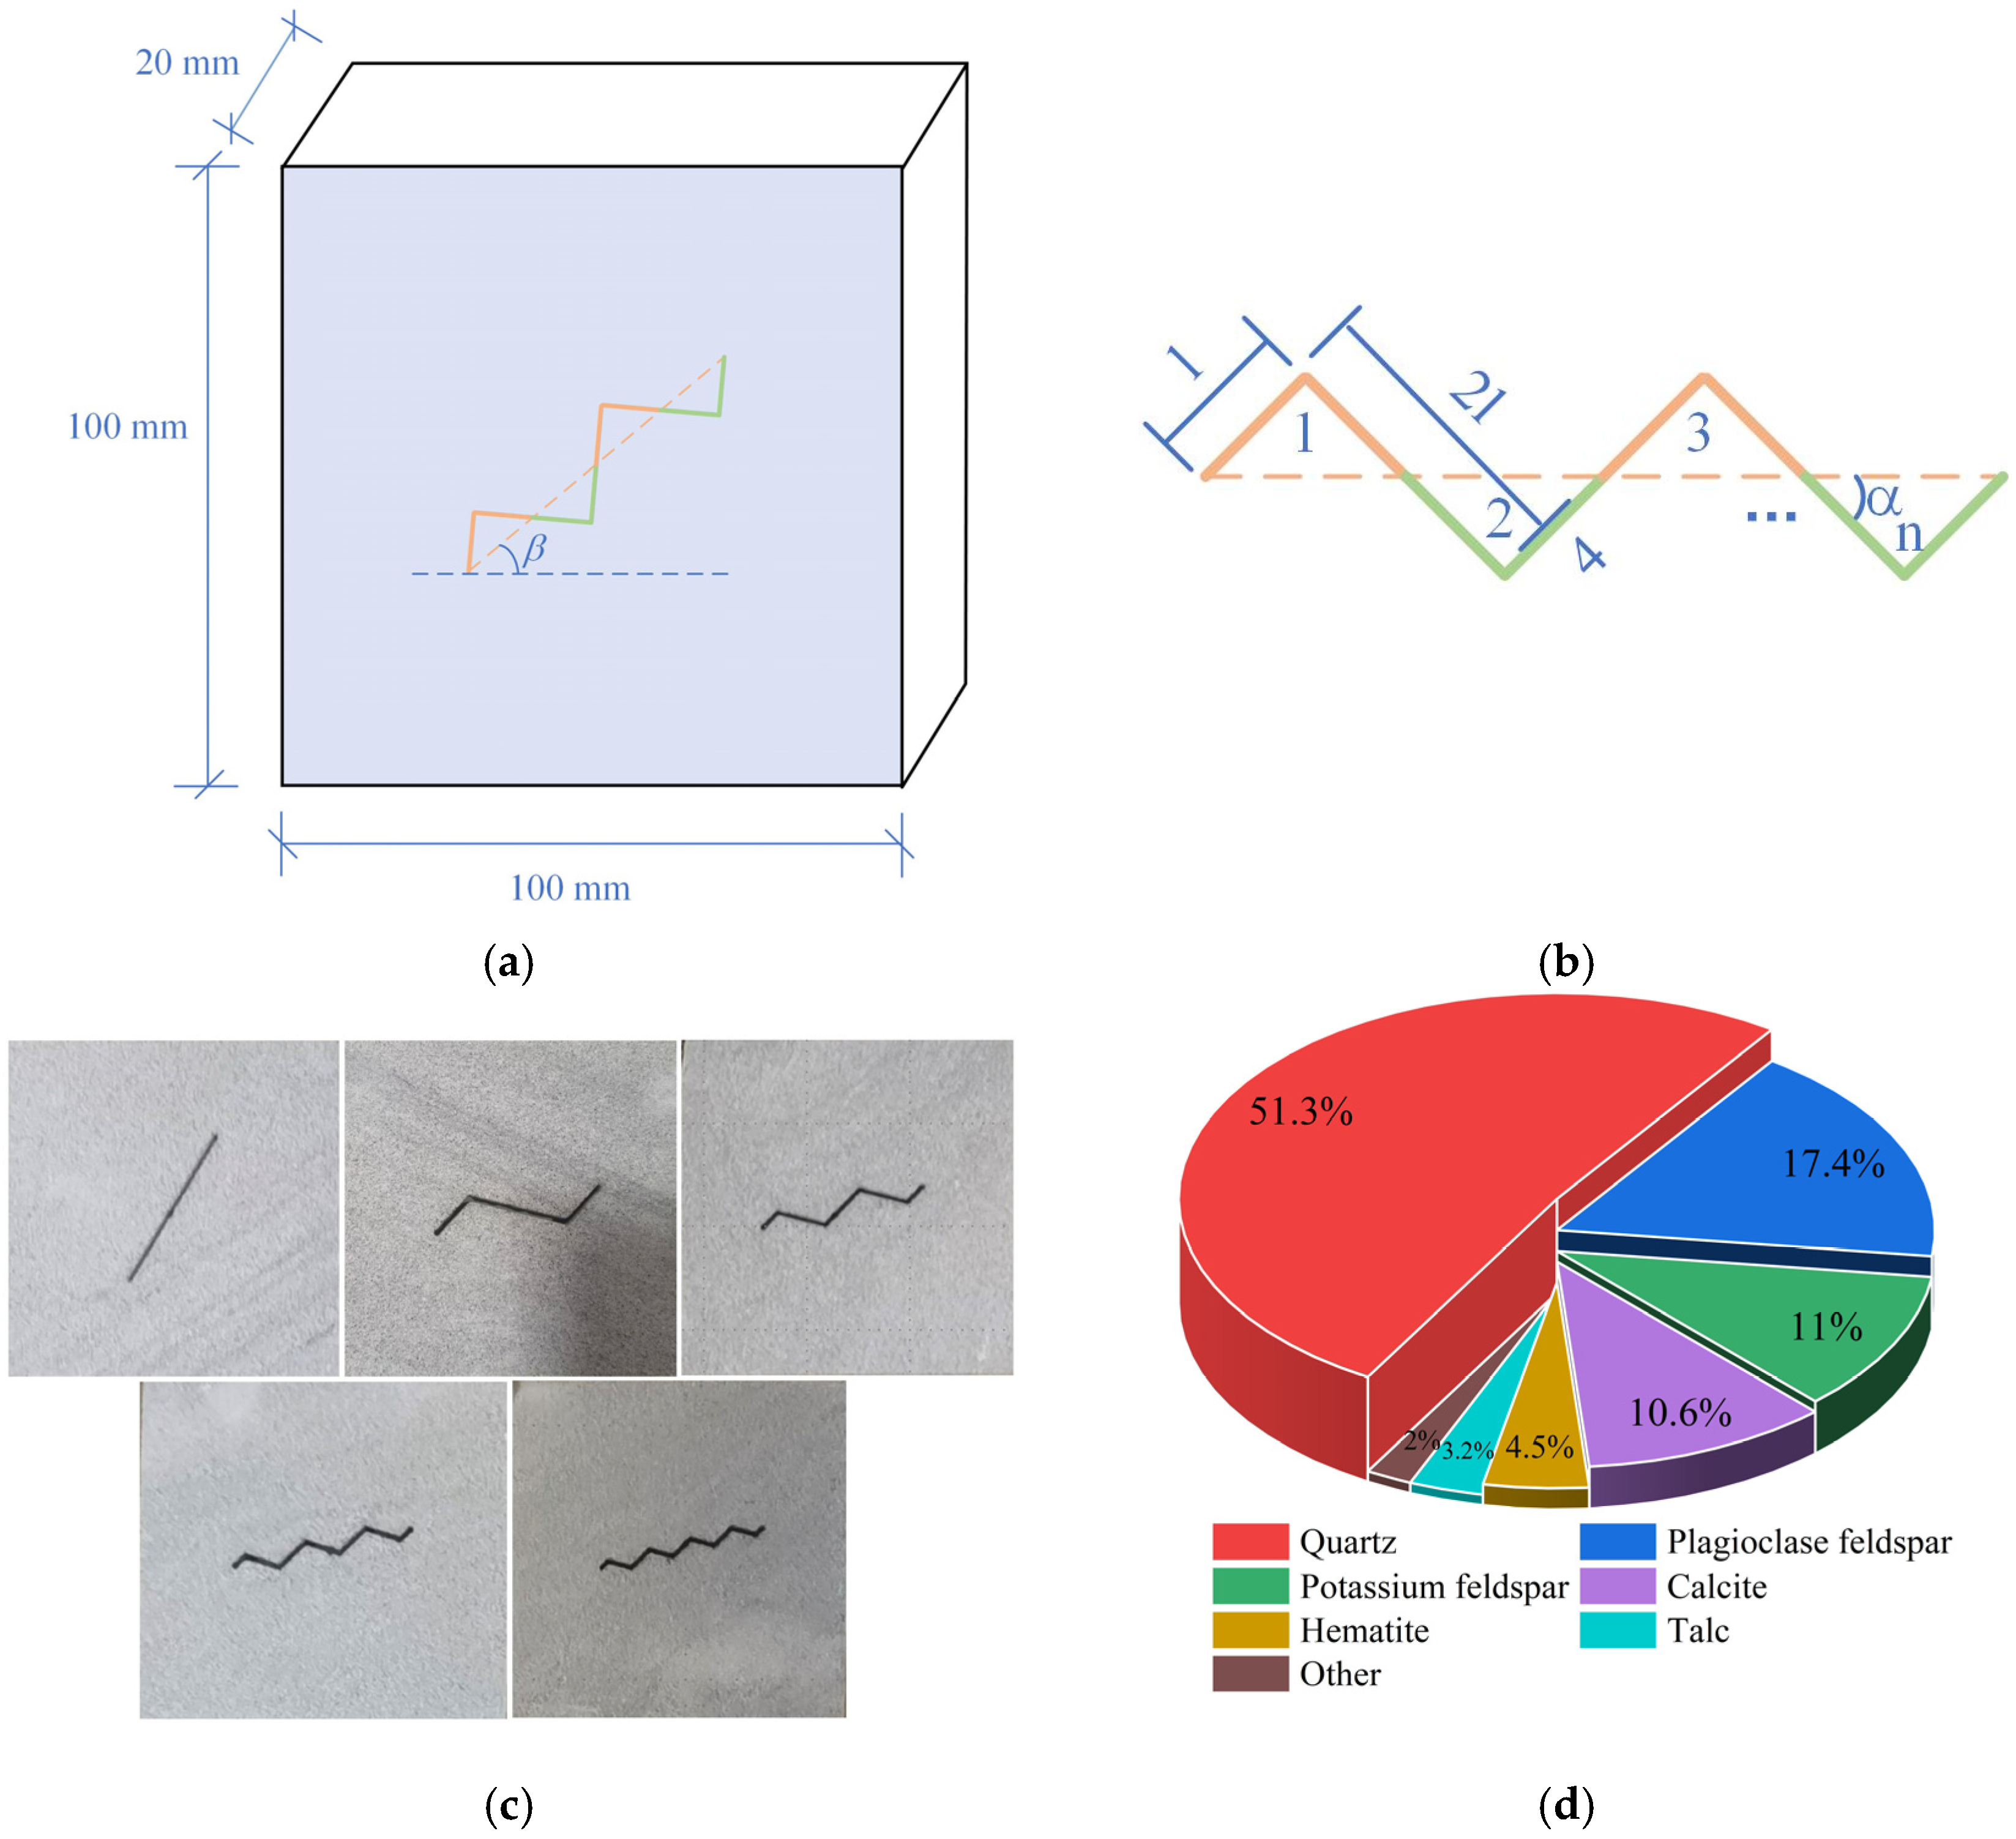
As shown in Figure 2, to compare the crack resistances of aquifer and non-aquifer surrounding rocks in CAES caverns, sandstone collected from Shandong Province, China, was selected to investigate the mechanical characteristics of rock specimens with folded cracks under both wetting and drying conditions. The porosity and moisture content of the intact specimen in its natural state were 3.6% and 2.47%, respectively. The original uniaxial compressive strength and Brazilian split tensile strength were 83.2 MPa and 4.5 MPa, respectively. The mineralogical composition of the specimen was Quartz, 51.3%; Plagioclase feldspar, 17.4%; Potassium feldspar, 11.0%; Calcite, 10.8%; Hematite, 4.5%; Talc, 3.0%; and other minerals, 2.0%. First, the rectangular specimen (100 mm × 100 mm × 20 mm in size) was processed by a cutting machine, and its axial roughness was controlled to within 0.02 mm. Subsequently, a folded pre-crack with a thickness of 1 mm was placed at the center of the specimen, penetrating it vertically, as shown in Figure 2a,b. Those geometric parameters and loading conditions are listed in Table 2, including the crack inclination angle (β), crack folded number (n), and crack folded length (l). The inclination angle β spans a wide range of orientations typical of natural sedimentary joints, while the fold number n characterizes the geometric complexity of the crack.
The specimens were divided into two groups to simulate aquifer (wetting, Group W) and non-aquifer (drying, Group D) surrounding rock conditions. Prior to testing, specimens were prepared for digital image correlation (DIC) by applying a speckle pattern as follows: (1) clean the specimen surface to ensure that it is flat and free of impurities; (2) apply a thin, uniform layer of non-reflective white matte paint (thickness < 0.1 mm); and (3) after drying, spray fine, evenly distributed black matte speckles to form a high-contrast pattern. Second, all rock specimens were placed in a constant temperature drying oven at 105 °C for 24 h to ensure that the rock specimens were dried (0% water saturation, using the weighing method to ensure that the mass no longer changes with time). Then, the rock specimens of Group W were soaked in water for 48 h to ensure that all pores in the rock were in a saturated state (no further increase in mass with 100% water saturation) close to the aquifer surrounding rock. Before testing, all specimens were returned to room temperature, and excess surface water on wet specimens was removed using absorbent paper. Due to the short testing duration (10–15 min), water content was assumed to remain constant during loading. To facilitate identification and comparison, specimens were labeled based on their crack geometry and moisture condition. For example, if β = 30°, n = 2, and the loading condition was the wetting condition, the specimen was named W-30-2. It is worth noting that when n = ∞, the crack becomes a straight crack, which is consistent with the case of n = 0, named W-β-∞(0). Three specimens were prepared for each condition to ensure the experimental repeatability and reliability of the results, as shown in Figure 2c.

2.2. Test Equipment and Method

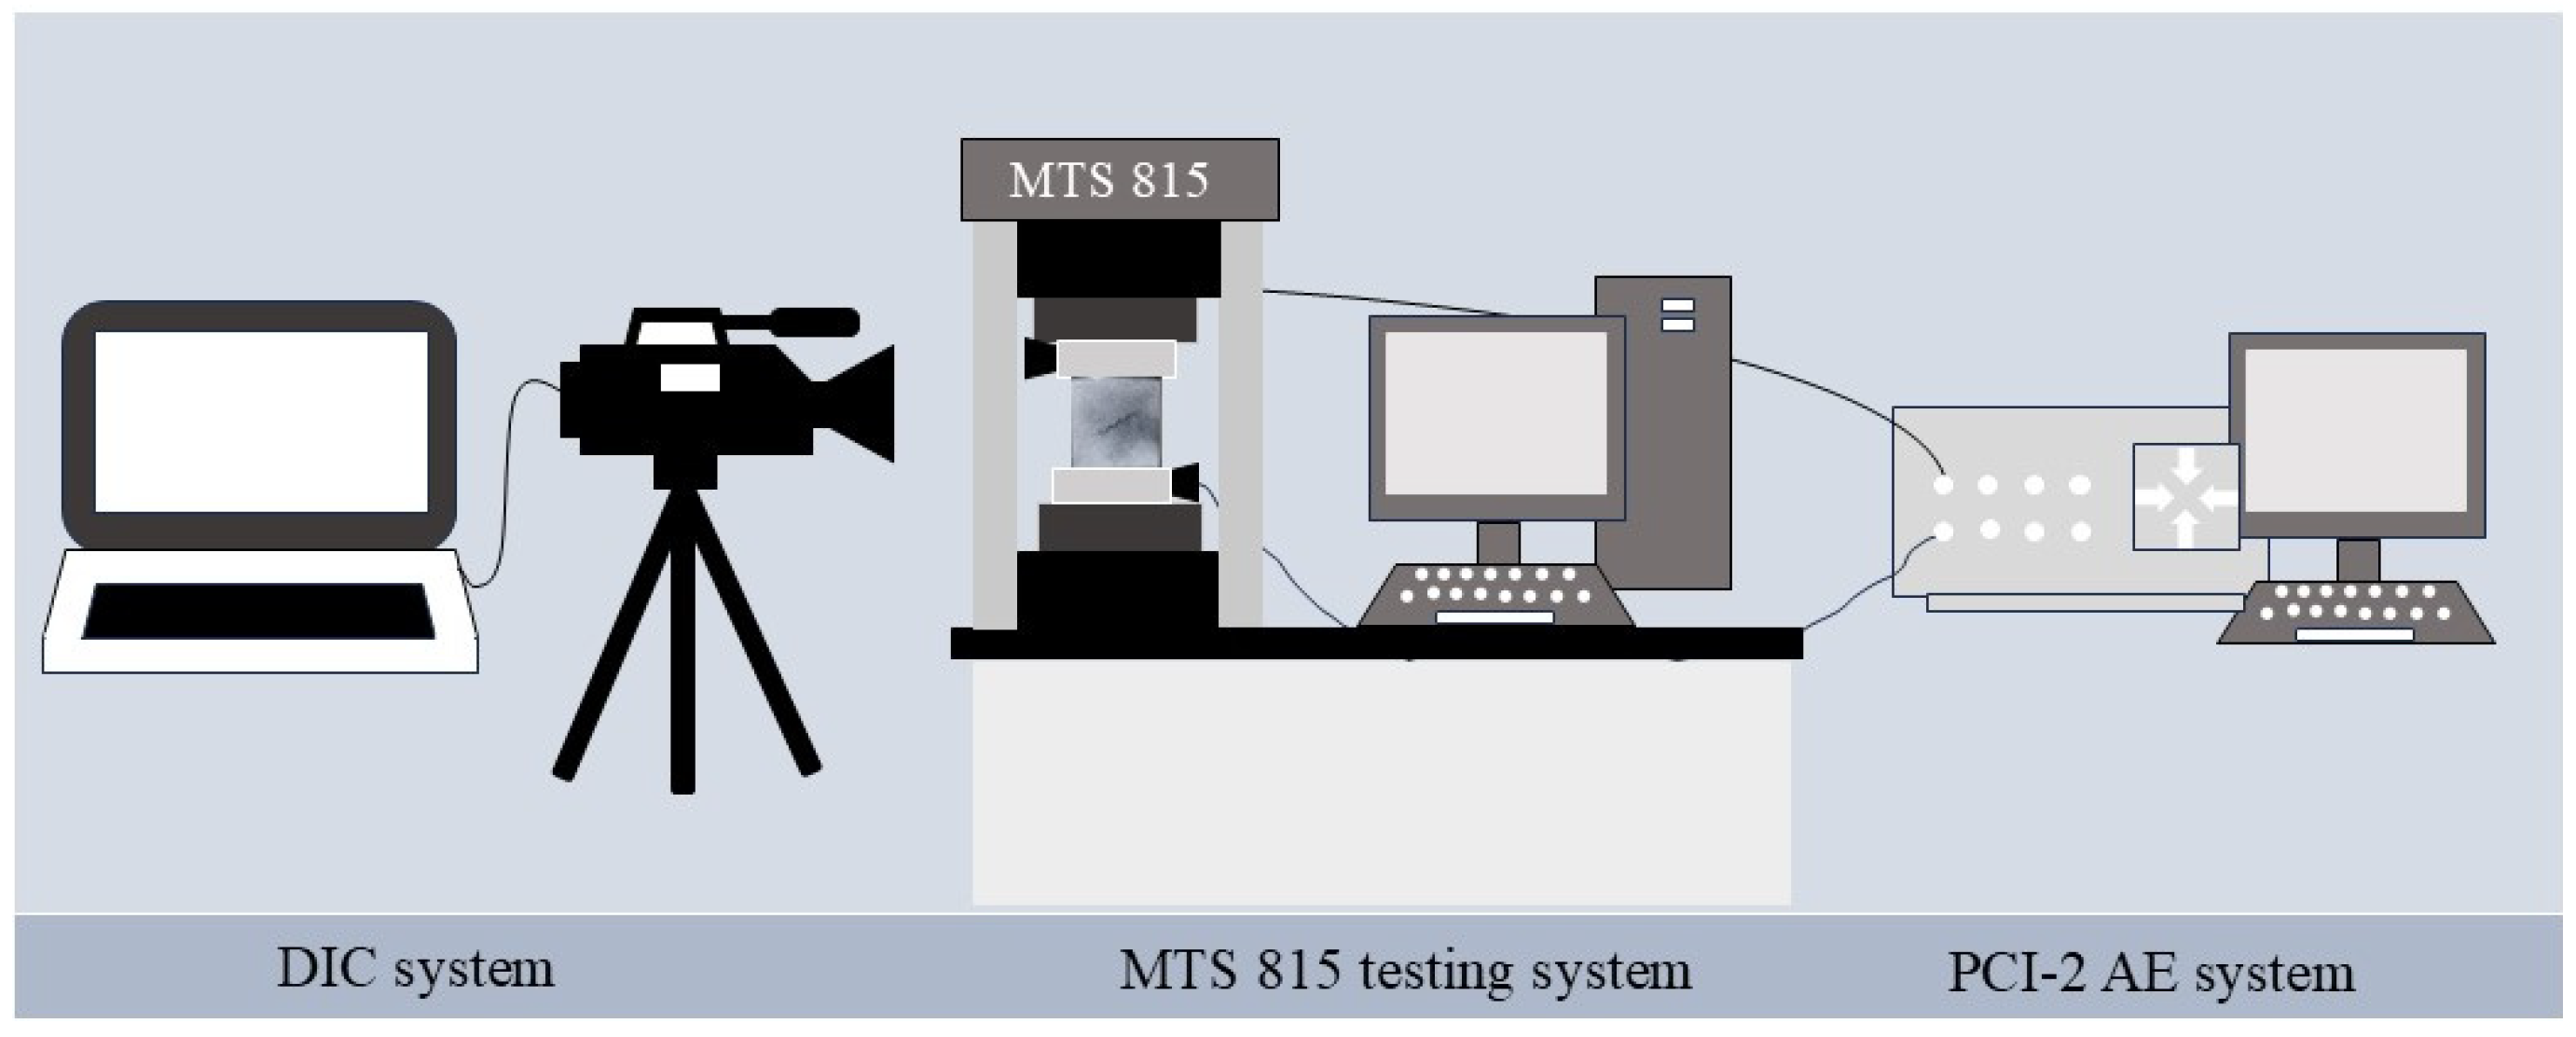
Figure 3 illustrates the testing system used in this study, which includes the MTS 815 testing system, the PCI-2 acoustic emission (AE) system, and the digital image correlation (DIC) system. The MTS 815 testing system provides the axial load by displacement control with a loading rate of 0.12 mm/min. The PCI-2 AE system is equipped with two probes, with a signal detection set to 40 dB. To ensure effective coupling between the AE sensors and the specimen surface, Vaseline was applied as a coupling agent. The DIC system consisted of a CCD camera (Canon brand from Tokyo, Japan), two light sources, and a computer equipped with the Ncorr software (an open-source DIC MATLAB R2014b program). The speckle image acquisition rate was set at 10 frames per second. During testing, the axial force and speckle photos were recorded synchronously. After testing, the crack initiation, propagation, and fracture trajectory were analyzed to compare the failure modes under wetting and drying conditions.

3. Results

3.1. Mechanical Characteristics of the Folded-Crack Rock Specimen

3.1.1. Deformation Behavior

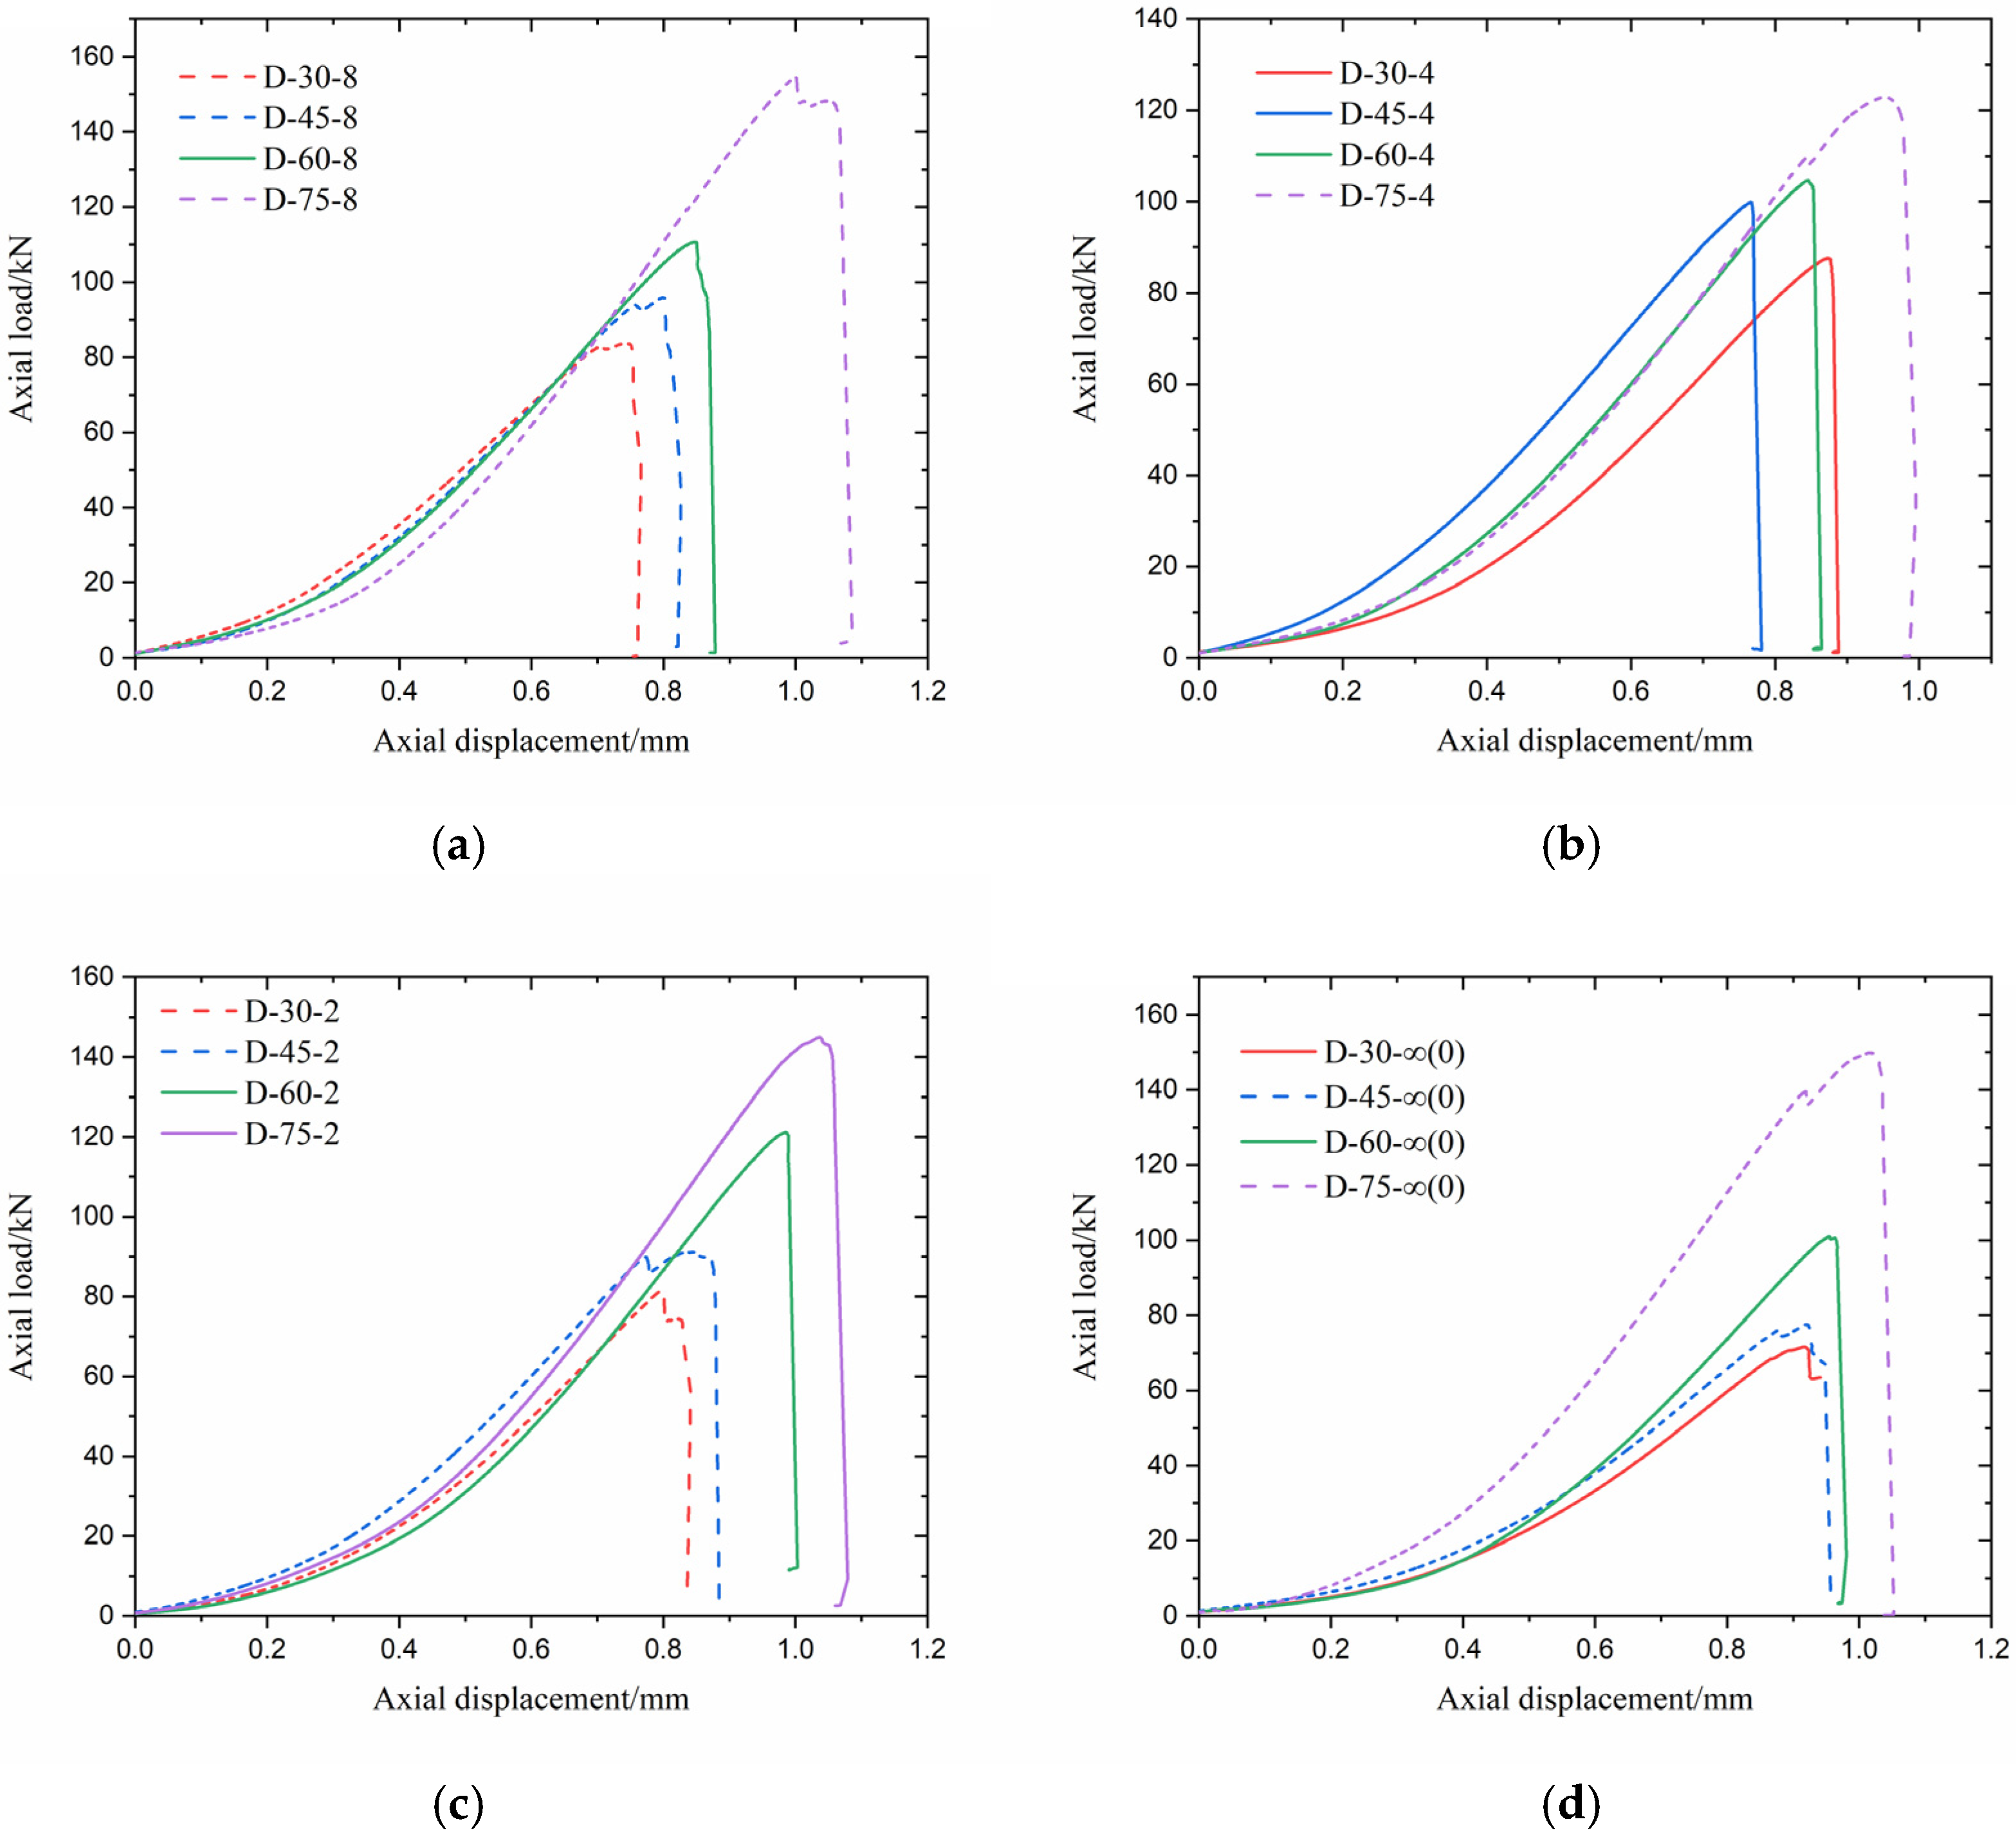
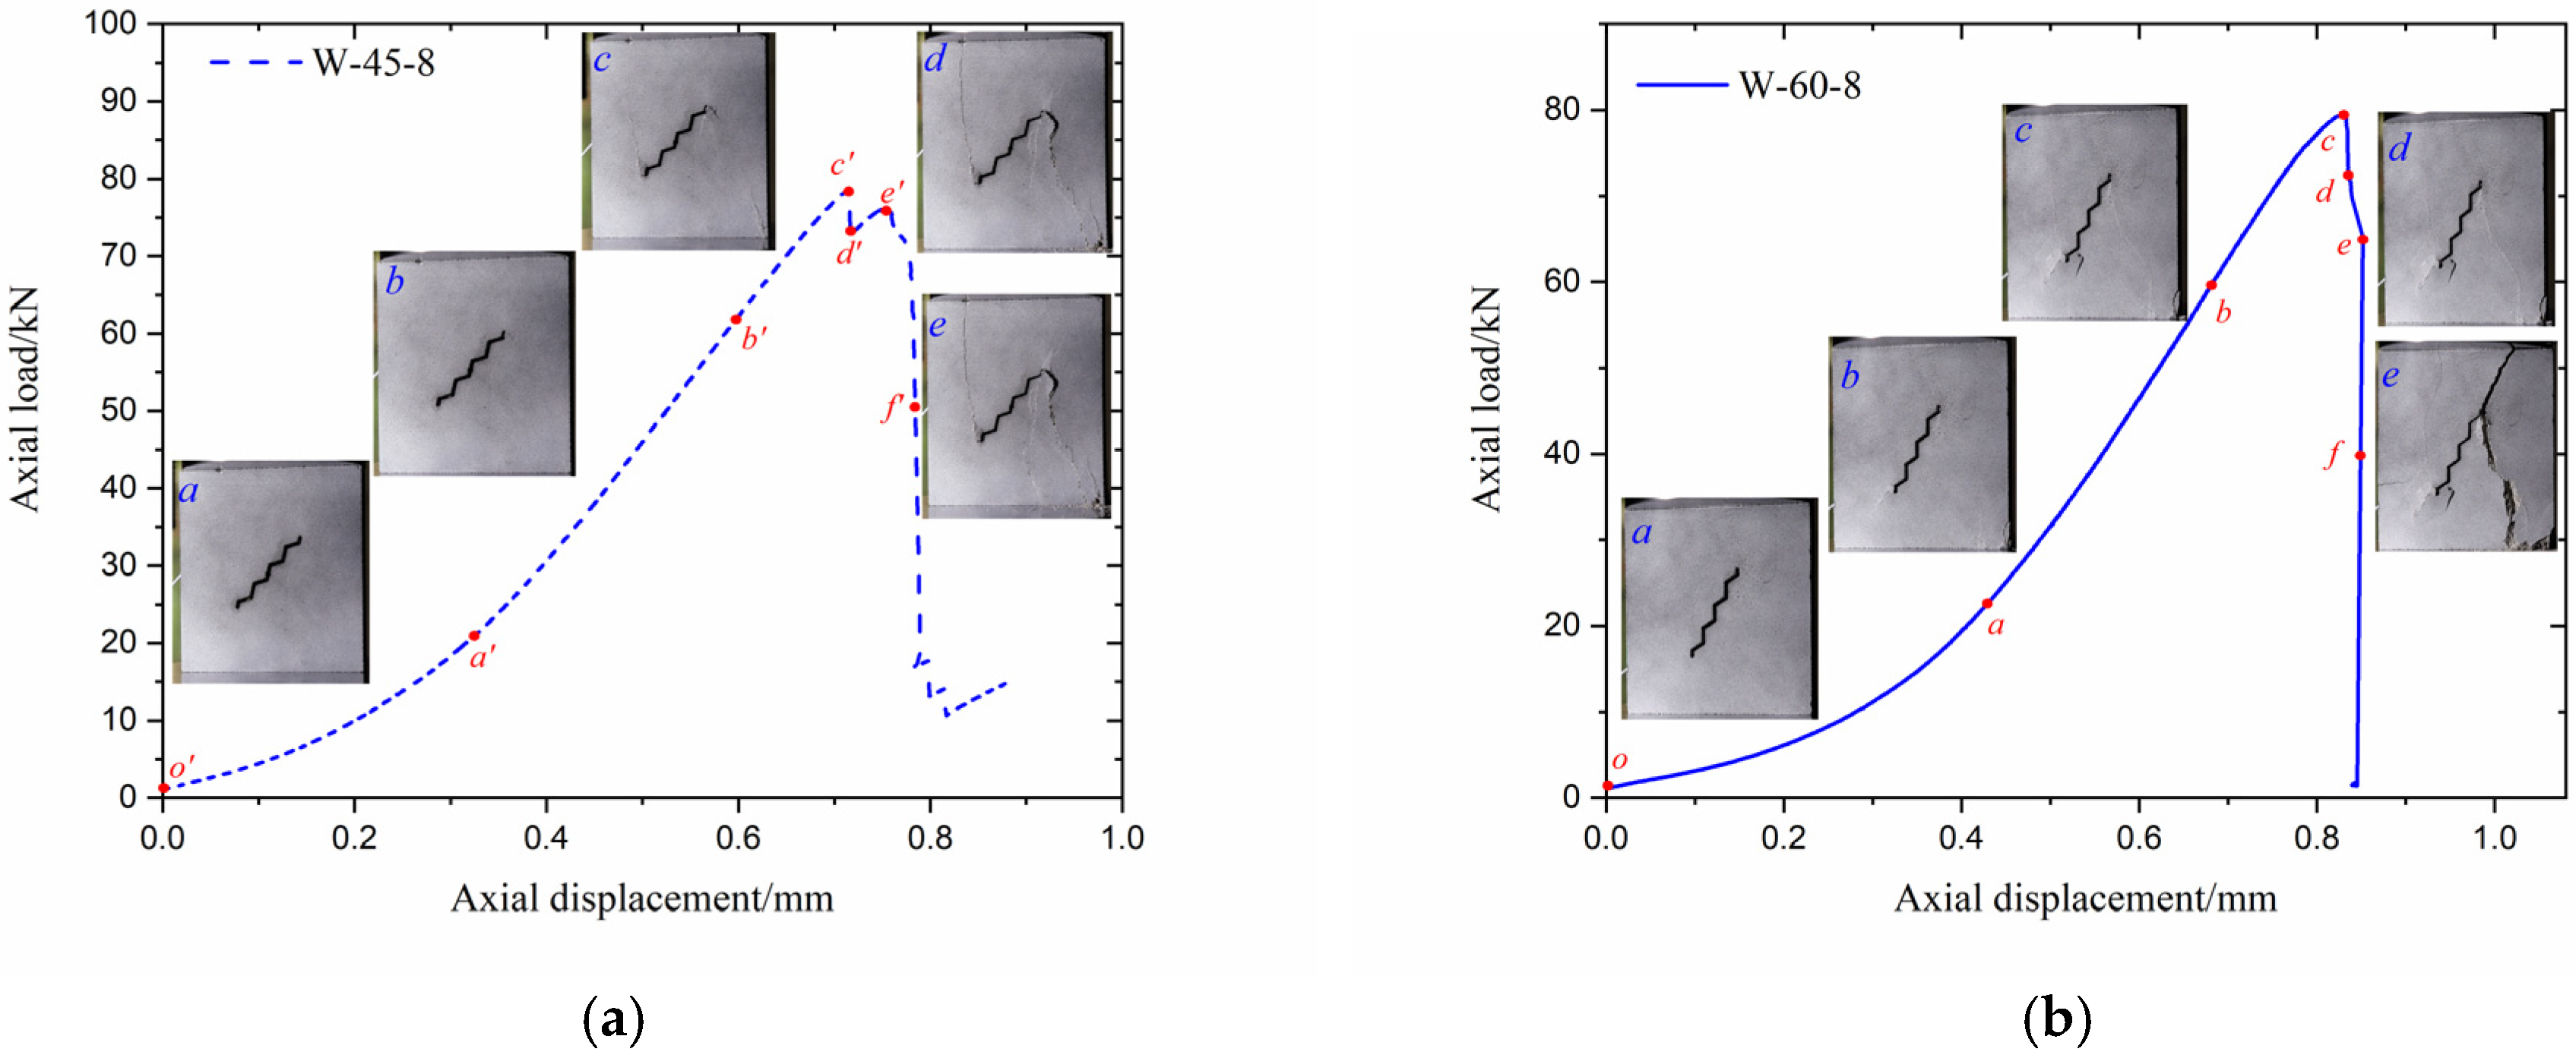
Figure 4 and Figure 5 show the axial load–displacement curves of the folded-crack specimens with different crack inclination angles (β) and the folded numbers (n) under both wetting and drying conditions. To classify the curve types more clearly, the following criteria were used: curves exhibiting more than one distinct peak with significant load drop (>5% of peak load) between successive peaks were defined as multimodal types; curves with only a single dominant peak before final failure were classified as single-peak types. These classifications were determined based on the smoothed axial load–displacement curves and visual inspection of the inflection points. Based on the curve shape and corresponding failure behavior, two distinct response types were identified: a single-peak type (solid lines in Figure 4 and Figure 5) and a multimodal type (dashed lines in Figure 4 and Figure 5). As a representative of the multimodal type, the specimen W-45-8 (β = 45°, n = 8) exhibited multiple load drops, indicating progressive damage accumulation and delayed failure. In contrast, the specimen W-60-8 (β = 60°, n = 8) exhibited a sharp single peak, followed by a rapid load drop, characteristic of the single-peak failure pattern, as illustrated in Figure 6.
As shown in Figure 6, similar to the responses of intact and straight-cracked rock specimens [31], the load–displacement curve of multimodal type can be divided into five stages: the compression stage (no new cracks are generated, i.e., oa’), the elastic stage (initiation of new cracks, i.e., ab’), the plastic deformation stage (cracks propagate and begin to coalesce, i.e., bc’), the brittle drop stage (secondary cracks propagate rapidly, i.e., cd’), and the residual stress stage (the folded flaws are fully damaged, i.e., df’). In contrast, the load–displacement curve of the single-peak type typically comprises four stages: the compression stage (no new crack generation, i.e., oa), the elastic stage (initiation of new cracks, i.e., ab), the plastic deformation stage (crack propagation and limited coalescence, i.e., bc), and the failure stage (rapid crack propagation and full coalescence result in specimen failure, i.e., cf). The key distinction lies in the absence of the brittle drop and residual stages in the single-peak type, indicating a more abrupt and localized failure mechanism.
Table 3 summarizes the types of axial load–displacement curves for specimens with different crack inclination angles (β) and crack folded numbers (n). No clear quantitative relationship could be established between the curve type and either β or n. However, a qualitative trend was observed: under the same β, multimodal curves occurred more frequently under wetting conditions than under drying conditions. This trend may be attributed to the influence of water on the deformation behavior of sandstone. Specifically, the presence of water is known to reduce intergranular cohesion and increase ductility, thereby promoting a transition in mechanical response from brittle to ductile. As a result, crack propagation tends to be more gradual and segmented, leading to the emergence of multimodal load–displacement curves.

3.1.2. Peak Strength Evolution

(1)
Peak strength under wetting condition
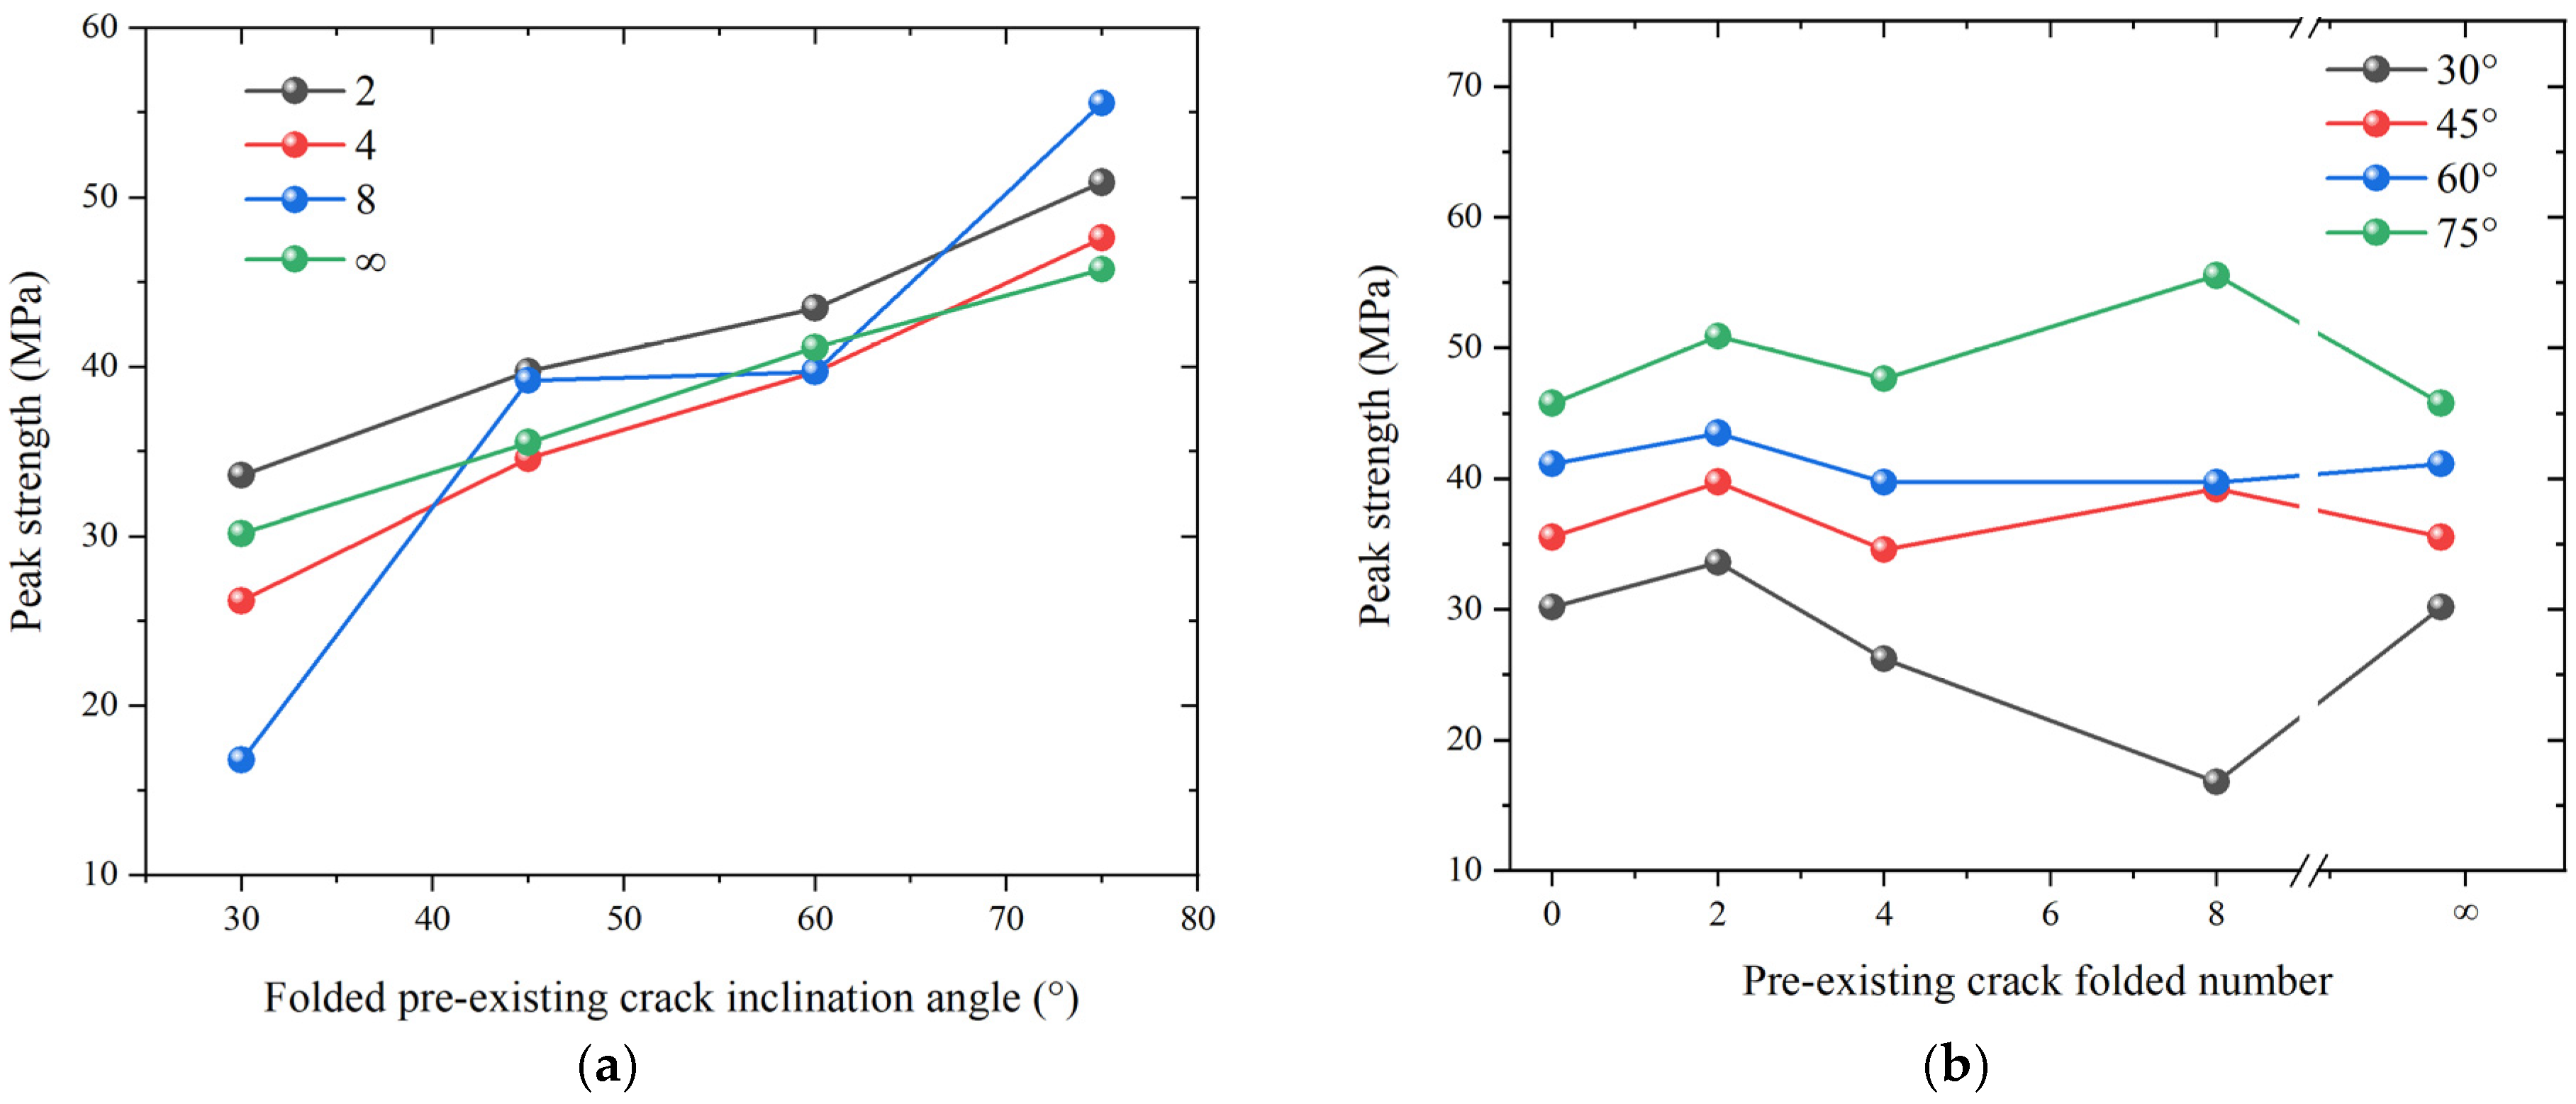
Figure 7 shows the peak strengths at different folded-crack inclination angles (β) and crack folded numbers (n) under wetting conditions. The peak strength almost increased with the increase in β since the decrease in the fault area along the loading direction caused the increase in loading capacity. In addition, the maximum peak strength was 1.59~3.44 times the minimum value for the same n with different β. However, the effect of n on the peak strength was not noticeable compared with that of β. The maximum peak strength was 1.09 (1.21 times the minimum value). When β = 30°, the peak strength first increased, and then decreased, and then increases again. When β > 30°, the peak strengths showed a fluctuating trend of first increasing and then decreasing, and then increasing and then decreasing again.
(2)
Peak strength under drying condition
Figure 8 shows the peak strengths of folded-crack specimens with different folded-crack inclination angles (β) and crack folded numbers (n) under drying conditions. Similar to the results under wetting conditions, the peak strength generally increases with increasing β. This can be attributed to the reduction in fault area along the loading direction, resulting in a higher load-bearing capacity. A notable difference is that the change amplitudes of peak strength under drying conditions are consistently greater than those under wetting conditions. For example, when n = 2, 4, 8, and ∞, the change amplitudes under drying conditions are 29.85 MPa, 25.65 MPa, 45.98 MPa, and 38.32 MPa, respectively, compared with only 17.3 MPa, 21.41 MPa, 38.76 MPa, and 15.58 MPa under wetting conditions.
Similar to the wetting scenario, the influence of folded number n on peak strength is less pronounced than that of inclination angle β. At β = 75°, peak strength first decreases, and then increases, and then decreases again as n increases, reaching a minimum at n = 4. At β = 60°, peak strength exhibits a fluctuating pattern (increase–decrease–increase–decrease), also reaching its lowest value at n = 4. When β < 45°, the peak strength tends to increase initially and then decrease with increasing n, with the highest strength observed at n = 4. However, the overall magnitude of variation remains limited. Moreover, the variation in peak strength across different β values is more pronounced under drying conditions. For example, when β = 30°, 45°, 60°, and 75°, the change amplitudes under drying conditions are 7.99 MPa, 11.14 MPa, 10.05 MPa, and 15.83 MPa, respectively, whereas the corresponding values under wetting conditions are 16.80 MPa, 5.17 MPa, 3.76 MPa, and 9.79 MPa. These results indicate that the effect of β on the peak strength of folded-crack specimens is more significant under dry conditions than under wetting conditions.
(3)
Comparison of peak strengths under dry and wet conditions
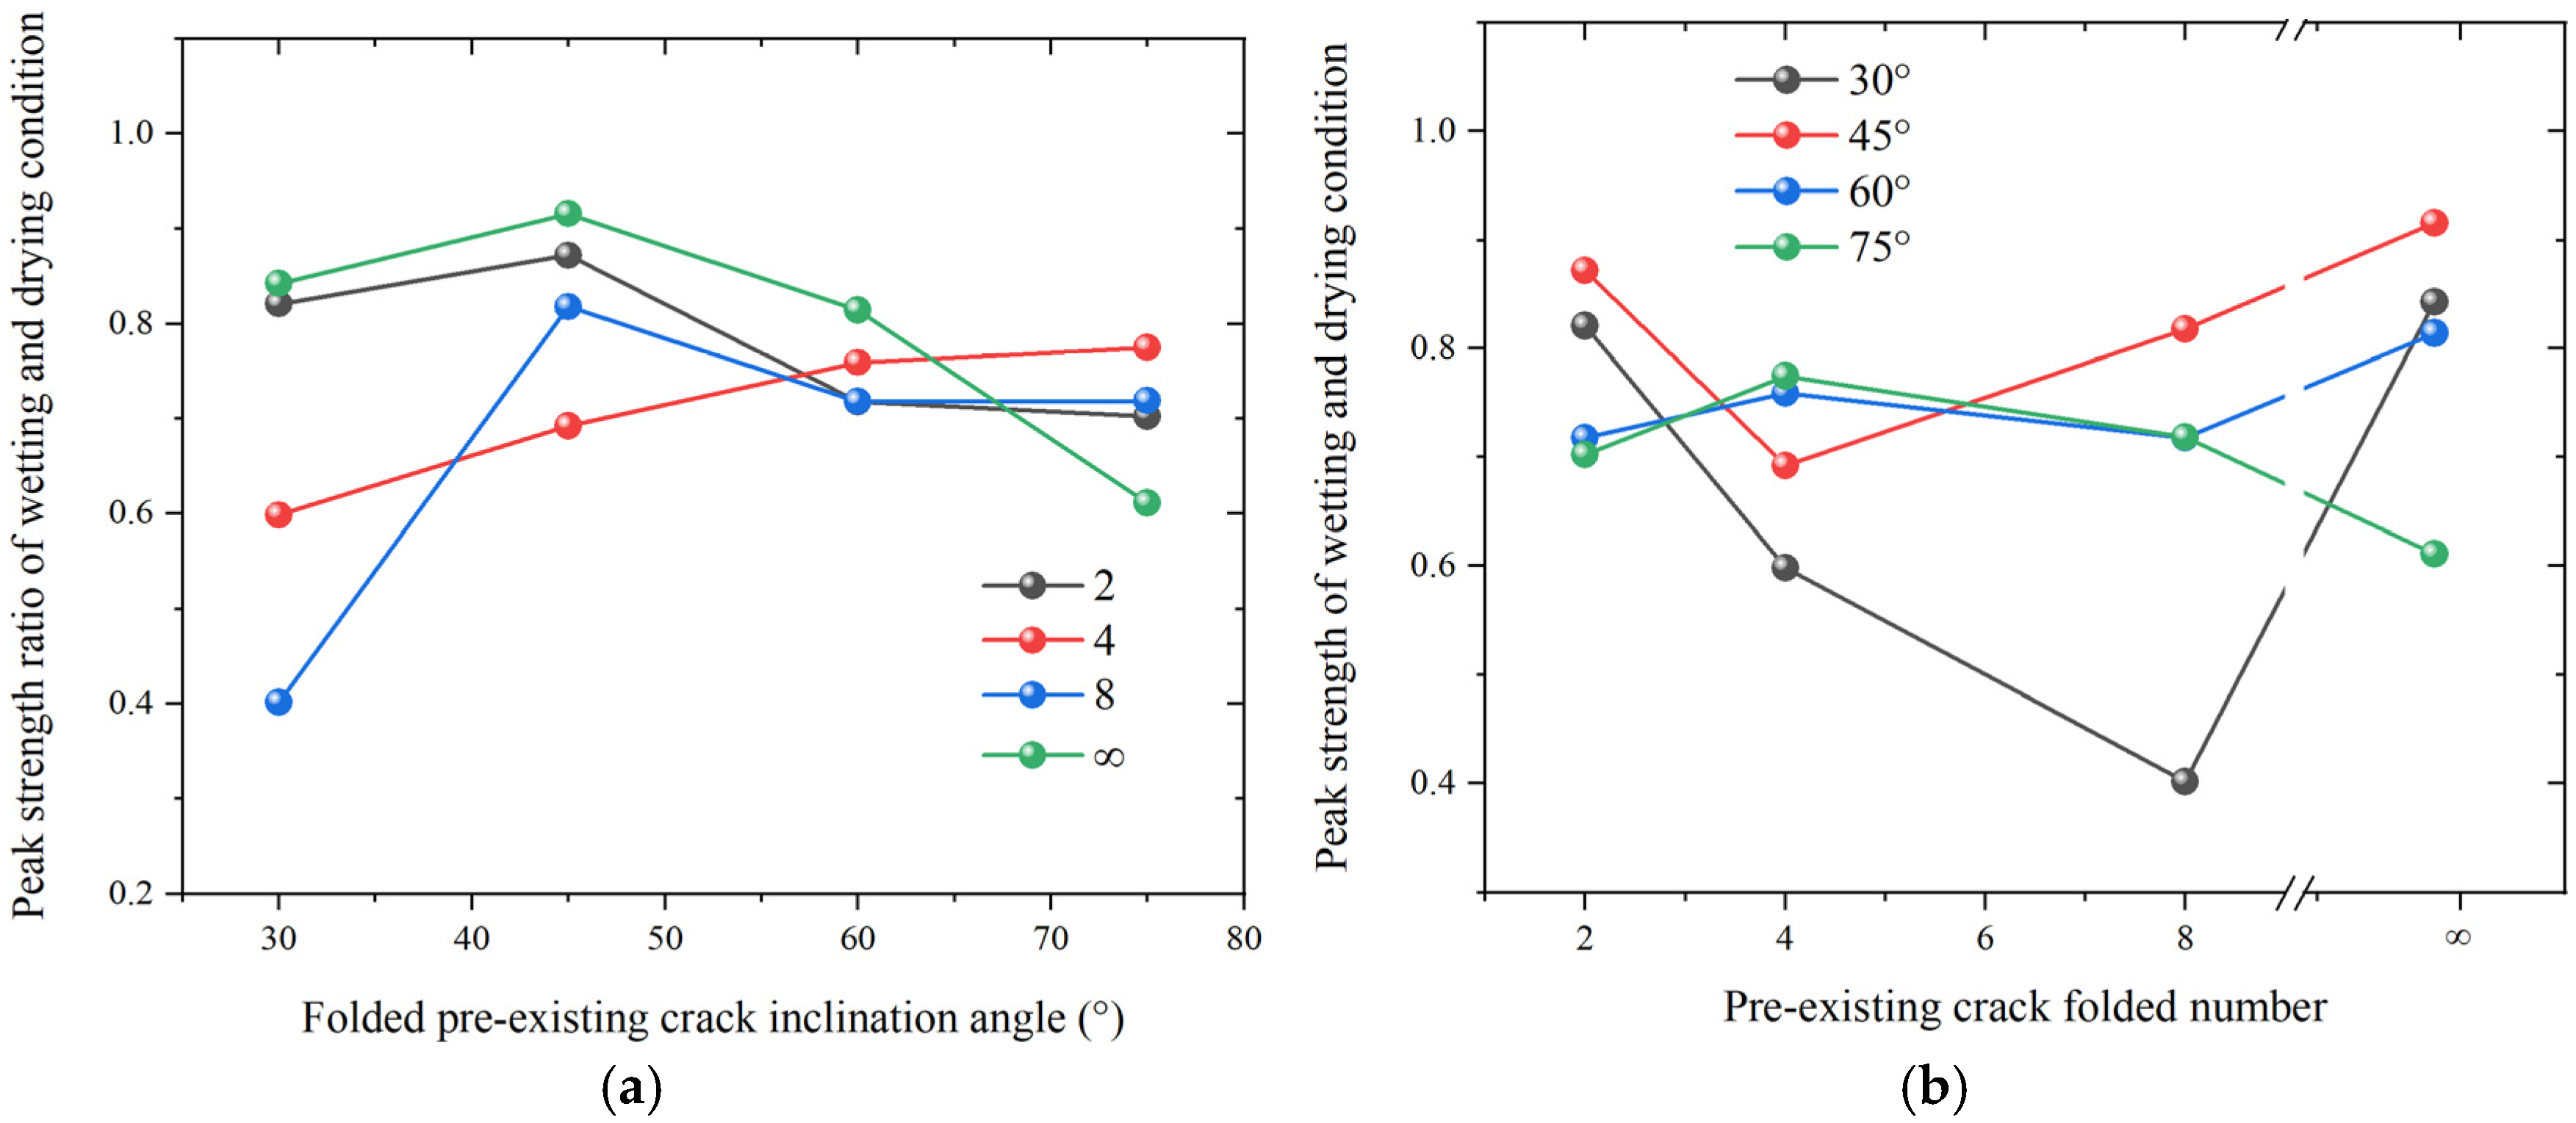
Figure 9 shows the ratio of peak strengths under wetting and drying conditions for different β and n. It can be observed that all strength ratios are less than 1, indicating that wetting conditions consistently reduce the peak strength of sandstone specimens with pre-existing folded cracks. This reduction in strength is likely due to the presence of water within the internal pores and fractures, which promotes hydrolysis of the cementing minerals (such as chlorite) between grains. As a result, the intergranular bonding is weakened, frictional resistance is reduced, and water acts as a lubricant. These effects facilitate relative displacement and slip between mineral particles, thereby promoting the propagation of cracks along grain boundaries and through existing flaws.

3.2. Acoustic Emission Characteristics

To study the rock fracture characteristics (such as stress distribution and crack rupture process), the b-value characteristics are analyzed as follows.
The b-value of AE originates from seismology and primarily represents the ratio of AE minor events to significant events. When the value of b is large, it indicates that small-scale microruptures are predominant. Conversely, the decrease in the b-value indicates a relative increase in the proportion of large-scale ruptures, indicating the imminent occurrence of a main rupture. The expression is shown in the following Equation (1):
lg N = a b M
where M is the earthquake magnitude, replacing it with the AE amplitude parameter (Adb/20). N is the number of AE events with magnitudes between M and (M + ΔM). The variables a and b are parameters, and parameter b can characterize the crack propagation scale of the rock.
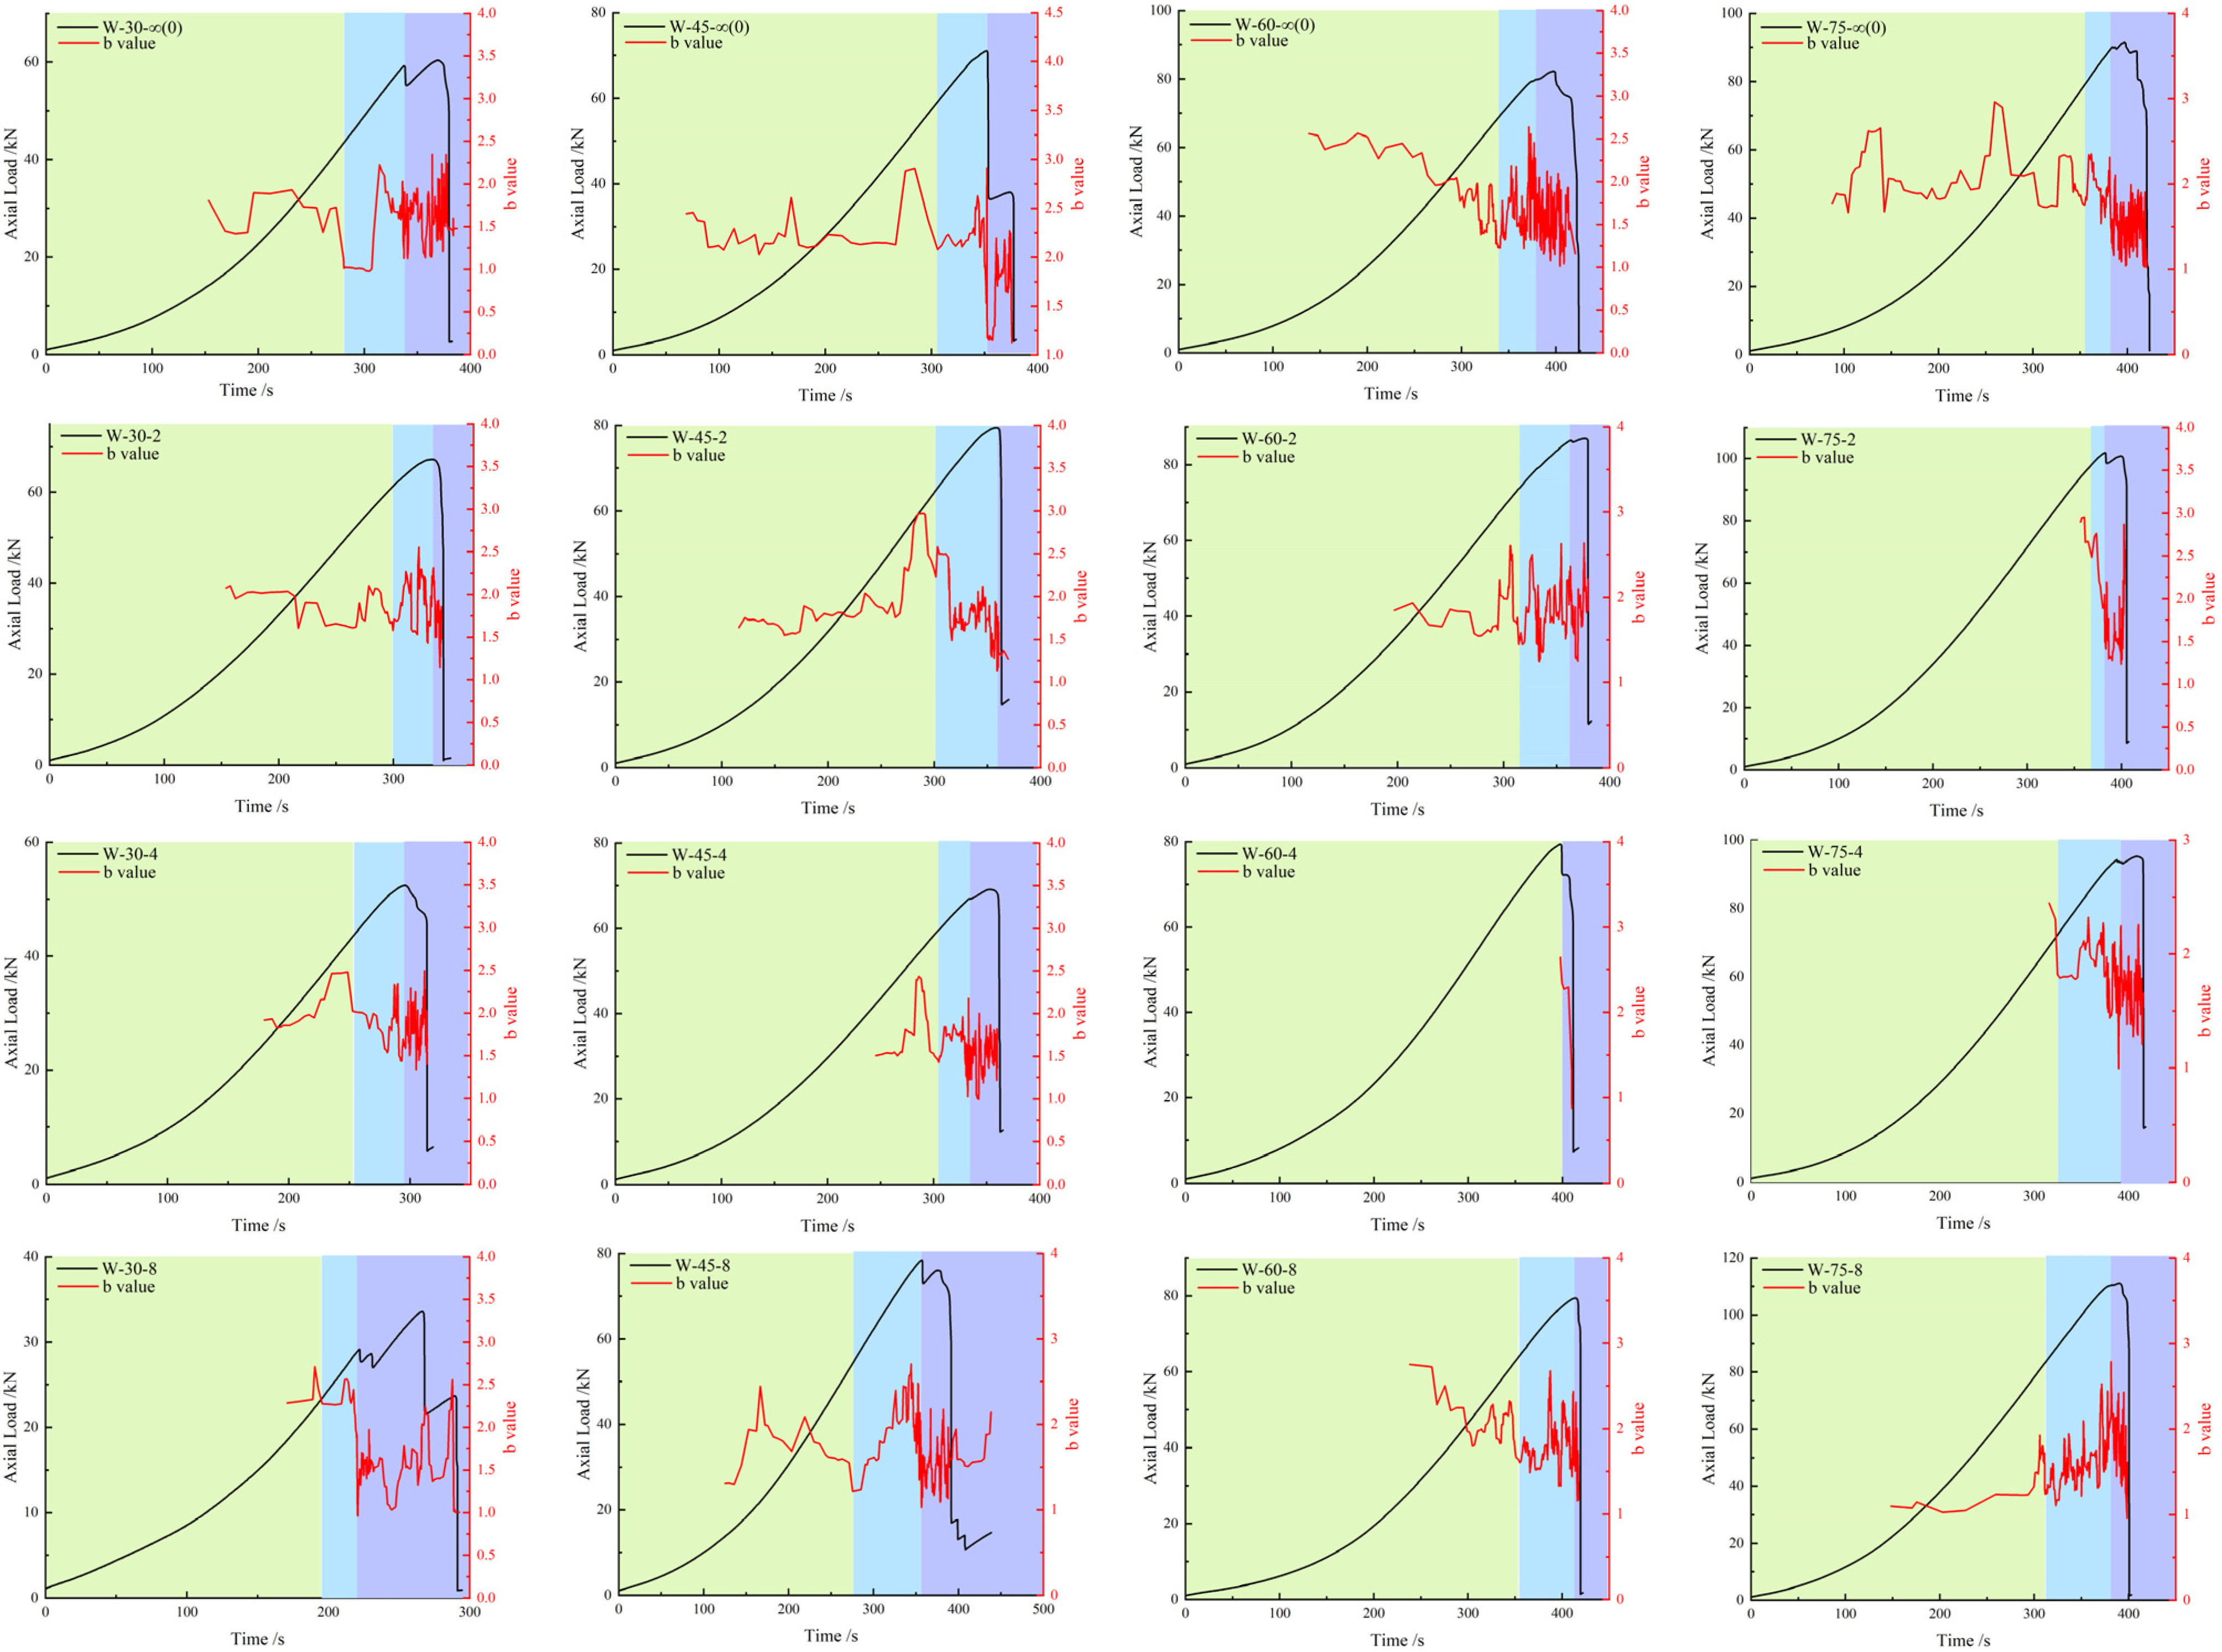
Figure 10 and Figure 11 illustrate the variation of the b-value for the folded-crack specimens under both wetting and drying conditions. During the initial compression stage, the b-value exhibits an increasing trend, indicating low crack activity. As stress accumulates, the b-value begins to fluctuate within a narrow range and then drops significantly at the onset of crack initiation. In the plastic deformation stage, the b-value remains within a relatively low range, suggesting intensive crack propagation and a gradual increase in fracture scale. During the failure stage, a sharp decline in the b-value is observed, as multiple microcracks coalesce into a dominant macroscopic fracture.
Although the overall fracture evolution under wetting and drying conditions follows a similar pattern, notable differences are observed in the b-value behavior. Specifically, under wetting conditions, the b-value is generally lower and exhibits larger fluctuations. This implies a higher proportion of large-scale fractures and fewer small-scale cracks under wet conditions. The presence of water reduces the bonding strength between mineral particles, facilitating easier crack growth. Consequently, once initiated, microcracks are more likely to expand rapidly and evolve into larger fractures, accelerating the failure process.

3.3. Crack Initiation and Coalescence Modes

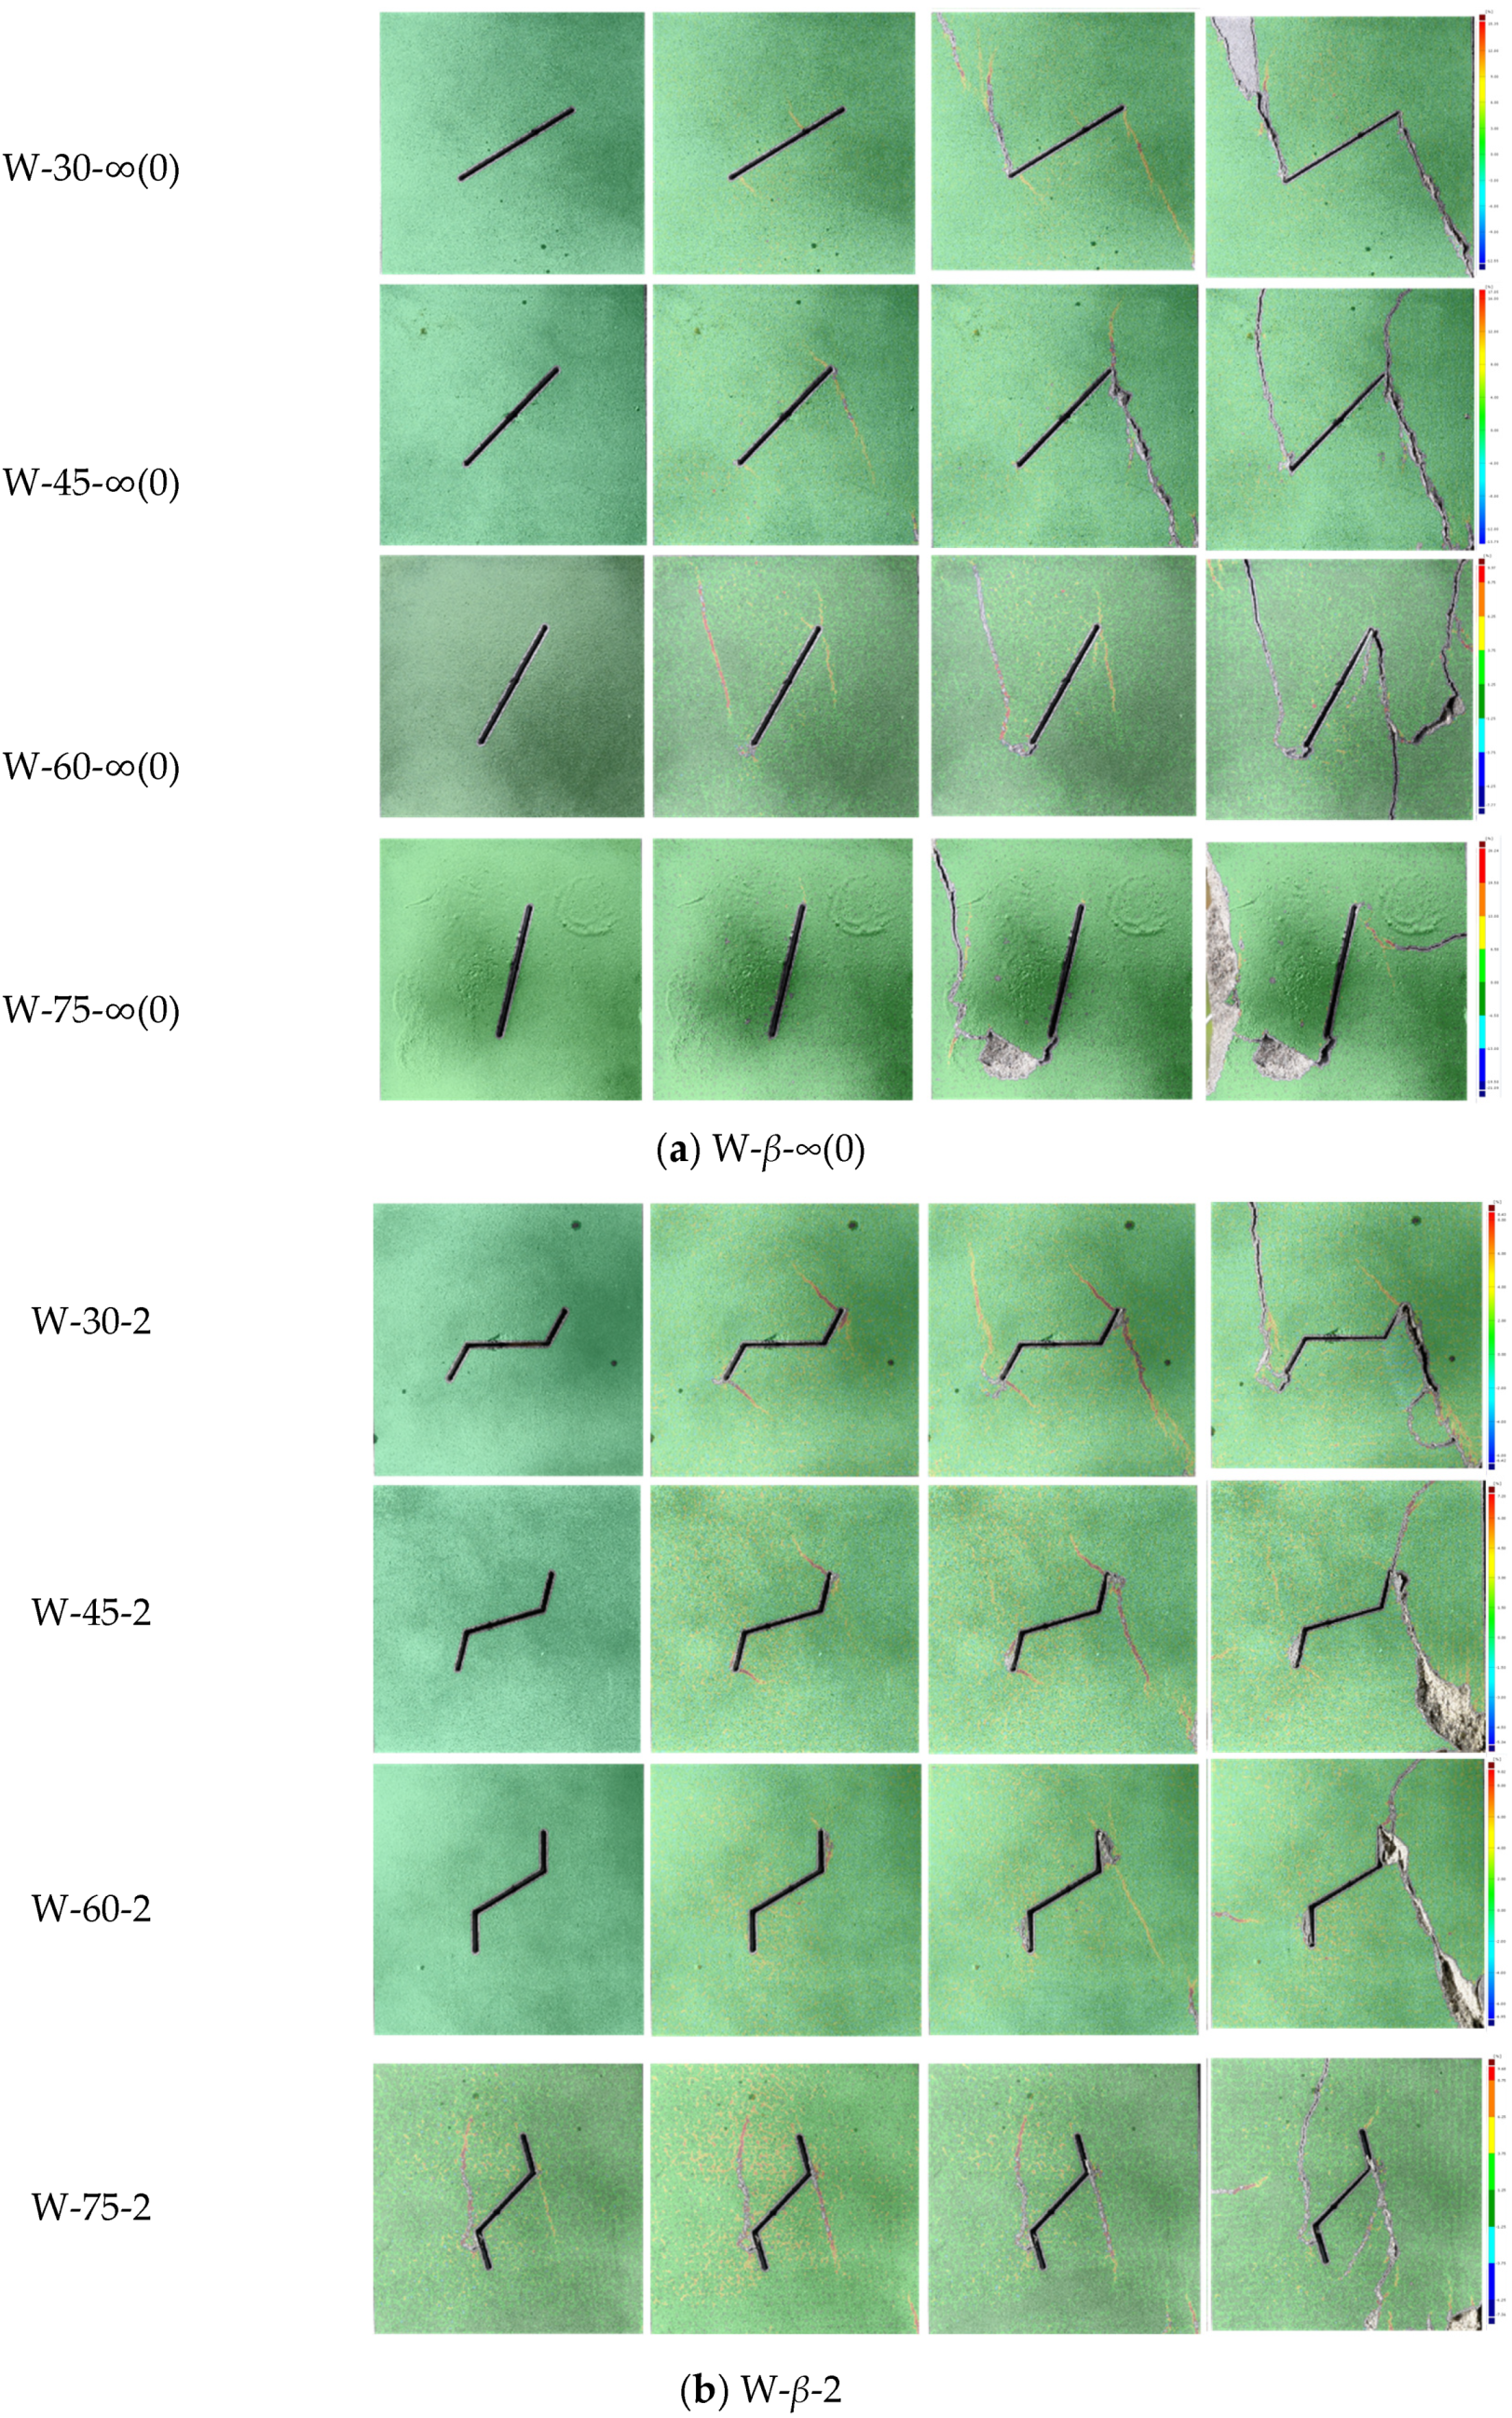
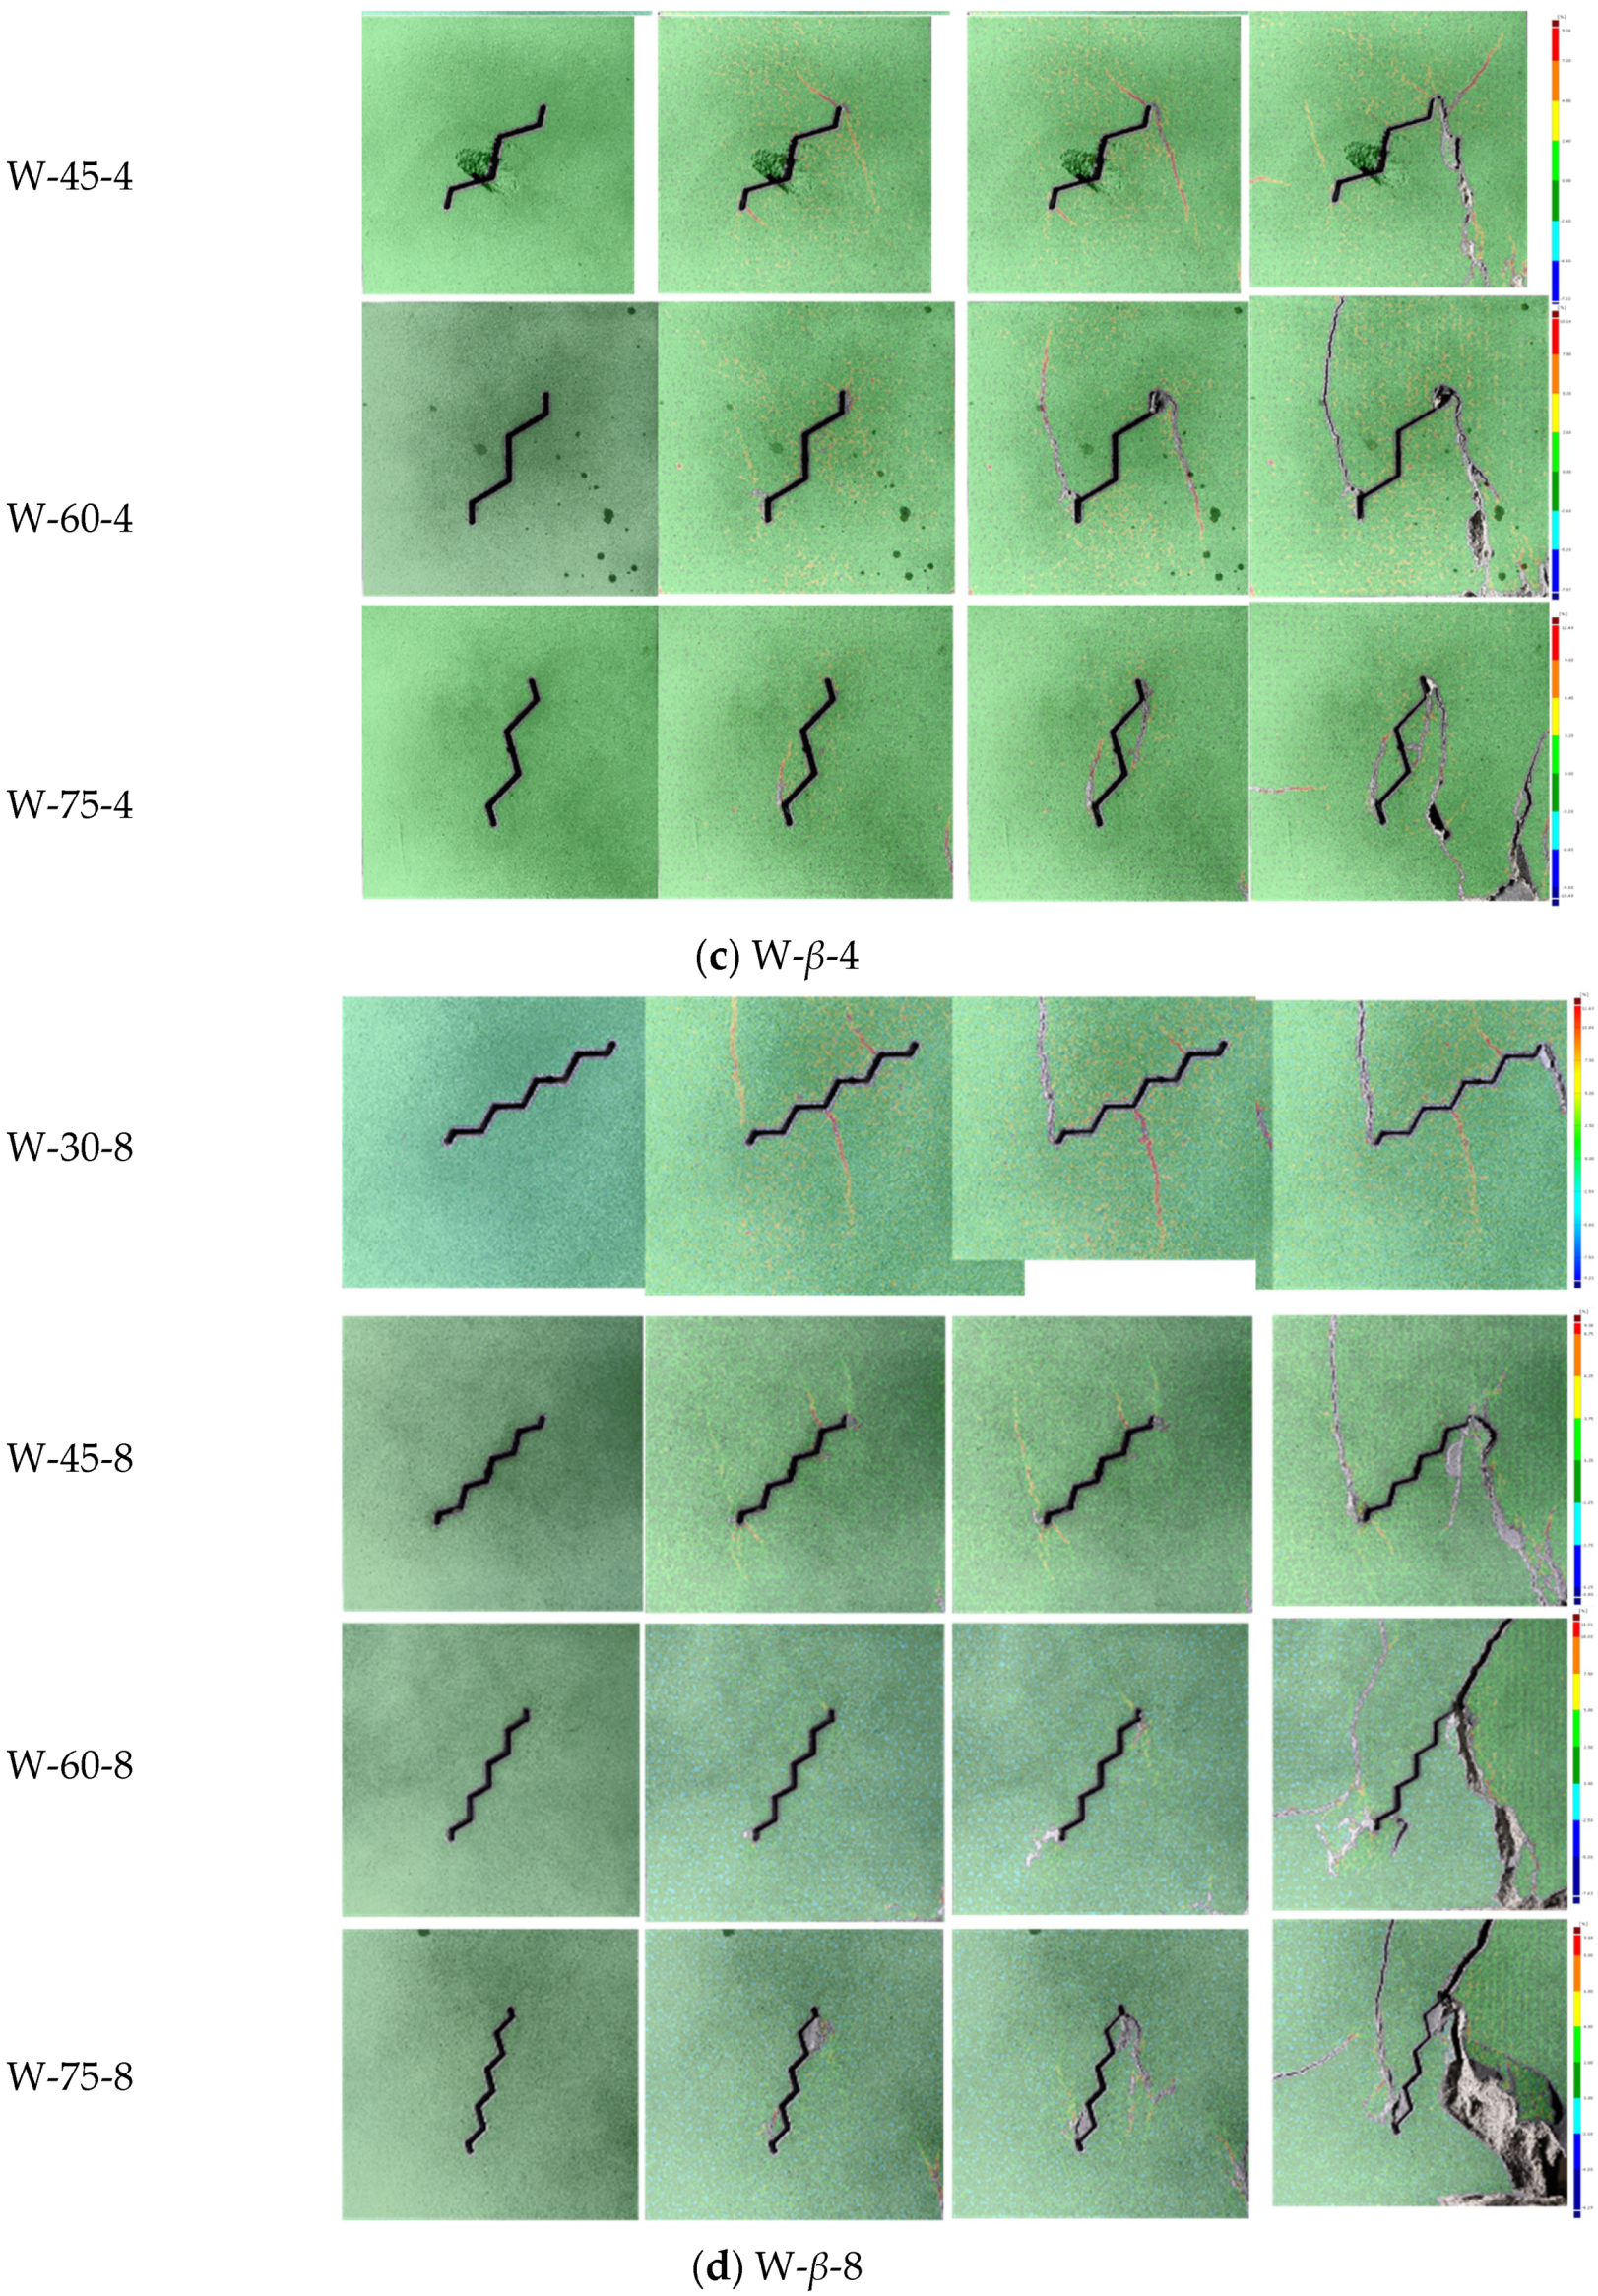
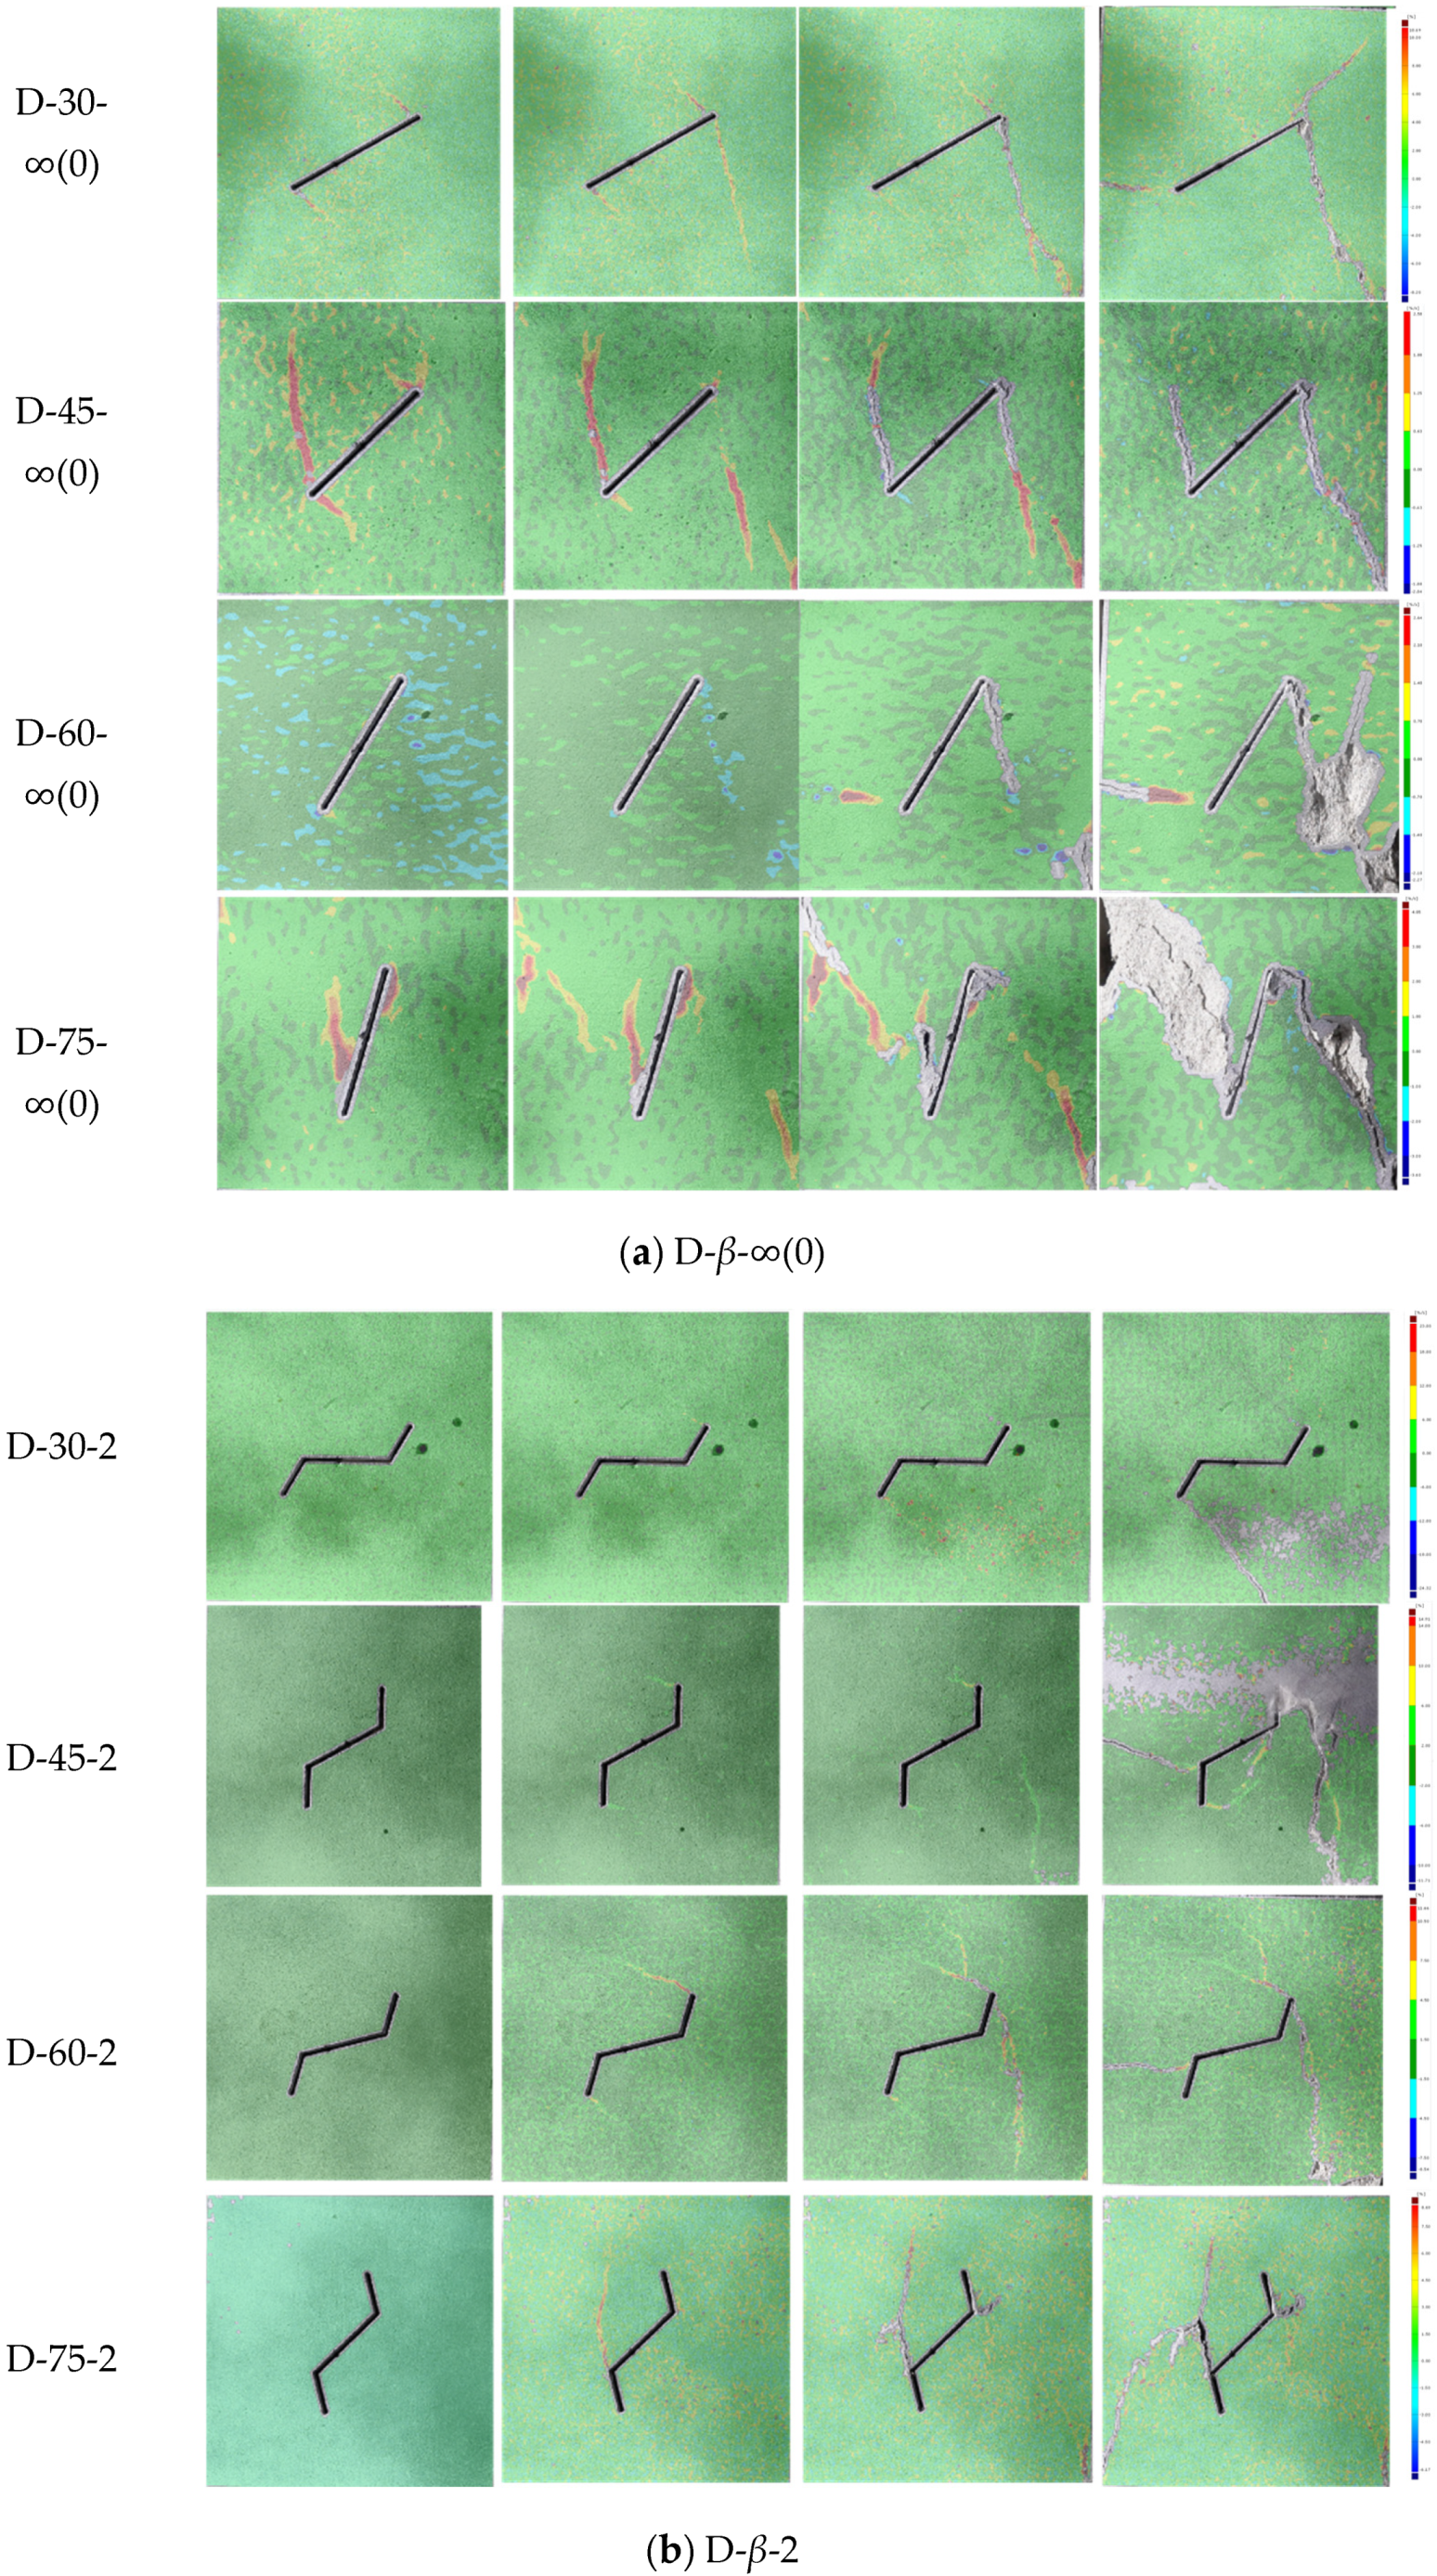
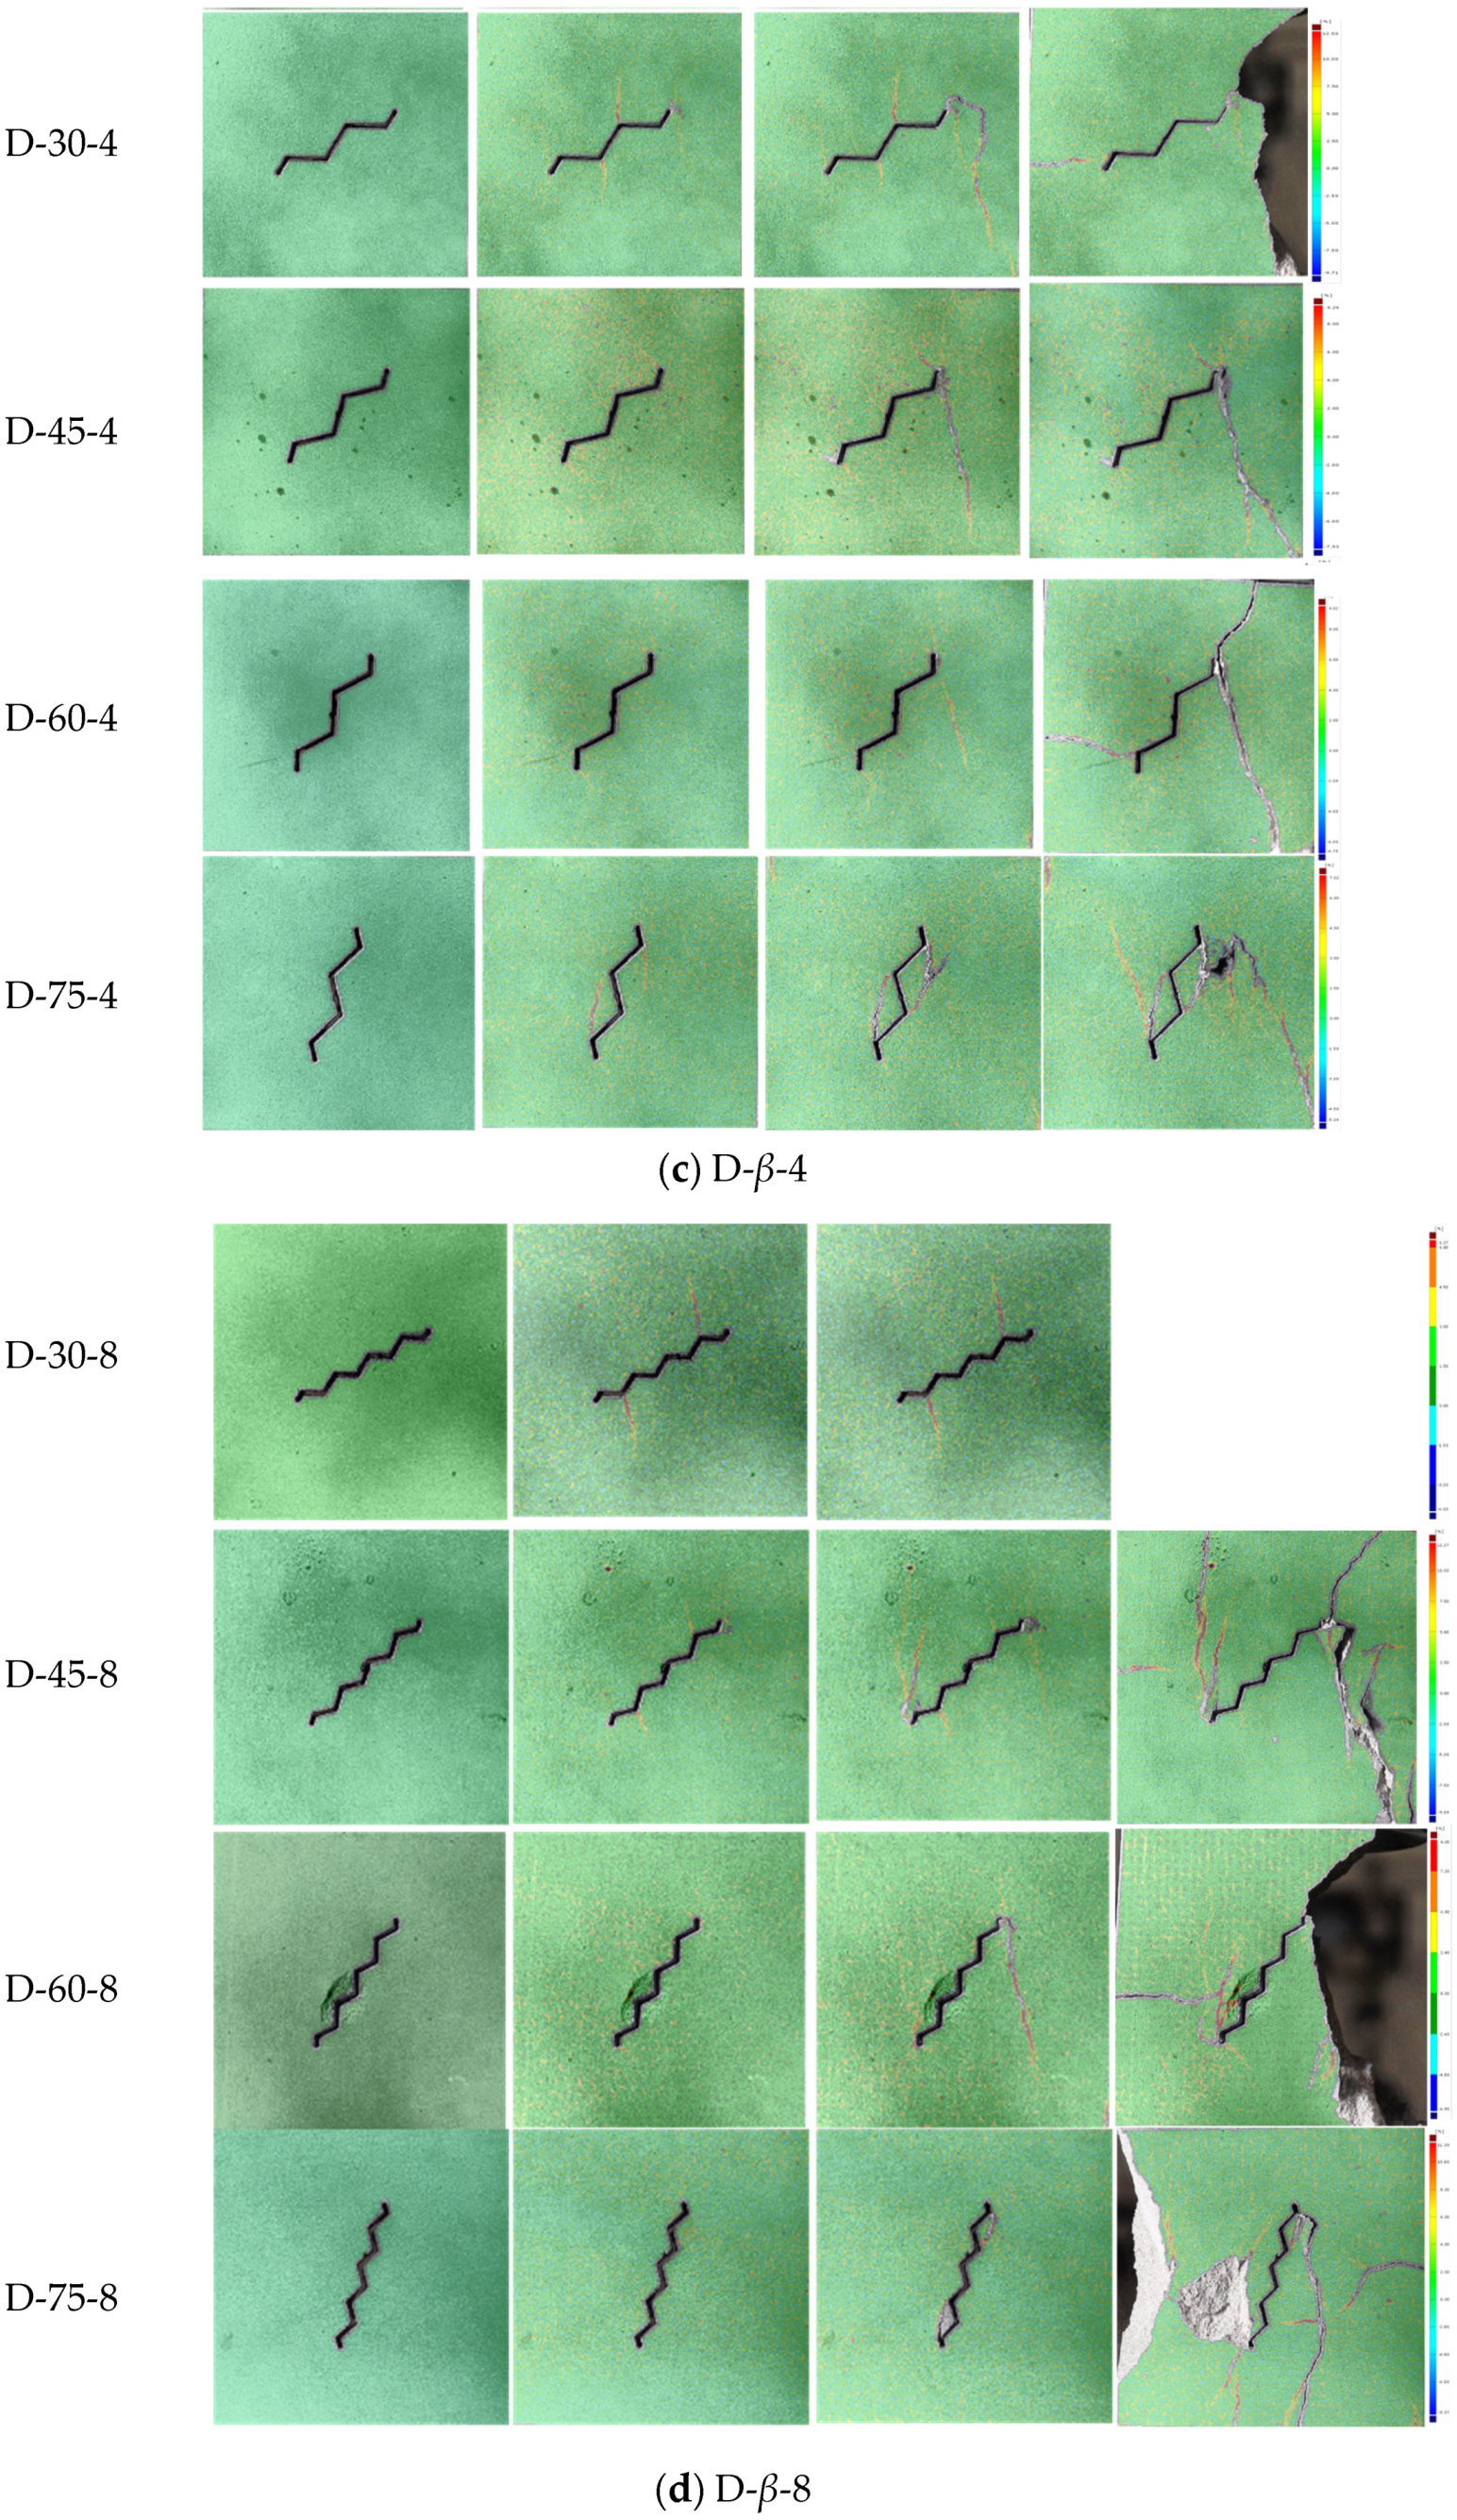
To intuitively study the deformation characteristics of the specimen, DIC technology is used to track the speckle pattern on the specimen’s surface and calculate the grayscale values of the speckle domain, thereby obtaining the deformation data of the specimen’s surface. Figure 12 and Figure 13 show the strain cloud maps in the yy direction of the folded-crack specimens with different crack inclination angles (β) and crack folded numbers (n) in wetting and drying conditions (positive values represent tensile strain, and negative values represent compressive strain). Four representative time points are selected during the test: the initial stage, the crack initiation stage, the crack propagation stage, and the crack failure stage. It is worth noting that W-30-4 only has the picture of the crack failure stage (Figure 12c), lacking pictures of the initial stage, crack initiation stage, and crack propagation stage, as the recording was interrupted due to equipment failure during the test. It is difficult to process the same batch of rocks for conducting additional tests.

3.3.1. Crack Initiation Mode

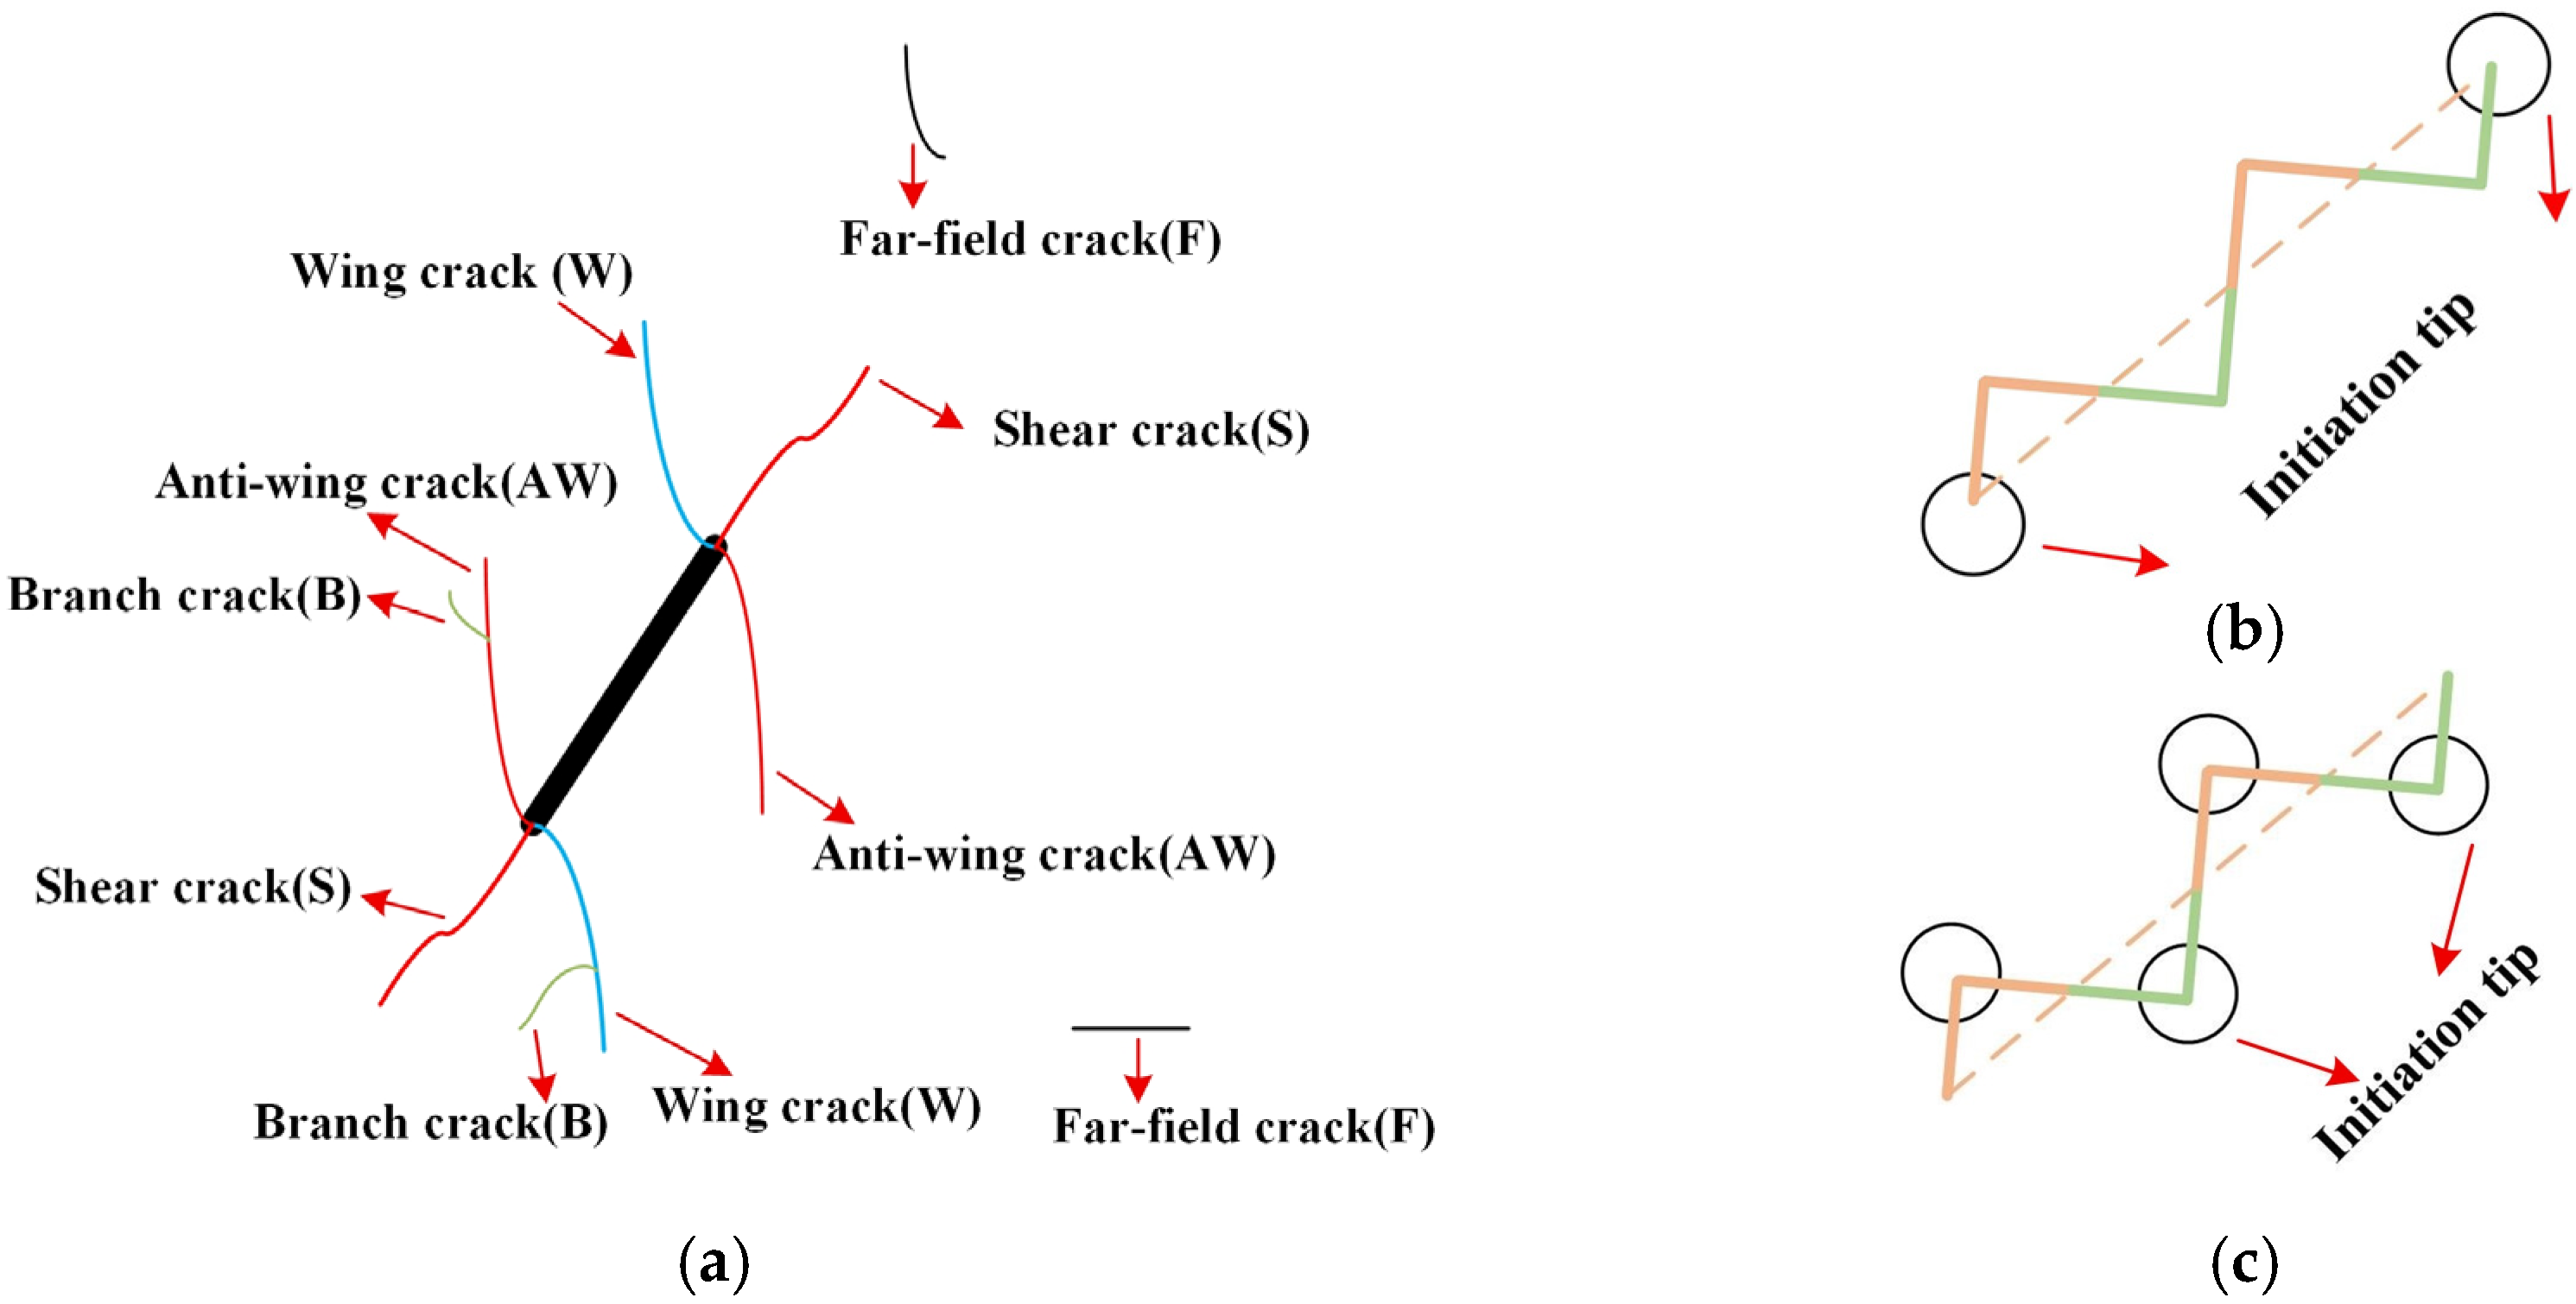
In sandstone specimens containing a folded crack, crack initiation, propagation, and coalescence modes were all observed from the upper and lower tips of the pre-existing crack (Figure 14), and they were dependent on the crack inclination angle (β) and the crack folded number (n). Therefore, in this section, a systematic evaluation of the crack initiation mode in sandstone specimens containing a folded crack is presented under a uniaxial compression test. The classification of crack initiation modes was based on two quantifiable criteria: (1) the geometric location of the first visible macrocrack on the DIC strain field (i.e., whether it occurs at crack tip or at tooth vertex) and (2) the orientation and curvature of the crack path, which were used to distinguish tensile (opening) from shear (sliding) cracks. A crack with its propagation angle greater than 60° from the loading axis was considered a tensile crack, while angles below 45° indicated shear crack initiation.
Figure 14 illustrates a sketch of initiated crack types for sandstone specimens. It can be seen that, for the rock specimen with a single straight crack, there are four types of crack initiation mechanisms. One can see that one of them (crack type wing crack (W), as shown by the blue line in Figure 14a) is tensile, two of them (crack type shear crack (S) and anti-wing crack (AW), as shown by the red line in Figure 14a) are shear crack, and one of them (crack type far crack (F), as shown by the black line in Figure 14a) is far-field crack.
However, for the rock specimen with the folded crack, there were six types of crack initiation mechanisms: Type TW, Type TAW, Type TS, Type VW, Type VAW, and Type VS, according to their crack initiation mechanism (tensile, shear, and far-field crack) and crack initiation position (crack tip and crack non-tip). In Type TW, the new cracks initiated at the crack tips (Figure 14b) in tension mode (crack type W in the straight crack) and symmetrically distributed on both sides of the folded crack; in Type TAW, the new cracks initiated at the crack tips (Figure 14b) in shear mode (crack type AW in the straight crack); in Type TS, the new cracks initiated at the crack tips in shear mode (crack type S in the straight crack); in Type VW, the new cracks initiated at the vertex of tooth shapes (Figure 14c) in tension mode (crack type W in the straight crack) and symmetrically distributed on both sides of the folded crack; in Type VAW, the new cracks initiated at the vertex of tooth shapes in shear mode (crack type AW in the straight crack); and in Type VS, the new cracks initiated at the vertex of tooth shapes in shear mode (crack type S in the straight crack).
Following the above three crack types for single straight crack and six crack types for the folded crack, one can analyze the crack initiation mode and cracking process of sandstone specimens containing the folded crack for the uniaxial compression test under wetting conditions and drying conditions (Figure 15) by the strain cloud maps in the yy direction by DIC technology and the video recording during the experiment process.
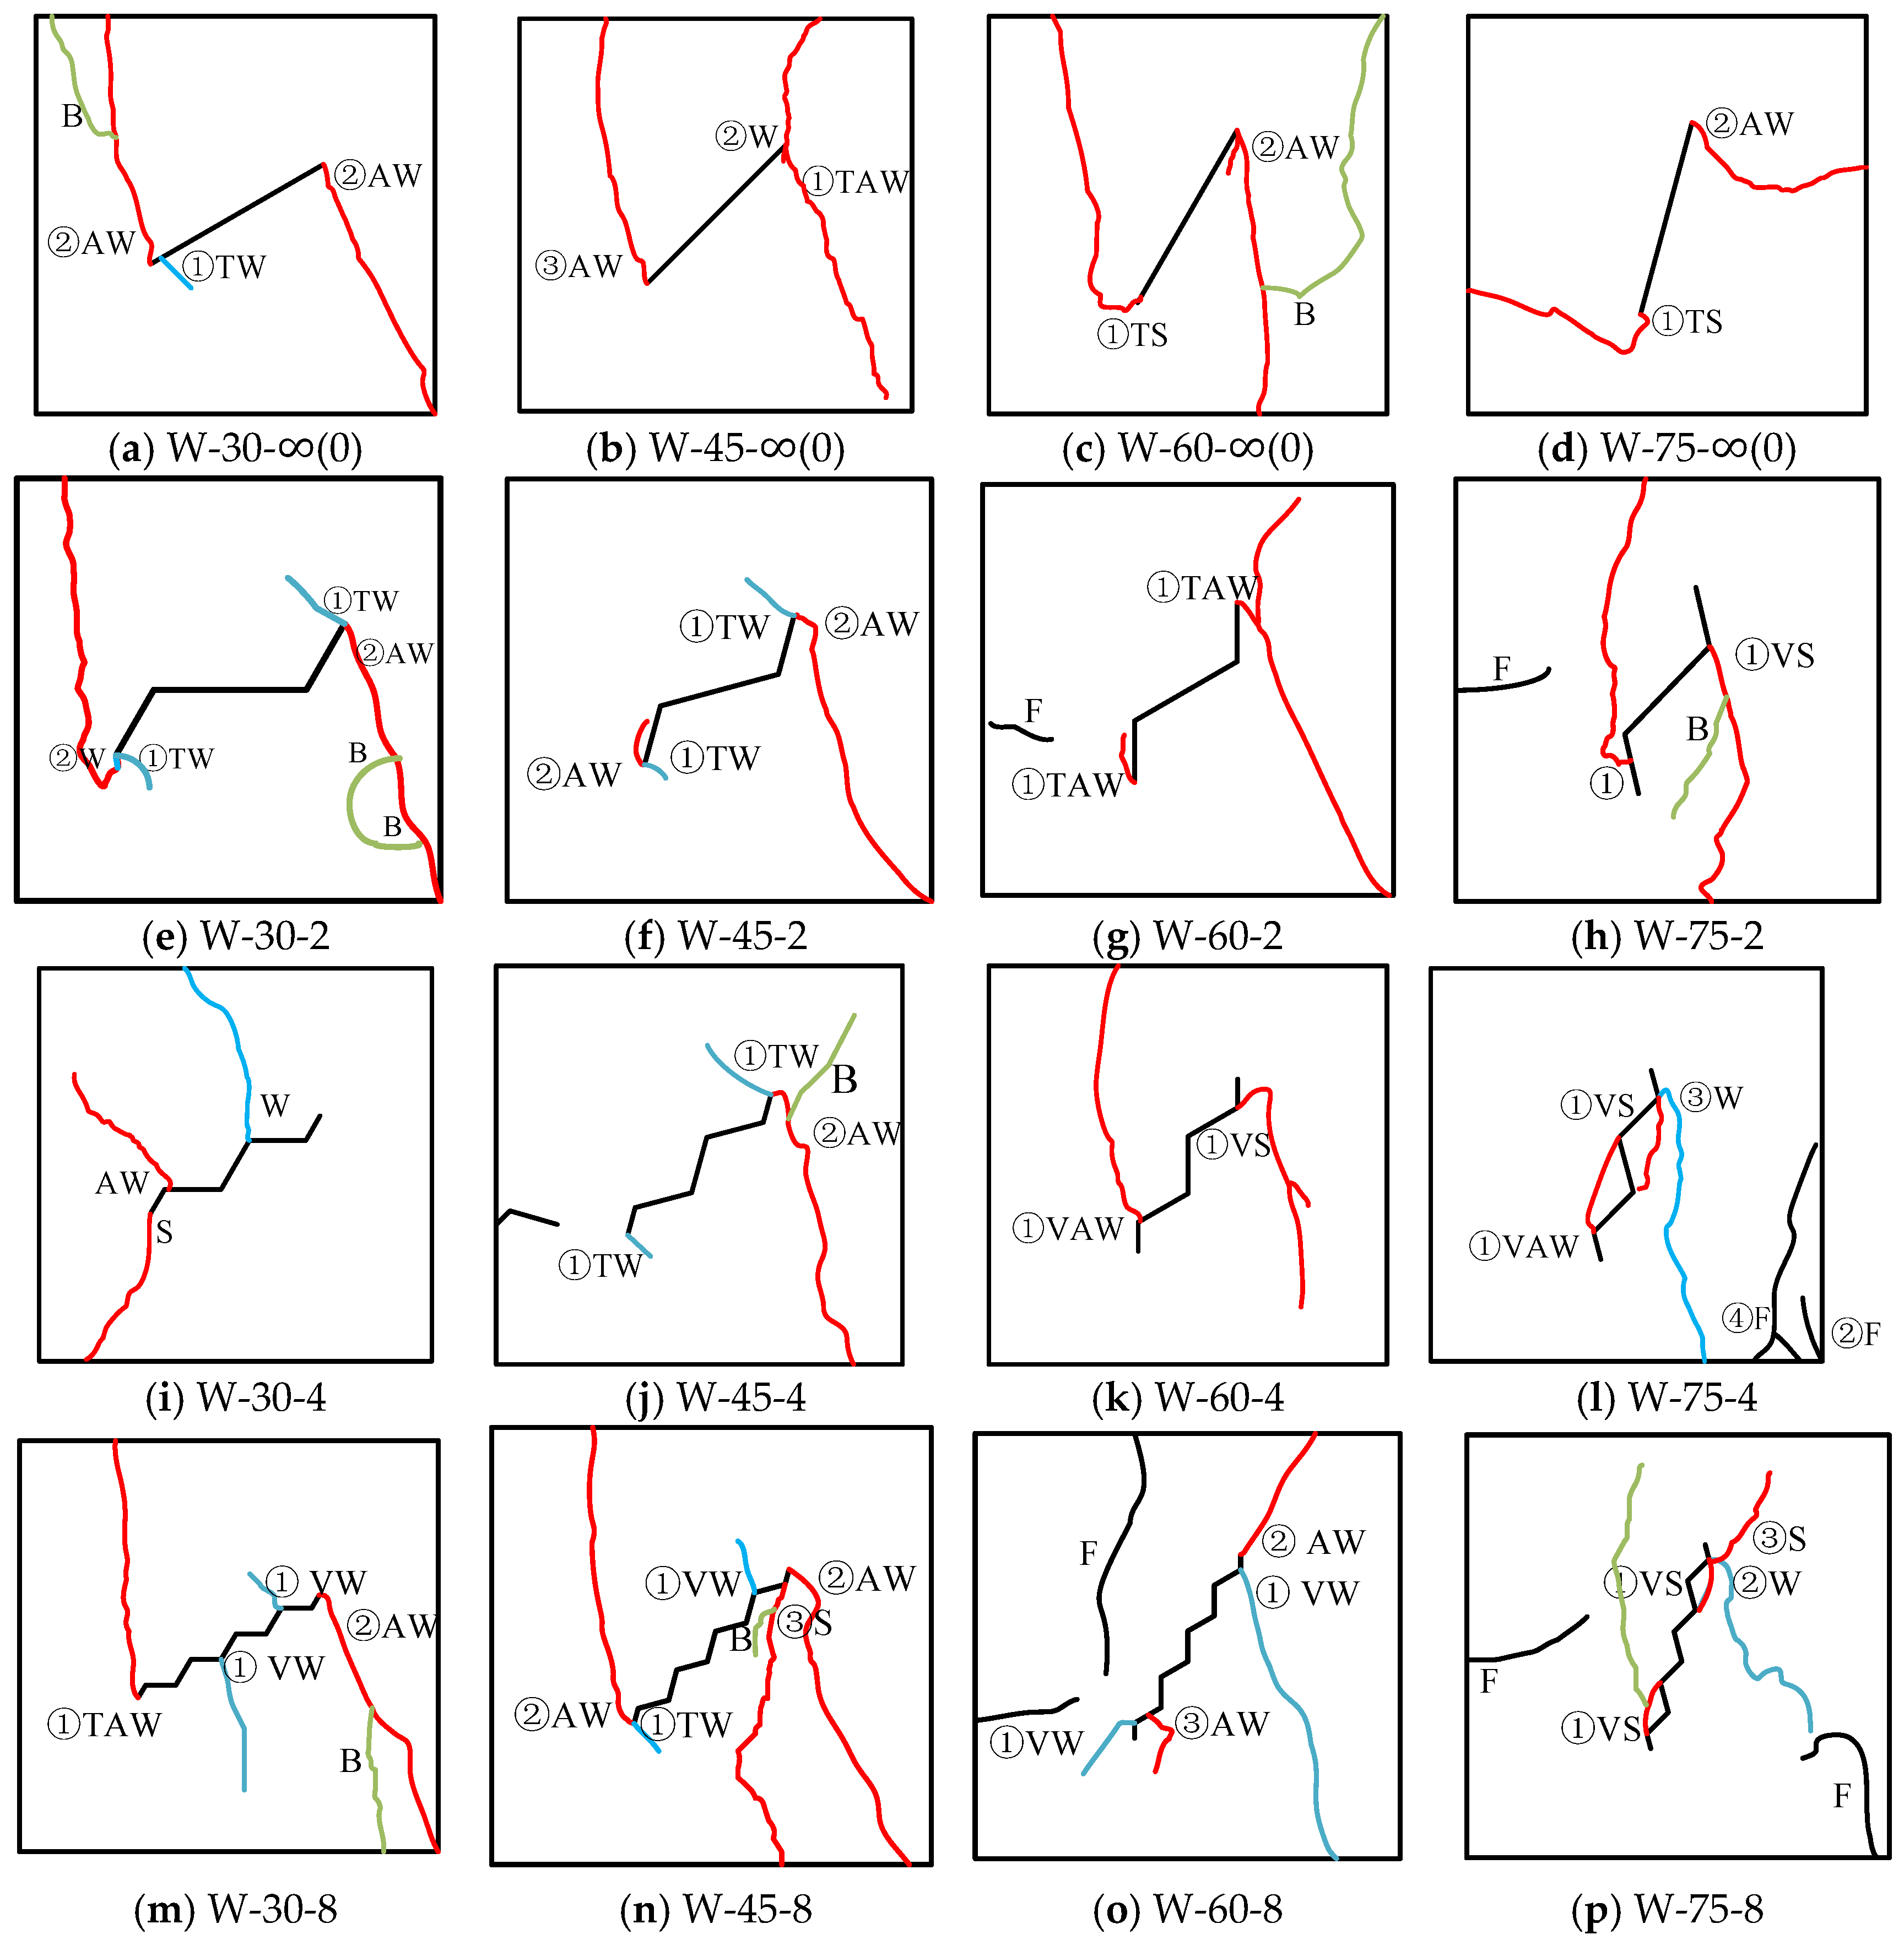
Figure 15 shows the crack trajectories during fracture for the folded-crack rock specimen with different crack inclination angles β and crack folded numbers n in the uniaxial compression test under wetting conditions. For n = 0, when β is increased, the number of new cracks is decreased from three (Figure 15a–c) to two (Figure 15d). Concerning the initiation characteristics of the folded-crack rock specimen with different crack inclination angles β and the same n (n = 0, i.e., straight crack), there exist three initiation patterns: TW, TAW, and TS. With the increase in β, the crack initiation mode changes from TW (Figure 15a) into TAW (Figure 15b,c) and TS (Figure 15d).
For n = 2, when β is increased, the number of new cracks is decreased from four (Figure 15e,f) to two (Figure 15g,h). Concerning the initiation characteristics of the folded-crack rock specimen with different crack inclination angles β and the same n = 2, there exist three initiation patterns: TW, TAW, and VS. With the increase in β, the crack initiation mode changes from TW (Figure 15e,f) to TAW (Figure 15g) and VS (Figure 15h).
For n = 4, when β is increased, the number of new cracks is first decreased from three (Figure 15i,j) to two (Figure 15k) and then increased to three (Figure 15l). Concerning the initiation characteristics of the folded-crack rock specimen with different crack inclination angles β and the same n = 4, there exist two initiation patterns: TW and both VAW and VS. With the increase in β, the crack initiation mode changes from TW (Figure 15j) to both VAW and VS (Figure 15k,l).
For n = 8, when β is increased, the number of new cracks is first increased from four (Figure 15m) to five (Figure 15n) and then increased to four (Figure 15o,p). Concerning the initiation characteristics of the folded-crack rock specimen with different crack inclination angles β and the same n = 8, there exist four initiation patterns: both VW and TAW, both VW and TW, VW, and VS. With the increase in β, the crack initiation mode changes from both VW and TAW (Figure 15m) and both VW and TW (Figure 15n) to VW (Figure 15o) and VS (Figure 15p).
It should be noted that with the increase in β, the initiation point changes from the crack tips to the vertex of tooth shapes and the initiation mode changes from tensile mode to shear mode for the folded-crack rock specimen. This is because as β increases, the component of the applied force acting longitudinally to the crack walls increases, leading to enhanced stress concentration at the crack tips and folded vertices. When the folded-crack inclination angle exceeds 60°, the ends of the folded crack close to 90° are subjected to bidirectional shear forces parallel to the crack surface under compressive loads, making it more prone to shear cracking (e.g., AW and TAW types) with significant strain concentration. In contrast, for smaller β, the applied force acts more transversally to the crack, resulting in lower stress concentration and a predominance of tensile cracking (e.g., TW type). With the increase in n, the initiation points change from the crack tips to the vertex of the tooth shape for the folded-crack rock specimen. This is because the more n, the greater the strain concentration at the folded point than at both crack tips, and the increase in n disperses the stress gradient, enhancing resistance to crack propagation by complicating the crack growth path.
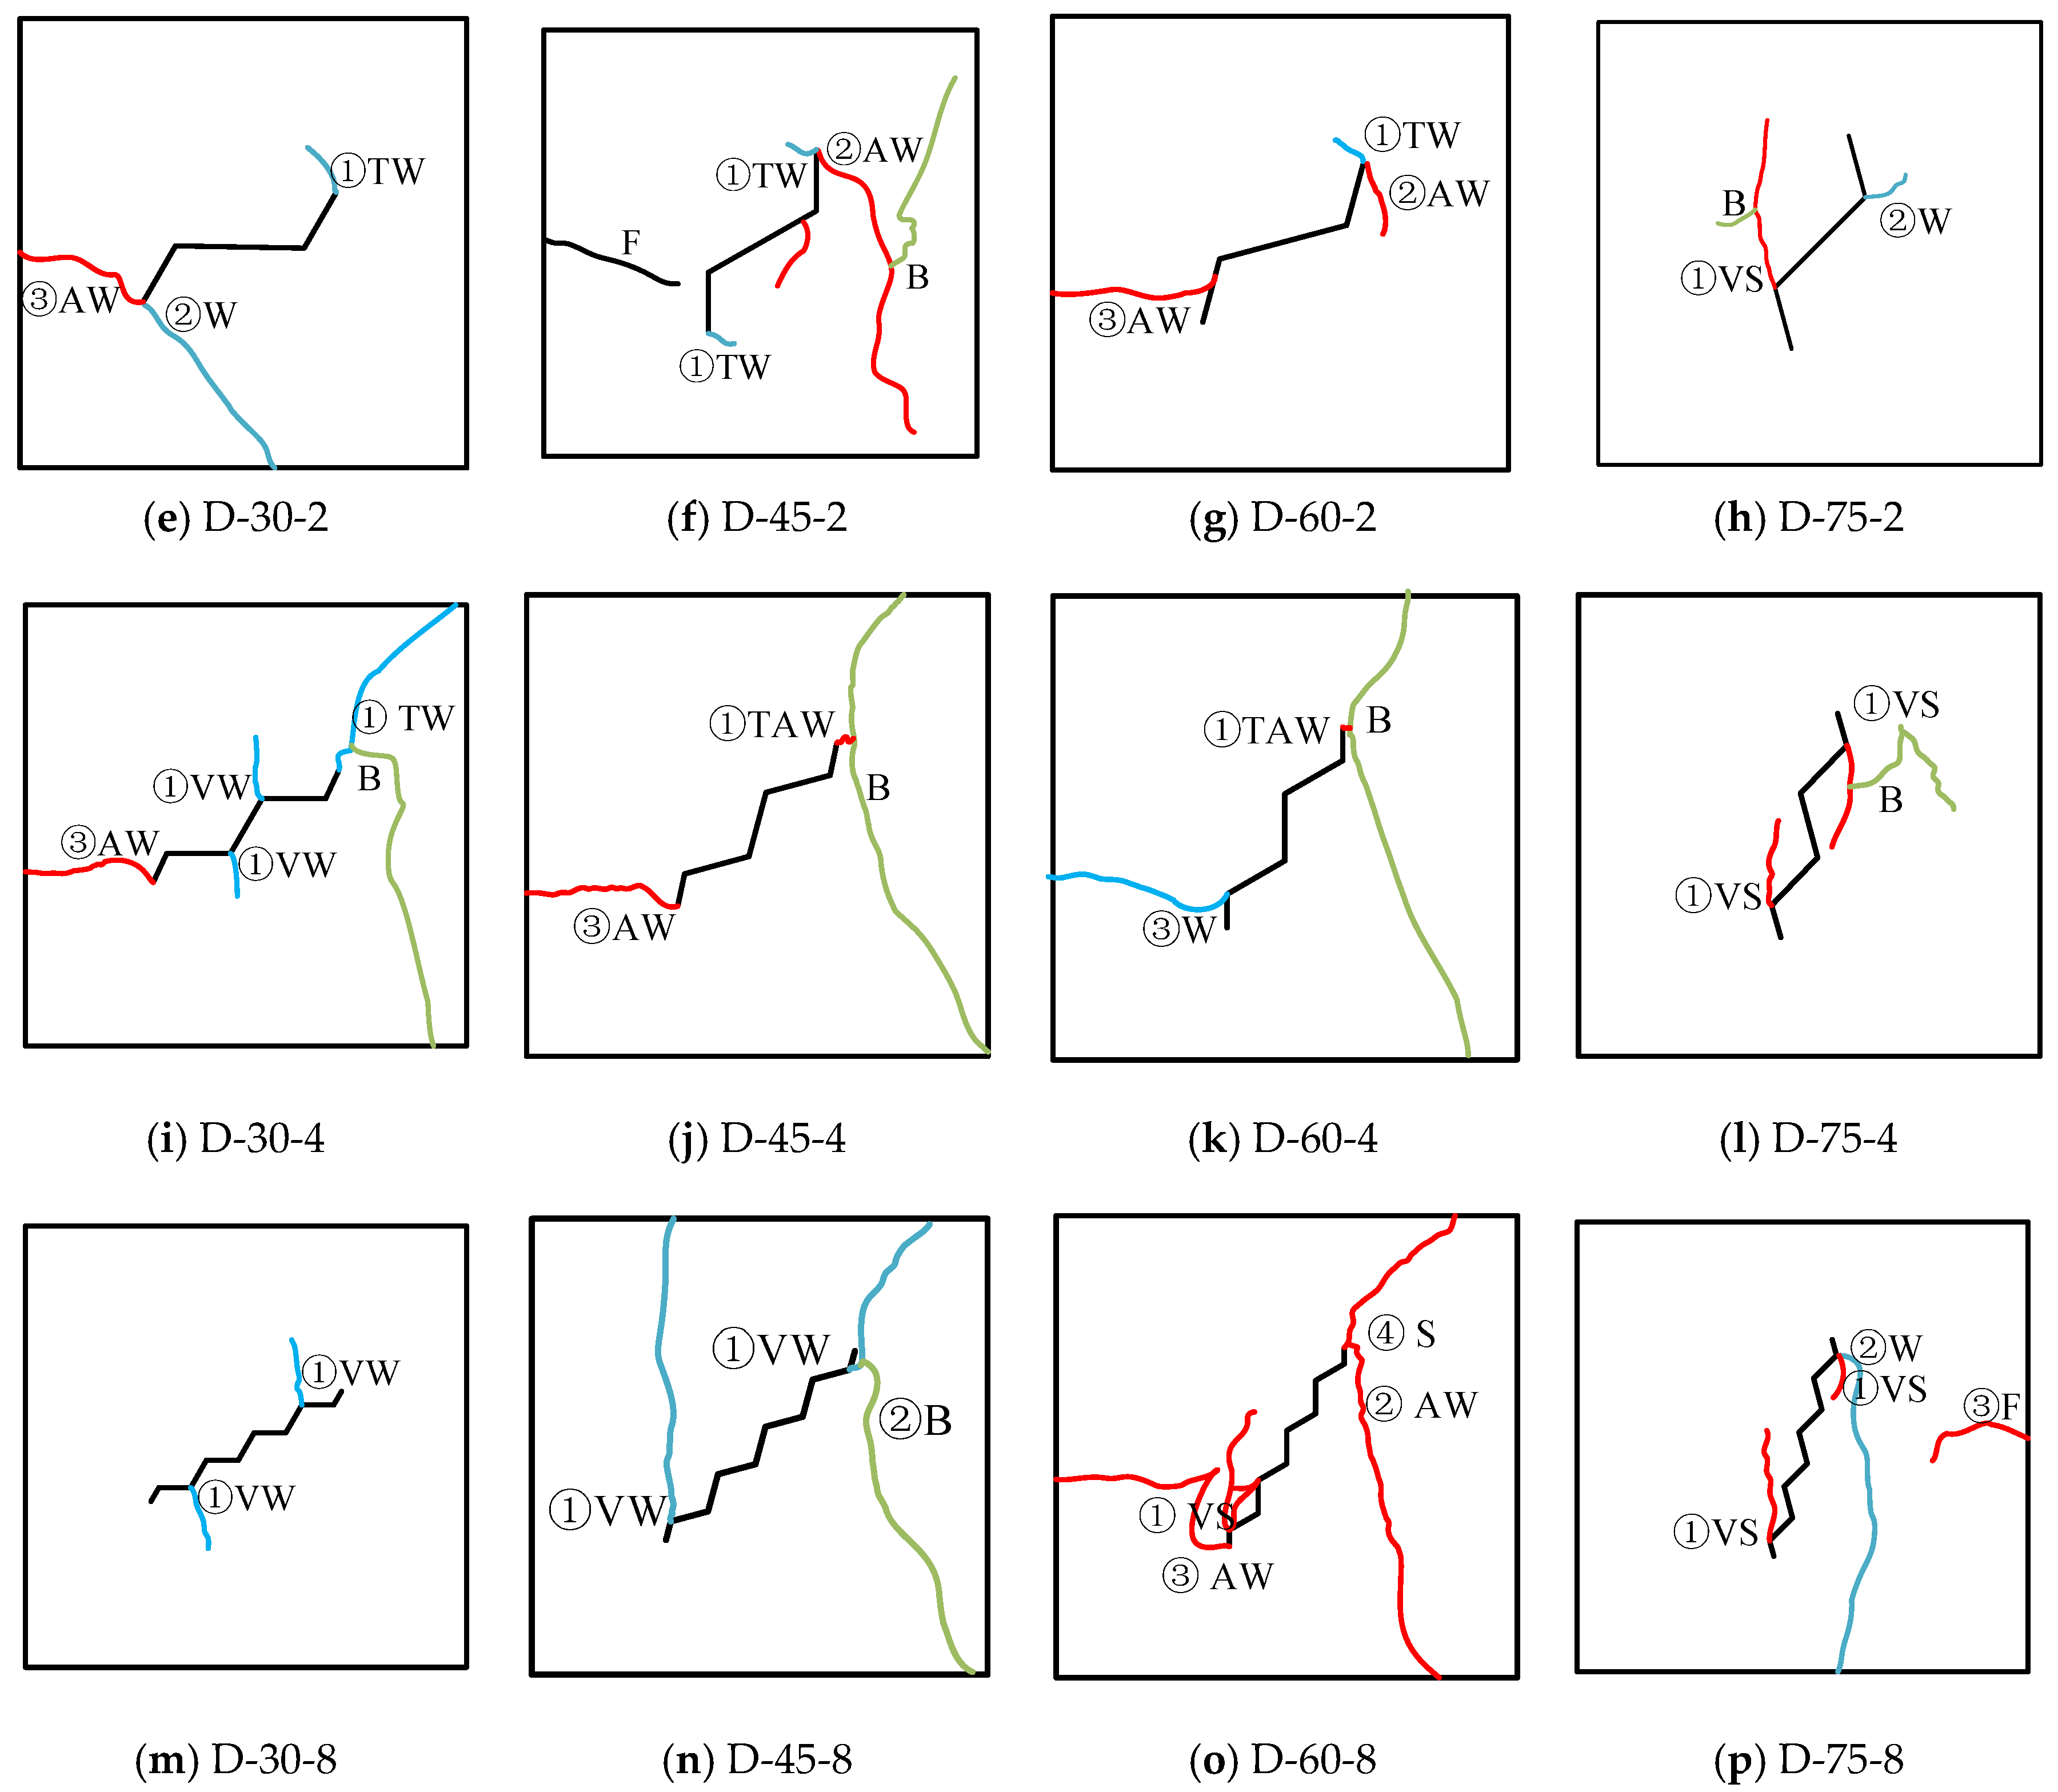
Figure 16 shows the crack trajectories during fracture for the folded-crack rock specimen with different crack inclination angles β and crack folded numbers n in the uniaxial compression test under drying conditions. For n = 0, when β is increased, the number of new cracks is decreased from three (Figure 16a,b) to two (Figure 16c,d). Concerning the initiation characteristics of the folded-crack rock specimen with different crack inclination angles β and the same n (n = 0, straight crack), there exist two initiation patterns: TW and TAW. With the increase in β, the crack initiation mode changes from TW (Figure 16a,b) to TAW (Figure 16c,d).
For n = 2, when β is increased, the number of new cracks is decreased from three (Figure 16e,f) to two (Figure 16g,h). Concerning the initiation characteristics of the folded-crack rock specimen with different crack inclination angles β and the same n = 2, there exist two initiation patterns: TW and VS. With the increase in β, the crack initiation mode changes from TW (Figure 16e,g) to VS (Figure 16h).
For n = 4, when β is increased, the number of new cracks is first decreased from five (Figure 16i) to two (Figure 16j,l). Concerning the initiation characteristics of the folded-crack rock specimen with different crack inclination angles β and the same n = 4, there exist three initiation patterns: both TW and VW, TAW, and VS. With the increase in β, the crack initiation mode changes from both TW and VW (Figure 16i) to TAW (Figure 16j,k) and VS (Figure 16l).
For n = 8, when β is increased, the number of new cracks is first increased from two (Figure 16m,n) to four (Figure 16o) and then decreased to three (Figure 16p). Concerning the initiation characteristics of the folded-crack rock specimen with different crack inclination angles β and the same n = 8, there exist three initiation patterns: VW, TS, and VS. With the increase in β, the crack initiation mode changes from both VW (Figure 16m,n) to TS (Figure 16o) and VS (Figure 16p).
It should be noted that, similar to the wetting condition, with the increase in β, the initiation point changes from the crack tips to the vertex of tooth shapes, and the initiation mode changes from tensile mode to shear mode for the folded-crack rock specimen. With the increase in n, the initiation mode changes from the crack tips to the vertex of the tooth shape for the folded-crack rock specimen. Only when β = 60° that the initiation modes of folded-crack rock specimens are Type TAW, Type VAW and VS, and Type VW in n = 2, 4, 8 under wetting conditions, respectively, which is different from those that are Type TW, Type TAW, and Type VS.

3.3.2. Crack Coalescence Mode

Two types of crack coalescence patterns were observed in specimens with folded cracks: no coalescence and direct coalescence. In the no coalescence pattern, new cracks initiate at the crack tips or the vertices of the tooth-shaped folds and propagate upward or downward toward the specimen boundaries, without merging into a single fracture. This behavior was observed in Group D (n = 0, 2), Group D (n = 4) with β ≠ 75°, Group D (n = 8) with β = 30° and 45°, Group W (n = 0, 2), Group W (n = 4) with β ≠ 75°, and Group W (n = 8) with β ≠ 75°. In contrast, the direct coalescence pattern involves new cracks propagating from the crack tips or fold vertices that connect with the opposite side of the original folded crack, forming a closed-loop structure within the specimen. This behavior was identified in Group D (n = 4) with β = 75°, Group D (n = 8) with β = 60° and 75°, and Group W (n = 4, 8) with β = 75°. These results suggest that both the crack inclination angle (β) and folded number (n) influence the transition between non-coalescent and coalescent fracture behaviors, with higher β and n favoring direct coalescence.
It was observed that with increasing crack folded number (n) and inclination angle (β), the crack coalescence mode tends to shift from no coalescence to direct coalescence. This is because, at higher β, cracks are more likely to initiate at the vertices of the tooth-shaped folds and propagate upward, ultimately merging with the opposing side of the folded crack. The influence of wetting and drying conditions on the coalescence mode is generally limited. An exception was noted when β = 60° and n = 8, where direct coalescence occurred under drying conditions (Group D), but no coalescence was observed under wetting conditions (Group W). The increased occurrence of direct coalescence at higher n and β reflects a progressive transition from isolated cracking to geometrically guided fracture coalescence. This trend can be interpreted as a ductile-to-brittle transition driven by geometric complexity and mechanical boundary conditions. At low n and β, the stress distribution is relatively diffuse, and fracture energy is dissipated through scattered microcracking, which inhibits macro-scale coalescence. In contrast, higher values of n and β promote localized stress concentration at the fold vertices, facilitating the development of shear or tensile failure zones that favor direct coalescence.
Additionally, under wetting conditions, the presence of water weakens intergranular cohesion by reducing cementation strength through hydrolysis and capillary effects. This results in decreased peak strength and enhanced crack connectivity, particularly in highly folded cracks (high n), where the increased internal surface area allows for more water infiltration. These laboratory findings can be extended to field-scale aquifers, where saturated, folded, or undulated cracks with high inclination angles may exhibit enhanced fracture linkage, potentially compromising the structural integrity of underground compressed air storage (CAESA) systems. Therefore, future numerical modeling and in situ acoustic monitoring should incorporate both crack geometry and fluid saturation conditions to better evaluate the evolution of fracture networks and the associated leakage risks in CAESA applications.

4. Conclusions

(1)
For the folded-crack rock specimens, the axial compressive axial load–displacement curves can be categorized into multimodal and single-peak types. While no clear quantitative relationship was observed between curve type and either crack inclination angle (β) or folded number (n), multimodal responses were more frequently observed under wetting conditions than under drying conditions.
(2)
Under both drying and wetting conditions, the peak strength generally increased with increasing β, whereas the effect of n was less significant in comparison. However, the magnitude of variation in peak strength was more pronounced under drying conditions, while the effect of n on the peak strength was not apparent in comparison with that of β. Furthermore, wetting conditions consistently reduced the peak strength for specimens with identical folded-crack configurations.
(3)
The crack initiation modes of folded-crack rocks can be classified into six types: Type TW, TAW, TS, VW, VAW, and VS, based on the crack initiation position (tip or vertex) and failure mechanism (tensile or shear). The crack coalescence modes can be categorized into two types: no coalescence and direct coalescence.
(4)
The uniaxial compression test of folded-crack rock specimens under wetting and drying conditions can provide helpful engineering guidance for the anti-cracking optimal design of the CAES lining cavern, especially for CAES-containing aquifers. Future studies will expand to a comparative analysis of different lithologies and investigate the long-term damage evolution laws of folded cracks under wetting–drying cycles, aiming to provide a more comprehensive understanding of the stability evaluation and design optimization of CAES projects under various geological conditions.

Author Contributions

Conceptualization and methodology, Z.L.; software, Y.M.; validation, J.G.; All authors have read and agreed to the published version of the manuscript.

Funding

This research was funded by the National Natural Science Foundation of China (52408433), the Fundamental Research Program of Shanxi Province (202403021212152), Scientific and Technological Innovation Programs of Higher Education Institutions in Shanxi (2024L257), Shanxi Scientific Research Initial Funding (20242105), and Fundamental Research Funds for the Central Universities of Central South University (2022zzts0036).

Institutional Review Board Statement

Not applicable.

Informed Consent Statement

Not applicable.

Data Availability Statement

The original contributions presented in the study are included in the article, further inquiries can be directed to the corresponding author.

Conflicts of Interest

The authors declare no conflicts of interest.

References

  1. Huang, D.Y.; Ma, Y.; Rao, Q.H.; Yi, W.; Shen, K. A new semi-analytic method for calculating the thermal-mechanical coupling stress intensity factor of interfacial crack. Theor. Appl. Fract. Mech. 2023, 128, 104156. [Google Scholar] [CrossRef]
  2. Ma, Y.; Rao, Q.; Huang, D.; Li, P.; Yi, W.; Sun, D. A new theoretical model of thermo-gas-mechanical (TGM) coupling field for underground multi-layered cavern of compressed air energy storage. Energy 2022, 257, 124646. [Google Scholar] [CrossRef]
  3. Zhao, K.; Ma, H.; Li, H.; Yang, C.; Li, P.; Liu, Y.; Li, H.; Zeng, Z.; Wang, X. Stability analysis of CAES salt caverns using a creep-fatigue model in Yunying salt district, China. J. Energy Storage 2023, 62, 124646. [Google Scholar] [CrossRef]
  4. Jiang, Z.; Li, P.; Tang, D.; Zhao, H.; Li, Y. Experimental and Numerical Investigations of Small-Scale Lined Rock Cavern at Shallow Depth for Compressed Air Energy Storage. Rock Mech. Rock Eng. 2020, 53, 2671–2683. [Google Scholar] [CrossRef]
  5. Wan, J.F.; Sun, Y.Q.; He, Y.X.; Ji, W.D.; Li, J.C.; Jiang, L.L.; Jurado, M.J. Development and technology status of energy storage in depleted gas reservoirs. Int. J. Coal Sci. Technol. 2024, 11, 29. [Google Scholar] [CrossRef]
  6. Aydin, H.; Merey, S. Potential of geothermal energy production from depleted gas fields: A case study of Dodan Field, Turkey. Renew. Energy 2021, 164, 1076–1088. [Google Scholar] [CrossRef]
  7. Colas, E.; Kukla, P.A.; Amann, F.; Back, S. Geological and mining factors influencing further use of abandoned coal mines—A multi-disciplinary workflow towards sustainable underground storage. J. Energy Storage 2025, 108, 115101. [Google Scholar] [CrossRef]
  8. Guo, C.B.; Pan, L.H.; Zhang, K.N.; Oldenburg, C.M.; Li, C.; Li, Y. Comparison of compressed air energy storage process in aquifers and caverns based on the Huntorf CAES plant. Appl. Energy 2016, 181, 342–356. [Google Scholar] [CrossRef]
  9. Yang, L.C.; Cai, Z.S.; Li, C.; He, Q.C.; Ma, Y.; Guo, C.B. Numerical investigation of cycle performance in compressed air energy storage in aquifers. Appl. Energy 2020, 269, 115044. [Google Scholar] [CrossRef]
  10. Li, Y.; Wang, H.; Wang, J.S.; Hu, L.T.; Wu, X.H.; Yang, Y.B.; Gai, P.; Liu, Y.N.; Li, Y. The underground performance analysis of compressed air energy storage in aquifers through field testing. Appl. Energy 2024, 366, 123329. [Google Scholar] [CrossRef]
  11. Li, Y.; Yu, H.; Tang, D.; Li, Y.; Zhang, G.J.; Liu, Y.N. A comparison of compressed carbon dioxide energy storage and compressed air energy storage in aquifers using numerical methods. Renew. Energy 2022, 187, 1130–1153. [Google Scholar] [CrossRef]
  12. Xia, C.; Xu, Y.; Zhou, S.; Qin, S.; He, X. Fracture initiation and propagation in the lined underground caverns for compressed air energy storage: Coupled thermo-mechanical phase-field modeling. Comput. Geotech. 2023, 157, 105329. [Google Scholar] [CrossRef]
  13. Han, P.H.; Zhao, Y.X.; Zhang, C.; Wang, X.J.; Wang, W. Effects of water on mechanical behavior and acoustic emission characteristics of coal in Brazilian tests. Theor. Appl. Fract. Mech. 2022, 122, 103636. [Google Scholar] [CrossRef]
  14. Wróbel, M.; Kalina, J. Preliminary evaluation of CAES system concept with partial oxidation gas turbine technology. Energy 2019, 183, 766–775. [Google Scholar] [CrossRef]
  15. Liu, W.; Zhang, Z.X.; Chen, J.; Jiang, D.Y.; Wei, F.; Fan, J.Y.; Li, Y.P. Feasibility evaluation of large-scale underground hydrogen storage in bedded salt rocks of China: A case study in Jiangsu province. Energy 2020, 198, 117348. [Google Scholar] [CrossRef]
  16. Zhou, A.H.; Li, P.; Fan, L.Y.; Yi, Z.W.; Tang, X.B.; Fei, W.B. Influence of drainage system on the stability of underground CAES gas storage under different lateral pressure coefficients. Tunn. Undergr. Space Technol. 2025, 159, 106444. [Google Scholar] [CrossRef]
  17. Xu, Y.J.; Zhou, S.W.; Xia, C.C.; Zhao, H.O.; Xue, X.D. Three-dimensional thermo-mechanical analysis of abandoned mine drifts for underground compressed air energy storage: A comparative study of two construction and plugging schemes. J. Energy Storage 2021, 39, 102696. [Google Scholar] [CrossRef]
  18. Li, D.X.; Wang, E.Y.; Kong, X.G.; Ali, M.; Wang, D.M. Mechanical behaviors and acoustic emission fractal characteristics of coal specimens with a pre-existing flaw of various inclinations under uniaxial compression. Int. J. Rock Mech. Min. Sci. 2019, 116, 38–51. [Google Scholar] [CrossRef]
  19. Zhuang, X.Y.; Zhou, S.W. An Experimental and Numerical Study on the Influence of Filling Materials on Double-Crack Propagation. Rock Mech. Rock Eng. 2020, 53, 5571–5591. [Google Scholar] [CrossRef]
  20. Yang, S.Q.; Yang, D.S.; Jing, H.W.; Li, Y.H.; Wang, S.Y. An Experimental Study of the Fracture Coalescence Behaviour of Brittle Sandstone Specimens Containing Three Fissures. Rock Mech. Rock Eng. 2012, 45, 563–582. [Google Scholar] [CrossRef]
  21. Zhou, X.P.; Cheng, H.; Feng, Y.F. An Experimental Study of Crack Coalescence Behaviour in Rock-Like Materials Containing Multiple Flaws Under Uniaxial Compression. Rock Mech. Rock Eng. 2014, 47, 1961–1986. [Google Scholar] [CrossRef]
  22. Zhu, D.; Jing, H.W.; Yin, Q.; Zong, Y.J.; Tao, X.L. Experimental study on mechanical characteristics of sandstone containing arc fissures. Arab. J. Geosci. 2018, 11, 637. [Google Scholar] [CrossRef]
  23. Ma, G.W.; Dong, Q.Q.; Fan, L.F.; Gao, J.W. An investigation of non-straight fissures cracking under uniaxial compression. Eng. Fract. Mech. 2018, 191, 300–310. [Google Scholar] [CrossRef]
  24. Yang, S.Q.; Yang, Z.; Zhang, P.C.; Tian, W.L. Experiment and peridynamic simulation on cracking behavior of red sandstone containing a single non-straight fissure under uniaxial compression. Theor. Appl. Fract. Mech. 2020, 108, 102637. [Google Scholar] [CrossRef]
  25. Dong, Q.Q.; Xiong, C.W.; Ma, C.L.; Wei, H.J. Experimental Study on Cracking Behaviour of Intermittent Double S-shaped Fissures under Uniaxial Compression. KSCE J. Civ. Eng. 2019, 23, 2483–2494. [Google Scholar] [CrossRef]
  26. Wu, S.Y.; Huang, Y.H. Macro and meso crack evolution of granite specimens with non-straight fissures: A comparison between two bond models. Theor. Appl. Fract. Mech. 2023, 125, 103890. [Google Scholar] [CrossRef]
  27. Fan, W.C.; Yang, H.; Jiang, X.L.; Cao, P. Experimental and numerical investigation on crack mechanism of folded flawed rock-like material under uniaxial compression. Eng. Geol. 2021, 291, 106210. [Google Scholar] [CrossRef]
  28. Zhou, X.P.; Niu, Y.; Cheng, H.; Berto, F. Cracking behaviors and chaotic characteristics of sandstone with unfilled and filled dentate flaw. Theor. Appl. Fract. Mech. 2021, 112, 102876. [Google Scholar] [CrossRef]
  29. Liu, X.H.; Pan, Z.; Wang, J.; Hu, Q.; Xiong, W.; Zhang, K. Quantitative investigation of the cracking mechanism of 3D sand-printed rock containing a fold flaw. Mater. Des. 2023, 236, 112523. [Google Scholar] [CrossRef]
  30. Wang, M.; Lu, Z.; Zhao, Y.; Wan, W. Experimental and numerical study on peak strength, coalescence and failure of rock-like materials with two folded preexisting fissures. Theor. Appl. Fract. Mech. 2023, 125, 103830. [Google Scholar] [CrossRef]
  31. Ma, Y.; Rao, Q.; Huang, D.; Liu, Z.; Yi, W.; Li, P. Gas-mechanical coupled crack initiation analysis for local air-leakage of compressed air energy storage (CAES) cavern with consideration of seepage effect. Theor. Appl. Fract. Mech. 2023, 125, 103827. [Google Scholar] [CrossRef]
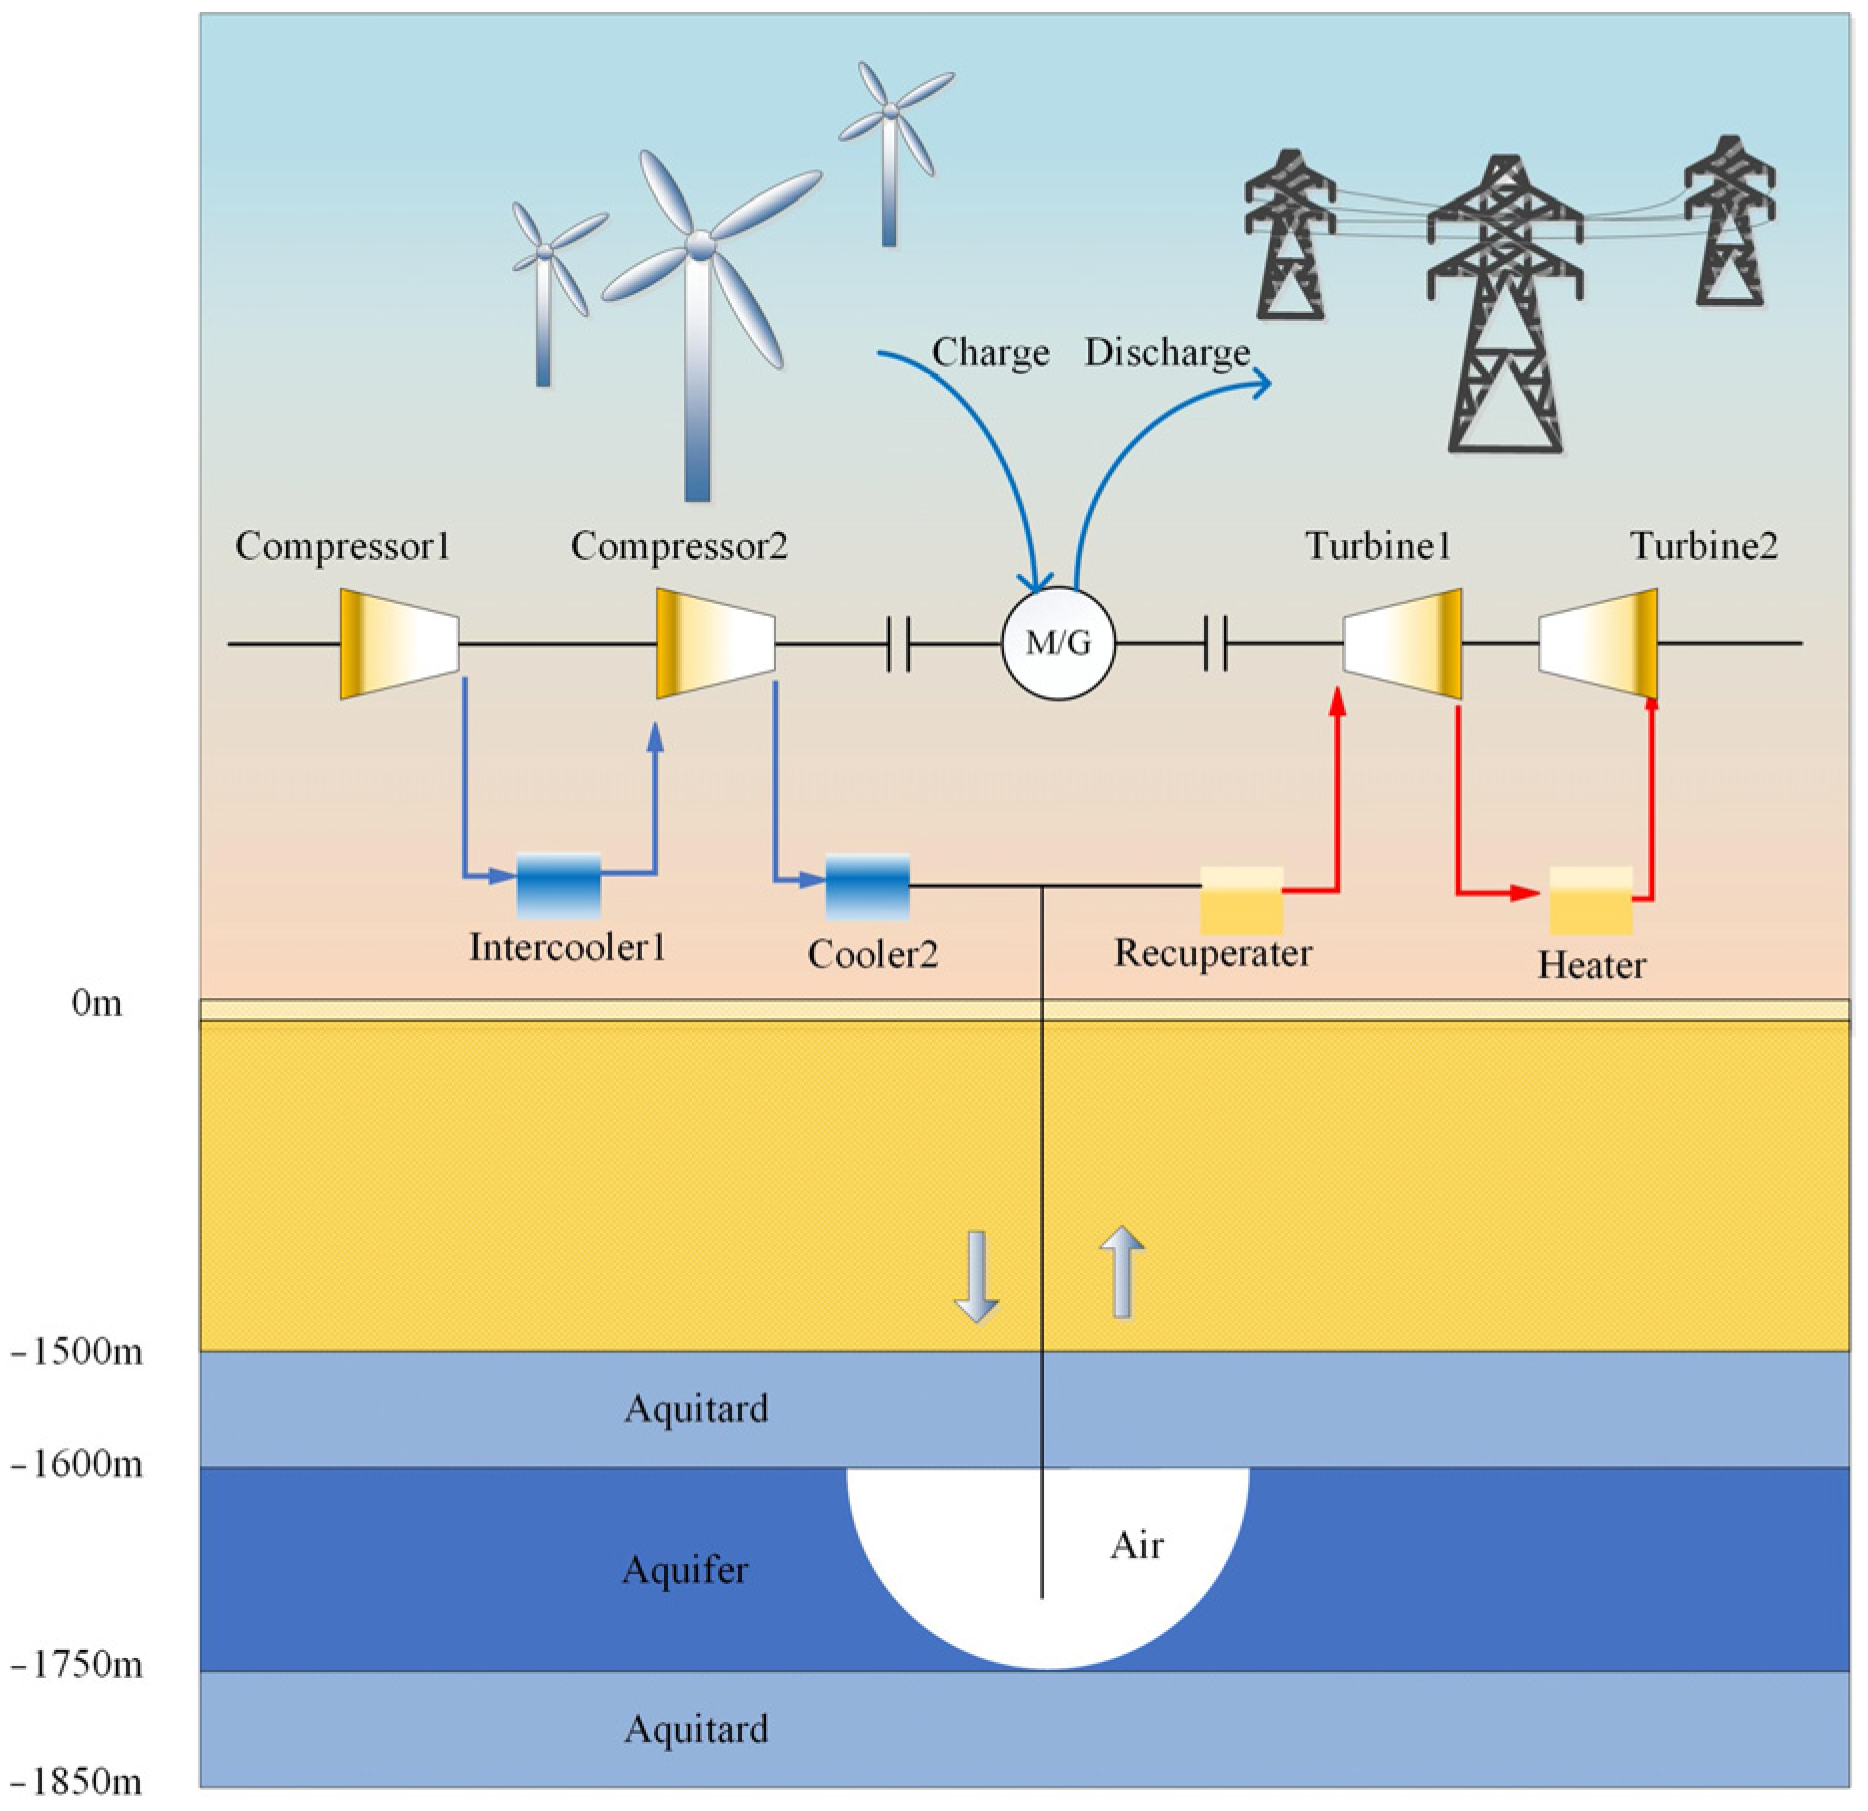
Figure 1. Conceptual model for CAESA power station.
Applsci 15 08905 g001
Figure 2. Rock specimen with folded crack: (a) diagrammatic sketch of rock specimen, (b) diagrammatic sketch of folded crack, (c) physical image of part rock specimens with folded crack, and (d) mineralogical composition of the specimen.
Applsci 15 08905 g002
Figure 3. Testing system.
Applsci 15 08905 g003
Figure 4. The axial load–displacement curves of specimens with different folded-crack inclination angles (β) and crack folded numbers (n) under wetting conditions: (a) W-β-8, (b) W-β-4, (c) W-β-2, and (d) W-β-∞(0).
Applsci 15 08905 g004
Figure 5. The axial load–displacement curves of specimens with different folded-crack inclination angles (β) and crack folded numbers (n) under drying condition: (a) D-β-8, (b) D-β-4, (c) D-β-2, and (d) D-β-∞(0).
Applsci 15 08905 g005
Figure 6. The axial load–displacement curves of different specimens: (a) W-45-8; (b) W-60-8.
Applsci 15 08905 g006
Figure 7. Peak strengths at different folded-crack inclination angles (β) and crack folded numbers (n) under wetting condition: (a) folded pre-existing crack inclination angle; (b) pre-existing crack folded number.
Applsci 15 08905 g007
Figure 8. Peak strengths at different folded pre-existing crack inclination angles (β) and pre-existing crack folded numbers (n) under drying conditions: (a) folded pre-existing crack inclination angle; (b) preexisting crack folded number.
Applsci 15 08905 g008
Figure 9. Peak strengths ratio of wetting and drying conditions at different folded pre-existing crack inclination angles (β) and pre-existing crack folded numbers (n): (a) folded pre-existing crack inclination angle; (b) pre-existing crack folded number.
Applsci 15 08905 g009
Figure 10. Variation of the b-value for folded crack under wetting condition.
Applsci 15 08905 g010
Figure 11. Variation of the b-value for folded crack under drying condition.
Applsci 15 08905 g011
Figure 12. The strain cloud maps in the yy direction of folded-crack specimens with different crack inclination angles and crack folded numbers in wetting conditions.
Applsci 15 08905 g012aApplsci 15 08905 g012b
Figure 13. The strain cloud maps in the yy direction of folded-crack specimens with different crack inclination angles and crack folded numbers in drying conditions: (a) n = ∞(0), (b) n = 2, (c) n = 4, and (d) n = 8.
Applsci 15 08905 g013aApplsci 15 08905 g013b
Figure 14. A sketch of initiated crack types for sandstone specimens: (a) crack types of rock with crack, (b) crack initiation types (tip), and (c) crack initiation types (non-tip).
Applsci 15 08905 g014
Figure 15. The crack initiation mode and cracking process of sandstone specimens containing the folded crack for the uniaxial compression test under wetting conditions.
Applsci 15 08905 g015
Figure 16. The crack initiation mode and cracking process of sandstone specimens containing the folded crack for the uniaxial compression test under drying conditions.
Applsci 15 08905 g016aApplsci 15 08905 g016b
Table 1. Categories of compressed air energy storage caverns.
Cavern TypesAdvantageDisadvantageCase
Salt cavernLow cost
Long life
No sealing layer required
Geographical limitationsHuntorf, Germany, and McIntosh, United States [14]
Jintan, Jiangsu, and Feicheng, Shandong [15]
Artificial lining cavernWithout geographical limitationsSealing layer is requiredPingjiang, Hunan, and Chaoyang, Liaoning [16]
Depleted
oil and gas field
Low costGeographical limitationsEngineering demonstration and testing stage [5]
Abandoned coal mineLow costGeographical limitationsAbandoned tunnel CAES power station in mine in Yungang, Datong [17]
AquiferLow cost
Without geographical limitations
-Engineering demonstration and testing stage
Table 2. Geometric parameters and loading conditions of rock materials with folded crack.
GroupNo.β/◦nl/mmGroupNo.β/◦nl/mm
WW-30-230214.43DD-30-230214.43
W-30-447.22D-30-447.22
W-30-883.61D-30-883.61
W-30-∞(0)∞(0)50D-30-∞(0)∞(0)50
W-45-245214.43D-45-245214.43
W-45-447.22D-45-447.22
W-45-883.61D-45-883.61
W-45-∞(0)∞(0)50D-45-∞(0)∞(0)50
W-60-260214.43D-60-260214.43
W-60-447.22D-60-447.22
W-60-883.61D-60-883.61
W-60-∞(0)∞(0)50D-60-∞(0)∞(0)50
W-75-275214.43D-75-275214.43
W-75-447.22D-75-447.22
W-57-883.61D-57-883.61
W-75-∞(0)∞(0)50D-75-∞(0)∞(0)50
Table 3. The types of axial load–displacement curves for different crack inclination angles (β) and crack folded numbers (n).
No.Types of Axial Load–Displacement CurvesNo.Types of Axial Load–Displacement Curves
MultimodalSingle PeakMultimodalSingle Peak
D-30-2 W-30-2
D-30-4 W-30-4
D-30-8 W-30-8
D-30-∞ W-30-∞
D-45-2 W-45-2
D-45-4 W-45-4
D-45-8 W-45-8
D-45-∞ W-45-∞
D-60-2 W-60-2
D-60-4 W-60-4
D-60-8 W-60-8
D-60-∞ W-60-∞
D-75-2 W-75-2
D-75-4 W-75-4
D-75-8 W-75-8
D-75-∞ W-75-∞
Disclaimer/Publisher’s Note: The statements, opinions and data contained in all publications are solely those of the individual author(s) and contributor(s) and not of MDPI and/or the editor(s). MDPI and/or the editor(s) disclaim responsibility for any injury to people or property resulting from any ideas, methods, instructions or products referred to in the content.