1. Introduction
The automotive industry places increasing demands on Noise, Vibration, and Harshness (NVH) performance, as noise sources significantly impact passenger comfort. Among these sources, small electric motors—such as those used in windshield wipers, power windows, and sunroof mechanisms—are critical contributors [
1,
2]. Existing research has primarily focused on electromagnetic and aerodynamic noise in DC motors, but mechanical noise sources remain less explored.
Noise and vibration analysis techniques are becoming increasingly important in industrial diagnostics due to their non-invasive nature and their ability to detect early-stage faults in electromechanical systems. In automotive applications, NVH evaluation plays a key role in both quality control during production and post-sale maintenance, especially in systems where traditional inspection methods are limited or impractical. Incorporating acoustic and vibrational monitoring can reduce warranty costs and improve long-term reliability, particularly in complex assemblies such as sunroof mechanisms or window regulators.
Reliable fault detection in DC motors is crucial throughout the entire supply chain of a sunroof system—from the DC motor manufacturer, through the sunroof system integrator, all the way to the final car manufacturer. Ineffective identification of defective units leads to increased costs at every stage of the chain. In many cases, faulty components are only identified at the vehicle assembly stage, resulting in delays, rework, and increased warranty claims.
Recent reviews [
3] highlight that noise and vibration characteristics in electric motors have become key quality indicators across industries, especially in the automotive sector. Inadequate NVH performance can result in negative customer perception, product recalls, or costly repairs. Studies also emphasize that detecting faults late in the supply chain—such as during vehicle assembly—can cause significant disruptions and financial losses for both suppliers and OEMs. These findings underline the necessity of early, precise, and cost-effective diagnostic techniques, particularly in small DC motors used in comfort systems like sunroofs.
This study hypothesizes that rotor misalignment, rather than rotor imbalance or other factors, is the primary cause of excessive NVH in sunroof DC motors. To test this, Time Synchronous Averaging (TSA) is applied to isolate periodic signals and diagnose NVH characteristics more accurately than conventional Fast Fourier Transform (FFT) methods.
According to [
4], the potential sources of noise and vibrations in DC motors can be divided into three categories: electromagnetic, aerodynamic, and mechanical sources. Extensive research has been conducted into the first two categories. In study [
5], a holographic acoustic imaging method was implemented to visualize noise sources within the motor. It was found that the main sources of noise were electromagnetic forces and rotor imbalance, with motor structure resonances identified as the primary cause of higher frequency noise. In [
6], parameters such as stator core thickness and slot angle were optimized, successfully reducing vibration amplitudes.
Pindoriya et al. [
7] analyzed vibrations and noise in brushless DC motors and concluded that electromagnetic forces were the main source of noise and vibrations. By applying pulse-width modulation control, these issues were mitigated. Studies [
8,
9,
10,
11] propose various structural modifications to the stator and rotor to reduce noise and vibrations caused by electromagnetic forces in the motor. Paper [
12] presents a one-dimensional modeling approach for the noise and vibrations of a DC motor used in automotive windows. This model integrates electrical and mechanical elements, providing a predictive tool for NVH characteristics.
However, in automotive DC motors, vibrations often originate from mechanical sources [
13]. The complexity of the assembly, which includes not only the DC motor itself but also various other rotating components, is a primary cause. These components include bearings and their defects, sliding contacts, rotor imbalance, shaft misalignment, couplings, gears, and more [
1,
2].
The operation of DC motors at relatively high speeds, around 4500 rpm, ensures the generation of the required torque for the given unit but also contributes to significant noise production due to the involvement of these rotating components. Noise levels depend not only on the motor’s design but also on factors such as total operating time, rotation direction, real load and boundary conditions [
14].
In complex assemblies of automotive DC motors, locating noise sources is a challenging task due to the intricate interaction of mechanical components. Traditional methods often fail to accurately pinpoint the origin of vibrations, leading to ineffective noise reduction measures. The conventional approach for evaluating the NVH characteristics of DC motors involves acoustic and vibration analysis using a measurement system composed of multiple accelerometers and microphones [
1,
14,
15]. The recorded data are then processed using Fast Fourier Transformation (FFT) analysis, which enables the evaluation of the power spectrum. From this spectrum, RMS values are calculated to assess NVH intensity. These evaluation processes are designed to detect defective DC motors and their adjacent components during production.
In the analysis of DC motors, these conventional methods can identify defective products to some extent, but they are unable to precisely define the boundary between acceptable (OK) and unacceptable (NOK) motors. Furthermore, they cannot accurately classify the type or source of the problem.
A typical FFT analysis or Power Spectral Density (PSD) analysis of measured data contains a wide spectrum of signal harmonics, making it challenging to distinguish their source. Moreover, measured signals from multiple defective samples may not exhibit any common features that could be further analyzed.
To address this issue, the TSA technique is applied in this paper. This method has proven to be an effective tool for diagnosing faults in large rotating assemblies, such as turbines, gearboxes, or helicopter rotors, due to its ability to isolate periodic signals from noise and interference [
16,
17,
18,
19]. TSA extracts specific periodic signals from a composite signal through averaging [
20].
In studies [
21,
22,
23,
24], TSA was utilized to eliminate unwanted interference frequencies from the measured signals of gearboxes. TSA effectively filtered out harmonic components unrelated to the tested gears and removed noise caused by other vibration sources within the system. This improved the accuracy and reliability of fault detection in gearbox gears.
Wang et al. [
25] employed TSA to enhance crack detection at the edge of planetary gear holes in helicopter planetary gearboxes by removing disruptive harmonic components from the gear and shaft harmonics. This approach isolated the effects of cracks from the dominant gear harmonics, increasing the system’s ability to detect and track crack progression in planetary gear hole edges. TSA has also demonstrated its effectiveness in bearing fault detection, enabling more accurate and efficient diagnostics of early-stage faults, thus significantly contributing to early fault identification and reliability improvement [
26,
27,
28].
Based on the reviewed literature, the TSA method has been widely applied across various technical fields. However, its use in smaller rotating systems, such as DC motors, remains insufficiently explored. Time Synchronous Averaging (TSA) is a powerful technique for isolating periodic components in vibration signals, being widely used in fault diagnostics of rotary machines. However, its application differs significantly depending on the scale of the system. In small-scale devices such as DC motors or drone rotors, TSA must contend with high-frequency components arising from elevated rotational speeds and significant influence from motor electronics. The tonal and broadband noise originating from closely spaced components and unsteady motion can complicate signal synchronization and averaging accuracy [
29,
30]. Conversely, in large-scale machines like turbines or industrial gearboxes, TSA benefits from more stable operating conditions and dominant low-frequency mechanical and aerodynamic noise, allowing for more effective extraction of fault-related signatures. Additionally, large machines exhibit less variation in phase due to structural inertia and slower dynamics, which facilitates TSA alignment and averaging [
31,
32]. Therefore, while TSA remains a useful tool across scales, its effectiveness and implementation parameters must be carefully adapted to account for the different noise characteristics and dynamic behaviors of small and large rotary systems.
The paper is structured as follows: Following the introduction,
Section 2 addresses the measurement methods and the discussion about existing decision-making criteria for classifying samples as acceptable (OK) or unacceptable (NOK) under the manufacturing conditions of an automotive sunroof system producer. It also describes the experiment and the proposed evaluation method.
Section 3 provides a detailed description of DC motor design and the experimental procedure.
Section 4 presents the experimental results.
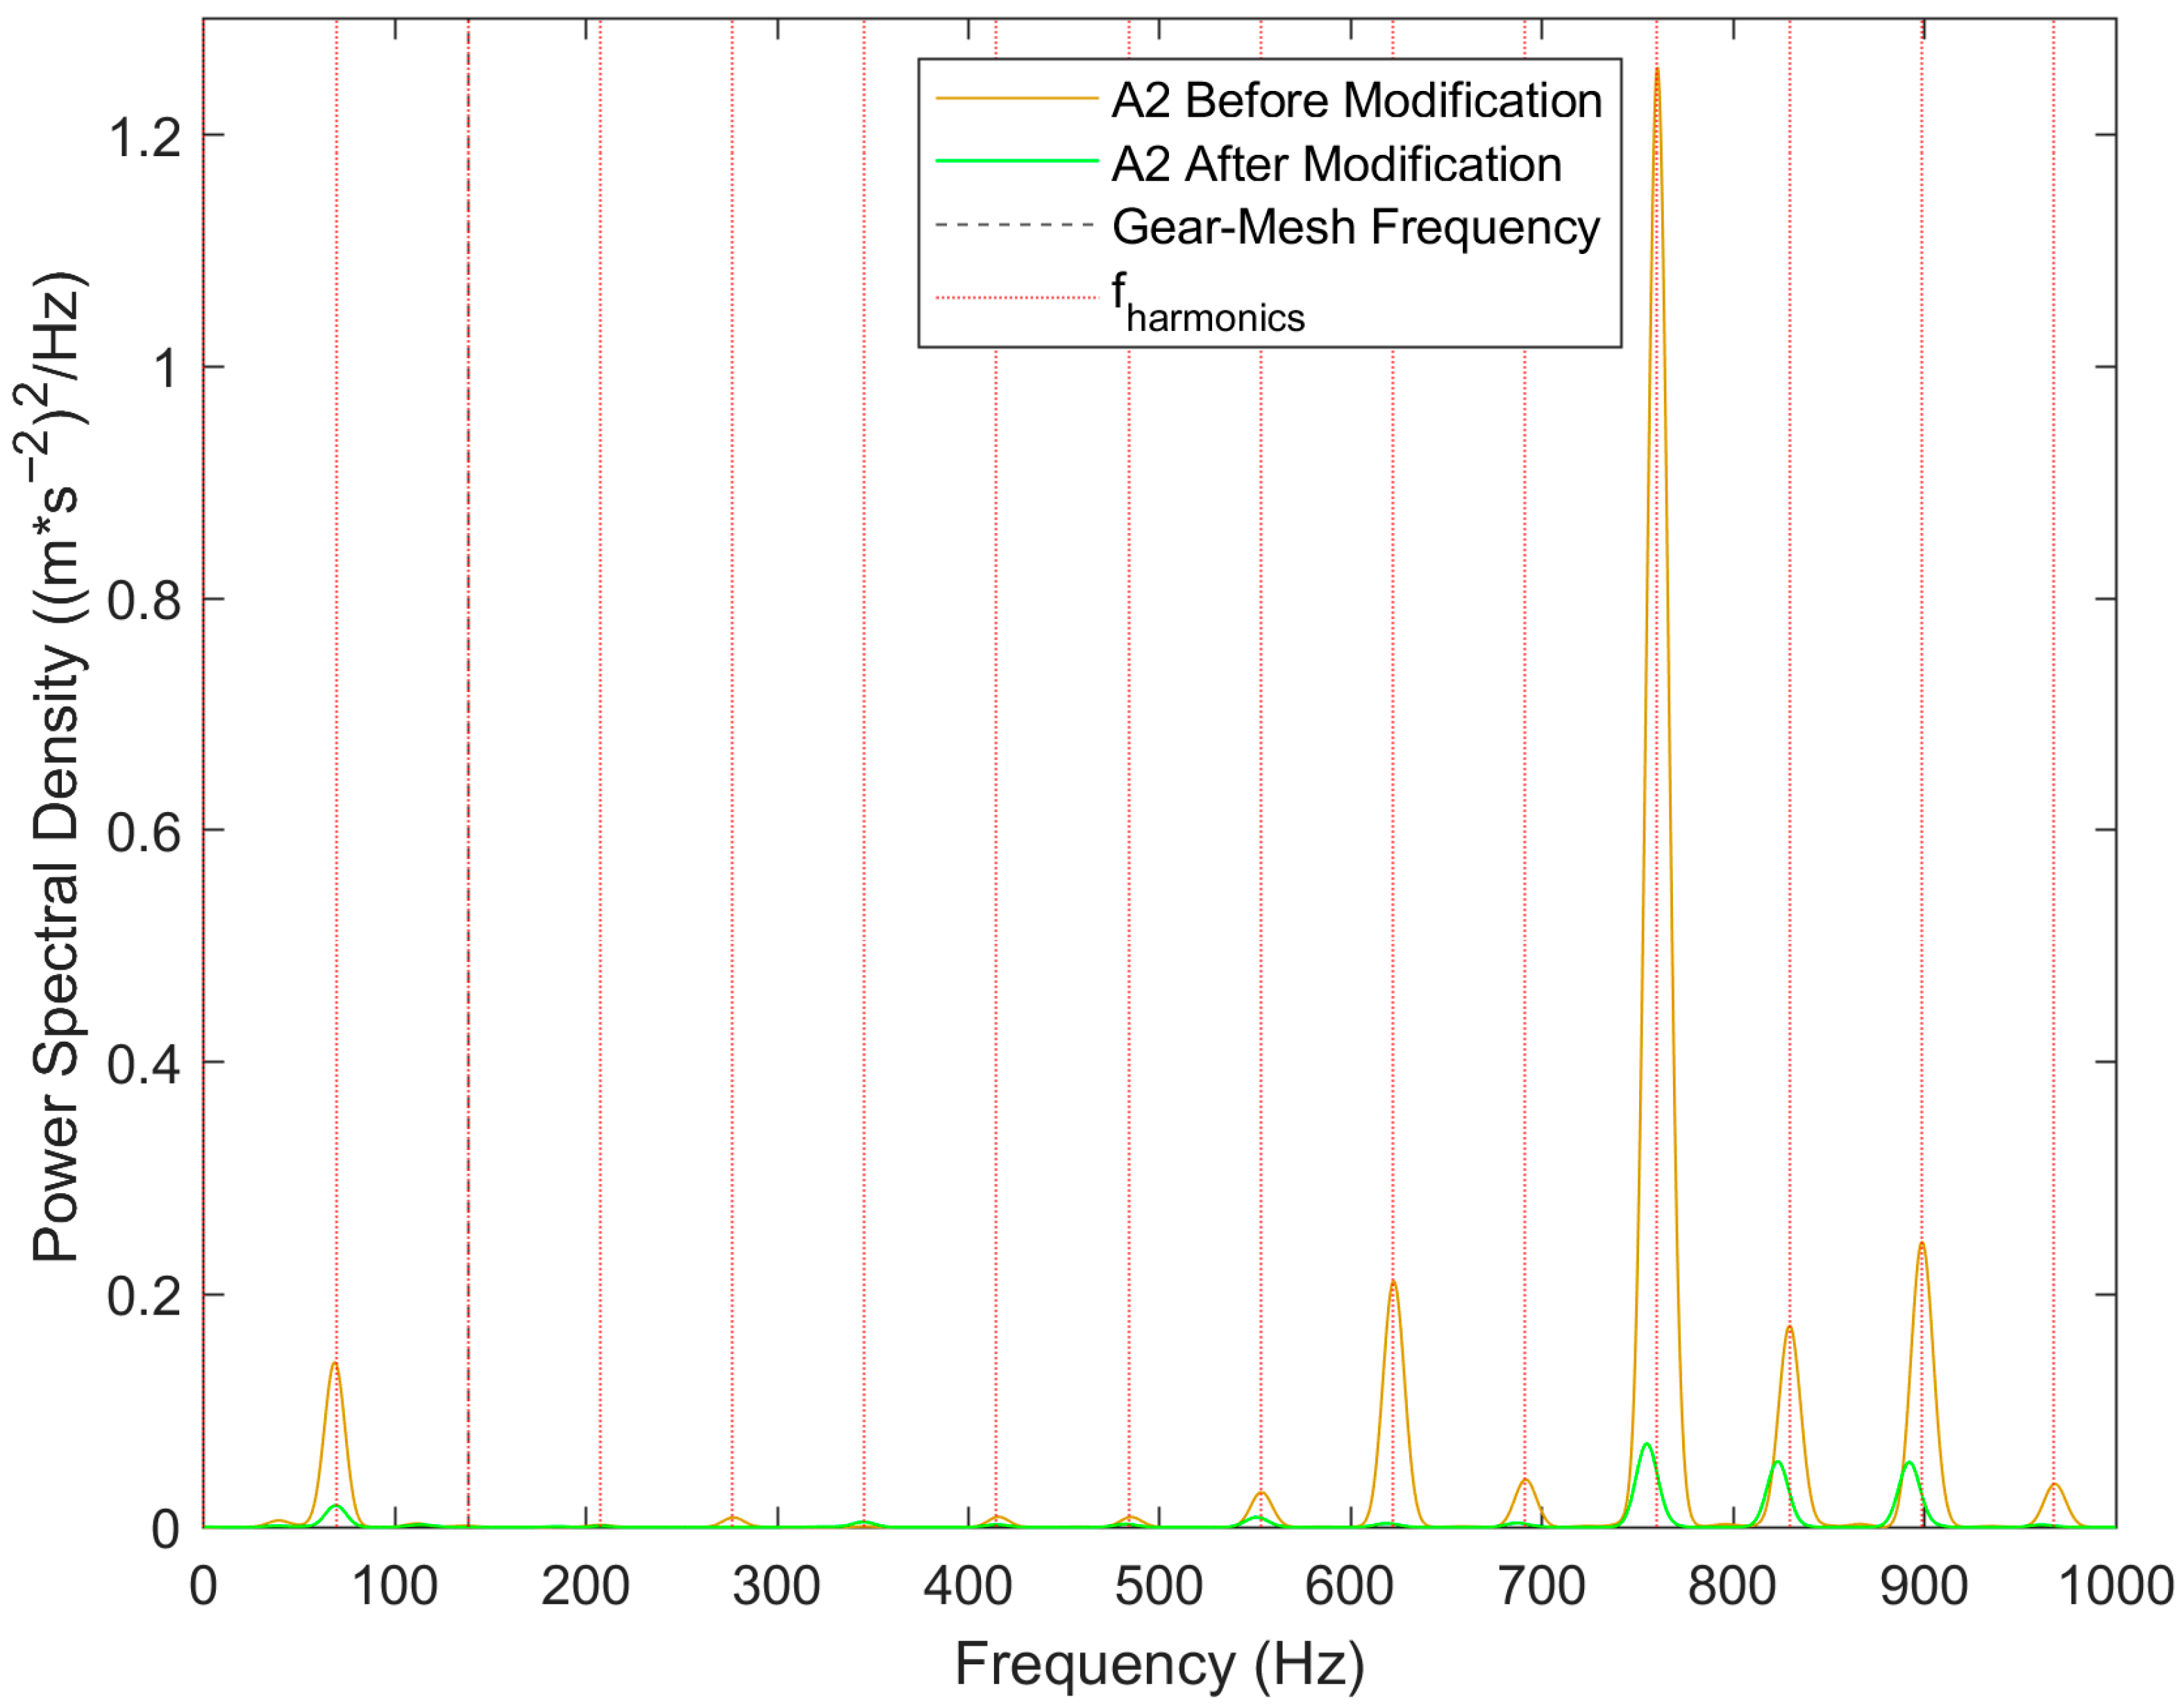
Section 5 focuses on the experimental modification of a selected NOK sample to minimize NVH characteristics based on the findings of prior analyses. Finally,
Section 6 analyzes the measurement results of modified samples.
2. Experimental Methodology, TSA Method, Decision-Making Criteria
As part of the study, a group of two OK samples exhibiting acceptable NVH characteristics and two NOK samples classified as unacceptable in terms of NVH was analyzed, selected from a larger set of analyzed samples. The decision-making criteria for determining whether a sample is acceptable or not was based on both objective and subjective evaluations.
Objective evaluation involved analyzing outputs from Frequency Response Functions (FRFs) of acceleration or acoustic pressure, with defined permissible thresholds for acceleration and acoustic pressure values. Subjective evaluation was carried out by assessing audible noise, considering human perception.
Figure 1 compares the Welch PSD estimates of acceleration responses for selected OK and NOK samples. The most critical NVH frequency range is identified as 0–1000 Hz. It is evident that defining objective criteria for distinguishing OK and NOK samples based solely on PSD is challenging. Notably, in this case, the RMS value of the measured signal for the OK sample is approximately 10% higher than that of the NOK sample.
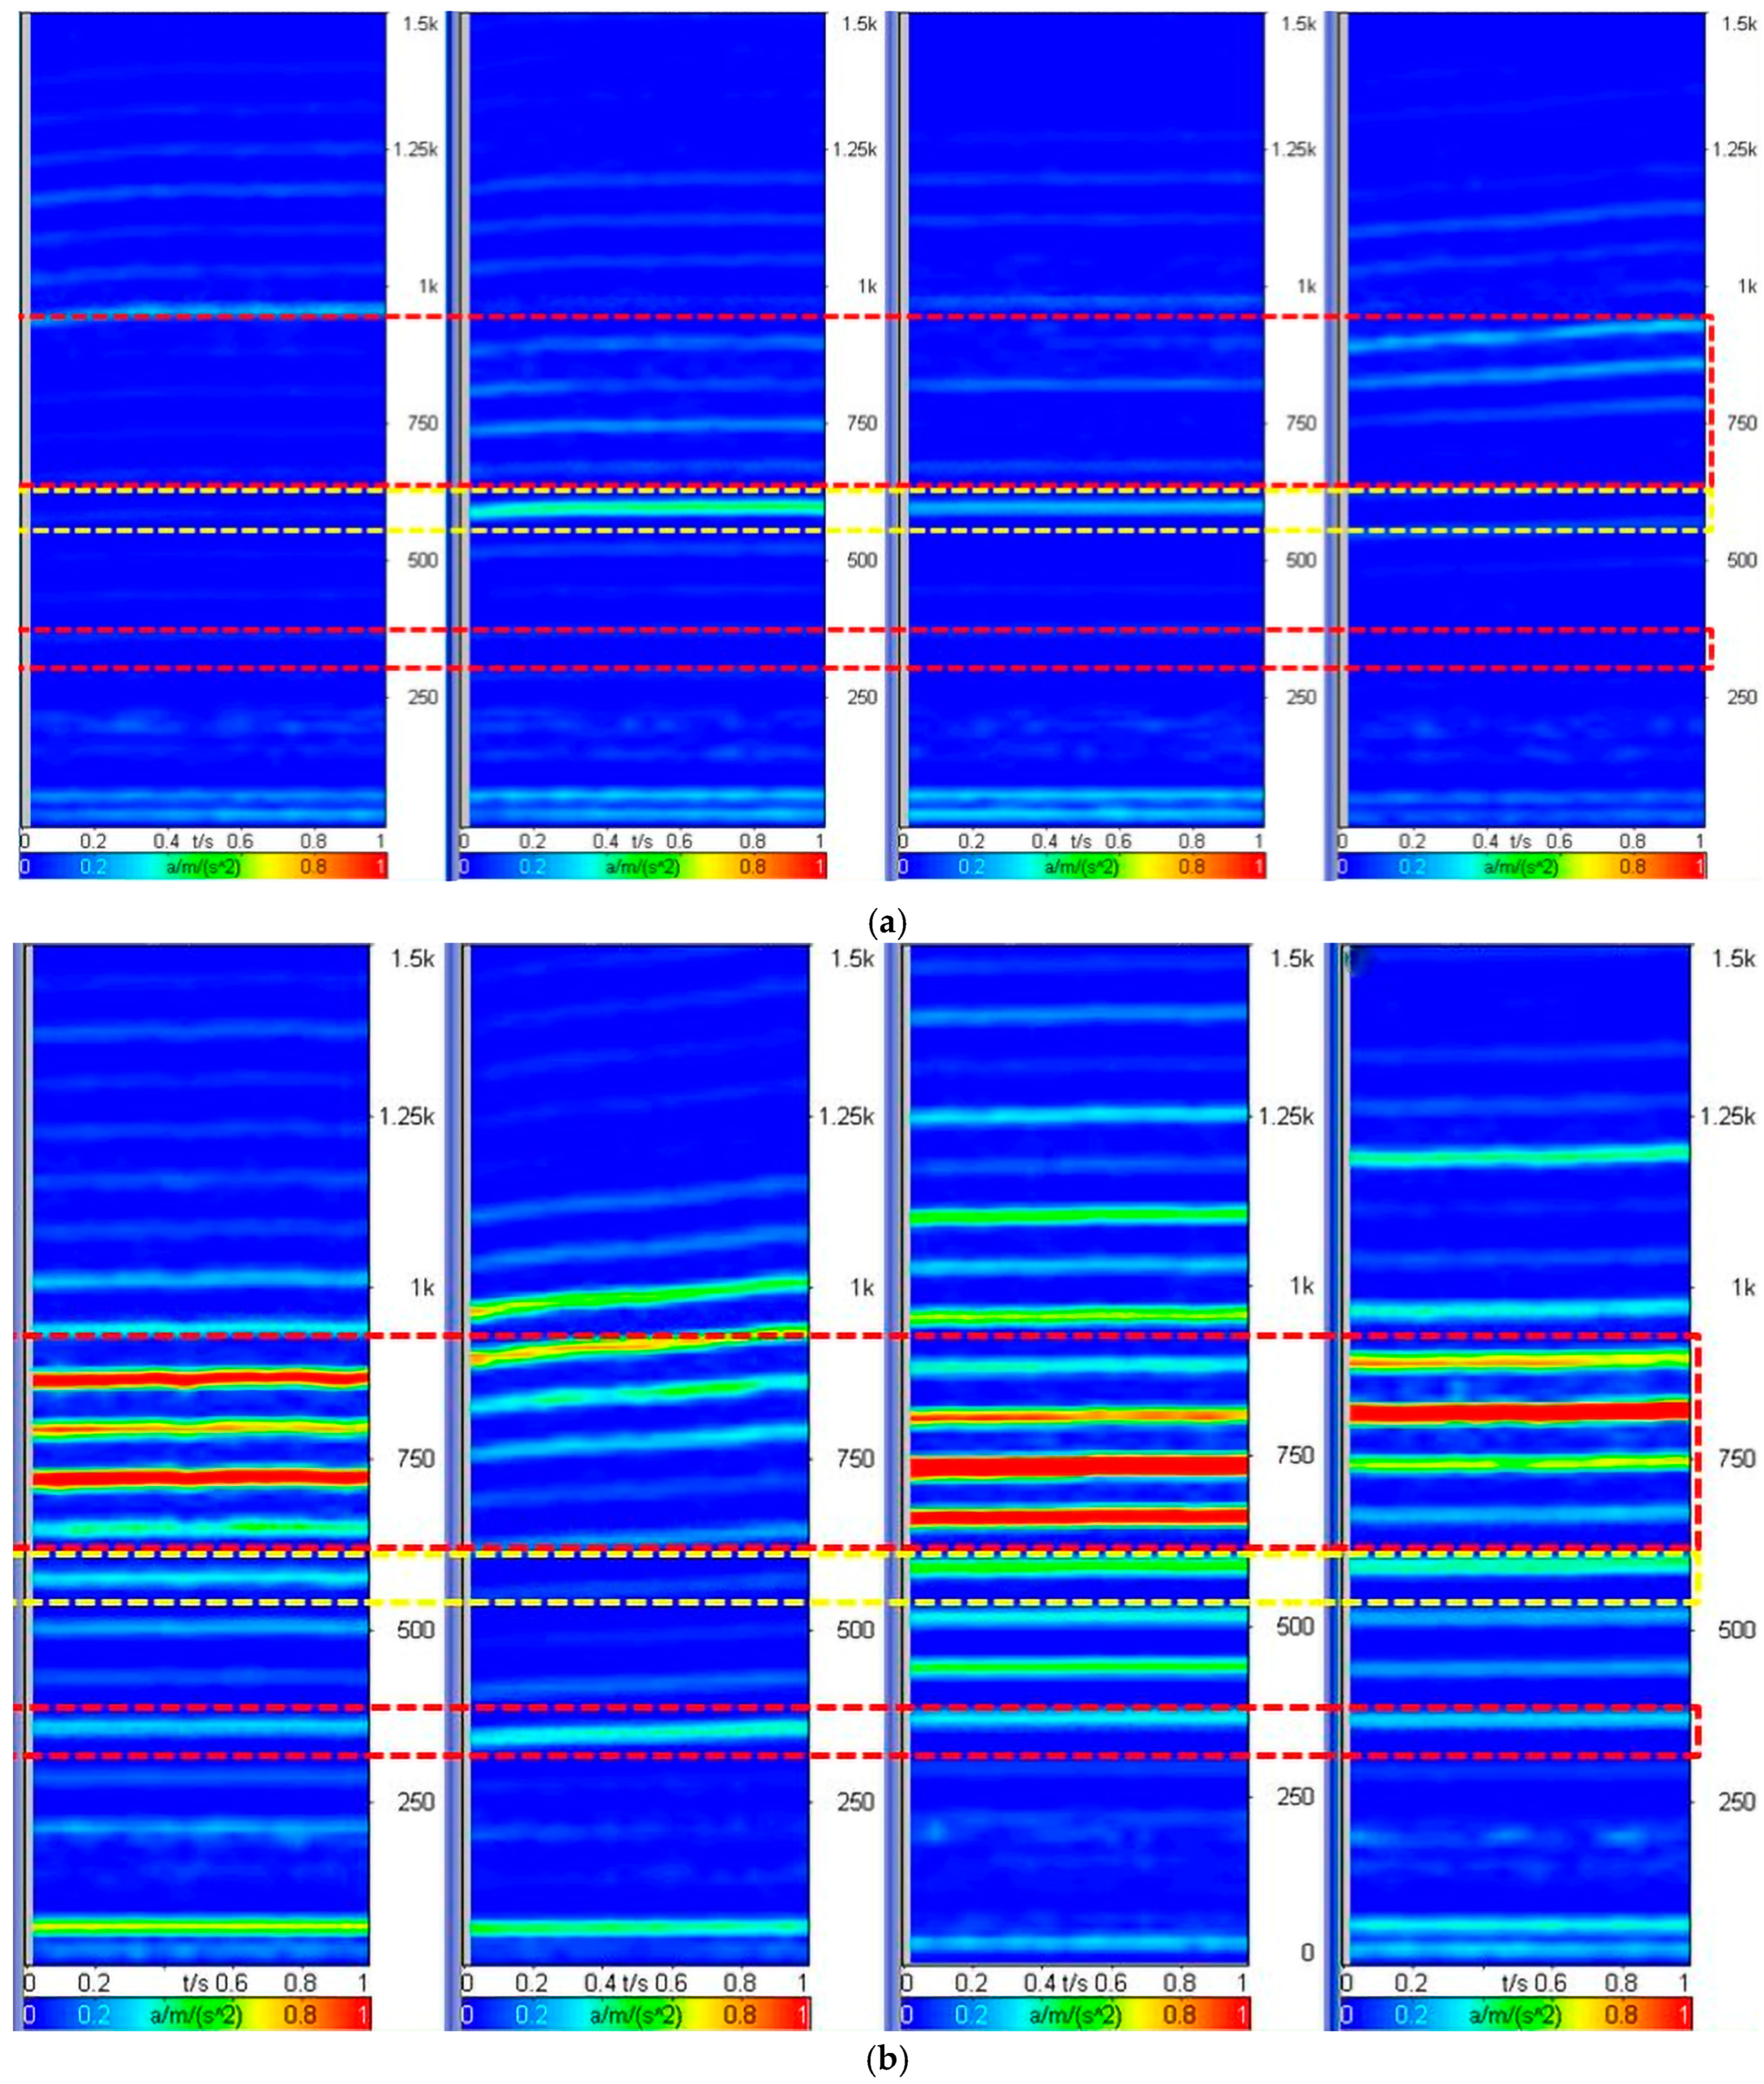
Four OK samples (
Figure 2a) and four NOK samples (
Figure 2b) were further compared using spectrograms. Differences in vibration amplitudes at various harmonic multiples of the fundamental frequency were observed between OK and NOK samples. It is important to emphasize that these differences are not only present between the OK and NOK categories but also among individual samples within the same category, whether OK or NOK. The most significant differences were observed at harmonic multiples in the range of 600 to 900 Hz.
The presented evaluation approaches based on frequency response of accelerations and FFT analysis serve as fundamental tools for NVH analysis, providing an overview of its characteristics. However, the signals measured from the samples contain not only periodic components but also non-periodic ones, such as random noise or interactions with other components. Given this, the basic tools lack a methodology for clear and objective differentiation between OK and NOK samples. Additionally, they do not reliably identify the causes of elevated NVH levels.
The TSA method is applied to measured signals to extract periodic components while suppressing random noise and asynchronous vibrations. Unlike FFT-based methods, which analyze the entire frequency spectrum, TSA focuses on phase-synchronized averaging, improving fault detection accuracy. This technique has been validated for large rotating assemblies, such as turbines and gearboxes, but its application to smaller systems like DC motors remains underexplored.
The fundamental theory of TSA is as follows: the measured signal
from a rotating mechanism can be expressed by the equation:
This signal is a combination of several components:
Periodic component : related to the dynamics of the rotor (e.g., fundamental frequency and its harmonic multiples).
Random noise : non-periodic and unrelated to the rotor’s rotation.
Asynchronous components : such as vibrations from other devices.
TSA isolates the
component by averaging the signal over multiple rotations. Using a tachometer signal or another reference source, the signal
is divided into
N segments, with each segment corresponding to a single complete rotation. Let
T represent the period of one rotation. Then, for the segment of the
k-th rotation, the following applies:
The synchronous average
is defined as the average of these segments:
The periodic components of individual segments, , are identical; therefore, is preserved in . The values of random noise across N segments do not correlate with the reference signal, causing their average to approach zero as N → ∞. The phase of asynchronous components varies between segments, leading to their suppression during averaging.
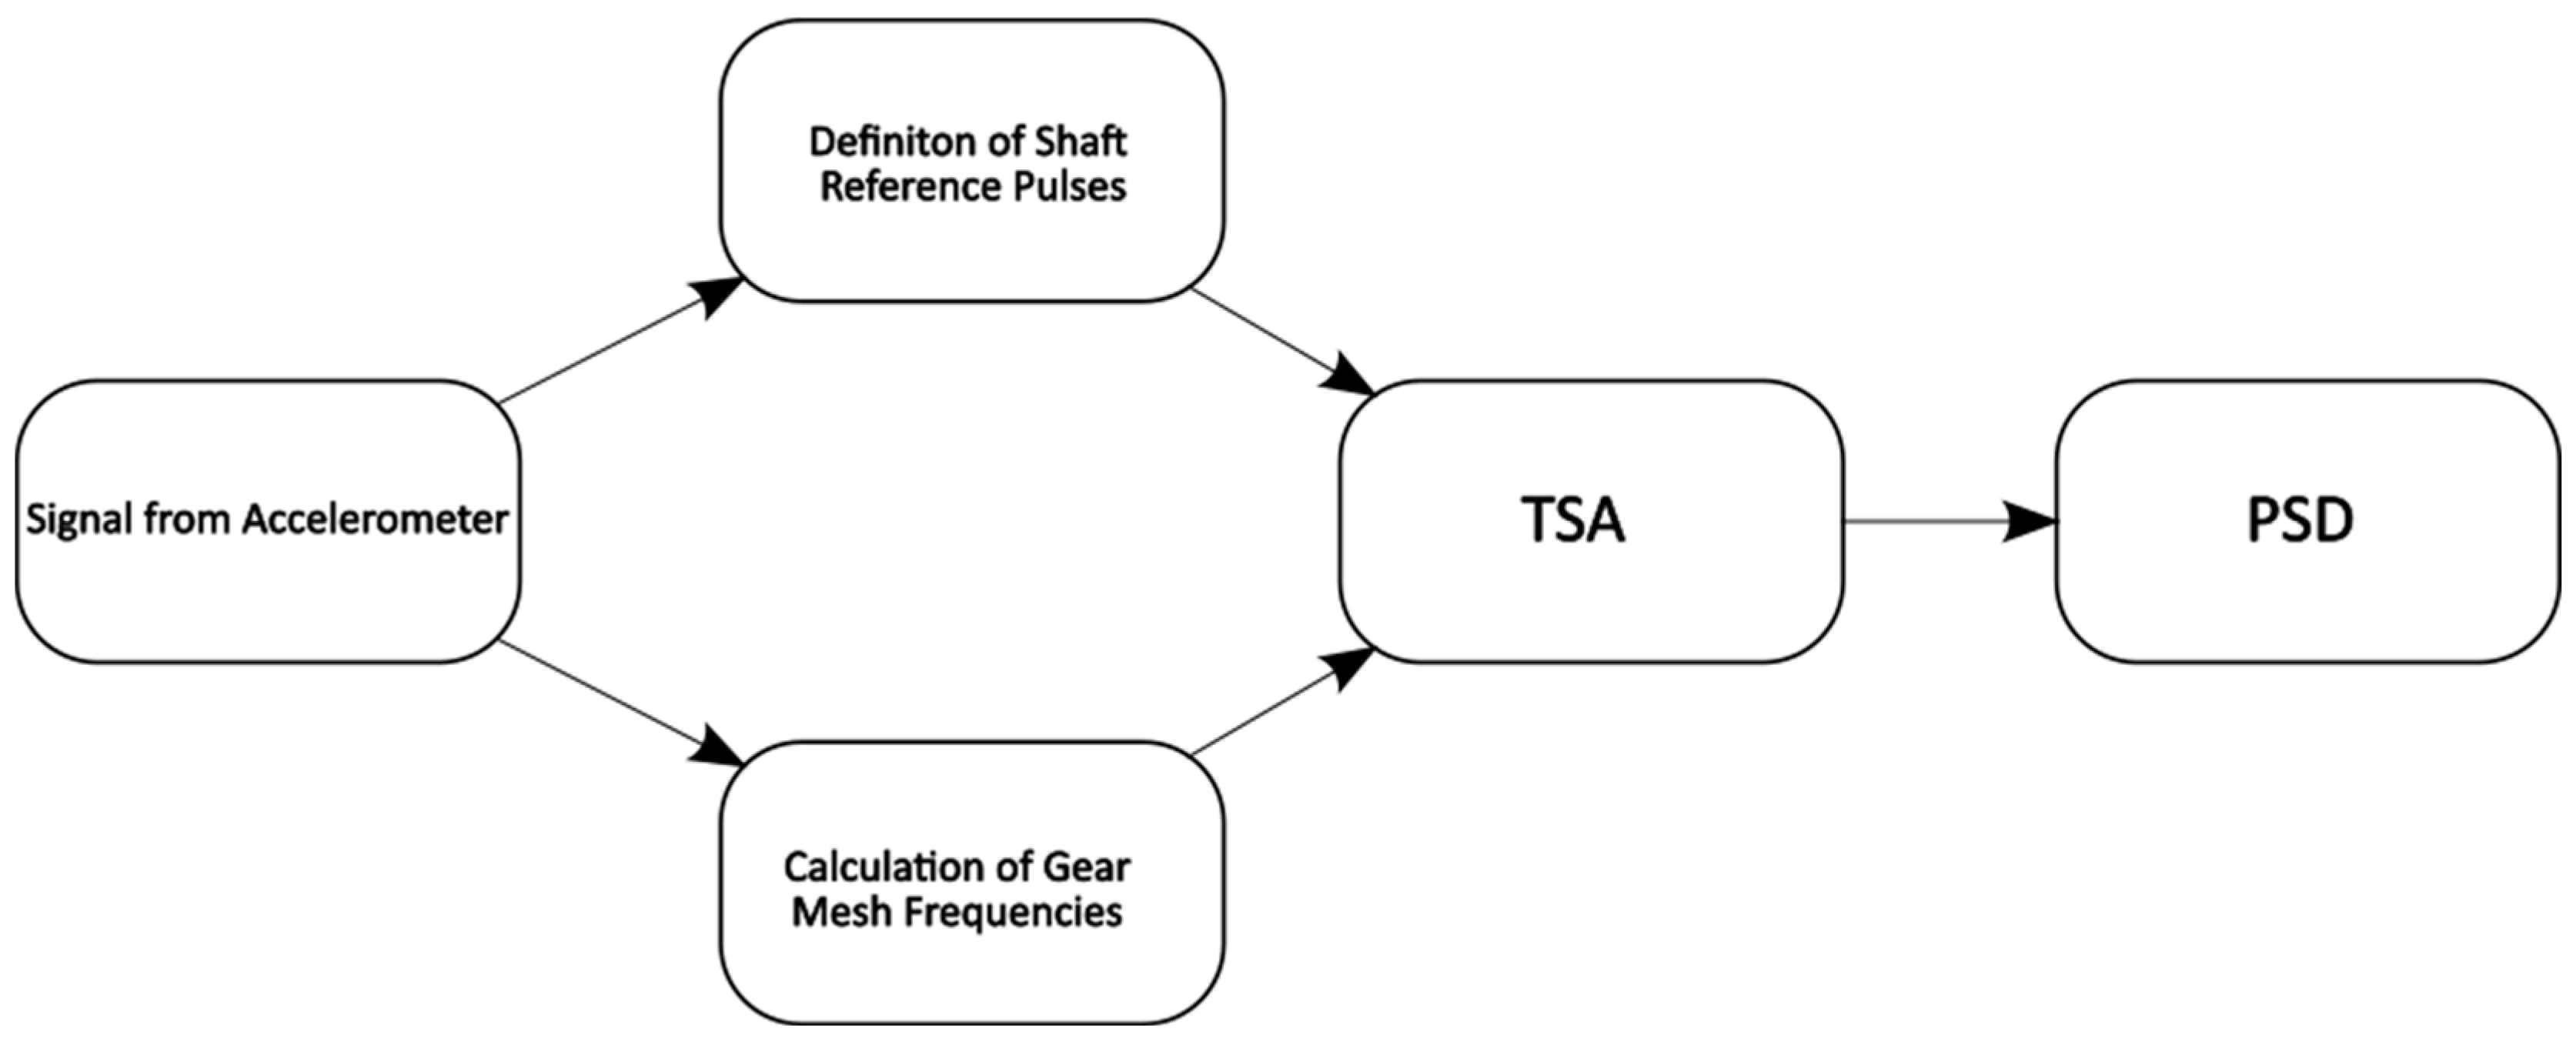
The process of evaluating the measured data is illustrated in
Figure 3. The collected data were imported into MATLAB R2020b for subsequent analysis. In the first step, the reference signal for the rotor’s rotational frequency is determined. Due to the complexity of measuring rotations directly on the rotor, caused by the small size of the system, the reference signal was extracted directly from the measured signal.
Within the frequency range of 65 Hz to 75 Hz, a signal amplitude corresponding to the rotor’s rotational frequency
was identified in the frequency response. Subsequently, the gear mesh frequency
was calculated using the following formula:
where
is the number of teeth (threads) on the worm shaft.
These frequencies are characteristic of rotating components and help identify potential mechanical issues. In the next step, the signal was averaged with respect to the rotor’s rotational frequency using the TSA method. This process suppressed noise and emphasized the recurring signal components associated with the rotor’s rotational frequency.
In the final step, the averaged signal was analyzed in the frequency domain, and its Power Spectral Density (PSD) was plotted, providing a detailed view of the dominant frequency components related to the rotor’s dynamics.
Statistical validation is incorporated by comparing TSA-processed results across OK and NOK samples. Power Spectral Density (PSD) analysis is used to assess vibration levels before and after experimental modification.
3. Experimental Analysis
The DC motor samples analyzed are part of an automotive sunroof system, driving a retractable sunroof rollo. The DC motor assembly shown in
Figure 4 includes an integrated gearbox with a gear ratio of 1:32 and an electric motor component comprising a worm shaft (7) operating at 4200 rpm, a core component, and a commutator with 8 metallic lamellae.
A permanent magnet is in the frame (1), which is flexibly connected to the motor housing (2). The sleeve bearing (9), which generates a radial reaction force RR2 on the rotor, is mounted in the motor housing on the gearbox side. The gearbox (8) is a screw-type transmission. Axial load on the rotor is transmitted via the engineering plastic (EP) bolt (6) on the gearbox side, which creates both an axial reaction force RA1 and a radial reaction force RR1. On the coil side, the end washer (4) applies an axial reaction force RA2. Additionally, the sleeve bearing (5) generates a radial reaction force RR3 on the rotor (3). The DC motor is secured to the sunroof system using three screws located near the gearbox in the motor housing.
Prior to the analysis, two potential sources of NVH were hypothesized: the gearbox and the rotor. Considering that the gear ratio is relatively high and thus unlikely to generate high-frequency NVH, the study focused on analyzing the rotor as a possible noise source.
Harmonic signals generated by the rotor are typically analyzed through direct displacement measurements using proximity probes mounted on the rotor’s housing. However, this approach is challenging due to the specific construction of the DC motor under study and the presence of a strong magnetic field, which can affect the accuracy of proximity probes. As a result, data collection using accelerometers was chosen instead.
3.1. Experimental Setup
Data collection was conducted using three different experimental configurations of accelerometer placements on the DC motor structure to enable a more detailed analysis of the assembly’s NVH characteristics. This variability in accelerometer placement provides a more comprehensive understanding of vibration amplitude distribution and facilitates the identification of specific vibrational characteristics of the structure.
Figure 5a illustrates the arrangement of accelerometers on the DC motor structure. Accelerometers were positioned at key points of the assembly: accelerometer A1 on the sleeve bearing near the gearbox side, accelerometers A2 and A3 on the frame near the second sleeve bearing, oriented vertically and horizontally, respectively, and accelerometer A4 in the axial direction near the end washer. This configuration allows for a thorough analysis of vibrations across the structure.
In the second experimental setup (
Figure 5b), two accelerometers were evaluated. Accelerometer A1 was placed in the axial direction on the rotor side near the EP bolt, while accelerometer A4 was positioned on the opposite side of the rotor near the end washer. This arrangement enabled more detailed measurements of shaft vibrations in the axial direction.
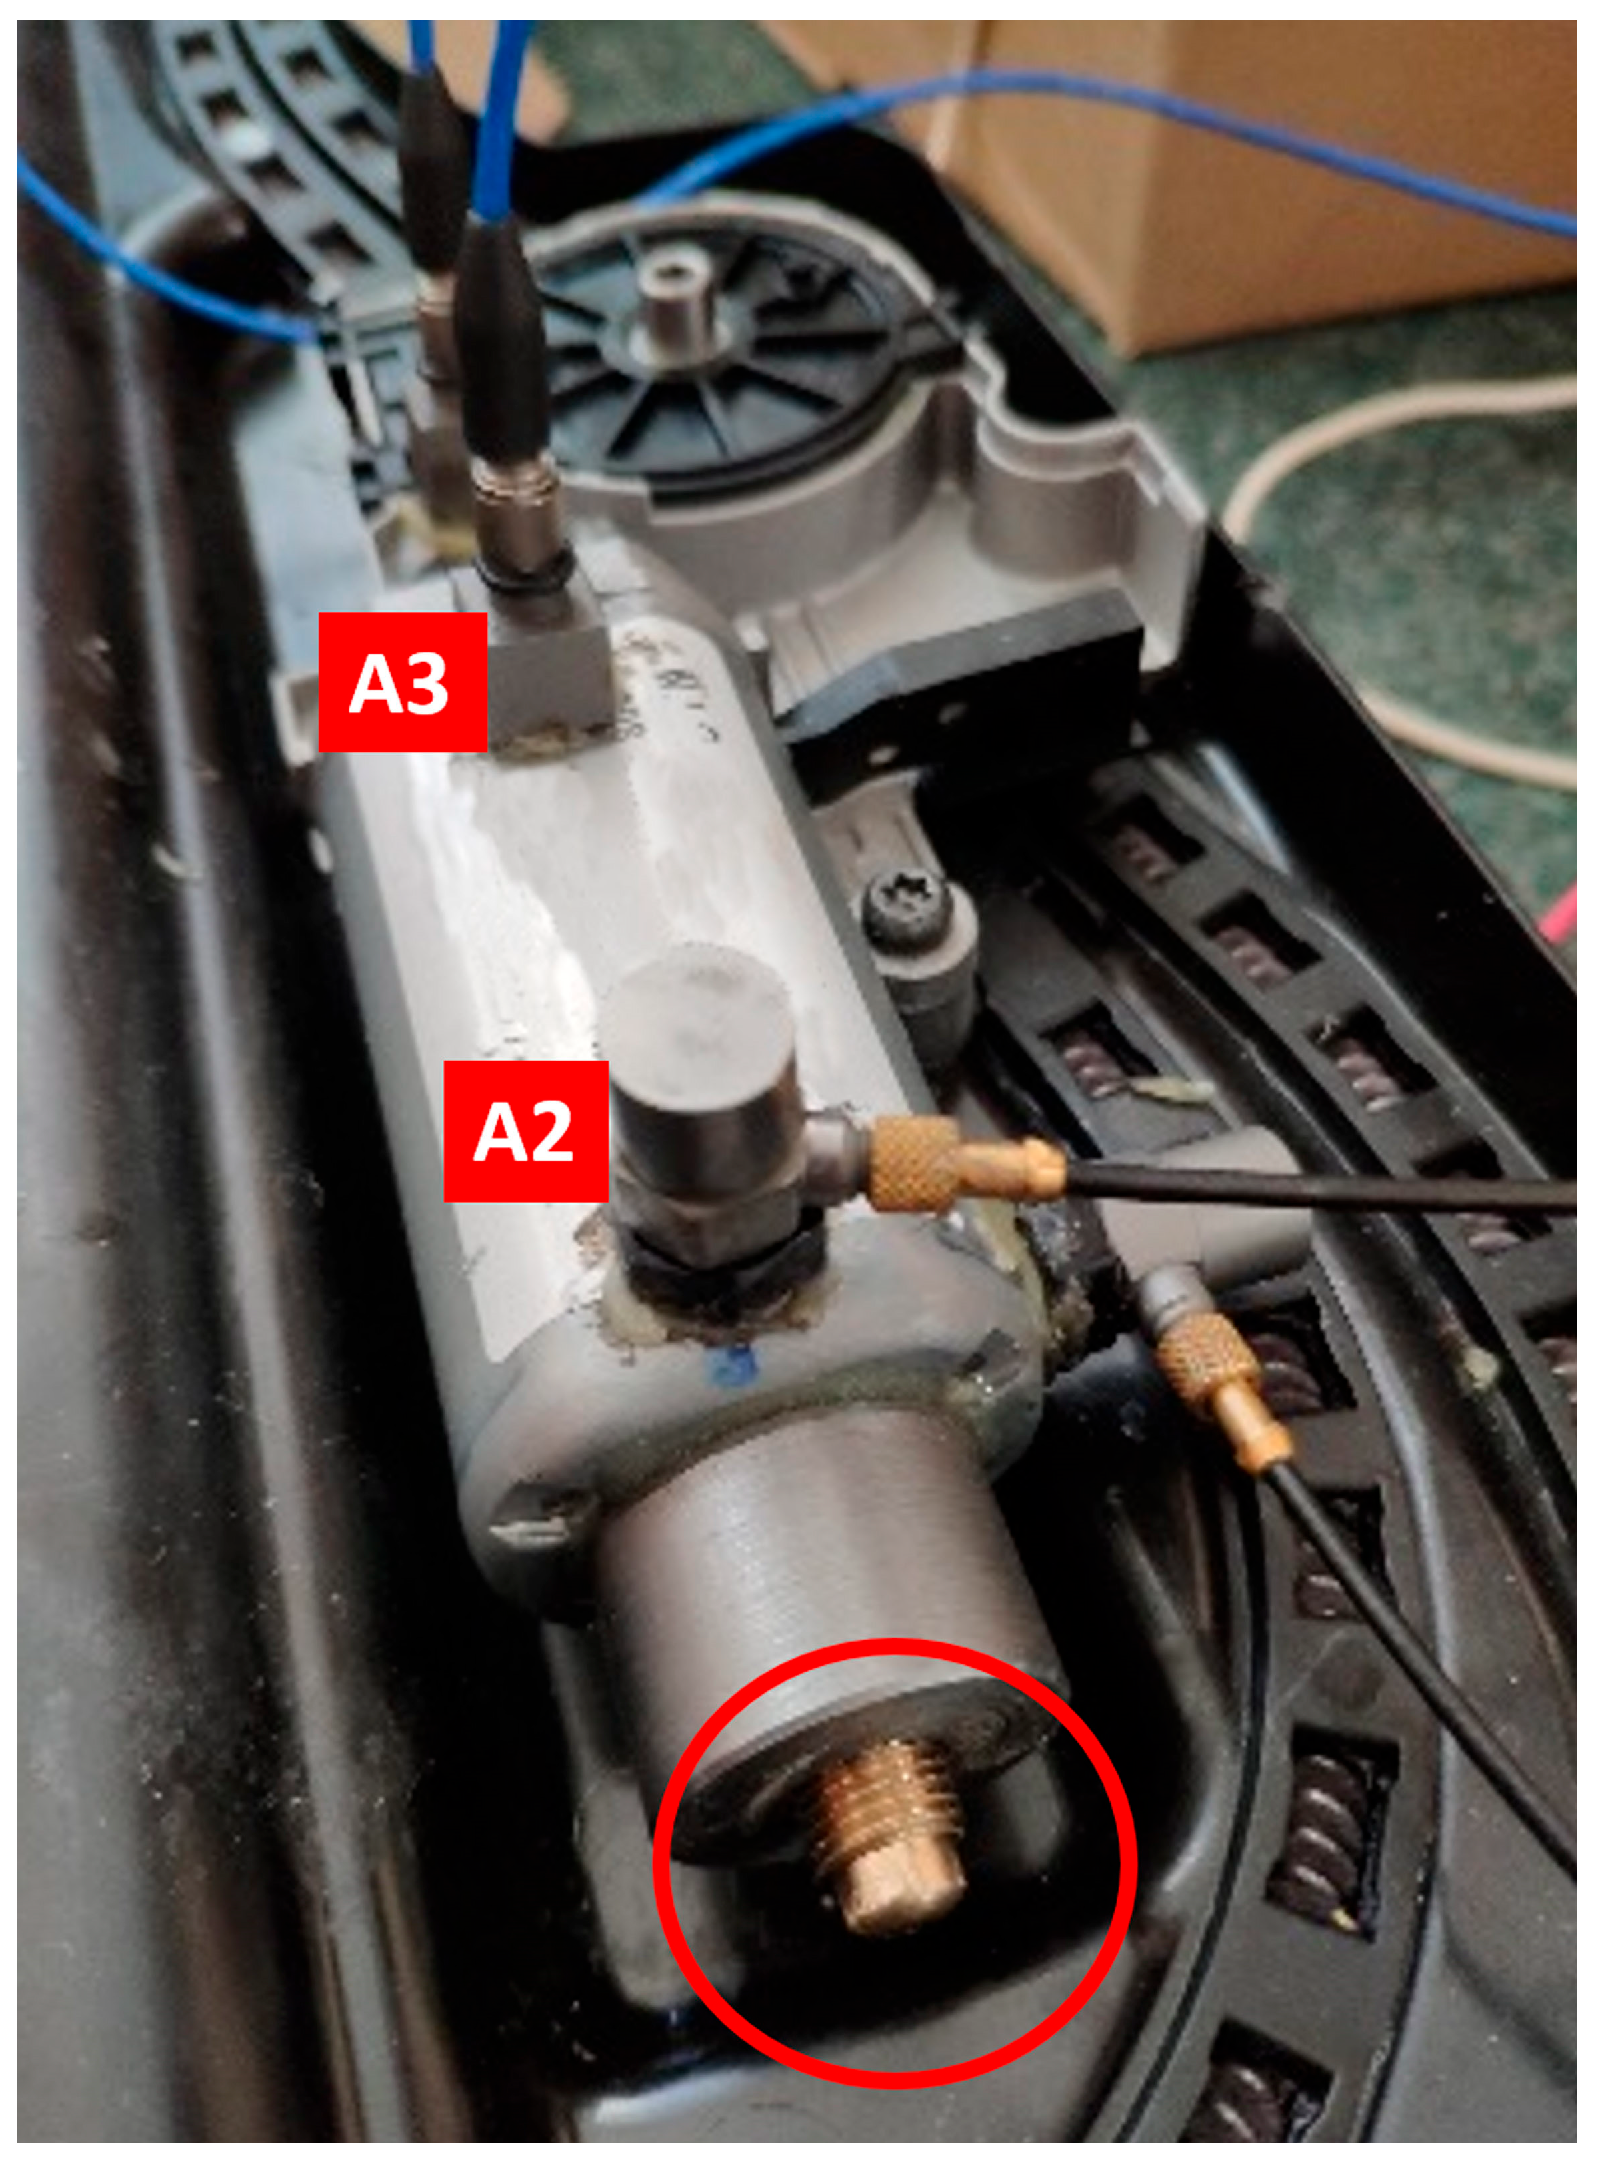
Figure 5c depicts the third experimental setup, where two accelerometers were mounted on the DC motor frame to better identify vibrations specific to the motor frame itself. One accelerometer was attached at the frame-housing connection, while the other was mounted elsewhere on the frame.
The samples were tested in two operating modes: opening and closing the sunroof rollo. The measurements revealed that significantly higher vibration amplitudes were generated in the rollo’s open state compared to the rollo’s closed state. Based on this observation, the analysis focuses exclusively on the rollo’s open state.
3.2. Data Collection and Processing
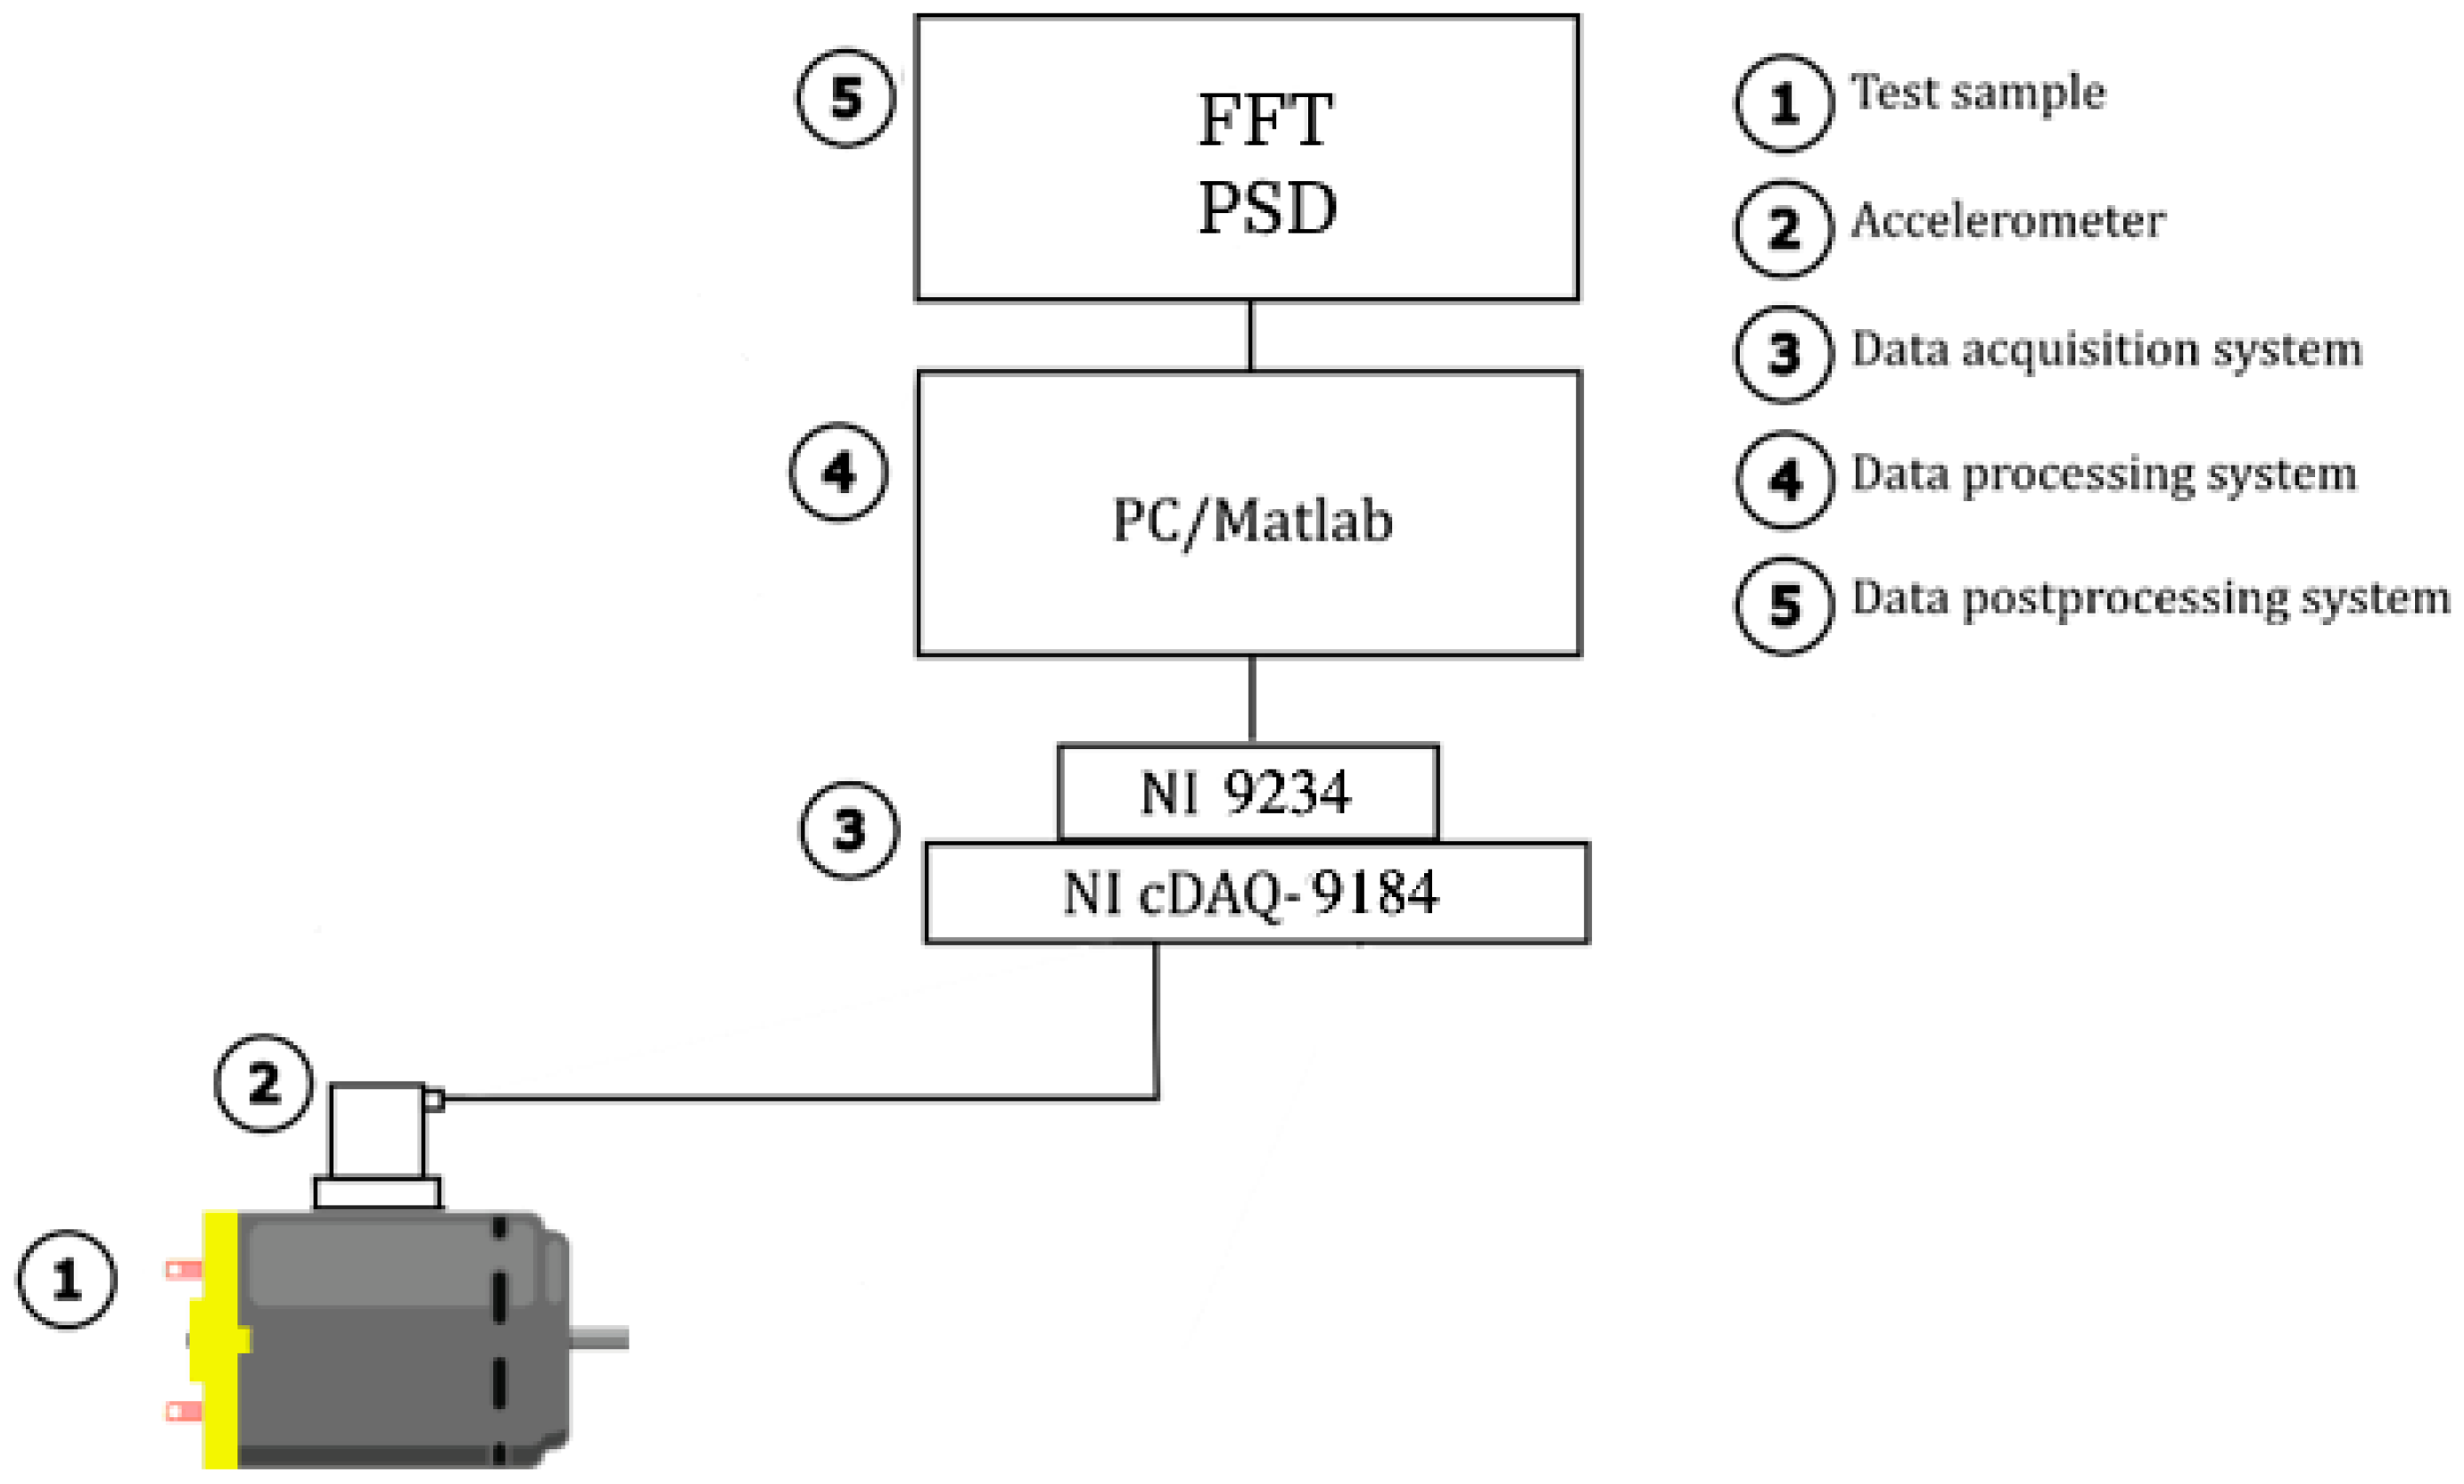
For data collection and analysis, the measurement chain illustrated in
Figure 6 was used. It consists of the tested DC motor (1), a stationary accelerometer (2) mounted on the test sample, a data acquisition system (3) comprising the NI 9234 data acquisition card (National Instruments, Austin, TX, USA) and the NI cDAQ-9184 chassis (National Instruments, Austin, TX, USA), a data processing system (4) utilizing PC/MATLAB R2020b, and a post-processing system (5) also using PC/MATLAB R2020b. The parameters of the components in the measurement chain are consolidated in
Table 1.
Although the roof window motor does not operate at a strictly constant rotational speed during opening, the variations are relatively small and arise naturally from changing load conditions throughout the cycle. Based on the manufacturer’s request, the analysis focused on the time interval during which the system exhibited the highest noise and vibration levels. This period occurred in the initial phase of the opening process, which is considered the most critical in terms of diagnostic sensitivity. The selection of this specific interval ensured consistent and representative vibration data for the purpose of TSA evaluation. Nevertheless, it is recognized that a more comprehensive assessment under varying speed conditions would further strengthen the robustness of the method, and such scenarios will be addressed in future work.
4. Results
For the purpose of this study, a total of 20 roof window units were provided by the manufacturer and categorized based on their internal quality control system into two groups: 10 samples conforming to quality standards (OK) and 10 samples identified as non-conforming (NOK). Each of these samples was subjected to vibration analysis using the Time Synchronous Averaging (TSA) method, aiming to detect characteristic vibration features and distinguishable differences between the two groups. Based on the TSA results, two representative samples were selected from each group (2 × OK and 2 × NOK). The selection was made to reflect typical signal behavior within each category, while also ensuring a clear contrast between the OK and NOK groups. This strategy enabled a more focused analysis of group differences, while acknowledging the need for expanded sampling in future studies to achieve higher statistical robustness.
The following chapter presents the PSD measured for OK and NOK samples. The OK group samples are labeled as OK-1 and OK-2, while the NOK samples are labeled as NOK-1 and NOK-2.
Section 4.1, Analysis of NOK Samples, presents the results of the analyses for NOK-1 and NOK-2 samples.
Section 4.2, Analysis of OK Samples, includes the results of the analyses for OK-1 and OK-2 samples.
4.1. Analysis of NOK Samples
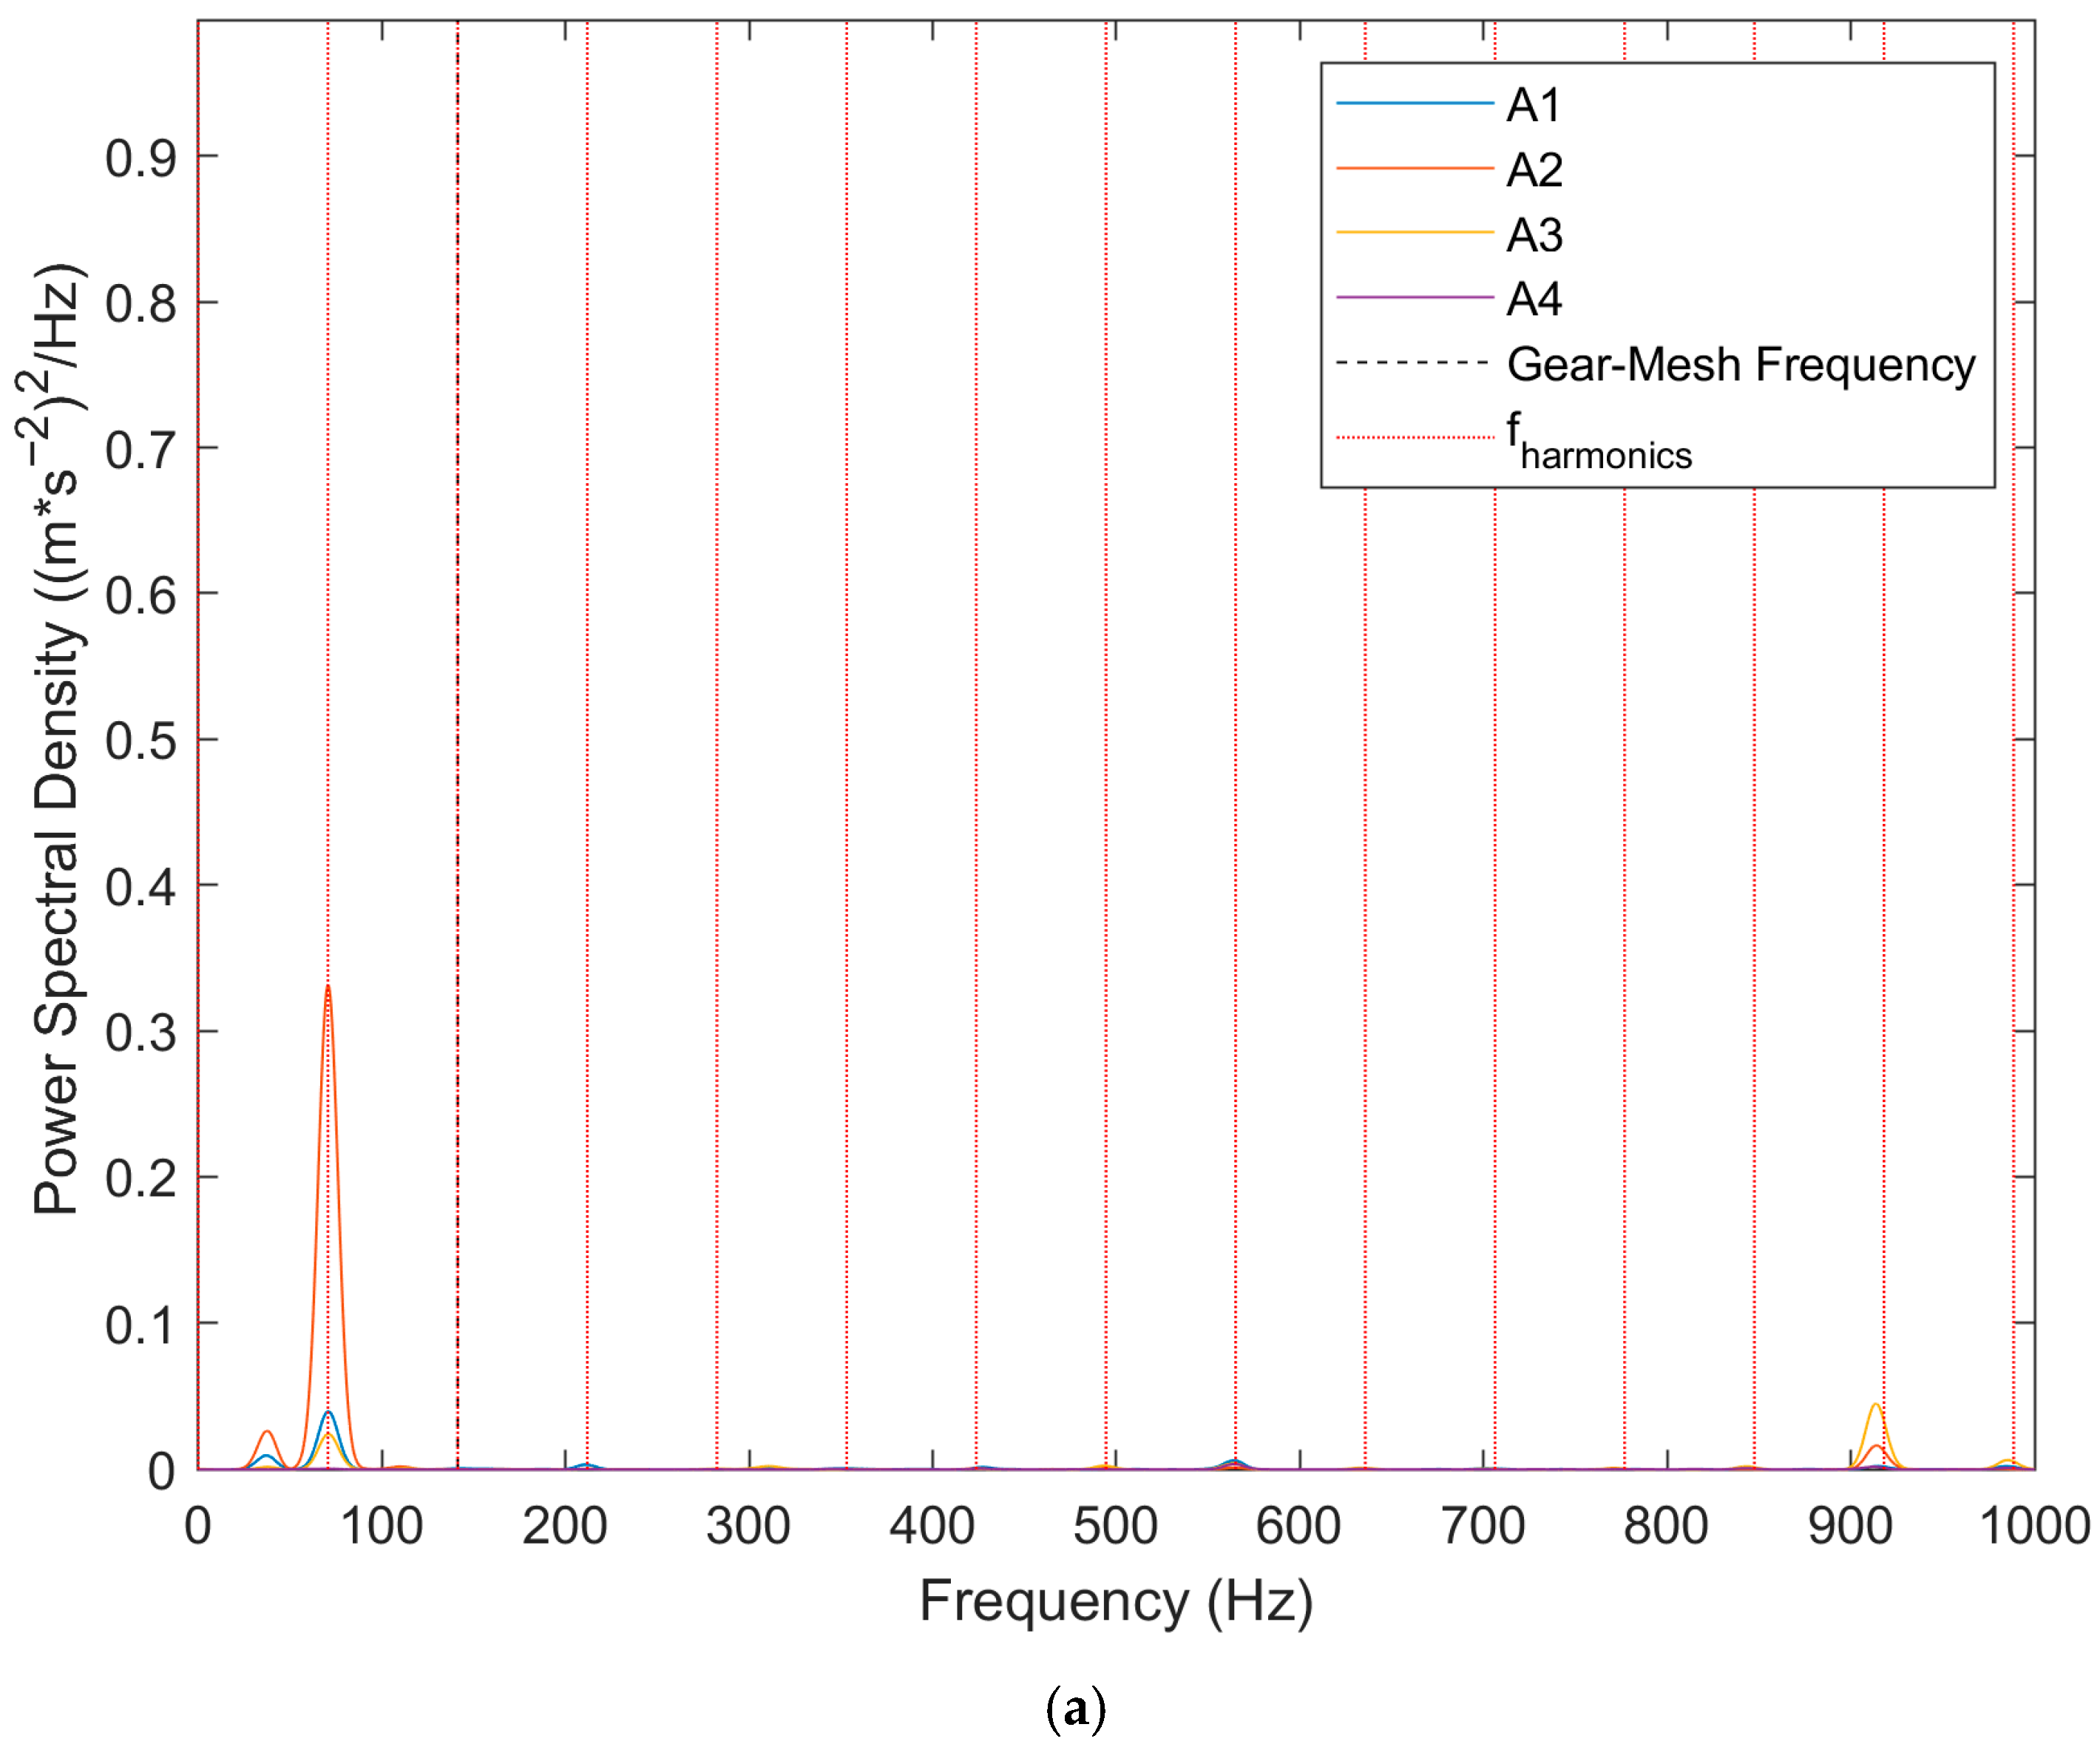
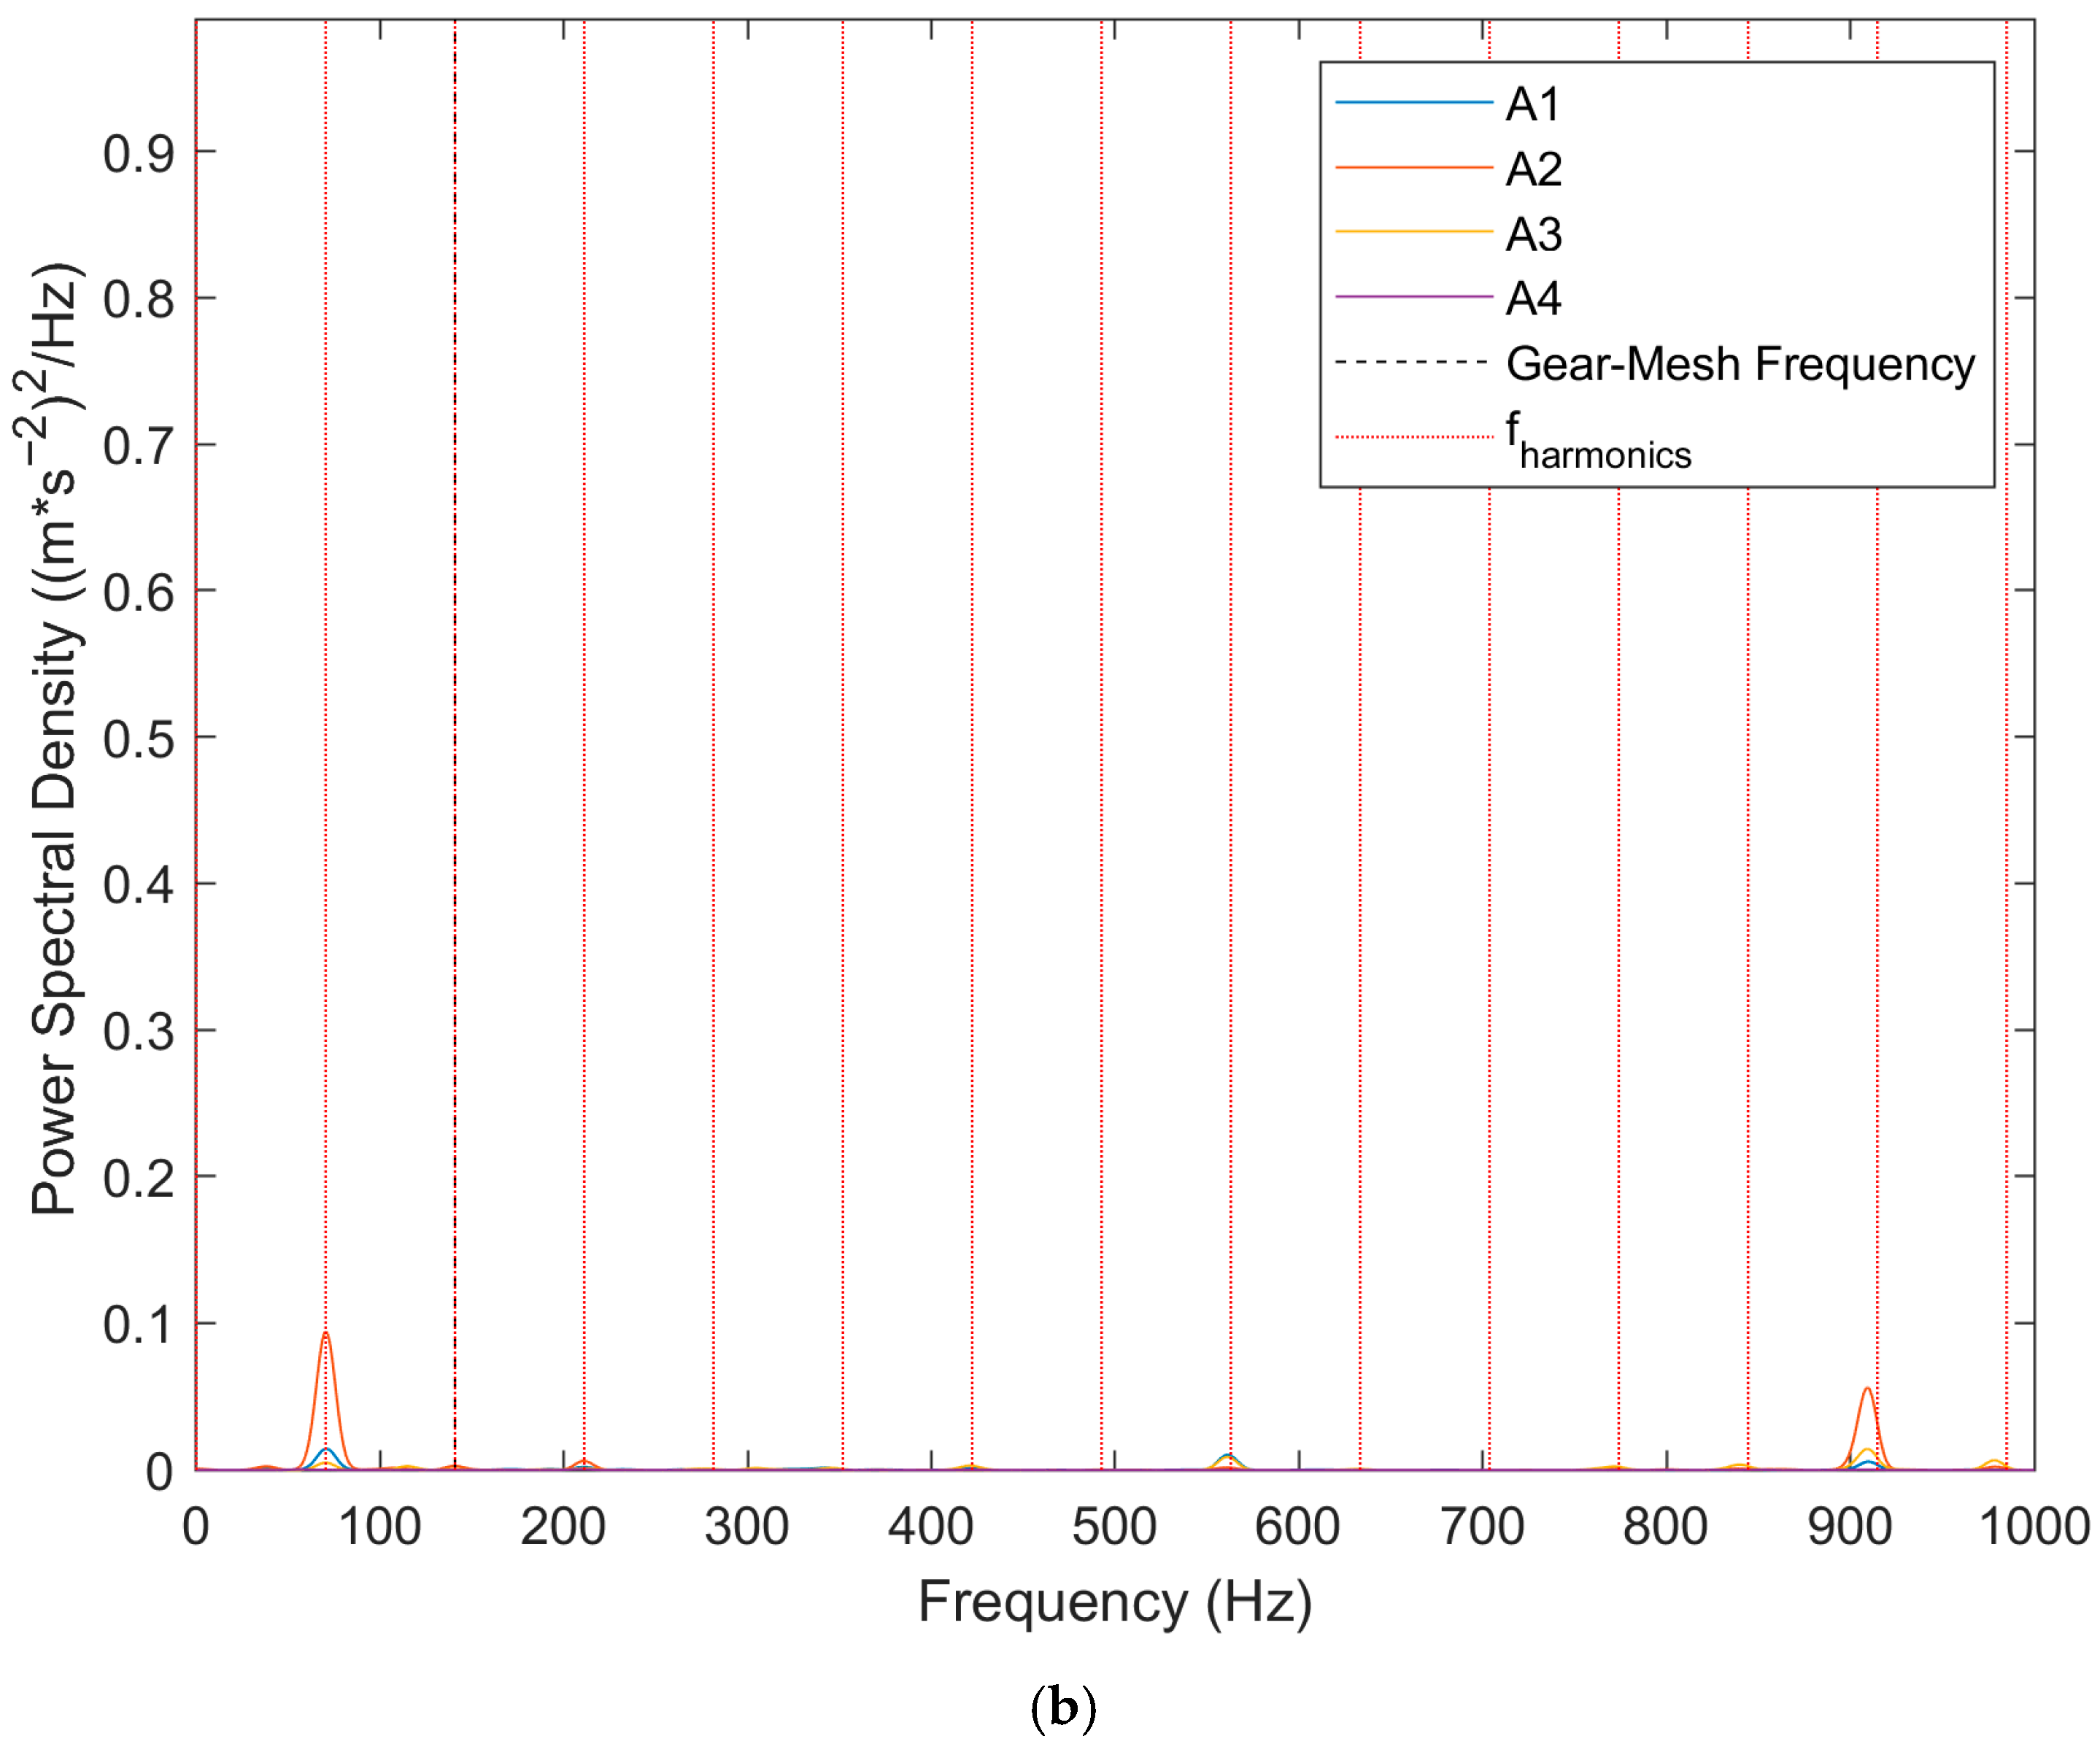
The following section analyzes the PSD amplitudes of accelerations measured for NOK-1 and NOK-2 samples. The measured data were processed using the TSA method. The graphs include not only spectral characteristics but also gear meshing frequencies and harmonic frequencies. The gear meshing frequency is 140 Hz, which corresponds to the product of the shaft’s rotational frequency and the number of teeth on the shaft. Harmonic frequencies are integer multiples or fractions of the rotor’s fundamental rotational frequency, which is approximately 70 Hz.
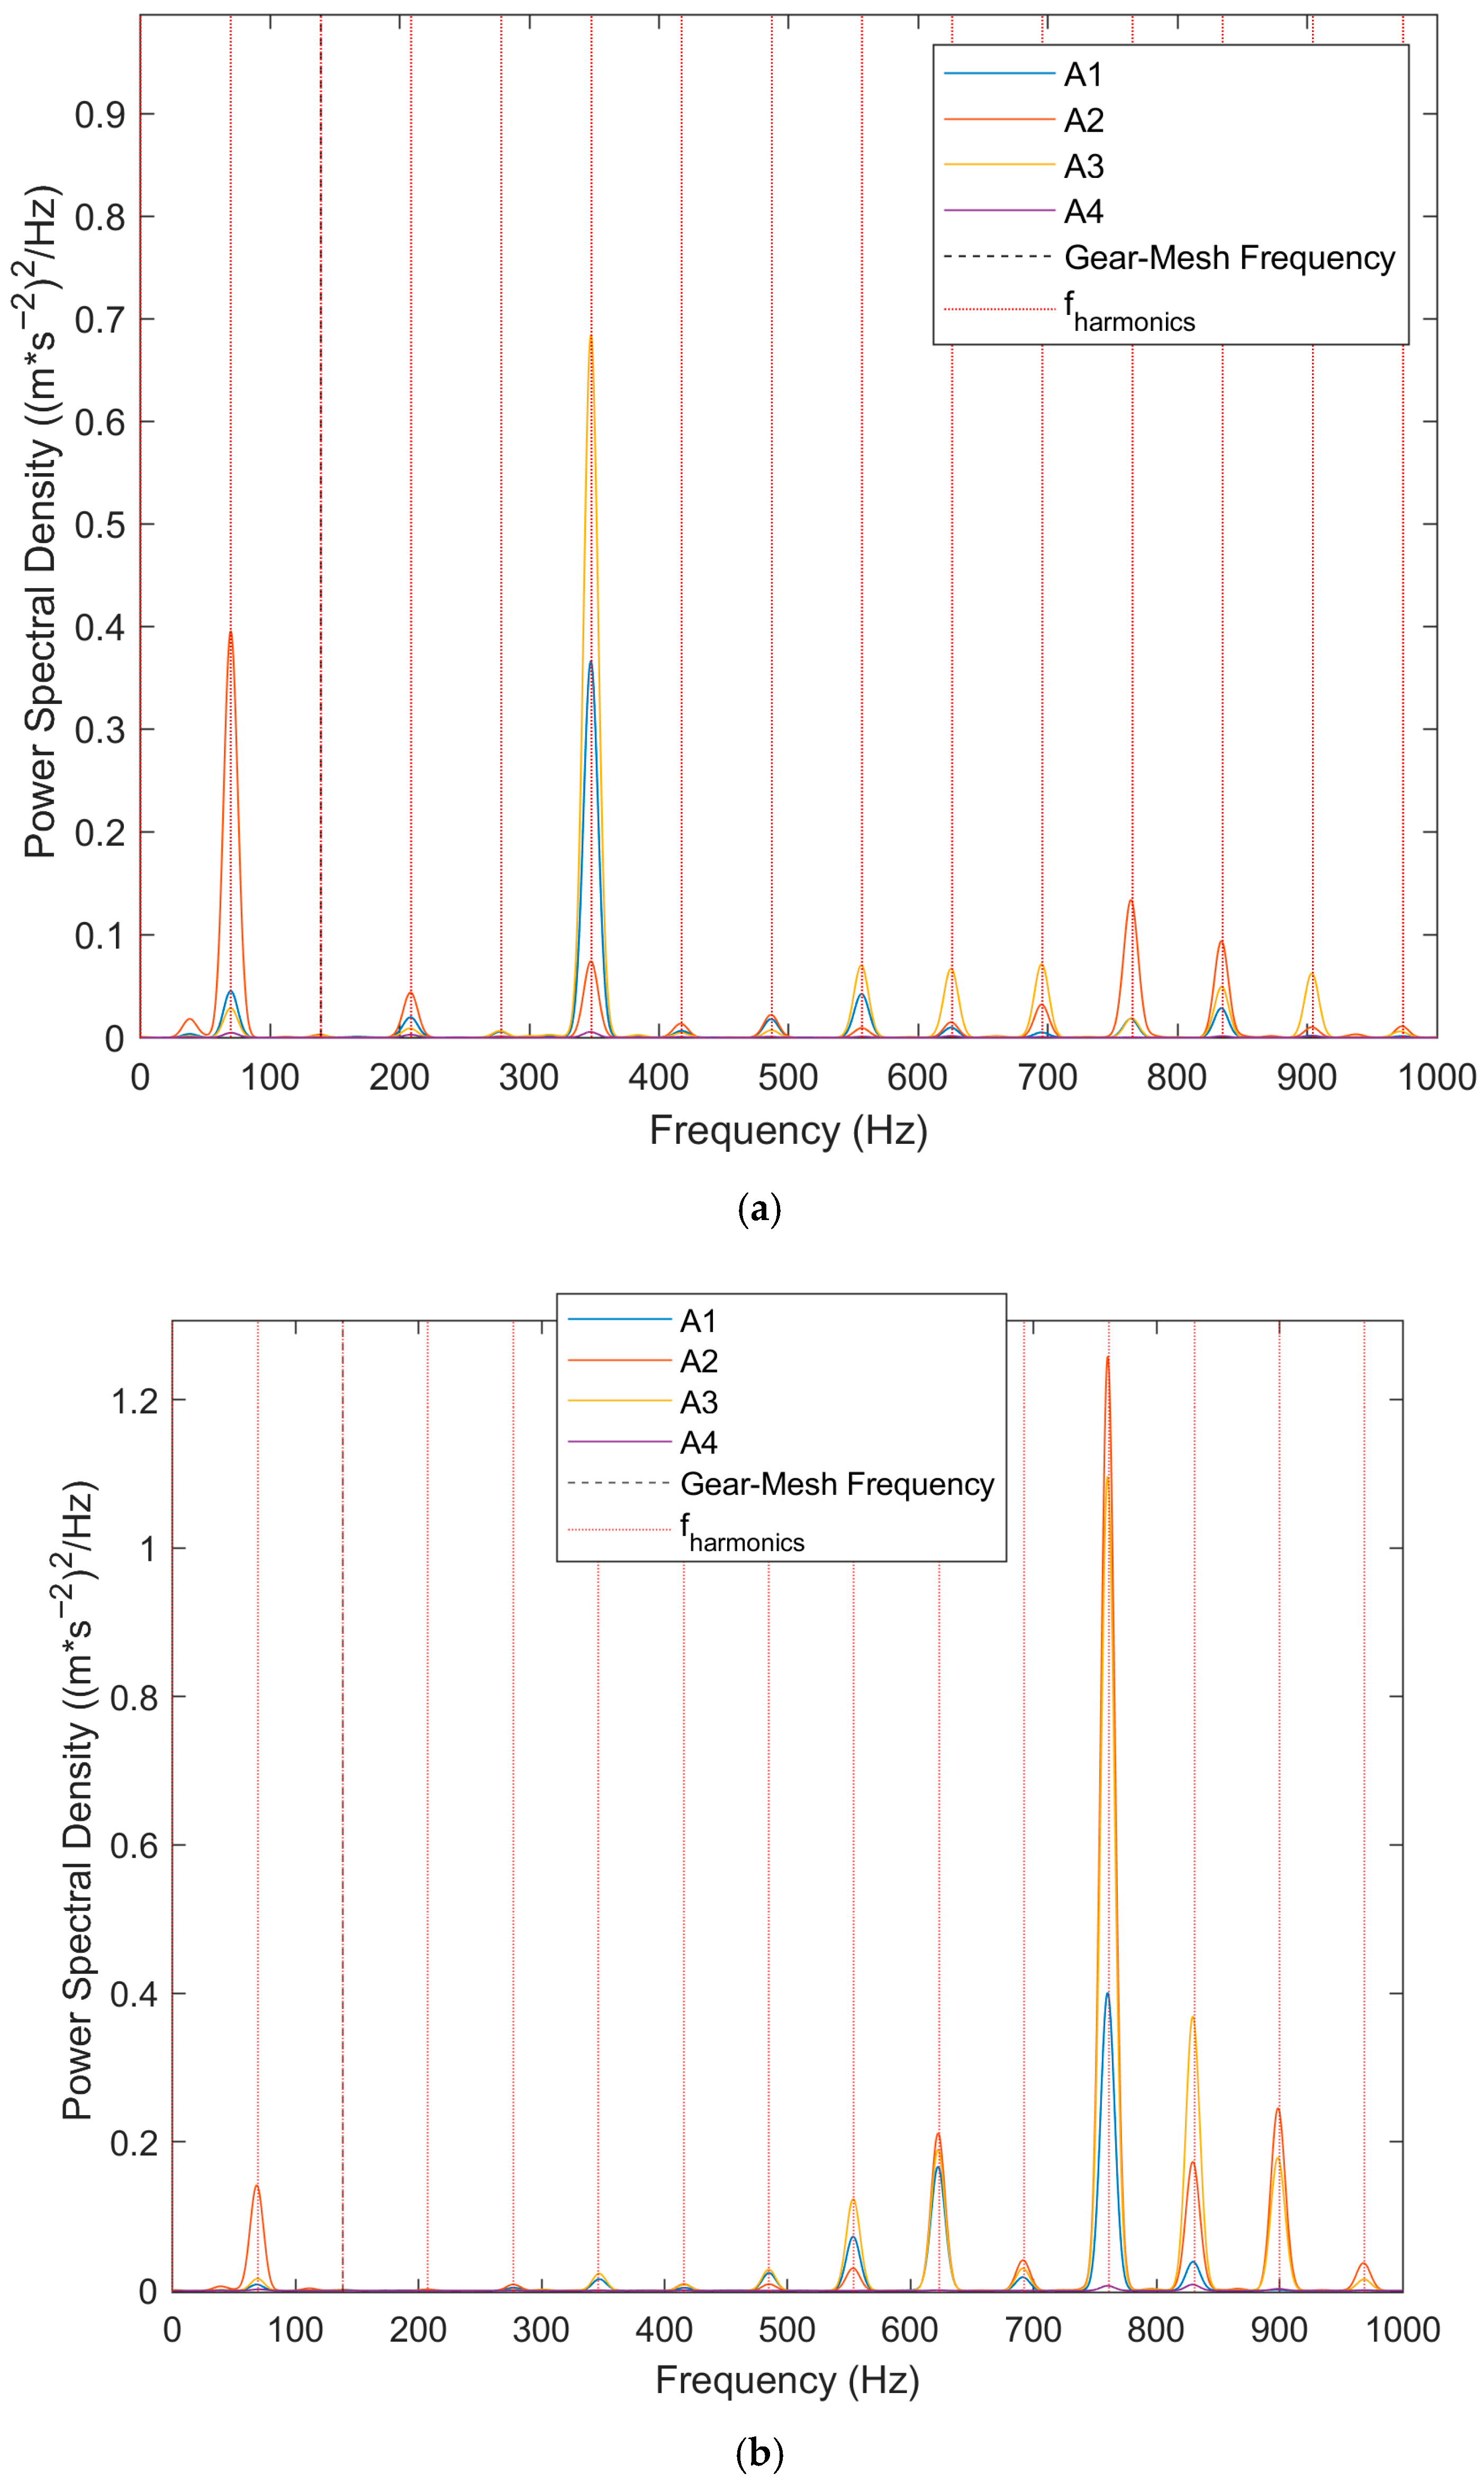
The results from Setup 1 are shown in
Figure 7, where the PSD of NOK-1 (
Figure 7a) reveals an increase in vibration power at the rotor’s rotational frequency, around 70 Hz. This elevated power likely relates to rotor imbalance, where centrifugal forces induce vibrations at the fundamental rotational frequency. Additionally, increased amplitudes at higher harmonics are observed, which may be linked to issues such as shaft misalignment or elevated friction in the bearings. Subharmonic frequencies below the fundamental frequency are also detected, potentially resulting from rotor motion within the sleeve bearings [
33].
The PSD results in
Figure 7a indicate that vibrations at the fundamental frequency at A2 (bearing (5)) are significantly higher than at A1 (bearing (9)). This can be attributed to the rotor’s mass distribution on the shaft, with the center of mass closer to bearing (5).
The PSD of NOK-2 (
Figure 7b) shows lower power at the rotational frequency, indicating a better-balanced rotor compared to NOK-1. Consequently, rotor imbalance can be ruled out as the primary source of noise in these samples. The main issue appears to be higher PSD values at higher harmonic frequencies, which may be associated with shaft misalignment [
33]. The highest RMS value for the NOK-1 sample on the A3 sensor reaches 4.2 m/s
2, while the RMS value for the NOK-2 sample on the A2 sensor reaches 5.7 m/s
2.
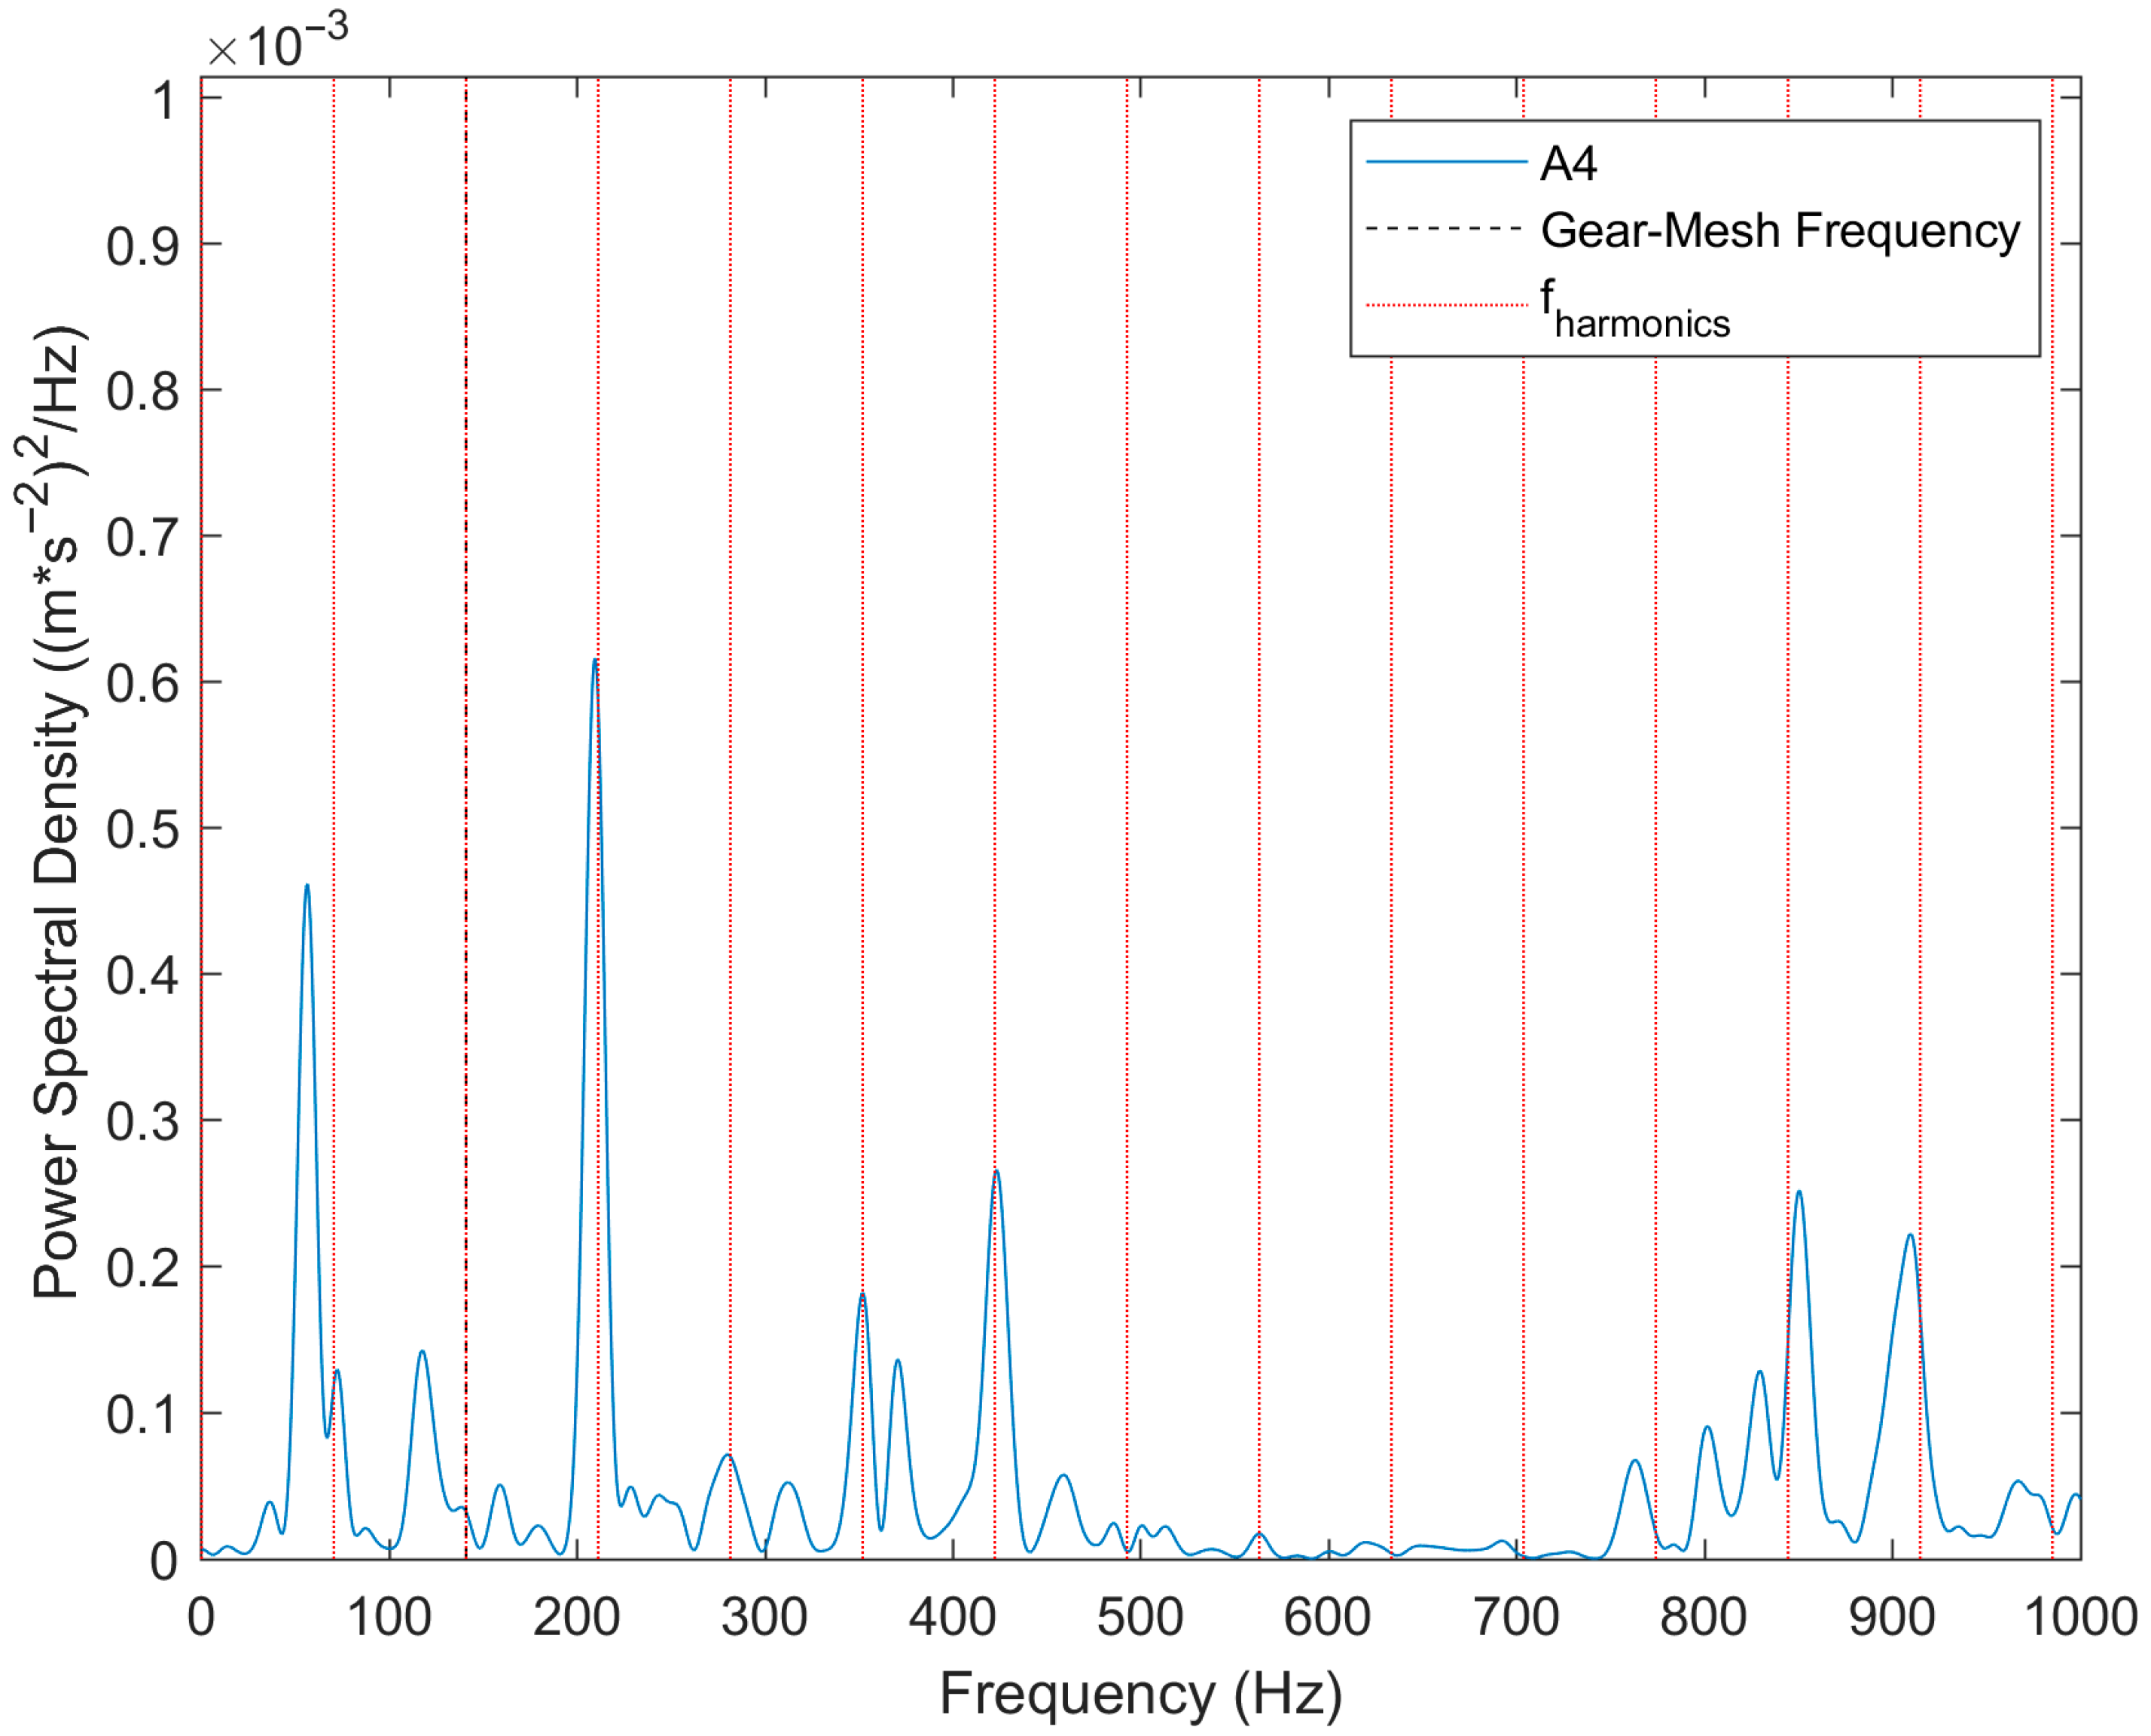
Figure 8 illustrates the PSD of axial vibrations for the NOK-1 sample, measured using accelerometers in Setup 2, positioned near the end washer and the EP bolt. The graphs reveal axial movement of the shaft, and a comparison with radial vibration amplitudes (shown in
Figure 7) indicates that the axial amplitudes are lower. Additionally, a correlation between sensors A1 and A4 is evident, suggesting potential lateral movement of the rotor in the axial direction.
Figure 9 illustrates the PSD for Setup 3 and the NOK-2 sample. The amplitudes measured at A3 are approximately half of those measured at A2, indicating that the area near the second bearing exhibits significantly higher vibration amplitudes.
The upper harmonics suggest a potential issue with rotor misalignment or increased friction in the bearings. Elevated vibration amplitudes in both the axial and radial directions near bearing 5 further support the hypothesis of rotor misalignment.
4.2. Analysis of OK Samples
Figure 10 shows the PSD for the tested OK-1 and OK-2 samples. These samples exhibit low power levels at the shaft’s rotational frequency as well as at upper harmonics. The OK-2 sample, whose PSD is depicted in
Figure 10b, demonstrates the lowest vibration amplitudes compared to the other samples analyzed. Although the tested samples passed the NVH tests conducted by the sunroof system manufacturer, there are significant differences in shaft dynamics among them. These differences highlight potential uncertainties in the manufacturing process or the axial preload adjustment of the shaft using the EP bolt. Such factors could influence the dynamic behavior of the shaft. The highest RMS value for the OK-1 sample on the A2 sensor reaches 2.3 m/s
2, while the RMS value for the OK-2 sample on the A2 sensor reaches 1.6 m/s
2. These values are significantly lower compared to the NOK samples, and based on them, it is possible to objectively distinguish between OK and NOK samples.
Figure 11 illustrates the dynamic performance of the shaft in the axial direction for the OK-2 sample in Setup 2. This sample exhibits significantly lower vibrations compared to the other tested samples. The comparisons indicate that low vibrations in the radial direction are accompanied by low vibrations in the axial direction.
It should be noted that all experiments were conducted at ambient room temperature, and the thermal effects on bearing friction or rotor dynamics were not considered. The short duration of the window opening process (a few seconds) and the focus on the initial motion phase minimized the likelihood of temperature-related influences. However, for systems exposed to longer operational periods or thermal gradients, temperature may play a more significant role, particularly in relation to frictional behavior and misalignment sensitivity. This aspect warrants further investigation in future studies.
6. Conclusions
This study highlights the practical application of the Time Synchronous Averaging (TSA) method for analyzing the NVH characteristics of DC motors used in automotive sunroof systems. The results demonstrate that TSA effectively isolates periodic signals, enabling accurate diagnosis of issues such as shaft misalignment and vibrations caused by dynamic components. Notably, the findings confirm that excessive noise and vibrations primarily originate from misalignment in the end washer rather than from rotor imbalance.
An experimental modification of the end washer significantly reduced vibration amplitudes at higher harmonic frequencies, reinforcing its impact on the overall NVH characteristics. This intervention achieved a 67% reduction in the acceleration RMS value, thereby validating the initial hypothesis and revealing opportunities for optimizing DC motor design to improve acoustic and vibrational performance.
Although direct cost data are often proprietary, implementing TSA-based diagnostics in mass production environments may lead to substantial cost savings by reducing false positive rates, improving fault isolation accuracy, and minimizing unnecessary part replacements. In systems such as sunroof mechanisms—where the end-user’s perception of noise quality is critical—enhanced diagnostics can improve customer satisfaction and reduce warranty claims. Compared to traditional FFT-based evaluation methods, TSA offers a more targeted and reliable analysis, especially when diagnosing mechanical anomalies in compact electromechanical devices.
This study highlights the practical application of the TSA method for analyzing the NVH characteristics of DC motors in automotive sunroof systems. In contrast to traditional FFT-based diagnostics, TSA isolates periodic components, enhancing fault detection even in systems with overlapping vibrational sources. The results demonstrate that TSA enables accurate identification of issues, such as shaft misalignment, which are difficult to diagnose using conventional techniques.
Furthermore, this study offers promising directions for future research. Expanding the application of TSA to other motor types, evaluating its scalability across different system configurations, and assessing the long-term effects of end washer modifications represent key areas of interest. Additionally, automating TSA-based diagnostics in DC motor manufacturing could further enhance NVH assessment and quality control. By leveraging TSA, more precise diagnostic tools and effective mitigation strategies can be developed, contributing to advances in both DC motor design and broader automotive applications.

