Article

Variability and Trends in Selected Seismological Parameters During Longwall Mining of a Coal Seam Disrupted by a Rockburst

1
Department of Geology, Geophysics and Surface Protection, Central Mining Institute—National Research Institute, 1 Gwarków Sqr., 40-166 Katowice, Poland
2
Polish Mining Group, Ruda Hard Coal Mine, 160 Halembska Str., 41-711 Ruda Śląska, Poland
3
School of Mining and Petroleum Engineering, University of Alberta, Edmonton, AB T6G 2R3, Canada
4
Faculty of Environmental Sciences, University of Silesia in Katowice, 60 Będzińska Str., 41-200 Sosnowiec, Poland
*
Author to whom correspondence should be addressed.
Appl. Sci. 2025, 15(16), 8897; https://doi.org/10.3390/app15168897
Submission received: 9 July 2025 / Revised: 6 August 2025 / Accepted: 11 August 2025 / Published: 12 August 2025

Abstract

Seismic tremors provide valuable insights into stress redistribution and accumulation, often serving as indicators of these processes within the rock mass, which can precede or accompany rockburst occurrences. Consequently, seismic monitoring is implemented in mines endangered by rockbursts to systematically assess the hazard conditions of mining openings. This study examines the variability and trends of selected seismological parameters, primarily the seismic energy of tremors observed during the longwall mining of the top layer of thick coal seam under challenging geological and mining conditions in an underground mine located in the Upper Silesian Coal Basin, Poland. The longwall mining operation was interrupted by a rockburst and subsequently discontinued. The analysis highlights both the cyclic variability and trends of seismological parameters, considering their dependence on extraction progress and temporal dynamics. The results indicate that mining progress is a significant factor influencing the stationarity of the seismic energy release process. It has been proposed that cumulative Benioff strain release is evaluated solely as a function of longwall face advancement. This illustrates the correlation between excavation progress and seismic energy accumulation. The trend analysis of this parameter, both over time and in relation to longwall face advancement, has also been conducted.

1. Introduction

Hard coal is a crucial energy resource, especially in regions characterized by robust industrial activity. Additionally, it is important to acknowledge coal’s transitional role in ensuring energy stability as countries shift toward renewable sources. One of the most important areas for hard coal extraction is the Upper Silesian Coal Basin (USCB) in Poland, where coal is mined from underground seams.
In the USCB, the longwall mining technique is typically employed due to its efficiency and high extraction capacity. In this method, a longwall shearer moves steadily along the coal face, cutting slices of coal. As the shearer progresses, the hydraulic roof supports are advanced in a coordinated sequence, enabling the roof behind to collapse in a controlled manner. Longwall mining involves specific safety challenges, particularly due to controlled roof collapses. This method is commonly used in deeper coal seams, where advanced roof support systems provide better safety compared to other underground techniques. Environmentally, longwall mining in hard coal mines often causes more significant land subsidence and ecosystem disturbance than, for example, the room-and-pillar mining technique, which leaves supporting pillars intact and thus reduces surface impacts.
Seismic activity is commonly observed during longwall mining of coal seams [1,2,3,4,5], including in mines located in the USCB [6,7,8]. The extraction process leads to significant stress redistributions within the rock mass, often manifesting as tremors. Among the particularly seismogenic factors are thick layers of strong rocks (e.g., sandstone), deposited in the roof of mined coal seam and local tectonics. In addition to these geological factors, a significant mining factor is represented by the edges of previously extracted seams. These boundaries between the goaf (mined-out zone) and unmined coal often experience displacement, high stress concentration, and are intersected by structural discontinuities. These features can cause such boundaries to behave like induced faults, and the boundaries are prone to reactivation by ongoing mining activities.
Hard coal mining under challenging geological and mining conditions is often associated with increased seismic activity and the occurrence of rockbursts. A rockburst is a sudden and violent failure of coal (or rock) that results in the ejection of material into underground workings. Rockbursts can cause significant damage or even the complete destruction of these workings. The rockburst hazard in underground mines is strongly correlated with the recorded seismicity. Seismic hazard analysis can be used to improve underground mine planning [9].
Seismological parameters can be applied using both probabilistic and deterministic approaches. In the probabilistic framework, statistical models analyze historical seismic data to estimate the likelihood and potential magnitude (energy) of future events over extended time periods. Probabilistic methods are frequently applied in civil engineering, especially for different types of structural evaluations and hazard forecasting [10,11]. In contrast, the deterministic approach involves continuously monitoring the evolution of parameters to identify critical thresholds that signal an imminent strong tremor or rockburst. In this article, the deterministic aspects of seismological parameters are considered. The potential of seismological parameters to serve as early-warning indicators for hazardous events such as strong tremors and rockbursts has garnered significant attention in mining seismology. Detailed monitoring of metrics, such as tremor frequency and seismic energy, along with the calculation of related parameters (e.g., Benioff strain, b-parameter of the Gutenberg–Richter relation), provides insights into the stress distribution and structural integrity of the rock mass. Changes in these parameters can reveal precursory signs of accumulating strain or destabilization. Mining-induced seismicity in underground mines arises from complex stress redistributions caused by continuous excavation.
Although time-dependent seismological parameters are invaluable in tracking the transient evolution of seismicity, the parameters directly linked to the progress of mining operations—such as extraction volumes, production rates, and the advancement of excavations—also play a significant role in influencing stress changes and rock mass stability, making them reliable indicators of mining-induced seismic hazards and rockburst potential. Therefore, in certain cases, integrating seismological data with operational parameters provides a more comprehensive understanding of the dynamic processes occurring within the rock mass, enabling improved prediction and management of seismic risks associated with mining activities. Below are studies predominantly conducted in hard coal mines, and also in ore mines, exploring the use of seismological parameters as early indicators of strong tremors or rockbursts.
Key seismological parameters—such as event magnitude, energy release, and frequency distribution—have been found to directly reflect changes in stress induced by mining activities in an ore mine [12]. Prior to rockbursts in a silver and zinc mine, a distinct pattern in seismological parameters was noted, i.e., seismic activity increased rapidly and then dropped suddenly [13]. Stress redistribution in mining zones influences tremor frequency and magnitude, making b-value trends a potential precursor for seismic hazard assessment in a hard coal mine [14]. Distinct anomalies in seismological parameters, such as event frequency, magnitude distribution, and energy release, were identified as precursors associated with mining-induced seismicity in longwall coal mining [15]. A quantitative evaluation demonstrated that a pronounced decline in the b-value, combined with accelerated event rates and a marked surge in seismic moment, was correlated with mining-induced stress redistribution and delineated critical thresholds preceding hazardous seismic episodes [16]. It was found that zones of high seismic velocity exhibit intense microseismic activity and maximal stress drops in ore mines [17]. A non-random clustering of events was found to occur before major tremors in a nickel mine, and fractal dimension analysis revealed an increase in spatial non-randomness prior to significant seismic events [18]. In an analysis of time-dependent mine seismicity, irregularities in event clustering and frequency shifts were identified, suggesting that temporal fluctuations in seismic activity may serve as potential precursors to hazardous tremors and underscoring the importance of continuous monitoring for improved seismic hazard assessment in gold mines [19]. Key seismological parameters—including reductions in b-values, increases in cumulative energy release, and variations in stress drop—have been shown to reliably serve as precursors to rockbursts and strong tremors in underground gold, coal, and copper mines [20]. Dispersion of tremor epicenters near mining operations in a coal mine was analyzed by quantifying the directional coefficient of a linear fit and its corresponding root mean square error, which together captured the temporal trend and spread of seismic activity [21]. Systematic variations in mining parameters, such as ore tonnage extracted, combined with seismological indices like seismic energy release and event frequency, have been identified as reliable premonitors of rockbursts in a gold mine, with the established linear empirical relationships between these parameters forming the basis of a deterministic model that enhances their forecasting and mitigation in mining environments [22]. Variations in event clustering, cumulative energy release, and scaling properties of seismicity (e.g., fractal dimensions) have been demonstrated to serve as reliable precursors to larger seismic events in a nickel mine [23]. Seismological parameters, such as radiated energy, are established as critical precursors to hazardous rockbursts, with subtle changes in these indicators revealing stress accumulation and early transitions from elastic to inelastic deformation that enable timely hazard mitigation in underground gold mines [24]. Fluctuations in b-values and stress transfer mechanisms have been confirmed as precursors to hazardous tremors in coal and copper mines [25]. It was investigated that seismic activity closely follows mining operations, with localized stress redistribution and shear failure mechanisms near longwall faces [26]. Variations in key seismological parameters, including power-law size distributions (b-values), cumulative seismic potency, and scaling relationships linking seismic energy to source potency, have been shown to reliably serve as precursors to rockbursts and hazardous seismic events in gold mines, and integrating these dynamic metrics with mining production data, such as volume mined, establishes objective thresholds that capture evolving stress conditions [27]. The microseismic frequency spectrum exhibits a distinct evolutionary pattern preceding roof fall-induced rockbursts in coal mine, in which the dominant frequency components gradually shift toward lower frequencies as the roof begins to fail, reflecting the progressive accumulation and coalescence of fractures in the rock mass [28]. New criteria for assessing seismic and rockburst hazards in coal mines have been developed based on the continuous monitoring of key seismological parameters—such as the spatial distribution of events, seismic energy, Gutenberg–Richter b-value, seismic energy index, seismic moment, and weighted peak particle velocity—and the analysis of these parameters in moving time windows to detect deviations from their average values, thereby enabling the precise identification of high-risk zones [29]. An analysis of the evolution of in situ stress during hard coal longwall mining in high rockburst risk areas reveals that abrupt increases in mining-induced stress are closely linked with surges in microseismic event rates and energy releases, indicating a buildup toward dynamic instability [30]. Distinct changes in key statistical parameters—including continuous increases in cumulative Benioff strain and an initial rise followed by a drop in the b-value—consistently manifest in the temporal and spatial characteristics of mine seismic sequences prior to large induced seismic events in a nickel mine [31]. Cumulative Benioff strain release exhibits power-law acceleration prior to large mining tremors in underground coal mines, serving as a reliable precursor to hazardous seismic events. Quantitative scaling relationships based on parameters such as the m-value and critical search radius provide effective diagnostic criteria for early warning and risk mitigation in mining-induced seismicity [32]. A mining-induced seismic event in an underground coal mine—characterized by distinct seismological parameters such as source location and focal mechanism—was immediately followed by rapid ground deformation and a subsequent massive collapse [33]. A back analysis of five short-term seismic hazard indicators—namely Seismic Activity Rate (SAR), Cumulative Seismic Moment (CSM), Energy Index (EI), Cumulative Apparent Volume (CAV), and Seismic Apparent Stress Frequency (ASF)—was conducted for 14 damaging seismic events in an iron ore mine [34]. Real-time microseismic monitoring was integrated with numerical simulations, artificial intelligence, and big data analytics to identify subtle precursor signals—such as changes in microcrack activity—that reliably indicate an imminent rockburst in a coal mine [35]. Deviations between observed and predicted radiated seismic energy, normalized by excavated rock volume, have been demonstrated to act as reliable precursors to the transition from elastic to inelastic deformation, while concurrent variations in Benioff strain and seismic source volume further substantiate this shift and provide robust parameters for early-warning and hazard assessment in mining operations in a coal mine [36]. Advanced microseismic monitoring in a typical island working face has been shown to effectively forecast rockbursts in a coal mine, as the spatial–temporal analysis of microseismic events—focusing on key parameters such as energy release, frequency shifts, and event clustering—reveals detectable anomalies that serve as precursors to rockburst occurrences [37]. In longwall mining, the expansion of the goaf area results in the initial and periodic fracturing of the super-thick overlying strata, leading to an abrupt release of stored elastic energy and the subsequent occurrence of strong mining tremors [38]. Local geological characteristics—such as lithology and rock mass discontinuities—combined with structural factors and drift segmentation metrics have been correlated using multivariate factor analysis to deterministically evaluate their influence on seismic intensities from development blasting in deep, high-stress ore mining [39]. A statistically significant microseismic silent period—defined as a transient interval exhibiting a marked reduction in seismic event frequency—was identified as a diagnostic precursor to delineate high-risk zones in a coal mine [40]. A method for predicting rockbursts, which employs a temporal trend test on cumulative seismic and geomechanical parameters, was proposed and applied in a hard coal mine, wherein the detection of a statistically significant microseismic silent period delineated precursory signals of imminent rockbursts [41]. Three key geotechnical seismic precursors—namely, the nucleation of dense microseismic event clusters within hard strata, a critical peak in front abutment pressure, and an unstable stage in the strain curve—collectively indicate the imminent release of accumulated strain energy as strong tremors in a coal mine [42]. Moreover, parameters such as microseismic moment tensors were examined alongside probabilistic methods like dynamic Bayesian networks to analyze rockburst mechanisms and develop effective warning systems [43]. Deep neural networks and spatio–temporal clustering were used to automatically assess rockburst and seismic hazards based on seismic data, enabling statistical identification of high-risk areas [44]. Spatial and temporal parameters between seismic events were combined with a modified Gutenberg–Richter distribution to analyze aftershock cascade sequences in longwall coal mines [45].
This article investigates various seismological parameters pertinent to the longwall mining of coal seam No. 504 in the Bielszowice part of the Ruda Hard Coal Mine, located in the USCB. The extraction of the selected 001z longwall panel in the north-western part of the mining area was conducted under complex geological and mining conditions. It was accompanied by significant seismic activity and ultimately terminated prematurely due to a rockburst. In the article, a retrospective (back) analysis of seismological parameters was conducted with full knowledge of how the analyzed exploitation ended. This approach enabled a deeper understanding of the seismic behavior observed during the mining process and provided insights into the factors that influenced the final outcome of the operation.
The article examines the variability and trends of key seismological parameters, i.e., the number of tremors and seismic energy, along with other related metrics (e.g., specific seismic energy, average seismic energy, seismic energy per meter of longwall face advance). The parameters were analyzed in discrete time intervals and/or in cumulative form, allowing for a detailed exploration of their trends and providing insights into the cyclicity and evolution of seismic activity under different mining conditions.
Moreover, the evolution of cumulative parameters was determined both over the duration of mining operations and as a function of longwall face advance or extraction volume. This approach enabled a comprehensive assessment of seismic activity trends by linking them to operational factors that influence underground stability. Notably, longwall face advance is one of the key parameters affecting the stochastic nature of the process, with its variability playing a crucial role in shaping seismic activity and determining stability conditions within the mining environment.
This study explores the possibility that longwall face advancement may be a key factor influencing seismic energy release and stress redistribution in the rock mass. It further considers that advancement-based models could provide a more precise framework for identifying precursory trends leading to rockbursts, potentially offering more consistent insight into the spatial and temporal evolution of strain than traditional time-based analyses. A novel approach establishes a direct correlation between cumulative Benioff Strain Release (BSR) and longwall face advancement. Instead of relying solely on traditional time-based analysis, this method links seismic energy release directly to the active progression of the longwall face. It assumes that mining-induced seismicity is a dynamic response to excavation activities, wherein every increment of longwall face advancement triggers stress redistributions within the rock mass. Additionally, a trend analysis of cumulative Benioff strain release has been conducted, considering variations over time and longwall face advancement.
The relationship between seismological parameters—particularly Benioff strain release—and mining operations, especially longwall face advancement, under complex geological conditions, was investigated. This study highlights the importance of directly linking cumulative Benioff strain release to mining progress. Such an approach provides a practical understanding of stress accumulation and rockburst precursors, thereby contributing to improved risk management strategies in underground coal mining.

2. Materials and Methods

2.1. Geological and Mining Conditions

The 001z longwall panel in the top layer of the coal seam No. 504 (referred to as the coal seam No. 504tl) was designed in the north-west part of the Ruda mining area, Ruda Śląska, Poland. Excavation of the 001z longwall panel in the coal seam No. 504tl was conducted up to a height of 3 m using the transverse system with the caving of roof rocks. The longwall face advanced from south to north (Figure 1a). The width of the 001z longwall panel was up to 252 m. The planned length of the longwall panel was 750 m, but it was never reached because of a rockburst which occurred in this area (Figure 1a). The longwall panel was located at a depth ranging from 657–661 m b.s.l. at the start of mining to 550–558 m b.s.l. where mining was planned to end (Figure 1a). The land surface in this part of the mining area is approximately 230 m a.s.l. The longitudinal inclination of the 001z longwall ranged from 0° to 10°, while the transverse inclination ranged from 0° to 15°. The thickness of the coal seam No. 504 within the longwall panel 001z varied from 7.8 to 9.1 m. Due to the mining of the top layer of the thick coal seam No. 504, a coal layer with a thickness ranging from 4.8 to 6.1 m was left in the floor. The extension of the layers in the analyzed area was from ENE–WSW to E–W, with dip angles ranging from 0° to 15° (in areas of local faults, even to 18°). Local faults with throws ranging from 0.6 to 3.5 m were present in the central and northern parts of the 001z longwall panel.
According to the geological profile from the borehole drilled in the area of the 001z longwall panel (Figure 1b), the thickness of the coal seam No. 504 is 7.8 m. In the roof of the coal seam No. 504, layers of shale, sandy shale, and sandstone are deposited alternately. The thickness of these rock layers ranges from 0.1 to 2.4 m. At a distance of 10.3 m above the roof of the coal seam No. 504, a thin coal seam No. 503 (0.7 m) is deposited (Figure 1b). Approximately 32 m above the roof of the coal seam No. 504, sandstone layers are deposited with a total thickness of 39.4 m (Figure 1b). Among them, there are layers of other rocks, such as 3 m of conglomerate, 3.9 m of sandy shale, and 0.2 m of shale. At a distance of 82.8 m, the coal seam No. 502 with a thickness of 1.3 m is deposited (Figure 1b). Above it, layers of sandstone are deposited with a total thickness of 23.2 m, followed by a layer of shale (0.5 m), the coal seam No. 501 (1.45 m), and additional sandstone layers with a total thickness of 10.8 m (Figure 1b). The following rocks are deposited in the floor of the coal seam No. 504: 0.3 m of sandy shale, 0.2 m of shale, the coal seam No. 505/1 (0.5 m), 0.9 m of shale, and 3.6 m of sandstone (Figure 1b). The average uniaxial compressive strength, based on measurements taken with a borehole penetrometer, ranged from approximately 46 to 52 MPa for the roof rocks and from 14 to 42 MPa for the floor rocks, including the coal in the bottom layer of seam No. 504. Additionally, laboratory tests have shown that sandstones in this part of the mine reach maximum uniaxial compressive strength values exceeding 80 MPa.
Historically, the extraction of adjacent coal seams was conducted both above and below the 001z longwall panel in the coal seam No. 504tl. The coal seam No. 416 (approximately 220 m above the 001z longwall panel) and the coal seam No. 501 (approximately 100 m above the 001z longwall panel) were extracted in total. This exploitation occurred approximately 29–37 and 39–46 years prior to the start of the mining of the 001z longwall panel, respectively. The thickness of the coal seam No. 416 was approximately 2.7 m. The thickness of the coal seam No. 501 ranged between 1.1 m and 2.5 m. Given the vertical distance between the extracted adjacent coal seams and the coal seam No. 504, as well as the temporal interval since the extraction activities, it is improbable that the coal seam No. 504 has experienced a destress effect. Coal seams Nos. 418 and 502 were thinned above the 001z longwall panel (thickness below 1 m), resulting in their incomplete extraction and leaving mining edges with an irregular course (Figure 1a). The referenced coal seams are deposited approximately 160 m and 80 m above the coal seam No. 504, respectively. The thickness of the extracted coal seam No. 418 in this part of the mining area ranged between 1.5 m and 3.35 m. The southern part of the 001z longwall panel was almost entirely under goaf created during the extraction of the coal seam No. 418, approximately 35–39 years earlier, and only above the south-western part of the longwall panel the coal seam No. 418 was not mined (Figure 1a). Further to the north, the coal seam No. 418 was only partially extracted on the western side (Figure 1a), approximately 37–38 years earlier. The opposite situation occurred further to the north, where the coal seam No. 418 was extracted on the eastern side (Figure 1a), approximately 39–41 years earlier. The progressive thinning of the coal seam No. 418 to the north-east necessitated the commencement of extraction activities increasingly towards the east (Figure 1a). North of the planned end of mining of the 001z longwall panel, the coal seam No. 418 was once again almost entirely extracted (Figure 1a), approximately 42 years earlier. Due to the irregular deposition, the coal seam No. 502 was extracted only to the east of the longwall panel 001z (Figure 1a). The edge of the coal seam No. 502 was closest at a horizontal distance of approximately 12 m to 36 m. The coal seam No. 502 was extracted there approximately 30 years earlier, with a thickness ranging from 1.45 m to 1.6 m. The northern part of the 001z longwall panel was situated above goaf created in the coal seams Nos. 506 and 507 (Figure 1a). The coal seam No. 506, characterized by a thickness ranging from approximately 1.2 m to 1.35 m, was extracted there approximately 36–37 years earlier. In turn, the coal seam No. 507, characterized by a thickness ranging from approximately 3.5 m to 4.8 m, was extracted there approximately 22–25 and 33–34 years earlier. The distances between mentioned coal seams and the coal seam No. 504 in this part of the mining area are 15–38 m and 53–67 m, respectively. North of the planned end of mining of the 001z longwall panel, the coal seam No. 510 was extracted (Figure 1a). This seam is deposited in this part of the mining area approximately 58 to 72 m below the coal seam No. 504.
The mining of the 001z longwall panel can be subdivided into three primary stages, determined by the extent of preceding extraction operations in coal seams Nos. 418 and 502, the caving process, and the dominant advance rate of the longwall face. In the first stage (weeks 1–7), coal seam No. 418 was not entirely extracted above the western side of the 001z longwall panel (Figure 1a). This phase was characterized by the initiation of immediate roof caving, while the advance rate of the longwall face remained low. The second stage (weeks 8–17) involved mining predominantly beneath the goaf in coal seam No. 418 (Figure 1a). During this phase, immediate roof caving persisted, accompanied by the occurrence of high roof caving. The advance rate of the longwall face was regular and high. In the third stage (weeks 18–27), the longwall face approached the parallel edge of coal seam No. 418 and the mining was subsequently conducted predominantly beneath the unmined coal seam No. 418, which had only been mined above the western side of the 001z longwall panel (Figure 1a). To the east of the 001z longwall panel, the edge of coal seam No. 502 was located, approximately aligned parallel to the maingate. This stage saw the continuation of both immediate and high roof caving. However, the advance rate of the longwall face once again diminished, particularly two weeks before the rockburst.
The extraction of coal seam No. 504tl was prematurely ceased. After the longwall face advanced approximately 328 m, a tremor with an energy of 2 ×·107 J occurred, leading to a rockburst in the maingate (Figure 1a). The longwall face was then located mostly beneath the unmined coal seam No. 418 and to the west of the edge of coal seam No. 502 (Figure 1a). The damage to the maingate caused by the rockburst was visible over a length of 75 m ahead of the longwall face, e.g., floor heave, and deformation and destruction of the support occurred. The most severe damage occurring approximately 30–50 m ahead of the longwall face, rendering passage impossible. The equipment installed in the maingate was damaged, including the conveyor belt. The volume of airflow decreased from 1200 m3/min to 300 m3/min. Consequent to the discussed rockburst, the extraction activities within coal seam No. 504tl in the 001z longwall panel were terminated.

2.2. Seismic Monitoring During the Extraction of the 001z Longwall Panel

The 001z longwall panel was monitored using the ARAMIS S seismic system, which operates with a sampling frequency of 200 Hz. During the extraction of this panel, the ARAMIS S seismic network consisted of 15 or 16 sensors. The spatial configuration of these sensors on the day of the rockburst is depicted in Figure 2a. These sensors were deployed in underground mine workings at depths ranging from 520 m b.s.l. to 1000 m b.s.l. Two types of seismic sensors were employed: SPI-70 seismometers and low-frequency DLM-2001 geophones. The SPI-70 seismometers were mounted on concrete pedestals, whereas the low-frequency DLM-2001 geophones were installed on bolts anchored in the floor of the mine workings, in locations where seismometers could not be set up. Both sensor types measured the vertical component of rock mass velocity and detected seismic signals at a minimal frequency of approximately 1 Hz. Each seismic channel had an individual gain value.
The method of first arrivals of P-wave was utilized to determine the tremor locations. Most seismic sensors were positioned to the east, north, and southeast of the 001z longwall panel (Figure 2a), with two additional sensors installed within the longwall gate roads (S-1, S-8). This specific spatial configuration of the sensor network influenced the localization error for the epicenter, ranging from 32.3 m to 42 m, and the hypocenter, ranging from 44.9 m to 59.7 m.
The seismic energy associated with tremors was estimated using numerical integration of seismograms. This approach involved summing the squares of amplitudes recorded by the sensors. Several parameters were considered in the seismic energy calculations: the sampling rate (200 Hz), rock mass density (2600 kg/m3), quality factor representing attenuation (30), sensor calibration factor, distance between the seismic event focus and the seismic station, and seismic wave velocity (ranging between approximately 3800 and 4100 m/s, depending on the station). The energy values calculated for individual seismic stations were averaged to obtain the final result. These energy values could subsequently be converted to the local magnitude (ML) using a formula provided by [46]:
l o g E = 1.8 + 1.9 M L
The energy of strong tremors (E ≥ 1·× 105 J, ML ≥ 1.68) was further verified through calculations performed by the Upper Silesian Regional Seismological Network, managed by the Central Mining Institute—National Research Institute in Katowice, Poland [47].
The extraction of the 001z longwall panel resulted in a total of 2777 recorded tremors (Figure 2b), releasing a cumulative seismic energy of 5.14 ×·107 J. The distribution of tremors across individual seismic energy ranges is as follows: 2291 tremors with an energy level of 102 J (0.11 ≤ ML < 0.63), 377 tremors with an energy level of 103 J (0.63 ≤ ML < 1.16), 76 tremors with an energy level of 104 J (1.16 ≤ ML < 1.68), 25 tremors with an energy level of 105 J (1.68 ≤ ML < 2.21), 7 tremors with an energy level of 106 J (2.21 ≤ ML < 2.74), and 1 tremor with an energy of 2·× 107 J (ML = 2.9), which was responsible for the rockburst in the maingate. Of all the recorded tremors, 42 occurred after the rockburst and the termination of mining operations in the 001z longwall panel. This includes 29 tremors with an energy level of 102 J, 12 with an energy level of 103 J, and 1 tremor with an energy level of 104 J.

2.3. Seismological Parameters

2.3.1. Number of Tremors, Seismic Energy, and Energy-Related Parameters

The number of tremors and seismic energy represent fundamental variables systematically monitored during longwall mining operations. Their comprehensive analysis provides critical insights into the stress–strain state and stability of the rock mass, enabling the assessment and mitigation of seismic and rockburst hazards.
The number of tremors refers to the frequency of seismic events associated with mining activities. These tremors result from stress redistribution and rock fracturing caused by coal extraction. Their occurrence is influenced by various factors, including geological features such as depth of mining operations, fault zones, and mining-specific conditions, such as the edges of previously extracted coal seams, pillars, and the rate of coal extraction. In longwall mining, greater excavation depths and accelerated coal removal generally result in increased seismic activity. An increase in seismic activity is commonly observed near the edges of adjacent coal seams and pillars [7]. In contrast, a decrease in seismic activity is recorded when the mined coal seam has been previously destressed by the extraction of a neighboring seam. Moreover, in mining practice, a temporary reduction or even cessation of seismic activity can be observed. This phenomenon arises when the rock mass transitions into a state of apparent stability, wherein stress continues to accumulate without immediate redistribution or release. It may create a misleading impression of stability, ultimately leading to the rapid release of stored stress once critical thresholds are exceeded, resulting in a sudden, strong tremor or rockburst. Therefore, the interpretation of seismological data is often marked by a degree of ambiguity, stemming from the intricate interplay of factors associated with coal extraction.
Seismic energy is a critical parameter that quantifies the energy released during tremors. Its release is governed by the magnitude of stress within the rock mass, the physical properties of the rock mass, and changes in stress distribution resulting from void formation during mining activities. As material is removed, the support previously provided by the rock is lost, leading to stress concentration in adjacent areas. This stress redistribution can exceed the strength of the rock, causing sudden failures or slips along fractures which release seismic energy. Therefore, the creation of voids contributes to increased seismic activity by destabilizing the stress equilibrium in the rock mass. In hard coal mines, strong tremors are mainly associated with the fracturing of thick layers of hard rocks (e.g., sandstones). They also occur in the vicinity of edges of other seams, pillars, and fault zones. By analyzing seismic energy, zones of high stress concentration can be identified, which are commonly indicative of areas susceptible to instability and an elevated risk of rockbursts [7,32,36].
During longwall mining operations, an assessment of tremor frequency and its corresponding seismic energy is fundamental for estimating seismic and rockburst hazards. Continuous microseismic monitoring provides detailed insights into the evolving stress field within the mining environment, where excavation activities disturb the pre-existing equilibrium of the rock mass. Patterns of seismic activity can identify areas susceptible to instability. Temporal trends in tremors and seismic energy offer valuable insights into how mining operations influence the behavior of the rock mass over time. The analysis of these parameters as a function of the longwall face advance may also hold significant importance.
Building on these two primary parameters, several derivative metrics are calculated to evaluate seismic and rockburst hazards, such as specific seismic energy, average seismic energy release per tremor, and seismic energy per unit of longwall face advance. Higher values of these parameters may indicate intense seismic activity, often associated with zones of high stress within the rock mass. The definition of specific seismic energy can vary depending on the objectives and industry standards being applied. It may be defined as the amount of seismic energy released per unit volume or mass of the extracted rock, or per unit area of the exposed roof rocks. In Polish hard coal mining, it is typically referred to as “seismic intensity” and is calculated per unit mass (i.e., tone) of extracted coal [48]. A value of this indicator up to 10 J/t signifies a low risk of rockbursts, a value from 10 J/t to less than 100 j/t corresponds to a moderate risk, and a value greater than or equal to 100 J/t indicates a high risk [48].
The analysis of seismological parameters can be conducted using various approaches, including evaluations over defined time intervals (day, week, decade, month, etc.) [29] and cumulative assessments based on either time or mining progress [29,32,36]. Both methods provide distinct and valuable insights into the dynamics of mining-induced seismicity.
The analysis of seismicity in defined time intervals enables the detection of patterns or anomalies in the frequency of tremors, seismic energy, or energy-related parameters. By examining the temporal evolution of these parameters within defined intervals, seismic responses can be systematically correlated with mining operations or geological and mining-specific factors, such as fault zones and edges of adjacent coal seams, respectively. Moreover, periodicity in stress–strain redistribution and rock fracturing during longwall mining is often mirrored in seismic activity. This allows identifying periods of greater seismic and rockburst hazards, assuming the stationarity of processes occurring in the rock mass caused by mining.
In turn, cumulative analysis involves aggregating seismological data over consecutive days of mining or relative to mining progress. This approach provides a comprehensive view of seismic activity patterns and their relationships with geological and mining factors. A temporal or spatial representation of the total seismic energy released during mining operations reveals long-term trends and aids in detecting critical hazards, such as progressive stress accumulation or delayed seismic responses. This approach identifies localized variations in seismic behavior, particularly as mining-induced stress concentrations intensify near edges and remnants of adjacent coal seams [7,32,36] or faults.
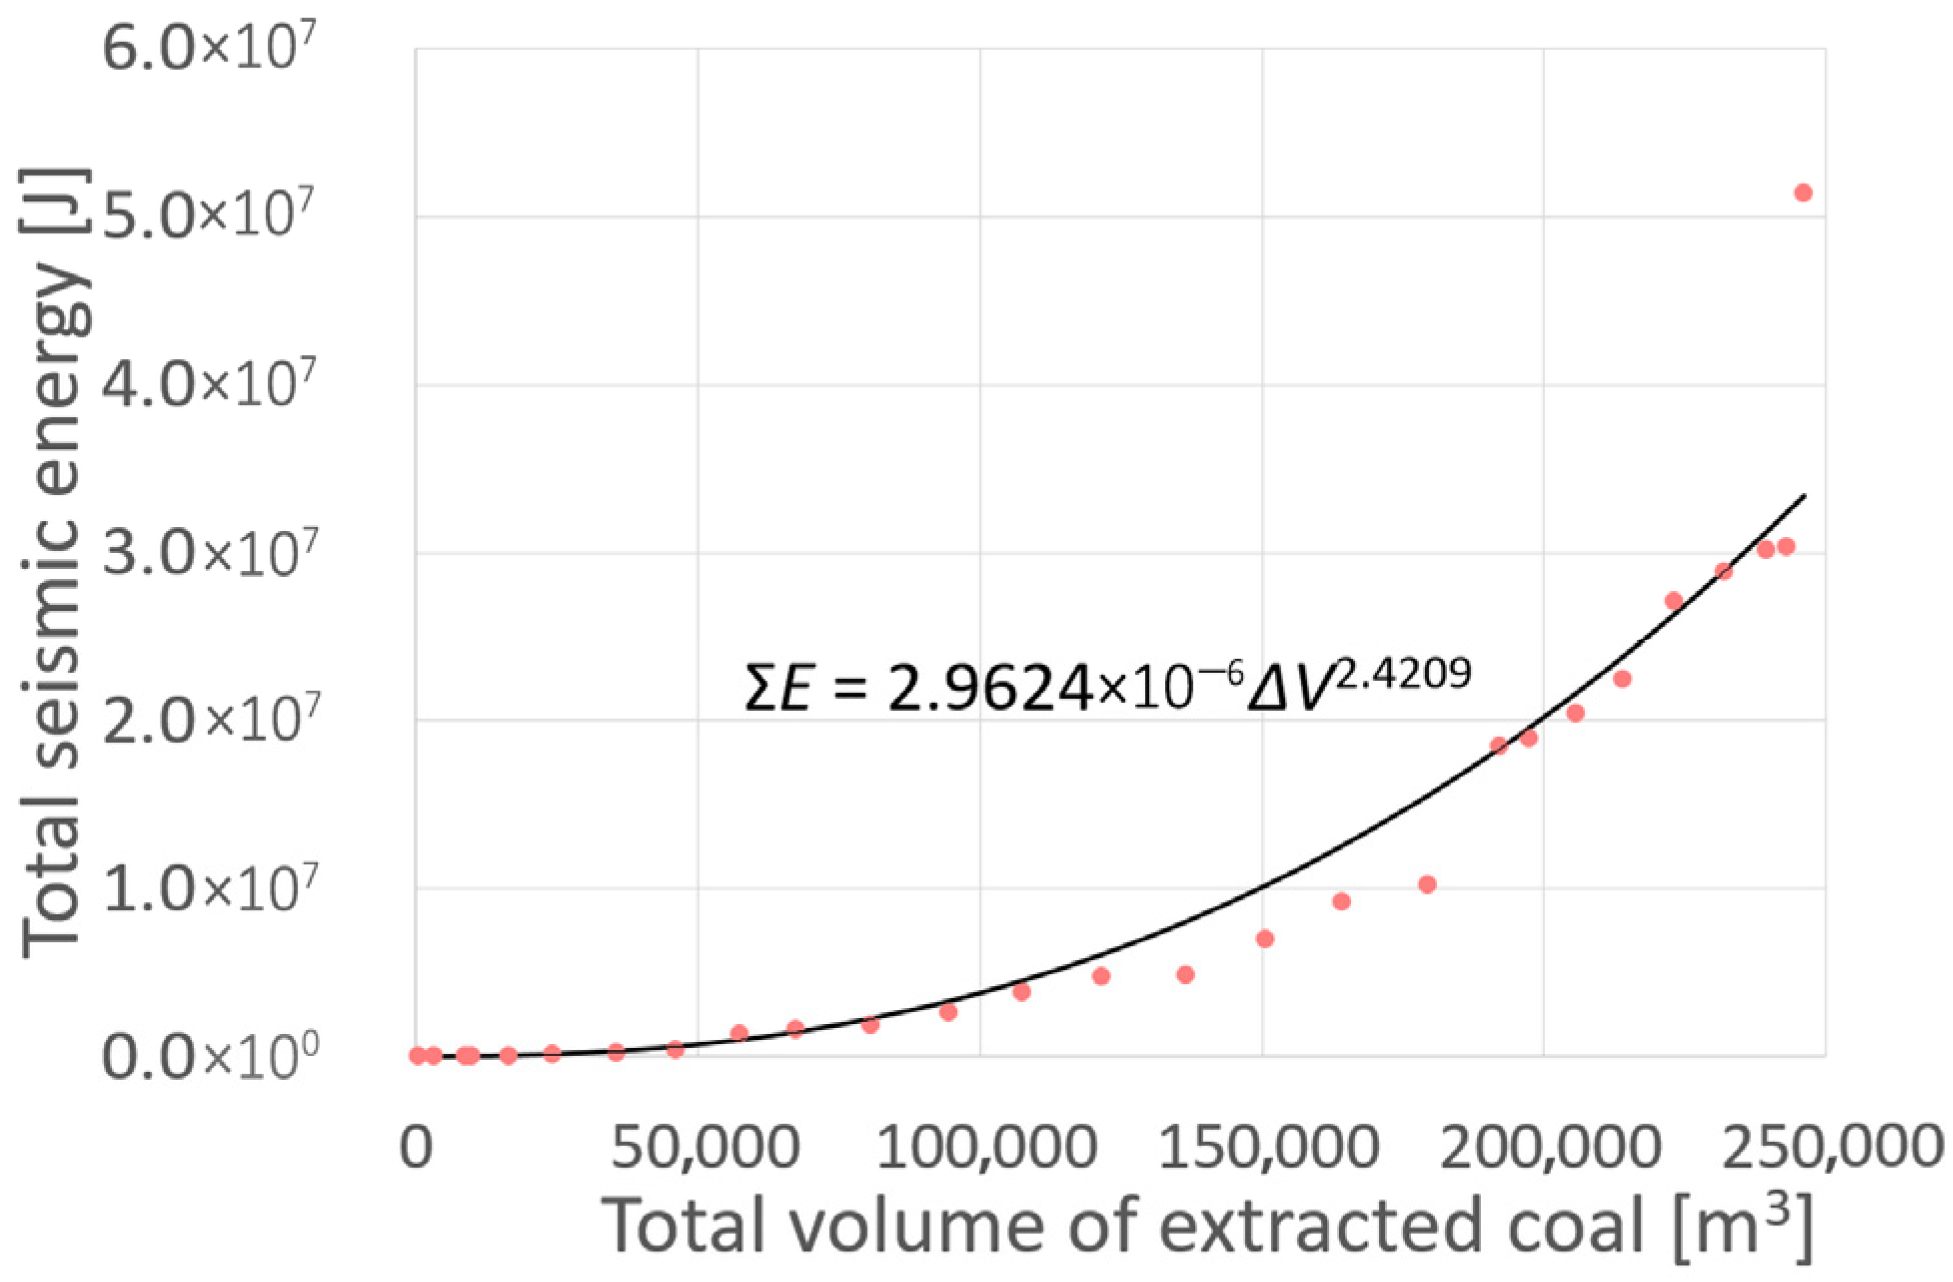
A specific case of cumulative parameter analysis is the relationship between the total seismic energy and the total volume of extracted coal. This relationship is analyzed to detect patterns and identify zones of instability within the rock mass. A higher seismic energy release relative to the volume of extracted coal may suggest the presence of stress concentrations within the rock mass. In contrast, a lower ratio of seismic energy release to the volume of coal extracted could indicate a more stable rock mass or the effectiveness of destressing mechanisms. The relationship between the total seismic energy (ƩE) and the total volume of extracted coal (ΔV) is commonly characterized by a power-law model [20], emphasizing the complex, nonlinear processes of stress redistribution and rock fracturing within the rock mass during mining activities:
E = C Δ V B
where C represents the initial stress conditions and physical properties of the rock mass, and B represents the state of the rock mass and its reaction to mining-induced stress.
The presented parameters were applied to the seismic activity observed during the exploitation of the 001z longwall panel. An attempt was made to correlate the development of these parameters with the extraction process and the geological and mining conditions.

2.3.2. Benioff Strain Release

A systematic investigation into natural seismicity has demonstrated that the strain energy released during earthquakes remains remarkably constant over extended periods, thereby supporting the concept of a globally coherent mechanism of stress accumulation and energy release [49]. In this context, cumulative Benioff strain release—defined as the sum of the square roots of the energy released by individual seismic events—has been introduced as a quantitative indicator of the progressive accumulation of strain in the Earth’s crust. Subsequent regional studies have revealed that the characteristics of strain release, when assessed using this approach, exhibit significant spatial variability that reflects the heterogeneity of the underlying tectonic stress fields [49,50,51]. The theoretical framework has been further refined by incorporating subcritical crack growth processes, which provide a mechanistic explanation for the time-dependent rupture phenomena observed in the Earth’s crust [52]. Moreover, an accelerated cumulative increase in Benioff strain, following an inverse power-law behavior, is interpreted as a precursory signal that the crust is approaching a critical threshold prior to the occurrence of a major earthquake [53]. This measure has also been applied to the analysis of tremors induced by mining operations, revealing strain-release patterns in zones with elevated seismic risk [20,25,32]. This concept can be directly applied to mining-induced seismicity because the underlying physical process—accumulation and sudden release of strain energy—is similar to that of natural earthquakes, even though the causes differ. In mining areas, human activities such as excavation and void creation alter stress distributions, leading to induced seismic events that also release strain energy. Analyzing Benioff strain release for mining-induced seismicity may provide a consistent and quantitative way to track the progressive build-up and release of strain during mining.
The acceleration in seismic data is frequently examined using models such as BSR (Benioff Strain Release), AER (Accelerating Energy Release), or AMR (Accelerating Moment Release). These models suggest that prior to substantial seismic events—whether major earthquakes [54,55] or strong mining-induced tremors [32,36]—the surrounding region may experience an increase in smaller seismic events that follow a power-law pattern. This phenomenon reflects how stress builds up in the rock mass as it approaches a critical point, leading to increased seismic activity. Initially, strain energy is released as low-energy, low-frequency tremors. However, as the rock mass nears its critical failure threshold, the fracturing rate escalates rapidly, leading to an increasingly higher release of seismic energy. Once the critical stress threshold is surpassed, unstable fracturing or abrupt displacement may ensue, culminating in an earthquake or a high-energy mining tremor or a rockburst.
The three acceleration models mentioned are rooted in a time-to-failure (critical-point) framework that captures the progressive evolution of fracture processes leading to catastrophic rupture. As microcracks accumulate and coalesce in brittle materials, the system reaches a critical threshold beyond which even small increases in stress can trigger dynamic rupture, resulting in a power-law acceleration of released energy [52]. Moreover, the constant ratio between the first and second derivatives of observable precursors—such as seismic energy, moment, or deformation rate—allows for an estimation of the remaining time until failure [56]. Additionally, although the nucleation phase is typically accompanied by an increase in foreshock activity due to accelerating stress loading, the presence of foreshocks is neither a definitive nor a universal marker of impending failure, as their occurrence can vary significantly across seismic sequences [57]. Furthermore, a comprehensive review of accelerating seismic moments and energy release prior to large and great earthquakes demonstrated that moderate-magnitude seismicity evolves in both time and space in a manner that scales with the size of the impending mainshock, reinforcing the critical point hypothesis and extending the concept to regional seismicity [58]. A time-to-failure method based on cumulative Benioff strain release was applied to capture accelerating seismicity preceding a main shock, with an empirically derived power-law model enhanced by scaling relationships used to forecast earthquake timing and magnitude [59,60]. Empirical investigations have broadened the critical-point framework by using a search radius to define the area over which precursor seismicity occurs. It has been demonstrated that the logarithm of the critical radius scales with the magnitude of the impending earthquake, indicating that the area of correlated seismic events enlarges with increasing event size [61]. The detection of accelerating Benioff strain release—used as a proxy for the evolving state of stress—is highly sensitive to the selected spatial window, with an appropriate search radius yielding clearer acceleration signals. This spatial approach has also been applied to induced seismicity in underground coal mines, where analyses of accelerating BSR show that when the acceleration is present, the process exhibits critical behavior, with a scaling relation between the critical radius and the target event’s magnitude paralleling observations in natural seismicity [32].
Thus far, cumulative Benioff strain release has been modeled using an empirical time-to-failure formulation, as shown in Equation (3), which has been applied to both natural earthquakes [59,60] and induced seismicity [32]:
B S R t = i = 1 N t < t f E i = K t k t n t 1 t f t m t
where Ei denotes the seismic energy released by the i-th tremor occurring at time t preceding failure time tf, Kt represents the ultimate cumulative strain at failure time tf, kt is the scaling coefficient controlling the amplitude of the acceleration factor, nt is a dimensionless parameter modulating the curvature of the strain release (nt ≠ 1), and mt is the exponent governing the rate of power-law acceleration (mt = nt − 1).
The conventional time-to-failure model has been reformulated by replacing the time parameter with a variable representing the volume of an extracted deposit. In this approach, it is assumed that changes in stress and the associated tremors are directly related to the extraction process, linking volumetric changes to strain accumulation. Moreover, because the longwall height and length remain almost unchanged during mining, the volumetric parameter can be further simplified to depend solely on longwall face advancement. The proposed advancement-to-failure model utilizes longwall face advancement (A) as its key indicator. In this reformulated approach, the original scaling coefficients and exponents (e.g., Kt, kt, nt, and mt) need to be recalibrated to accurately reflect the physical relationship among longwall face advancement, stress changes, and energy release. This recalibration offers an alternative description of the evolving strain field in the rock mass and provides enhanced insight into the system’s mechanical response to operational changes (e.g., KA, kA, nA, and mA). In this approach, the formula will have the following form:
B S R A = i = 1 N A < A f E i = K A k A n A 1 A f A m A
While the phenomenon of accelerating Benioff strain release is significant, it does not always manifest in mining-induced seismicity. An initial surge in seismic activity can be followed by a decline, suggesting that stress within the rock mass may temporarily stabilize before reaching a critical threshold. A reduction in seismic activity can be correlated with the closure of fractures, although such stability is typically short-lived as stress continues to build. Moreover, in some instances, quiescence may precede a major seismic event or rockburst. Simultaneously, the strain energy becomes increasingly concentrated, setting the stage for a rapid and catastrophic release of energy once the rock’s strength is exceeded. The behavior of a rock mass prior to strong induced tremors or rockbursts is inconsistent. However, the influence of the longwall face advancement must be considered, as it is one of the factors determining the stationarity of the process of strain energy accumulation and induced seismicity.
An analysis of the cumulative Benioff strain release was performed, focusing on its trends over time and the longwall face advancement. In this article, a detailed case study is presented that examines the evolution, cyclicity, and trend of selected seismological parameters preceding a rockburst during longwall mining of a coal seam.

3. Results

3.1. Seismic Activity and Associated Energy Parameters

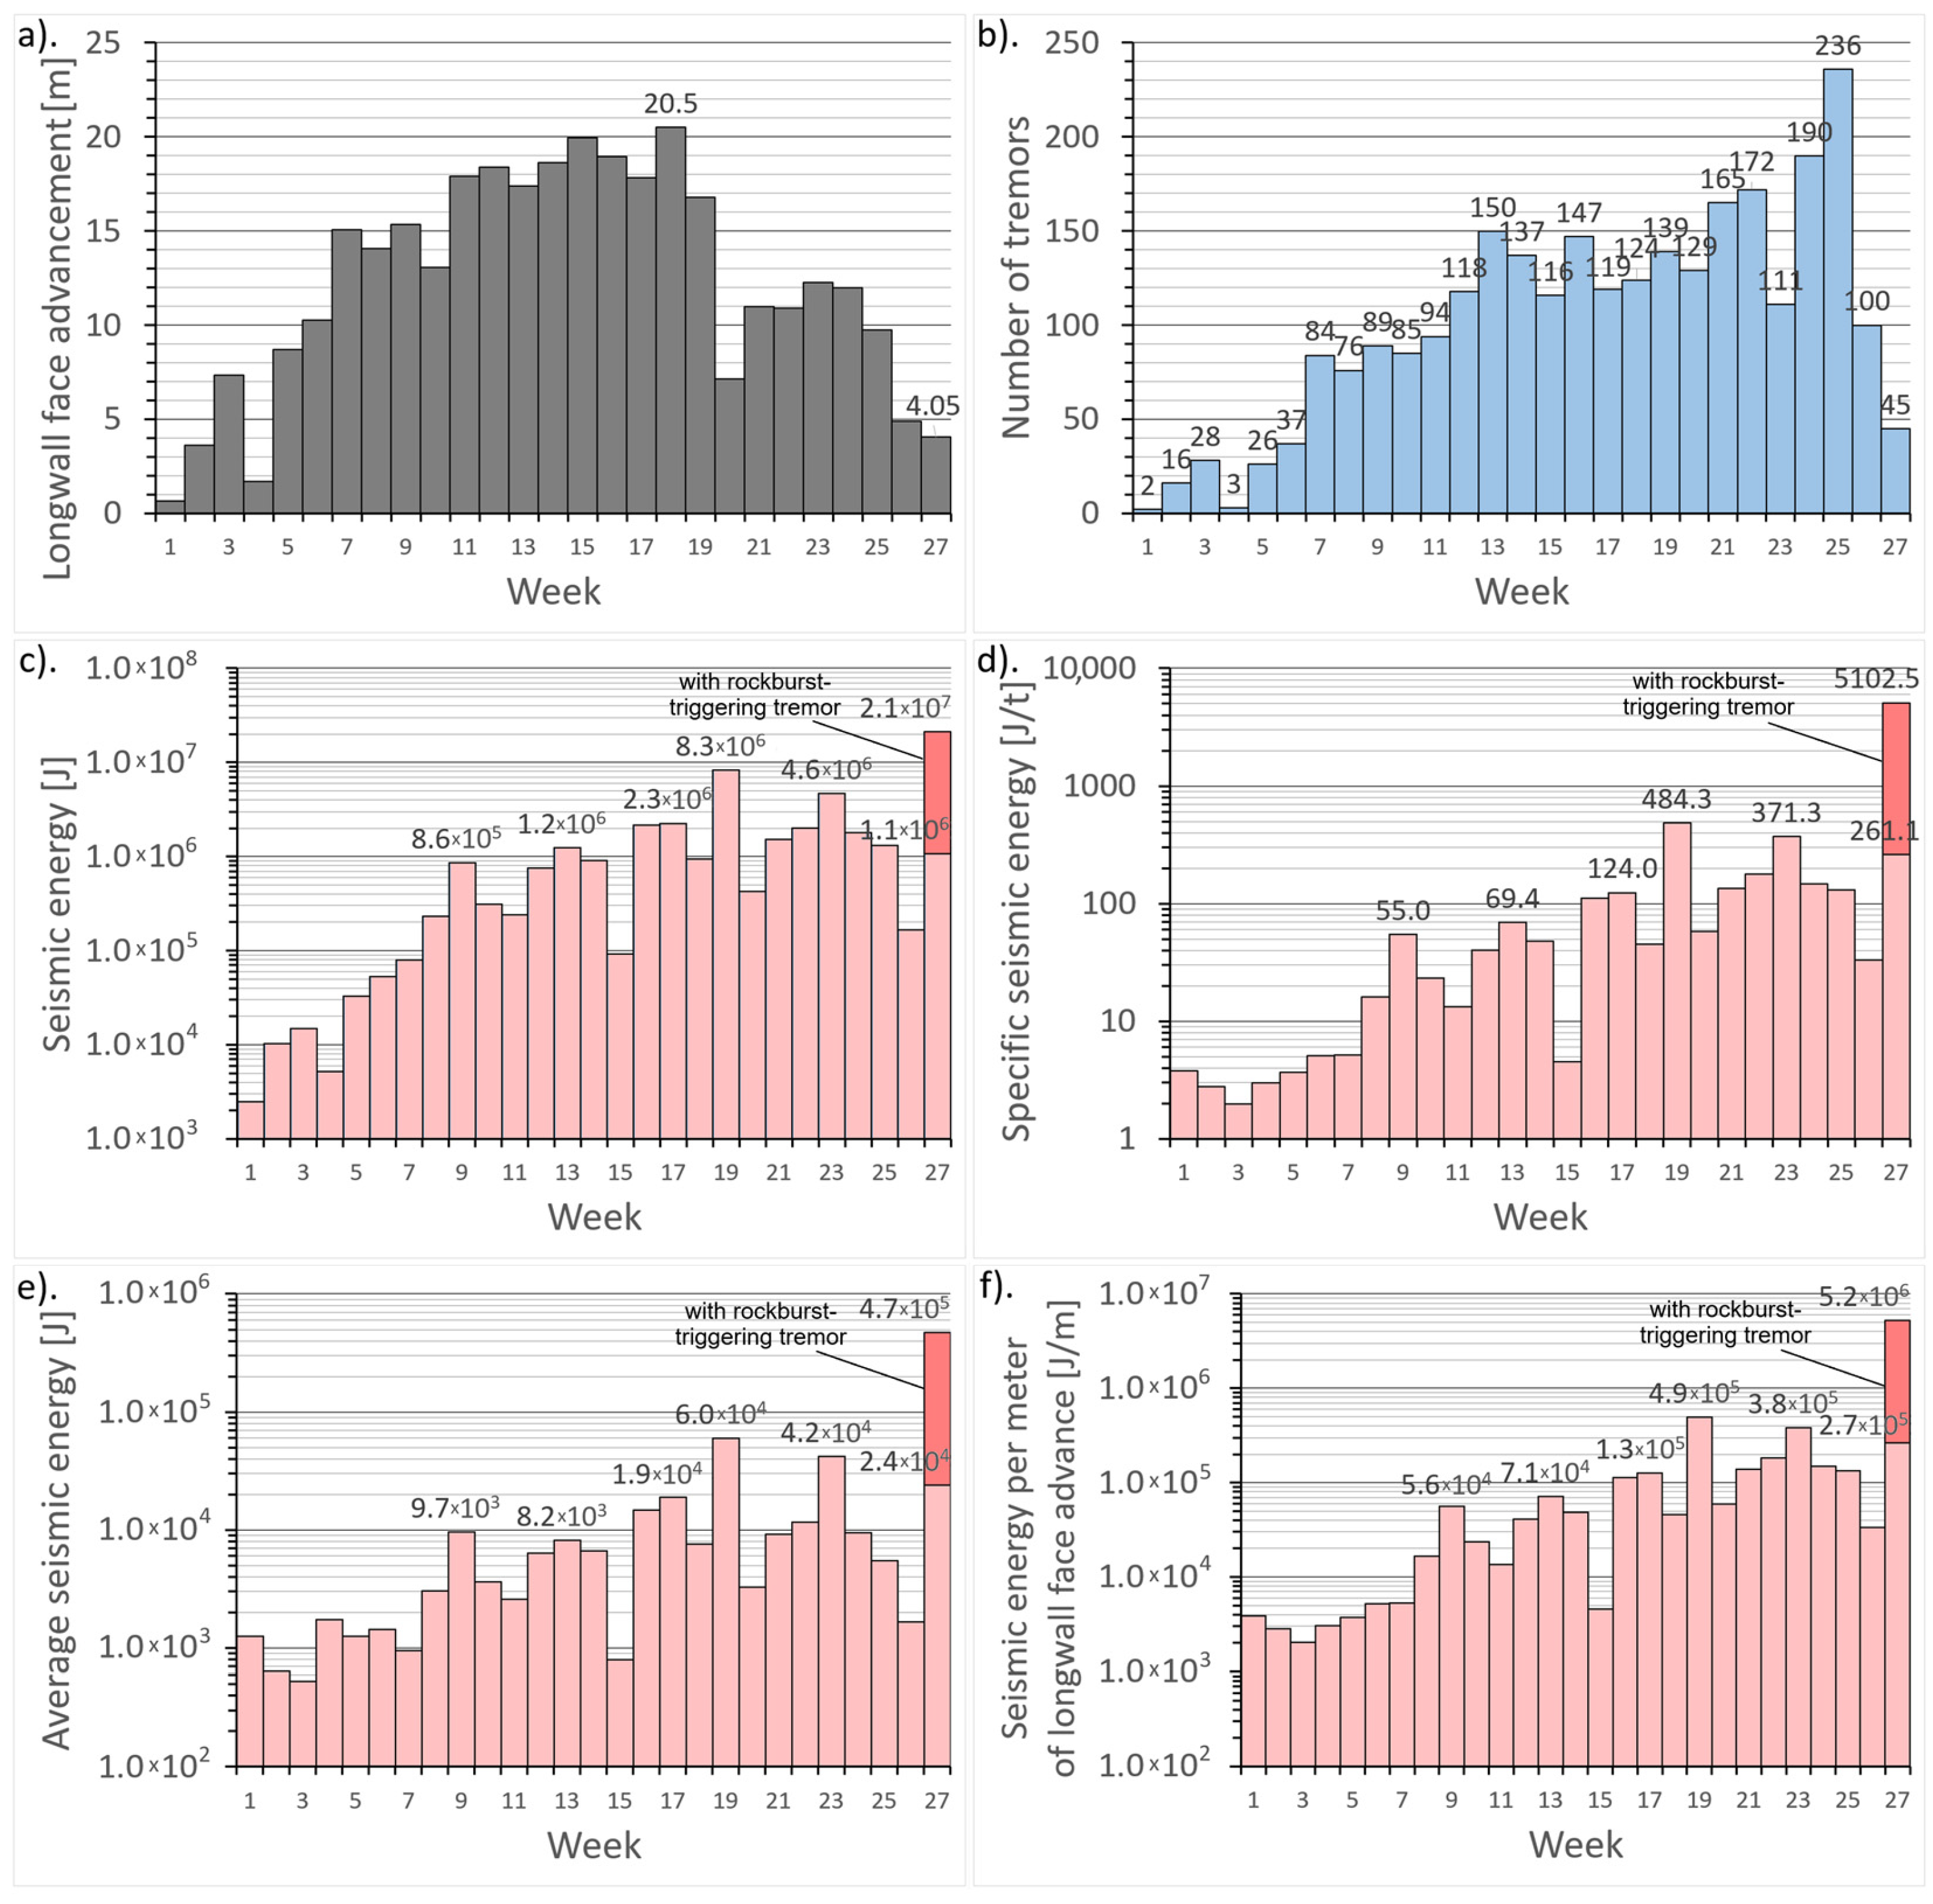
The analysis was conducted for the weekly interval corresponding to the mining of the 001z longwall panel, identifying patterns in seismic activity, energy distribution, and energy-related parameters in relation to mining operations and other factors. The weekly distributions of longwall face advancement, tremor frequency, seismic energy, specific seismic energy, average seismic energy, and seismic energy per meter of longwall face advance are presented in Figure 3. The values of seismic energy (Figure 3c) and energy-related parameters (Figure 3d–f) for the final week of mining were calculated both with and without the inclusion of the strongest tremor correlated with the rockburst. The strongest tremor was incorporated to provide context for its magnitude.
The analysis of seismic activity for the 001z longwall panel was conducted for three distinguished stages of exploitation. The first stage corresponded to weeks from the 1st to the 7th. During this stage, the seismic activity was low and proportional to the small advances of the longwall. The second stage (weeks 8–17) covered the period of cyclical increase in seismic energy release. The third stage (weeks 18–27) was associated with the effects of the presence of the unexploited seam No. 418 above the longwall panel and the frontal collapse of the roof. The unexploited seam No. 418 likely influenced the redistribution of stresses, leading to earlier or more intense seismic events. As a result, this seam significantly affects both the intensity and pattern of seismic activity by contributing to stress concentration and energy build-up in the area above the longwall panel.
During the first stage of mining (weeks 1–7), no significant influence of the unmined coal seam No. 418 above the western part of the longwall panel on seismic activity growth is observed. The longwall is in the startup phase and achieves only minor advancements, with seismic activity remaining low. It is only in the 7th week that the longwall face exhibits greater advancement (Figure 3a), which corresponds to an increase in the seismic activity recorded that week (Figure 3b). An increase in the advancement of the longwall face generally leads to a more significant redistribution of stresses within the surrounding rock mass. This causes stronger and more frequent localized stress concentrations, which in turn results in greater seismic activity both in terms of intensity and frequency. The seismic energy released in the seventh week is the highest compared to the energy emitted during the previous six weeks of mining; however, the energy-related parameters associated with it do not differ from earlier values (Figure 3d–f). Seismic activity in the first stage was, therefore, proportional to the extent of the exploitation of coal seam No. 504tl.
During the second and third stages of mining, cyclic variations in seismic energy and energy-related parameters were observed. In these stages, high-roof caving develops, and seismic activity may be linked to the periodic fracturing of thick sandstones (Figure 1b). The rise in seismic activity after the seventh week is linked not only to the further progress of the longwall face but also to the initiation of significant roof caving. High-roof caving plays a significant role in modifying the stress distribution within the surrounding rock mass. As the collapse progresses upward, the stress previously carried by the caving strata is transferred toward the undisturbed strata found closer to the surface. This redistribution may lead to local stress concentrations in the more shallowly deposited rocks, increasing the risk of brittle failure and seismic events. Therefore, the observed rise in seismic activity reflects both the mechanical response of the rock mass to continued mining and the stress changes associated with the onset of high-roof caving.
In the second stage (weeks 8–17), the highest energy release occurs every four weeks (weeks 9, 13, 17). However, the seismic energy emitted during these weeks is lower than in the third stage (Figure 3c–f), which may be attributed to mining predominantly beneath the goaf in coal seam No. 418 (Figure 1a) and some destress effect. In the third stage of mining (week 18–27), extraction is conducted predominantly beneath the unmined coal seam No. 418 (Figure 1a). A similar cyclic pattern of seismic energy release is also observed, occurring every four weeks (weeks 19, 23, 27); however, as it was mentioned, more seismic energy is released (Figure 3c–f). The first cyclical increase in seismic activity in the third stage (week 19) occurred only two weeks after the last such increase in the second stage (week 17). This disruption of four-week cyclicity is most likely related to changes in exploitation conditions, specifically the presence of a mostly unmined coal seam No. 418 above the longwall panel. In contrast to the goaf zones encountered during the second stage—where a partial destressing effect may have occurred—the presence of the undisturbed seam acts as a stiff, load-bearing structure that impedes gradual stress dissipation. The transition zone between the previously mined-out goaf and the intact coal seam constitutes a distinct structural boundary, which can serve as a zone of stress concentration and mechanical discontinuity. These contrasting geomechanical conditions promote localized stress accumulation and increase the potential for sudden failure in the rock mass. Furthermore, the presence of the unmined seam may alter the overall mechanical behavior of the overburden, influencing both the initiation and propagation of fractures within the overlying thick sandstone strata.
The cumulative values of the number of tremors and seismic energy were also analyzed. The relationship was analyzed as a function of time and the longwall face advancement (Figure 4). For comparison, the total longwall face advancement is also depicted in the time-based plot (Figure 4a).
At the very beginning of the third stage, the highest advancement rates were achieved (Figure 3a). However, shortly thereafter, the longwall face advance decreased. This decline is also evident in the reduced slope of the total longwall face advancement graph over time, starting from approximately day 130 of mining (Figure 4a). Despite the slowdown in advancement, seismic activity remained high. A noticeable decrease in seismic activity occurred only about two weeks before the rockburst, following a significant reduction in longwall face advancement (Figure 4a). The limited longwall face advancement resulted from an unstable roof in the area of local fault disturbances. In the advancement-based graph (Figure 4b), a greater slope in the cumulative number of tremors and cumulative seismic energy is observed in the third stage, beginning from approximately 250 m of total longwall face advancement. Only right before the rockburst can a slight decrease in seismic energy release be observed. Therefore, longwall face advancement was identified as a key factor influencing the stability of the seismic energy emission process.
A similar situation occurs in the relationship between total seismic energy (ƩE) and the total volume of extracted coal (ΔV) (Figure 5). Here, as in the previously described case, a slight decrease in seismic energy release is observed directly before the rockburst. A clear deviation from the fitted relationship is noticeable in the second stage when the longwall face was entirely under the goaf of the previously extracted coal seam No. 418. The observed release of seismic energy during that period was notably lower than the expected values derived from the extent of coal seam No. 504tl’s extraction. This discrepancy suggests a deviation from typical energy emission patterns, potentially influenced by some destress effect.

3.2. Analysis of Benioff Strain Release

As described earlier, a comprehensive evaluation of the cumulative BSR for the 001z longwall panel in coal seam No. 504tl was carried out. The analysis investigated the cumulative BSR as a function of time and longwall face advancement, separately. In each case, a critical-point framework was applied, based on the known occurrence—both in time and longwall face advancement—of a main tremor with an energy of 2·× 107 J (ML = 2.9) and a rockburst in the maingate. All models were fitted to data collected under stationary conditions, namely in cases where the development of high-roof caving occurred and the longwall face advancement was consistent. During the first stage of mining (weeks 1–7), longwall face advancement remained relatively small, with a significant increase occurring only in week 7 (Figure 3a). Seismic activity throughout the first seven weeks of mining was comparatively lower than in the eighth week (Figure 3d–f)., and correlated rather with the caving of the immediate roof. During weeks 8–25, longwall face advancement was relatively stable, although it was lower during weeks 20–25 (Figure 3a), and caving of both the immediate and high roof occurred. A pronounced decline in longwall face advancement occurred during the 26th and 27th weeks of mining, exerting a significant impact on the temporal evolution of recorded seismic activity (Figure 4a). However, in the 27th week, despite a significant reduction in the number of tremors (Figure 3b), the released energy and energy-related parameters were cyclically high again (Figure 3c–f).
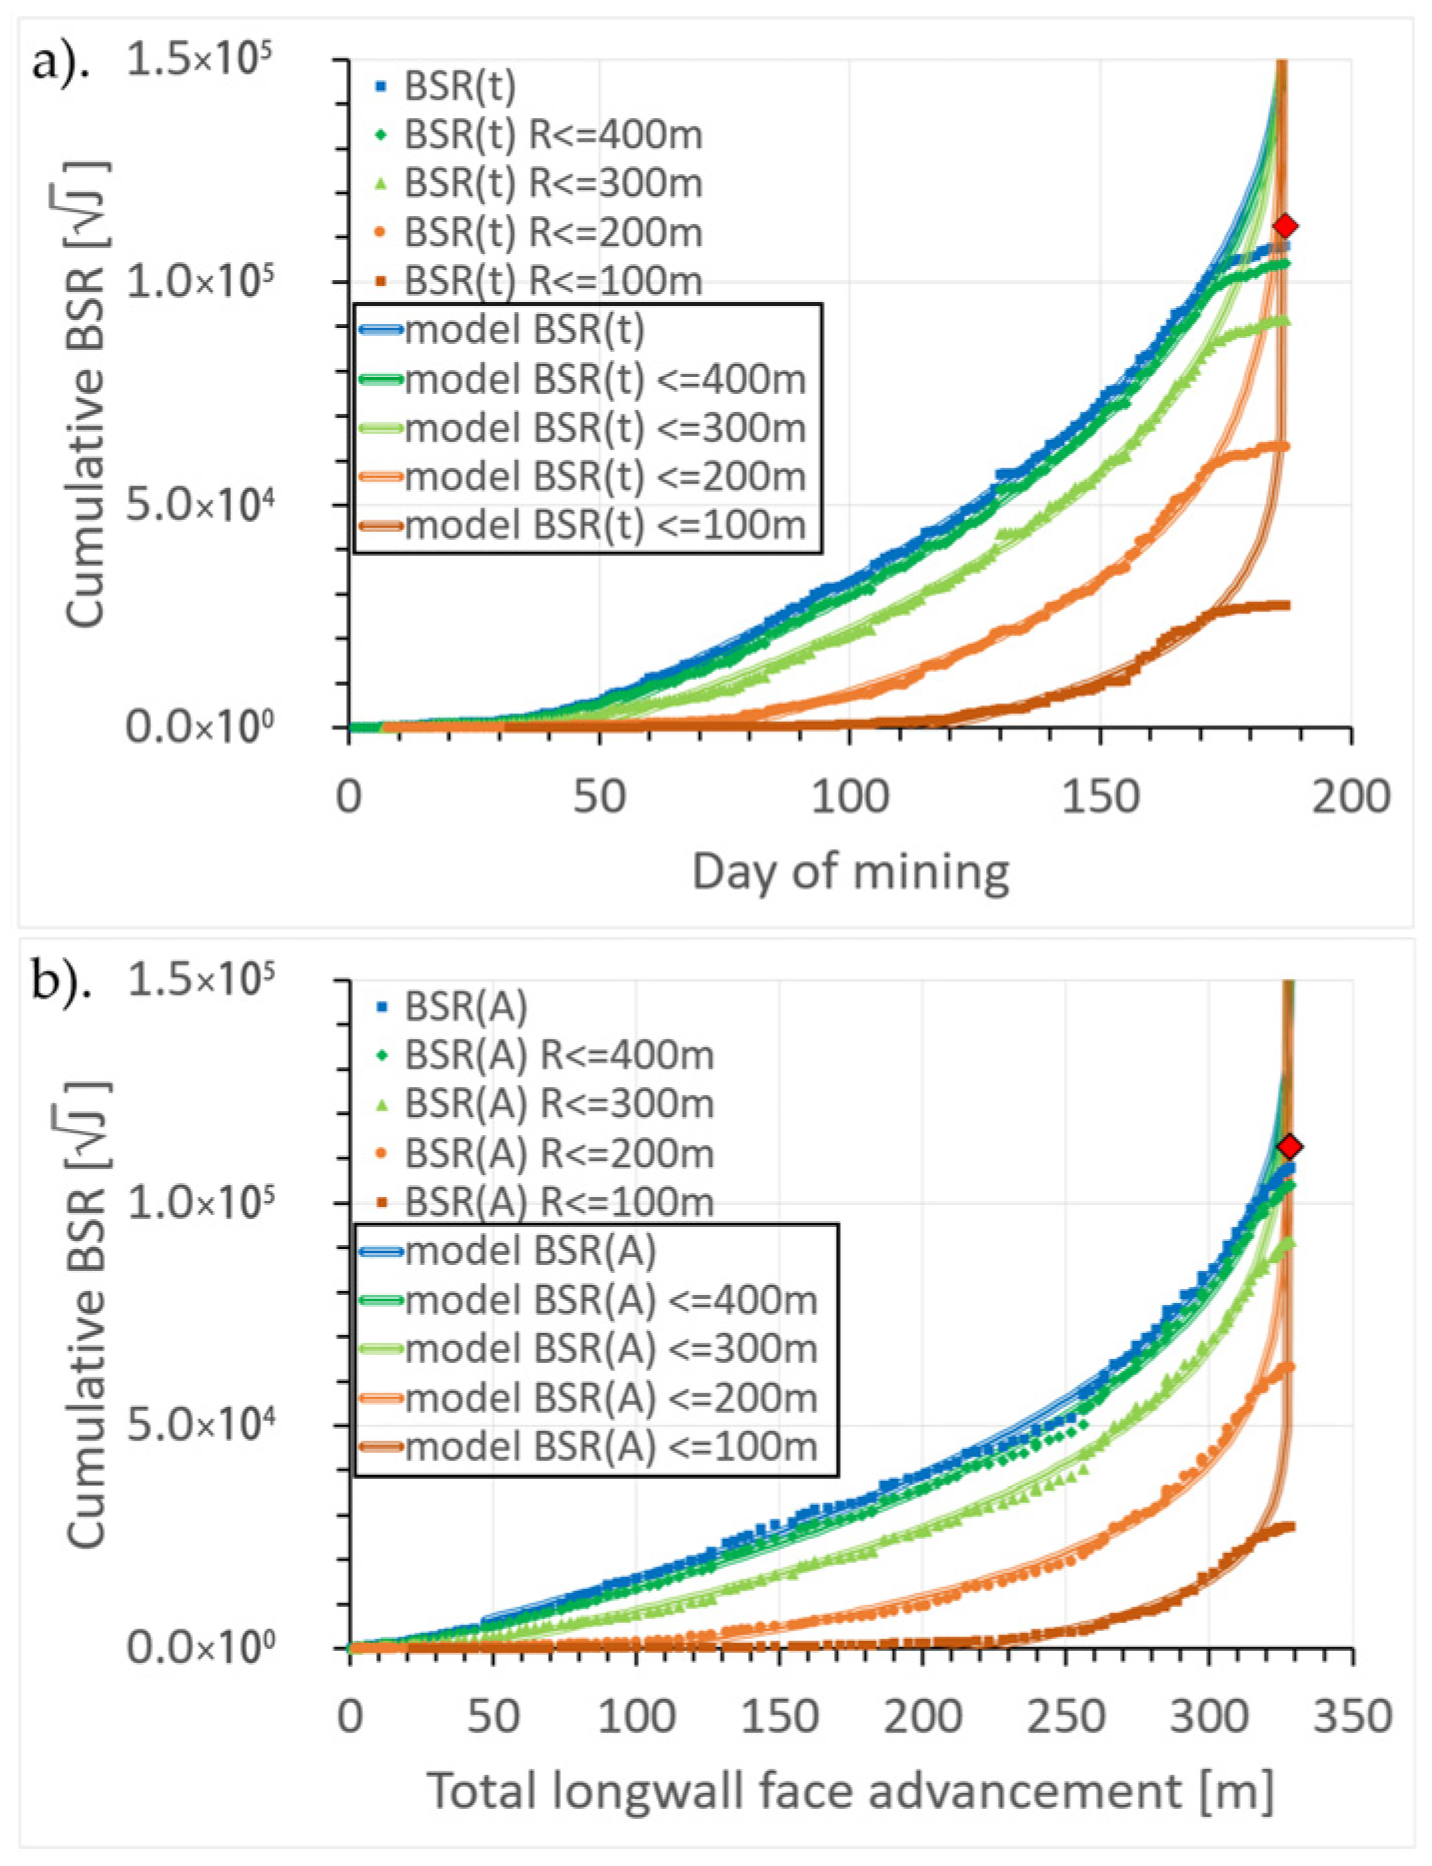
The analysis of cumulative BSR preceding the strongest tremor and rockburst revealed that up to a specific point—approximately two weeks and about 9 m of longwall face advancement prior to the rockburst—the process exhibited characteristics indicative of an accelerating-like sequence (Figure 6). For each model, calculations were performed for the data collected between the 8th and 25th weeks—in one case using all pre-tremors, and in the other cases by partitioning the study area into four circular zones with search radii of 100 m, 200 m, 300 m, and 400 m, respectively (Figure 6). In Figure 6, the strongest tremor related to the rockburst (and corresponding cumulative BSR) is also marked. The parameters for the time-to-failure models, determined for data collected between 8 and 25 weeks, are summarized in Table 1, while those for the advancement-to-failure models are presented in Table 2. Both the time-to-failure and advancement-to-failure models achieved an R2 value of approximately 0.98–0.99.
In time-to-failure BSR(t) models, the parameter Kₜ reaches its maximum for a radius of up to 200 m and then decreases as more distant events are included. In advancement-to-failure BSR(A) models, the parameter KA is most pronounced in the immediate vicinity of the main tremor focus (R ≤ 100 m) before declining with an increased spatial radius. Regarding the acceleration exponent m, both models show that m increases as the spatial extent widens. This indicates that, regardless of the model (time-based or advancement-based), strain release accelerates less when more distant tremors are incorporated. Notably, while this trend is consistent across both models, the absolute values of m are slightly higher in the time-to-failure model.
The entire region exhibited an accelerating pattern of induced seismicity until approximately two weeks (corresponding to about 9 m of longwall face advancement) before the rockburst. However, unlike a strictly accelerating sequence, each case featured a distinct phase of diminished seismic activity preceding the main tremor and rockburst. For this short period, the parameters of the time-to-failure and advancement-to-failure models were also determined and are presented in Table 3 and Table 4, respectively.
For the time-to-failure BSR(t) models, determined for data collected during the last two weeks before the rockburst, mt is negative (and close to zero) at very small scales (R ≤ 100 m). In contrast, for larger radii (R ≤ 200–400 m and for all tremors) the mt values range from about 1.20 to 1.39, which indicates a slowdown in the accumulation process as the system approaches failure. A similar trend is observed in the advancement-to-failure BSR(A) models, where mA is negative at small scales (R ≤ 100 and 200 m) and increases to around 1 for broader spatial domains (R ≤ 300–400 m and all tremors), representing almost linear Benioff strain release.
The negative m-values (both mt and mA) are the nonlinear regression artifacts, which appeared due to the short period (two weeks) and the relatively small number of data points, and a regression algorithm could not find the appropriate global minimum of the objective function. However, the number of data points was still enough to find the unknown regression parameters, i.e., the data set was larger than the unknown parameters. Mathematically, the negative m-value produced complex numbers which were not expected in the models.
Nevertheless, it still implies an absence of the expected precursory acceleration in cumulative Benioff strain release. Moreover, the selected short period (two weeks) and the relatively small number of data points reflect the significant reduction in longwall face advancement in induced seismicity. When mining operations are suddenly reduced, the continuous accumulation of seismic energy is interrupted, resulting in a lack of the expected precursor acceleration—where m would normally be positive. Such behavior can also be interpreted as reflecting alternative energy dissipation processes or changes in the stress regime that do not follow the classic accelerating pattern.
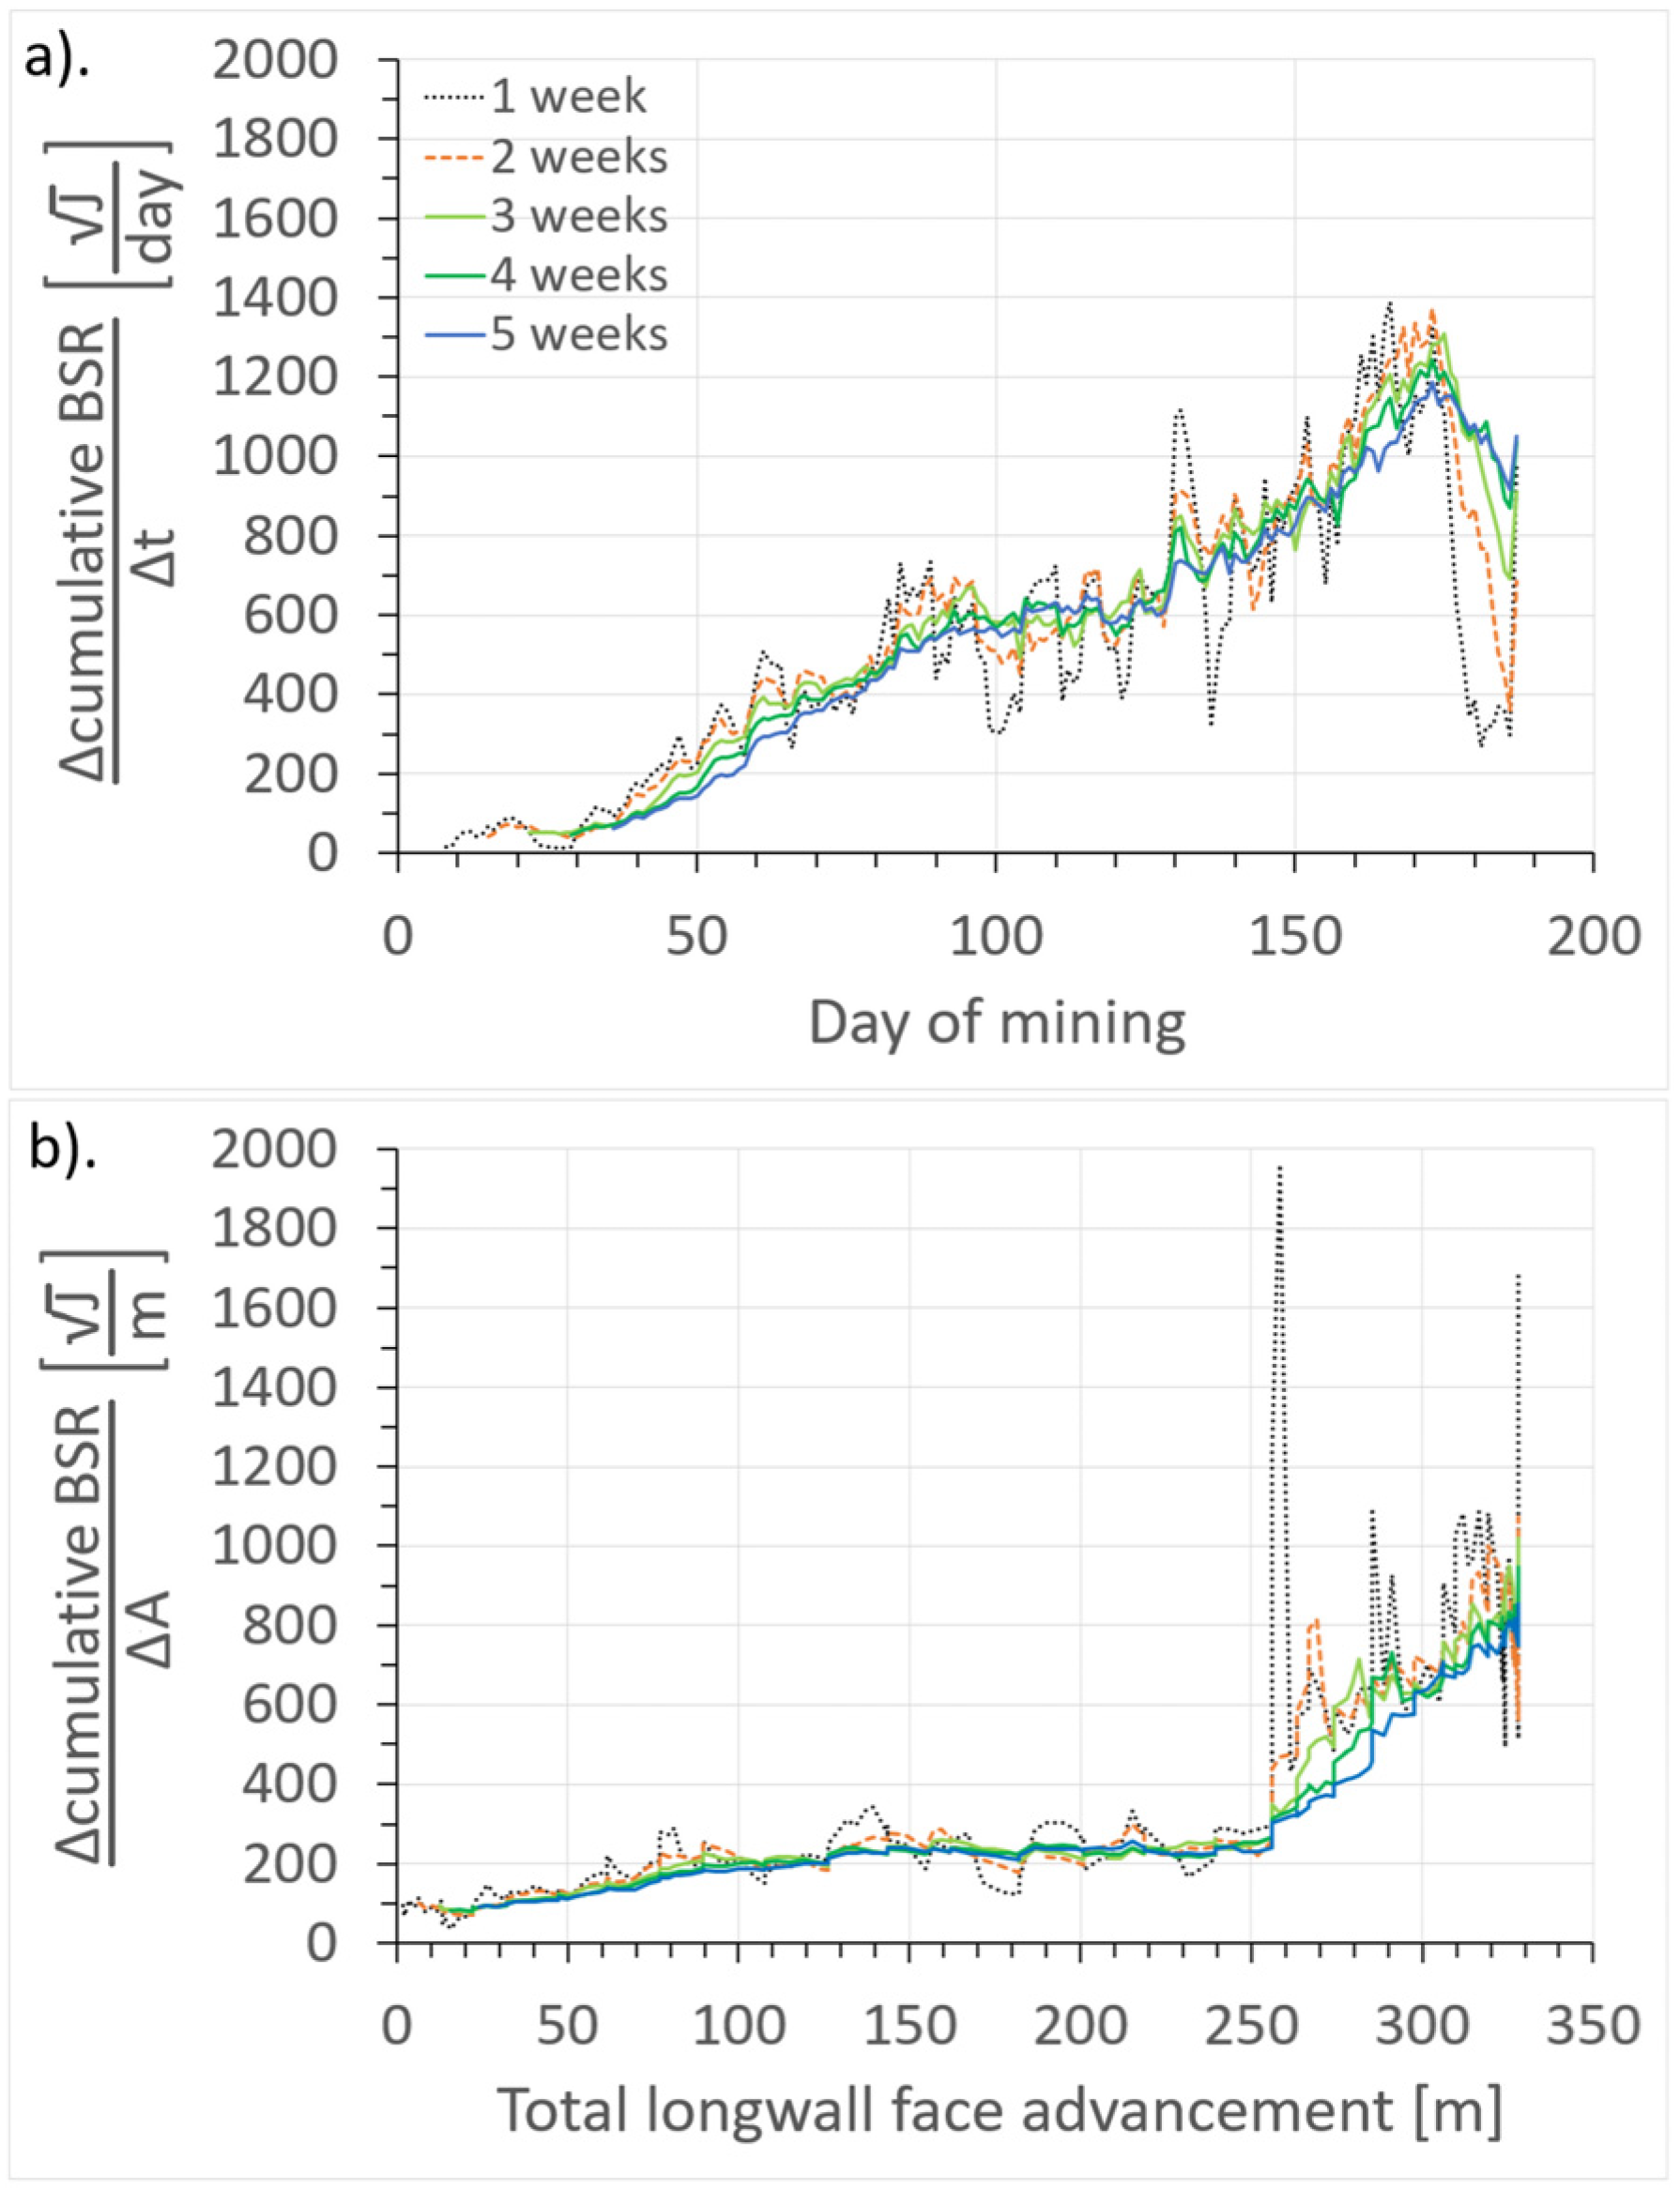
An analysis was performed on the cumulative Benioff strain release trends, examining their variation over time as well as in relation to the longwall face advancement. For this study, trends were determined for various moving windows ranging from 1 to 5 weeks, with each window shifting by one day, in order to account for a similar range of technological processes, including mining operations and rockburst prevention. In each of these intervals, the trend was obtained by subtracting the values recorded at the endpoints—considering both the cumulative BSR and the corresponding days or longwall face advancement. Figure 7 presents the cumulative BSR trends as a function of time and longwall face advancement for various window lengths.
The cumulative BSR trend over time (Figure 7a) demonstrates that in shorter windows (1–2 weeks), fluctuations are significant, while longer windows (3–5 weeks) result in a smoother trend with reduced variability. Approximately two weeks before the rockburst, the cumulative BSR trend over time was approximately 1323 J1/2/day for a 1 week window, 1371 J1/2/day for a 2 week window, 1281 J1/2/day for a 3 week window, 1242 J1/2/day for a 4 week window, and 1187 J1/2/day for a 5 week window. Regardless of the chosen window length, the trend was similar. The trend has been steadily decreasing over the last two weeks, irrespective of the window length (Figure 7a), and this decline is attributed to limitations in longwall face advance, as evidenced by a clear reduction in seismic activity over time. On the day before the rockburst, the trend values were approximately 297 J1/2/day for a 1 week window, 359 J1/2/day for a 2 week window, 690 J1/2/day for a 3 week window, 872 J1/2/day for a 4 week window, and 918 J1/2/day for a 5 week window.
The cumulative BSR trend over the longwall face advancement exhibits a progressively pronounced increase, starting at approximately 250 m (Figure 7b). However, immediately preceding the rockburst, a noticeable decline is observed when using only shorter windows (1–2 weeks). In contrast, longer windows (3–5 weeks) maintain a high trend value until the rockburst. The average trend from about 250 m of advancement to the day before the rockburst was approximately 753 J1/2/m. However, on the day before the rockburst, the trend values were approximately 513 J1/2/m for a 1 week window, 561 J1/2/m for a 2 week window, 775 J1/2/m for a 3 week window, 795 J1/2/m for a 4 week window, and 748 J1/2/m for a 5 week window. In the analyzed case, the seismicity relative to longwall face advancement did not decrease as significantly as it did when compared to time.

4. Discussion

The study examined seismological parameters related to the longwall mining of coal seam No. 504 in the Bielszowice part of the Ruda Hard Coal Mine (USCB). It focused on the extraction of the 001z longwall panel under complex geological and mining conditions that induced significant seismic activity and ultimately ended prematurely due to a rockburst. A retrospective analysis was conducted with full awareness of the mining operation’s outcome, which allowed for a deeper insight into the seismic behavior during excavation and the factors influencing mine stability.
Key parameters such as tremor frequency and seismic energy, but also various measures related to seismic energy, were analyzed over discrete time intervals (Figure 3) and cumulatively (Figure 4). This approach facilitated a detailed exploration of cyclicity, trends, and the evolution of seismic activity as the longwall face advanced. Furthermore, the analysis linked cumulative seismic parameters to operational factors (Figure 4b), emphasizing that the variability in longwall face advancement plays a crucial role in stress redistribution within the rock mass.
The presented study confirms many established aspects of mining-induced seismicity. In the early phase of longwall mining, seismic activity was low due to minimal face advancement, confirming earlier observations that limited excavation produces fewer seismic events and associated stress changes [12,13]. A cyclic pattern in seismic energy release, characterized by periodic peaks approximately every four weeks, is evident and aligns with findings reported in earlier works that documented similar fluctuations as consequences of cyclic stress buildup and relaxation within the rock mass [14,15,16]. The cyclic stress buildup observed in the study is closely linked to the repetitive advancement of the longwall face and the progressive deformation of the surrounding rock mass, including the development of a high-roof caving zone. As mining progresses, the roof strata—particularly the thick sandstone layers above—begin to fracture and cave in, forming the high-roof collapse. The mechanical properties of these sandstones, such as their brittleness and stiffness, contribute to stress accumulation by temporarily bearing increased loads before fracturing occurs. This process causes stress to build up cyclically: as the longwall face advances, the load previously supported by the extracted coal and the caved roof strata is transferred to the intact sandstone layers, raising local stress levels. Once the stress exceeds the rock strength, fracturing and seismic energy release occur, corresponding to the observed seismic peaks roughly every four weeks. As this study focuses on a single case, the generalization of the observed four-week cyclicity to other mines or geological settings is limited. Cyclic patterns may be influenced by site-specific factors such as local geology, mining schedules, and operational practices, which can vary widely between locations.
Moreover, cumulative analyses demonstrate that integrated seismic metrics effectively track progressive stress redistribution in mining environments [17,18,19,20]. Such cumulative metrics can serve as reliable indicators of potential hazardous events, thereby providing a robust framework for risk management in mining operations [21,22,23,24,25,26,27]. These findings are consistent with the evolution of microseismic frequency spectra as precursors to roof-fall–triggered rockbursts [28] and with statistical approaches that utilize temporal and spatial seismic trends to forecast induced seismicity [29]. Moreover, the influence of local geological conditions on seismic behavior is corroborated by recent investigations [38,39,40]. The use of temporal trend tests and geomechanical model analyses to predict rockburst occurrence confirms the predictive value of continuous seismic monitoring in delineating hazardous conditions [41,42].
The cumulative tremor counts and seismic energy were analyzed also as functions of longwall face advancement (Figure 4b). A steeper increase in both cumulative tremor counts and seismic energy was observed from roughly 250 m of total face advance, with only a slight decrease in energy release immediately preceding the rockburst. A similar trend was observed in the relationship between total seismic energy and the volume of extracted coal (Figure 5), where a slight decrease in energy release occurred directly prior to the rockburst. This decrease can be primarily attributed to stress redistribution related to operational factors, particularly a reduction in longwall face advancement. When advancement slows, the input of new stress and strain into the rock mass decreases, causing a temporary drop in seismic activity. In mining environments, such operational interruptions—like slowing or pausing excavation—lead to stress redistribution that temporarily lowers seismic energy release. Thus, this slight decrease reflects a complex interplay between mining progress, stress redistribution, and seismic response. It underscores the importance of linking seismic monitoring directly to mining activity in this case, rather than relying solely on time-based analyses.
Thus, the longwall face advancement emerged as a crucial factor affecting the stability of the seismic energy release process. Advancement-based seismological parameters exhibited greater stability than their time-based counterparts.
This consistency in the relationship between mining progress and seismic energy release, together with the reproducible cyclic behavior and corroborative cumulative monitoring techniques, reinforces the established understanding of stress accumulation and release processes in underground mining. This integrated, multifactor approach provides a refined understanding of the interactions between operational dynamics and geological and mining conditions that govern seismic energy release.
The observed accelerating trend in cumulative BSR release prior to rockburst is analogous to the tectonic patterns [49,50]. A power-law increase in cumulative Benioff strain release has been identified as the system nears its critical failure state (Figure 6a, Table 1). This behavior is similarly observed in regional strain release characteristics [51] and in theoretical models of time-dependent rupture [52]. Furthermore, the concept of accelerating seismic moment or energy release, as noted in studies examining preshock behavior [54,55] and in the critical earthquake framework [58,61], is supported by the present findings, which demonstrate that cumulative strain exhibits an accelerating trend over time.
Distinct differences, however, are evident when comparing the controlled mining environment to natural tectonic settings. Unlike many tectonic sequences where strain acceleration typically persists uninterrupted until failure [49,50,51,52], the present analysis identifies a short-term phase during which a decline in seismic activity occurs immediately before the main tremor and rockburst (Figure 6a). This deviation from a strictly accelerating sequence is attributed to operational factors unique to mining, such as a significant reduction in longwall face advancement. The decline in the acceleration exponent at small spatial scales (R ≤ 100 m), which leads to near-zero and negative values (Table 3), contrasts with the uninterrupted acceleration typically reported for natural earthquakes [53,56,57,59,60], and in tremors analyzed during non-disturbed mining [32].
A novel method was introduced to directly correlate cumulative Benioff strain release with longwall face advancement (Figure 6b). Instead of relying on traditional time-based assessments, this approach ties seismic energy release directly to each increment of face advancement, reflecting the dynamic response of the rock mass to excavation activities. As the system approaches its critical failure state during longwall face advancement, a power-law increase in cumulative Benioff strain release is observed (Table 2). Moreover, by relating seismic energy release directly to longwall face advancement rather than to elapsed time, the model establishes a more direct connection between operational progress and changes in strain. This approach enables the isolation of geomechanical effects specifically attributable to mining activities, which may be obscured in time-based analyses by non-steady excavation rates. Both models capture the accelerating release of strain energy preceding failure, consistent with the critical-point hypothesis. However, their predictive performance diverges depending on the stability of mining operations. The time-to-failure model, rooted in empirical studies of natural and induced seismicity, aligns well with classical critical-point behavior under stable conditions. Yet, it is more sensitive to deviations during abrupt reductions in longwall face advancement, which disrupt the temporal continuity of strain accumulation. In contrast, the advancement-to-failure model incorporates mining progress directly, offering a physically grounded alternative that remains more robust under variable operational conditions. This divergence highlights the importance of linking stress accumulation to both time and operational parameters when applying critical-point models to induced seismicity.
The advancement-based model exhibits an acceleration pattern that is closer to the characteristic behavior observed immediately before the critical event (Figure 6b). Although this approach more closely aligns with the critical-point framework, negative values of the acceleration exponent have also been observed during the last two weeks before the rockburst, specifically for search radii of R ≤ 100 m and R ≤ 200 m (Table 4). The presented approach effectively captured the accelerating pattern of seismic energy release as the system approached a critical failure state, a crucial aspect for developing predictive systems aimed at mitigating hazardous mining events. However, the study also reveals significant limitations inherent in current predictive models. Notably, during the final two weeks before the rockburst, the data became irregular. This change is attributed to a significant reduction in longwall face advancement that disrupted the continuous buildup of seismic energy and resulted in transient negative values of the acceleration exponent. This irregularity poses a major challenge to precisely forecasting the timing and intensity of the event during this critical phase.
The cumulative BSR trends were analyzed using moving windows with durations ranging from 1 to 5 weeks, each shifted by 1 day. Analyzing the trend parameter is critical because it can capture the underlying tendency in seismic energy accumulation. In the time-based analysis, a significant decline in the cumulative BSR trends was observed approximately two weeks before the main tremor. This decrease correlated strongly with reduced longwall face advancement, indicating that limitations in advancement directly influenced the seismic energy release pattern. Although the advancement-based analysis also shows a transient decline when using shorter moving windows, this approach generally yields a steadier trend because it inherently normalizes the energy release against the physical displacement of the longwall face. Consequently, while both methods reflect the impact of operational limitations on cumulative BSR, the advancement-based model provides a more robust and consistent depiction of the stain buildup, effectively isolating the influence of mining progress on the precursory seismic behavior.
Overall, the results indicate that longwall face advancement is a critical factor in controlling seismic energy emission. The observed cyclic variations, cumulative energy trends, and deviations from anticipated energy release patterns likely reflect complex interactions between mining operations, geological conditions, and stress redistribution processes. These insights emphasize the need for integrated monitoring approaches to better predict rockbursts and manage seismic hazards during longwall mining. Observed seismicity should be correlated not only with time but also with longwall face advancement. In the analyzed case, this approach enabled more accurate tracking of stress buildup and early detection of hazardous conditions. Moreover, recognizing cyclic patterns in seismic energy release can inform operational planning, allowing for increased monitoring and precautionary measures during peak stress periods. In the analyzed case, a drastic decrease in longwall face advancement only disrupted seismicity but was not enough to prevent the rockburst. However, careful management of the longwall face advancement rate remains crucial in minimizing rockburst hazard. Active rockburst prevention methods, such as controlled blasting, can be employed to proactively release accumulated stress in the rock mass in a controlled manner, thereby reducing the likelihood of sudden, hazardous rockbursts. Integrating these measures with seismic monitoring and operational control forms a comprehensive strategy for mitigating seismic risks in underground mining.

5. Conclusions

Based on the analysis of the seismic activity observed during the extraction of the 001z longwall panel in coal seam No. 504tl—disrupted by a rockburst—the following conclusions can be inferred:
  • Seismic activity and energy release during the longwall mining of a coal seam are correlated with geological and mining conditions. Caving of the immediate and high roof rocks, previous extraction of adjacent coal seams resulting in edge-induced stress increases and a destress effect, and the rate of ongoing extraction of the longwall panel are reflected in the recorded seismic activity.
  • Seismic energy release may demonstrate a clear cyclicity throughout the mining process. This regular pattern provides valuable insight for anticipating dynamic changes and potential rockbursts.
  • Mining progress, expressed, for example, by longwall face advancement or volume of extracted coal, is a critical factor in controlling seismic energy emission.
  • With reduced longwall panel extraction, seismic activity per unit of longwall face advancement either remained proportional or experienced a slight decline. Over time, however, a clear reduction in activity became evident.
  • A clear, accelerating buildup of cumulative BSR over time was observed before a moment of rockburst, although this pattern included a short phase of reduced activity correlated with a reduction in longwall face advancement. In the proposed advancement-to-failure models, the acceleration remains closer to the moment of rockburst, as the seismic activity relative to face advancement does not drop as drastically as in the time-based models. This behavior suggests that the advancement-based approach may more precisely capture the changes in the system’s stress state preceding critical events in hard coal mines. Moreover, advancement-to-failure models exhibited the highest KA values in the immediate vicinity of the main tremor focus (R ≤ 100 m), indicating a stronger local effect. The lowest mA value in this near-focus region suggests a rapid and localized strain concentration. The most critical dynamics of strain accumulation occurred in close proximity to the main tremor focus.
  • A sudden reduction in longwall face advancement interrupted the typical continuous buildup of strain. In the cumulative BSR failure models, the expected precursory acceleration was absent—or even reversed. During this period, the time-to-failure and advancement-to-failure models demonstrated slightly negative m values in the immediate vicinity of the main tremor focus, i.e., within radii of R ≤ 100 m and R ≤ 200 m, respectively. The advancement-to-failure model effectively describes strain accumulation linked to mining progress and provides valuable insights into mechanical system responses. Similarly, the time-to-failure model captures the temporal evolution of strain release and seismicity, but under stable longwall face advancement. However, the accuracy of both models is limited during significant reductions in longwall face advancement, with the time-to-failure model tending to exhibit greater deviations under these conditions. This leads to regression artifacts such as negative m values and deviations from the expected acceleration pattern due to complex stress redistribution.
  • The cumulative BSR trends exhibited a marked decline over time preceding the rockburst, which appears to be due to a decrease in seismic activity resulting from reduced longwall face advancement rather than from a phase of typical quiescence. Conversely, when examining cumulative BSR relative to longwall face advancement, the trend was more sustained—particularly for wider windows—suggesting that the spatial evolution of strain release is less disrupted by the decline in extraction.

Author Contributions

Conceptualization, Ł.W.; methodology, Ł.W.; software, Ł.W.; validation, Ł.W., R.P. and M.J.M.; formal analysis, Ł.W., R.P. and M.J.M.; investigation, Ł.W.; resources, R.P.; data curation, R.P.; writing—original draft preparation, Ł.W., R.P., D.B.A. and M.J.M.; writing—review and editing, Ł.W., R.P., D.B.A. and M.J.M.; visualization, Ł.W. and R.P.; supervision, D.B.A.; project administration, D.B.A. All authors have read and agreed to the published version of the manuscript.

Funding

This research received no external funding.

Institutional Review Board Statement

Not applicable.

Informed Consent Statement

Not applicable.

Data Availability Statement

Restrictions apply to the availability of these data. Data were obtained from the Polish Mining Group and are available from the authors with the permission of the Polish Mining Group.

Acknowledgments

We would like to thank the Polish Mining Group for providing the data and materials and allowing the discussion of the results.

Conflicts of Interest

Author Rafał Pakosz was employed by the company Polish Mining Group, Ruda Hard Coal Mine. The remaining authors declare that the research was conducted in the absence of any commercial or financial relationships that could be construed as a potential conflict of interest.

References

  1. Bollinger, G.A. Microearthquake Activity Associated with Underground Coal Mining in Buchanan County, Virginia, U.S.A. Pure Appl. Geophys. 1989, 129, 407–413. [Google Scholar] [CrossRef]
  2. Swanson, P.; Boltz, M.S.; Chambers, D. Seismic Monitoring Strategies for Deep Longwall Coal Mines; National Institute for Occupational Safety and Health (NIOSH) Publication No. 2017-102, RI 9700, October 2016; NIOSH: Cincinnati, OH, USA, 2016. [Google Scholar]
  3. Ghosh, G.K.; Sivakumar, C. Application of Underground Microseismic Monitoring for Ground Failure and Secure Longwall Coal Mining Operation: A Case Study in an Indian Mine. J. Appl. Geophys. 2018, 150, 21–39. [Google Scholar] [CrossRef]
  4. Verdon, J.P.; Kendall, J.-M.; Butcher, A.; Luckett, R.; Baptie, B.J. Seismicity Induced by Longwall Coal Mining at the Thoresby Colliery, Nottinghamshire, U.K. Geophys. J. Int. 2018, 212, 942–954. [Google Scholar] [CrossRef]
  5. Cao, J.; Dou, L.; Zhang, X.; Gong, S.; Han, Y.; Li, G.; Liu, C.; Chen, Y. Study on the Mechanism of Mining-Induced Seismicity Triggered by Fracture of Hard and Extremely Thick Rock Stratum: A Case Study. Front. Earth Sci. 2025, 13, 1556612. [Google Scholar] [CrossRef]
  6. Marcak, H.; Mutke, G. Seismic Activation of Tectonic Stresses by Mining. J. Seismol. 2013, 17, 1139–1148. [Google Scholar] [CrossRef]
  7. Konicek, P.; Kajzar, V.; Schreiber, J. Seismic Activity of Hard Coal Longwall Mining in Protective Shaft Pillar near Closed Room and Pillar Panel. IOP Conf. Ser. Earth Environ. Sci. 2021, 833, 012087. [Google Scholar] [CrossRef]
  8. Lurka, A. Spatio-Temporal Hierarchical Cluster Analysis of Mining-Induced Seismicity in Coal Mines Using Ward’s Minimum Variance Method. J. Appl. Geophys. 2021, 184, 104249. [Google Scholar] [CrossRef]
  9. Jarufe, J. Using Seismic Hazard to Improve Underground Mine Planning. In Deep Mining 2024: Proceedings of the 10th International Conference on Deep and High Stress Mining; Andrieux, P., Cumming-Potvin, D., Eds.; Australian Centre for Geomechanics: Perth, Australia, 2024; pp. 1309–1318. [Google Scholar]
  10. Li, M.; Kurata, M. Probabilistic Updating of Fishbone Model for Assessing Seismic Damage to Beam-Column Connections in Steel Moment-Resisting Frames. Comput. Aided Civ. Inf. Eng. 2019, 34, 790–805. [Google Scholar] [CrossRef]
  11. Zhang, X.; Guo, D.; Dias, D.; Sun, Z. Dynamic Probabilistic Analysis of Non-Homogeneous Slopes Based on a Simplified Deterministic Model. Soil Dyn. Earthq. Eng. 2021, 142, 106563. [Google Scholar] [CrossRef]
  12. Cook, N. Seismicity Associated with Mining. Eng. Geol. 1976, 10, 99–122. [Google Scholar] [CrossRef]
  13. Brady, B.T. Anomalous Seismicity Prior to Rock Bursts: Implications for Earthquake Prediction. Pure Appl. Geophys. 1977, 115, 357–374. [Google Scholar] [CrossRef]
  14. Gibowicz, S.J. Space and Time Variations of the Frequency-Magnitude Relation for Mining Tremors in the Szombierki Coal Mine in Upper Silesia, Poland. Acta Geophys. Pol. 1979, 27, 39–49. [Google Scholar]
  15. Sato, K.; Fujii, Y. Induced Seismicity Associated with Longwall Coal Mining. Int. J. Rock Mech. Min. Sci. Geomech. Abstr. 1988, 25, 253–262. [Google Scholar] [CrossRef]
  16. Gibowicz, S.J. Seismicity Induced by Mining. Adv. Geophys. 1990, 32, 1–74. [Google Scholar]
  17. Young, R.P.; Maxwell, S.C.; Urbancic, T.I.; Feignier, B. Mining-Induced Microseismicity: Monitoring and Applications of Imaging and Source Mechanism Techniques. Pure Appl. Geophys. 1992, 139, 697–719. [Google Scholar] [CrossRef]
  18. Eneva, M.; Young, R.P. Evaluation of Spatial Patterns in the Distribution of Seismic Activity in Mines: A Case Study of Creighton Mine, Northern Ontario (Canada). In Rockbursts and Seismicity in Mines; Balkema: Lisse, The Netherlands, 1993; pp. 175–180. [Google Scholar]
  19. Kijko, A.; Funk, C.W.; Brink, A.V.Z. Identification of Anomalous Patterns in Time-Dependent Mine Seismicity. In Rockbursts and Seismicity in Mines; Balkema: Lisse, The Netherlands, 1993; pp. 205–210. [Google Scholar]
  20. Gibowicz, S.J.; Kijko, A. An Introduction to Mining Seismology; Academic Press: San Diego, CA, USA, 1994. [Google Scholar]
  21. Lasocki, S. Precursor of Strong Tremors? Dispersion of Foci–A Possible Precursor of Strong Tremors? Acta Mont. 1996, 100, 83–89. [Google Scholar]
  22. Srinivasan, C.; Arora, S.K.; Yaji, R.K. Use of Mining and Seismological Parameters as Pre-monitors of Rockbursts. Int. J. Rock Mech. Min. Sci. 1997, 34, 1001–1008. [Google Scholar] [CrossRef]
  23. Eneva, M. In Search for a Relationship between Induced Microseismicity and Larger Events in Mines. Tectonophysics 1998, 289, 91–104. [Google Scholar] [CrossRef]
  24. Mendecki, A.J. A Guide to Routine Seismic Monitoring in Mines; Creda Communications: Cape Town, South Africa, 1999. [Google Scholar]
  25. Gibowicz, S.J.; Lasocki, S. Seismicity Induced by Mining: Ten Years Later. Adv. Geophys. 2001, 44, 39–181. [Google Scholar]
  26. Bischoff, M.; Cete, A.; Fritschen, R.; Meier, T. Coal Mining Induced Seismicity in the Ruhr Area, Germany. Pure Appl. Geophys. 2010, 167, 63–75. [Google Scholar] [CrossRef]
  27. Mendecki, A.J. Characteristics of Seismic Hazard in Mines: Keynote Lecture. In Characteristics of Seismic Hazard in Mines; Mendecki, A.J., Ed.; Academia.edu: San Francisco, CA, USA, 2012; pp. 1–23. [Google Scholar]
  28. Lu, C.-P.; Dou, L.-M.; Zhang, N.; Xue, J.-H.; Wang, X.-N.; Liu, H.; Zhang, J.-W. Microseismic Frequency-Spectrum Evolutionary Rule of Rockburst Triggered by Roof Fall. Int. J. Rock Mech. Min. Sci. 2013, 64, 6–16. [Google Scholar] [CrossRef]
  29. Mutke, G.; Dubiński, J.; Lurka, A. New Criteria to Assess Seismic and Rock Burst Hazard in Coal Mines. Arch. Min. Sci. 2015, 60, 743–760. [Google Scholar] [CrossRef]
  30. Konicek, P.; Waclawik, P. Stress Changes and Seismicity Monitoring of Hard Coal Longwall Mining in High Rockburst Risk Areas. Tunn. Undergr. Space Technol. 2018, 81, 237–251. [Google Scholar] [CrossRef]
  31. Dong, L.; Sun, D.; Shu, W.; Li, X.; Zhang, L. Statistical Precursor of Induced Seismicity Using Temporal and Spatial Characteristics of Seismic Sequence in Mines. In Advances in Acoustic Emission Technology; WCAE 2017; Springer Proceedings in Physics; Shen, G., Zhang, J., Wu, Z., Eds.; Springer: Cham, Switzerland, 2019; Volume 218. [Google Scholar] [CrossRef]
  32. Mendecki, M.J.; Wojtecki, Ł.; Zuberek, W.M. Case Studies of Seismic Energy Release and Benioff Strain in Underground Coal Mines. Pure Appl. Geophys. 2019, 176, 2479–2500. [Google Scholar] [CrossRef]
  33. Rudziński, Ł.; Mirek, K.; Mirek, J. Rapid Ground Deformation Corresponding to a Mining-Induced Seismic Event Followed by a Massive Collapse. Nat. Hazards 2019, 96, 461–471. [Google Scholar] [CrossRef]
  34. Nordström, E.; Dineva, S.; Nordlund, E. Back Analysis of Short-Term Seismic Hazard Indicators of Larger Seismic Events in Deep Underground Mines (LKAB, Kiirunavaara Mine, Sweden). Pure Appl. Geophys. 2020, 177, 763–785. [Google Scholar] [CrossRef]
  35. Ma, T.-h.; Tang, C.-a.; Liu, F.; Zhang, S.-c.; Feng, Z. Microseismic Monitoring, Analysis and Early Warning of Rockburst. Geomat. Nat. Hazards Risk 2021, 12, 2956–2983. [Google Scholar] [CrossRef]
  36. Mendecki, M.J.; Pakosz, R.; Wojtecki, Ł.; Zuberek, W.M. Spatiotemporal Analysis of Elastic and Inelastic Deformations in Roof Rocks from Seismological Observations. Int. J. Min. Sci. Technol. 2021, 31, 389–402. [Google Scholar] [CrossRef]
  37. Zhang, C.; Jin, G.; Liu, C.; Li, S.; Xue, J.; Cheng, R.; Wang, X.; Zeng, X. Prediction of Rock-Bursts in a Typical Island Working Face of a Coal Mine through Microseismic Monitoring Technology. Tunn. Undergr. Space Technol. 2021, 113, 103972. [Google Scholar] [CrossRef]
  38. Yang, Y.; Cao, A.; Liu, Y.; Bai, X.; Yan, Z.; Wang, S.; Wang, C. Understanding the Mechanism of Strong Mining Tremors near the Goaf Area of Longwall Mining: A Case Study. Appl. Sci. 2023, 13, 5364. [Google Scholar] [CrossRef]
  39. Goulet, A.; Grenon, M.; Hadjigeorgiou, J. Understanding Seismic Hazards Associated with Development Mining: The Role of Local Geology and Structures. Geotech. Geol. Eng. 2024, 42, 3137–3169. [Google Scholar] [CrossRef]
  40. Sun, W.; Wang, E.; Li, J.; Liu, Z.; Zhang, Y.; Qiu, J. Mining-Induced Earthquake Risk Assessment and Control Strategy Based on Microseismic and Stress Monitoring: A Case Study of Chengyang Coal Mine. Appl. Sci. 2024, 14, 11951. [Google Scholar] [CrossRef]
  41. Xue, Y.; Li, Z.; Song, D.; He, X.; Wang, H.; Zhou, C.; Chen, J.; Sobolev, A. A Method to Predict Rockburst Using Temporal Trend Test and Its Application. J. Rock Mech. Geotech. Eng. 2024, 16, 909–923. [Google Scholar] [CrossRef]
  42. Lin, H.; Zhang, Q.; Duan, K.; Wang, P.; Zhang, X.; Liu, C.; Chen, C.; Zhao, Y. Geo-mechanical Model Test on Strong Mine Tremors Induced by the Breakage of High Thick-and-Hard Overlying Strata During Longwall Coal Retreat Mining. Rock Mech. Rock Eng. 2025, 58, 5549–5578. [Google Scholar] [CrossRef]
  43. Mao, H.; Xu, N.; Li, X.; Li, B.; Xiao, P.; Li, Y.; Li, P. Analysis of Rockburst Mechanism and Warning Based on Microseismic Moment Tensors and Dynamic Bayesian Networks. J. Rock Mech. Geotech. Eng. 2023, 15, 2521–2538. [Google Scholar] [CrossRef]
  44. Lurka, A. Combining Deep Neural Network and Spatio-temporal Clustering to Automatically Assess Rockburst and Seismic Hazard–Case Study from Marcel Coal Mine in Upper Silesian Basin, Poland. Comput. Geosci. 2024, 192, 105709. [Google Scholar] [CrossRef]
  45. Li, X.; Si, G.; Cao, W.; Cai, W.; Oh, J.; Ismet, C. A Sequence of Seismic Event Triggering in Longwall Coal Mines Based on the Aftershock Cascade Theory. Int. J. Rock Mech. Min. Sci. 2024, 182, 105883. [Google Scholar] [CrossRef]
  46. Dubiński, J.; Wierzchowska, Z. Methods for Calculating the Seismic Energy of Tremors in Upper Silesia. Sci. Work. Cent. Min. Inst. 1973, 591, 3–23. (In Polish) [Google Scholar]
  47. Stec, K.; Lurka, A. Characteristics and Seismologic Methods of Analysis of Seismic Activity in the Upper Silesian Coal Basin. Pol. Min. Rev. 2015, 1, 83–93. (In Polish) [Google Scholar]
  48. Gerlach, Z. Prediction of Seismic Hazard in Mining Conditions. In Geophysical Investigations in Mines; Dubiński, J., Pilecki, Z., Zuberek, W.M., Eds.; IGSMiE PAN: Cracow, Poland, 2001. (In Polish) [Google Scholar]
  49. Benioff, H. Energy Release in Earthquakes. Bull. Seismol. Soc. Am. 1951, 41, 1676–1687. [Google Scholar]
  50. Bath, M.; Benioff, H. The Aftershock Sequence of the Kamchatka Earthquake of November 4, 1952. Bull. Geol. Soc. Am. 1958, 48, 1–15. [Google Scholar] [CrossRef]
  51. Chouhan, R.K.S. Regional Strain Release Characteristics for Indian Regions. Bull. Geol. Soc. Am. 1966, 56, 749–754. [Google Scholar] [CrossRef]
  52. Das, S.; Scholz, C.H. Theory of Time-Dependent Rupture in the Earth. J. Geophys. Res. Solid Earth 1981, 86, 6039–6051. [Google Scholar] [CrossRef]
  53. Kawada, Y.; Nagahama, H. Cumulative Benioff Strain Release, Modified Omori’s Law and Transient Behaviour of Rocks. Tectonophysics 2006, 424, 157–166. [Google Scholar] [CrossRef]
  54. Jiang, C.; Wu, Z. Test of the Preshock Accelerating Moment Release (AMR) in the Case of the 26 December 2004 Mw 9.0 Indonesia Earthquake. Bull. Seismol. Soc. Am. 2005, 95, 2016–2025. [Google Scholar] [CrossRef]
  55. Jiang, C.; Wu, Z. Benioff Strain Release Before Earthquakes in China: Accelerating or Not? Pure Appl. Geophys. 2006, 163, 1965–1976. [Google Scholar] [CrossRef]
  56. Voight, B. A Relation to Describe Rate-Dependent Material Failure. Science 1989, 243, 200–203. [Google Scholar] [CrossRef]
  57. Varnes, D.J. Predicting Earthquakes by Analyzing Accelerating Precursory Seismic Activity. Pure Appl. Geophys. 1989, 130, 661–686. [Google Scholar] [CrossRef]
  58. Jaumé, S.C.; Sykes, L.R. Evolving Towards a Critical Point: A Review of Accelerating Seismic Moment/Energy Release Prior to Large and Great Earthquakes. Pure Appl. Geophys. 1999, 155, 279–305. [Google Scholar] [CrossRef]
  59. Brehm, D.J.; Braile, L.W. Intermediate-Term Earthquake Prediction Using Precursory Events in the New Madrid Seismic Zone. Bull. Seismol. Soc. Am. 1998, 88, 564–580. [Google Scholar] [CrossRef]
  60. Brehm, D.J.; Braile, L.W. Intermediate-Term Earthquake Prediction Using the Modified Time-to-Failure Method in Southern California. Bull. Seismol. Soc. Am. 1999, 89, 275–293. [Google Scholar] [CrossRef]
  61. Bowman, D.D.; Ouillon, G.; Sammis, C.G.; Sornette, A.; Sornette, D. An Observational Test of the Critical Earthquake Concept. J. Geophys. Res. Solid Earth 1998, 103, 24359–24372. [Google Scholar] [CrossRef]
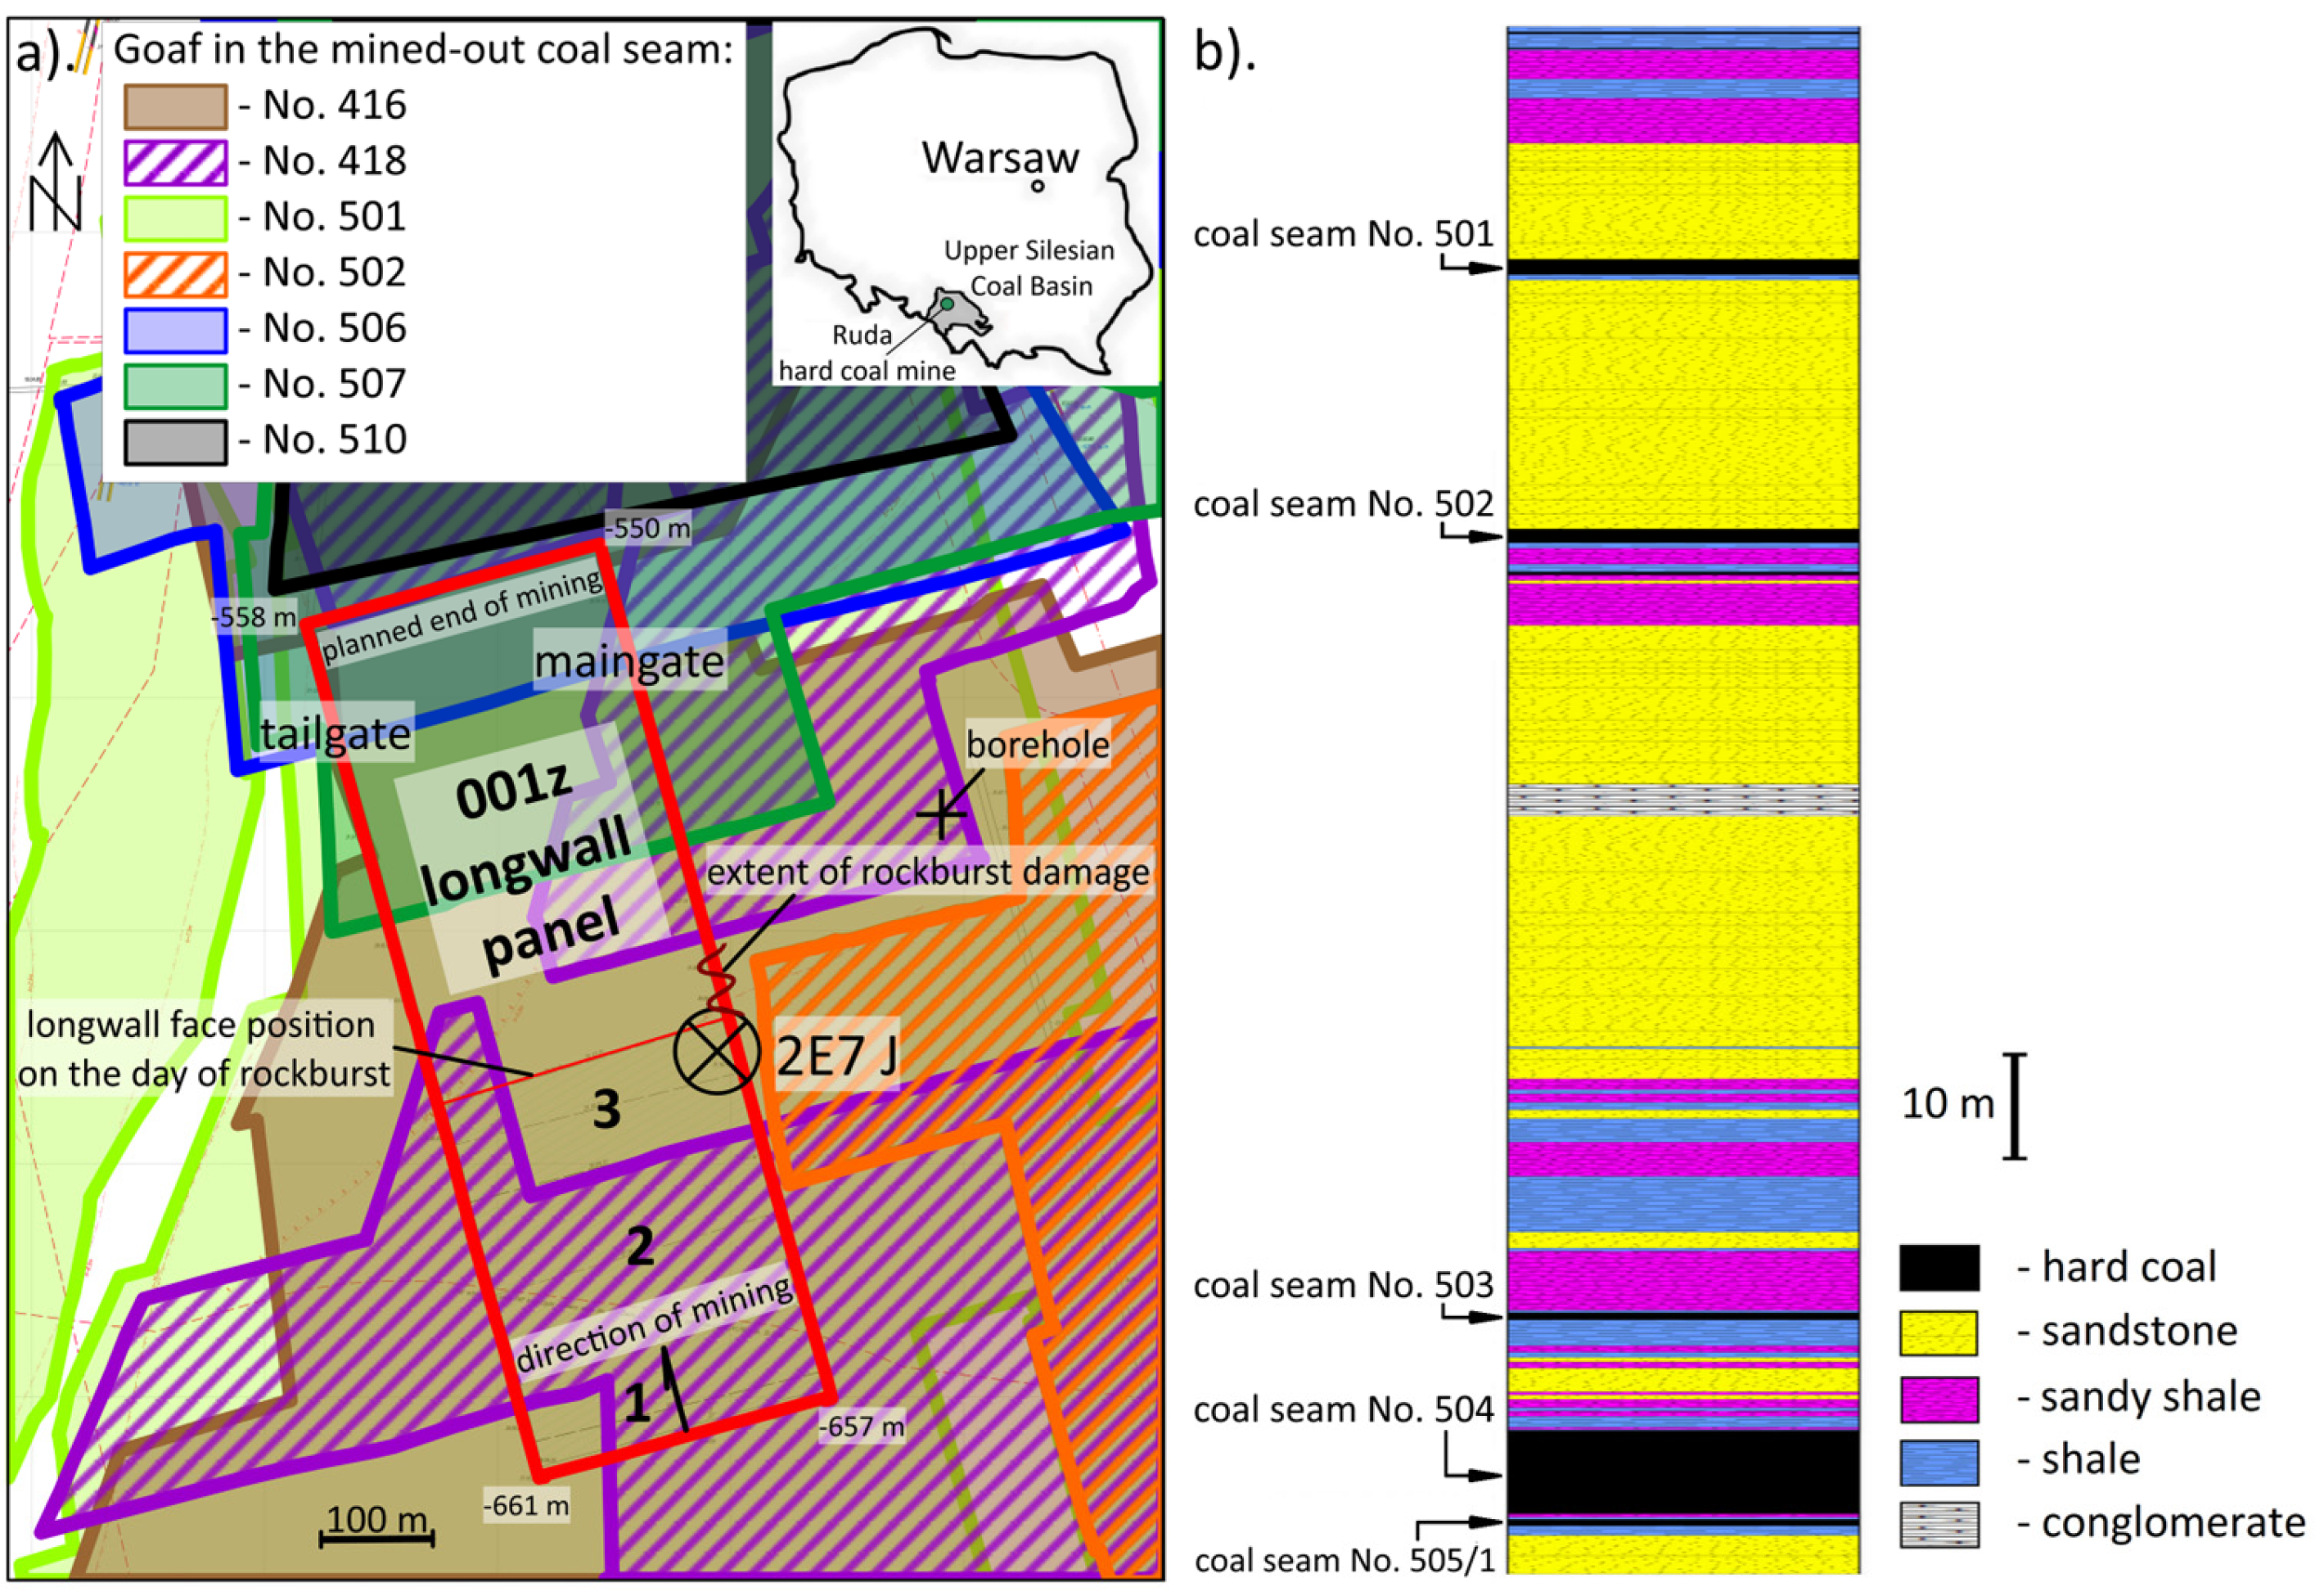
Figure 1. Projection of the 001z longwall panel within coal seam No. 504tl and the extraction extent in adjacent coal seams (a), and the geological profile of the borehole drilled in the vicinity of the 001z longwall panel (b).
Applsci 15 08897 g001
Figure 2. Seismic network on the day of the rockburst (a) and seismic activity during the extraction of the 001z longwall panel (b).
Applsci 15 08897 g002
Figure 3. The weekly distributions of longwall face advancement (a), tremor frequency (b), seismic energy (c), specific seismic energy (d), average seismic energy (e), and seismic energy per meter of longwall face advance (f).
Applsci 15 08897 g003
Figure 4. Cumulative values of selected parameters over time (a) and total longwall face advancement (b).
Applsci 15 08897 g004
Figure 5. The relationship between total seismic energy and the total volume of extracted coal from the 001z longwall panel.
Applsci 15 08897 g005
Figure 6. Cumulative BSR as a function of mining duration (a) and longwall face advancement (b), along with the determined time-to-failure and advancement-to-failure models, respectively.
Applsci 15 08897 g006
Figure 7. Cumulative BSR trends as a function of time (a) and longwall face advancement (b) for different window lengths (1–5 weeks).
Applsci 15 08897 g007
Table 1. Parameters of time-to-failure BSR(t) models determined for data collected between 8 and 25 weeks.
RadiusNumber of TremorsKtktntmt
R ≤ 100 m531384,219.214,052.31.040.04
R ≤ 200 m1393563,470.923,844.91.050.05
R ≤ 300 m1996220,420.416,339.01.230.23
R ≤ 400 m2293171,535.79904.11.380.38
All tremors2398169,481.89100.81.400.40
Table 2. Parameters of advancement-to-failure BSR(A) models determined for data collected between 8 and 25 weeks.
RadiusNumber of TremorsKAkAnAmA
R ≤ 100 m531520,632.010,388.51.020.02
R ≤ 200 m1393489,355.016,660.71.040.04
R ≤ 300 m1996181,889.711,720.51.200.20
R ≤ 400 m2293160,687.58931.51.280.28
All tremors2398156,326.78033.91.310.31
Table 3. Parameters of time-to-failure BSR(t) models determined for data collected during the last two weeks before the rockburst.
RadiusNumber of TremorsKtktntmt
R ≤ 100 m5215,682.1572.90.95−0.05
R ≤ 200 m9363,320.4136.62.391.39
R ≤ 300 m12591,654.4206.72.301.30
R ≤ 400 m137104,255.3259.12.201.20
All tremors140108,223.3262.82.211.21
Table 4. Parameters of advancement-to-failure BSR(A) models determined for data collected during the last two weeks before the rockburst.
RadiusNumber of TremorsKAkAnAmA
R ≤ 100 m5217,233.5704.20.93−0.07
R ≤ 200 m9339,268.51818.80.93−0.07
R ≤ 300 m12591,698.7566.52.021.02
R ≤ 400 m137104,253.0623.11.980.98
All tremors140108,229.1637.51.980.98
Disclaimer/Publisher’s Note: The statements, opinions and data contained in all publications are solely those of the individual author(s) and contributor(s) and not of MDPI and/or the editor(s). MDPI and/or the editor(s) disclaim responsibility for any injury to people or property resulting from any ideas, methods, instructions or products referred to in the content.