Abstract
Manual calibration of nuclear medicine scanners currently relies on handling phantoms containing radioactive sources, exposing personnel to high radiation doses and elevating cancer risk. We designed an automated detection framework for robotic inspection on the YOLOv8n foundation. It pairs a lightweight backbone with a shape-aware geometric attention module and an anchor-free head. Facing a small training set, we produced extra images with a GAN and then fine-tuned a pretrained network on these augmented data. Evaluations on a custom dataset consisting of PET/CT gantry and table images showed that the SAM-YOLOv8n model achieved a precision of 93.6% and a recall of 92.8%. These results demonstrate fast, accurate, real-time detection, offering a safer and more efficient alternative to manual calibration of nuclear medicine equipment.
1. Introduction
Nuclear medicine imaging equipment is crucial for early tumor detection [1,2], and calibration significantly affects image quality and diagnostic accuracy [3]. To ensure the safety and effectiveness of such equipment, various countries have established corresponding technical regulations for oversight, and significant advancements have also been made in nuclear medicine within China in recent years [4]. Additionally, there is growing international interest in implementing medical assistance tools based on artificial intelligence to improve diagnostic efficiency and accuracy [5]. However, current quality control and calibration procedures, such as injecting radioactive nuclides into phantoms and thoroughly mixing them, are largely reliant on manual operations. These tasks expose operators to significantly higher radiation levels than background, thereby elevating the cancer risk among professionals [6]. Therefore, conducting research on automated intelligent detection technology for nuclear medicine imaging equipment and enabling robotic systems to replace manual operations is crucial for safeguarding the health and well-being of inspection personnel.
1.1. Challenges and Motivation
Currently, the integration of robotics and machine vision technology [7] has opened up novel solutions for the inspection of nuclear medicine imaging equipment. Vision-based detection robots [8,9,10] can partially replace manual operations, significantly reducing direct contact between operators and radioactive substances, thereby enhancing the safety and efficiency of quality control procedures. Nevertheless, existing methods continue to face several notable challenges:
- Real-Time Detection in Dynamic EnvironmentsIn the context of robotic-assisted calibration tasks, it is essential for the robot to continuously capture images during its movement and to identify the target equipment in real time. This requirement necessitates the deployment of a highly efficient detection algorithm that optimally balances detection speed and accuracy. However, existing object detection methodologies often face challenges in maintaining high performance under real-time constraints, particularly on resource-constrained embedded devices [11,12].
- Limited Training Data AvailabilityAcquiring labeled images of nuclear medicine imaging equipment poses considerable challenges due to the specialized nature of imaging environments and the substantial costs associated with data collection [13,14]. Current datasets contain approximately 800 images, which is significantly below the requirements for modern deep learning-based detection models [15]. The shortage of high-quality training data remains a fundamental obstacle in this area of research. The lack of representative samples ultimately harms their performance in real-world situations.
- Lightweight Deployment for Embedded SystemsRobotic systems utilized in medical environments often function under strict computational and power constraints. The implementation of a high-performance detection algorithm requires the deployment of lightweight models with reduced memory and processing demands [16,17]. While numerous models have been optimized for general embedded applications, achieving a balance between lightweight deployment and high detection performance remains a significant challenge [18,19].
1.2. Research Objectives and Contributions
The goal of this work is to build a compact yet responsive real-time object detection framework for use in inspection robots for nuclear medicine imaging equipment. Special attention is given to issues such as real-time processing, adaptation to geometric characteristics, data scarcity during training, and integration into embedded hardware. The specific objectives are as follows:
- Enhancing Detection Accuracy with Shape-Aware ModulesDevelop and integrate a Shape-Aware module to enhance the detection capabilities of nuclear medicine imaging equipment characterized by circular PET/CT gantries. Optimize the detection head by incorporating techniques such as deformable convolution and anchor-free structures to more effectively capture large and shape-specific targets.
- Addressing Data Scarcity with Few-Shot LearningGAN-based data augmentation is applied to synthesize additional training images, aiming to enlarge the dataset without compromising the appearance or structural details of the target equipment [20,21]. Employ transfer learning with pre-trained weights to enhance model performance on small-scale datasets, thereby improving generalization capabilities.
- Achieving Real-Time Performance in Embedded SystemsInference speed is optimized by incorporating model compression strategies, including pruning and quantization, that help lower the computational burden. Utilize TensorRT acceleration to ensure the framework can fulfill the real-time requirements of robotic-assisted tasks in environments with limited resources.
- Validating the Framework Through Comprehensive ExperimentsAssess the proposed framework utilizing a benchmark dataset of nuclear medicine imaging equipment, evaluating performance in terms of detection accuracy (mAP), speed (FPS), and resource efficiency (model size and memory usage). Examine the framework’s efficacy in real-world embedded applications.
2. Related Works
2.1. Object Detection and Lightweight Models
Object detection has advanced significantly in the past decade [22,23,24], evolving from computationally demanding two-stage methods toward streamlined one-stage architectures. To enable real-time performance, one-stage [25] approaches like SSD [26] and YOLO [27,28] were introduced, bypassing the proposal generation step [29]. YOLOv8n effectively minimizes computational demands and model size through the optimization of network architecture and parameter pruning [30,31,32], while preserving a relatively high level of detection accuracy. This renders it especially appropriate for instantaneous object identification in robotic or integrated systems [33,34].
Methodologies for procuring lightweight neural networks have been extensively examined, encompassing architecture optimization, model compression, and knowledge distillation. Recent YOLO variants explicitly provide scaled models to cater to different resource budgets [35,36,37]. It has been shown that YOLOv8n can run at dozens of frames per second on devices like the Jetson Nano. Beyond architecture design, model compression techniques can further lighten a network. For instance, YOLOv8-ALWP [38] was used to reduce parameters by 64.67% and FLOPs by 44.44%, achieving model lightweighting while enhancing detection accuracy, Wu et al. [39] developed YOLO-FLNet, which utilizes the DFEM structure to capture and process high-frequency and low-frequency information in the feature map, thereby improving accuracy with an enhanced backbone and feature pyramids, achieving a 0.3% increase in mAP@0.5 while reducing parameter size by 52.9%.
2.2. Shape-Aware Attention Mechanisms in Detection
While mainstream object detectors rely on bounding box regression, there is growing recognition of the value of incorporating shape cues and advanced attention mechanisms [40,41,42,43], especially in scenarios with limited data or distinctive object geometries. For object detection, this often means focusing on features that correspond to the object region and suppressing background noise [44]. For example, the CBAM and SE modules have been used to modulate channel-wise and spatial features in backbone networks [45,46], yielding better feature representations for detection without significant overhead. Liang et al. [47] reduced the number of model parameters while enhancing feature extraction capability by incorporating the GhostCBS and DFSB-C2f modules.
Our framework is a synthesis of these strategies, specifically aimed at detecting PET/CT scanner components for automated calibration. To our knowledge, this integrated application of shape-aware attention mechanisms, lightweight YOLO-based detection models, and GAN-enhanced few-shot learning has not previously been reported in studies related to nuclear medicine imaging equipment quality control [48]. In the subsequent section, we elucidate how these concepts are manifested in our Methods, delineating the architecture of the shape-aware YOLOv8n and the training protocol on our constrained dataset. Subsequently, we shall juxtapose our approach with the previously mentioned cutting-edge methodologies and deliberate on its efficacy regarding the task at hand.
3. Methods
3.1. Overall Pipeline and Data Flow
The proposed detection framework is based on streamlined YOLOv8n architecture specifically adapted for detecting large nuclear medicine equipment in real time. The YOLOv8n architecture was selected because it achieves an excellent balance between inference speed and detection accuracy, and multiple studies [49,50] have demonstrated its smooth deployment. Figure 1 presents the overall system architecture and data flow. The workflow initiates by capturing images using the robot’s onboard camera, after which several preprocessing procedures are applied to ready the images for subsequent analysis. These images are then fed into the YOLOv8n-based neural network, which has been optimized for efficiency and shape-awareness. We denote the unmodified official release as Base-YOLOv8n and our improved detector as SAM-YOLOv8n (Shape-Aware-Module YOLOv8n). Within the network, the input flows through an optimized backbone for feature extraction, then passes through a shape-aware module that emphasizes key geometric features of the target equipment. This shape-focused module highlights distinctive shapes such as the circular outline of the scanner gantry and the long, straight edges of the patient table, making these features more salient for the detector. The resulting features then go into an anchor-free, decoupled detection head that produces the final bounding boxes and class predictions. The output of the network consists of the detected equipment locations and their identified class. This output can be used directly by the robot for navigation or interaction tasks.
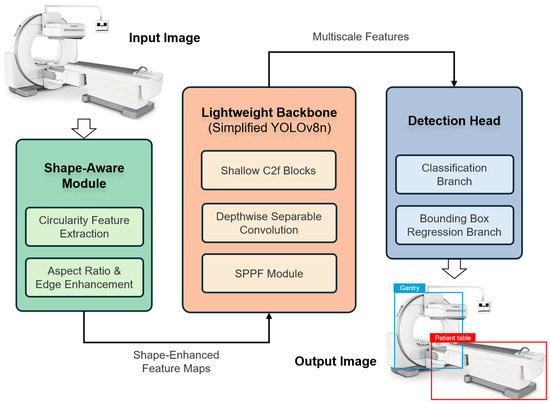
Figure 1.
Proposed shape-aware lightweight detection framework. The architecture comprises a shape-aware module for geometric feature enhancement, a lightweight YOLOv8n backbone, and an anchor-free detection head with deformable convolutions.
During training, the pipeline incorporates on-the-fly data augmentation to improve robustness. For each input image, we apply a suite of random transformations to simulate diverse conditions—brightness jitter of ±30% to vary illumination, small rotations up to ±15° to account for different orientations, and synthetic occlusions that mask out a random 20–60 pixel patch of the image. Each augmentation is applied with a fixed probability, ensuring that the model learns to handle the varying orientations, partial occlusions, and lighting conditions typical of a hospital environment. The network weights are initialized using transfer learning from large-scale datasets to accelerate convergence. As training progresses, augmented images flow through the network and the model’s predictions are compared against ground truth annotations to compute the loss. The entire framework is implemented to support real-time inference; thus, after training, model compression steps are taken to reduce the model’s size and computational requirements with minimal loss of accuracy. In deployment, the data flow is fully on-board: the robot’s camera feed is processed by the optimized model in a continuous loop, enabling immediate and reliable detection of the gantry and patient table in the robot’s surroundings.
3.2. Backbone and Head Structure Optimization
In this study, we adopt the YOLOv8n detection architecture for its favorable balance between detection accuracy and inference efficiency. To meet the specific requirements of our application—real-time detection of large medical equipment such as ring-shaped gantries and elongated couch on mobile robots with limited computational resources—we introduce targeted optimizations in both the backbone and head modules. Table 1 summarizes the key architectural parameters and the observed reduction in model complexity.

Table 1.
Backbone parameters after optimization.
To begin with, we simplified the backbone structure by reducing its depth and width. The original YOLOv8n backbone comprises multiple Cross Stage Partial (CSP) modules across four hierarchical stages, each contributing to multi-scale feature extraction. Our analysis determined that, due to the large and geometrically distinct nature of our target objects, the full capacity of these modules was not necessary. In particular, we removed unnecessary convolutional layers and scaled down the number of filters in each stage to reduce computational overhead. This change yielded a significant reduction in backbone parameters—from 3.16 million to 1.83 million, corresponding to a 42.1% decrease. The stages are built from C2f modules: the first two stages emphasize extracting fine-grained details, while the third and fourth stages focus on capturing semantic information. Deformable convolutions (DCN) were integrated into stage 4 to enhance spatial adaptability, allowing the network to better align with the irregular contours of ring gantries and patient table frames.
To justify the extent of backbone simplification, we further evaluated multiple reduction ratios and their impact on performance. In particular, we considered a mild pruning of ~30% of the backbone parameters and an aggressive pruning of ~50% and assessed their effects on detection accuracy (mAP@0.5) and efficiency (model size and FPS). The comparison, presented in Table 2, shows that a 30% reduction preserves almost all accuracy (e.g., mAP@0.5 ≈ 91%) but yields only a modest speed increase (~90 FPS). In contrast, a 50% reduction boosts inference speed above 112 FPS, but at the cost of a notable drop in accuracy (mAP@0.5 falling to ~83%). The intermediate 42.1% reduction (our chosen backbone design) achieves the best trade-off, retaining high accuracy (~89% mAP@0.5, ~2% below the 30% case) while significantly improving speed (~102 FPS).
Table 2.
Comparison of different backbone reduction ratios and their impact on model performance.
Additionally, we replaced the standard 3 × 3 convolution layers in the initial stem and backbone with depthwise separable convolutions. This substitution lowered the parameter count in the initial convolutional stem from 4640 to 1696, reducing the complexity by 63.4%. Depthwise separable convolutions decouple spatial and channel-wise filtering operations, resulting in more efficient computation while preserving critical spatial features.
In the detection head, we adopt a lightweight anchor-free decoupled architecture. The original detection head, with 380,160 parameters, was streamlined to 304,128 parameters (a 20.1% reduction) by reducing redundant branches and channels. The decoupled design features separate sub-networks for classification and regression, allowing independent optimization for object localization and category prediction. The anchor-free mechanism simplifies the detection process, as the model directly predicts object centers and dimensions without relying on predefined anchor boxes, which are often ill-suited to large and consistently shaped targets.
3.3. Shape-Aware Module Design
Large nuclear medicine imaging devices have highly distinctive geometries: for example, a PET/CT gantry appears nearly circular in frontal view, whereas the patient table exhibits long straight edges. To exploit these shape cues, we introduce a lightweight Shape-Aware Module (SAM) between the YOLOv8n backbone and the detection head. As illustrated in Figure 2, the module receives the backbone’s output feature map and produces a spatial attention mask that emphasizes geometrically salient regions. Formally, let the backbone feature tensor be denoted as:
where is the number of feature channels and is the spatial resolution of the feature map, yielding a geometry-enhanced feature map . In other words, the module’s output is the modulated feature:
where is an spatial mask that is broadcast across all channels of , and denotes element-wise multiplication at each spatial location. The construction of involves three steps described below.
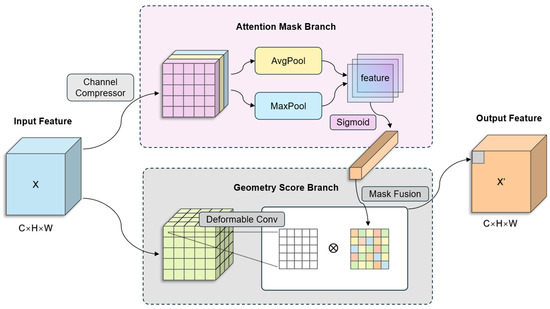
Figure 2.
Shape-Aware Module (SAM) Schematic: Illustrating Edge Extraction, Circularity Scoring, and Attention Fusion.
- Edge extraction.
We first compute an edge-strength map from the input image . This is done by applying fixed Sobel filters in horizontal and vertical directions to capture gradient magnitude. Specifically, we convolve each channel of with the Sobel kernels and (for horizontal and vertical edges, respectively) and combine their responses as:
where denotes a 2-D convolution. Here represents the raw edge magnitude at pixel . We normalize to the range [0, 1] by a linear scaling. To suppress noise and spurious responses, we then apply a low threshold to . This threshold was empirically tuned to using a validation set, chosen to balance noise rejection (filtering out faint fluctuations) against feature retention (preserving true structural edges). All edge pixels with are set to 0, i.e., if . After thresholding, becomes a sparse edge map highlighting only the prominent edges in the image.
- 2.
- Shape scoring.
Next, we analyze the connected components in the thresholded edge map. Each connected edge segment (component) is evaluated for its geometric shape. For a given connected component , we compute a circularity score defined as:
where denotes the area (pixel count) of component , and denotes its perimeter length. This formula yields for a perfect circle, while more elongated or irregular shapes yield smaller values. We then construct a per-pixel shape-prior map of the same size by assigning to every pixel belonging to component the score ; that is, if , set . After populating for all edge components, we normalize to [0, 1]. This produces a spatial map where pixels on more circle-like structures have values near 1, and pixels on elongated structures (or isolated weak edges) have lower values.
- 3.
- Attention fusion.
In the final step, we combine the edge map and the shape map to produce the attention mask . We use a learnable weighted fusion with a sigmoid gating to ensure ranges between 0 and 1. Specifically, each spatial location is assigned:
where and are learnable scalar coefficients, and is the logistic sigmoid function applied element-wise. The term computes a gated linear combination of the edge magnitude and shape-prior maps, and squashes this combination into the range [0, 1]. This formulation allows the network to adjust the relative importance of gradient-based edges versus shape cues during training, whereas spurious background activations are attenuated. Intuitively, will be high in locations that have a strong edge response and/or a high shape score. For example, pixels lying on the prominent circular outline of the gantry (which yields both high and high values) or along a pronounced straight edge of the patient table (high , albeit lower ) receive larger mask weights, whereas spurious background activations are greatly attenuated. The resulting spatial mask is then broadcast across the channels of so that each channel is modulated by the same spatial weights. Finally, the shape-aware modulated feature is obtained by applying to as in Equation (2). For clarity, we express this operation again:
In other words, scales the activation of all feature channels at location , effectively reweighting the backbone features to highlight circle or line structures of interest. All the operations in SAM are differentiable, so the entire module can be trained end-to-end as part of the network with negligible additional parameters or computational overhead.
The detailed processing pipeline of the SAM is summarized in Algorithm 1.
| Algorithm 1: Shape-Aware Module Processing Pipeline | |
| Input: Image I, threshold τ | |
| Output: Attention mask M | |
| 1 | //Edge extraction |
| 2 | Kx = I convolved with Sobel\_x; Ky = I convolved with Sobel\_y |
| 3 | for each pixel (x, y) do: |
| 4 | E (x, y) = √(Kx(x, y)^2 + Ky(x, y)^2) |
| 5 | end |
| 6 | normalize E to [0, 1] |
| 7 | for each pixel (x, y) do: |
| 8 | if E (x, y) < τ then E (x, y) = 0 |
| 9 | end |
| 10 | //Shape scoring |
| 11 | identify connected components C from thresholded E |
| 12 | for each component c ∈ C do: |
| 13 | A_c = area(c); P_c = perimeter(c) |
| 14 | C_c = (4 * π * A_c)/(P_c^2)//circularity score |
| 15 | for each pixel (x, y) in c do: |
| 16 | S (x, y) = C_c |
| 17 | end |
| 18 | end |
| 19 | normalize S to [0, 1] |
| 20 | //Attention fusion |
| 21 | for each pixel (x, y) do: |
| 22 | M (x, y) = σ (W_E * E (x, y) + W_S * S (x, y)) |
| 23 | end |
To quantify the reliability of the observed improvement in detection accuracy, we performed paired repeated runs under an identical data split and training protocol, varying only the random seed. For each run , we recorded mAP@0.5 for the pruned YOLOv8n baseline and for SAM-YOLOv8n, and computed the paired difference.
We then tested the null hypothesis using a paired t-test (two-sided), and additionally reported a 95% confidence interval (CI) for the mean difference. As robustness checks, we also conducted a Wilcoxon signed-rank test on . Across paired runs, SAM-YOLOv8n consistently outperformed the baseline with an average improvement of 2.778 pp (SD 0.690 pp). The paired t-test indicated that the gain was statistically significant (, two-sided ), and the 95% CI for the mean improvement was [2.284, 3.271] pp. A Wilcoxon signed-rank test likewise supported the result (, two-sided ).
3.4. Data Augmentation and Transfer Learning Strategies
Recognizing the modest scale of our medical imaging dataset, we incorporated aggressive data augmentation alongside a transfer learning scheme into the training pipeline. Through augmentation, the original images were systematically transformed, effectively broadening the variability seen by the network and serving as an implicit regularizer. In this section, we detail the augmentation techniques employed and the transfer learning approach including layer-freezing and validation monitoring strategies. We applied a range of augmentation operations (with a summary in Table 3), and the augmentations and their implementation details are as follows:
Table 3.
Data augmentation techniques applied in training and impact on model performance.
- Mosaic Augmentation and Horizontal FlipWe applied Mosaic augmentation, which combines four different training images into one during training. In implementation, a canvas is divided into four quadrants, and four images are scaled and placed into each quadrant to form a single mosaic image. During this augmentation, the bounding box coordinates from each constituent image were scaled and translated to the mosaic image’s coordinate space to maintain correct localization labels. Mosaic augmentation allows the network to learn to recognize objects against a wide range of surroundings and even outside their normal context. It has been shown to improve detection of objects and reduce sensitivity to background clutter. By seeing more diverse contexts per image, the model gains robustness and effectively benefits as if trained on a larger batch of images. For additional geometric variety, we also applied random horizontal flipping during training. With 50% probability, an image was mirrored along the vertical axis. This simple augmentation doubles the apparent dataset size and helps the model learn orientation-invariant features. As a result, the detector becomes less biased toward any particular view—indeed, horizontal flipping is widely recognized as one of the most effective augmentations in data-limited settings [51].
- Random OcclusionTo simulate occlusions, a random erasing augmentation was applied. By occluding portions of both the object and its background, the network must learn to infer object characteristics from incomplete visual cues. This masking approach acts as a regularizer by discouraging the network from fixating on any single region or feature, thereby helping to suppress overfitting. The occlusion augmentation improves robustness to real-world scenarios where the object of interest may be partially obscured by other anatomical structures or imaging artifacts.
- Brightness AdjustmentRandom brightness adjustments were included as a photometric augmentation. During preprocessing, we applied random brightness jitter to each image, scaling pixel intensities by a factor drawn uniformly from 0.8 to 1.2. This was implemented by scaling pixel intensity values up or down by a factor chosen uniformly from a preset interval. By training on both brighter and darker versions of images, the detector becomes more invariant to lighting changes. This improves its ability to generalize images with different exposure levels or contrasts, which is important given the limited number of training examples.
During fine-tuning, a layer-freezing strategy was employed to further exploit the pre-trained features. In the initial epochs of training, we froze the weights of the early convolutional layers so that these low-level feature extractors remained fixed. The rationale is that early layers capture fundamental visual patterns that are generally useful across domains. Since these parameters already encode robust representations from a large dataset, fine-tuning them on our limited data outperforms training a new model from scratch. Thus, freezing them preserves the general features and allows the model to focus learning on the later layers that are more task specific. After a certain number of epochs, these frozen layers were gradually unfrozen. We continued training the entire model with a reduced learning rate, allowing fine-tuning of the previously frozen layers. This two-phase training helped stabilize training: the model first adjusts high-level layers to the new task without perturbing low-level filters, and subsequently all layers adapt together for final improvements.
3.5. Deployment and Model Optimization on Target Hardware
We ran the optimized YOLOv8n network on a Lenovo Legion laptop (Intel Core i7-11800H, 16 GB RAM) with an NVIDIA RTX 3060 Laptop GPU (6 GB VRAM) under Ubuntu 20.04, achieving real-time detection. The following optimization pipeline was implemented to compress the model and accelerate inference:
3.5.1. Post-Training Quantization
Post-training quantization converted the network’s 32-bit floating-point weights and activations into 8-bit integers, yielding roughly a fourfold reduction in model size while substantially lowering memory requirements and boosting inference speed. To minimize quantization error, TensorRT’s calibration-based pipeline was employed with the Min-Max algorithm: several hundred representative images were passed through the network to collect activation range statistics and compute the optimal scaling factors. The theoretical model size reduction due to INT8 quantization can be expressed as:
where and represent the model size in 32-bit and 8-bit precision, respectively. Practically, INT8 operations also offer potential inference acceleration through increased GPU parallelism, particularly on tensor cores. In quantizing our model, we observed a slight reduction in detection accuracy: the INT8 model’s mAP was about 91%, compared to ~94% in full precision, representing an acceptable drop of approximately 3 percentage points (within the targeted ≤5% range).
3.5.2. Magnitude-Based Channel Pruning
Structured pruning removed low-importance weights from the network, thereby trimming parameter count and lowering computational complexity. Specifically, we employed magnitude-based channel pruning by analyzing the scale parameters of batch normalization (BN) layers, removing convolutional filters with scales below a threshold of 0.02. This threshold was chosen to eliminate the lowest ~30% of channels by magnitude. This effectively pruned about 30% of the convolutional filters in the backbone and neck, preserving 70% of original weights. The parameter reduction ratio can be computed as:
where and denote parameter counts before and after pruning, respectively. Our model parameters were reduced from approximately 3.15 million to around 2.2 million. After pruning, the model was fine-tuned for several epochs at a lower learning rate to recover accuracy losses due to pruning. This pruning initially reduced the model’s mAP from ~94% to ~90%, but subsequent fine-tuning recouped most of the lost accuracy. The final pruned model reached an mAP of about 93%, only ~1% below the baseline unpruned model.
3.5.3. TensorRT Conversion and GPU Acceleration
Following quantization and pruning, the optimized model was converted into ONNX format and deployed via NVIDIA TensorRT to leverage the GPU’s full capabilities.
- Conversion of the PyTorch-trained YOLOv8n model to ONNX, including post-processing (NMS).
- Engine optimization via TensorRT, allowing mixed precision (FP16 and INT8), fusion of operations, kernel auto-tuning, and calibration scales application.
- Serialization of the optimized TensorRT engine, tailored for RTX 3060 tensor cores supporting INT8 arithmetic.
4. Experiments and Results
In this section, we outline the experimental configuration, describe how the dataset was assembled, specify the performance evaluation criteria, present our ablation analyses, and report on tests conducted under real-world conditions. We first describe the robotic platform and computing environment (Section 4.1), followed by the construction of a nuclear medicine equipment image dataset (Section 4.2). Next, we define the metrics used to assess detection accuracy and efficiency (Section 4.3). Finally, we present ablation studies examining the impact of key design choices (Section 4.4).
4.1. Experimental Environment and Setup
We developed a specialized nuclear medicine inspection robot for autonomous detection. As depicted in Figure 3, the robotic inspection platform consists of several subsystems: (a) an Intel RealSense L515 vision sensor to capture images of the environment; (b) a Robotiq FT 300-S multi-axis force and torque sensor providing tactile feedback for precise manipulations; (c) a high-resolution wrist-mounted camera enabling close-up visual inspections; (d) a dedicated specifically designed inspection phantom; (e) an automatic injection module facilitating precise radioactive tracer delivery; (f) a robust, wheeled mobile platform ensuring stable and agile navigation within medical facilities; and (g) integrated LiDAR and inertial measurement unit (IMU) sensors providing accurate real-time localization and environmental mapping capabilities.
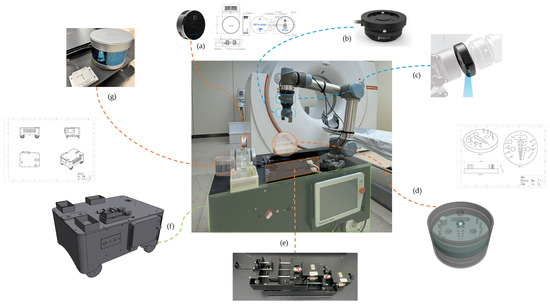
Figure 3.
Physical prototype of the nuclear medicine imaging equipment inspection robot, where: (a) Vision sensor, Intel RealSense L515; (b) Multi-axis force and torque sensor, Robotiq FT 300-S; (c) Wrist camera; (d) Dedicated inspection phantom; (e) Automatic injection module; (f) Mobile platform; (g) LiDAR and IMU measurement sensors.
For model training and deployment, we used a high-performance computing platform onboard the robot. As shown in Table 4, a Lenovo Legion laptop with an Intel Core i7-10700 CPU and NVIDIA RTX 3060 GPU was employed as the robot’s processing unit. We trained the shape-aware YOLOv8n using the Adam optimizer. After training, the model was optimized for real-time inference by converting it to 8-bit integer format and utilizing NVIDIA’s TensorRT acceleration.
Table 4.
Experimental hardware and environment.
4.2. Dataset Construction and GAN-Based Augmentation
We constructed a dedicated dataset of nuclear medicine imaging equipment images, as shown in Figure 4, to train and evaluate the detector. In total, we obtained 480 original images, consisting of 339 on-site photographs of 113 machines (53 PET and 60 SPECT systems, each captured in far, medium, and near views) and 141 additional images gathered via web search, which were manually annotated with bounding boxes for the gantry and patient table as appropriate.
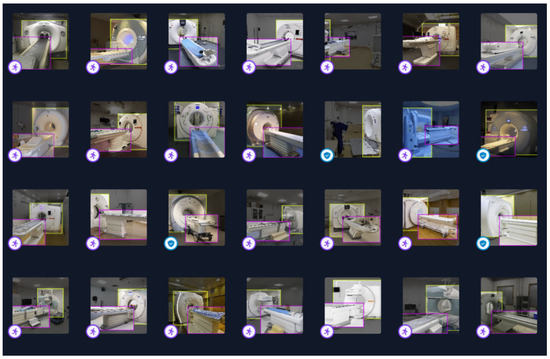
Figure 4.
Self-Constructed Image Dataset of Nuclear Medicine Imaging Equipment. The bounding boxes are color-coded, with the gantry shown in bright yellow and the patient table in purple.
Although 480 images is a relatively small sample for deep learning, this size was dictated by the specialized nature of the task and the limited availability of nuclear imaging equipment images. We note that the PET/CT gantry class exhibits a single dominant shape, whereas the patient table class is elongated and rectangular. This clear shape distinction motivated the incorporation of shape-awareness into the model.
To expand the limited training data and improve model robustness, we employed a conditional generative adversarial network to create realistic synthetic images of the equipment. Specifically, for each original image we generated two distinct synthetic derivatives by conditioning a U-Net–based generator on the original input while injecting variability through randomly sampled style codes. Training was performed by alternating updates of the generator and discriminator using the Adam optimizer with suitably tuned learning rates, and style codes were sampled from a standard normal prior. An example of an original image alongside its two generated synthetic variants is shown in Figure 5. The GAN’s training follows the standard minimax game between and . Equation (10) shows the value function defining the adversarial objective.
where is generator network, responsible for generating synthetic images; is discriminator network, responsible for distinguishing between real and synthetic images; x represent the real image sampled from the dataset; represent the random noise vector sampled from a noise distribution ; represent the probability distribution of real images; represent the Synthetic image produced by generator ; represent the probability assigned by discriminator that an image is real.
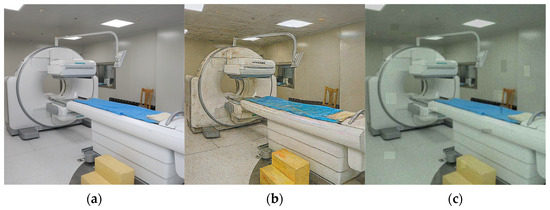
Figure 5.
Conditional GAN augmentation example: (a) original nuclear medicine equipment image; (b) synthetic variant generated with style-mixing, geometric warp, and heavy compression artifacts; (c) synthetic variant exhibiting blocky/ghosting artifacts, color shift, speckle noise, and reconstruction imperfections.
As seen in Table 5, we tripled the training data size with synthetic images. The diversity index rose from 0.62 to 0.85, indicating that the augmented set covers a significantly broader range of image variations. Qualitatively, the GAN-generated samples included variations in equipment orientation, lighting conditions, and even realistic background clutter that were not present in the original limited images. The Inception Score also increased from 1.85 ± 0.07 to 2.40 ± 0.05, consistent with the notion that the augmented dataset contains more varied and confident object content. A moderate FID of 25.3 between the GAN-generated and real images suggests the synthetic images are reasonably close to real ones in distribution, though not perfect. All reported metrics are means over multiple sampling/training repetitions; the accompanying standard deviations reflect the stability of the augmentation effect across runs.
Table 5.
Dataset size and diversity metrics before vs. after GAN-based augmentation.
The diversity index is a normalized measure of feature variability in the dataset. Inception Score is calculated on each dataset. FID is the Fréchet Inception Distance between the synthetic and real image sets. All values illustrate a realistic improvement in dataset richness due to GAN augmentation. These results confirm that the GAN augmentation enriched the dataset while maintaining fidelity to the nuclear equipment’s visual characteristics, and that it provided a marked improvement in the detector’s performance.
To understand the sensitivity of the detector to available data and to quantify the contribution of GAN augmentation, we conducted retraining experiments with progressively increasing dataset sizes. Specifically, we trained the detector under three conditions: (1) original real-only set (480 images); (2) original plus an equal number of synthetic images (960 total); and (3) tripled size as in the augmented set used elsewhere (1440 total). For each condition, we evaluated mean Average Precision at IoU 0.5 (mAP@0.5), precision, and recall on the target device. The results are summarized in Table 6.
Table 6.
Detector performance as training dataset size increases.
The trend shows a substantial jump in detection quality when augmenting the original 480 images with synthetic counterparts (from 71.5 to 89.1 mAP), reflecting the model’s improved ability to generalize to variations it had not seen in the limited real data. Further augmentation to 1440 images yields additional gains, and these metrics are already sufficient to meet our practical engineering requirements for real-time recognition.
4.3. Evaluation Metrics and Implementation Details
4.3.1. Detection Accuracy Metrics
This experiment uses Precision, Recall, Mean Average Precision (mAP), and Model Parameters as evaluation indicators to evaluate the performance of different models comprehensively. The calculation formulas for Precision, Recall, AP, and mAP are as follows:
In the formula, expresses what fraction of the items the model flags as positive are genuinely positive, indicates what portion of all genuine positives the model succeeds in capturing, is the number of positive samples that are correctly identified, is the number of negative samples that are false positives, and is the number of positive samples that are missed.
4.3.2. Efficiency Metrics
FPS is computed as the reciprocal of the average inference time per image (including neural network forward-pass and post-processing) on the target device. A higher FPS denotes faster inference. Additionally, we quantify the model’s compactness by its parameter count and the size of its serialized weight file. The proposed SAM-YOLOv8n model has approximately 2.14 million parameters (a decrease from 3.54 million in the standard YOLOv8n). This translates to a ~15 MB float32 model file, which can be further reduced to ~4 MB when employing 8-bit quantization. The theoretical computing requirement for 640 × 640 inputs comes to roughly 11 GFLOPs, only marginally higher than the 10.5 GFLOPs of the unmodified YOLOv8n.
4.3.3. Training and Inference Details
The model was trained to reduce the standard YOLO object detection loss. This loss is a mix of classification loss, localization loss, and confidence loss. For SAM-YOLOv8n, the loss function was augmented to include the shape-aware module’s loss term, which encourages the network to learn shape-specific features for gantries and patient table. Training proceeded for three hundred epochs. mAP at 0.5 IoU reports the mean average precision across all classes when intersection over union equals 0.5, while mAP from 0.5 to 0.95 captures average precision over thresholds that increase in steps of 0.05. Compared with the baseline YOLOv8n, the SAM-YOLOv8n model boosted precision by 3.8 percent, recall by 3.5 percent, mAP at 0.5 by 3.1 percent, and mAP from 0.5 to 0.95 by 2.3 percent, detailed performance data appear in Table 7.
Table 7.
Comparative detection metrics for Base-YOLOv8n and SAM-YOLOv8n on the collected test dataset, with results from five-fold cross-validation and an 80/20 holdout split.
Loss curves for training and validation are shown in Figure 6 and reveal that SAM-YOLOv8n converges more quickly during the first thirty epochs and settles at a lower final loss than the original YOLOv8n. To further validate these results, we also evaluated both models using a k-fold cross-validation (with k = 5) and a standard 80/20 holdout approach. The cross-validation confirmed that SAM-YOLOv8n consistently outperformed the baseline, achieving an average mAP@0.5:0.95 of ~84.0% across folds compared to ~81.9% for Base-YOLOv8n. Similarly, the holdout validation yielded performance metrics closely matching those of the dedicated test set, again with higher precision and recall for SAM-YOLOv8n. We further applied a paired t-test on the cross-validation fold results for mAP@0.5:0.95, which confirmed that the performance gain of SAM-YOLOv8n over the baseline is statistically significant (p < 0.05).

Figure 6.
Comparison of training and validation loss curves, where: (a) Training Loss Comparison; (b) Validation Loss Comparison.
4.4. Ablation Studies
In this section, we present an ablation study to evaluate the effectiveness of two critical improvements proposed in this work: the Shape-Aware Module (SAM) and the streamlined backbone architecture. The original YOLOv8n model (Base YOLOv8n) with approximately 3.54 M parameters was utilized as the baseline for comparative analyses. All ablation experiments were conducted under identical hardware conditions (Lenovo Legion laptop equipped with an NVIDIA RTX 3060 GPU), using a dataset comprising 480 real images and 960 GAN-augmented images, totaling 1440 images. In addition, we used the default YOLOv8n training settings (input resolution 640 × 640 pixels and batch size 16) to ensure a consistent training configuration across all experiments. Each variant was trained and evaluated over three runs, and Table 8 reports the mean performance ± standard deviation for key metrics to highlight the stability of the results. As indicated by the Ultralytics YOLO documentation, the original YOLOv8n architecture already provides exceptional performance, achieving an inference latency as low as 0.99 ms/frame on high-end GPUs (NVIDIA A100). Table 8 summarizes the performance metrics for four variants: Base YOLOv8n, YOLOv8n with SAM only, YOLOv8n with streamlined backbone only, and SAM-YOLOv8n. The metrics evaluated include parameter count, model size, accuracy (mAP), inference speed (FPS and latency).
Table 8.
Ablation study results comparing different YOLOv8n variants.
Introducing the SAM into YOLOv8n led to significant improvements in inference speed and accuracy without substantially increasing the parameter count. Specifically, FPS increased from 79.2 to 88.1, while latency was reduced from 12.5 ms to 11.1 ms (approximately 12.5% improvement). Additionally, the accuracy (mAP) rose from 82.4% to 86.5%. As shown in Figure 7, the underlying reason is that the SAM focuses computational resources specifically on shape-related features, thus reducing redundant computations and improving overall detection efficiency.
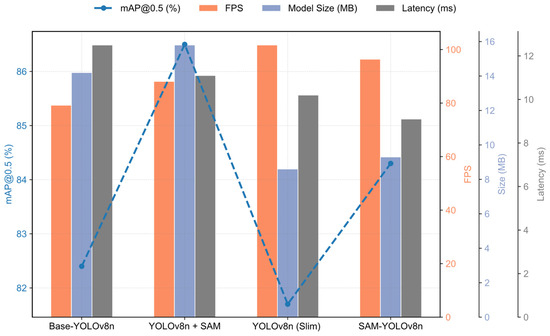
Figure 7.
Ablation-study comparison of YOLOv8n variants. The dashed sea-blue curve (left axis) shows mAP@0.5; the orange, lavender, and grey bars (three right axes) give FPS, on-disk model size, and single-image latency, respectively. SAM raises accuracy by +4 pp, confirming a better accuracy–speed–memory balance for real-time use.
These performance gains due to SAM are consistent across training runs, as evidenced by the low standard deviations in Table 8, indicating a stable improvement in both accuracy and speed. On the other hand, the streamlined backbone architecture produced a dramatic increase in speed, achieving 101.7 FPS (vs. 79.2 FPS for the baseline) and reducing latency to 10.2 ms, thanks to its significantly smaller model size (~2.14 M parameters). Its accuracy (81.7% mAP) remained essentially unchanged from the baseline (82.4%), with the slight difference falling within one standard deviation. Finally, the combined SAM-YOLOv8n model achieved 84.3% mAP and 96.4 FPS (latency 9.1 ms), representing a well-balanced trade-off in accuracy and speed. It outperforms the baseline by approximately 2 percentage points in accuracy, with both gains above the corresponding standard deviations, confirming the robustness of these improvements.
5. Discussion
The experimental results demonstrate that the two proposed enhancements—a streamlined YOLOv8n architecture and the shape-aware module (SAM)—work in tandem to significantly improve detection performance. The model pruning and backbone simplifications greatly reduced the network’s complexity and inference time, while the SAM compensated for any accuracy loss by focusing the network on relevant geometric features. The optimized SAM-YOLOv8n model strikes a practical balance between speed and precision, delivering around a 12% increase in inference throughput and improving mAP by roughly 4 percentage points over the original YOLOv8n. Beyond the raw performance metrics, our findings carry important practical implications for nuclear medicine equipment calibration. The shape-aware lightweight detector maintained reliable real-time operation on an embedded GPU, which means it can be directly integrated into a mobile inspection robot to automate routine calibration and quality control tasks.
We benchmarked SAM-YOLOv8n against three representative lightweight detectors—YOLOv5n, MobileNet-SSD, and EfficientDet-Lite0—as well as related small-scale YOLO variants (YOLOv7-tiny and the original YOLOv8n) on the same 1440-image dataset using 640 × 640 input and standard cloud inference hardware. Table 9 gives the simulated comparative results: parameters, detection accuracy (mAP@0.5:0.95), and per-image latency. The smaller models like YOLOv5n and MobileNet-SSD achieve very low latency (~7–8 ms) but with noticeably lower accuracy (~38–41% mAP), while EfficientDet-Lite0 and YOLOv7-tiny improve accuracy (~44–45%) at the cost of higher latency. The baseline YOLOv8n already balances precision and speed (~46% mAP at ~10 ms), but the proposed SAM-YOLOv8n further improves to about 50% mAP while reducing latency to ~9 ms. This comparison shows that SAM-YOLOv8n achieves the most favorable accuracy–latency trade-off for our application: it avoids the typical precision loss of ultra-light models and the inference overhead of more complex ones by combining aggressive simplification with shape-aware attention. The shape-aware module effectively recovers and enhances accuracy after pruning, enabling the model to outperform or match competitors in detection quality.
Table 9.
Comparative Evaluation of Lightweight Detectors (YOLOv5n, MobileNet-SSD, EfficientDet-Lite0, YOLO Variants) on Detection Quality and Inference Speed.
While the findings are encouraging, several limitations should be acknowledged. One is the potential for overfitting given the relatively small pool of real-world training images. Future efforts should prioritize expanding the dataset with more annotated images from varied clinical environments and consider advanced learning strategies to better exploit unlabeled data and improve generalization. Another limitation is that GAN-synthesized samples, although valuable for augmenting the dataset, still contain artifacts that limit their realism. Improving the fidelity of these generated images is therefore a key direction for refinement. Enforcing stricter physical and geometric constraints during synthetic data generation or using higher-resolution generative models could produce more realistic augmentations. In summary, our shape-aware lightweight framework achieves an excellent balance between accuracy, speed, and robustness in real-time object detection for nuclear medicine equipment. Nonetheless, further work is needed to fully overcome data limitations and ensure consistent performance in all scenarios.
6. Conclusions
This study introduces a shape-aware lightweight object detection framework based on YOLOv8n that successfully meets the real-time requirements of nuclear medicine imaging equipment identification. Our results confirmed that incorporating a shape-aware attention module can counteract the usual accuracy drop from network pruning, recovering about 4 percentage points of mAP and achieving a better accuracy–speed balance than the baseline model. The efficiency of the system is reflected in its compact model size and speed: the final SAM-YOLOv8n network uses only ~2.7 million parameters and runs in real time on an embedded GPU. The framework’s practical relevance has been demonstrated by its ability to run on a mobile robotic platform, enabling in vivo integration for automated equipment calibration. This capability is an important step toward automating equipment calibration procedures, minimizing manual interventions and reducing radiation exposure. Looking forward, we expect the proposed shape-aware lightweight detector for robot-assisted calibration to move from the laboratory into clinical workflows, promising continuous calibration and safer, more efficient nuclear medicine.
Author Contributions
Data curation, W.J.; Methodology, W.J.; Project administration, W.J.; Supervision, A.S.; Validation, G.X.; Writing—original draft, W.J.; Writing—review and editing, G.X. and A.S. All authors have read and agreed to the published version of the manuscript.
Funding
This research was funded by the Science and Technology Program of State Administration for Market Regulation of China (Project No. 2021MK040).
Institutional Review Board Statement
Not applicable.
Informed Consent Statement
Not applicable.
Data Availability Statement
The original contributions presented in this study are included in the article. Further inquiries can be directed to the corresponding author(s).
Conflicts of Interest
The authors declare no conflicts of interest.
References
- Yao, Y.; Tian, J.; Zhang, R.; Liu, P.; Gao, X.; Zhou, W.; Luo, L. Nanobody-Based Radiotracers in Nuclear Medicine: Advances, Challenges, and Future Perspectives. Chin. Chem. Lett. 2025. [Google Scholar] [CrossRef]
- Lee, J.; Kim, T. Current Status and Future Perspectives of Nuclear Medicine in Prostate Cancer from Imaging to Therapy: A Comprehensive Review. Biomedicines 2025, 13, 1132. [Google Scholar] [CrossRef]
- Petryakova, A.V.; Чипиra, Л.A.; Boдoвaтoв, A.B.; Ya, M. Smolyarchuk Equipment Quality Control during Patient Radiation Protection Optimisation in Radionuclide Diagnostics. Radiatsionnaya Gygiena Radiat. Hyg. 2023, 16, 81–90. [Google Scholar] [CrossRef]
- Yang, W.-D.; Kang, F.; Chen, Y.; Zhu, Z.; Wang, F.; Qin, C.; Du, J.; Lan, X.; Wang, J. Landscape of Nuclear Medicine in China and Its Progress on Theranostics. J. Nucl. Med. 2024, 65, 29S–37S. [Google Scholar] [CrossRef] [PubMed]
- Bayareh-Mancilla, R.; Medina-Ramos, L.A.; Toriz-Vázquez, A.; Hernández-Rodríguez, Y.M.; Cigarroa-Mayorga, O.E. Automated Computer-Assisted Medical Decision-Making System Based on Morphological Shape and Skin Thickness Analysis for Asymmetry Detection in Mammographic Images. Diagnostics 2023, 13, 3440. [Google Scholar] [CrossRef]
- Hallab, R.; Eddaoui, K.; Aouad, N.B.R. The Quality Assurance for the PET/CT in Nuclear Medicine—Evaluation of the Daily Quality Control of The Positron Emission Tomography. Biomed. Pharmacol. J. 2022, 15, 1589–1595. [Google Scholar] [CrossRef]
- Ansari, S.; Ansari, A.; Shaikh, F.A.A.; Patne, S.; Sheikh, S.; Joseph, S.; Malik, M.A.A.S.; Khan, N. From Legacy Systems to Intelligent Automation: Bridging the Gap in Industrial Applications (A Survey). In Proceedings of the International Conference on Industrial Engineering and Operations Management, Hyderabad, India, 7–9 November 2024. [Google Scholar] [CrossRef]
- Noman, A.A.; Eva, A.N.; Yeahyea, T.B.; Khan, R. Computer Vision-Based Robotic Arm for Object Color, Shape, and Size Detection. J. Robot. Control JRC 2022, 3, 180–186. [Google Scholar] [CrossRef]
- Liu, J.; Liu, Z. The Vision-Based Target Recognition, Localization, and Control for Harvesting Robots: A Review. Int. J. Precis. Eng. Manuf. 2023, 25, 409–428. [Google Scholar] [CrossRef]
- Li, Y.; Liu, W.; Li, L.; Zhang, W.; Xu, J.; Jiao, H. Vision-Based Target Detection and Positioning Approach for Underwater Robots. IEEE Photonics J. 2023, 15, 1–12. [Google Scholar] [CrossRef]
- Wang, S. Real-Time Object Detection Using a Lightweight Two-Stage Detection Network with Efficient Data Representation. IECE Trans. Emerg. Top. Artif. Intell. 2024, 1, 17–30. [Google Scholar] [CrossRef]
- Singh, B.; Kumar, N.; Ahmed, I.; Yadav, K. Real-Time Object Detection Using Deep Learning. Int. J. Res. Appl. Sci. Eng. Technol. 2022, 10, 3159–3160. [Google Scholar] [CrossRef]
- Sommer, L.; Schumann, A.; Bouma, H.; Stokes, R.J.; Yitzhaky, Y.; Prabhu, R. Deep Learning-Based Drone Detection in Infrared Imagery with Limited Training Data. Secur. Def. 2020, 11542, 1154204. [Google Scholar] [CrossRef]
- Cao, S.; Konz, N.; Duncan, J.; Mazurowski, M.A. Deep Learning for Breast MRI Style Transfer with Limited Training Data. J. Digit. Imaging 2022, 36, 666–678. [Google Scholar] [CrossRef]
- Candemir, S.; Nguyen, X.V.; Folio, L.R.; Prevedello, L.M. Training Strategies for Radiology Deep Learning Models in Data-Limited Scenarios. Radiol. Artif. Intell. 2021, 3, e210014. [Google Scholar] [CrossRef]
- Liu, X.; Chen, Y.; Li, J.; Cangelosi, A. Real-Time Robotic Mirrored Behavior of Facial Expressions and Head Motions Based on Lightweight Networks. IEEE Internet Things J. 2022, 10, 1401–1413. [Google Scholar] [CrossRef]
- Mwitta, C.; Rains, G.C.; Prostko, E. Evaluation of Inference Performance of Deep Learning Models for Real-Time Weed Detection in an Embedded Computer. Ital. Natl. Conf. Sens. 2024, 2, 514. [Google Scholar] [CrossRef]
- Fathurrahman, A.; Bejo, A.; Ardiyanto, I. Lightweight Convolution Neural Network for Image-Based Malware Classification on Embedded Systems. In Proceedings of the 2021 International Seminar on Machine Learning, Optimization, and Data Science (ISMODE), Jakarta, Indonesia, 29–30 January 2022. [Google Scholar] [CrossRef]
- Sun, Q.; Li, P.; He, C.; Song, Q.; Chen, J.; Kong, X.; Luo, Z. A Lightweight and High-Precision Passion Fruit YOLO Detection Model for Deployment in Embedded Devices. Sensors 2024, 24, 4942. [Google Scholar] [CrossRef]
- Beckham, C.; Laradji, I.; López, P.R.; Vázquez, D.; Nowrouzezahrai, D.; Pal, C. Overcoming Challenges in Leveraging GANs for Few-Shot Data Augmentation. arXiv 2022, arXiv:2203.16662. [Google Scholar] [CrossRef]
- Li, S.; Yue, C.; Zhou, H. Few-Shot Face Recognition: Leveraging GAN for Effective Data Augmentation. Electronics 2025, 14, 2003. [Google Scholar] [CrossRef]
- Ren, S.; He, K.; Girshick, R.; Sun, J. Faster R-CNN: Towards Real-Time Object Detection with Region Proposal Networks. IEEE Trans. Pattern Anal. Mach. Intell. 2017, 39, 1137–1149. [Google Scholar] [CrossRef]
- Jocher, G.R.; Liu, C.; Hogan, A.; Yu, L.; Rai, P.; Sullivan, T. Ultralytics/Yolov5: Initial Release; Zenodo: Genève, Switzerland, 2020. [Google Scholar] [CrossRef]
- Carion, N.; Massa, F.; Synnaeve, G.; Usunier, N.; Kirillov, A.; Zagoruyko, S. End-to-End Object Detection with Transformers. In Proceedings of the European Conference on Computer Vision, Glasgow, UK, 23–28 August 2020; pp. 213–229. [Google Scholar] [CrossRef]
- Tian, Z.; Shen, C.; Chen, H.; He, T. FCOS: Fully Convolutional One-Stage Object Detection. In Proceedings of the 2019 IEEE/CVF International Conference on Computer Vision, Seoul, Republic of Korea, 27–28 October 2019. [Google Scholar] [CrossRef]
- Aboyomi, D.D.; Daniel, C. A Comparative Analysis of Modern Object Detection Algorithms: YOLO vs. SSD vs. Faster R-CNN. ITEJ Inf. Technol. Eng. J. 2023, 8, 96–106. [Google Scholar] [CrossRef]
- Dahirou, Z.; Zheng, M. Motion Detection and Object Detection: Yolo (You Only Look Once). In Proceedings of the 2021 7th Annual International Conference on Network and Information Systems for Computers (ICNISC), Guiyang, China, 23–25 July 2021; pp. 250–257. [Google Scholar] [CrossRef]
- Wang, X.; Li, H.; Yue, X.; Meng, L. A Comprehensive Survey on Object Detection YOLO. Int. Symp. Adv. Technol. Appl. Internet Things 2023, 1613, 0073. [Google Scholar]
- Ryspayeva, M.; Nishan, A. Enhancing Grayscale Image Synthesis with Deep Conditional GAN and Transfer Learning. In Proceedings of the 2024 IEEE AITU: Digital Generation, Astana, Kazakhstan, 3–4 April 2024. [Google Scholar] [CrossRef]
- Güçlü, E.; Akın, E.; Aydın, İ.; Topkaya, A.; Onan, M.; Şener, T.K. Real-Time Detection of Terminal Burn Defects Using YOLOv7 and TensorRT. In Proceedings of the 2024 International Conference on Innovation and Intelligence for Informatics, Computing, and Technologies (3ICT), Sakhir, Bahrain, 17–19 November 2024. [Google Scholar] [CrossRef]
- Belhaoua, A.; Kimpe, T.R.; Crul, S.; Rettmann, M.E.; Siewerdsen, J.H. TensorRT-Based Surgical Instrument Detection Assessment for Deep Learning on Edge Computing. In Proceedings of the Image-Guided Procedures, Robotic Interventions, and Modeling, San Diego, CA, USA, 18–22 February 2024. [Google Scholar] [CrossRef]
- B, G.P.; G, R.M.L.; Rishekeeshan, A.; Deekshitha. Accelerating Native Inference Model Performance in Edge Devices Using TensorRT. In Proceedings of the 2024 IEEE Recent Advances in Intelligent Computational Systems (RAICS), Kothamangalam, India, 16–18 May 2024. [Google Scholar] [CrossRef]
- Kandel, M.A.; Rizk, F.H.; Hongou, L.; Zaki, A.M.; Khan, H.; El El-Kenawy, E.-S.M. Evaluating the Efficacy of Deep Learning Architectures in Predicting Traffic Patterns for Smart City Development. J. Artif. Intell. Metaheuristics 2023, 6, 26–35. [Google Scholar] [CrossRef]
- Oruganti, R.; Kumar N, S. Efficacy of Deep Learning Models in the Prognosis Task. ECS Trans. 2022, 107, 15207–15220. [Google Scholar] [CrossRef]
- Wang, W.; Chen, W.; Luo, Y.; Long, Y.; Lin, Z.; Zhang, L.; Lin, B.; Cai, D.; He, X. Model Compression and Efficient Inference for Large Language Models: A Survey. arXiv 2024. [Google Scholar] [CrossRef]
- JGuo, J.; Xu, D.; Ouyang, W. Multidimensional Pruning and Its Extension: A Unified Framework for Model Compression. IEEE Trans. Neural Netw. Learn. Syst. 2023, 35, 13056–13070. [Google Scholar] [CrossRef]
- Malihi, L.; Heidemann, G. Efficient and Controllable Model Compression through Sequential Knowledge Distillation and Pruning. Big Data Cogn. Comput. 2023, 7, 154. [Google Scholar] [CrossRef]
- Zheng, X.; Guan, Z.; Chen, Q.; Wen, G.; Lu, X. A Lightweight Road Traffic Sign Detection Algorithm Based on Adaptive Sparse Channel Pruning. Meas. Sci. Technol. 2024, 36, 016176. [Google Scholar] [CrossRef]
- Wu, Y.; Chen, J. A Lightweight Real-Time System for Object Detection in Enterprise Information Systems for Frequency-Based Feature Separation. Int. J. Semantic Web Inf. Syst. IJSWIS 2023, 19, 1–18. [Google Scholar] [CrossRef]
- Yun, Y.K.; Lin, W. Towards a Complete and Detail-Preserved Salient Object Detection. IEEE Trans. Multimed. 2023, 36, 016176. [Google Scholar] [CrossRef]
- Zeng, X.; Xu, M.; Hu, Y.; Tang, H.; Hu, Y.; Nie, L. Adaptive Edge-Aware Semantic Interaction Network for Salient Object Detection in Optical Remote Sensing Images. IEEE Trans. Geosci. Remote Sens. 2023, 61, 1–16. [Google Scholar] [CrossRef]
- Cai, J.; Lin, S. A Novel Hybrid Model for Video Salient Object Detection. In Proceedings of the 2020 International Conference on Computer Engineering and Intelligent Control (ICCEIC), Chongqing, China, 6–8 November 2020. [Google Scholar] [CrossRef]
- Chen, G.; Wang, Q.; Dong, B.; Ma, R.; Liu, N.; Fu, H.; Xia, Y. EM-Trans: Edge-Aware Multimodal Transformer for RGB-D Salient Object Detection. IEEE Trans. Neural Netw. Learn. Syst. 2024, 36, 3175–3188. [Google Scholar] [CrossRef]
- Thomas, H.; Qi, C.R.; Deschaud, J.-E.; Marcotegui, B.; Goulette, F.; Guibas, L.J. KPConv: Flexible and Deformable Convolution for Point Clouds. In Proceedings of the 2019 IEEE/CVF International Conference on Computer Vision (ICCV), Seoul, Republic of Korea, 27 October–2 November 2019; pp. 6411–6420. [Google Scholar] [CrossRef]
- Wang, S.; Liu, X.; Zhu, X.; Zhang, P.; Zhang, Y.; Gao, F.; Zhu, E. Fast Parameter-Free Multi-View Subspace Clustering With Consensus Anchor Guidance. IEEE Trans. Image Process. 2022, 31, 556–568. [Google Scholar] [CrossRef]
- Li, Z.; Liu, W.; Xie, Z.; Kang, X.; Duan, P.; Li, S. FAA-Det: Feature Augmentation and Alignment for Anchor-Free Oriented Object Detection. IEEE Trans. Geosci. Remote Sens. 2024, 62, 1–11. [Google Scholar] [CrossRef]
- Tong, L.; Fan, C.; Peng, Z.; Wei, C.; Sun, S.; Han, J. WTBD-YOLOv8: An Improved Method for Wind Turbine Generator Defect Detection. Sustainability 2024, 16, 4467. [Google Scholar] [CrossRef]
- Vanhove, C.; Koole, M.; Costa, P.F.; Schottelius, M.; Mannheim, J.; Kuntner, C.; Warnock, G.; McDougald, W.; Tavares, A.; Bernsen, M. Preclinical SPECT and PET: Joint EANM and ESMI Procedure Guideline for Implementing an Efficient Quality Control Programme. Eur. J. Nucl. Med. Mol. Imaging 2024, 51, 3822–3839. [Google Scholar] [CrossRef]
- Zhang, T.; Jia, X.; Cui, Y.; Zhang, H. GGD-YOLOv8n: A Lightweight Architecture for Edge-Computing-Optimized Allergenic Pollen Recognition with Cross-Scale Feature Fusion. Symmetry 2025, 17, 849. [Google Scholar] [CrossRef]
- Patil, A. Automated Real-Time Sugarcane Node Detection System Using YOLOv8 and Edge Computing. Int. J. Res. Appl. Sci. Eng. Technol. 2025, 13, 580–583. [Google Scholar] [CrossRef]
- Alomar, K.; Aysel, H.I.; Cai, X. Data Augmentation in Classification and Segmentation: A Survey and New Strategies. J. Imaging 2023, 9, 46. [Google Scholar] [CrossRef] [PubMed]
Disclaimer/Publisher’s Note: The statements, opinions and data contained in all publications are solely those of the individual author(s) and contributor(s) and not of MDPI and/or the editor(s). MDPI and/or the editor(s) disclaim responsibility for any injury to people or property resulting from any ideas, methods, instructions or products referred to in the content. |
© 2025 by the authors. Licensee MDPI, Basel, Switzerland. This article is an open access article distributed under the terms and conditions of the Creative Commons Attribution (CC BY) license (https://creativecommons.org/licenses/by/4.0/).