Article

Impact of Adaptive Process Control on Mechanical Properties of Plastic Parts and Process Robustness

by
Tomasz Olszewski
*,
Danuta Matykiewicz
* and
Michał Jakubowicz
Faculty of Mechanical Engineering, Poznan University of Technology, Piotrowo 3, 61-138 Poznan, Poland
*
Authors to whom correspondence should be addressed.
Appl. Sci. 2025, 15(16), 8829; https://doi.org/10.3390/app15168829
Submission received: 17 July 2025 / Revised: 6 August 2025 / Accepted: 8 August 2025 / Published: 10 August 2025
(This article belongs to the Special Issue Mechanical Properties and Numerical Modeling of Advanced Materials)

Abstract

This work aimed to assess the influence of the iQ Weight Control System on the weight, dimensional stability, and mechanical properties of injection-molded samples. The properties of products made from glass fiber-reinforced polyamide and 50% regrind from post-production waste were evaluated. The mechanical properties, such as impact strength and tensile strength, were measured to determine the material’s performance. Additionally, a spiral flow test was conducted to verify the process robustness and repeatability when producing with either virgin material or a blend of virgin and regrind material. The spiral flow test, which involves injecting the polymer melt into a spiral mold, provides insights into the processability and flow characteristics of the polymer under high shear rates. This test is crucial for assessing the consistency of the injection molding process and ensuring that the material maintains its properties across different production batches. Results demonstrated that, despite the viscosity reduction associated with regrind, the system successfully maintained a consistent shot weight, thereby stabilizing the amount of material injected into the mold cavity. The iQ Weight Control System activation led to an increase in impact strength from 9.50 kJ/m2 to 10.78 kJ/m2 for virgin samples and from 9.26 kJ/m2 to 9.73 kJ/m for a 50/50 virgin/regrind blend.

1. Introduction

1.1. Injection Molding Process and Systematic Six-Step Process Development

Nowadays, many consumer products are manufactured from plastics using injection molding [1]. For environmental and material-saving reasons, both virgin polymer material and recycled material, such as regrind from industrial waste, are used [2,3]. Injection molding is a cyclic thermomechanical process in which polymeric materials are plasticized and injected into a mold cavity under high pressure, resulting in the formation of complex parts. Owing to the nonlinear interplay of thermal gradients, material rheology, and mechanical forces, stringent process control is critical to ensuring the quality and dimensional stability of molded parts. The entire process is traditionally segmented into distinct phases such as plasticization, clamping, filling, packing, cooling, and demolding/ejection. Optimizing these phases requires a systematic development methodology that incorporates detailed process analysis and iterative adjustments [4].
A robust six-step process development methodology has been established to guide the optimization of injection molding parameters. This approach consists of the following sequential studies [5,6,7].
The first step is the in-mold rheology study, which aims to optimize the injection phase by understanding the rheological behavior of the plastic melt. The viscosity of the plastic melt is measured at various injection speeds, treating the injection molding machine as a rheometer. The viscosity is plotted against the shear rate to identify the non-Newtonian and Newtonian regions. The goal is to set the injection speed in the Newtonian region where viscosity remains relatively constant, ensuring consistent mold filling. This optimization minimizes shot-to-shot variations and ensures consistent cavity fill [8]. The second step is the cavity balance study, which ensures uniform filling of all cavities in a multi-cavity mold. Parts are molded with no holding pressure to create short shots, and the weights of these short shots are measured to determine the balance between cavities. The study identifies imbalances due to non-uniform flow channel dimensions, venting issues, cooling variations, or rheological differences. Adjustments are made to runners, gates, or cooling channels to achieve balanced cavity filling. The third step is the pressure drop study, which determines the pressure loss throughout the mold and identifies any restrictive sections. The pressure required to fill the mold is measured at various points, including the nozzle, sprue, runners, gates, and end of fill. A graph of pressure versus flow sections is plotted to visualize the pressure drop. Sections with significant pressure drops are identified and modified to reduce resistance and ensure consistent flow. The fourth step is the process window study, which establishes the range of processing parameters that yield cosmetically acceptable parts. Holding pressure and melt temperature (for amorphous materials) or mold temperature (for crystalline materials) are varied to determine the limits within which acceptable parts are produced. The fifth step is the gate seal time study, which determines the time required for the gate to freeze, preventing backflow of plastic. Parts are molded with varying holding times, and their weights are measured. A graph of part weight versus holding time is plotted, and the gate seal time is identified as the point where the part weight stabilizes. The holding time is set to slightly longer than the gate seal time to ensure complete gate freeze and prevent defects. The sixth and final step is the cooling study, which determines the optimal cooling time to ensure parts are ejected at the correct temperature without deformation. Parts are molded with varying cooling times, and their cosmetic and dimensional stability are evaluated. A graph of part dimensions versus cooling time is plotted to identify the optimal cooling time. The cooling time is set to ensure parts are ejected at the correct temperature, balancing cycle time and part quality.
The overall process development can be visually represented by the following flow diagram (Figure 1). By integrating these six targeted studies, the methodology ensures that injection molding is finely tuned for consistency in part weight, surface quality, and dimensional stability.

1.2. Optimizing Injection Molding with AI Systems Integration

According to Plastics Information Europe [9], the European plastics processing sector is facing a considerable skills shortfall, which is expected to require nearly 15,000 specialized professionals (engineers, chemical experts, and processing technicians) in Germany over the next three years. This deficit is exacerbated by a substantial decline in the traditional apprenticeship system, which now achieves only about 50% of the necessary intake—a reduction of approximately 40% since 2017—mainly due to demographic shifts, including the impending retirement of the Baby Boomer generation and a waning interest among younger cohorts. In parallel, the industry’s challenges are further underscored by findings reported in Plastics Machinery and Manufacturing [10], where the skills gap is depicted as a critical driver for increased investment in training programs.
The integration of artificial intelligence (AI) into the plastics manufacturing industry heralds a transformative shift toward intelligent and self-optimizing production systems. AI-driven technologies now automate routine monitoring tasks, dynamically adjust machine settings in real time, and predict maintenance needs well before failures occur. Such capabilities reduce the reliance on highly specialized manual intervention while ensuring consistent product quality. Moreover, AI and machine learning (ML) act as practical decision support tools—essentially serving as “virtual experts” that assist less experienced operators in diagnosing issues and optimizing production parameters, thereby embedding continuous improvement within daily operations [11,12].
By harnessing real-time data from production environments, these systems detect operational anomalies and forecast equipment failures, which minimizes unplanned downtime. They are also capable of autonomously adjusting process parameters to mitigate the risks of production variability, further reducing the dependence on scarce high-level expertise. In addition, AI-driven systems optimize material flow and energy consumption, contributing significantly to manufacturing sustainability. Importantly, these technologies capture the tacit knowledge of experienced personnel, ensuring that the decision-making heuristics that have driven historical performance are preserved, even as workforce demographics evolve. Collectively, these innovations highlight the potential of AI to enhance production efficiency, resilience, and environmental responsibility in the plastics industry [13]. For example, the development of an integrated e-Dart-based artificial neural network (e-ANN MQOD) system for sensing multiple quality characteristics with real-time process information extracted from in-mold sensors was described by Chen et al. [14].
Recent developments in injection molding have increasingly incorporated machine learning (ML) approaches to enhance adaptive process control (APC). Rather than relying solely on static parameter adjustments determined by operator experience, modern APC systems use high-speed data acquisition and ML algorithms to facilitate real-time process adjustments. At the core of these systems is the viscosity index (VI), derived from time-integrated melt pressure data during the filling and early packing phases. Deviations between the measured VI and a predetermined target initiate immediate corrective adjustments in injection parameters. For example, when the VI exceeds the desired range, the control algorithm may delay the V/P switchover to maintain cavity fill quality [15]. These systems integrate multiple sensor inputs—including nozzle and cavity pressure, as well as clamping force data—into predictive models, often employing neural networks or adaptive regression techniques. The models are continually refined based on historical production data and real-time measurements, enabling adjustments that consistently achieve extremely low part weight variations. This not only improves the overall process reliability but also minimizes the need for operator intervention [16].
A study conducted by Chen et al. introduces an innovative, cost-effective approach for enhancing the quality and stability of injection molding processes by monitoring tie-bar elongation. Rather than using costly and potentially intrusive in-cavity sensors, the method relies on measuring the peak clamping force increment (CFI) via strain gauges attached to the machine’s tie bars. The CFI peak value serves as an indirect indicator of melt quality variations, which fluctuations in melt viscosity and cavity pressure may cause. By adjusting key processing parameters, specifically the velocity-to-pressure (V/P) switchover point and the holding pressure, the system can compensate for these deviations in real time. Experimental results using a two-cavity mold producing tensile specimens demonstrated strong correlations between CFI peak and molded part quality—primarily indicated by part weight—leading to a significant improvement in process capability and yield rate, which increased from 60% to 90%. The proposed control strategy provides a simpler, less invasive alternative to traditional methods, paving the way for more robust, adaptive injection molding systems in industrial applications [17].
Experimental trials [18] using multiple recycled PP blends with differing melt flow rates demonstrated that enabling auto-viscosity control significantly reduced cavity pressure variation and part weight fluctuation while maintaining mechanical properties within an acceptable range. Results showed up to a 5% reduction in processing variability and highlighted the critical role of trigger time optimization for maximizing process stability. The findings support pressure-controlled molding as an effective strategy for managing material heterogeneity in sustainable polymer manufacturing. In applications combining an iQ Weight Control System [19], where the abbreviation iQ stands for intelligent quality, proposed by ENGEL or APC by Krauss Maffei [20], iterative learning algorithms continuously recalibrate parameters like the V/P switchover point and holding pressure. By automatically adapting to fluctuations in material properties or environmental conditions, these systems maintain high product quality and process stability. The achievement of consistent molding quality is critical in injection molding and requires control of materials, molds, and process parameters [21,22]. To achieve better production stability and capacity, an online control system is necessary. To fill the gap between manufacturing quality aspect monitoring and changes in mechanical properties, this paper presents the multi-criteria analysis of polyamide products from virgin and from post-production waste regrind materials. The novelty of this study is the demonstration of the benefits of using the iQ Weight Control System for various types of polyamide products. Importantly, it confirms that this system enables the use of secondary raw materials in the form of regrind from production waste during an efficient injection process. The effective use of these systems represents a significant contribution to scientific advancement and also allows for savings in both materials and energy required when setting injection molding parameters for different materials.
Therefore, this work aimed to assess the influence of the iQ Weight Control System on the weight, dimensional stability, and mechanical properties of injection-molded samples. The properties of products made from glass fiber-reinforced polyamide and 50% regrind from post-production waste were evaluated.

2. Materials and Methods

2.1. Materials and Sample Preparation

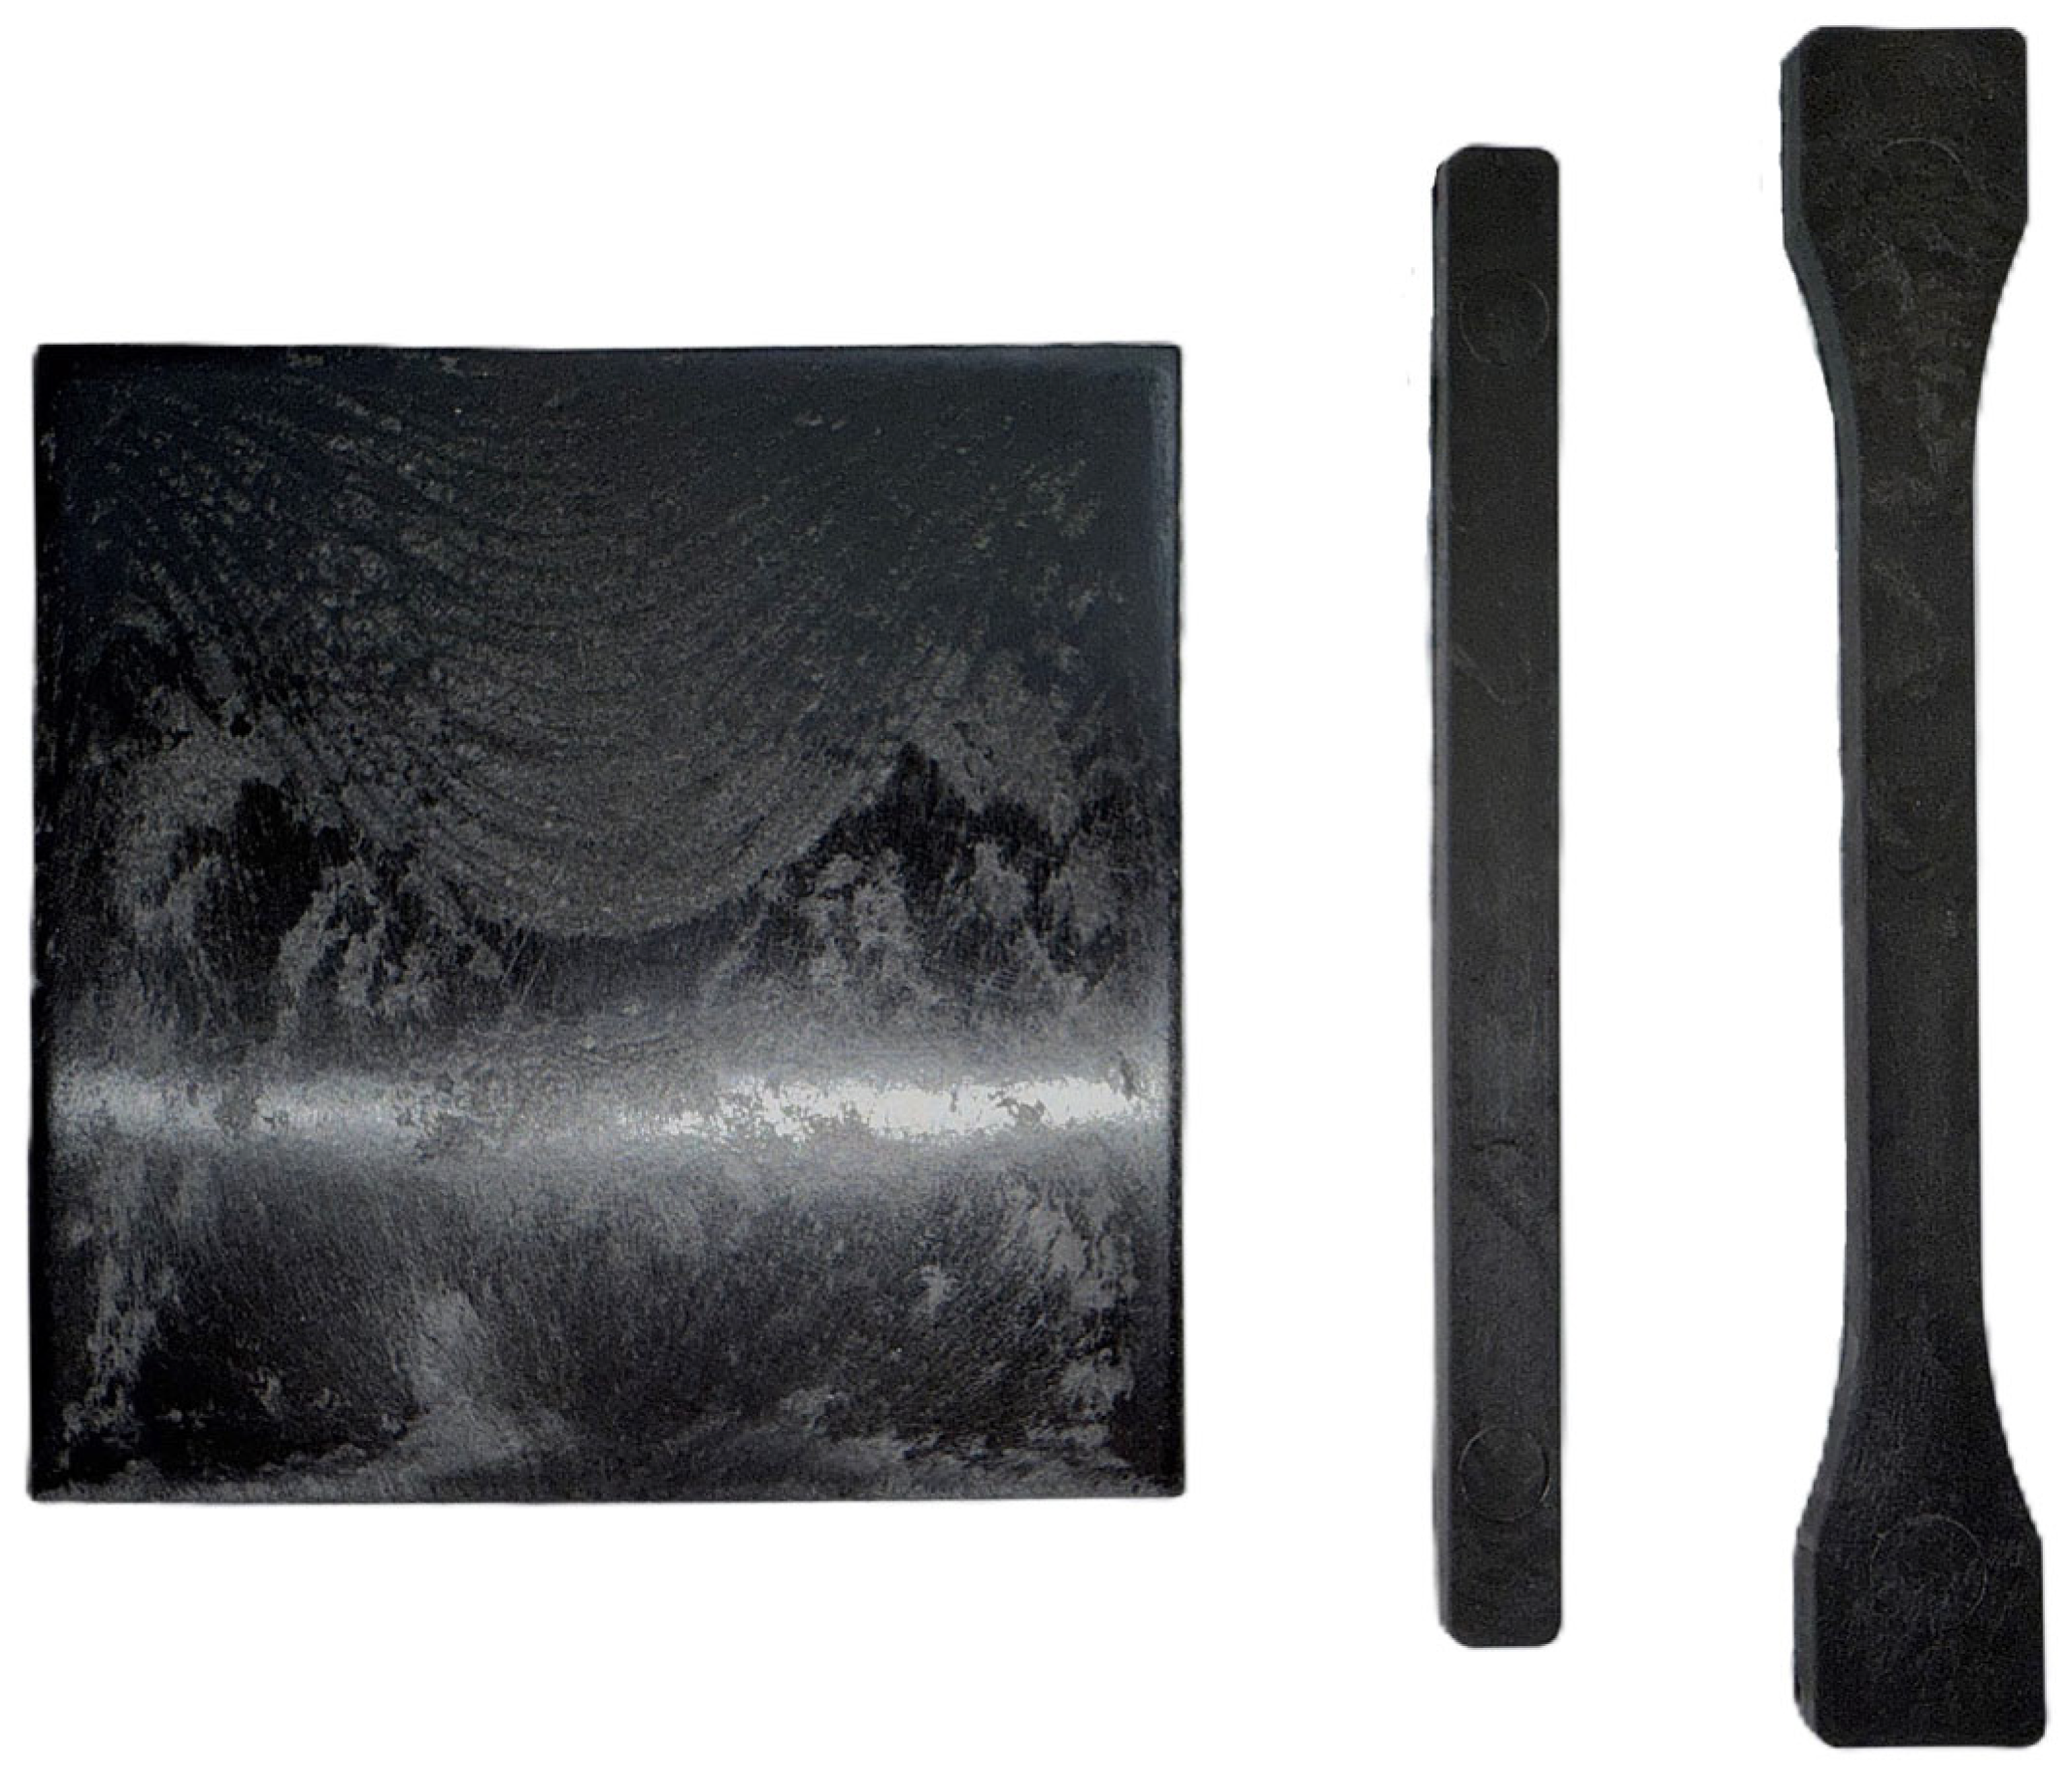
Polyamide 6 (PA6) injection molding grade, reinforced with 50% of short glass fiber and heat-stabilized under the trade name Promyde B300 P2 G50 (Nurel S.A., Zaragoza, Spain), was used in the study. To verify process robustness, four types of specimens (dog-bone, rectangular bar, square, and spiral) were produced using an Engel Victory 50 (ENGEL AUSTRIA GmbH, Schwertberg, Austria) injection molding machine equipped with the iQ Weight Control System (Figure 2). The dog-bone and rectangular bar were used to assess the mechanical properties of the samples. The other two were used to measure the mass and dimensional stability, as well as process robustness.
For all the processes, the melt temperature was established at 260 °C, the mold temperature at 60 °C, the injection velocity at 120 mm/s, holding pressure = 40 hydraulic bar, and holding/cooling time, respectively, at 8 and 20 s. The parameters were defined based on the material’s Technical Data Sheet (TDS) and aligned with scientific molding principles.
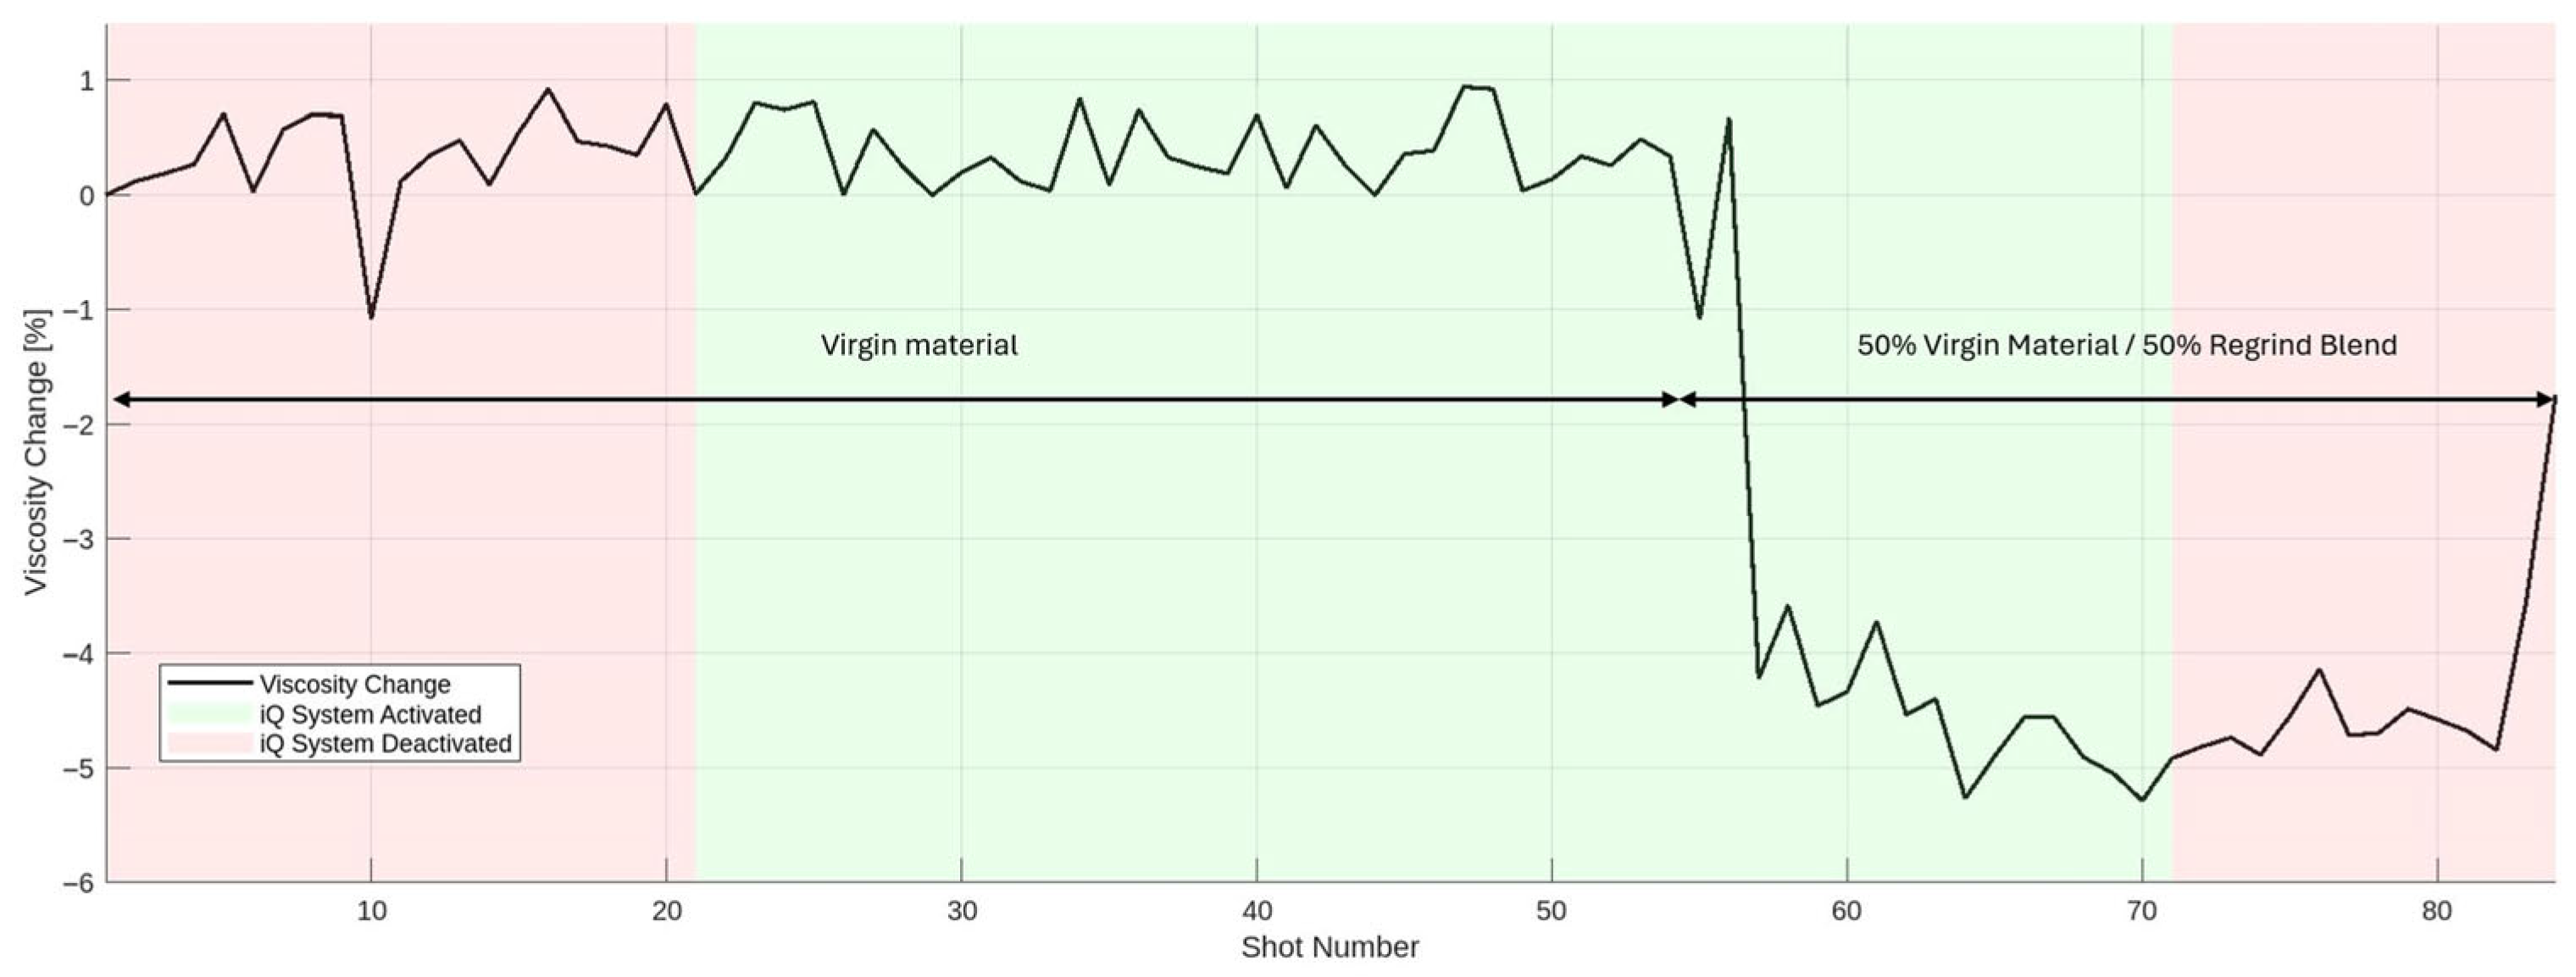
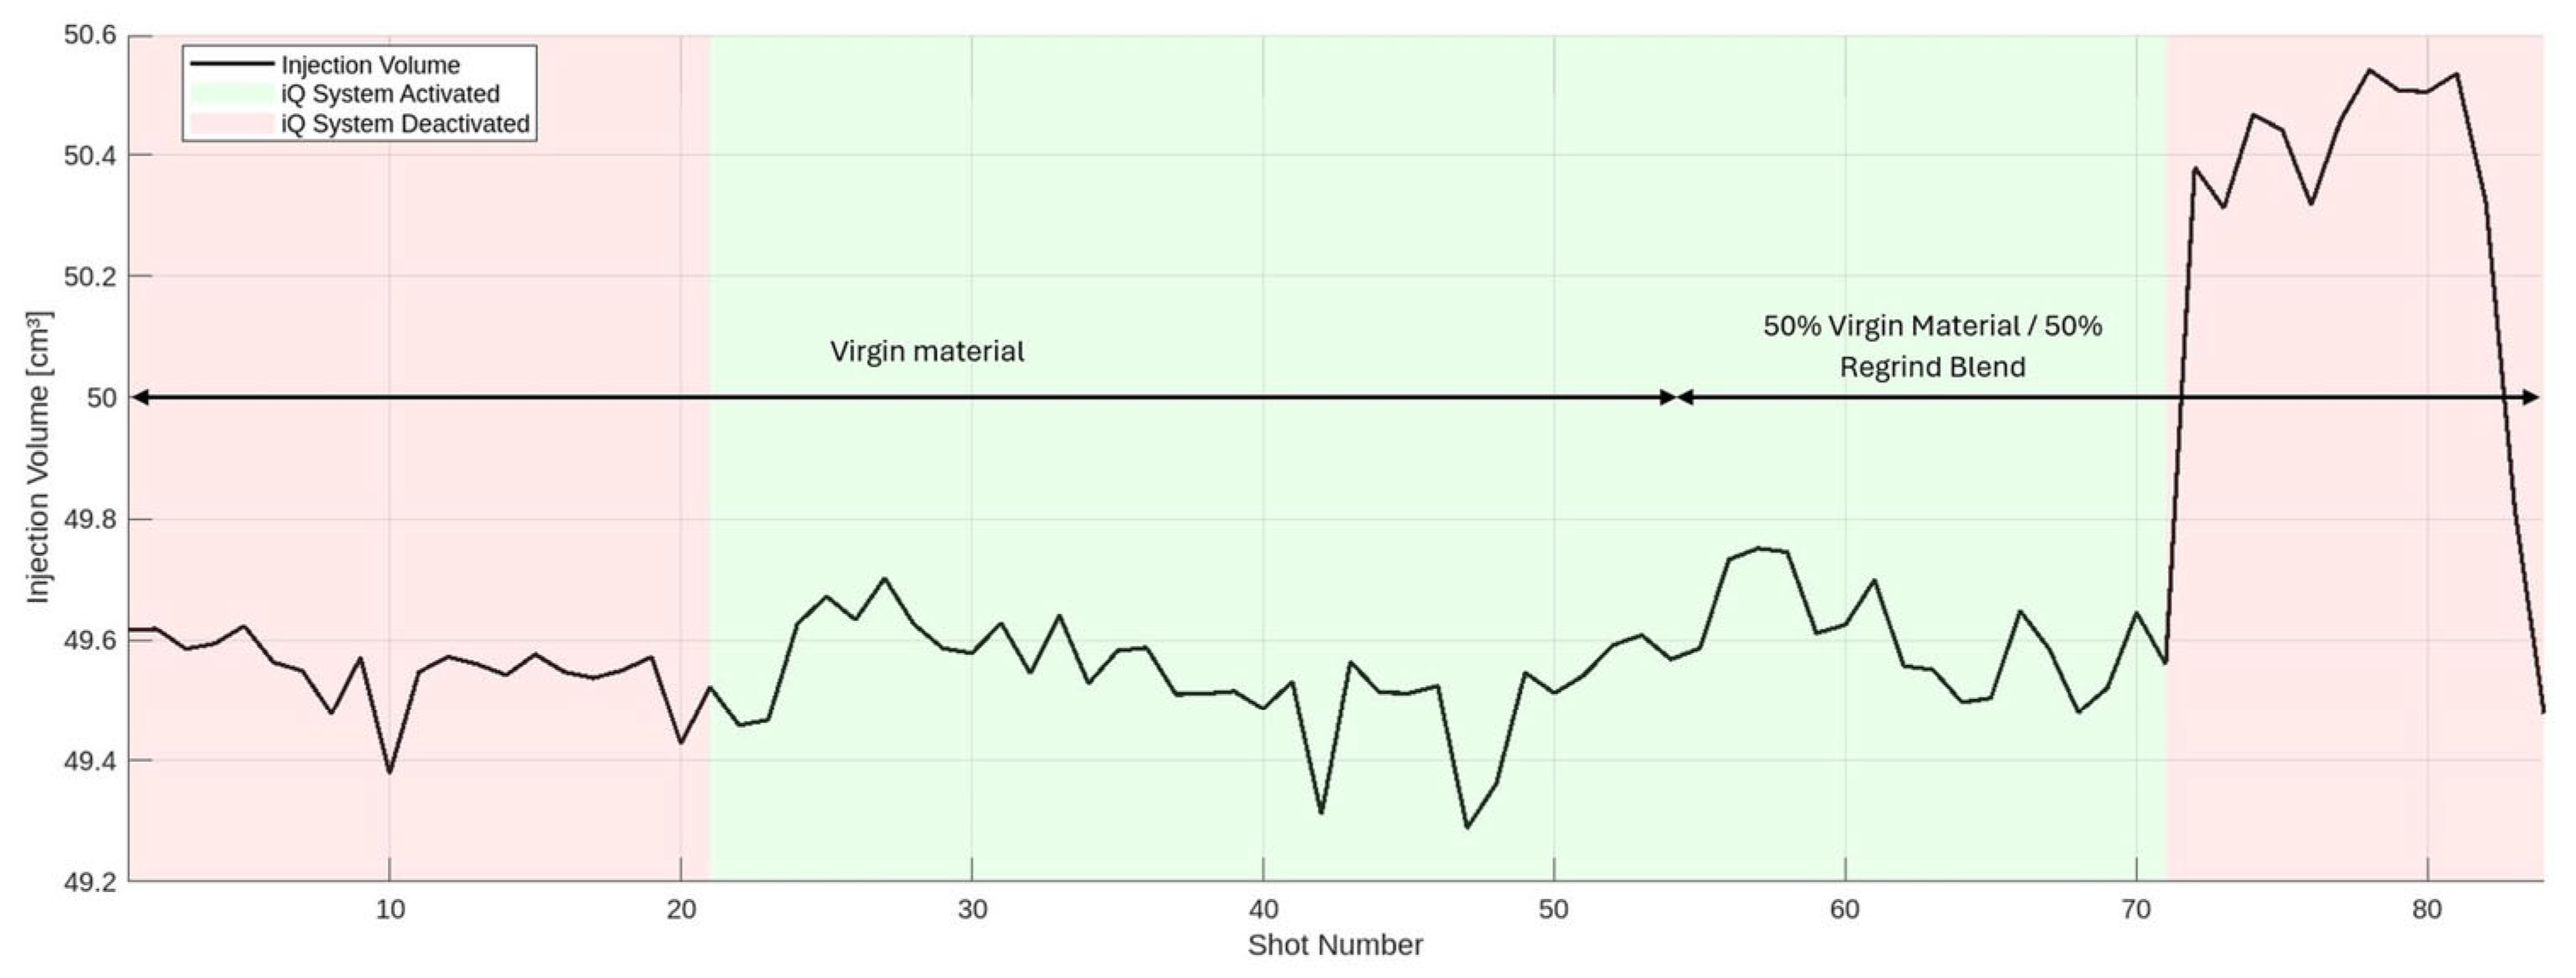
To obtain regrind for the study, post-production waste in the form of sprues was ground using a low-speed grinder equipped with an appropriate screen to match the size of the virgin pellets. Samples were produced with the iQ Weight Control System both activated and deactivated. For each condition, five consecutive shots were collected immediately after the process stabilized following any change in material proportion or system activation status. Collection regions, as well as process variations, are presented in Figure 3 and Figure 4.

2.2. Methods

The weight of the specimens was measured using an AXSIS AD200 laboratory scale (AXIS, Gdańsk, Poland) with an accuracy of 0.001 g. The process robustness, defined as the amount of the plastic melt injected into the cavity of a spiral flow tool, was established.
The dimensional stability of the dog-bone and rectangular bar samples was measured using a Mitutoyo Digital Micrometer (Mitutoyo Corporation, Kanagawa, Japan) 0–25 with an accuracy of 0.0001.
The impact strength of notched rectangular specimens with dimensions of 80 × 10 × 4 mm was evaluated using the Charpy impact method by ISO 179. Tests were conducted at room temperature with a support span of 62 mm. A V-notch was introduced to each specimen to facilitate controlled crack initiation. During testing, the peak load was recorded as the maximum force (Fmax) sustained by the specimen. A Zwick/Roell HIT 25P impact tester (Zwick, Ulm, Germany) equipped with a 5 J pendulum hammer was employed for all measurements.
To determine the values of tensile strength Rm [MPa], Young’s modulus E [MPa], and elongation at breakage ε [%], a static tensile test was carried out according to ISO 527-1. A Zwick Z020NT universal testing machine (Zwick, Ulm, Germany) was used with a tensile speed of 50 mm/min.
Pp (Process Performance) and Ppk (Process Performance Capability) are statistical metrics used to evaluate the capability of a process to produce output within specified limits. These indicators are crucial in various industries, including semiconductor manufacturing, pharmaceutical production, and automotive manufacturing, to ensure product quality and process efficiency. Pp measures the overall capability of a process to meet specification limits, considering both the mean and variability of the process over a long-term period [23,24,25]:
P p = U S L L S L 6 σ P = U S L L S L 6 s  
where USL—Upper Specification Limit; LSL—Lower Specification Limit; σP, s—Standard Deviation.
Ppk is a more refined measure that accounts for the process mean and its deviation from the target value, providing insight into the process’s ability to produce within specification limits consistently [24,26,27]:
P p k = min P P U ; P P L
P P U = U S L X = 3 σ P = U S L X = 3 s
P P L = X = L S L 3 σ P = X = L S L 3 s
where USL—Upper Specification Limit; LSL—Lower Specification Limit; σP, s—Standard Deviation; X = —mean of the sample means.
Pp and Ppk are used to dynamically obtain parts per million (ppm) and acceptance limits, integrating statistical modules for monitoring and controlling equipment setup [23]. Ppk is also critical for assessing process robustness and making early predictions on process capability during development stages using Bayesian statistics and expert knowledge [18]. In the automotive industry, Pp and Ppk are preferred for long-term variation estimations, aiding in continuous improvement efforts and ensuring high-quality production [26,28]. The accuracy of Pp and Ppk can be affected by estimation errors due to unknown process parameters. Techniques such as Bayesian methods and advanced statistical models can mitigate these errors [24,25,29]. The performance of Pp and Ppk indices can be influenced by the tail behavior of distributions, particularly in non-normal processes like Weibull distributions [28]. There is confusion in the industry regarding the proper use of these indices, leading to inconsistent assessments of process capability. Proper characterization and understanding of variation are essential for effective application [26]. To assess normality, the classical Shapiro–Wilk test was used [30].

3. Results

3.1. Mass Consistency and Process Robustness

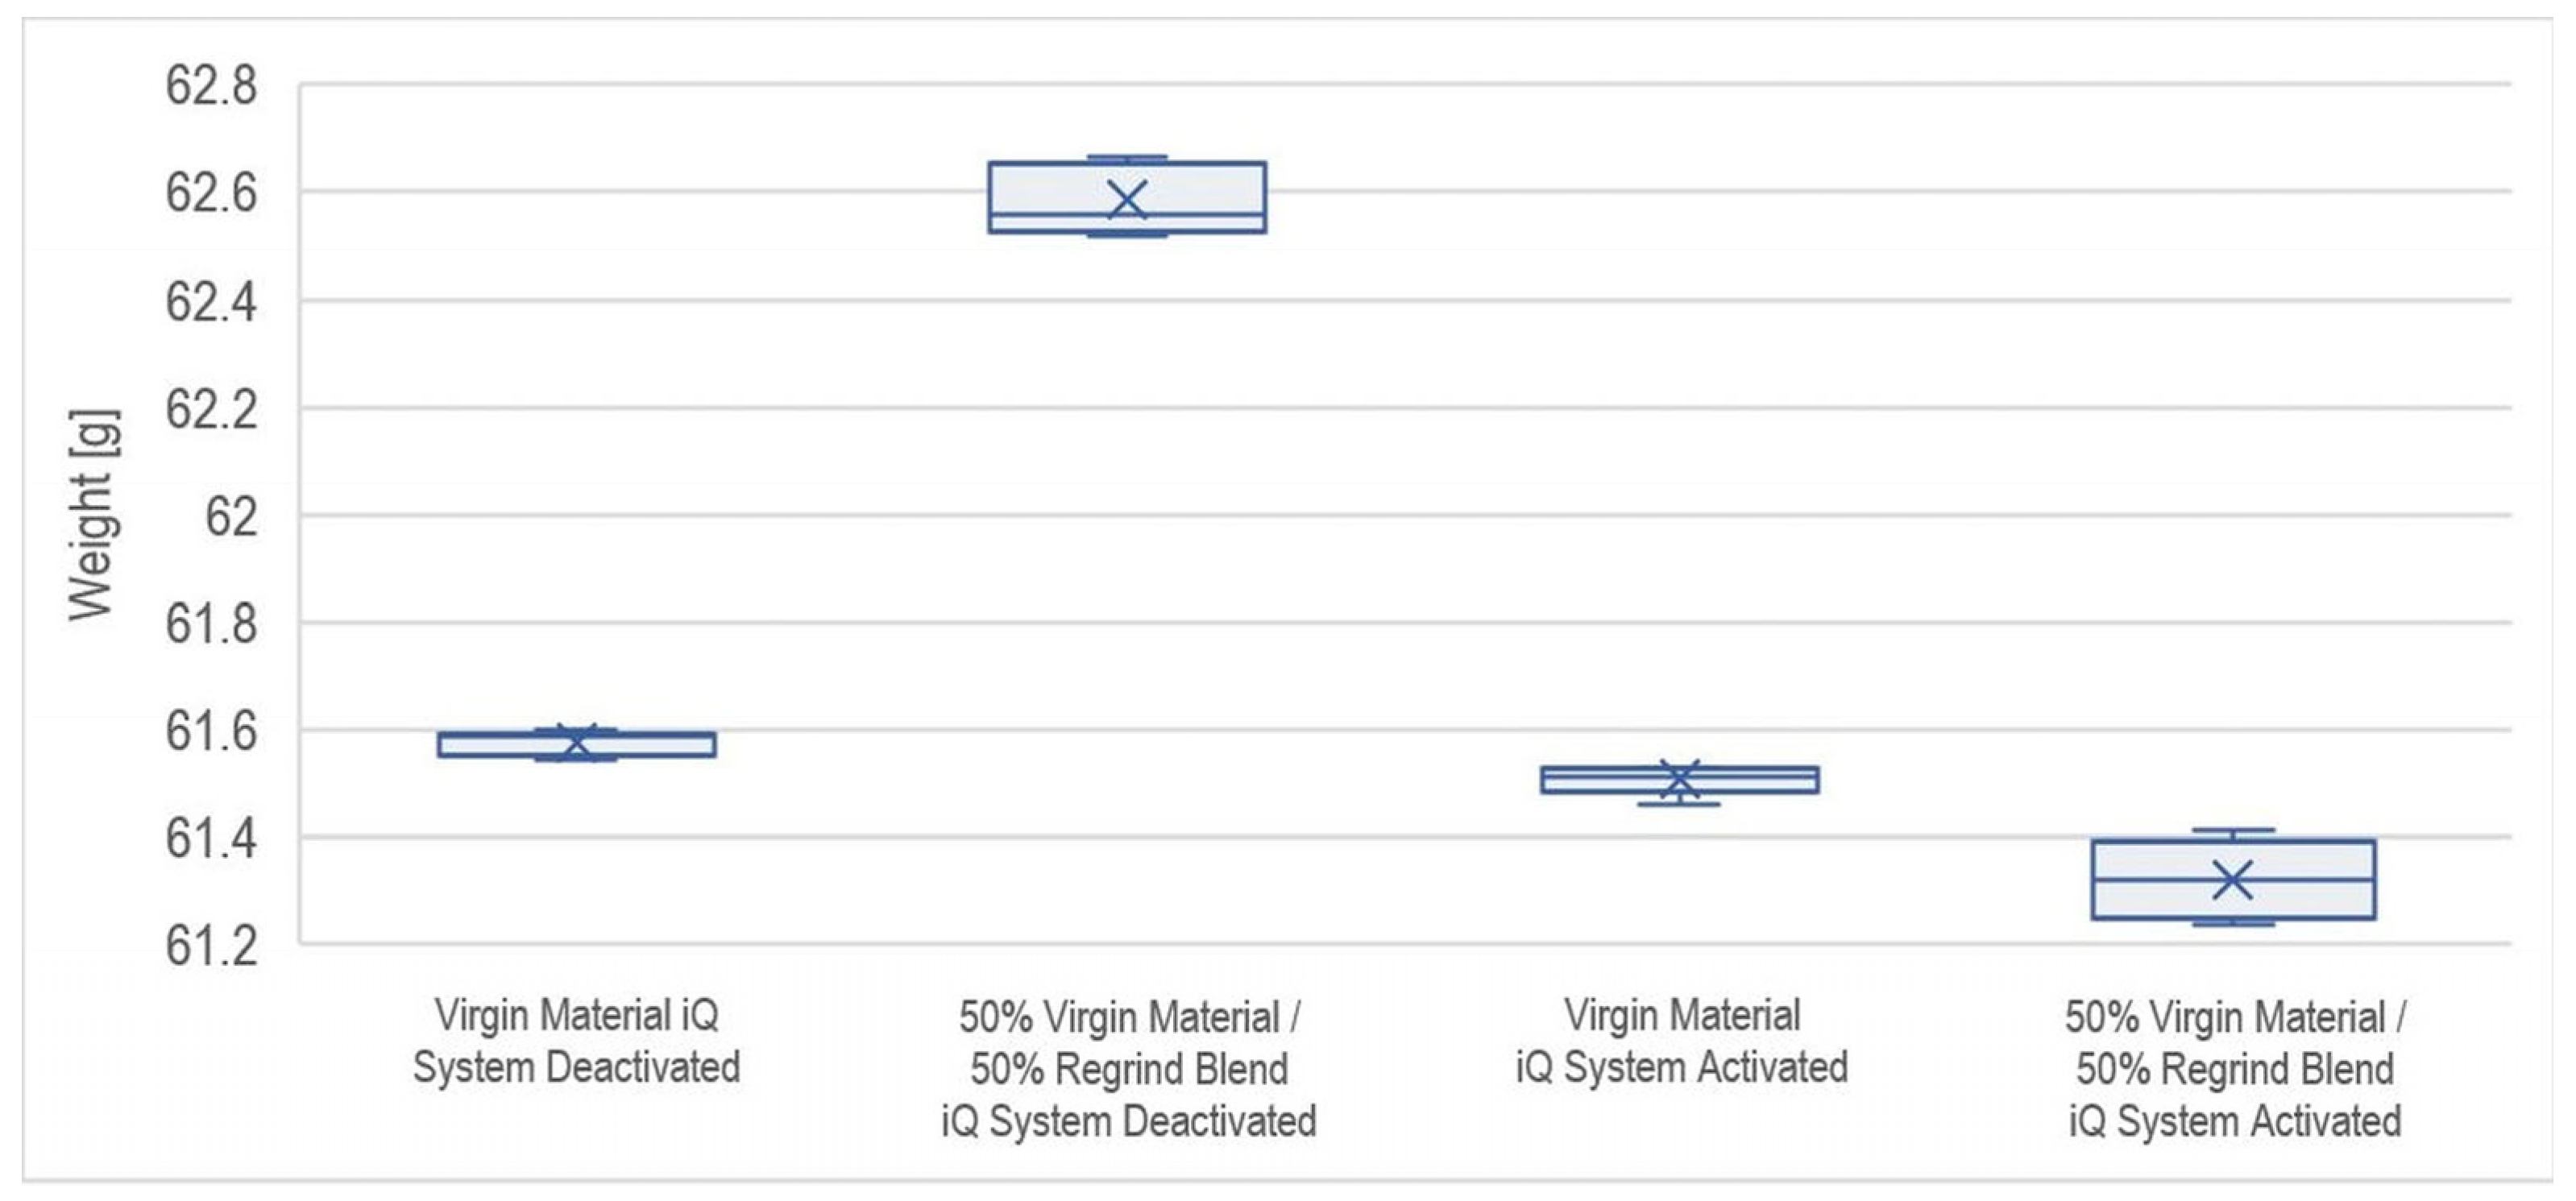
The incorporation of 50% regrind material was found to influence the mass consistency of molded parts. Activation of the iQ Weight Control System led to improved weight uniformity, allowing the final part weight to closely match that of parts produced entirely from virgin material. Although the proportion of regrind had minimal effect on weight variability, the system ensured consistent part mass throughout production. Results are presented in Table 1 and Figure 5.
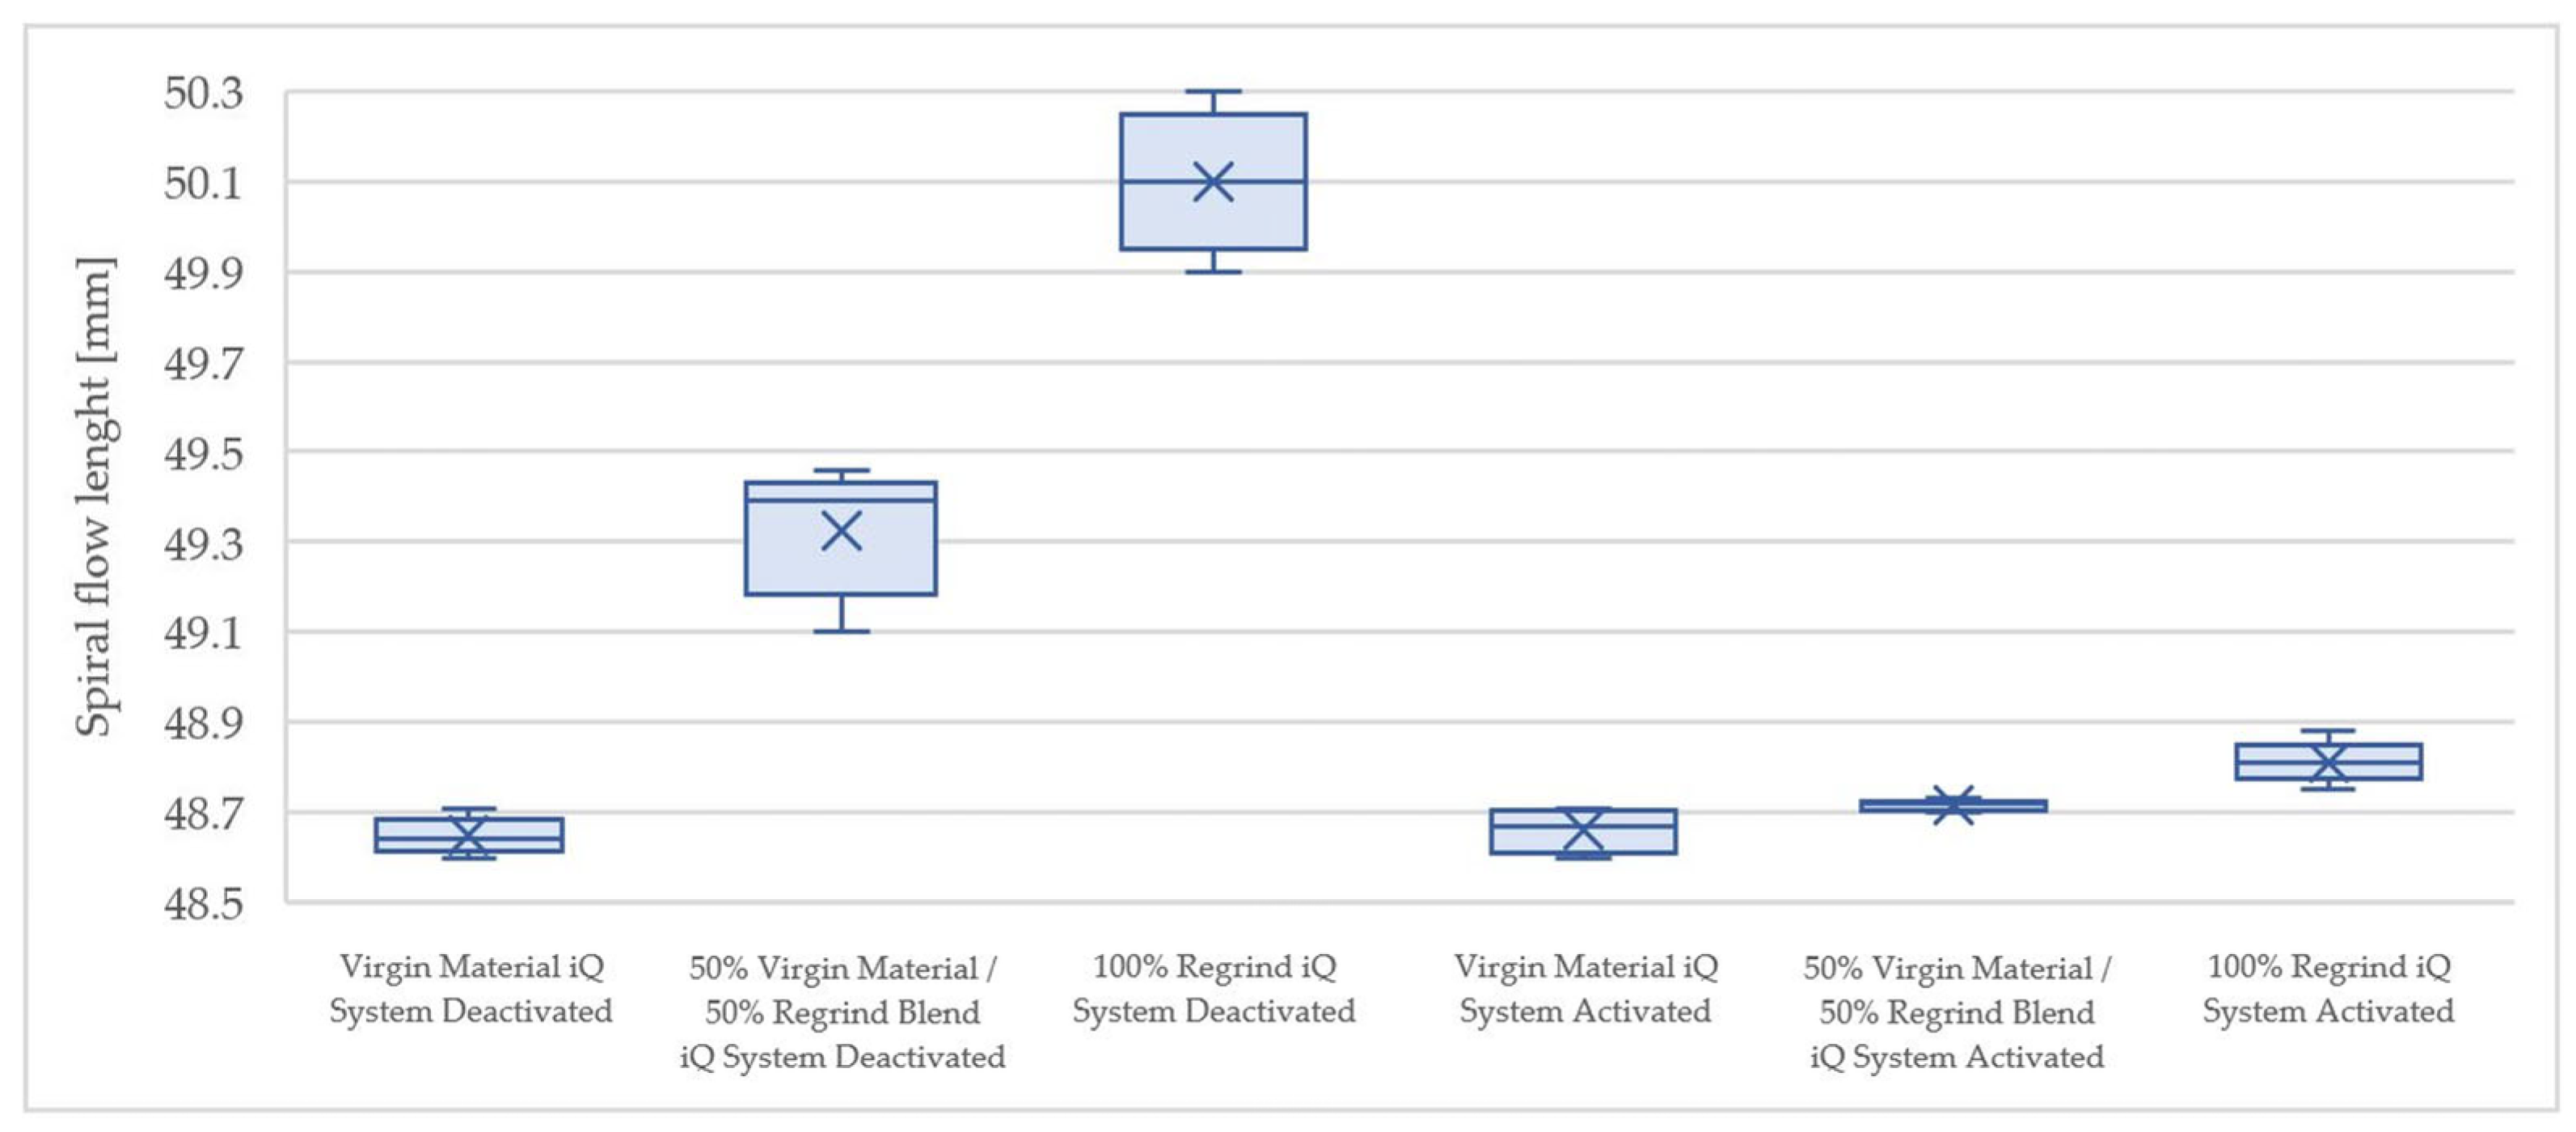
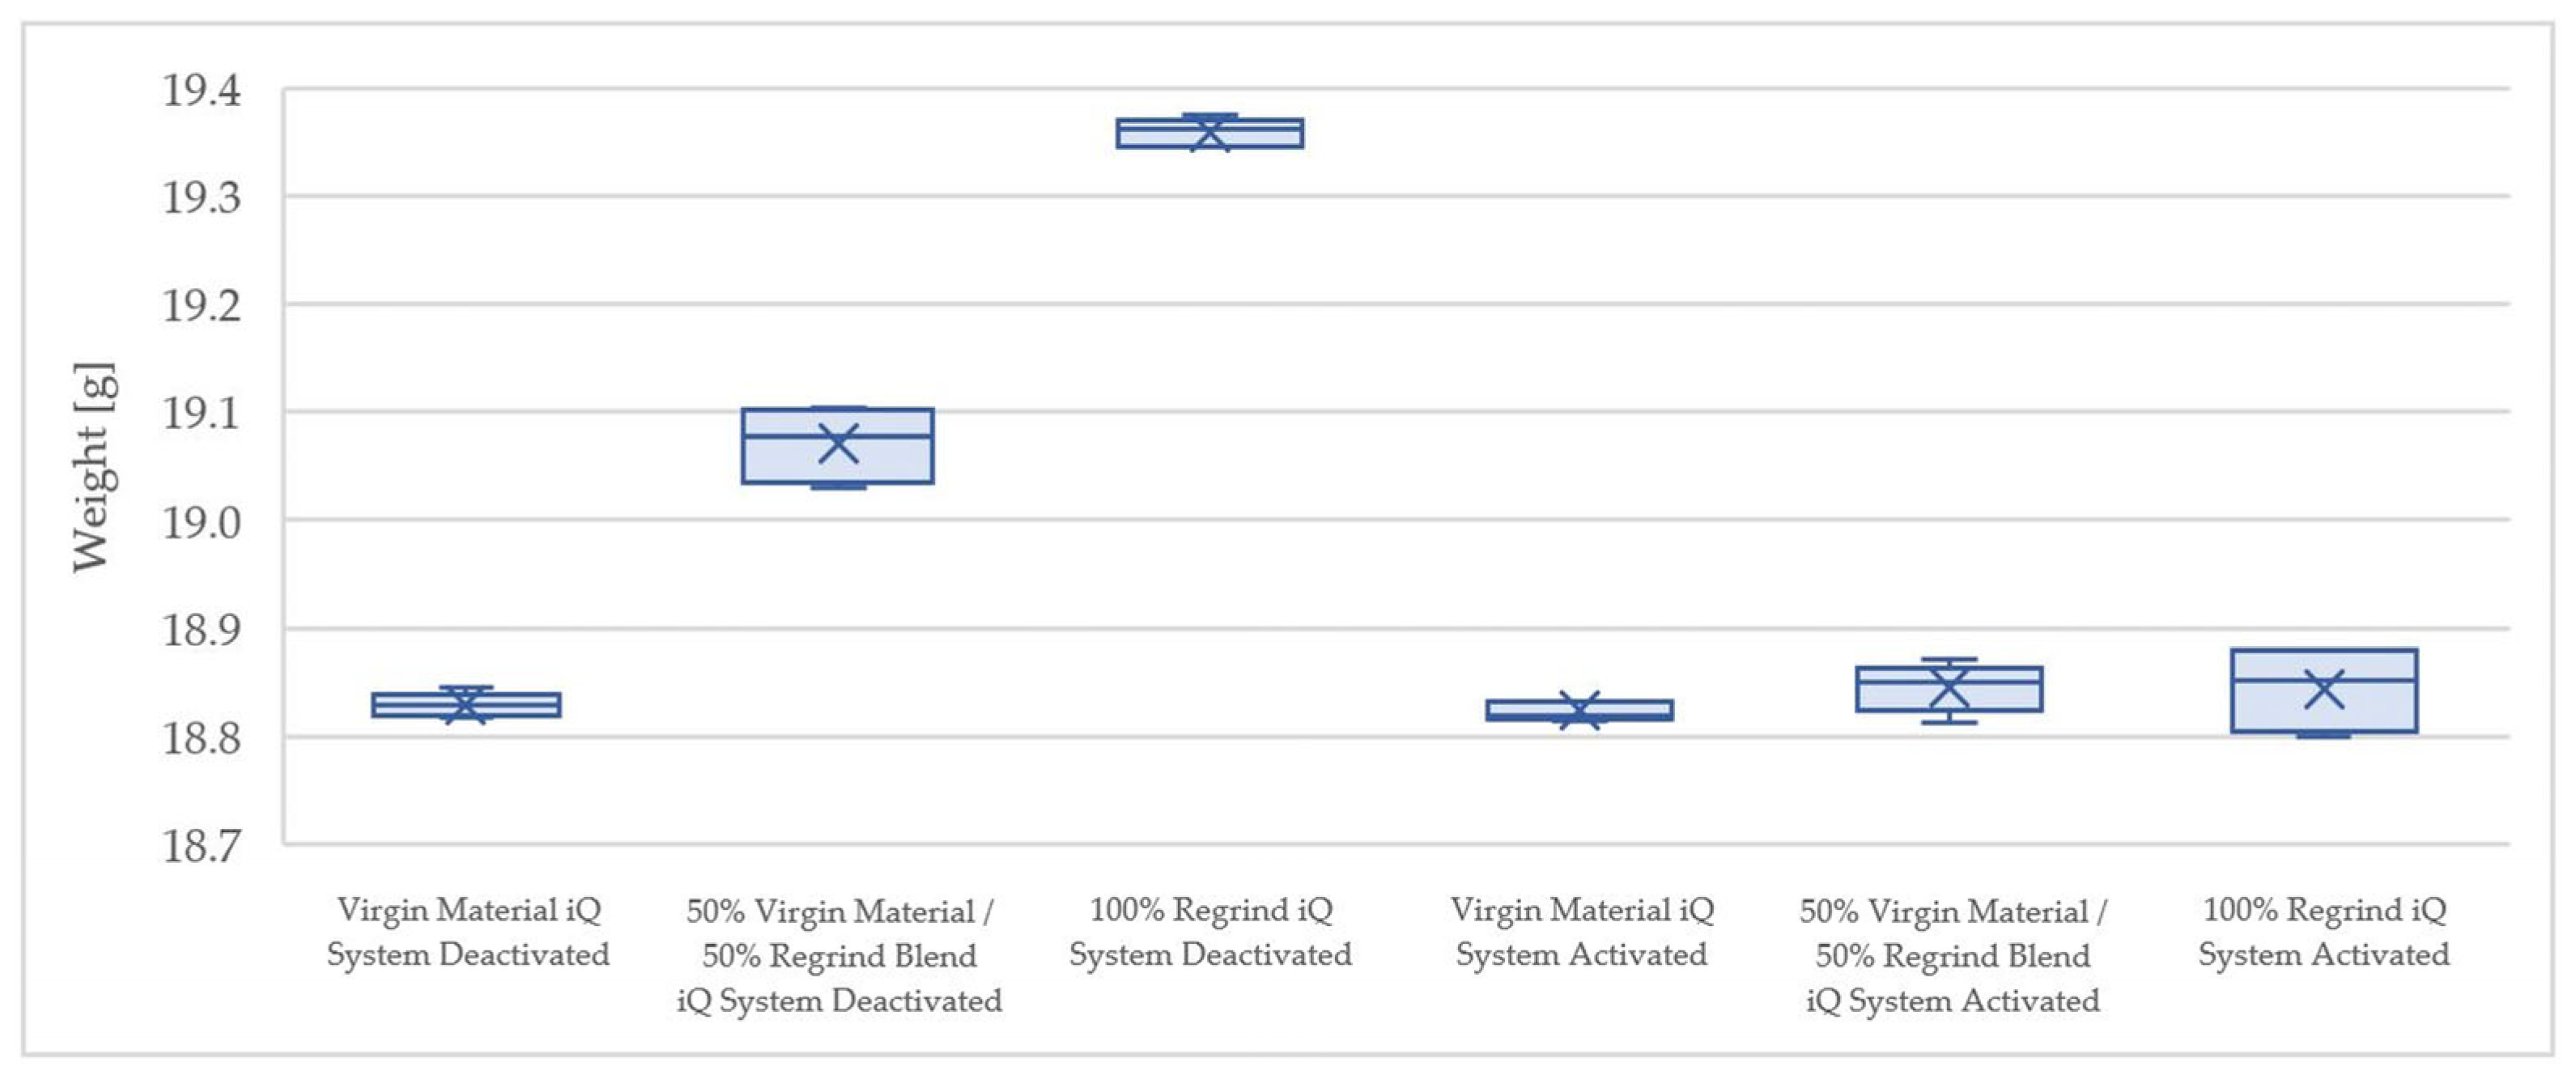
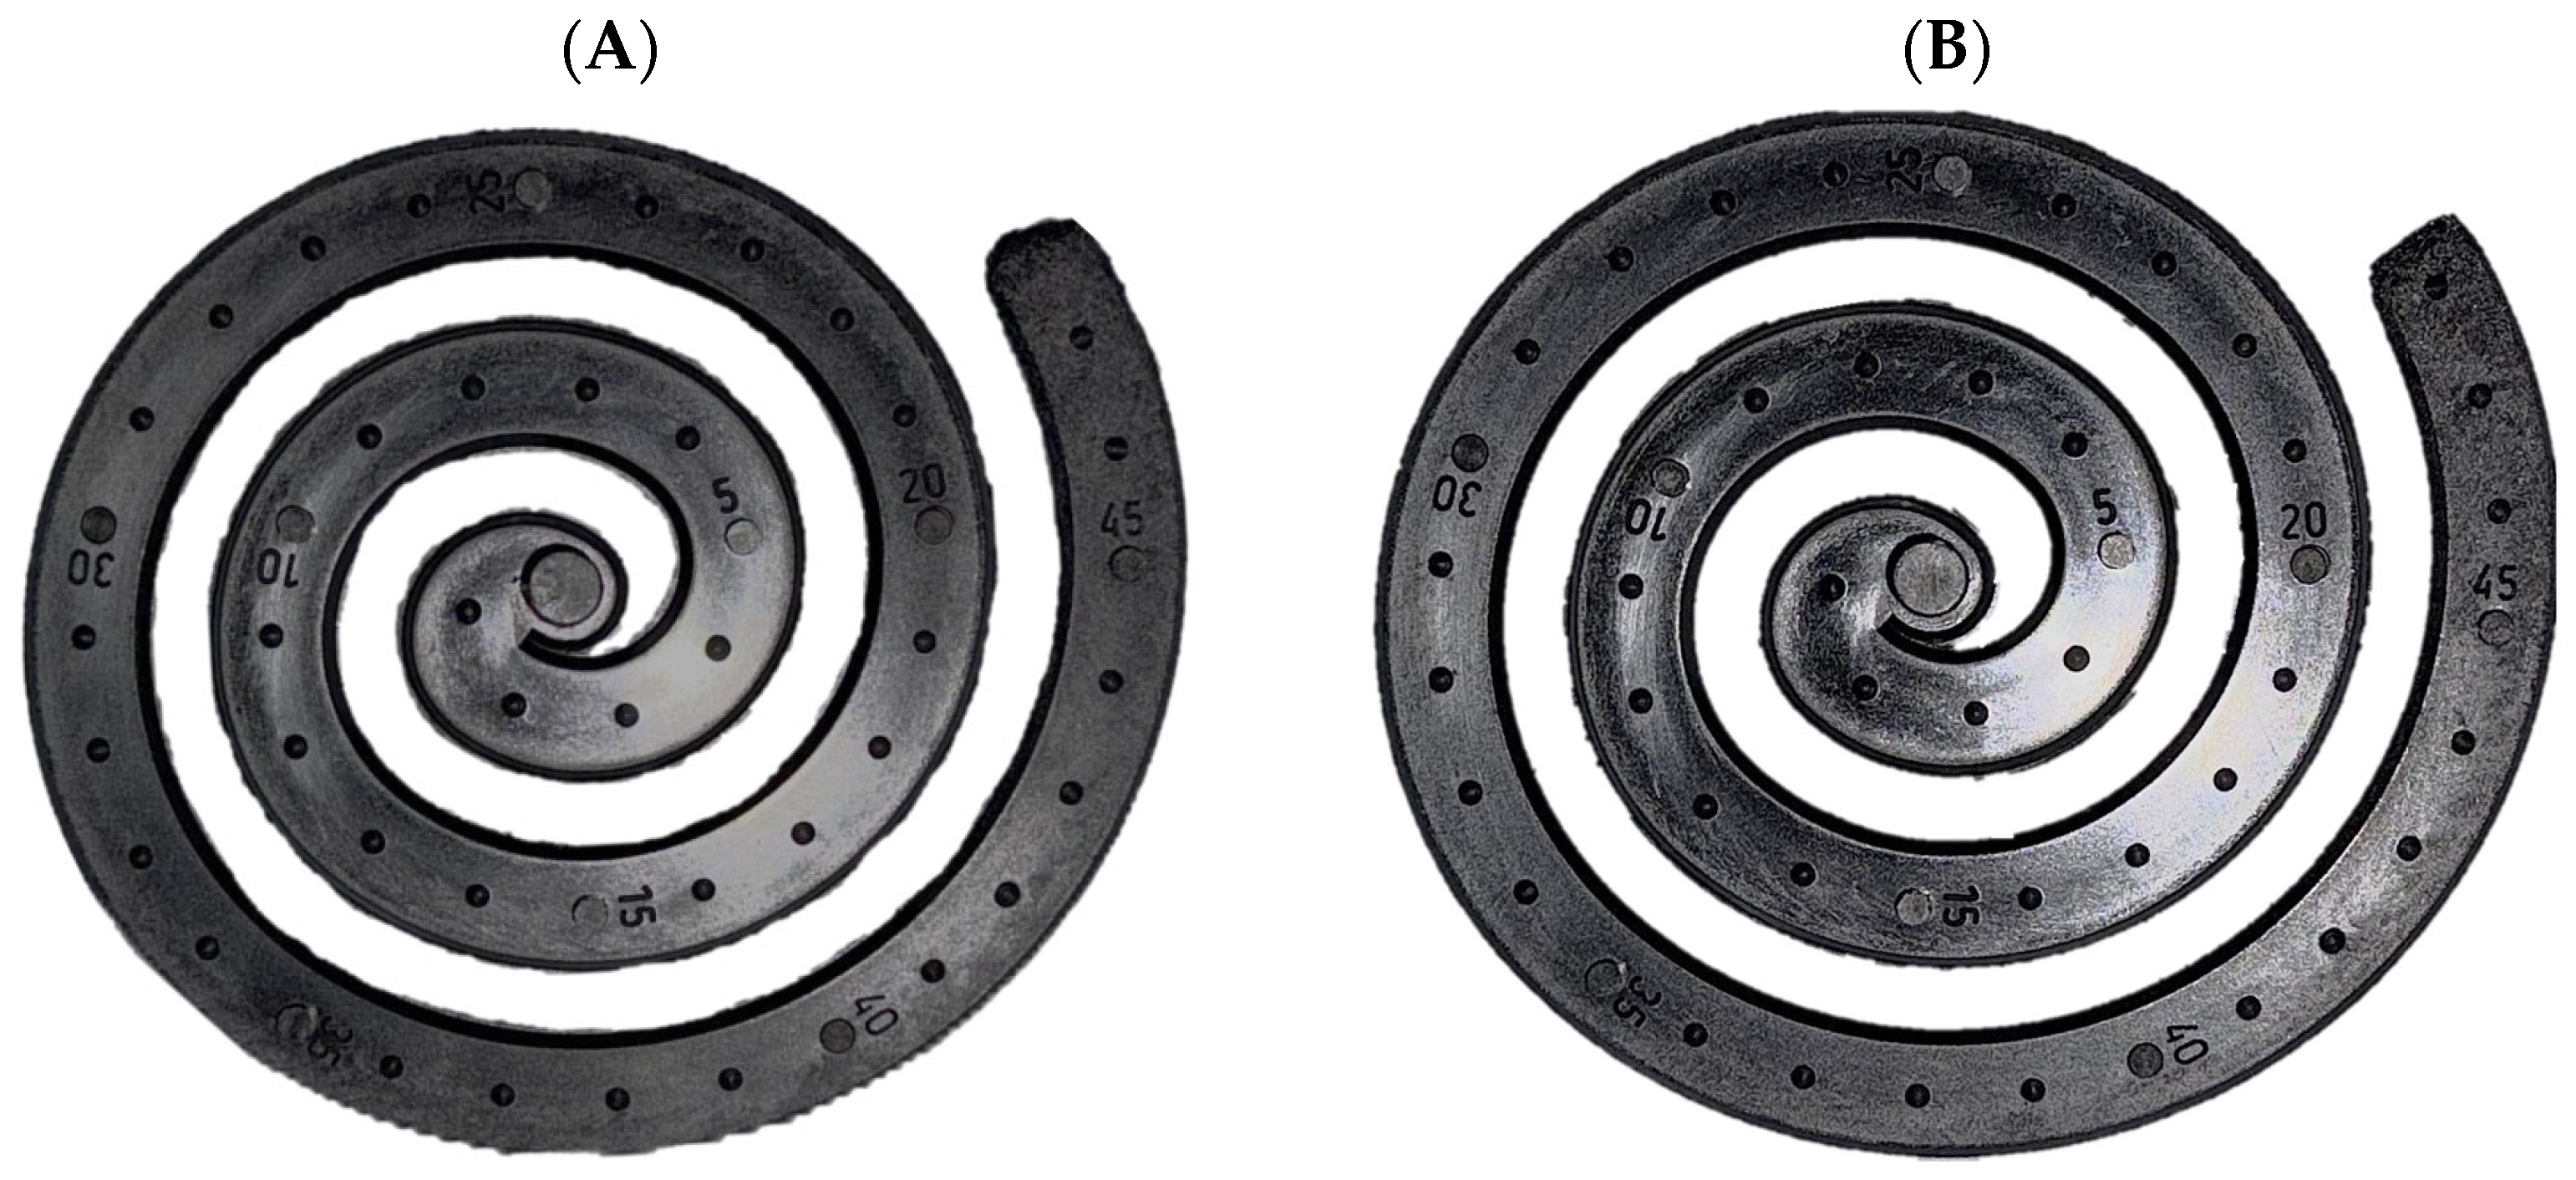
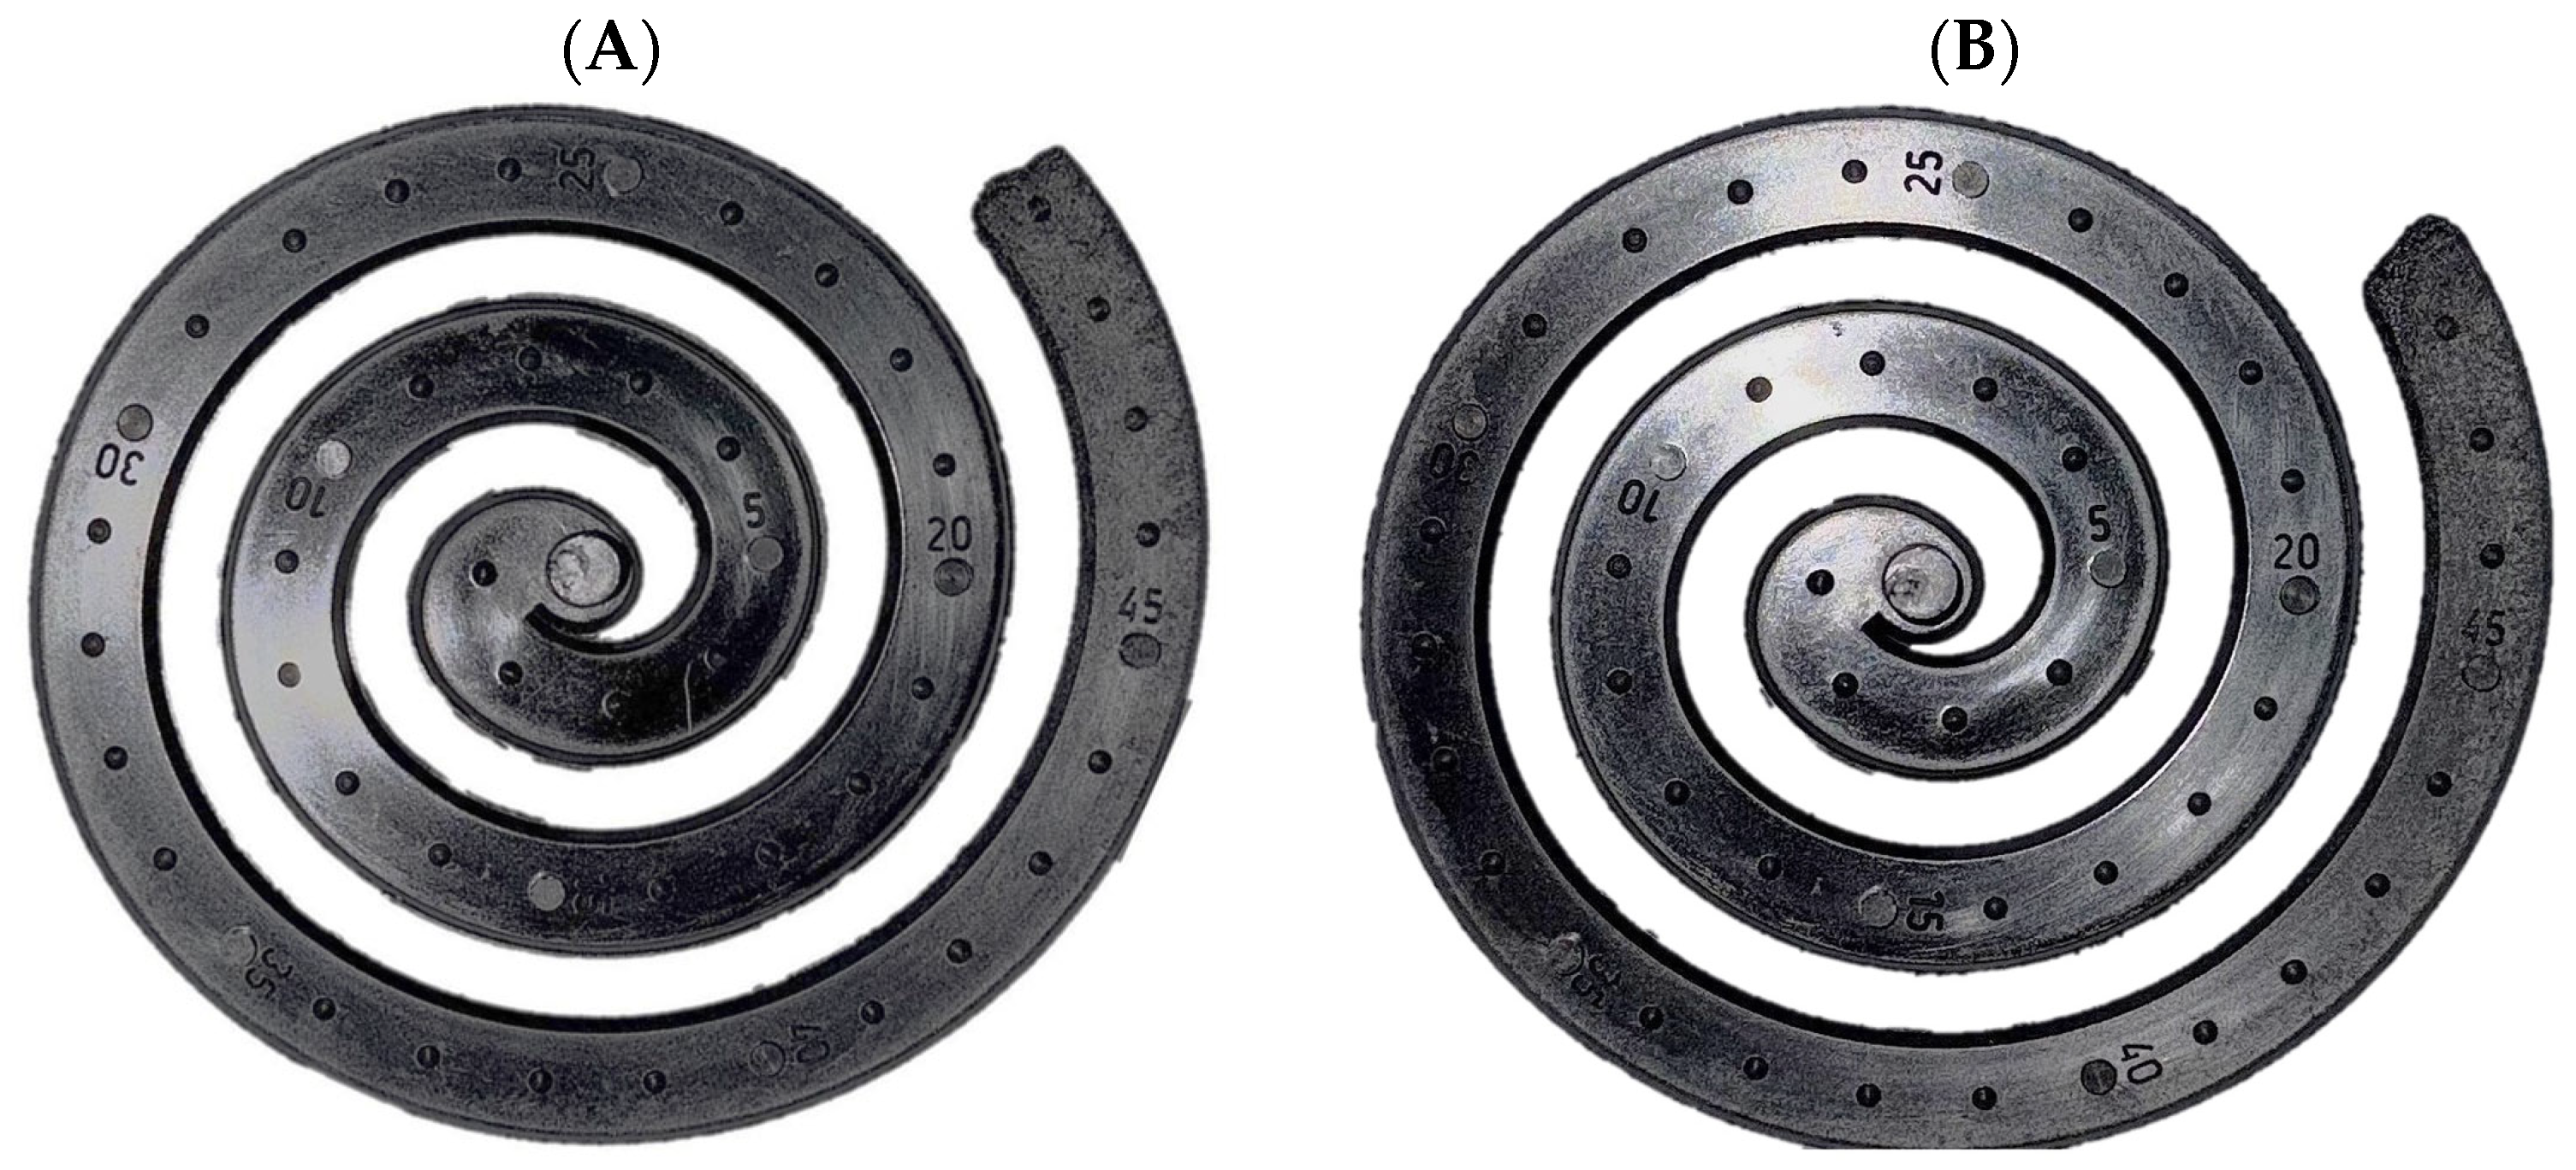
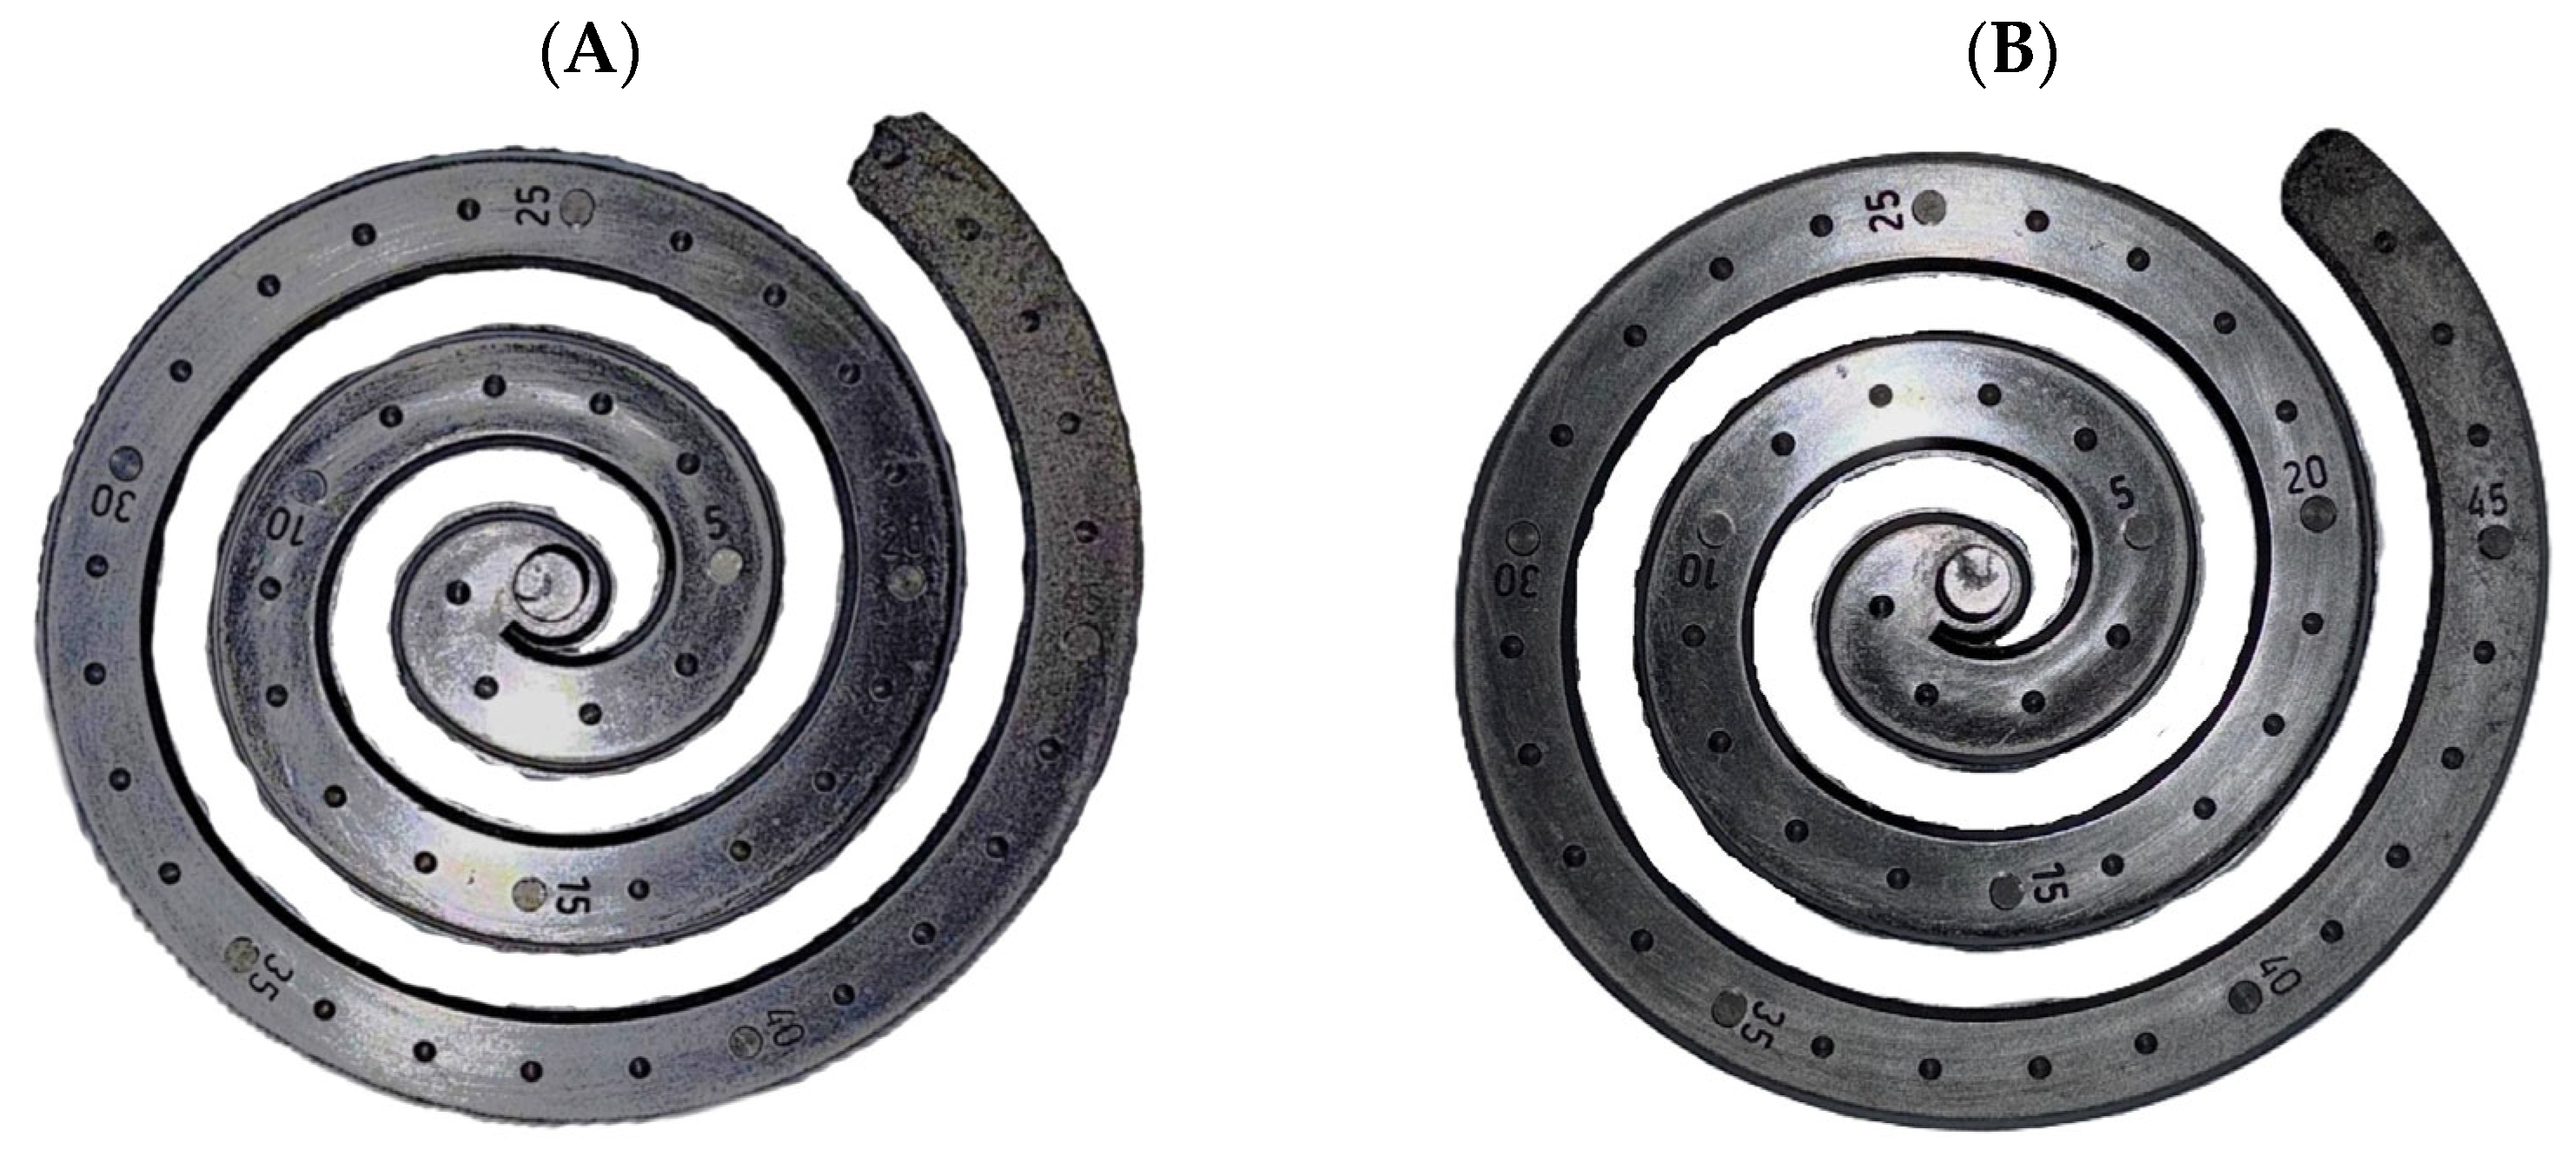
Spiral flow specimens were employed to evaluate process robustness, defined in this context as the volume of polymer injected into the mold cavity, represented by the flow length of the spiral [31]. The iQ Weight Control System demonstrated its effectiveness in stabilizing the injected volume, as evidenced by consistent flow lengths. A corresponding increase in specimen weight was also observed with increasing flow length. In this test, 100% regrind material was used to assess the system’s responsiveness to significant changes in melt viscosity. Due to the open-ended design of the spiral flow test tool, which lacks a physical flow restriction, it was possible to assess the full extent of material flow accurately and, by extension, the injected volume. The results are summarized in Table 2 and illustrated in the following Figure 6 and Figure 7. With the iQ Weight Control System deactivated, the spiral flow length increased proportionally with the regrind content, by 1.38% for a 50% regrind blend and by 2.98% for 100% regrind. When the system was activated, these increases were significantly reduced to 0.12% and 0.31%, respectively. This corresponds to an 89.65% improvement in flow length stability for the 100% regrind condition, demonstrating the system’s effectiveness in compensating for substantial viscosity variations.
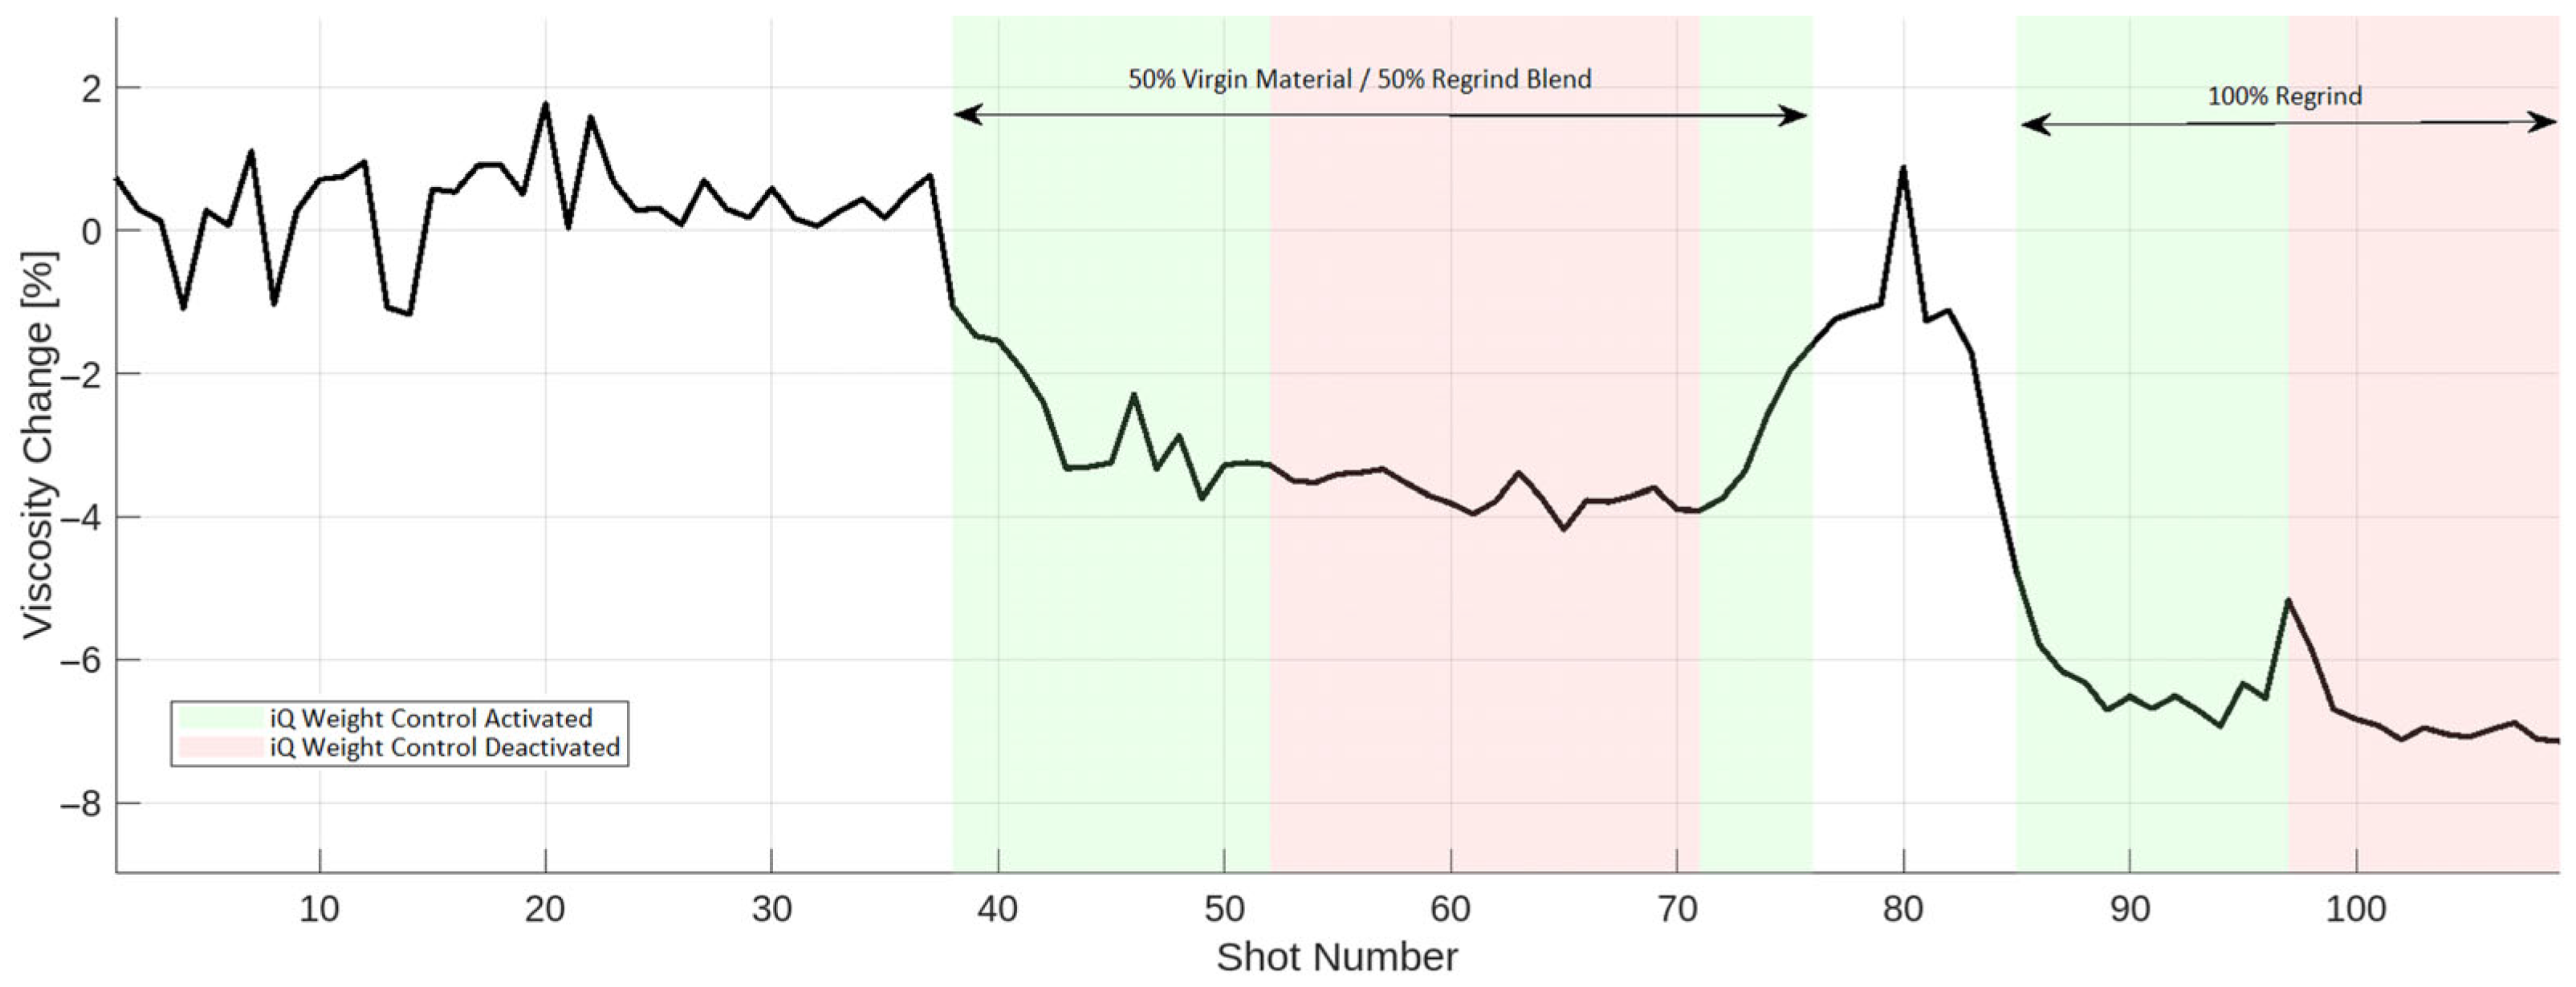
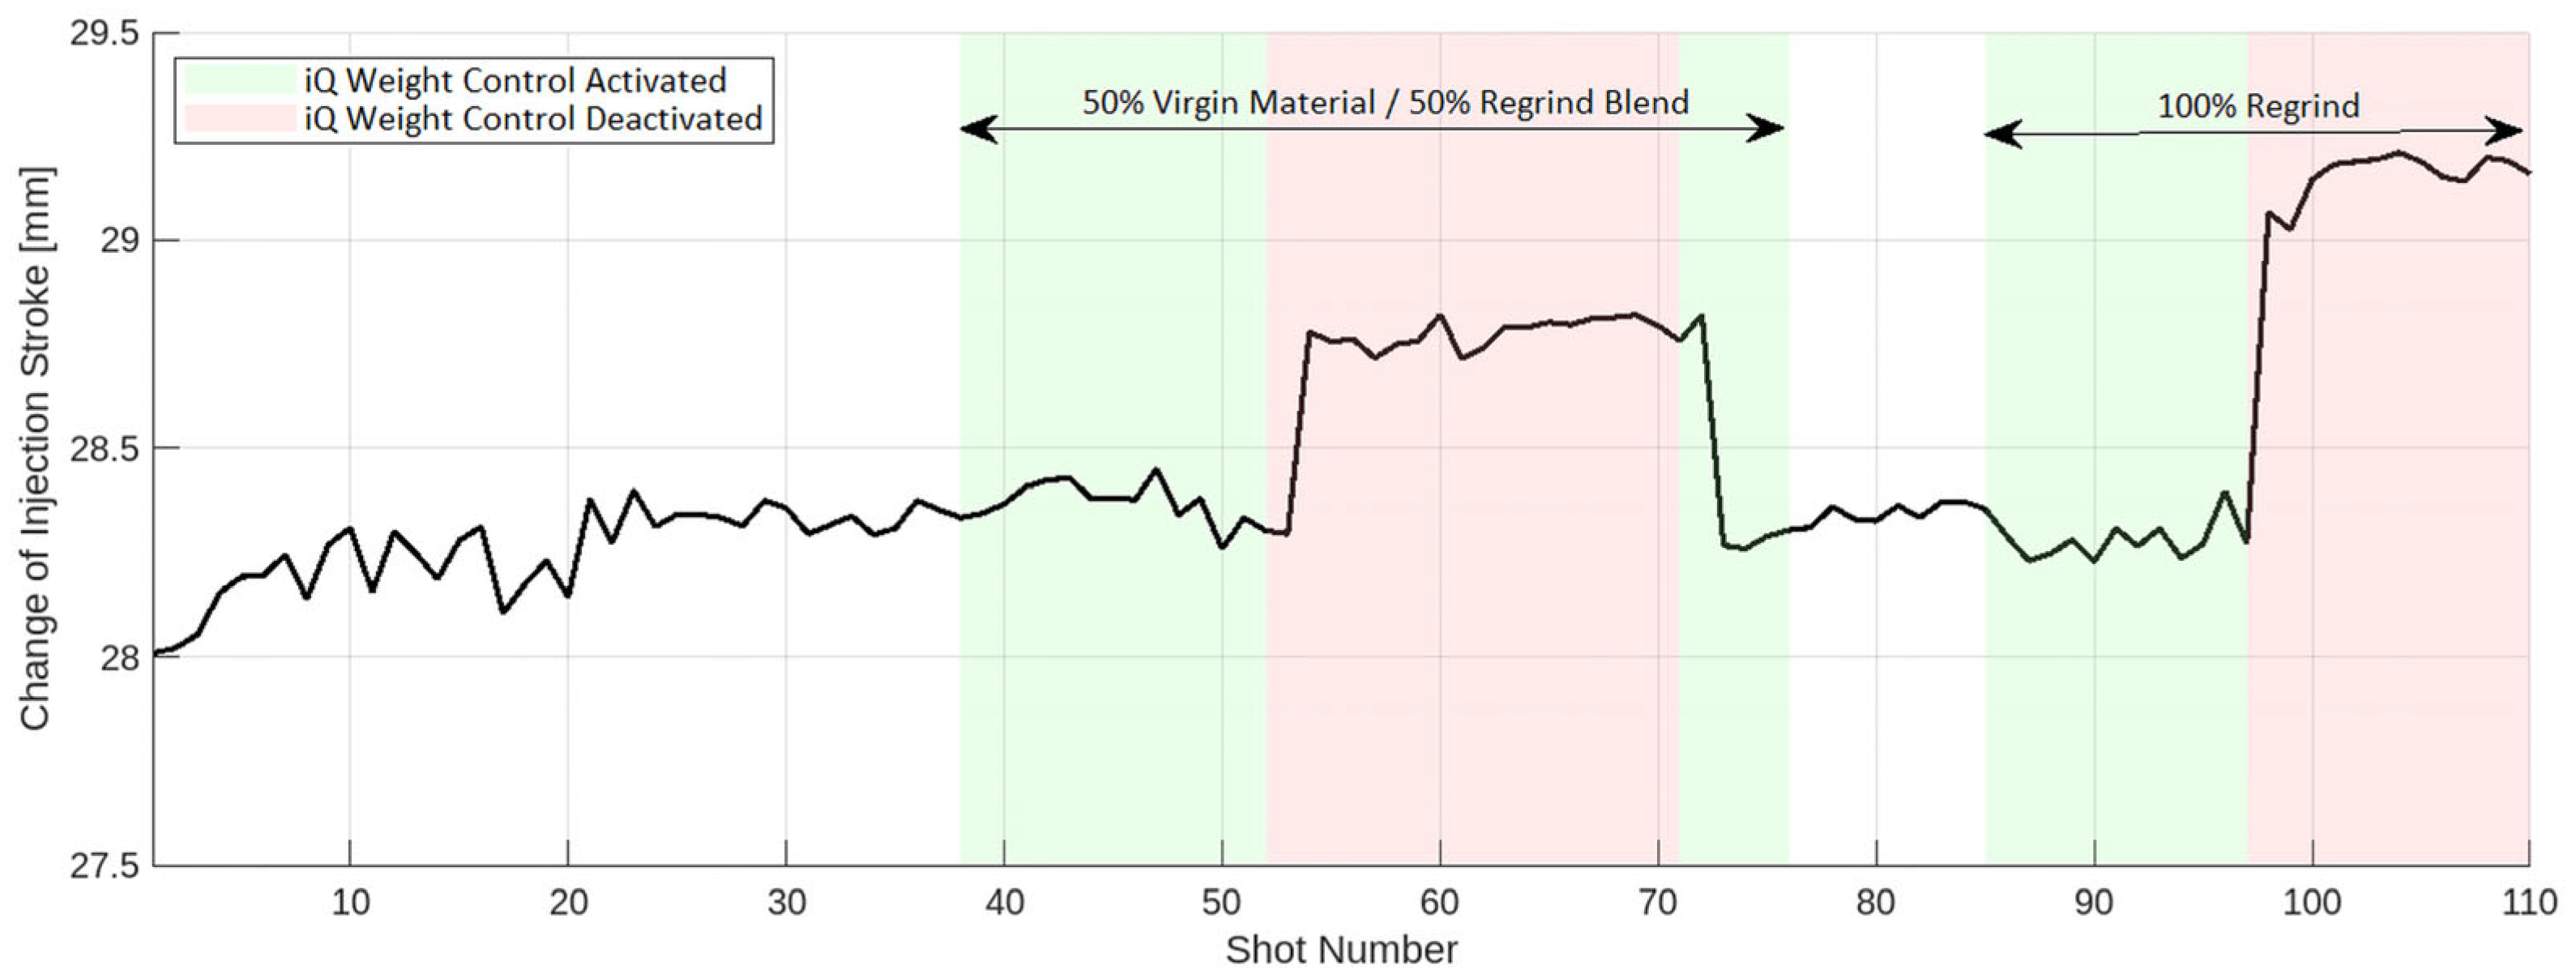
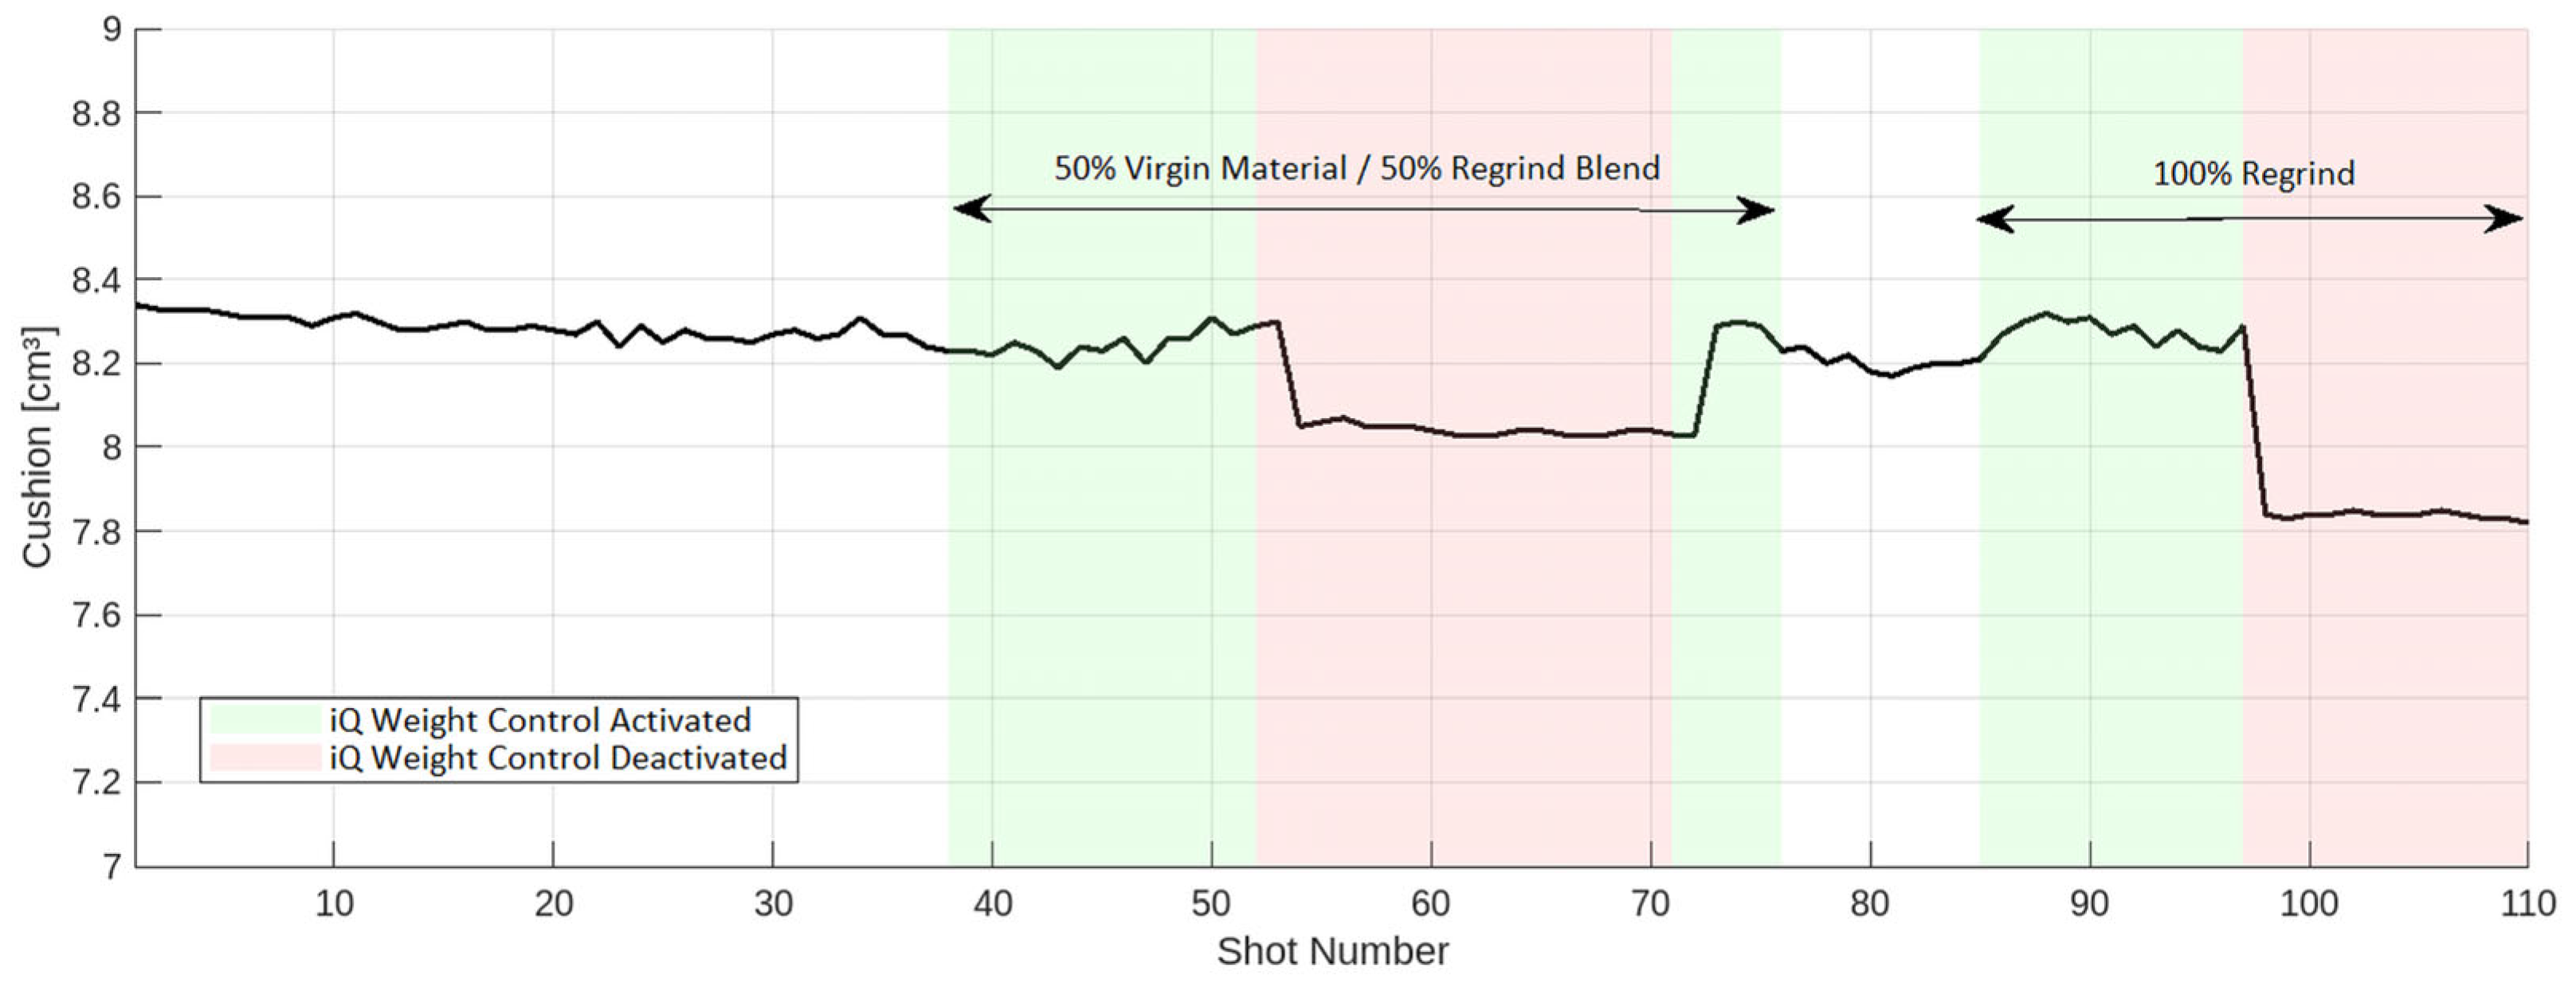
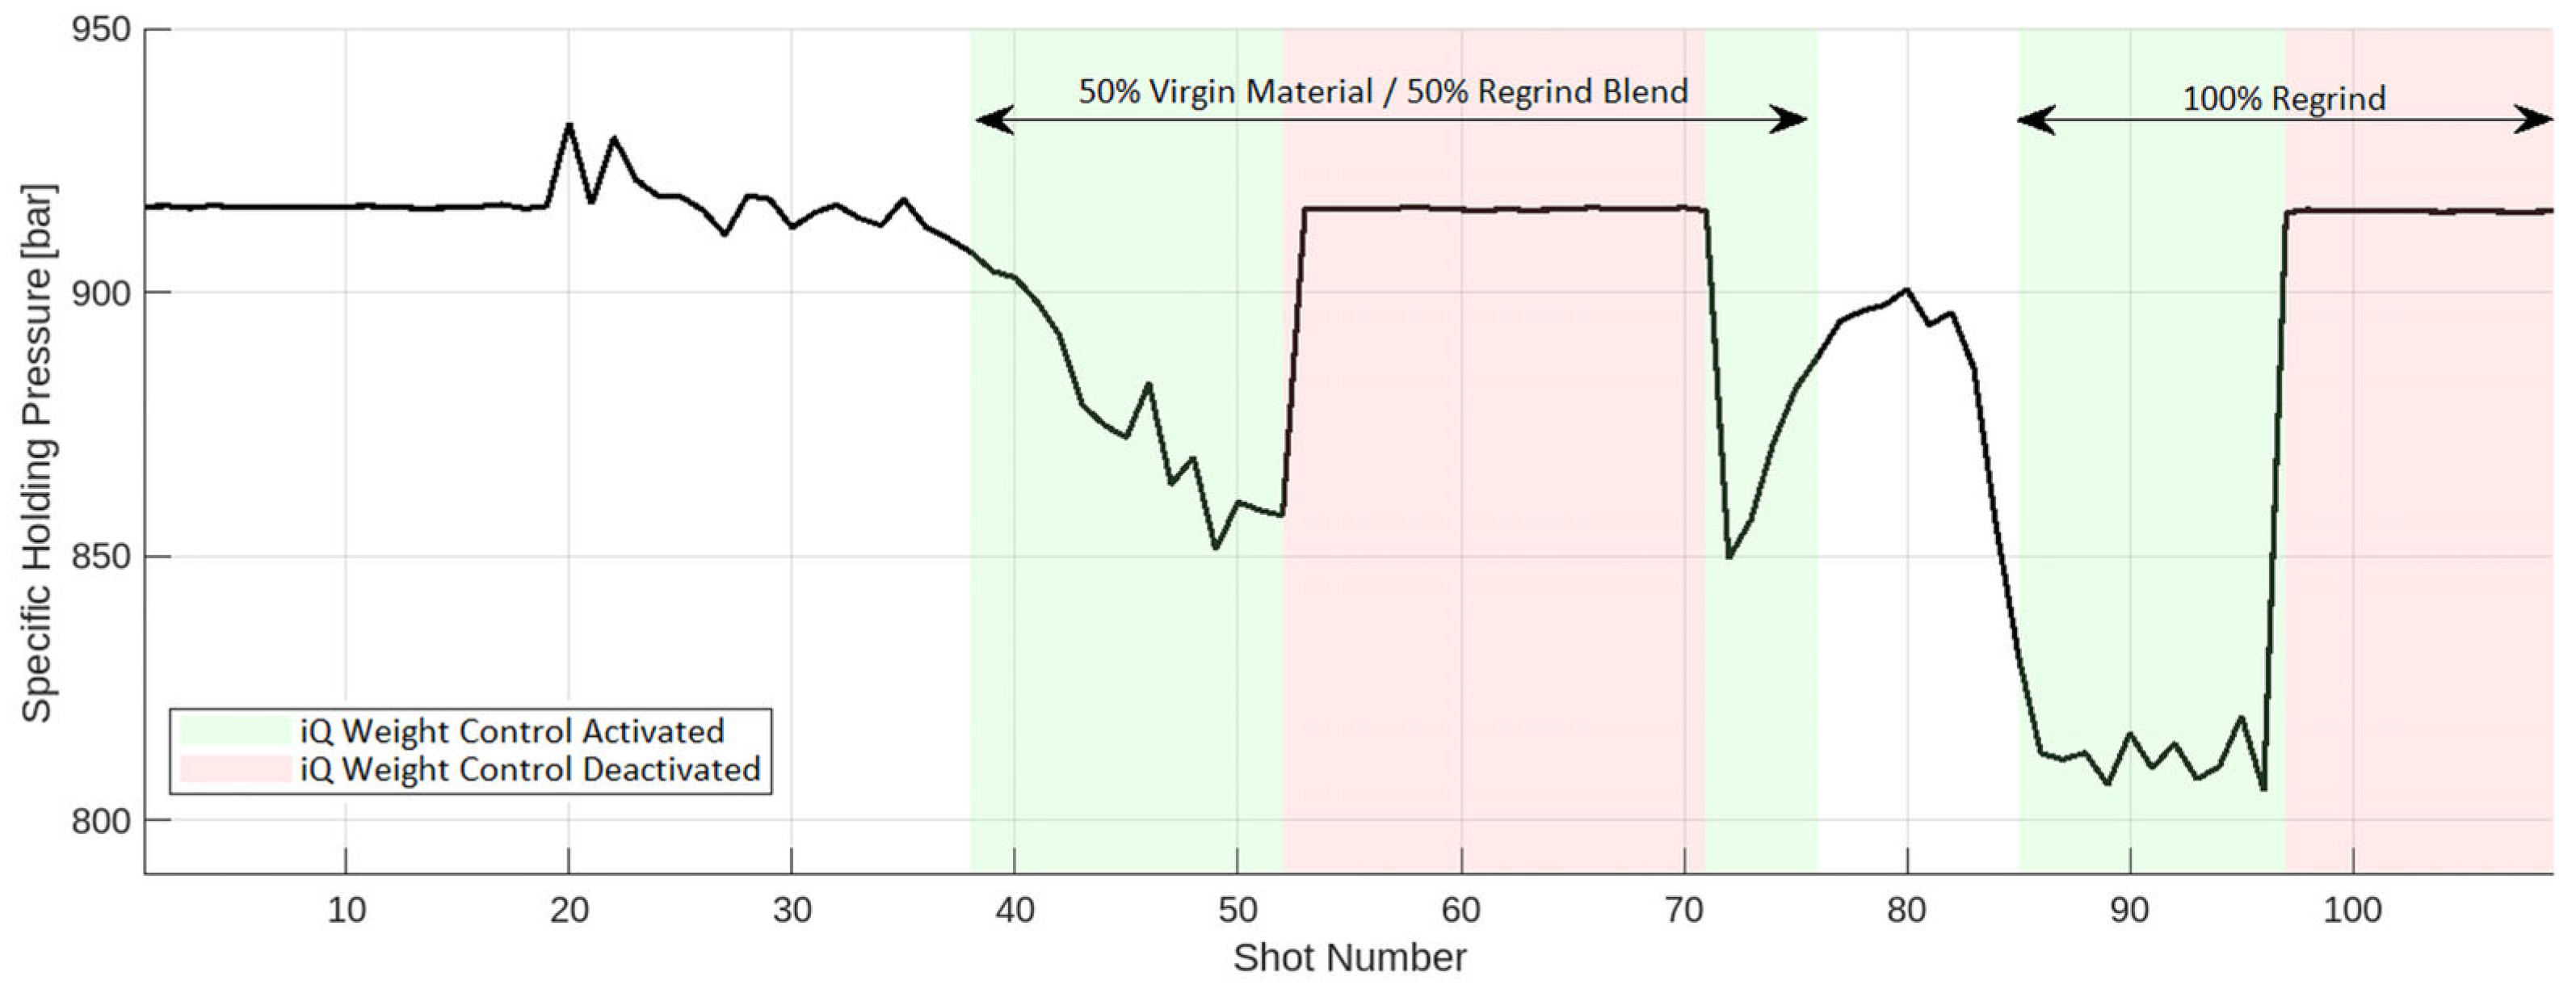
Viscosity fluctuations and corresponding adjustments to injection molding parameters are illustrated in Figure 8, Figure 9, Figure 10 and Figure 11. It can be observed that for a conventional process, when adaptive process adjustment is deactivated, as soon as the viscosity decreases, the volume of injected molten plastic increases (Figure 12, Figure 13 and Figure 14). It happens because lower viscosity is equal to lower resistance to flow. When the system is not changing parameters, such as holding pressure with lower resistance, the screw that acts as a plunger can push more material into the cavity [32].

3.2. Dimensional Stability

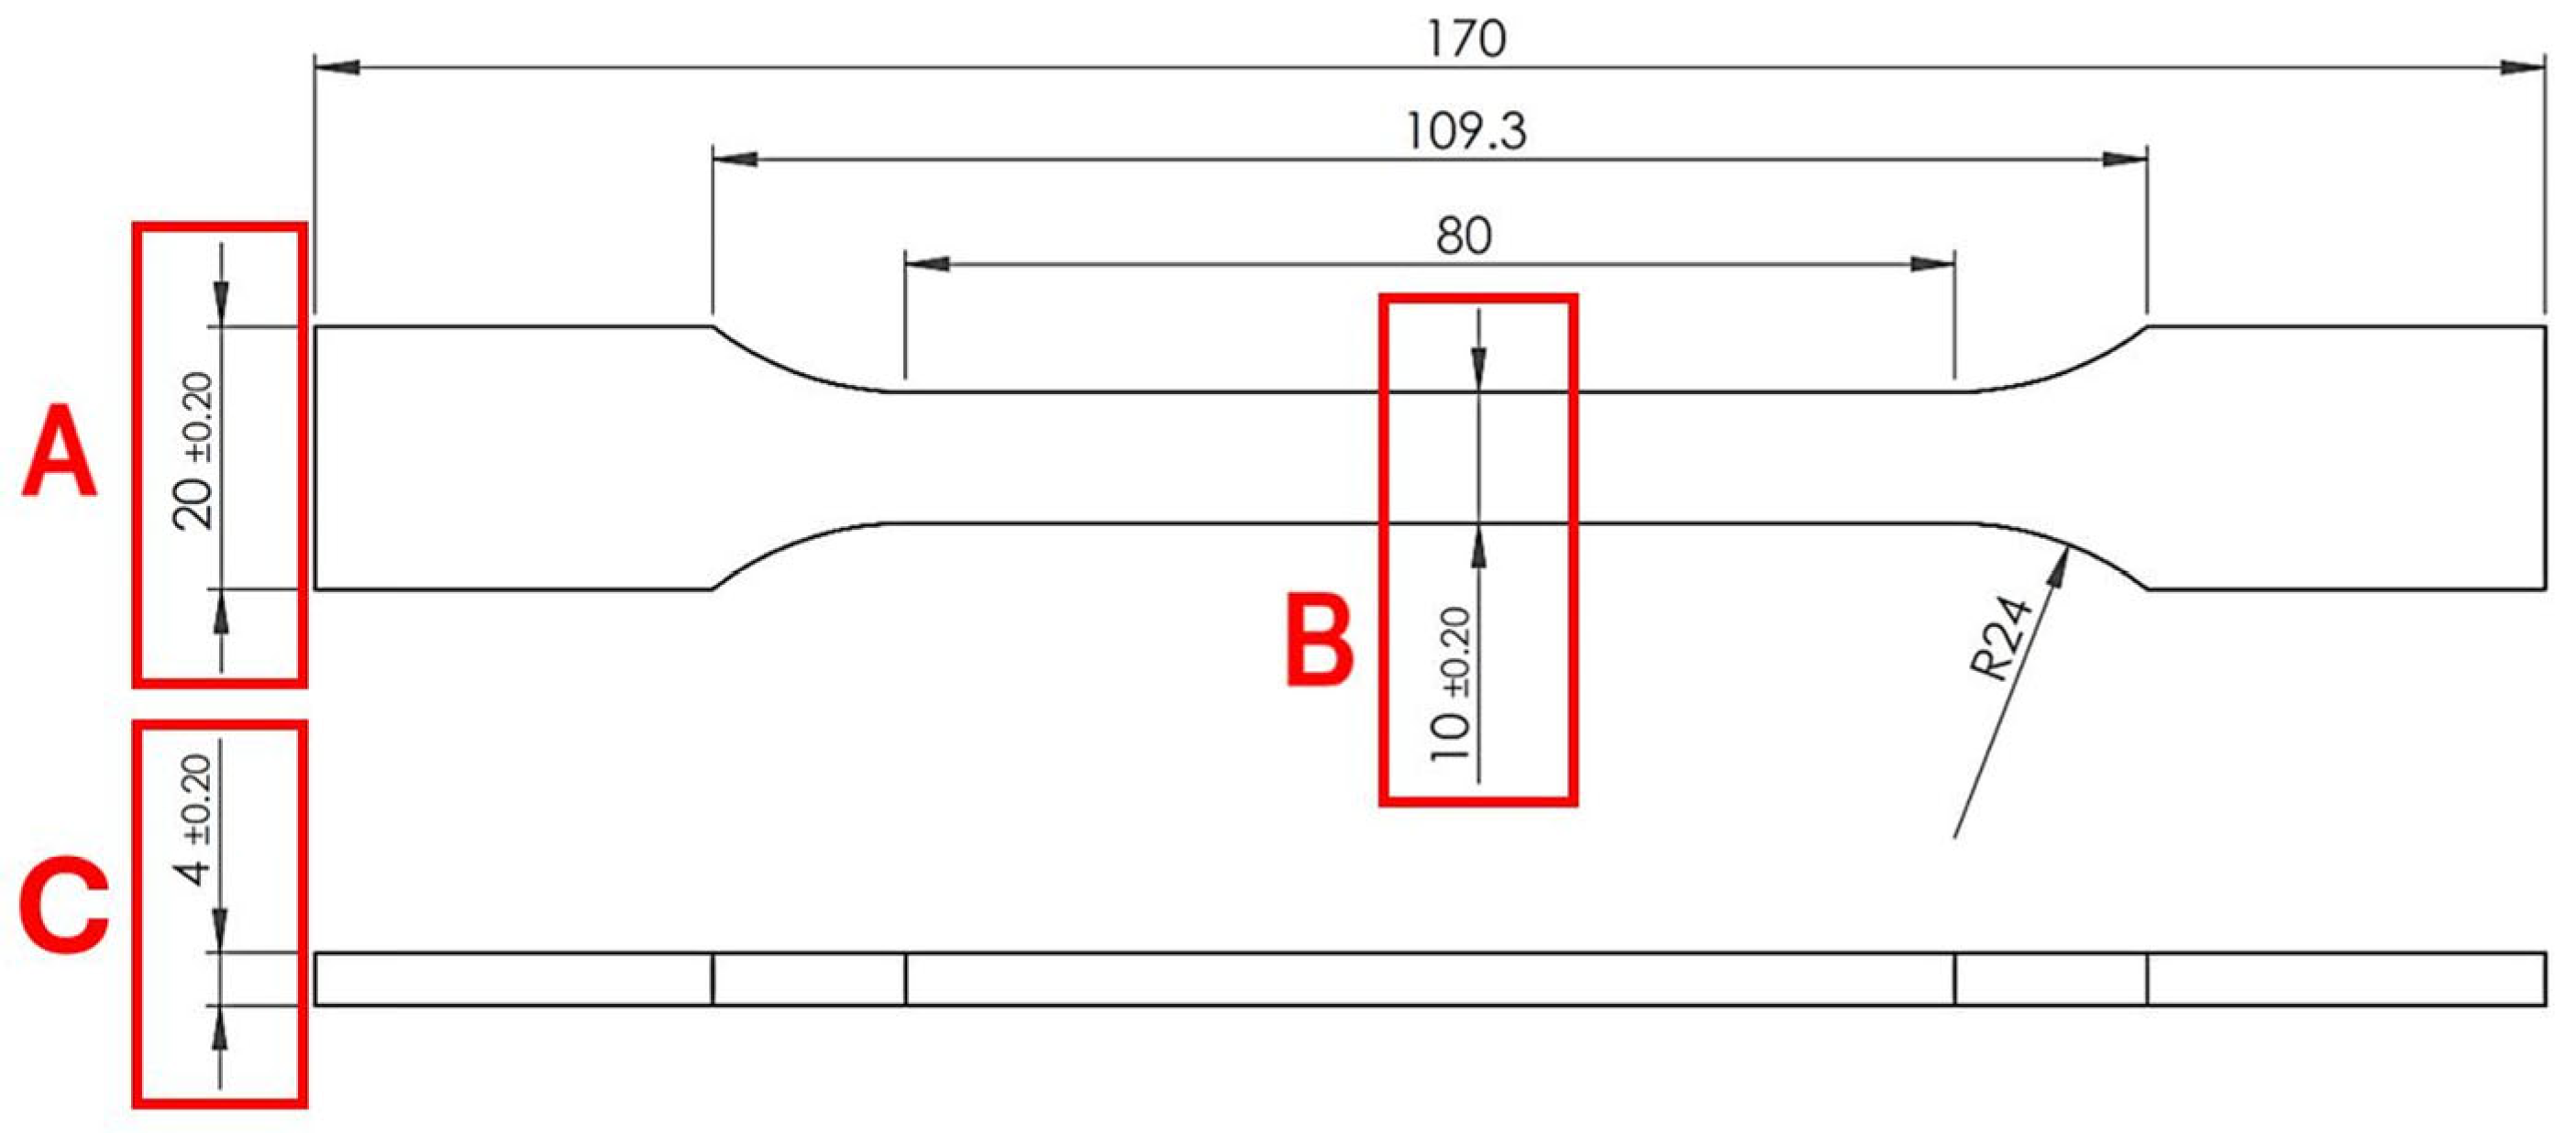
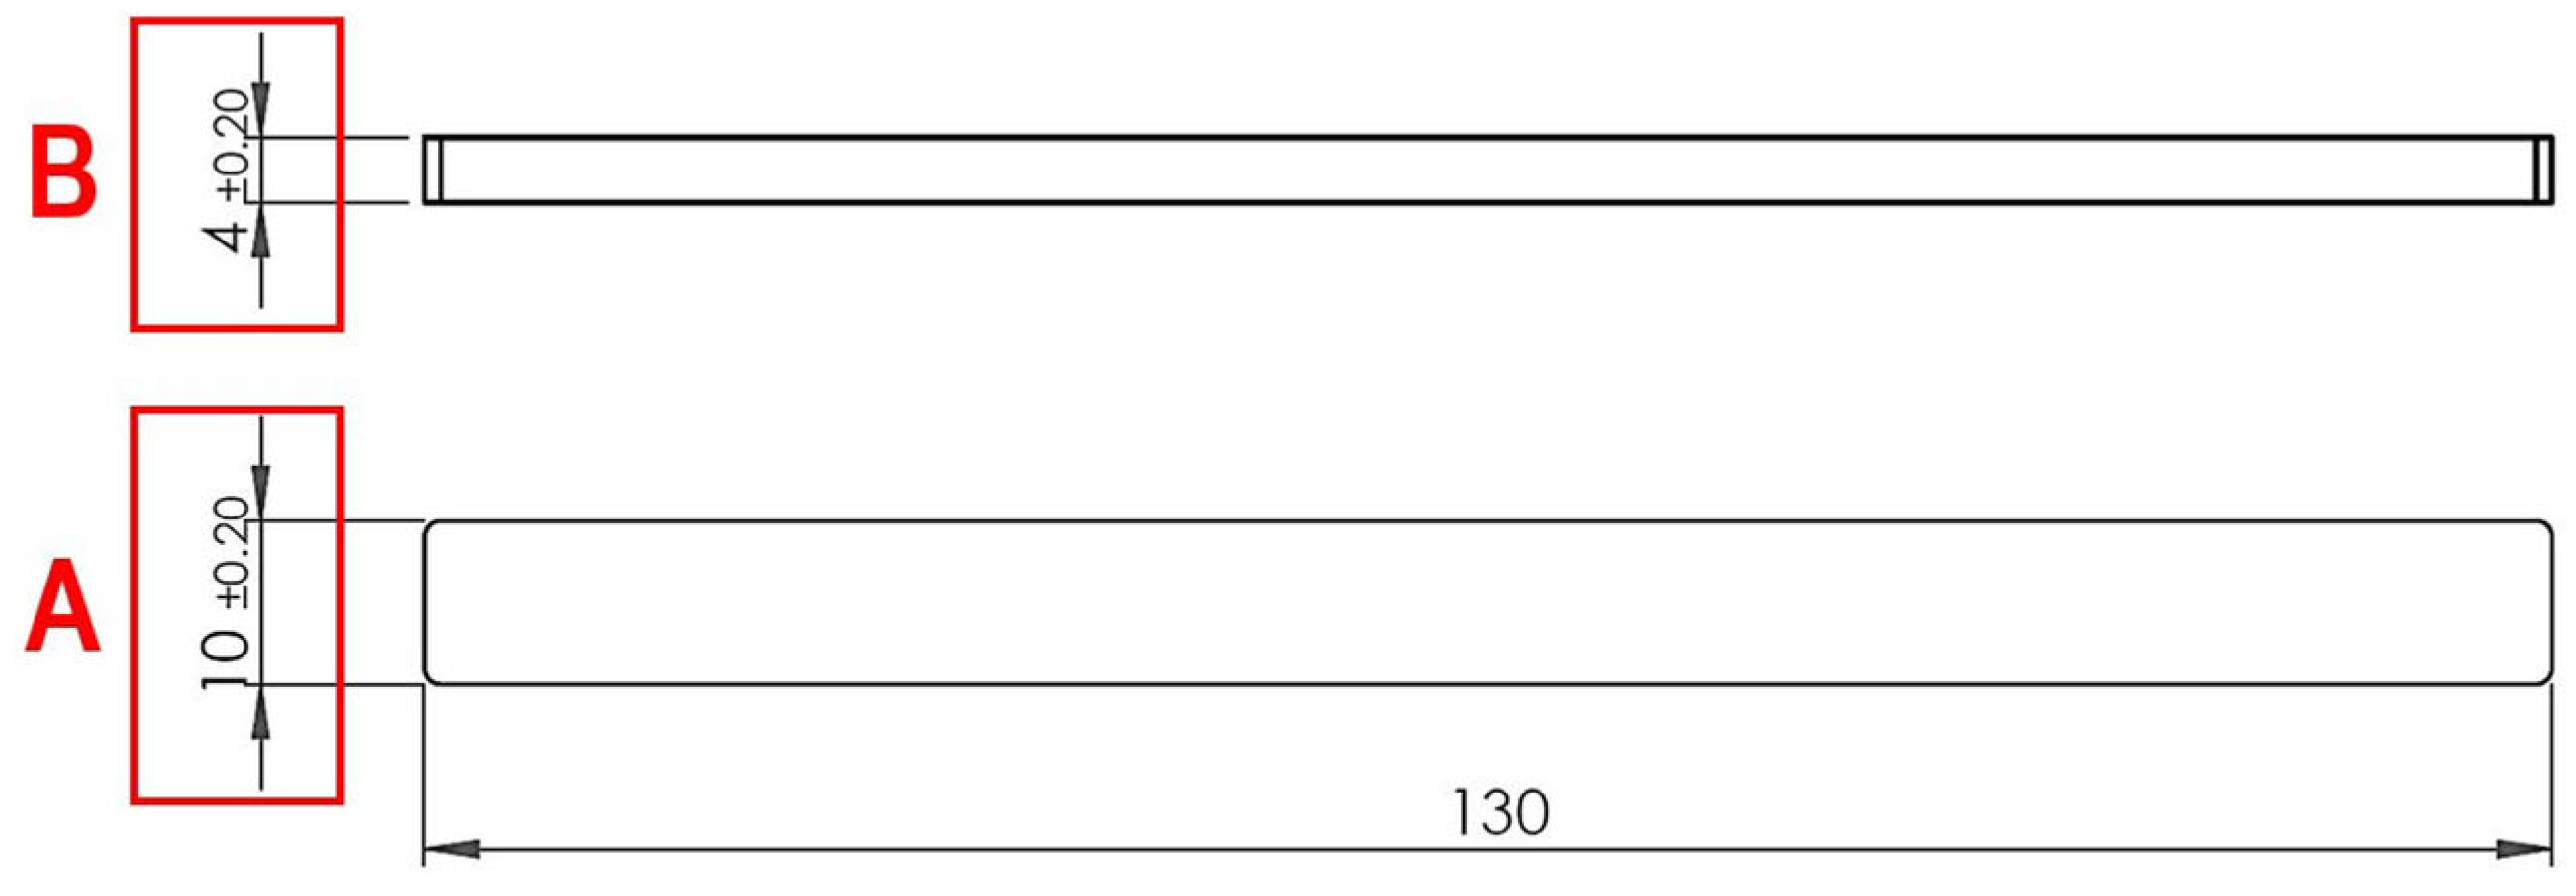
The dimensional stability of the dog-bone and rectangular bar (Figure 15 and Figure 16) samples is summarized in Table 3, as are the Pp and Ppk indices presented in Table 4. The figures show the characteristic dimensions for the specific dimension measurement scatter plot.
According to standard process capability criteria, a process is considered acceptable when both the Process Performance Index (Pp) and the Process Performance Capability Index (Ppk) are at least 1.33. Values exceeding 1.67 are typically regarded as excellent, indicating that the process is not only capable of consistently producing parts within specification limits but is also well-centered [33]. In the case of the investigated samples, which feature relatively simple geometries, the Process Performance Indices were found to exceed 2.0. This demonstrates a highly capable and stable process, significantly surpassing the threshold for excellence (Table 4).
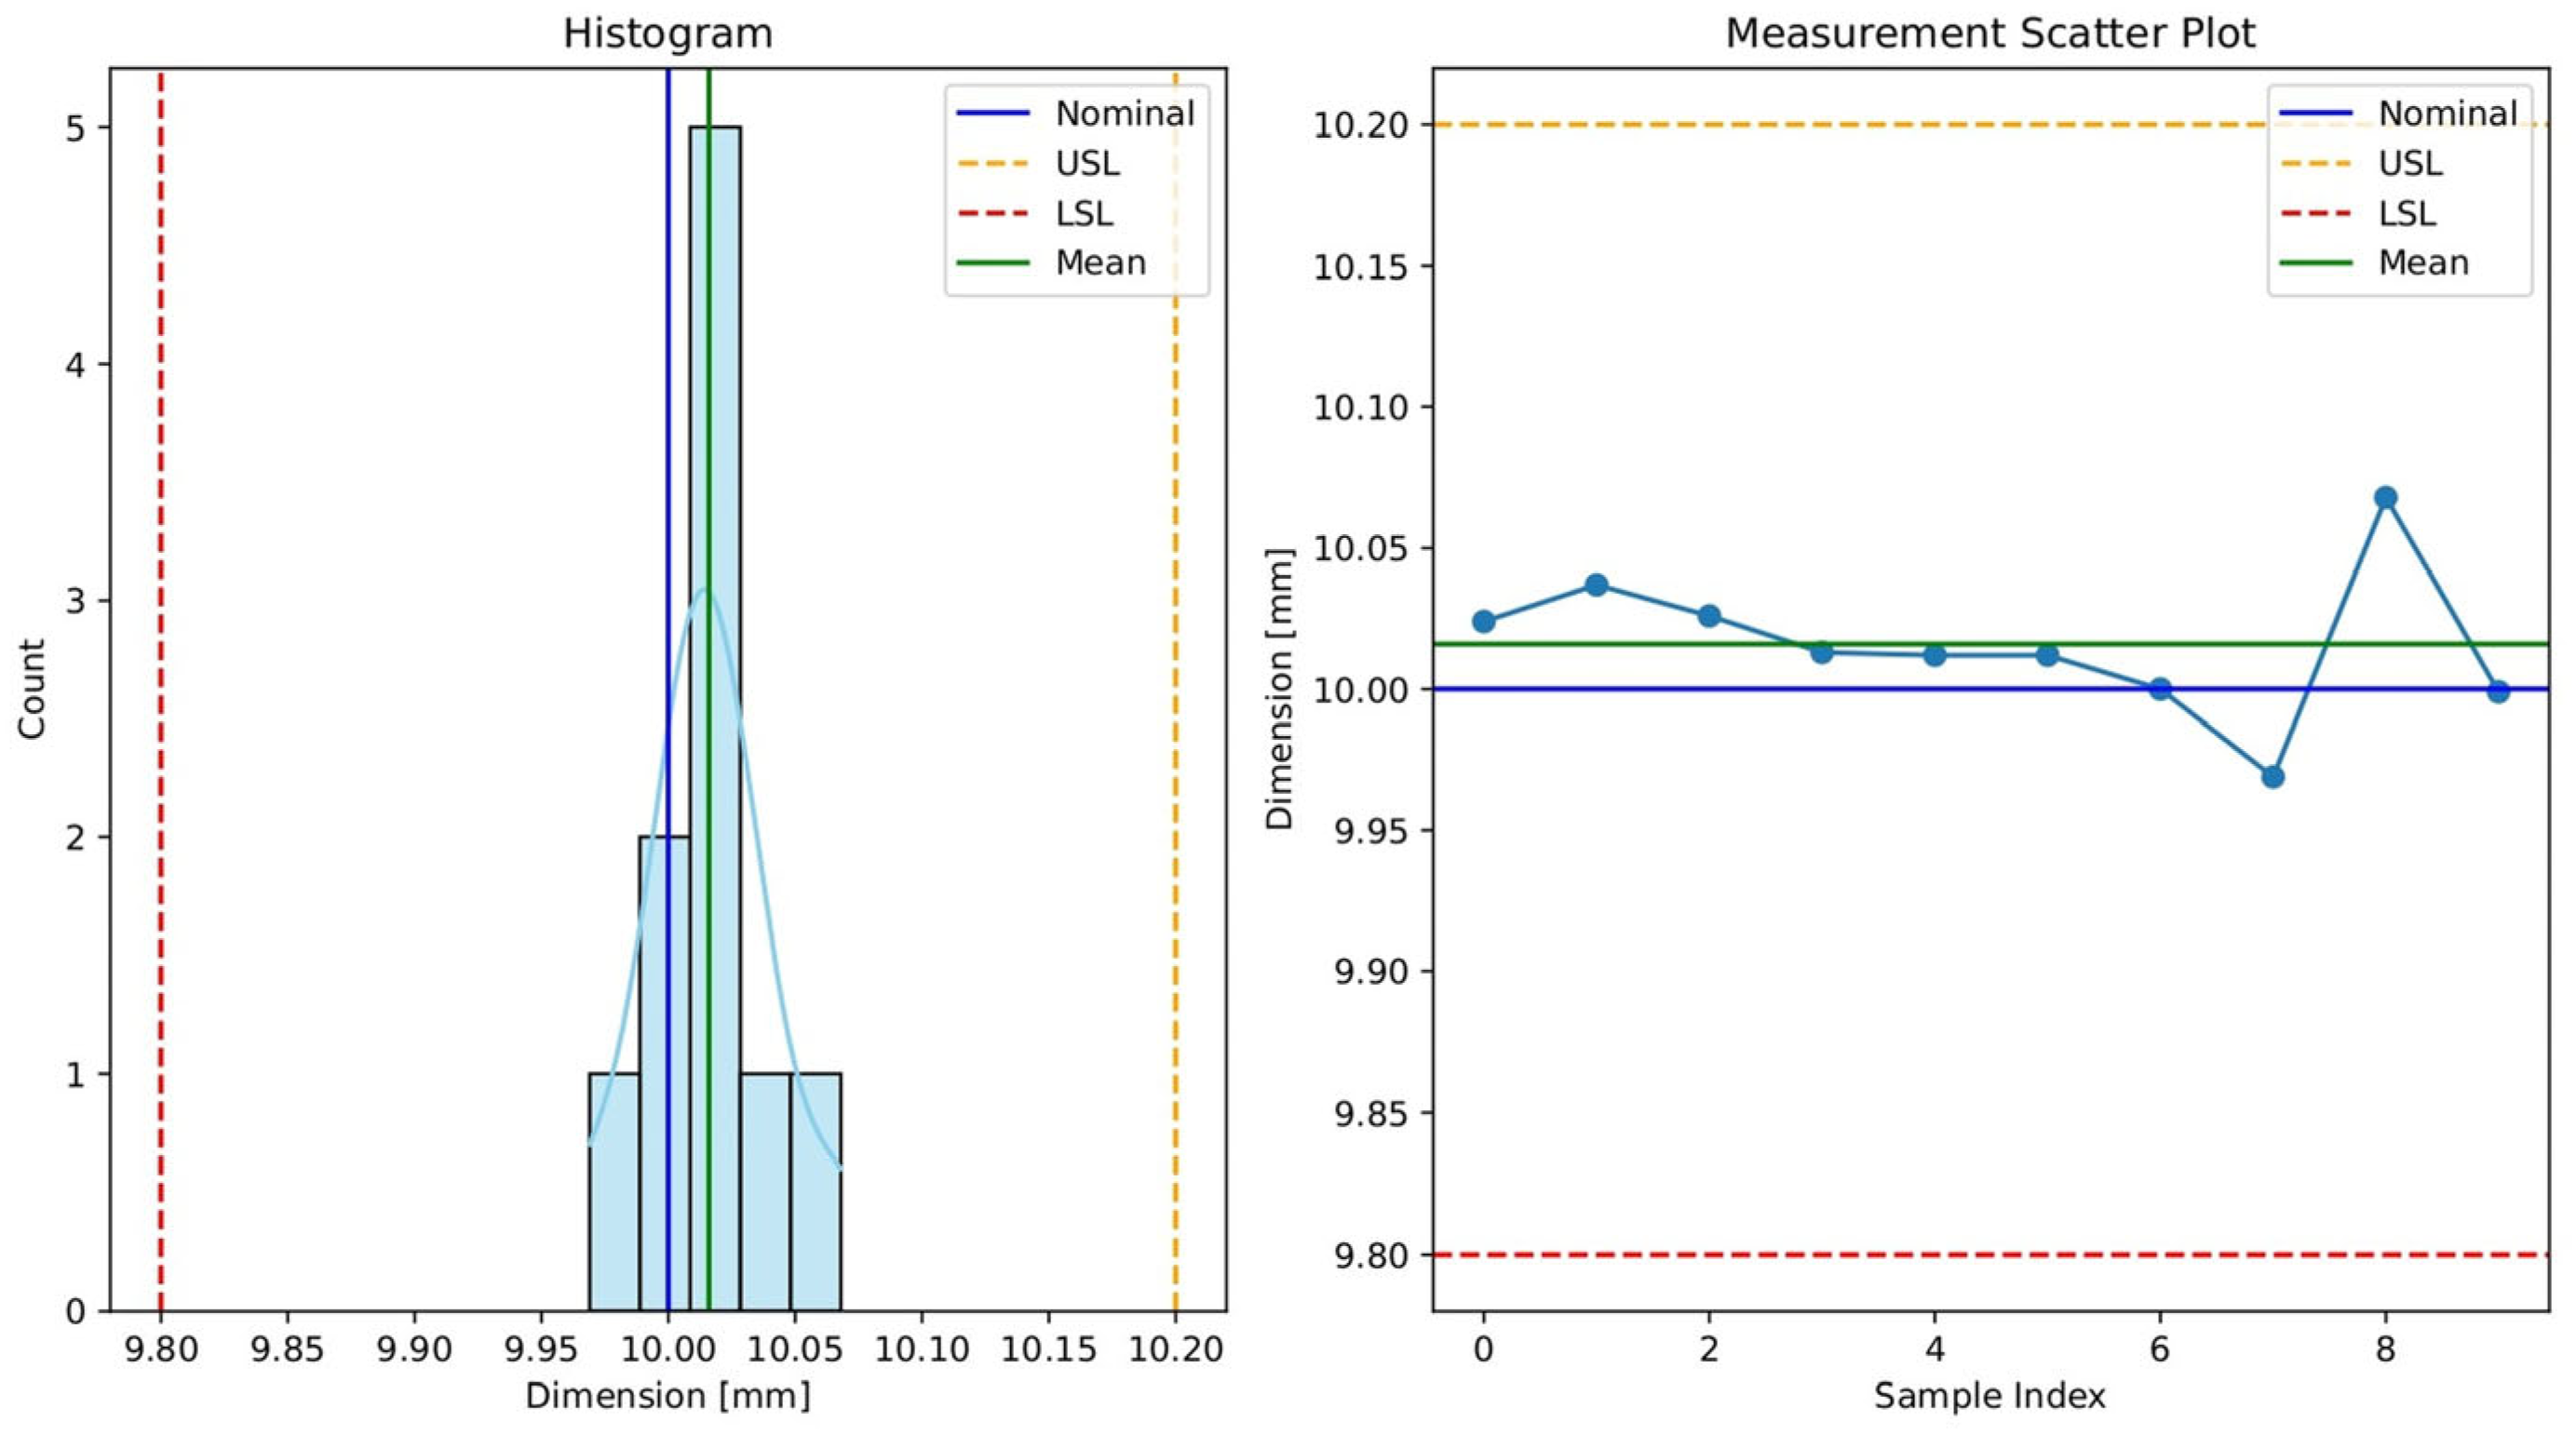
Statistical Process Control (SPC) charts, including histograms and scatter plots, were utilized to evaluate process stability and variation. Representative data for Dimension A of a rectangular specimen are illustrated in Figure 17.

3.3. Impact Strength

The impact strength of polymeric materials is a critical parameter, particularly in applications involving mechanical loading and structural integrity. Glass fiber-reinforced polyamide exhibits high stiffness and dimensional stability, making it suitable for the fabrication of load-bearing structural components. However, exposure to moisture or water can significantly influence the mechanical performance, physicochemical characteristics, and dimensional stability of polyamide-based composites [34]. In thermoplastic composites containing short fibers, damage initiation is predominantly attributed to two mechanisms: debonding at the fiber–matrix interface and the formation of microcracks within the polymer matrix [35,36]. The results presented in Table 5 indicate that the activation of the iQ Weight Control System positively influences the impact performance of both virgin and blended polyamide materials. For virgin material, iQ Weight Control System activation led to an increase in impact strength from 9.50 kJ/m2 to 10.78 kJ/m2, accompanied by an increase in peak load from 547.56 N to 584.24 N. Similarly, in the 50/50 virgin/regrind blend, activation of the iQ Weight Control System improved impact strength from 9.26 kJ/m2 to 9.73 kJ/m2. In contrast, the peak load increased slightly from 519.39 to 588.72 N.

3.4. Tensile Strength

To assess the mechanical behavior of the tested polyamide materials, both tensile strength (δm) and Young’s modulus (Et) were evaluated under four processing conditions: virgin material and 50% regrind blend, each with and without iQ Weight Control System activation (Table 6). For both material types, the virgin and regrind blend, a reduction in tensile strength and Young’s modulus was observed with the addition of regrind. This decline in tensile strength is likely attributable to the reduction in fiber length in the reprocessed material [3,37]. Specifically, when the iQ Weight Control System was deactivated, Et decreased from 8684 MPa for virgin material to 4982 MPa for blended material, representing a 43% reduction. In contrast, with the system activated, the reduction was significantly lower, at only 18%. A similar trend was observed for tensile strength—without system activation, the strength decreased by 6.3%, whereas with the system activated, the reduction was limited to 3.2%. These findings suggest that the iQ Weight Control System plays a significant role in mitigating the negative effects of regrind on mechanical properties.

4. Discussion

Plastic recycling refers to the recovery and valorization of waste or post-consumer plastics through their reprocessing into products of equivalent value. From the perspective of industrial process safety and stability, primary recycling—also known as closed-loop recycling—is conducted using waste materials with a well-documented history. These reprocessed materials originate from within the production facility and have not exited the processing environment [38]. Polyamides, a class of thermoplastic polymers, typically melt within the range of 220–250 °C and are predominantly processed via injection molding and extrusion techniques [39]. Their chemical structure is characterized by the presence of amide groups, which engage in hydrogen bonding. This interaction reduces interchain mobility, thereby contributing to the high melting temperatures and mechanical strength of polyamides [40]. Given the extensive use of polyamide-based components in the construction and automotive sectors, the incorporation of recycled and post-industrial polyamide waste offers substantial environmental advantages [41]. Analysis of injection-molded products with various shapes, such as a square, a rectangular bar, and a dog-bone, allowed for full verification of the effectiveness of the tested system. The presented work highlights the benefits of utilizing adaptive process control systems to mitigate the negative influence of regrind incorporation into virgin material on mass and dimensional stability, as well as maintaining mechanical properties.

5. Conclusions

Injection molding is a highly complex manufacturing process used across nearly all industrial sectors. One of the key challenges in maintaining consistent product quality is the variation in material viscosity between different batches of raw material. In response to increasing demands for sustainable manufacturing, many facilities are incorporating regrind, post-production waste, or scrapped parts into the production cycle. However, the introduction of regrind significantly affects the viscosity of the polymer melt, complicating the process’s robustness. Concurrently, the industry is experiencing a notable decline in experienced personnel, further emphasizing the need for intelligent, automated process control strategies. This study evaluates the effectiveness of the iQ Weight Control System in enhancing the robustness of the injection molding process under varying material conditions. The system was tested with blends containing up to 50% regrind. Results demonstrated that, despite the viscosity reduction associated with regrind, the system successfully maintained a consistent shot weight, thereby stabilizing the amount of material injected into the mold cavity. When the iQ Weight Control System was deactivated, spiral flow length increased proportionally with regrind content—by 1.38% for a 50% regrind blend and by 2.98% for 100% regrind. With the system activated, these increases were significantly reduced to 0.12% and 0.31%, respectively. Moreover, the results indicate that activation of the iQ Weight Control System positively influences the impact strength of both virgin and blended polyamide materials. These findings are promising; they are based on standardized test specimens. Further research is necessary to evaluate the system’s effectiveness on complex, real-world production parts and to explore its integration with broader AI and machine learning strategies in injection molding.

Author Contributions

Conceptualization, D.M. and T.O.; methodology, D.M. and T.O.; validation, T.O. and M.J.; formal analysis, D.M.; investigation, D.M., T.O. and M.J.; resources, T.O. and M.J.; data curation, T.O. and M.J.; writing—original draft preparation, D.M. and T.O.; writing—review and editing, D.M.; visualization, T.O.; supervision, D.M.; project administration, D.M.; funding acquisition, D.M. All authors have read and agreed to the published version of the manuscript.

Funding

The research was financed under the Program of the Polish Ministry of Science and Higher Education “Applied Doctorate” realized in years 2023–2027 (Agreement no. DWD/7/0114/2023 dated on 24 November 2023).

Data Availability Statement

The original contributions presented in this study are included in the article. Further inquiries can be directed to the corresponding authors.

Conflicts of Interest

The authors declare no conflicts of interest.

References

  1. Czepiel, M.; Bańkosz, M.; Sobczak-Kupiec, A. Advanced Injection Molding Methods: Review. Materials 2023, 16, 5802. [Google Scholar] [CrossRef]
  2. Lebreton, L.; Andrady, A. Future Scenarios of Global Plastic Waste Generation and Disposal. Palgrave Commun. 2019, 5, 1–11. [Google Scholar] [CrossRef]
  3. Olszewski, T.; Matykiewicz, D.; Barczewski, M.; Andrzejewski, J. Efficient Use of Secondary Raw Material from the Production of Polyamide Construction Products. Processes 2024, 12, 1304. [Google Scholar] [CrossRef]
  4. Park, H.S.; Phuong, D.X.; Kumar, S. AI Based Injection Molding Process for Consistent Product Quality. Procedia Manuf. 2019, 28, 102–106. [Google Scholar] [CrossRef]
  5. Kulkarni, S. Robust Process Development and Scientific Molding; Carl Hanser Verlag GmbH & Co. KG: München, Germany, 2016. [Google Scholar]
  6. Schiller, G.F. A Practical Approach to Scientific Molding; Carl Hanser Verlag GmbH & Co. KG: München, Germany, 2018. [Google Scholar]
  7. MacKenzie, G. A Closer Look at Scientific Molding Theory. Available online: https://www.plasticstoday.com/injection-molding/a-closer-look-at-scientific-molding-theory (accessed on 5 July 2025).
  8. Catignani, U. Moving Beyond the Relative Viscosity Curv—Determining Optimum Plastic Flow Rates: Part 1. Available online: https://www.ptonline.com/articles/moving-beyond-the-relative-viscosity-curve-determining-optimum-plastic-flow-rates-part-1 (accessed on 5 July 2025).
  9. Gerlach, M. Critical Skill Shortage in Plastics Processing Industries Intensifies/Germany Needs Almost 500,000 Foreigners Per Year; Shortage of Working Migrants in Italy and Spain—Study/PIE Talks to Industry Experts. Available online: https://pieweb.plasteurope.com/Default.aspx?pageid=19990&docid=254890 (accessed on 5 July 2025).
  10. Hanna, K. Skills Gap Highlights Need for Training. Available online: https://www.plasticsmachinerymanufacturing.com/manufacturing/article/53073243/skills-gap-highlights-need-for-training (accessed on 5 July 2025).
  11. Bin Akhtar, Z. Artificial Intelligence (AI) within Manufacturing: An Investigative Exploration for Opportunities, Challenges, Future Directions. Metaverse 2024, 5, 2731. [Google Scholar] [CrossRef]
  12. Blume, E. Artificial Intelligence in the Plastics Industry: Sustainability Through Technology. Available online: https://www.k-online.com/en/media_news/k-mag/digitalisation/artificial-intelligence/ai-plastics-industry-sustainability (accessed on 5 July 2025).
  13. Kavanaugh, C. Putting the Intelligence in AI for the Plastics Industry. Available online: https://www.plasticsnews.com/news/putting-intelligence-ai (accessed on 11 July 2024).
  14. Chen, J.C.; Kakati, A. Development of E-Dart-Based Artificial Neural Network for Multiple Quality Characteristic Online Defect Detection System in Injection Molding Processes. Int. J. Adv. Manuf. Technol. 2025, 136, 951–960. [Google Scholar] [CrossRef]
  15. Chen, Y.-S.; Wu, K.-T.; Tsai, M.-H.; Hwang, S.-J.; Lee, H.-H.; Peng, H.-S.; Chu, H.-Y. Adaptive Process Control of the Changeover Point for Injection Molding Process. J. Low Freq. Noise Vib. Act. Control 2021, 40, 383–394. [Google Scholar] [CrossRef]
  16. Su, C.-W.; Su, W.-J.; Cheng, F.-J.; Liou, G.-Y.; Hwang, S.-J.; Peng, H.-S.; Chu, H.-Y. Optimization Process Parameters and Adaptive Quality Monitoring Injection Molding Process for Materials with Different Viscosity. Polym. Test. 2022, 109, 107526. [Google Scholar] [CrossRef]
  17. Chen, J.-Y.; Zhuang, J.-X.; Huang, M.-S. Enhancing the Quality Stability of Injection Molded Parts by Adjusting V/P Switchover Point and Holding Pressure. Polymer 2021, 213, 123332. [Google Scholar] [CrossRef]
  18. Krantz, J.; Nieduzak, Z.; Licata, J.; O’Meara, S.; Gao, P.; Masato, D. In-mold Rheology and Automated Process Control for Injection Molding of Recycled Polypropylene. Polym. Eng. Sci. 2024, 64, 4112–4127. [Google Scholar] [CrossRef]
  19. Stable Injection Moulding Processes with IQ Weight Control. Available online: https://www.engelglobal.com/en/blog/stable-injection-moulding-processes-with-iq-weight-control (accessed on 5 July 2025).
  20. Schiffers, R.; Kruppa, S.; Moser, S. The Right Changeover Point for Each Shot. J. Kunststoffe 2014, 11, 26–29. [Google Scholar]
  21. Chang, C.H.; Ke, K.-C.; Huang, M.-S. Cross-Machine Predictions of the Quality of Injection-Molded Parts by Combining Machine Learning, Quality Indices, and a Transfer Model. Int. J. Adv. Manuf. Technol. 2024, 133, 4981–4998. [Google Scholar] [CrossRef]
  22. Kurt, M.; Saban Kamber, O.; Kaynak, Y.; Atakok, G.; Girit, O. Experimental Investigation of Plastic Injection Molding: Assessment of the Effects of Cavity Pressure and Mold Temperature on the Quality of the Final Products. Mater. Des. 2009, 30, 3217–3224. [Google Scholar] [CrossRef]
  23. de Souza, J.M.; de Holanda, G.M.; Henriques, H.A.; Furukawa, R.H. Modified Control Charts Monitoring Long-Term Semiconductor Manufacturing Processes; Springer International Publishing: Cham, The Switzerland, 2021; pp. 80–87. [Google Scholar]
  24. Weusten, J.; Hu, J. Predictive Ppk Calculations for Biologics and Vaccines Using a Bayesian Approach—A Tutorial. Pharm. Stat. 2025, 24, e2380. [Google Scholar] [CrossRef]
  25. Piñero, N. Estimating Process Capability Indexes through Random Samples in CVG-Bauxilum. In Proceedings of the Technical Sessions Presented by the TMS Aluminum Committee at the TMS 2009 Annual Meeting & Exhibition, San Francisco, CA, USA, 15–19 February 2009; pp. 145–149. [Google Scholar]
  26. Lynch, D.P. Setting the Record Straight with Capability Indices. SAE Int. 2004, 1, 1747. [Google Scholar]
  27. Zaneldin, E.; Ahmed, W.; Mansour, A.; Hassan, A. El Dimensional Stability of 3D Printed Objects Made from Plastic Waste Using FDM: Potential Construction Applications. Buildings 2021, 11, 516. [Google Scholar] [CrossRef]
  28. Senvar, O.; Sennaroglu, B. Comparing Performances of Clements, Box-Cox, Johnson Methods with Weibull Distributions for Assessing Process Capability. J. Ind. Eng. Manag. 2016, 9, 634–656. [Google Scholar] [CrossRef]
  29. Ozkaya, B.Y.; Testik, M.C. On the Expected Parts per Million Nonconforming Levels Obtained from Estimated Process Capability Indices. Qual. Reliab. Eng. Int. 2010, 26, 817–829. [Google Scholar] [CrossRef]
  30. Monter-Pozos, A.; González-Estrada, E. On Testing the Skew Normal Distribution by Using Shapiro–Wilk Test. J. Comput. Appl. Math. 2024, 440, 115649. [Google Scholar] [CrossRef]
  31. Jiang, B.; Zou, Y.; Liu, T.; Wu, W. Characterization of the Fluidity of the Ultrasonic Plasticized Polymer Melt by Spiral Flow Testing under Micro-Scale. Polymers 2019, 11, 357. [Google Scholar] [CrossRef]
  32. Rubin, I.I. Injection Molding of Thermoplastics. In SPI Plastics Engineering Handbook of the Society of the Plastics Industry, Inc.; Springer: Boston, MA, USA, 1991; pp. 133–178. [Google Scholar]
  33. Chaciński, T.; Jaskólski, P.; Pałubicki, M. Study of Process Stability in Injection Molding Based on Product Weight. J. Mech. Energy Eng. 2022, 6, 21–26. [Google Scholar] [CrossRef]
  34. Gijsman, P.; Meijers, G.; Vitarelli, G. Comparison of the UV-Degradation Chemistry of Polypropylene, Polyethylene, Polyamide 6 and Polybutylene Terephthalate. Polym. Degrad. Stab. 1999, 65, 433–441. [Google Scholar] [CrossRef]
  35. Pötschke, P.; Fornes, T.D.; Paul, D.R. Rheological Behavior of Multiwalled Carbon Nanotube/Polycarbonate Composites. Polymer 2002, 43, 3247–3255. [Google Scholar] [CrossRef]
  36. Arabeche, K.; Abdelmalek, F.; Delbreilh, L.; Zair, L.; Berrayah, A. Physical and Rheological Properties of Biodegradable Poly(Butylene Succinate)/Alfa Fiber Composites. J. Thermoplast. Compos. Mater. 2022, 35, 1709–1727. [Google Scholar] [CrossRef]
  37. Thomason, J.L. Structure–Property Relationships in Glass Reinforced Polyamide, Part 2: The Effects of Average Fiber Diameter and Diameter Distribution. Polym. Compos. 2007, 28, 331–343. [Google Scholar] [CrossRef]
  38. Fernandez, E.; Edeleva, M.; Fiorio, R.; Cardon, L.; D’hooge, D.R. Increasing the Sustainability of the Hybrid Mold Technique through Combined Insert Polymeric Material and Additive Manufacturing Method Design. Sustainability 2022, 14, 877. [Google Scholar] [CrossRef]
  39. Korkees, F.; Aldrees, A.; Barsoum, I.; Alshammari, D. Functionalised Graphene Effect on the Mechanical and Thermal Properties of Recycled PA6/PA6,6 Blends. J. Compos. Mater. 2021, 55, 2211–2224. [Google Scholar] [CrossRef]
  40. Chen, C.-W.; Ranganathan, P.; Mutharani, B.; Shiu, J.-W.; Rwei, S.-P.; Chang, Y.-H.; Chiu, F.-C. Synthesis of High-Value Bio-Based Polyamide 12,36 Microcellular Foams with Excellent Dimensional Stability and Shape Recovery Properties. Polymers 2024, 16, 159. [Google Scholar] [CrossRef]
  41. Yekymov, Y.; Lebedev, V.; Tykhomyrova, T.; Cherkashina, H.; Kariev, A. Design and Research of a Construction-Grade Engineering Plastic Based on Recycled Polyamides and Polyphthalamides. IOP Conf. Ser. Earth Environ. Sci. 2025, 1499, 012016. [Google Scholar] [CrossRef]
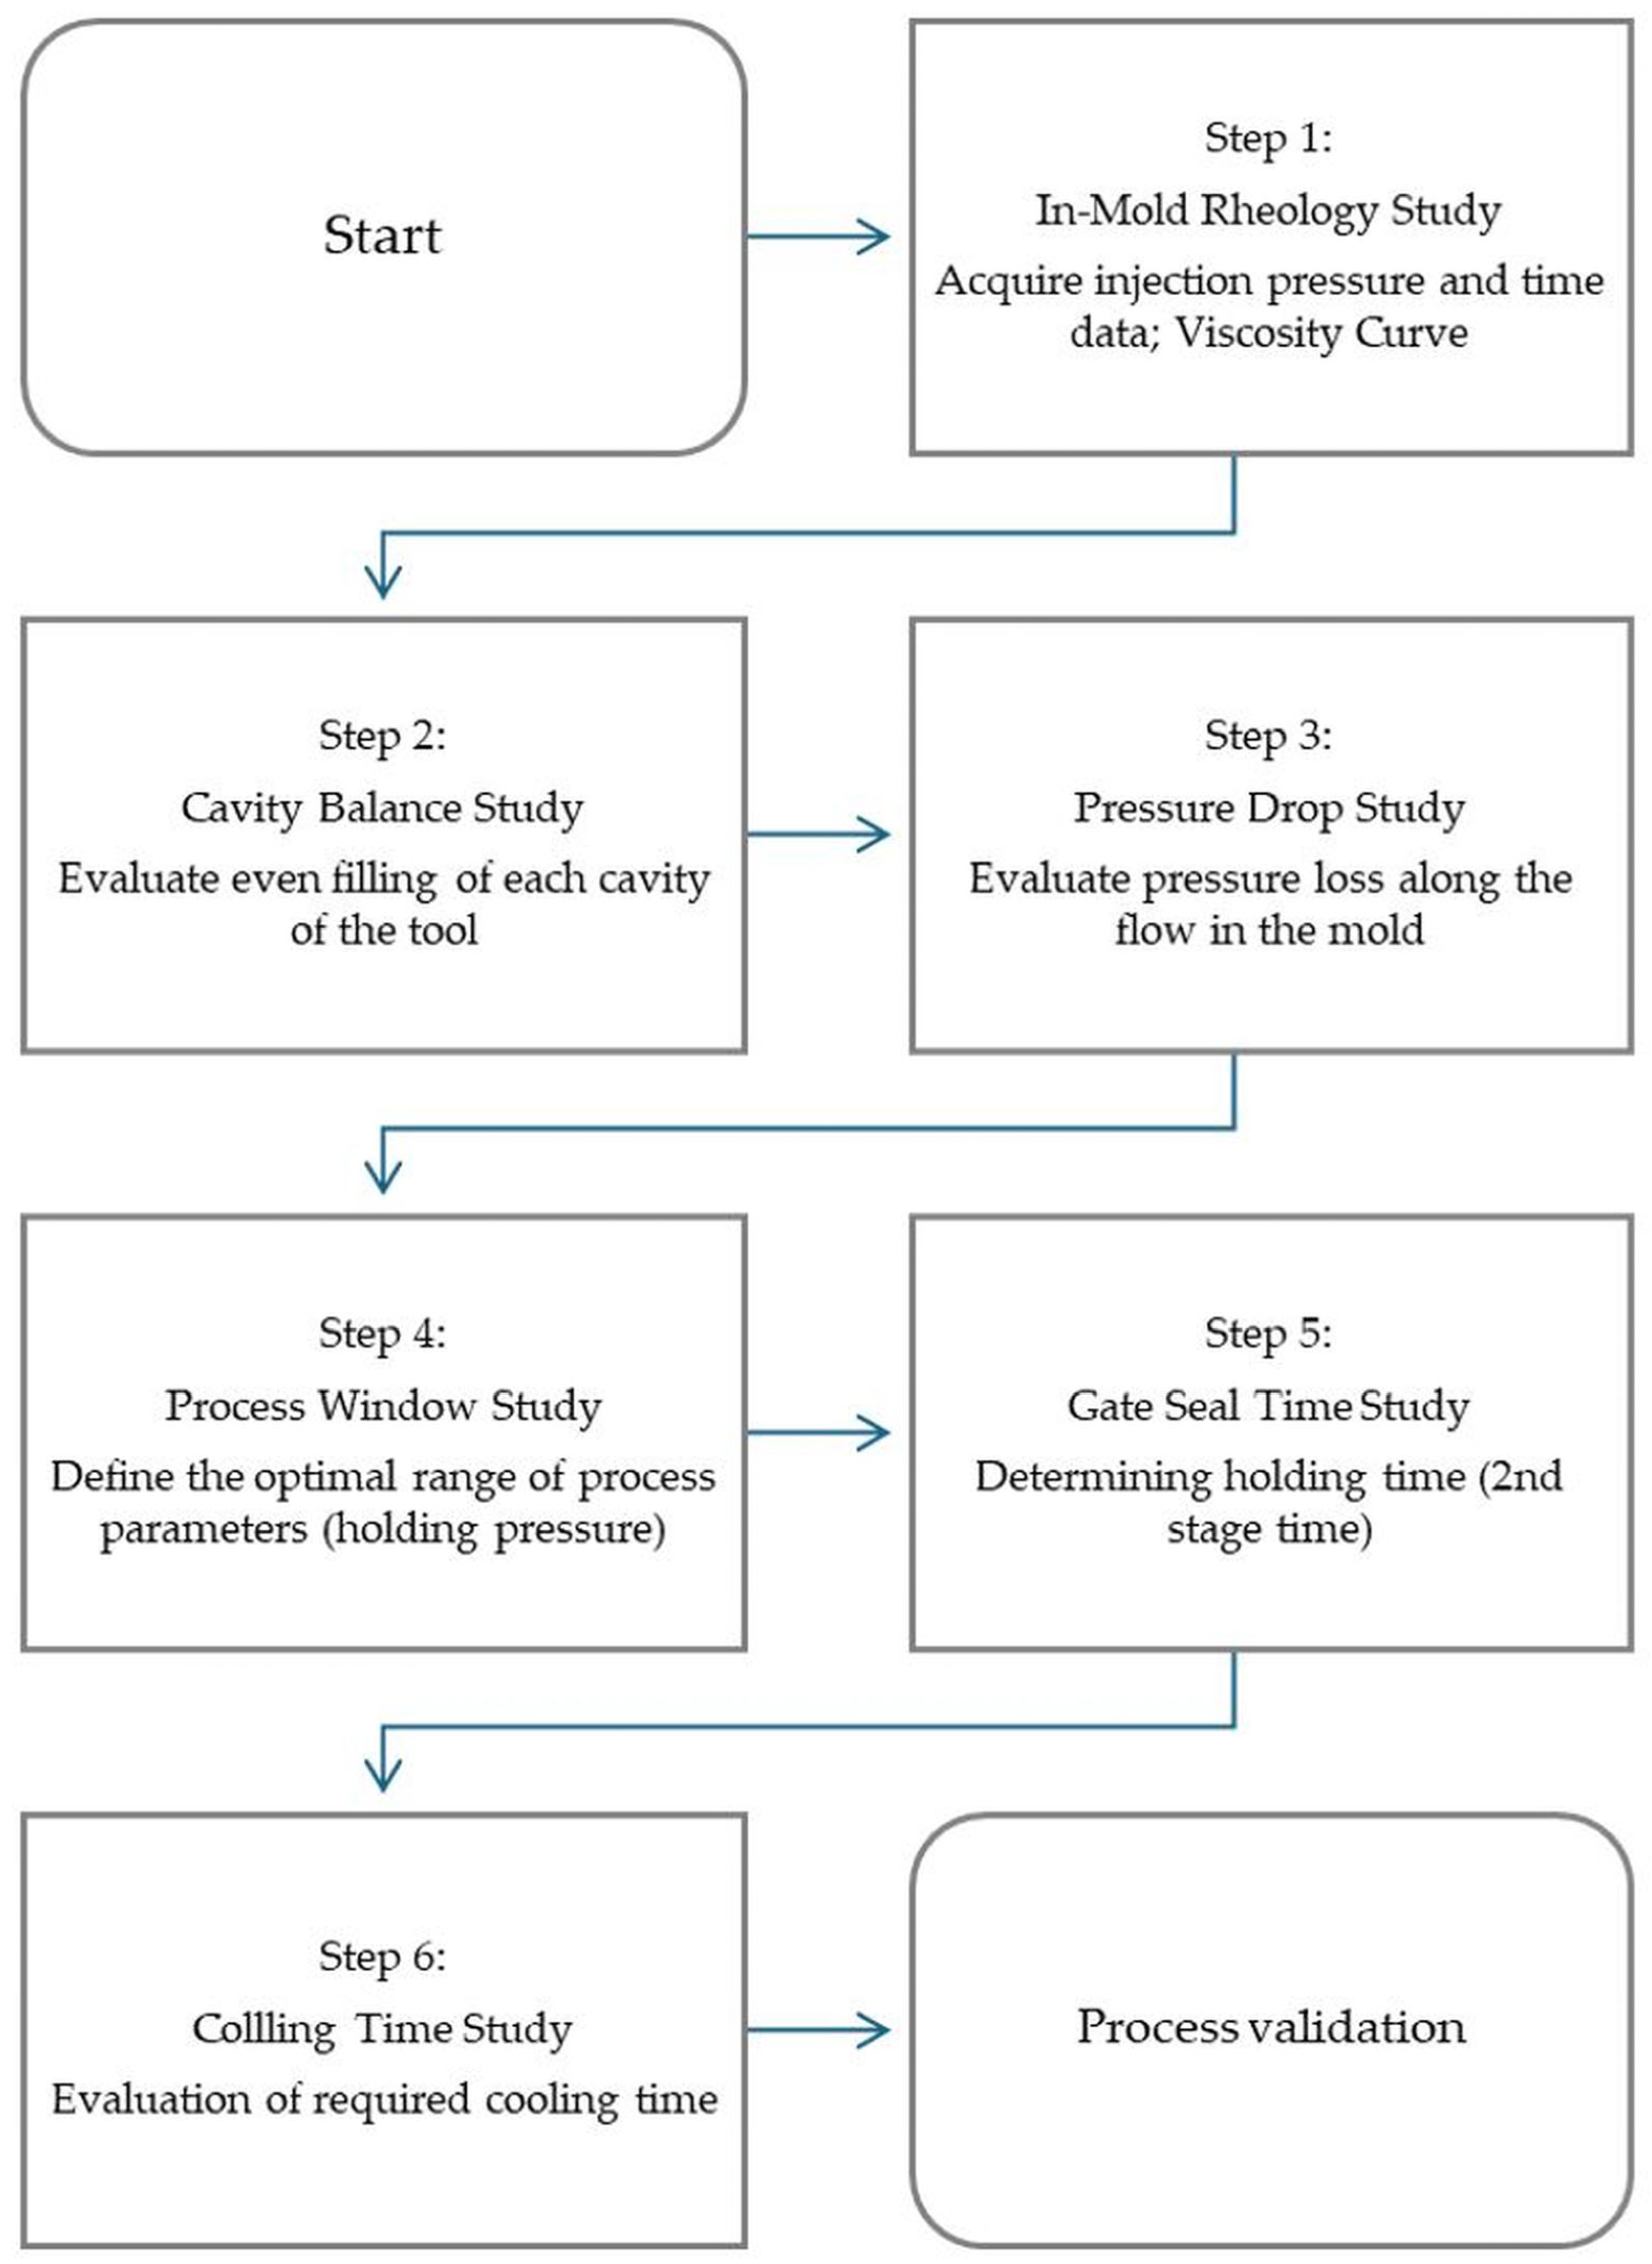
Figure 1. Six-step process development diagram.
Applsci 15 08829 g001
Figure 2. Specimens manufactured during the study (Scale 1:2) (from left to right: square, rectangular bar, dog-bone).
Applsci 15 08829 g002
Figure 3. Injection volume variation based on system activation status for a square specimen.
Applsci 15 08829 g003
Figure 4. Influence of material proportions on viscosity variability for a square specimen.
Applsci 15 08829 g004
Figure 5. Distribution of squared sample masses by material type and iQ Weight Control System activation status.
Applsci 15 08829 g005
Figure 6. Distribution of spiral specimen flow lengths by material type and iQ Weight Control System activation status.
Applsci 15 08829 g006
Figure 7. Distribution of spiral specimen masses by material type and iQ Weight Control System activation status.
Applsci 15 08829 g007
Figure 8. Influence of material proportions on viscosity variability.
Applsci 15 08829 g008
Figure 9. Effect of viscosity variations on injection stroke dynamics with and without the activation of the iQ Weight Control System.
Applsci 15 08829 g009
Figure 10. Effect of viscosity variations on cushion variation with and without the activation of the iQ Weight Control System.
Applsci 15 08829 g010
Figure 11. Effect of iQ Weight Control System activation on specific holding pressure.
Applsci 15 08829 g011
Figure 12. Spiral Specimen Length: Virgin material (Scale 1:2) (A)—iQ Weight Control System deactivated; (B)—iQ Weight Control System activated.
Applsci 15 08829 g012
Figure 13. Spiral Specimen Length: 50/50 blend (Scale 1:2) (A)—iQ Weight Control System deactivated; (B)—iQ Weight Control System activated.
Applsci 15 08829 g013
Figure 14. Spiral Specimen Length: 100% regrind (Scale 1:2) (A)—iQ Weight Control System; (B)—iQ Weight Control System activated.
Applsci 15 08829 g014
Figure 15. Measured dimensions of dog-bone specimen.
Applsci 15 08829 g015
Figure 16. Measured dimensions of rectangular bar specimen.
Applsci 15 08829 g016
Figure 17. Histogram and scatter plot for Dimension A of a rectangular specimen when the system is deactivated.
Applsci 15 08829 g017
Table 1. Weight of the square sample.
Weight [g]
MaterialiQ Weight Control System DeactivatediQ Weight Control System
Activated
Virgin Material61.576 ± 0.02461.507 ± 0.027
50% Regrind Blend62.585 ± 0.06761.320 ± 0.074
Table 2. Weight and dimensional stability of spiral samples.
MaterialMeasured
Parameter
iQ Weight Control System DeactivatediQ Weight Control
System Activated
Virgin
Material
Weight [g]18.83 ± 0.0118.82 ± 0.01
Flow Length [mm]48.65 ± 0.0448.66 ± 0.05
50%
Regrind Blend
Weight [g]19.07 ± 0.0318.85 ± 0.02
Flow Length [mm]49.32 ± 0.1448.72 ± 0.01
100%
Regrind
Weight [g]19.36 ± 0.0118.84 ± 0.04
Flowe Length [mm]50.10 ± 0.1648.81 ± 0.05
Table 3. Mean values and deviations of measurements of specimens.
iQ Weight Control DeactivatediQ Weight Control Activated
DimensionVirgin Material50% Virgin Material/50% Regrind BlendVirgin Material50% Virgin Material/50% Regrind Blend
Dog-bone SpecimenA20.0647 ± 0.008020.0437 ± 0.011120.0563 ± 0.020320.0314 ± 0.0236
B10.0532 ± 0.018510.0601 ± 0.022210.0399 ± 0.011910.0194 ± 0.0140
C4.0591 ± 0.00964.0464 ± 0.00854.0612 ± 0.00714.0348 ± 0.0085
Rectangular SpecimenA10.0158 ± 0.02599.9779 ± 0.01699.9654 ± 0.02079.9749 ± 0.0204
B4.0053 ± 0.01063.9989 ± 0.01193.9985 ± 0.01493.9962 ± 0.0081
Table 4. Process performance indicators for Dimension A for dog-bone and rectangular specimens.
iQ Weight Control System DeactivatediQ Weight Control System Activated
IndicatorVirgin Material50% Virgin Material/50% Regrind BlendVirgin Material50% Virgin Material/50% Regrind Blend
Dog-bone SpecimenPpA8.18616.09142.83863.313
PpkA5.52974.75132.38872.3754
Rectangular SpecimenPpA2.55993.95833.25023.2726
PpkA2.35513.52492.69122.8651
Table 5. Impact strength values of the tested materials.
Material/System Activation StatusFmax [N]ak [kJ/m2]
Virgin Material/iQ System Deactivated547.56 ± 38.439.50 ± 1.09
Virgin Material/iQ System Activated584.24 ± 33.7810.78 ± 1.43
50% Virgin Material/
50% Regrind Blend iQ/System Deactivated
519.39 ± 14.469.26 ± 0.74
50% Virgin Material/
50% Regrind Blend/iQ System Activated
588.72 ± 59.209.73 ± 1.08
Table 6. The tensile strength (δm) and Young’s modulus (Et) of the samples.
iQ Weight Control DeactivatediQ Weight Control Activated
ParameterVirgin
Material
50% Virgin Material/
50% Regrind
Virgin
Material
50% Virgin Material/
50% Regrind
Tensile Strength [MPa]197.8 ± 1.3185.4 ± 0.9194.6 ± 1.1188.4 ± 0.9
Young’s Modulus [MPa]8684 ± 7314982 ± 11103364 ± 9822750 ± 577
Disclaimer/Publisher’s Note: The statements, opinions and data contained in all publications are solely those of the individual author(s) and contributor(s) and not of MDPI and/or the editor(s). MDPI and/or the editor(s) disclaim responsibility for any injury to people or property resulting from any ideas, methods, instructions or products referred to in the content.