Article

Predicting Dike Piping Hazards Using Critical Slowing Down Theory on Electrical Signals

by
Tongtong Wang
,
Yuan Wang
and
Jie Ren
*
College of Water Conservancy and Hydropower Engineering, Hohai University, Nanjing 210098, China
*
Author to whom correspondence should be addressed.
Appl. Sci. 2025, 15(16), 8814; https://doi.org/10.3390/app15168814 (registering DOI)
Submission received: 29 June 2025 / Revised: 21 July 2025 / Accepted: 31 July 2025 / Published: 9 August 2025

Abstract

Early warning signals of critical transitions in the piping process are essential for predicting dike hazards. This study proposes a new approach that combines Critical Slowing Down (CSD) theory with electrical signals analysis to identify precursor characteristics during the evolution of piping in a dual-layer dike foundation. A laboratory experiment was conducted to simulate the piping process while monitoring electrical signals in real-time. Ensemble Empirical Mode Decomposition (EEMD) was employed to analyze the time-series characteristics of the electrical signals from multiple perspectives. The results demonstrate that low-frequency components effectively track the gradual development of piping, while high-frequency components are sensitive to abrupt transitions near the critical point of failure. Statistical analysis reveals that the variance of the low-frequency components increases suddenly 5.09 min before the formation of the piping outlet and 5.53 min before piping occurs, providing a clear early warning capability. In contrast, the variance of the high-frequency components increases suddenly only 0.26 min and 0.45 min in advance, offering a short-term warning. These sudden increases serve as the effective precursory characteristics of critical transitions in the piping process. These findings confirm the presence of CSD characteristics in electrical signals and establish variance-based indicators as reliable precursors for different stages of piping evolution. The proposed methodology offers both theoretical insight and practical guidance for enhancing early warning strategies for dike failure.

1. Introduction

Complex dynamical systems are widespread in nature, including ecosystems [1], climate systems [2], and seismic systems [3]. A broad class of dynamical systems undergoes critical transitions at a tipping point, where the system abruptly transforms from one stable state to a contrasting state. This sudden transition is generally substantial and catastrophic. This phenomenon is recognized as Critical Slowing Down (CSD) [4,5]. The phenomenon of critical slowing has significant potential for explaining mutation events and identifying precursor information before these events, which is essential for predicting catastrophic occurrences [6,7].
As a common failure mechanism observed in dike structures [8], piping hazards demonstrate significant dynamic and complex nonlinear characteristics across both spatial and temporal scales. As seepage pressure and hydraulic load increase, both pore water pressure and soil stress within the dike gradually build up. When these internal stresses approach a critical threshold, a sudden change occurs that may trigger piping hazards. The accumulation and release of pressure during the piping process can be viewed as two distinct states of the dike structure, displaying complex dynamic behavior and CSD characteristics. Piping damage not only triggers dike landslides and increased seepage but may also result in breaches, posing a significant threat to dike safety [9,10,11]. Therefore, based on CSD theory, identifying early warning signals during the piping process is crucial for the timely prediction of piping hazards and safeguarding dike integrity.
Electrical resistivity measurements have been widely used to monitor leakage in dikes [12,13]. In the context of piping detection, it serves two primary functions: identifying low-resistivity zones caused by abnormal seepage [14] and tracking the evolution of the soil pore structure due to internal erosion [15]. Shin et al. [16] conducted physical model experiments to monitor changes in resistivity during seepage in dike engineering. Their results showed that as water from upstream infiltrated the dike, the water saturation in the pipe gradually increased. Correspondingly, resistivity decreased from its initial high value to its lowest point at the time of dike failure. Moffat [17] employed a high-resolution resistivity monitoring system to investigate the resistivity response associated with internal soil erosion. Their study demonstrated that particle transport within the soil altered the pore structure, resulting in noticeable changes in resistivity. Although electrical signals can reflect changes in soil permeability and pore structure during the piping process, no study has yet applied CSD theory to analyze the signals in this context. Thus, investigating the phenomenon of CSD in electrical signals during piping evolution could provide a new method for early warning of dike piping hazards.
The force conditions of the dike project are more complex, and the piping process shows distinct dynamic change characteristics [18]. As a result, the unprocessed monitoring data collected from sensors may be affected by noise. The presence of noise can impact the effectiveness of the predictive model. Therefore, it is crucial to choose an appropriate denoising technique to eliminate noise from the measurement sequence [19]. To address this, techniques such as Singular Spectrum Analysis (SSA), Wavelet Analysis (WA), and Empirical Mode Decomposition (EMD) have been widely applied in hydraulic engineering [20,21,22]. However, these methods have several limitations. Specifically, WA can manage some level of nonlinearity and non-stationarity, but its effectiveness is limited by the need for predefined wavelet bases and its sensitivity to shifts and directionality [23]. SSA is generally more flexible than wavelet analysis, but it still encounters challenges with non-stationary signals due to its reliance on predefined component numbers and the stationarity assumptions in some variants [24]. Traditional EMD is sensitive to noise and often encounters mode mixing, which impacts the robustness and reliability of signal interpretation, especially in complex dynamic processes such as piping evolution. To address the challenges mentioned above, this study uses Ensemble Empirical Mode Decomposition (EEMD) to preprocess the electrical signals during the piping process. As an adaptive denoising technique, EEMD shows great potential in extracting both trend and detailed features from long-term, nonlinear, and non-stationary signals [25]. Effective data preprocessing is essential for identifying critical dynamic features in piping evolution. It establishes a reliable data foundation for early warning systems informed by CSD theory.
This study is the first to apply CSD theory to the statistical analysis of electrical signals during the piping process, aiming to reveal the precursors to piping failure in dual-layer dike foundations. While previous studies have monitored electrical signal changes to infer seepage behavior or internal erosion, they have not explored the underlying early warning dynamics using CSD indicators. A novel approach is introduced by combining the EEMD algorithm with statistical feature extraction techniques to effectively capture critical transitions during the piping process. Specifically, the piping process is simulated through physical model experiments, while electrical signals are collected in real-time. To reduce noise interference and enhance the accuracy of statistical analysis, the EEMD algorithm is employed to decompose electrical resistance sequences, along with Sample Entropy (SampEn) and Wavelet Denoising (WD) functions to identify and eliminate noise. Based on CSD theory, the reconstructed component sequences of the eliminated noise are analyzed to identify critical transition moments during the piping process. The results reveal effective precursory characteristics closely associated with the formation of the piping outlet and the occurrence of piping, demonstrating the potential of the proposed method for early warning of piping hazards in dike foundations.

2. Materials and Methods

To explore the CSD characteristics of electrical signals during the piping process, this study designed a series of controlled laboratory experiments. The objective was to simulate piping development in a dual-layer dike foundation under variable hydraulic loading and to monitor the real-time response of the electrical signals from the system. The experimental setup and signal processing methods are described below.

2.1. Experimental Study

The experimental study was conducted using a sandbox model specifically designed to replicate the hydraulic and structural characteristics of a dual-layer dike foundation. The goal was to simulate key stages of piping development under controlled conditions and to collect sensor data for analysis.

2.1.1. Design of Experimental Model

A sandbox is used to simulate the piping process of the dike foundation. The foundation of the dike is characterized by a dual-layer structure: the upper layer is clay, and the lower layer is fine sand. The sandbox device is a small-scale model measuring 500 mm in length, 10 mm in width, and 100 mm in height, as illustrated in Figure 1. Based on previous studies, it is evident that small-scale models effectively capture the essential features of internal erosion and piping [26,27]. The sample in the setup includes a 15 mm clay cover layer and an 85 mm sand layer. The setup is enclosed with a transparent cover that has a pre-set circular outlet simulating a weak point in the overlying clay layer. The exit has a diameter of 5 mm and is located 400 mm from the upstream inlet chamber. Nine fixed circular holes are arranged on one side of the setup for embedding resistance sensors. The specific locations of the sensors are R1 to R9, as shown in Figure 1b.
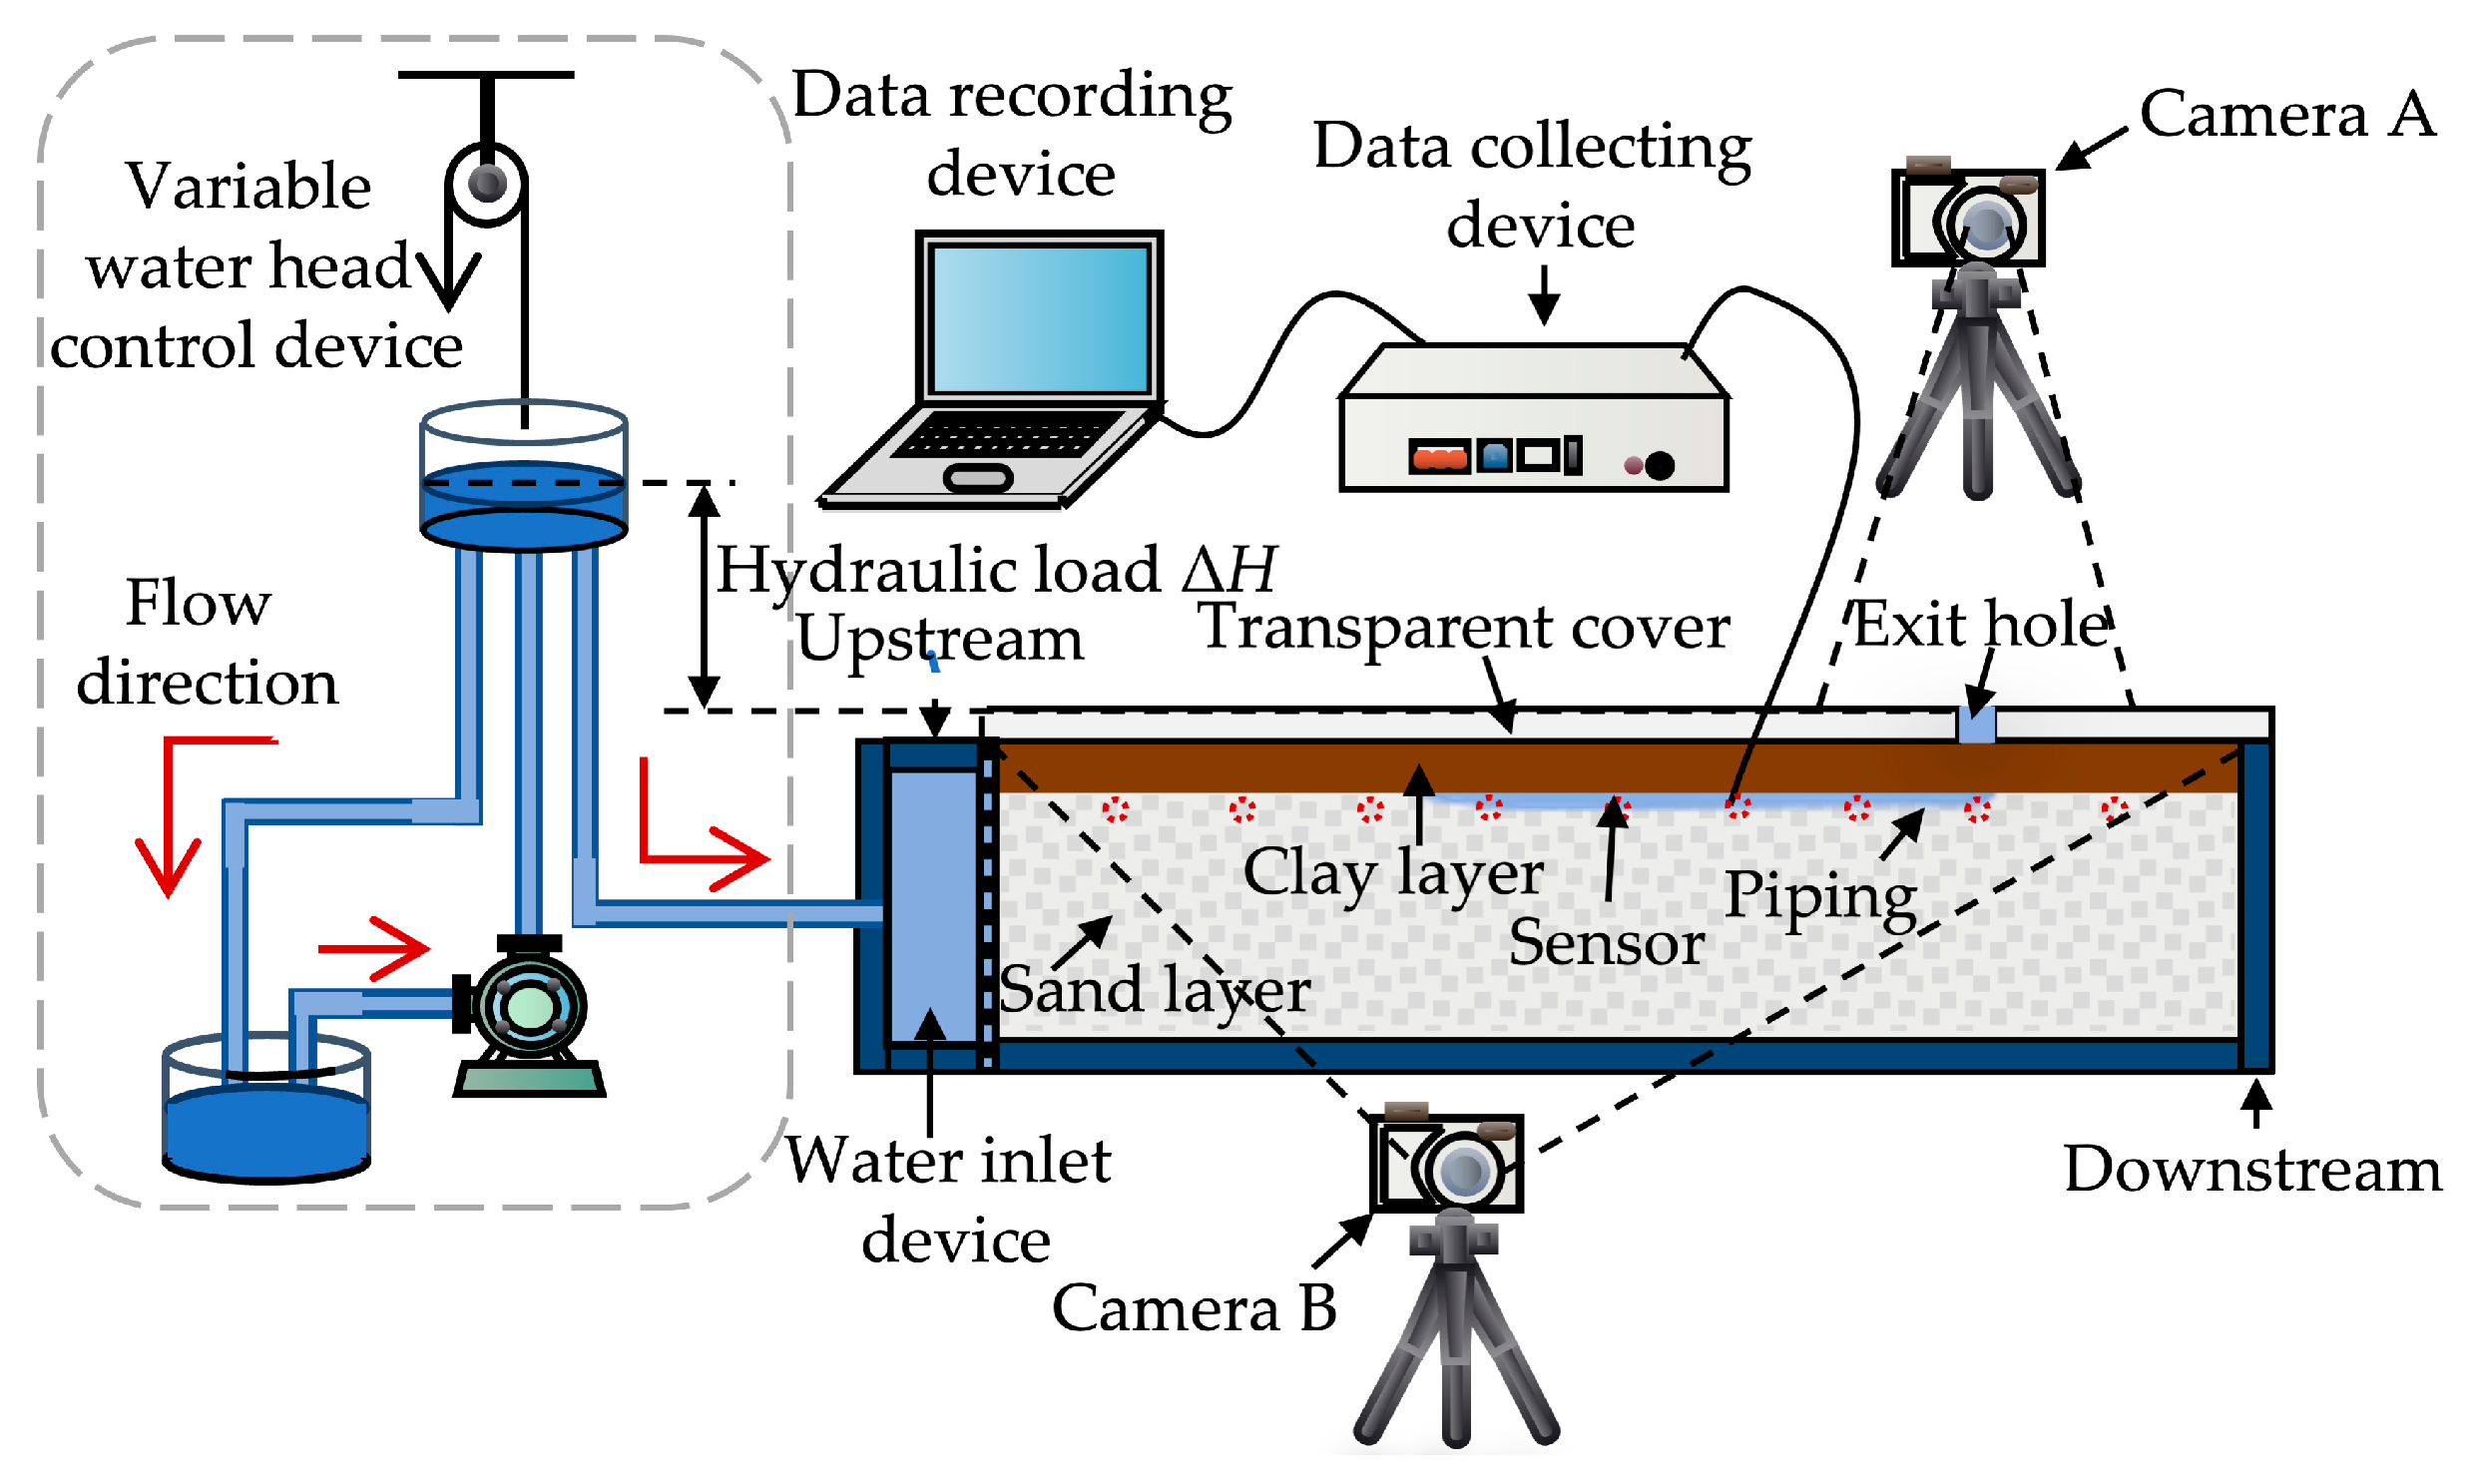
As shown in Figure 2, during the experiment, a variable head control system applies hydraulic head. Cameras record the process, with camera A capturing phenomenological changes at the piping outlet and camera B capturing the formation and development of the pipe. Resistance sensors embedded in the model box are used to track changes in electrical signals during erosion. These sensors have a measurement range of 10 µΩ to 200 kΩ, an AC frequency of 10 Hz, an accuracy of 0.05%, and a sampling frequency of 1 Hz. The data acquisition and recording system performs continuous measurement, enabling real-time data collection throughout the experiment.

2.1.2. Materials

Before conducting the sandbox model experiment, particle analysis and permeability deformation tests are performed to determine the properties of the experimental materials. The test results indicate that the basic parameters of the clay sample are specific gravity (Gs) = 2.60, liquid limit (ωL) = 37.46, plastic limit (ωp) = 17.89, and plasticity index (Ip) = 19.57. Table 1 displays the distinctive characteristics of the sand sample.

2.2. Denoising Method

2.2.1. EEMD

EEMD is a powerful tool for analyzing nonlinear and non-stationary signals, as it extracts the multi-scale features of the signals through the introduction of white noise-assisted decomposition. The implementation steps of EEMD are as follows:
(1)
Add a noise sequence n k ( t ) with an amplitude of α to the original data sequence x ( t ) of various signals, resulting in a new sequence x k ( t ) , as shown in Equation (1).
x k ( t ) = x ( t ) + n k ( t )
(2)
Apply Empirical Mode Decomposition (EMD) to x k ( t ) in order to extract several intrinsic mode function (IMF) components at different time scales, along with a residual sequence r n ( t ) .
(3)
Repeat steps (1) and (2) N times, adding a distinct white noise sequence each time. This process generates N sets of IMF components and residual sequences, where the jth-order IMF of the ith set is denoted as IMFij, and the residual sequence of the ith set is denoted as r n i ( t ) , where iN.
(4)
Independently compute the average of the N sets of corresponding IMF components and residual sequences to derive the final EEMD decomposition result, as presented in Equation (2).
I M F j = 1 N i = 1 N I M F i j , r n = 1 N i = 1 N r n i
EEMD can decompose electrical signals into several IMF components and a residual component.

2.2.2. Grouping Calculation of IMF Components

To demonstrate the evolution of piping at multiple scales, significance testing is conducted on the IMF components to group the frequency components [28,29]. The procedure consists of the following steps: first, IMF1 is designated as indicator 1, IMF1 + IMF2 as indicator 2, and so forth, with the sum of the first i IMF components serving as indicator i. Next, the mean of each indicator is calculated. Finally, t-tests are conducted to determine whether the means of each indicator are significantly different from 0. The calculation proceeds as follows:
t = ( X i ¯ μ ) / σ i n 1
where X i ¯ is the mean of indicator i, σ i is the standard deviation of indicator i, and n is the sample size of indicator i. If X i ¯ of the IMF components is significantly different from 0 at indicator i, IMF1, IMF2, …, IMF(i−1) are categorized as higher frequency components, while IMFi, IMF(i + 1), …, IMFn are classified as lower frequency components.

2.2.3. Sample Entropy

To evaluate the complexity of the decomposed sequence, the Sample Entropy (SampEn) of each IMF component is computed to identify whether it contains noise. Sample entropy effectively measures the complexity of time series by quantifying the probability of new pattern occurrences in the data sequence [30]. A higher probability of new pattern occurrences signifies greater sequence complexity. Assuming the length of the measured sequence is N, the calculation procedure for sample entropy is as follows:
The measured sequence x ( i ) is represented as a set of vector sequences X i of dimension m.
i = [ x ( i ) , x ( i + 1 ) , . . . , x ( i + m 1 ) ]
where i = 1,2 , . . . , N m + 1
Compute the absolute values of the maximum differences between corresponding elements in two vector sequences X i and X j , and represented as D i , j :
D i , j = m a x k = 0,1 , . . . , m 1 | x ( i + k ) x ( j + k ) |
For the vector sequences X i , count the number of times is less than the given similarity tolerance s, denote this count as C i . Then, calculate the ratio of C i and N m + 1 , and define the ratio as C i m s :
C i m s = 1 N m + 1 C i
Further, define C m s
C m s = 1 N m + 1 i = 1 N m + 1 C i m s
Increase the dimension of X i to m + 1 and repeat the above steps to compute C m + 1 s . The SampEn formula is as follows:
S a m p E n m , s , N = l n C m + 1 s C m s

2.2.4. Wavelet Denoising

The complexity of the piping evolution process, a multi-scale coupled phenomenon with uncertainties, leads to the possibility of noise contamination of the signal sequence monitored in real time. Wavelet Denoising (WD) is the process of decomposing and reconstructing the signal to reduce noise using wavelet transformation. The signal usually shows the low-frequency part or the part with relatively stable fluctuations, while the noise appears as the high-frequency part, which is uncertain. Therefore, based on separating high and low frequencies, the WD is used to reconstruct the attenuated high-frequency part, resulting in the denoised signal [31]. In this study, the WD method is used to process each IMF component requiring noise reduction, aiming to eliminate the noise concentrated in the high-frequency part.

2.3. Critical Slowing Down Theory

When a dynamic system transitions from the prior phase to the new phase state, it typically exhibits a range of fluctuation phenomena, such as increased amplitude, longer fluctuation periods, slower recovery from disturbances, and a reduced ability to return to its previous state. This phenomenon is known as critical slowing down. When a parameter within the system nears the CSD point, its variance and autocorrelation coefficient both increase [32,33].
Variance (sample variance) is a metric that quantifies the degree of deviation of data from the mean in a sample, as shown in Equation (9).
S 2 = 1 n i n x i x ¯ 2
where S 2 is the variance, x i is the i-th data, x ¯ is the mean.
The autocorrelation coefficient is a statistical metric that quantifies the correlation between different time points of the same variable, as shown in Equation (10).
a j = i = 1 n j x i x ¯ s x i + j x ¯ s
where j is the lag step of variable x i .
Assume the state variable has a forced disturbance within a time range t . During the perturbation process, the recovery rate is λ. The relationship between the variables approximates an exponential function, as given by Equation (11).
y n + 1 = e λ t y n + s ε n
where y n denotes the deviation of the system variable from the equilibrium state, and ε n is a normally distributed random variable. If λ is independent of y n , this process can be simplified to Equation (12).
y n + 1 = a y n + s ε n
where a is the autocorrelation coefficient, a = e λ t .
Analysis of Equation (12) with variance.
V a r y n + 1 = E y n 2 + E y n 2 = S 2 1 a 2
As the system approaches the critical point, the recovery rate induced by disturbances progressively slows down. The recovery rate λ tends to 0, the autocorrelation coefficient a tends to 1, and the variance tends to infinity.

3. Results

3.1. Analysis of Experimental Data for Piping

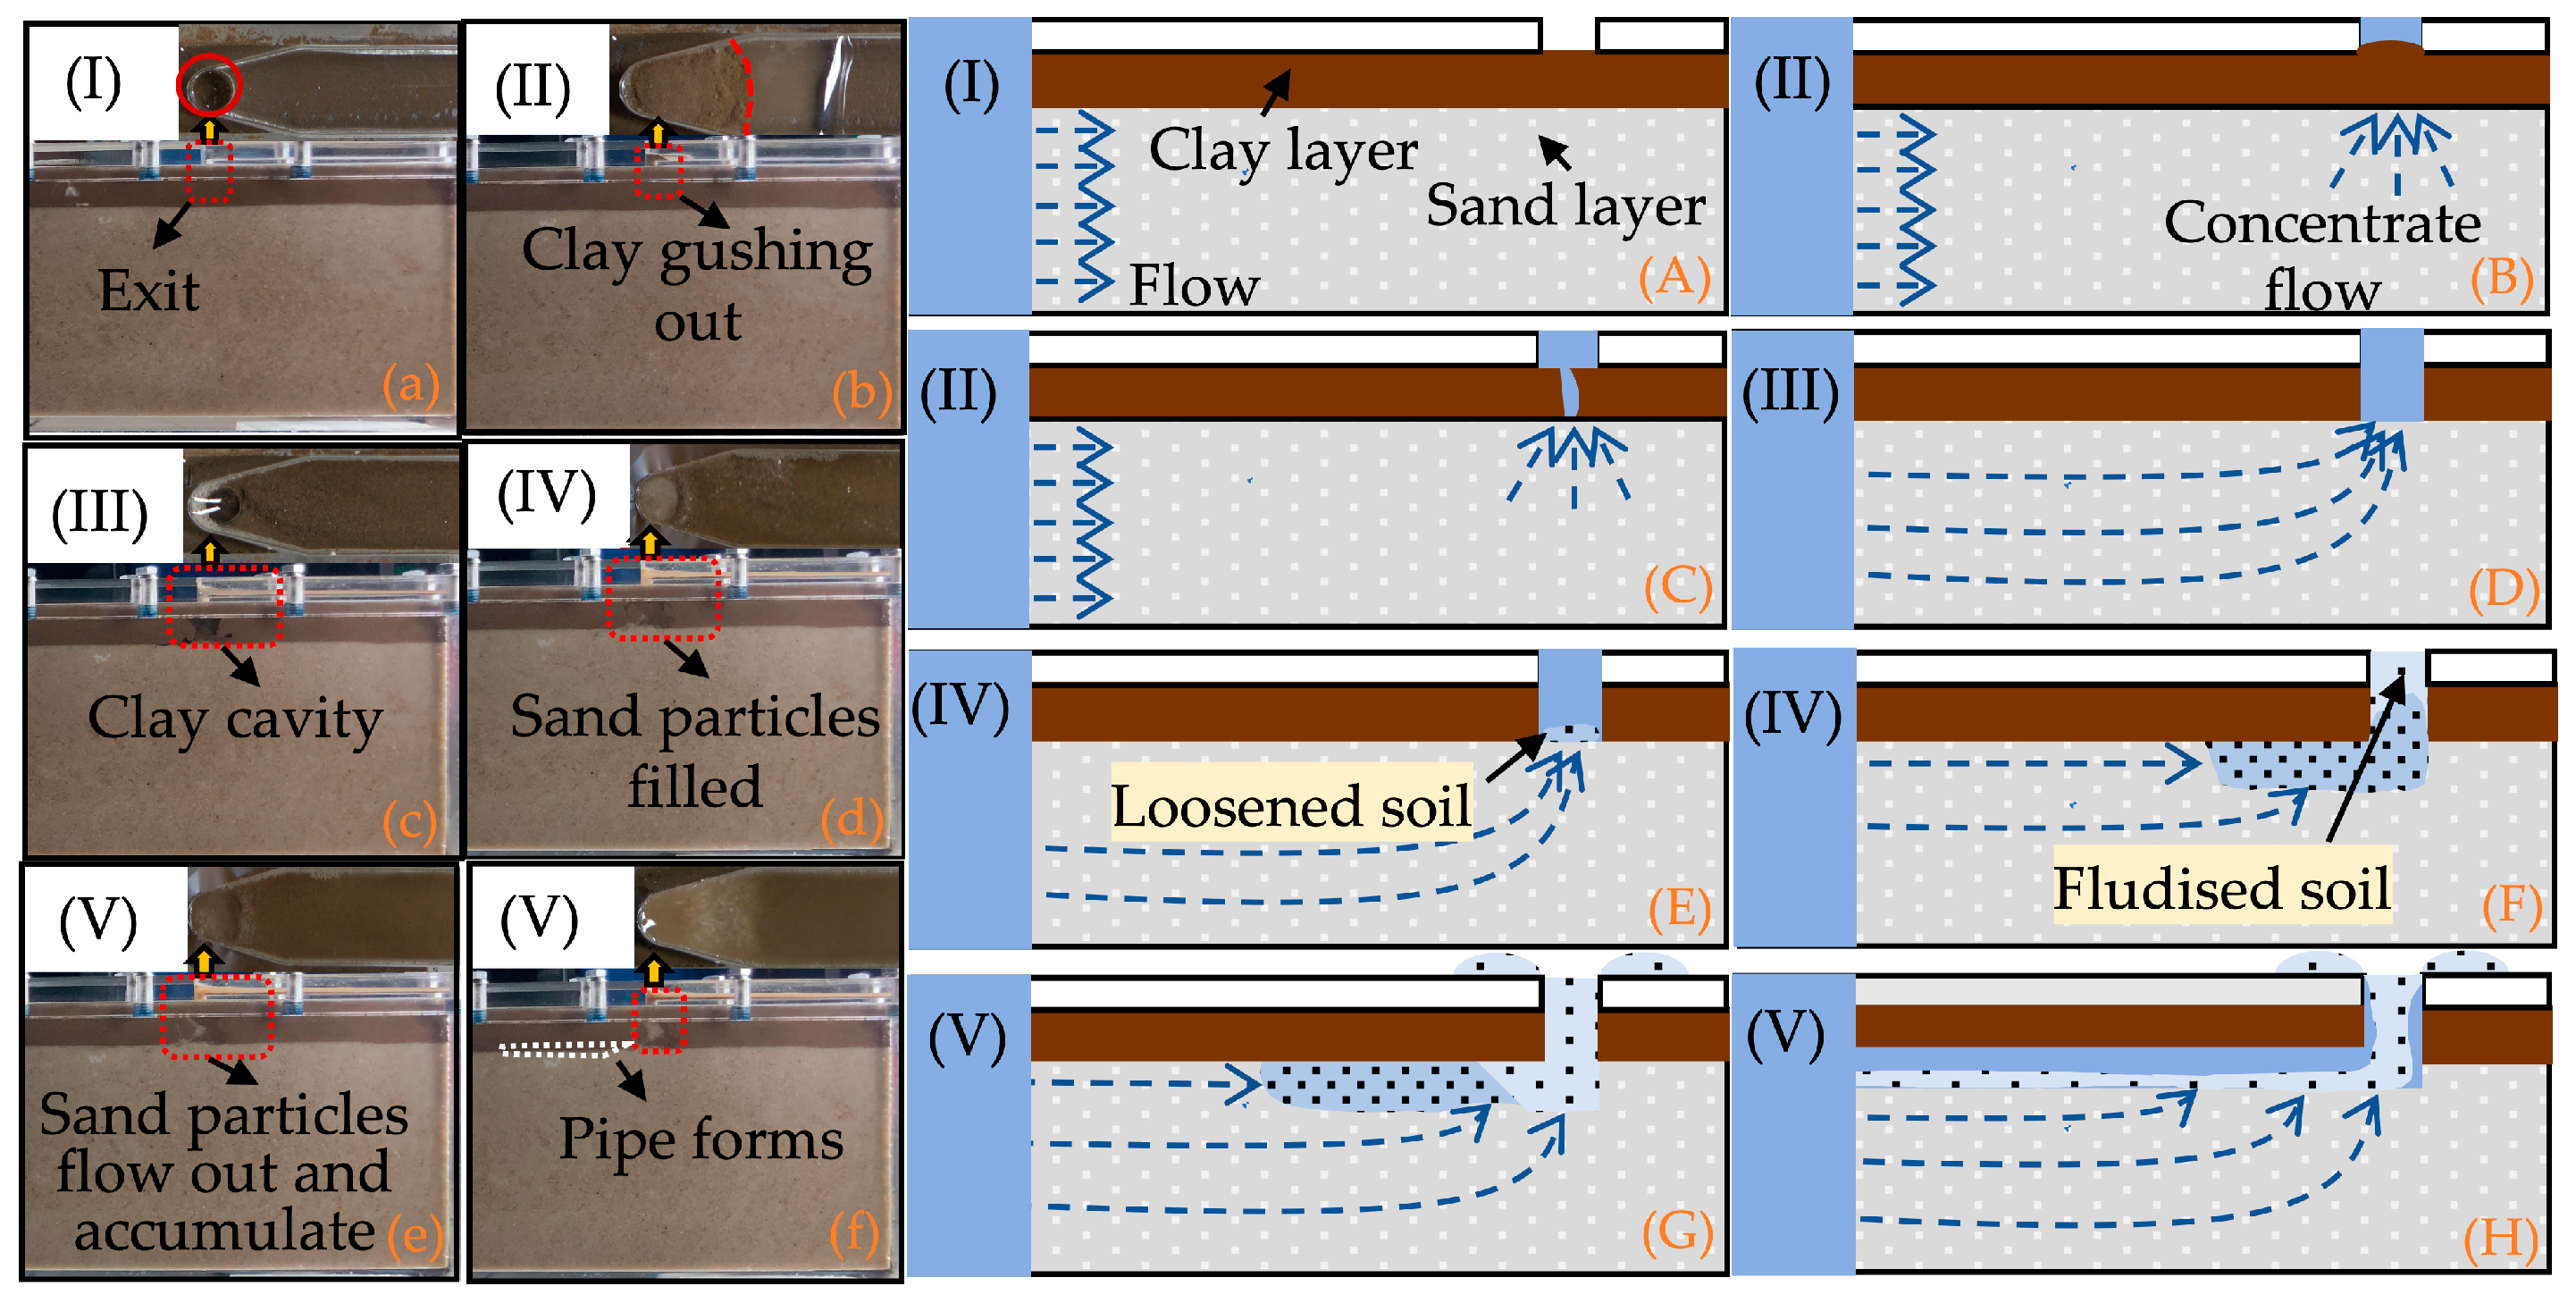
After conducting a detailed analysis of some sets of piping physical model experiments, this research observed some regular and similar phenomena during the development of the piping process. From the perspective of visual observation of the entire piping process, the phenomenon can be described through the following stages, as illustrated in Figure 3. The analysis is as follows: during the initial stable stage (I), no anomalies are observed. As the water level gradually rises, the clay layer at the exit experiences uplift, and turbid water slowly seeps out, marking the transition to the overlying clay layer rupture stage (II). When the hydraulic head exceeds the weight of the clay, the clay layer is punctured, causing slurry to erupt and form a piping outlet. The process then transitions into the seepage stage (III), where the clay near the outlet undergoes continuous erosion, forming a cavity within the clay. As the water level rises further, the sand layer near the piping outlet becomes loose, entering the initiation stage of piping (IV). In this stage, the sand particles gradually heave and fill the piping outlet. If the flow exceeds a critical rate, sand particles are transported and accumulate at the piping outlet, marking the onset of the piping stage (V). The erosion gradually progresses upstream, forming a piping channel at the interface between the clay and sand layers, eventually connecting with the upstream.
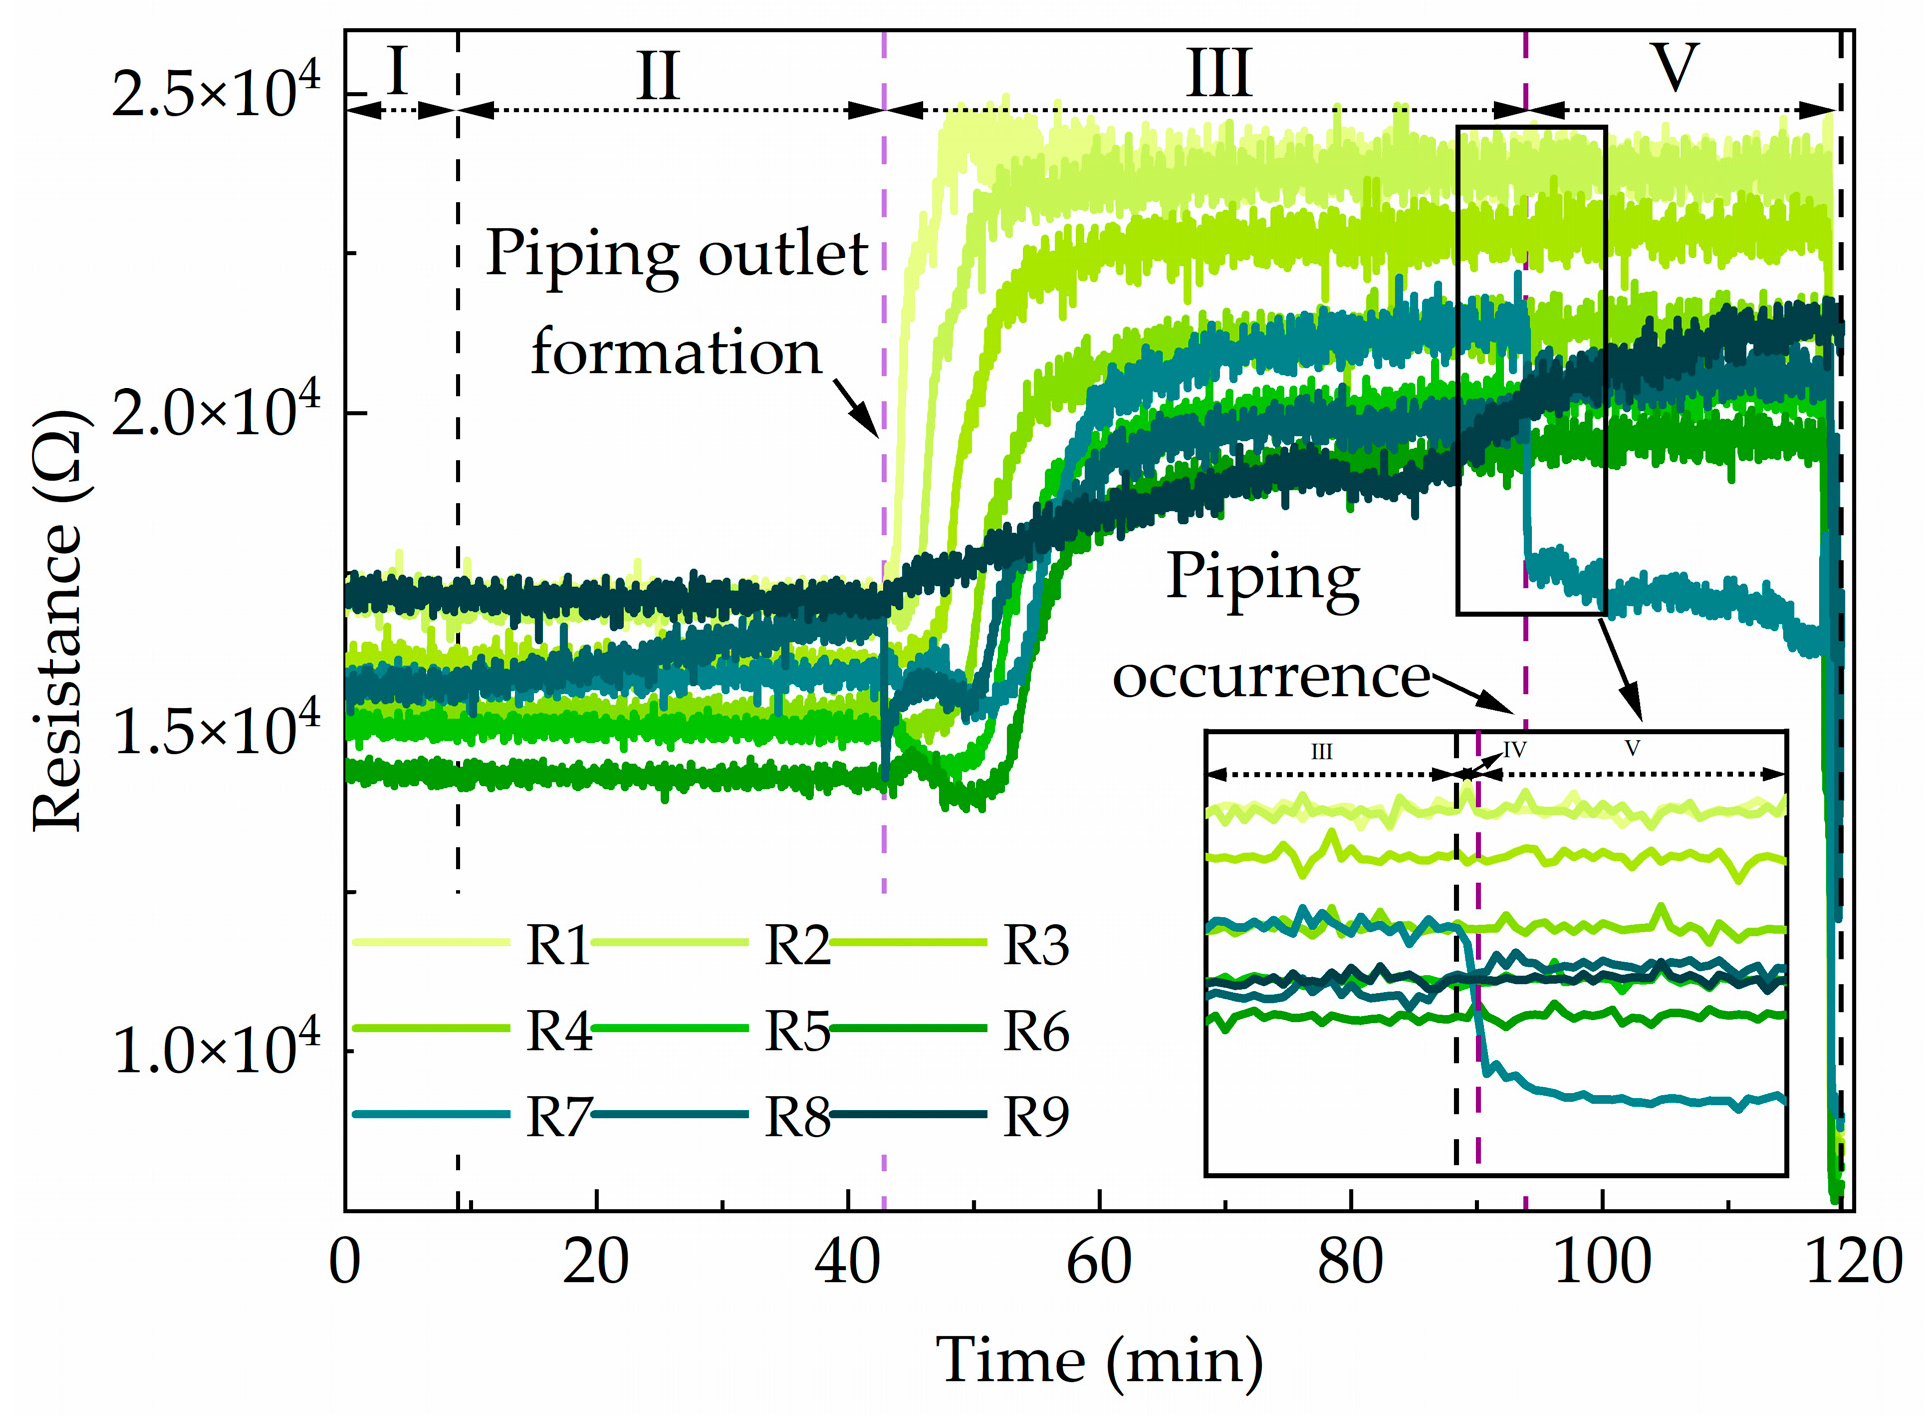
To ensure the operability of the experiments and the reliability of the results, this study conducted several groups of repeated experiments. To illustrate the electrical signal response characteristics of the piping process more clearly, a representative experiment is selected for detailed analysis. Figure 4 summarizes the changes in electrical signals during the piping process. The following provides a thorough analysis of the changes in resistance data based on the piping phenomenon. As shown by the curves, the electrical signals experience two distinct sudden changes during the piping process. The first sudden change occurs when the piping outlet forms (Stage II). At this point, the resistance at measurement point R8 decreases as the clay fully ruptures at the outlet. During the seepage stage (Stage III), the resistance at each measurement point increases sequentially. Subsequently, the electrical signals experience a second sudden change as they enter the piping initiation (Stage IV) and piping occurrence stage (Stage V). During these stages, the resistance at measurement point R8 increases, and the resistance at measurement point R7 decreases.

3.2. Decomposition and Reconstruction of Electrical Signal Sequences for Piping Processes

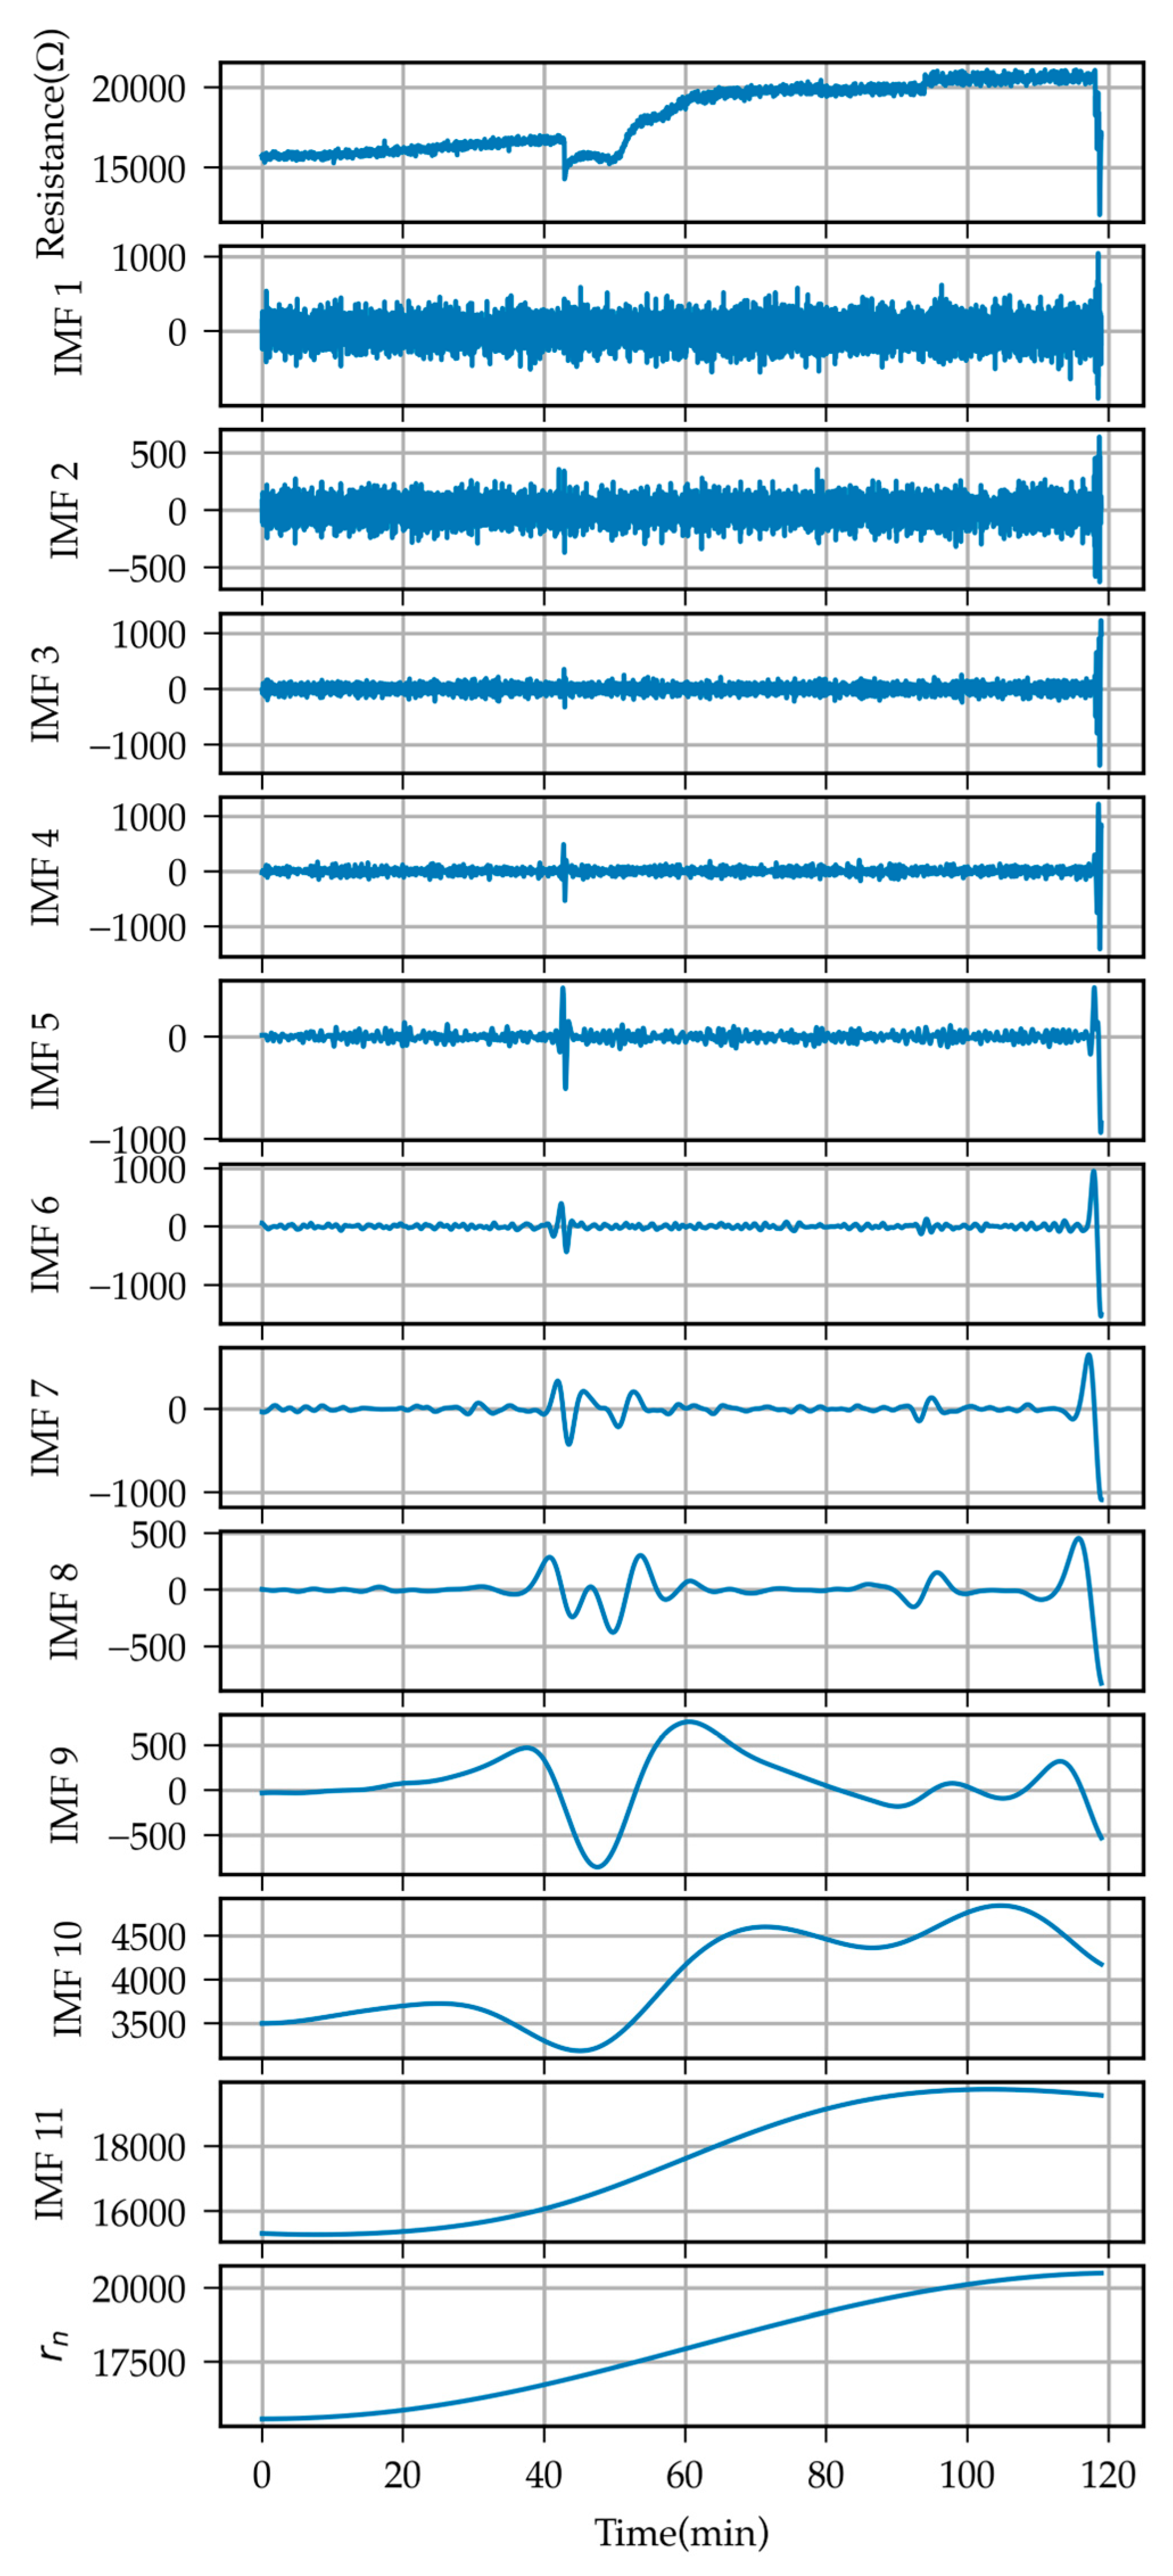
As shown in Figure 5, the electrical signals exhibit pronounced oscillatory characteristics. However, noise interference complicates the accurate extraction of detailed characteristics from the signal sequence. This limitation hinders the identification of critical transition moments in the piping process and significantly affects the reliability of identifying precursory characteristics related to piping hazards. Therefore, preprocessing the monitoring data is necessary. A representative dataset should be chosen for this purpose. Therefore, preprocessing the monitoring data is crucial. Based on the temporal and spatial response characteristics of electrical signals during the piping process, the time series from measurement point R8 is further examined to investigate the evolution of the piping process comprehensively.
Studies show that monitoring data frequently display significant non-stationary and nonlinear properties [34]. Similarly, the electrical signals during the piping process also display non-stationary and nonlinear characteristics. To better reveal the intrinsic structure and evolutionary patterns of these sequences, Ensemble Empirical Mode Decomposition (EEMD) is an effective method. The measured electrical signal sequence is decomposed into IMF components with different time scales using the EEMD algorithm. After the decomposition, 11 IMF components and 1 residual component are obtained, as shown in Figure 5. Each IMF component represents a specific feature of the original signal, arranged in order of decreasing frequency from top to bottom. This hierarchical arrangement helps visualize and understand the frequency characteristics, with high-frequency components at the top and low-frequency components at the bottom. The high-frequency components display random oscillations around a mean of zero, reflecting detailed variations in the original sequence. These fluctuations correspond to the critical time points of the original data curve, indicating abrupt changes during the piping process. In contrast, the low-frequency components capture the overall trend, clearly illustrating the staged characteristics of the piping evolution.
Equation (3) is used to calculate the IMF components, with the results shown in Table 2. IMF1 to IMF8 are high-frequency components, while IMF9 to IMF11 are low-frequency components.
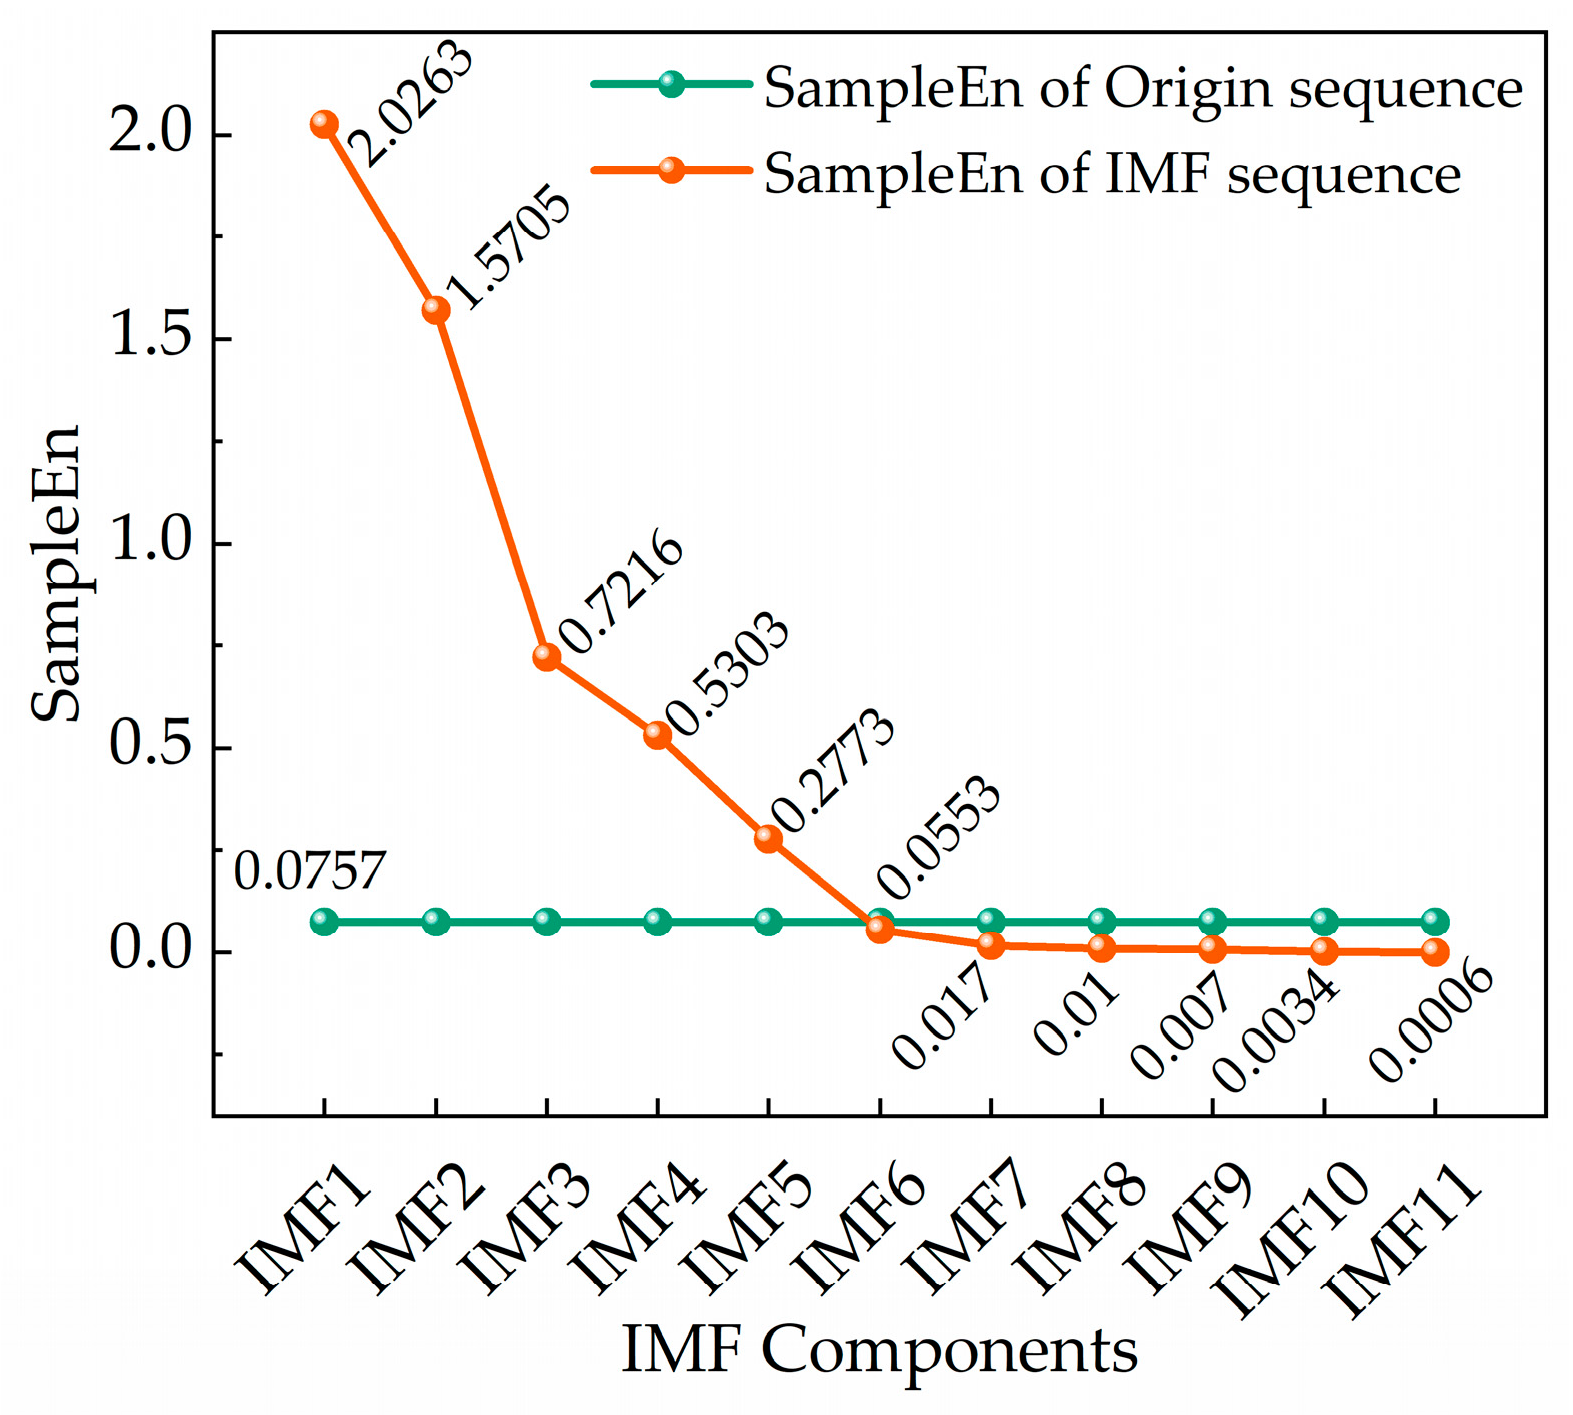
The SampEn is calculated to evaluate the complexity of each IMF component in sequence. The SampEn values, obtained using the default maximum epoch length m = 2 and the default tolerance s = 0.2, are presented in Figure 6. As shown in Figure 7, the SampEn value decreases sequentially for each IMF component, indicating a gradual reduction in complexity. The SampEn value for the original data sequence at measurement point R8 is 0.0757. Based on this comparison, it is evident that IMF1 to IMF5 contain noise and need further processing for noise reduction.
Adaptive wavelet denoising was applied to IMF1 through IMF5 for noise reduction [35,36]. The denoised IMF components were then summed with the remaining original IMF components according to the grouping results. The resulting reconstructed sequence, obtained by summing, is shown in Figure 7.
Figure 7 shows how the low- and high-frequency parts of the reconstructed electrical signals change over time. Specifically, t1 marks the moment when the piping outlet forms, while l1 and h1 indicate the sudden changes in the low- and high-frequency parts related to this event. Likewise, t2 signals the occurrence of piping, with l2 and h2 marking the corresponding sudden changes in these frequency components. At t1 = 42.85 min, the piping outlet forms, leading to concentrated seepage. Based on the resistivity model of saturated sandy soil [37], the sand layer loosens at this stage due to increased porosity, resulting in a sharp decrease in the resistance value of R8. Notably, the low- and high-frequency component values exhibit distinct sudden change patterns before this moment. The low-frequency component decreases at l1 = 37.76 min, while the high-frequency component increases at h1 = 37.76 min, with these changes occurring 5.09 min before the observed phenomenon. At t2 = 93.95 min, piping occurs, and the erosion of fine sand particles near the piping outlet alters the pore structure, resulting in a sudden increase in the resistance data of R8. At l2 = h2 = 88.42 min, the low- and high-frequency component values exhibit sudden changes simultaneously, with the low-frequency component increasing and the high-frequency component decreasing. These sudden changes happen 5.53 min before the observed event.

4. Discussion

During different stages of the piping process, the reconstructed components show significant sudden changes, although their critical transition patterns vary. To standardize the critical transition patterns of the reconstructed components, we use Critical Slowing Down (CSD) theory to analyze the characteristics of sudden changes quantitatively.
The process of piping evolution shows CSD characteristics. Before the formation of the piping outlet, the gradual accumulation of hydraulic head characterizes the old phase. The pressure release upon the complete rupture of the clay layer indicates the first phase transition. As the hydraulic head continues to rise, the accumulation of pressure in the sand layer characterizes the old phase. The second phase transition is characterized by a sudden pressure change caused by seepage forces, which lead to the outflow of sand particles from the outlet.
During each phase transition of the piping process, as the system approaches the critical point of failure, its ability to recover to the original state diminishes. Sudden changes in the electrical signals accompany this. At the moment of the piping outlet formation, the system undergoes its first phase transition as seepage becomes concentrated at the outlet. This causes a rapid buildup of charge. At the moment of the piping occurrence, the system undergoes its second phase transition. The movement of sand particles causes an immediate change in the pore structure of the sand layer, resulting in sudden variations in the electrical signals.

4.1. Determination of Window Length and Lag Length

The autocorrelation coefficient and variance are crucial indicators for identifying CSD characteristics. The choice of window length and lag length influences the values of the autocorrelation coefficient and variance [38]. The relationship between window length and lag length is illustrated in Figure 8.
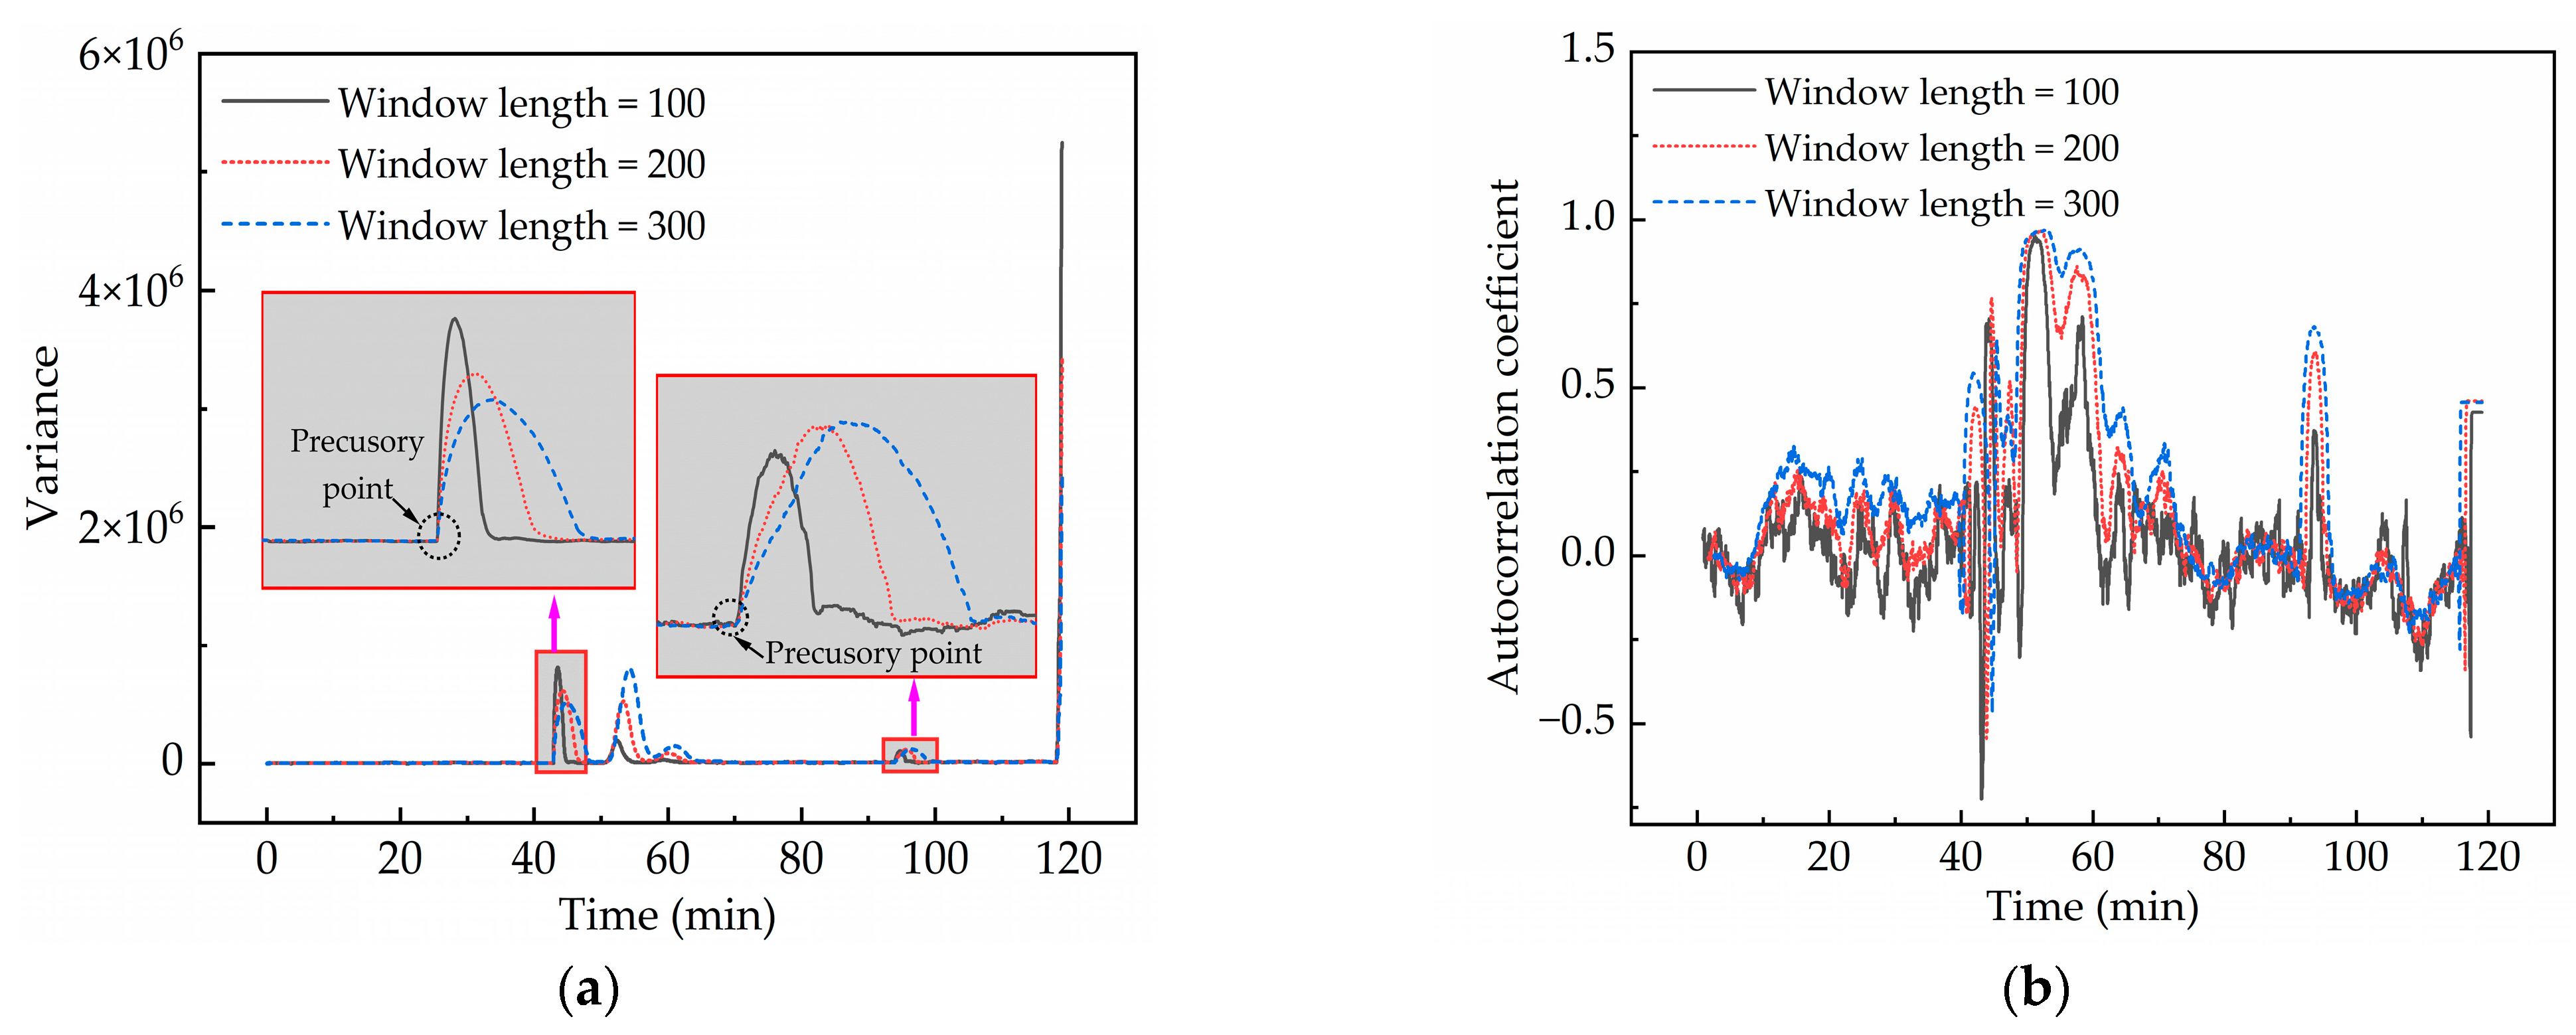
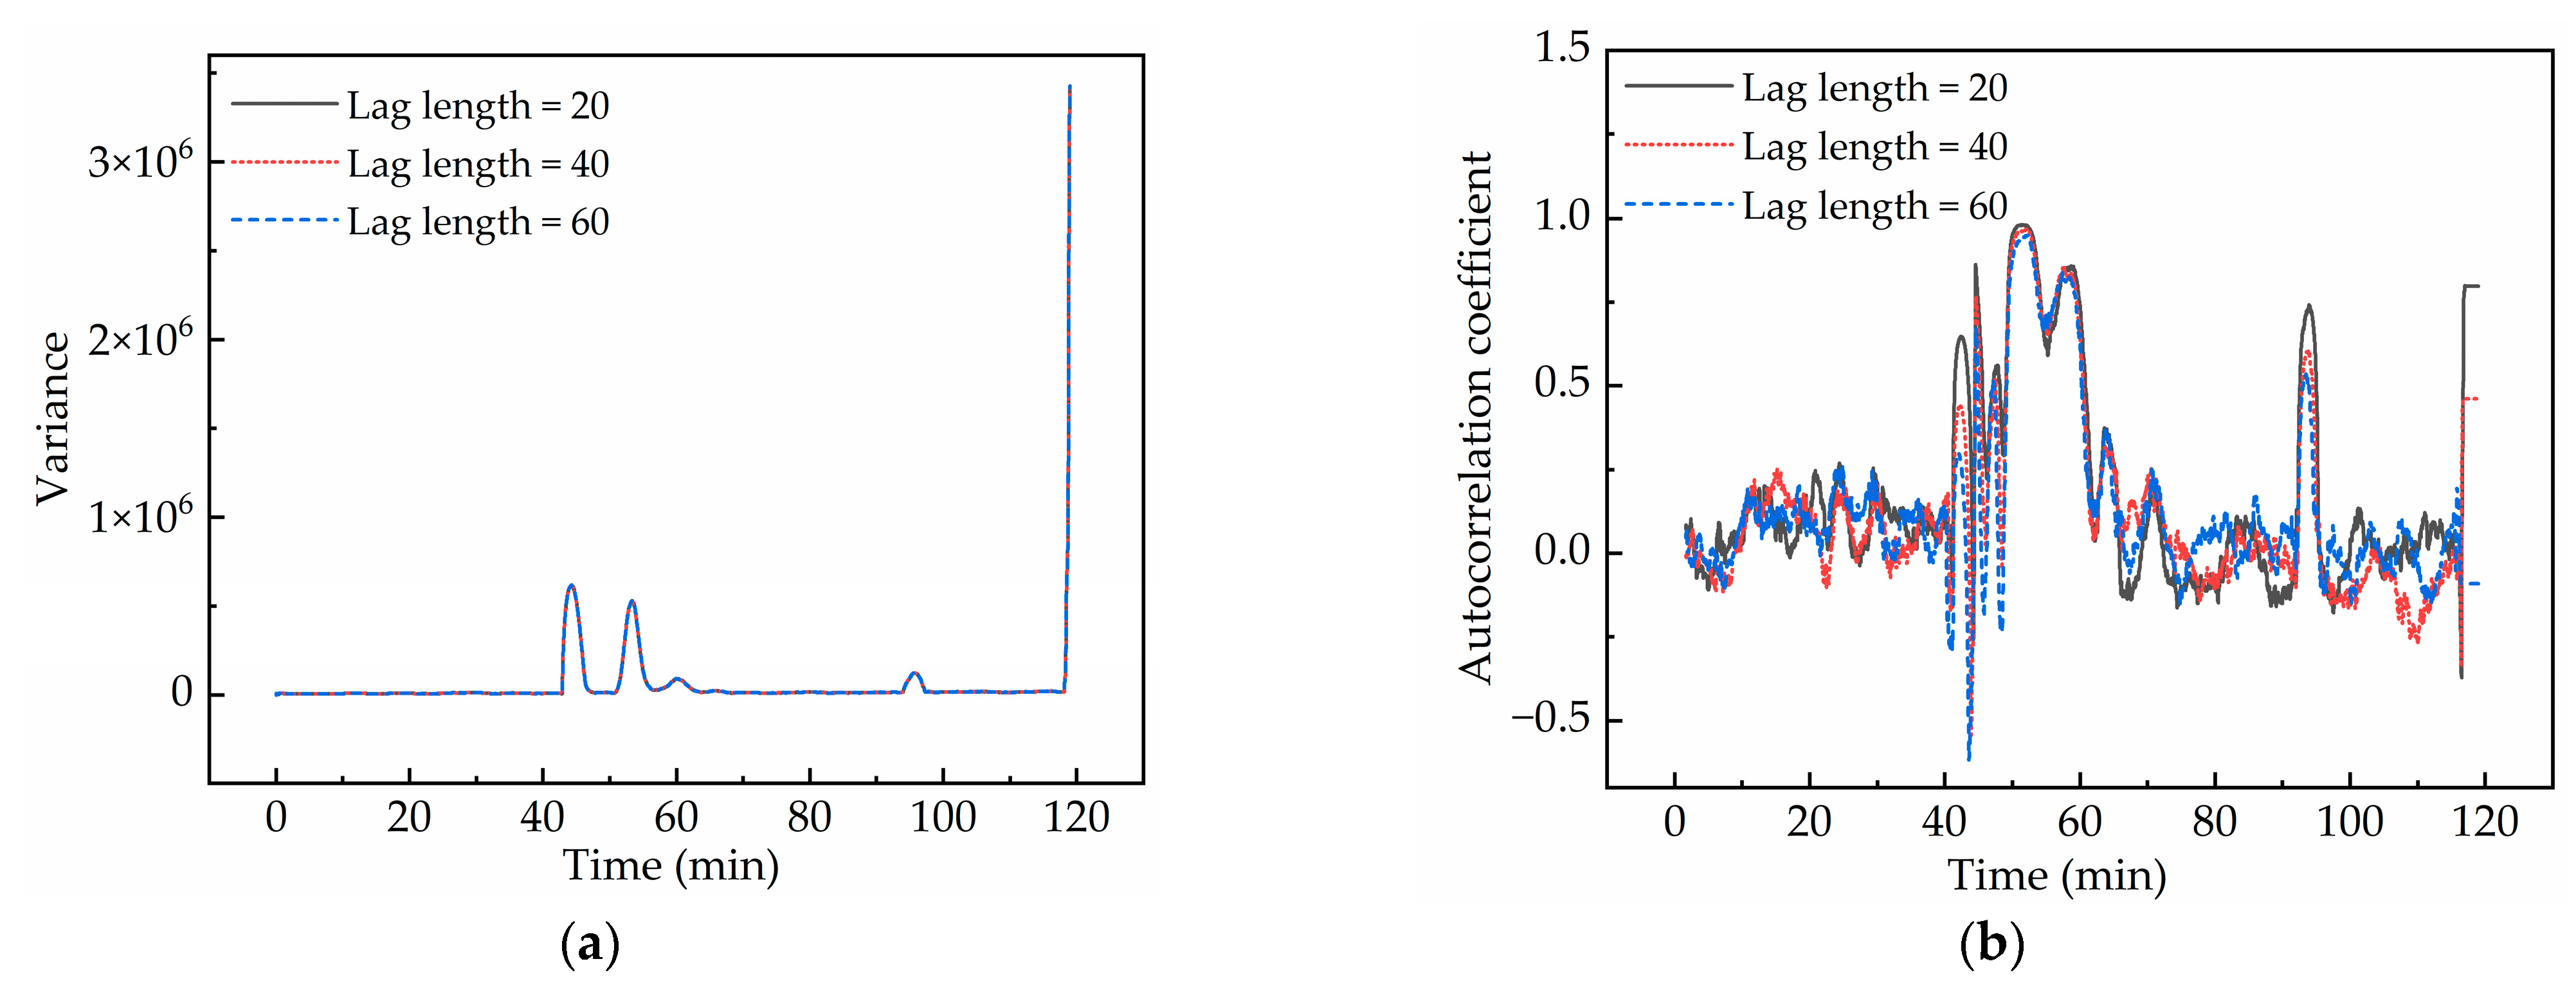
To examine how window length and lag length affect variance and autocorrelation coefficients, the CSD characteristics of the original sequences are calculated, as shown in Figure 9 and Figure 10. With the lag length set at 40, the impacts of different window lengths (100, 200, and 300) on variance (Figure 9a) and autocorrelation coefficient (Figure 9b) are examined. The results indicate that as the window length increases, the amplitude of curve fluctuations decreases, and the timing of local extrema shows a lagging effect. When the window length is fixed at 200, the effects of different lag lengths (20, 40, and 60) on variance (Figure 10a) and autocorrelation coefficient (Figure 10b) are analyzed. The results show that the variance curves for different lag lengths show similar overall trends and fluctuations, while the autocorrelation coefficient curves exhibit comparable fluctuations only at specific time points. Overall, adjustments to the window and lag lengths have a smaller impact on variance than on the autocorrelation coefficient.
At the moments of piping outlet formation and piping occurrence, the variance and autocorrelation coefficient curves of the electrical signals exhibit a sharp increase. The autocorrelation coefficient curve often shows an oscillatory trend, while the variance curve contains fewer pseudo-signals and demonstrates a more straightforward trend. This may be attributed to the weak correlation between data from the old and new phases [39]. Short window lengths offer richer precursory information within the sequence. However, when noise affects the signal, the underlying trend becomes hidden. In such cases, sudden changes in the variance curve are not visible anymore, making it challenging to identify the stages of piping evolution. This highlights the need to apply noise reduction to the original sequence. In this study, a window length of 200 and a lag length of 40 are used to conduct CSD analysis on the reconstructed components of the electrical signals.

4.2. Effective Precursory Characteristics of the Piping Process

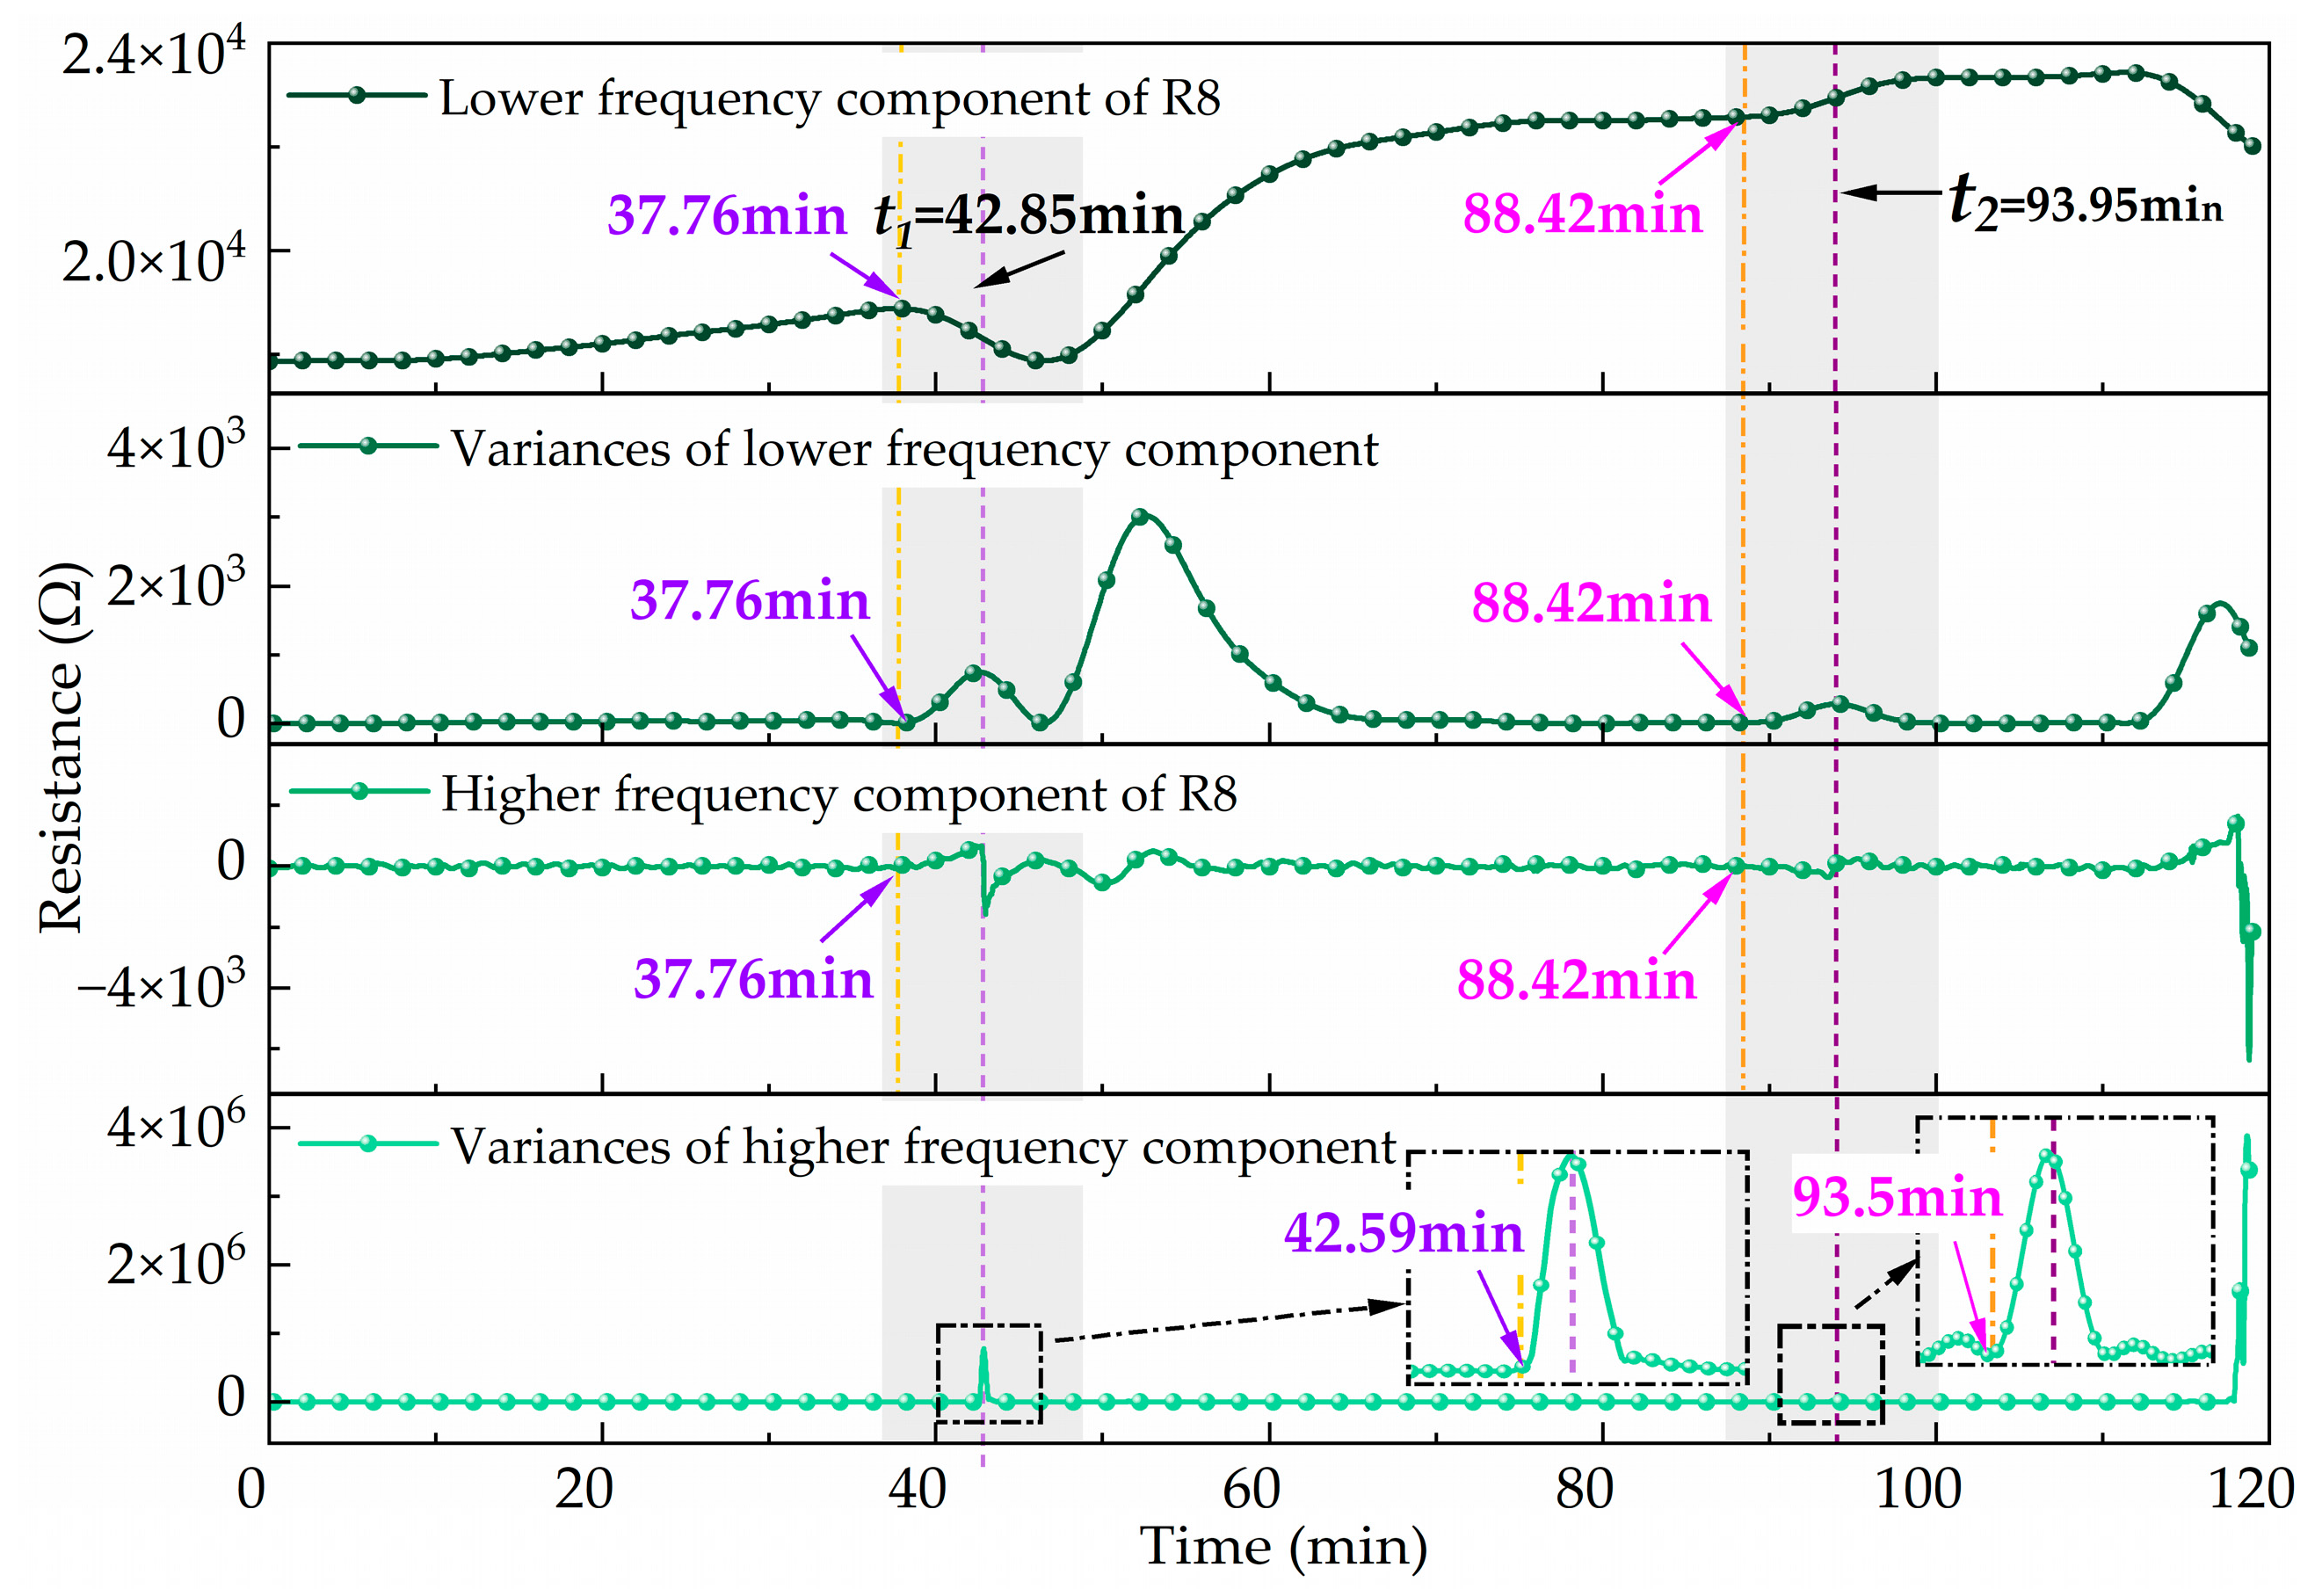
The variance curves of the reconstructed components are calculated based on CSD theory, as shown in Figure 11.
As shown in Figure 11, the variance curves of the reconstructed low- and high-frequency components exhibit significant sharp increases before the piping outlet formation and the piping occurrence. Specifically, for the piping outlet formation, the variance of both the low- and high-frequency components shows sharp increases at 37.76 min and 42.59 min, occurring 5.09 min and 0.26 min earlier, respectively. For the piping occurrence, the variance of the low- and high-frequency components shows sudden increases at 88.42 min and 93.5 min, happening 5.53 min and 0.45 min earlier, respectively. These sharply increasing points are precursory points to piping outlet formation and piping occurrence, demonstrating significant predictive value. Specifically, the sudden increases in the variance of the low- and high-frequency components act as effective precursory characteristics for piping outlet formation and piping occurrence. These findings provide a critical basis for the early warning of piping.
The above analysis focuses on the sudden changes in the variance curves of reconstructed components, which provide a certain degree of early warning for the piping evolution process. In engineering applications, identifying an optimal early warning time is essential for hazard prevention and the timely implementation of mitigation measures. As shown in Figure 11, the precursor points of the variance of the reconstructed low-frequency components occur earlier than those of the high-frequency components. Therefore, the variance of the low-frequency components can offer early warnings for piping hazards, allowing more time for emergency responses and enhancing the efficiency of mitigation efforts. Conversely, the variance of the high-frequency components offers a short-term warning, indicating that the hazard is imminent and necessitating the immediate cessation of operations and the evacuation of downstream areas.
Based on previous research, piping is typically identified by the presence of sand boiling at the outlet [40]. However, the concealed nature and variable location of outlets make sand boiling difficult to detect promptly [41]. Consequently, relying on sand boiling as an early warning indicator for piping failure is highly unreliable and often results in delayed responses [42]. In this study, an electrical signal monitoring technique is introduced to identify the internal structural changes of dikes caused by seepage and particle migration. Meanwhile, by applying CSD theory to analyze electrical signals during the piping process and combining it with the EEMD algorithm for signal preprocessing, the proposed method shows greater advantages in terms of timeliness of early warning and sensitivity to early signals. Although CSD theory has proven effective in detecting critical transitions in complex dynamic systems [43,44], this study extends its application to predicting piping failures in dikes. By identifying stage-wise transitions during the piping process, the effectiveness of statistical indicators such as variance is validated. These findings provide theoretical support and practical guidance for the development of on-site monitoring and intelligent early warning systems.

5. Conclusions

This study investigates the effective precursory characteristics of the piping process by analyzing the time-series characteristics of the electrical signals and incorporating the critical slowing down theory. The major conclusions can be drawn as follows:
(1)
The evolution of the piping process exhibited distinct phase characteristics. At the moments of piping outlet formation and piping occurrence, the electrical signals showed critical transition features, further validating the universality of the critical slowing down phenomenon.
(2)
The time-series characteristics of the electrical signals were analyzed using Ensemble Empirical Mode Decomposition (EEMD), which decomposed the signals into low- and high-frequency components. The low-frequency component reflects the staged characteristics of the piping process, while the high-frequency component captures the abrupt variations. Together, these components offer a multi-scale perspective on the evolution of piping.
(3)
The original sequences of the electrical signals displayed a sharp increase in critical slowing down indicators (variance and autocorrelation coefficient) at the critical transition points of the piping process, with the variance curve providing a more intuitive depiction of abrupt variations.
(4)
The reconstructed components of the electrical signals exhibited CSD characteristics. At the moment of piping outlet formation and piping occurrence, the sharp increase in the variance of the reconstructed low- and high-frequency components of electrical signals served as effective precursory characteristics. Quantitatively, the variance of the low-frequency component increased sharply 5.09 min before the formation of the piping outlet and 5.53 min before piping occurrence. In contrast, the variance of the high-frequency component increased 0.26 min and 0.45 min earlier, respectively. The precursory point of low-frequency variance appears earlier than that of high-frequency variance. The low-frequency variance provides an early warning for piping hazards, while the high-frequency variance offers a short-term warning.
These results validate the feasibility of using multi-scale electrical signals analysis under the CSD framework to provide real-time early warning of piping hazards in dike foundations. However, several limitations should be recognized. The relatively small size of the sandbox model may lead to scale effects, particularly regarding boundary conditions, hydraulic gradients, and the representation of soil structures. Therefore, the small-scale laboratory model may not completely replicate the stress fields or seepage dynamics present in field-scale dike foundations. Nevertheless, the model provides a well-controlled environment for observing piping evolution and extracting early warning features based on CSD theory. Future work should focus on scaling up the experimental setup, investigating a broader range of soil compositions, and integrating additional sensor types, such as pore pressure and temperature sensors, to enhance the generalizability and field applicability of the proposed method. Moreover, a detailed statistical analysis of inter-experimental reproducibility is planned to further support the generalizability and reliability of the proposed method under varied experimental conditions.

Author Contributions

Conceptualization, T.W. and J.R.; methodology, T.W. and J.R.; validation, T.W.; formal analysis, T.W.; investigation, T.W., Y.W. and J.R.; resources, Y.W.; data curation, T.W.; writing—original draft preparation, T.W.; writing—review and editing, J.R.; supervision, Y.W.; project administration, Y.W. All authors have read and agreed to the published version of the manuscript.

Funding

This work was supported by the National Natural Science Foundation of China (Grant Nos. 52209129, U2240210, and U23B20144), the Graduate Research and Innovation Projects of Jiangsu Province of China (Grant No. KYCX22_0654) and Guizhou Provincial Science and Technology Program (Major Special Project of Guizhou Science and Technology Cooperation [2024]008).

Institutional Review Board Statement

Not applicable.

Informed Consent Statement

Not applicable.

Data Availability Statement

The raw data supporting the conclusions of this article will be made available by the authors on request.

Conflicts of Interest

The authors declare no conflicts of interest.

References

  1. Beck, K.K.; Fletcher, M.; Gadd, P.S.; Heijnis, H.; Saunders, K.M.; Simpson, G.L.; Zawadzki, A. Variance and Rate-of-change as Early Warning Signals for a Critical Transition in an Aquatic Ecosystem State: A Test Case from Tasmania, Australia. J. Geophys. Res. Biogeosciences 2018, 123, 495–508. [Google Scholar] [CrossRef]
  2. Hao, W.; Wei, H.; Peng-Cheng, Y. Using the Principle of Critical Slowing down to Discuss the Abrupt Climate Change. Acta Phys. Sin. 2013, 62, 039206. [Google Scholar] [CrossRef]
  3. Yan, R.; Jiang, C.-S.; Zhang, L.-P. Study on Critical Slowing down Phenomenon of Radon Concentrations in Water before the Wenchuan MS8. 0 Earthquake. Chin. J. Geophys. 2011, 54, 1817–1826. [Google Scholar]
  4. Lenton, T.M.; Held, H.; Kriegler, E.; Hall, J.W.; Lucht, W.; Rahmstorf, S.; Schellnhuber, H.J. Tipping Elements in the Earth’s Climate System. Proc. Natl. Acad. Sci. USA 2008, 105, 1786–1793. [Google Scholar] [CrossRef]
  5. Tian, H.; Li, Z.; Shen, X.; Zang, Z.; Song, J.; Zhang, Q. Identification Method of Infrared Radiation Precursor Information of Coal Sample Failure and Instability under Uniaxial Compression. Infrared Phys. Technol. 2021, 119, 103957. [Google Scholar] [CrossRef]
  6. Zhang, X.; Li, Z.; Niu, Y.; Cheng, F.; Ali, M.; Bacha, S. An Experimental Study on the Precursory Characteristics of EP before Sandstone Failure Based on Critical Slowing Down. J. Appl. Geophys. 2019, 170, 103818. [Google Scholar] [CrossRef]
  7. Liang, P.; Li, Z.; Li, Q.; Yu, G.; Wang, S.; Han, Q.; Huang, X. The Critical Slowing-down Characteristics of Multi-Physical Field Monitoring Information about the Brittle Failure of Rock under Three-Point Bending. Nondestruct. Test. Eval. 2024, 39, 701–723. [Google Scholar] [CrossRef]
  8. Kanning, W.; Bocovich, C.; Schweckendiek, T.; Mooney, M.A. Incorporating Observations to Update the Piping Reliability Estimate of the Francis Levee. In Geotechnical Safety and Risk V; IOS Press: Amsterdam, The Netherlands, 2015; pp. 861–866. [Google Scholar]
  9. Foster, M.; Fell, R.; Spannagle, M. The Statistics of Embankment Dam Failures and Accidents. Can. Geotech. J. 2000, 37, 1000–1024. [Google Scholar] [CrossRef]
  10. Cho, I.; Ha, I.; Kim, K.; Ahn, H.; Lee, S.; Kang, H. 3D Effects on 2D Resistivity Monitoring in Earth-fill Dams. Near Surf. Geophys. 2014, 12, 73–81. [Google Scholar] [CrossRef]
  11. Richards, K.S.; Reddy, K.R. Critical Appraisal of Piping Phenomena in Earth Dams. Bull. Eng. Geol. Environ. 2007, 66, 381–402. [Google Scholar] [CrossRef]
  12. Mooney, M.A.; Parekh, M.L.; Lowry, B.; Rittgers, J.; Grasmick, J.; Koelewijn, A.R.; Revil, A.; Zhou, W. Design and Implementation of Geophysical Monitoring and Remote Sensing during a Full-Scale Embankment Internal Erosion Test. In Geo-Congress 2014: Geo-Characterization and Modeling for Sustainability; ASCE Library: Reston, VA, USA, 2014; pp. 202–211. [Google Scholar]
  13. Ahmed, A.S.; Revil, A.; Bolève, A.; Steck, B.; Vergniault, C.; Courivaud, J.; Jougnot, D.; Abbas, M. Determination of the Permeability of Seepage Flow Paths in Dams from Self-Potential Measurements. Eng. Geol. 2020, 268, 105514. [Google Scholar] [CrossRef]
  14. Lee, B.; Oh, S.; Yi, M.-J. Mapping of Leakage Paths in Damaged Embankment Using Modified Resistivity Array Method. Eng. Geol. 2020, 266, 105469. [Google Scholar] [CrossRef]
  15. Masi, M.; Ferdos, F.; Losito, G.; Solari, L. Monitoring of Internal Erosion Processes by Time-Lapse Electrical Resistivity Tomography. J. Hydrol. 2020, 589, 125340. [Google Scholar] [CrossRef]
  16. Shin, S.; Park, S.; Kim, J.-H. Time-Lapse Electrical Resistivity Tomography Characterization for Piping Detection in Earthen Dam Model of a Sandbox. J. Appl. Geophys. 2019, 170, 103834. [Google Scholar] [CrossRef]
  17. Moffat, R. A Laboratory Study of Particle Migration in Cohesionless Soils. Master’s Thesis, The University of British Columbia, Vancouver, BC, Canada, August 2002. [Google Scholar]
  18. Xiao, Y.; Pan, H.; Luo, G. Modelling of Flow in Backward Erosion Pipes. Geomech. Energy Environ. 2023, 35, 100476. [Google Scholar] [CrossRef]
  19. Alasadi, S.A.; Bhaya, W.S. Review of Data Preprocessing Techniques in Data Mining. J. Eng. Appl. Sci. 2017, 12, 4102–4107. [Google Scholar]
  20. Golyandina, N.; Korobeynikov, A.; Zhigljavsky, A. Singular Spectrum Analysis with R; Springer: Berlin/Heidelberg, Germany, 2018; ISBN 3-662-57380-6. [Google Scholar]
  21. Zhang, J.; Jiang, Q.; Ma, B.; Zhao, Y.; Zhu, L. Signal De-Noising Method for Vibration Signal of Flood Discharge Structure Based on Combined Wavelet and EMD. J. Vib. Control 2017, 23, 2401–2417. [Google Scholar] [CrossRef]
  22. Lu, S.; Wang, J.; Xue, Y. Study on Multi-Fractal Fault Diagnosis Based on EMD Fusion in Hydraulic Engineering. Appl. Therm. Eng. 2016, 103, 798–806. [Google Scholar] [CrossRef]
  23. Altunkaynak, A.; Çelik, A.; Mandev, M.B. Hourly Significant Wave Height Prediction via Singular Spectrum Analysis and Wavelet Transform Based Models. Ocean Eng. 2023, 281, 114771. [Google Scholar] [CrossRef]
  24. Ghanbarzadeh, M.; Aminghafari, M. A New Hybrid-Multiscale SSA Prediction of Non-Stationary Time Series. Fluct. Noise Lett. 2016, 15, 1650005. [Google Scholar] [CrossRef]
  25. Barbosh, M.; Singh, P.; Sadhu, A. Empirical Mode Decomposition and Its Variants: A Review with Applications in Structural Health Monitoring. Smart Mater. Struct. 2020, 29, 093001. [Google Scholar] [CrossRef]
  26. Van Beek, V.; VandenBoer, K.; Bezuijen, A. Influence of Sand Type on Pipe Development in Small-and Medium-Scale Experiments. In Proceedings of the 7th International Conference on Scour and Erosion, Perth, Australia, 2–5 December 2014; Volume 1, pp. 111–120. [Google Scholar]
  27. Xiao, Y.; Cao, H.; Pan, H.; Luo, G.; Zhu, D. Incipient Motion of Sands near the Pipe Tip. Acta Geotech. 2024, 19, 4107–4119. [Google Scholar] [CrossRef]
  28. Dubey, R.; Kumar, M.; Upadhyay, A.; Pachori, R.B. Automated Diagnosis of Muscle Diseases from EMG Signals Using Empirical Mode Decomposition Based Method. Biomed. Signal Process. Control. 2022, 71, 103098. [Google Scholar] [CrossRef]
  29. Kim, T.K. T Test as a Parametric Statistic. Korean J. Anesthesiol. 2015, 68, 540–546. [Google Scholar] [CrossRef]
  30. Richman, J.S.; Moorman, J.R. Physiological Time-Series Analysis Using Approximate Entropy and Sample Entropy. Am. J. Physiol. Heart Circ. Physiol. 2000, 278, H2039–H2049. [Google Scholar] [CrossRef] [PubMed]
  31. Qarib, H.; Adeli, H. A Comparative Study of Signal Processing Methods for Structural Health Monitoring. J. Vibroengineering 2016, 18, 2186–2204. [Google Scholar] [CrossRef]
  32. Scheffer, M.; Bascompte, J.; Brock, W.A.; Brovkin, V.; Carpenter, S.R.; Dakos, V.; Held, H.; Van Nes, E.H.; Rietkerk, M.; Sugihara, G. Early-Warning Signals for Critical Transitions. Nature 2009, 461, 53–59. [Google Scholar] [CrossRef]
  33. Guttal, V.; Jayaprakash, C. Changing Skewness: An Early Warning Signal of Regime Shifts in Ecosystems. Ecol. Lett. 2008, 11, 450–460. [Google Scholar] [CrossRef] [PubMed]
  34. Zhu, Y.; Zhang, Z.; Gu, C.; Li, Y.; Zhang, K.; Xie, M. A Coupled Model for Dam Foundation Seepage Behavior Monitoring and Forecasting Based on Variational Mode Decomposition and Improved Temporal Convolutional Network. Struct. Control Health Monit. 2023, 2023, 3879096. [Google Scholar] [CrossRef]
  35. Beale, C.; Niezrecki, C.; Inalpolat, M. An Adaptive Wavelet Packet Denoising Algorithm for Enhanced Active Acoustic Damage Detection from Wind Turbine Blades. Mech. Syst. Signal Process. 2020, 142, 106754. [Google Scholar] [CrossRef]
  36. Pan, Y.; Zhang, L.; Wu, X.; Zhang, K.; Skibniewski, M.J. Structural Health Monitoring and Assessment Using Wavelet Packet Energy Spectrum. Saf. Sci. 2019, 120, 652–665. [Google Scholar] [CrossRef]
  37. Archie, G.E. The Electrical Resistivity Log as an Aid in Determining Some Reservoir Characteristics. Trans. AIME 1942, 146, 54–62. [Google Scholar] [CrossRef]
  38. Zhang, Z.; Li, Y.; Hu, L.; Tang, C.; Zheng, H. Predicting Rock Failure with the Critical Slowing down Theory. Eng. Geol. 2021, 280, 105960. [Google Scholar] [CrossRef]
  39. Xu, C.; Xue, L.; Cui, Y.; Zhai, M.; Bu, F. Critical Slowing down Phenomenon for Predicting the Failure of Solid Rocks and Cement Mortar Materials: Insight from Acoustic Emission Multiparameters. Constr. Build. Mater. 2023, 399, 132523. [Google Scholar] [CrossRef]
  40. Fell, R.; Fry, J.-J. Internal Erosion of Dams and Their Foundations: Selected and Reviewed Papers from the Workshop on Internal Erosion and Piping of Dams and Their Foundations, Aussois, France; Crc Press: Boca Raton, FL, USA, 2005; ISBN 1-4822-6614-8. [Google Scholar]
  41. Chen, J.; Cheng, F.; Xiong, F.; Ge, Q.; Zhang, S. An Experimental Study: Fiber Bragg Grating–Hydrothermal Cycling Integration System for Seepage Monitoring of Rockfill Dams. Struct. Health Monit. 2017, 16, 50–61. [Google Scholar] [CrossRef]
  42. Kanning, W.; Baars, S.V.; Vrijling, J. The Stability of Flood Defenses on Permeable Soils: The London Avenue Canal Failures in New Orleans. In Proceedings of the 6th Conference of the International Conference on Case Histories in Geotechnical Engineering, Arlington, VA, USA, 14 August 2008. [Google Scholar]
  43. An, Q.; Steinberg, A.M.; Jella, S.; Bourque, G.; Füri, M. Early Warning Signs of Imminent Thermoacoustic Oscillations through Critical Slowing Down. J. Eng. Gas Turbines Power 2019, 141, 054501. [Google Scholar] [CrossRef]
  44. Zhang, Z.; Song, Z.; Lai, J.; Qiu, J.; Cheng, Y.; Zhang, J. Critical Slowing down Precursor Information for the Acoustic Emission Response Characteristics of Defective Tuffs. Theor. Appl. Fract. Mech. 2024, 129, 104220. [Google Scholar] [CrossRef]
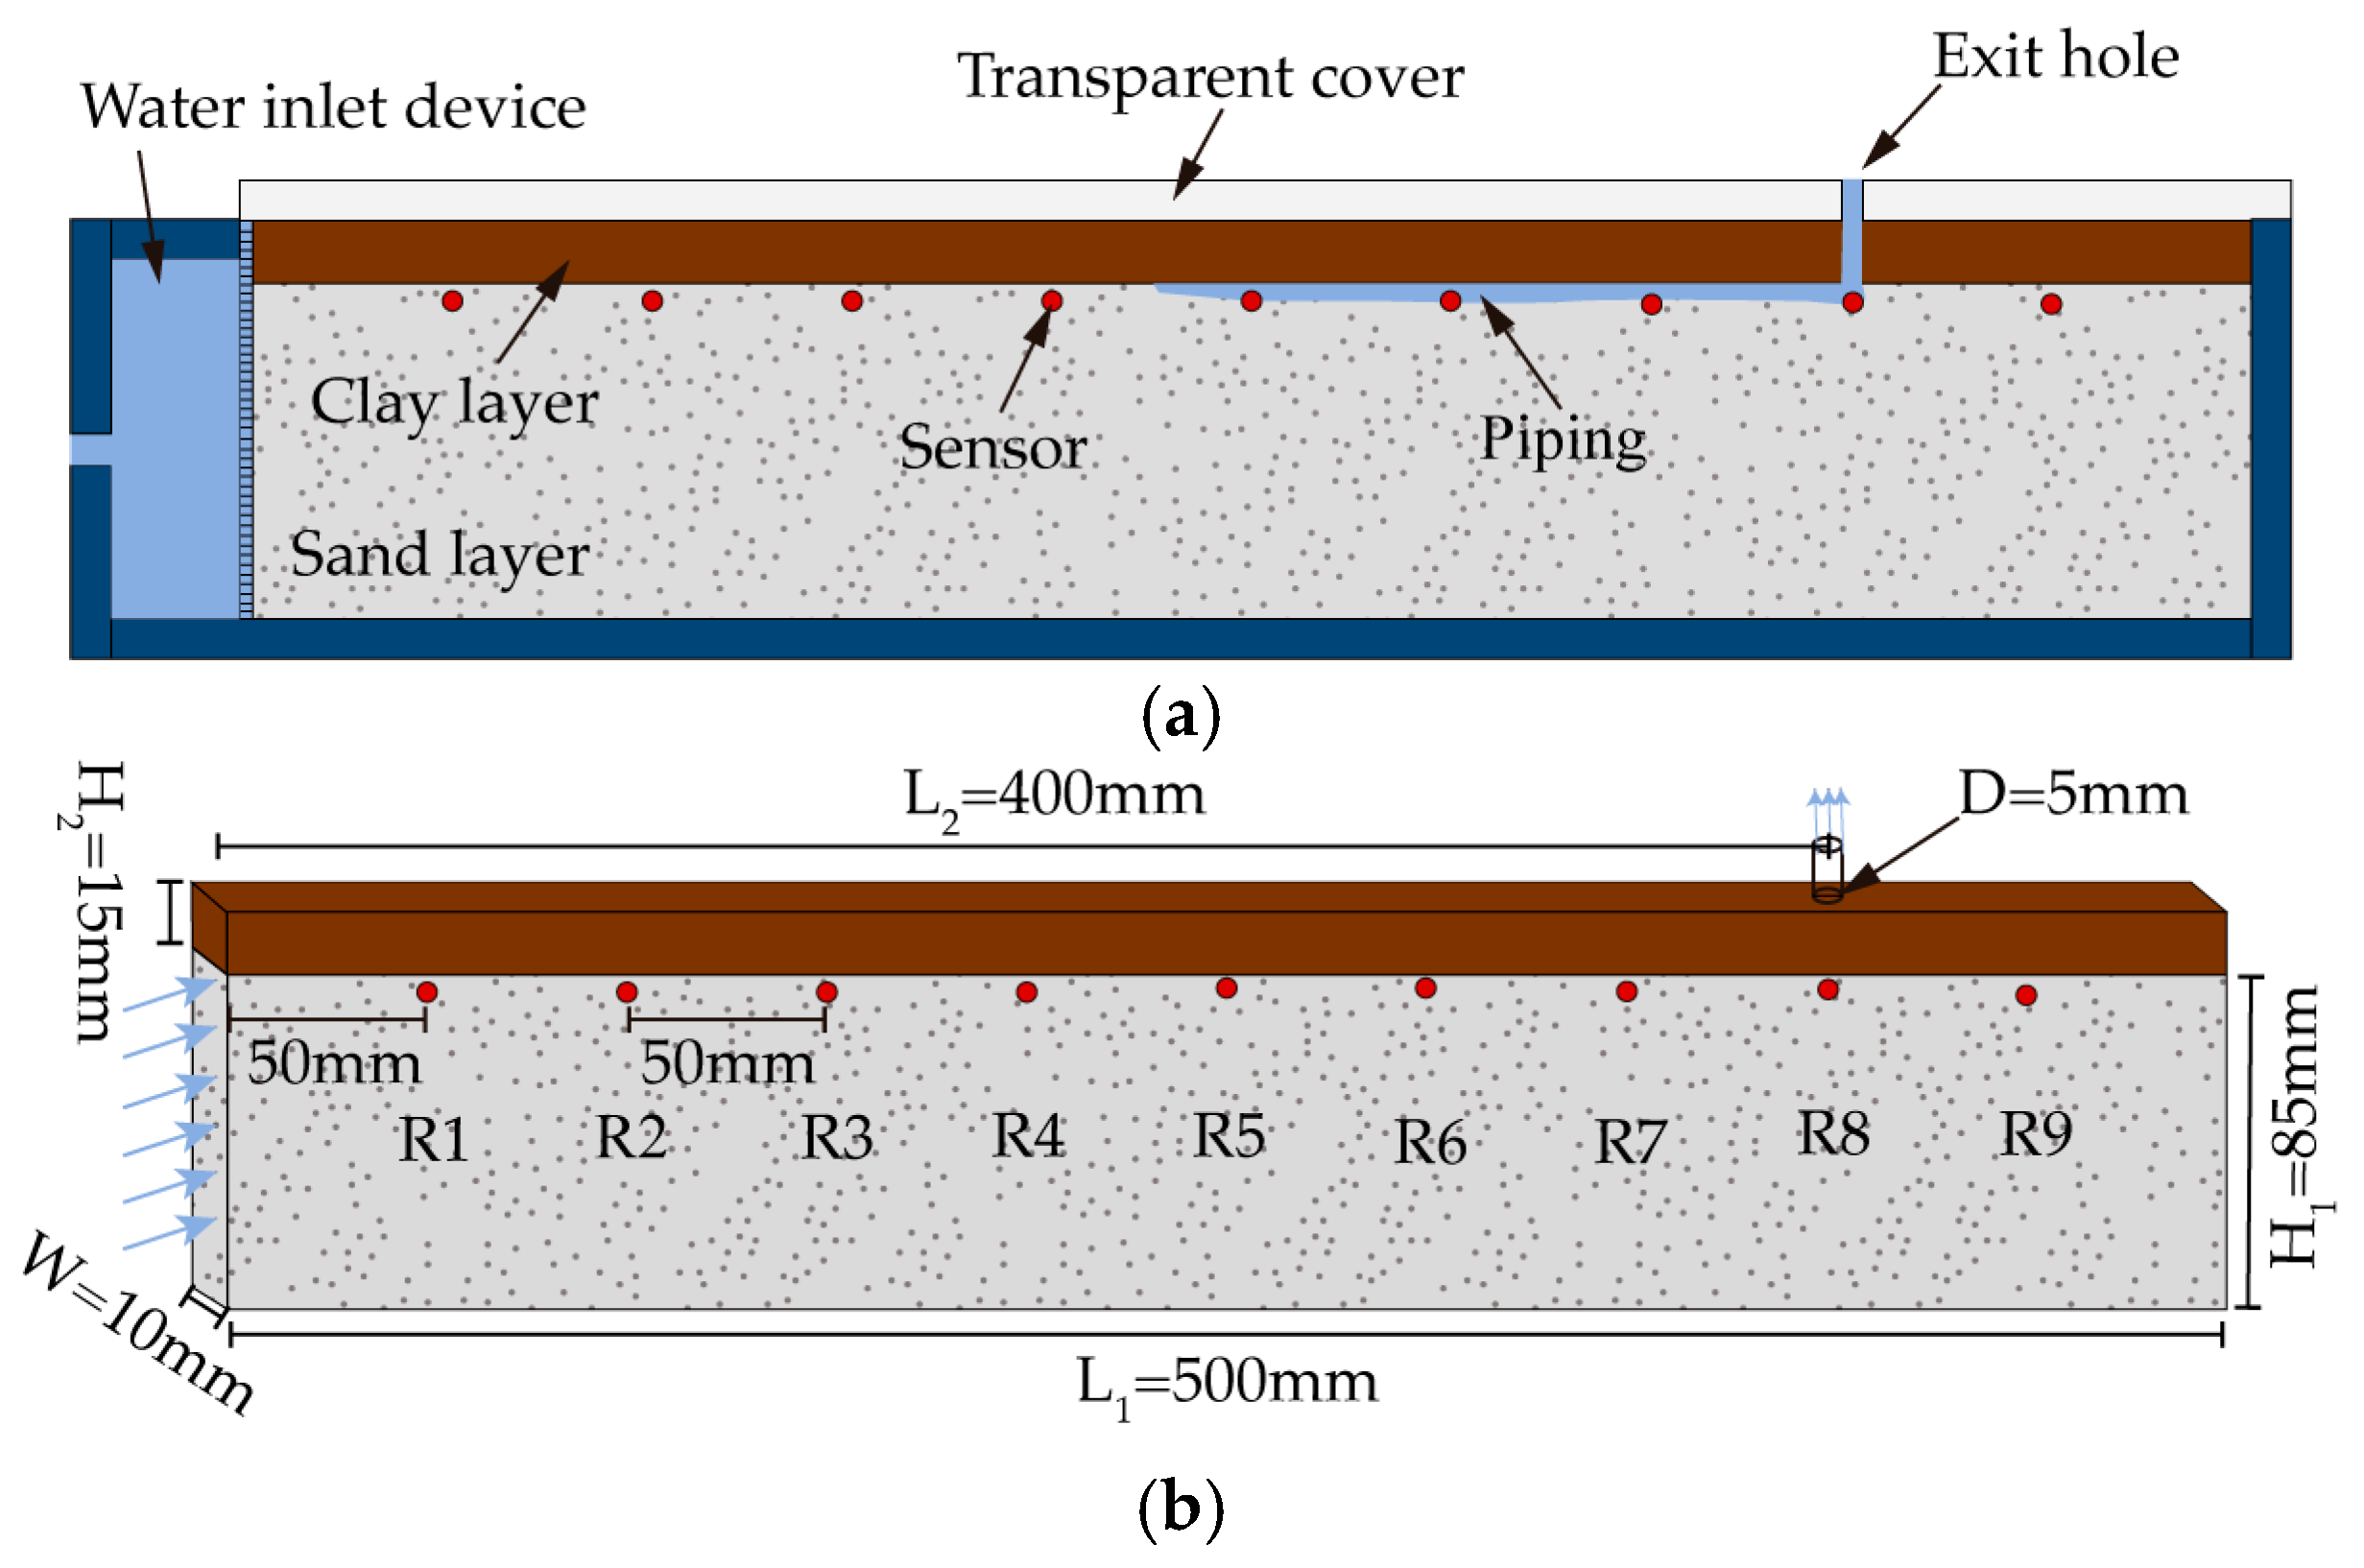
Figure 1. Schematic figure of the test model with dimensions. (a) Sandbox model for piping simulation; (b) dimensions of the test model.
Applsci 15 08814 g001
Figure 2. Schematic figure of the test setup.
Applsci 15 08814 g002
Figure 3. The phenomenon of the piping experiment. Subgraphs (af) show different stages of the piping process: Subgraph (a) is Stage I; Subgraph (b) is Stage II; Subgraph (c) is Stage III; Subgraph (d) is Stage IV; and Subgraphs (e,f) are Stage V. Subgraphs (AH) give detailed schematic illustrations of the piping phenomena: Subgraph (A) is Stage I; Subgraphs (B,C) are Stage II; Subgraph (D) is Stage III; Subgraphs (E,F) are Stage IV; and Subgraphs (G,H) are Stage V.
Applsci 15 08814 g003
Figure 4. The time-series curves of electrical signals during the piping process.
Applsci 15 08814 g004
Figure 5. EEMD results of electrical signals.
Applsci 15 08814 g005
Figure 6. The SampEn of IMF components obtained from the decomposition of electrical signals.
Applsci 15 08814 g006
Figure 7. Reconstructed component curves of the electrical signals.
Applsci 15 08814 g007
Figure 8. Schematic diagram of the relationship between window length and lag length.
Applsci 15 08814 g008
Figure 9. CSD characteristics of electrical signals with different window lengths and the same lag length. (a) Variance curve; (b) autocorrelation coefficient curve.
Applsci 15 08814 g009
Figure 10. CSD characteristics of electrical signals with different lag lengths and the same window length. (a) Variance curve; (b) autocorrelation coefficient curve.
Applsci 15 08814 g010
Figure 11. CSD characteristics of the reconstructed components.
Applsci 15 08814 g011
Table 1. The distinctive characteristics of the sand sample.
Grain Composition CharacteristicsDry Density/g·cm−3Relative DensityPorosityPermeability Coefficient
/cm·s−1
Grain Size Range/mmPercentage30 d50/mm
0.075–0.2525%151.522.620.320.04
0.25–0.525%
0.5–150%
Table 2. Significance test results for the IMF components in electrical signals.
IndexCalculation Results
IMF 10.7677
IMF 20.8854
IMF 30.9298
IMF 40.9859
IMF 50.6247
IMF 60.5158
IMF 70.7925
IMF 80.7332
IMF 90
IMF 100
IMF 110
IMF 12/
Disclaimer/Publisher’s Note: The statements, opinions and data contained in all publications are solely those of the individual author(s) and contributor(s) and not of MDPI and/or the editor(s). MDPI and/or the editor(s) disclaim responsibility for any injury to people or property resulting from any ideas, methods, instructions or products referred to in the content.