Article

MDNet: A Differential-Perception-Enhanced Multi-Scale Attention Network for Remote Sensing Image Change Detection

1
College of Geomatics and Geoinformation, Guilin University of Technology, Guilin 541004, China
2
Guangxi Key Laboratory of Spatial Information and Geomatics, Guilin 541004, China
3
Geomatics and Mapping Institute of Guangxi Zhuang Autonomous Region, Liuzhou 545006, China
*
Author to whom correspondence should be addressed.
Appl. Sci. 2025, 15(16), 8794; https://doi.org/10.3390/app15168794
Submission received: 4 July 2025 / Revised: 31 July 2025 / Accepted: 6 August 2025 / Published: 8 August 2025

Abstract

As a core task in remote sensing image processing, change detection plays a vital role in dynamic surface monitoring for environmental management, urban planning, and agricultural supervision. However, existing methods often suffer from missed detection of small targets and pseudo-change interference, stemming from insufficient modeling of multi-scale feature coupling and spatio-temporal differences due to factors such as background complexity and appearance variations. To this end, we propose a Differential-Perception-Enhanced Multi-Scale Attention Network for Remote Sensing Image Change Detection (MDNet), an optimized framework integrating multi-scale feature extraction, cross-scale aggregation, difference enhancement, and context modeling. Through the parallel collaborative mechanism of the designed Multi-Scale Feature Extraction Module (EMF) and Cross-Scale Adjacent Semantic Information Aggregation Module (CASAM), multi-scale semantic learning is strengthened, enabling fine-grained modeling of change targets of different sizes and improving small-target-detection capability. Meanwhile, the Differential-Perception-Enhanced Module (DPEM) and Transformer structure are introduced for global–local coupled modeling of spatio-temporal differences. They enhance spectral–structural differences to form discriminative features, use self-attention to capture long-range dependencies, and construct multi-level features from local differences to global associations, significantly suppressing pseudo-change interference. Experimental results show that, on three public datasets (LEVIR-CD, WHU-CD, and CLCD), the proposed model exhibits superior detection performance and robustness in terms of quantitative metrics and qualitative analysis compared with existing advanced methods.

1. Introduction

As a key technology for identifying surface changes by analyzing differences in temporal remote sensing images [1], remote sensing change detection has been widely applied to various fields such as urban planning [2], ecological environment monitoring [3], and disaster emergency assessment [4]. However, the practical application of this technology still faces multiple technical challenges: first, differences in lighting conditions and changes in sensor parameters during image acquisition easily lead to pseudo-change interference; second, image registration errors and spatial resolution differences affect the precise positioning of change areas; third, the problem of uneven land cover categories significantly restricts the model’s generalization ability [5].
In terms of methodological evolution, traditional change detection methods with manually constructed features [6] perform well in simple scenes, but their feature representation capabilities show obvious limitations in complex scenarios. In contrast, deep learning-based paradigms demonstrate significant advantages through end-to-end feature learning mechanisms. For example, Peng et al. [7] used a CNN with dense skip connections to fully learn the feature representations of unlabeled data through multi-level feature reuse. Bai et al. [8] innovatively introduced an edge constraint mechanism to enhance the CNN’s perception of change boundaries. Notably, spatio-temporal context modeling has become a key research direction for improving detection accuracy, and researchers have successively integrated feature aggregation or attention mechanisms into CNNs. For instance, Luo et al. [9] and Ying et al. [10] both adopted multi-scale fusion techniques, significantly improving the accuracy of remote sensing change detection by effectively combining feature representations at different scales. Zhang et al. [11] constructed an attention-guided edge refinement network, which uses an attention mechanism to aggregate contextual information while introducing an edge refinement module to enhance the structural boundaries of prediction results. Chen et al. [12] incorporated a dual attention mechanism into the change detection network to improve the model’s discriminative ability for pseudo-changes.
With the breakthrough progress of the Transformer architecture in global modeling, this technology has begun to be introduced into the field of remote sensing change detection. For example, Zhang et al. [13] proposed a pure Swin Transformer network, achieving global context awareness through a U-shaped encoder–decoder structure. Yan et al. [14] used Swin Transformer to learn discriminative global features and aggregated multi-level features through a pyramid structure to enhance feature representation. However, the high computational complexity of pure Transformer architectures has prompted research to shift towards the collaborative optimization of convolution and self-attention. Recent studies have proposed several innovative hybrid architectures. For instance, the asymmetric multi-head cross-attention mechanism designed by Zhang et al. [15] effectively integrates the local perception advantages of CNNs with the global modeling capabilities of Transformer. The cross-dimensional interactive self-attention module developed by Tao et al. [16] achieves multi-dimensional feature enhancement through joint channel–spatial optimization. Although significant progress has been made in research so far, there is still room for improvement in the dynamic complementary mechanism between local features and global context, computational efficiency optimization, etc. In particular, the balance between multi-scale change detection accuracy and model lightweighting in complex scenarios still requires in-depth exploration.
Building upon cutting-edge advancements in change detection, we propose a Differential-Perception-Enhanced Attention Network based on Multi-Scale Feature Aggregation (MDNet), which deeply integrates convolutional neural networks (CNNs), multi-scale feature aggregation, differential perception enhancement mechanisms, attention mechanisms, and Transformer architecture. We construct a novel CNN–Transformer hybrid framework: First, the EMF is used to extract multi-scale features of bi-temporal images, while the CASAM is utilized to progressively fuse the semantic features of adjacent layers in the backbone. Then, the Transformer and attention mechanisms are jointly employed to capture long-range dependencies. Simultaneously, the DPEM constructs a spatio-temporal feature difference mapping space to enhance change region features. The key contributions of this work include the following:
(i) MDNet, a novel CNN–Transformer hybrid framework that effectively combines the complementary strengths of both architectures while integrating multi-scale feature extraction, differential enhancement, and attention mechanisms.
(ii) A Multi-Scale Feature Extraction Module (EMF) is designed. Through the collaborative design of the channel attention mechanism and the deformable convolutional feature pyramid, it enables the extraction of multi-scale spatial structure features across resolution levels of bi-temporal images. A Cross-Scale Adjacent Semantic Aggregation Module (CASAM) is introduced to perform progressive fusion of semantic features of adjacent levels, strengthening the structural representation of ground objects and semantic consistency modeling.
(iii) A Differential-Perception-Enhanced Module (DPEM) is designed to construct a feature difference mapping space in the spatio-temporal dimension, systematically enhancing the joint spectral–structural representation ability of change regions and achieving a significant improvement in the completeness of multi-dimensional feature representation in complex scenarios.
The rest of this paper is organized as follows. Section 2 introduces the related work. Section 3 presents detailed information on the method proposed by us. Experimental results and analysis are provided in Section 4. Conclusions and future work are presented in Section 5.

2. Related Work

In recent years, with the continuous development of deep learning, most change detection algorithms have significantly improved the effectiveness and robustness of models by means of feature fusion, attention mechanisms, and Transformer. Therefore, this section will proceed from the three dimensions of feature aggregation, attention mechanisms, and Transformer to deeply analyze the related research works.

2.1. Feature Aggregation

Integrating feature information from different levels, sources, or temporal phases is crucial for capturing changes in remote sensing images. Existing change detection algorithms can be divided into early fusion, intermediate fusion, and late fusion according to the position of the fusion module [4]. Early fusion typically relies on a single-branch structure to directly perform feature fusion at the image level through operations such as differencing, concatenation, or summation [17]. Intermediate and late fusion generally act on a siamese network structure, covering single-scale fusion [12,18,19] and multi-scale fusion [20,21,22].
Single-scale fusion typically focuses on fusing bi-temporal features of two siamese branches, while multi-scale siamese networks usually extract bi-temporal features from multiple levels and integrate multi-scale information through cross-scale fusion strategies. Given that change objects in remote sensing images often have irregular and multi-scale characteristics, the composite feature maps generated by multi-scale fusion overcome the limitation that covering multi-size targets is difficult with single-scale features, and cross-level feature complementarity strengthens the parsing ability of complex scenes. In addition, most existing multi-scale models have difficulty in modeling contextual relationships, which is crucial for identifying changes in interest in remote sensing images.

2.2. Attention Mechanism

In the task of remote sensing image change detection, the attention mechanism achieves the adaptive enhancement of features in changed areas and dynamic suppression of features in unchanged areas by modeling the intrinsic semantic relationships of images. According to existing studies, the attention mechanism is mainly divided into four categories—spatial attention [23,24], channel attention [25,26], temporal attention [27,28], and self-attention [29,30,31,32,33,34]—which exhibit better feature representation capabilities compared to traditional convolutional methods.
In the spatial dimension, Song et al. [23] proposed using a spatial attention mechanism to decouple the semantic confusion between changed pixels and building backgrounds, while fusing the channel attention mechanism with the Atrous Spatial Pyramid Pooling (ASPP) module to effectively enhance the contextual correlation of multi-scale features. In the channel dimension, Jiang et al. [25] constructed a parallel channel–spatial attention mechanism (ARM) which significantly improved the model’s perception of subtle differences in remote sensing images and achieved the precise extraction of edge details of changed targets through the collaborative optimization of the cross-scale feature fusion module (CSFM). In terms of temporal modeling, Li et al. [27] improved lightweight temporal memory module (TTM) design based on the LSTM architecture, which effectively breaks through the weight-sharing limitations of traditional recurrent neural networks while maintaining the efficient transmission of spatio-temporal features. In the research field of self-attention mechanisms, existing technical routes primarily present two paradigms: feature extraction architectures based on self-attention mechanisms [29,30,31] and differential feature enhancement architectures based on CNN feature extraction [32,33,34]. Although the former enables global semantic modeling, its high computational complexity has prompted current research to favor hybrid designs integrating convolution and self-attention to balance performance and efficiency.

2.3. Transformer-Based Network

In recent years, Transformer models have achieved breakthrough progress in global contextual modeling in the field of computer vision [35,36,37] by virtue of their self-attention mechanisms, effectively addressing the inherent limitations of traditional 2D convolutional neural networks in capturing long-range dependency relationships. To synergize the local feature extraction advantages of CNNs and the global semantic representation capabilities of Transformer, current research mainly focuses on three types of integrated backbone network architectures.
Cascade architecture realizes modality complementarity through temporal feature transmission. Jiang et al. [38] used CNN features to construct semantically enhanced visual tokens (Visual Token) as ViT inputs to improve global contextual modeling capabilities. Tang et al. [39] explored shallow–deep semantic fusion mechanisms in the Transformer block cascade framework. Wu et al. [40] embedded cross-temporal Transformer modules in the CNN backbone to strengthen semantic change perception. Parallel architecture focuses on synchronous processing of multi-modal features. Feng et al. [41] designed a dual-stream parallel structure to extract fine-grained details and high-level semantics, respectively, but it has inherent defects such as insufficient interaction between branches and difficult feature alignment. Hybrid architecture combines flexibility and scalability. Wang et al. [42] constructed a Transformer–CNN hybrid decoder to achieve global–local context collaboration. Li et al. [43] and Zhao et al. [44] further introduced a multi-scale geometric feature fusion mechanism, but existing methods have not fully exploited the complementary potential of the two architectures.

3. Methodology

3.1. Overview

As shown in Figure 1, the MDNet proposed in this paper is a siamese network architecture that fuses a CNN, multi-scale feature aggregation, differential perception enhancement, Transformer, and attention mechanisms. The network employs an improved ResNet [45] as the backbone, performs multi-scale feature extraction on bi-temporal images through the EMF, and constructs a feature pyramid to capture representations of ground objects with different sizes. The CASAM is utilized to achieve interactive aggregation of cross-layer adjacent semantic features, enhancing the representation of ground object structure information and semantic consistency. Subsequently, the aggregated features are subjected to spatio-temporal context modeling via Transformer modules and attention mechanisms, capturing long-range dependencies through self-attention mechanisms. Meanwhile, the DPEM constructs a spatio-temporal differential feature space to explicitly enhance the spectral–structural difference representation of changed areas. The output features of DPEM are further processed by Transformer and attention mechanisms to deepen the context modeling of the difference domain, effectively bridging the inter-domain differences between bi-temporal images.
Specifically, let T1 and T2 represent images of the same area taken at two different times, respectively. I i ( i { 1 , 2 } ) R 3   ×   H   ×   W represents the original feature map of image T i ( i { 1 , 2 } ) . The MDNet process is summarized below:
(i) First, for the input images I i ( i { 1 , 2 } ) R 3   ×   H   ×   W , three sets of multi-scale feature maps G i 1 ( 1 ) , G i 2 ( 1 ) , G i 3 ( 1 ) are extracted through the shared-parameter ResNet backbone network.
(ii) Next, adjacent-scale feature maps are input into the Cross-Scale Adjacent Semantic Information Aggregation Module (CASAM), and feature fusion is performed on G 1 j ( 1 ) and G 2 j ( 1 ) ( j { 1 , 2 , 3 } ) of the two branches, respectively, generating optimized multi-scale feature maps G i j ( 2 ) ( i { 1 , 2 } , j { 1 , 2 , 3 } ) .
(iii) Then, the feature maps G i j ( 2 ) ( i { 1 , 2 } , j { 1 , 2 , 3 } ) of the same scale in the bi-temporal images are input into the Differential Perception Enhancement Module (DPEM), and spatio-temporal differential feature maps G 3 j ( 3 ) ( j { 1 , 2 , 3 } ) are extracted.
(iv) After that, G 3 j ( 3 ) ( j { 1 , 2 , 3 } ) and G i j ( 2 ) ( i { 1 , 2 } , j { 1 , 2 , 3 } ) are sequentially input into the Transformer and Channel Attention Module (CAM), generating feature maps G i j ( 4 ) ( i , j { 1 , 2 , 3 } ) that integrate spatio-temporal information.
(v) Meanwhile, the multi-scale Feature Extraction Module (EMF) processes the ResNet backbone features to generate feature maps I 3 , I 4 . After unifying the channel dimensions through convolutional layers, they are input into the DPEM and CAM to obtain the feature map I 5 , which is added to G 3 3 ( 4 ) to achieve feature updating.
(vi) Finally, the updated multi-scale feature maps G i j ( 4 ) ( i , j { 1 , 2 , 3 } ) are concatenated along the channel dimension and input into the corresponding CNN classifiers to obtain three predicted change maps.
This algorithm, through the collaboration of multiple modules, forms a hierarchical processing flow of “multi-scale feature extraction—cross-layer semantic aggregation—spatio-temporal difference enhancement—context modeling”, and finally outputs change detection results through pixel-level classification, effectively improving the model’s perception and generalization ability for complex scenes.

3.2. Multi-Scale CNN Feature Extractor

MDNet employs an improved ResNet as a feature extractor. The backbone network consists of five main blocks, including a 7 × 7 convolutional layer and four residual blocks. For simplicity, the four residual blocks are, respectively, denoted as R e s B l o c k _ i ( i { 1 , 2 , 3 , 4 } ) . Among them, R e s B l o c k _ i ( i = 2 , 3 ) downsamples the feature maps with a stride of 2 to gradually compress the spatial resolution; the number of channels in the 1   ×   1 residual connection of the 3rd Bottleneck in R e s B l o c k _ 4 and the last 1   ×   1 convolution is set to 1024; the initial fully connected layer is removed; the multi-scale Feature Extraction Module (EMF) is cascaded after R e s B l o c k _ 4 , generating multi-resolution feature representations through multi-branch convolutional operations.

Multi-Scale Feature Extraction Module (EMF)

To address the challenges of scale diversity and background noise in remote sensing change detection, the proposed EMF targets effective extraction of ground objects and complex textures across multiple scales. Inspired by ECA [46] and Inception [47], we designed a Multi-Scale Feature Extraction Module (EMF) to achieve efficient extraction of multi-scale features and noise suppression. The module first constructs a cross-channel information interaction network through a lightweight channel attention mechanism, adaptively enhancing the spectral–textural feature responses related to the change detection task, while suppressing redundant channel information to improve the pertinence of feature expression. Then, based on the feature pyramid structure, hierarchical deformable convolution processing is performed on the input feature maps to simultaneously obtain multi-resolution features. The shallow network of the EMF captures fine-grained position information such as edges and contours, while the deep network extracts coarse-grained contextual information such as semantic categories.
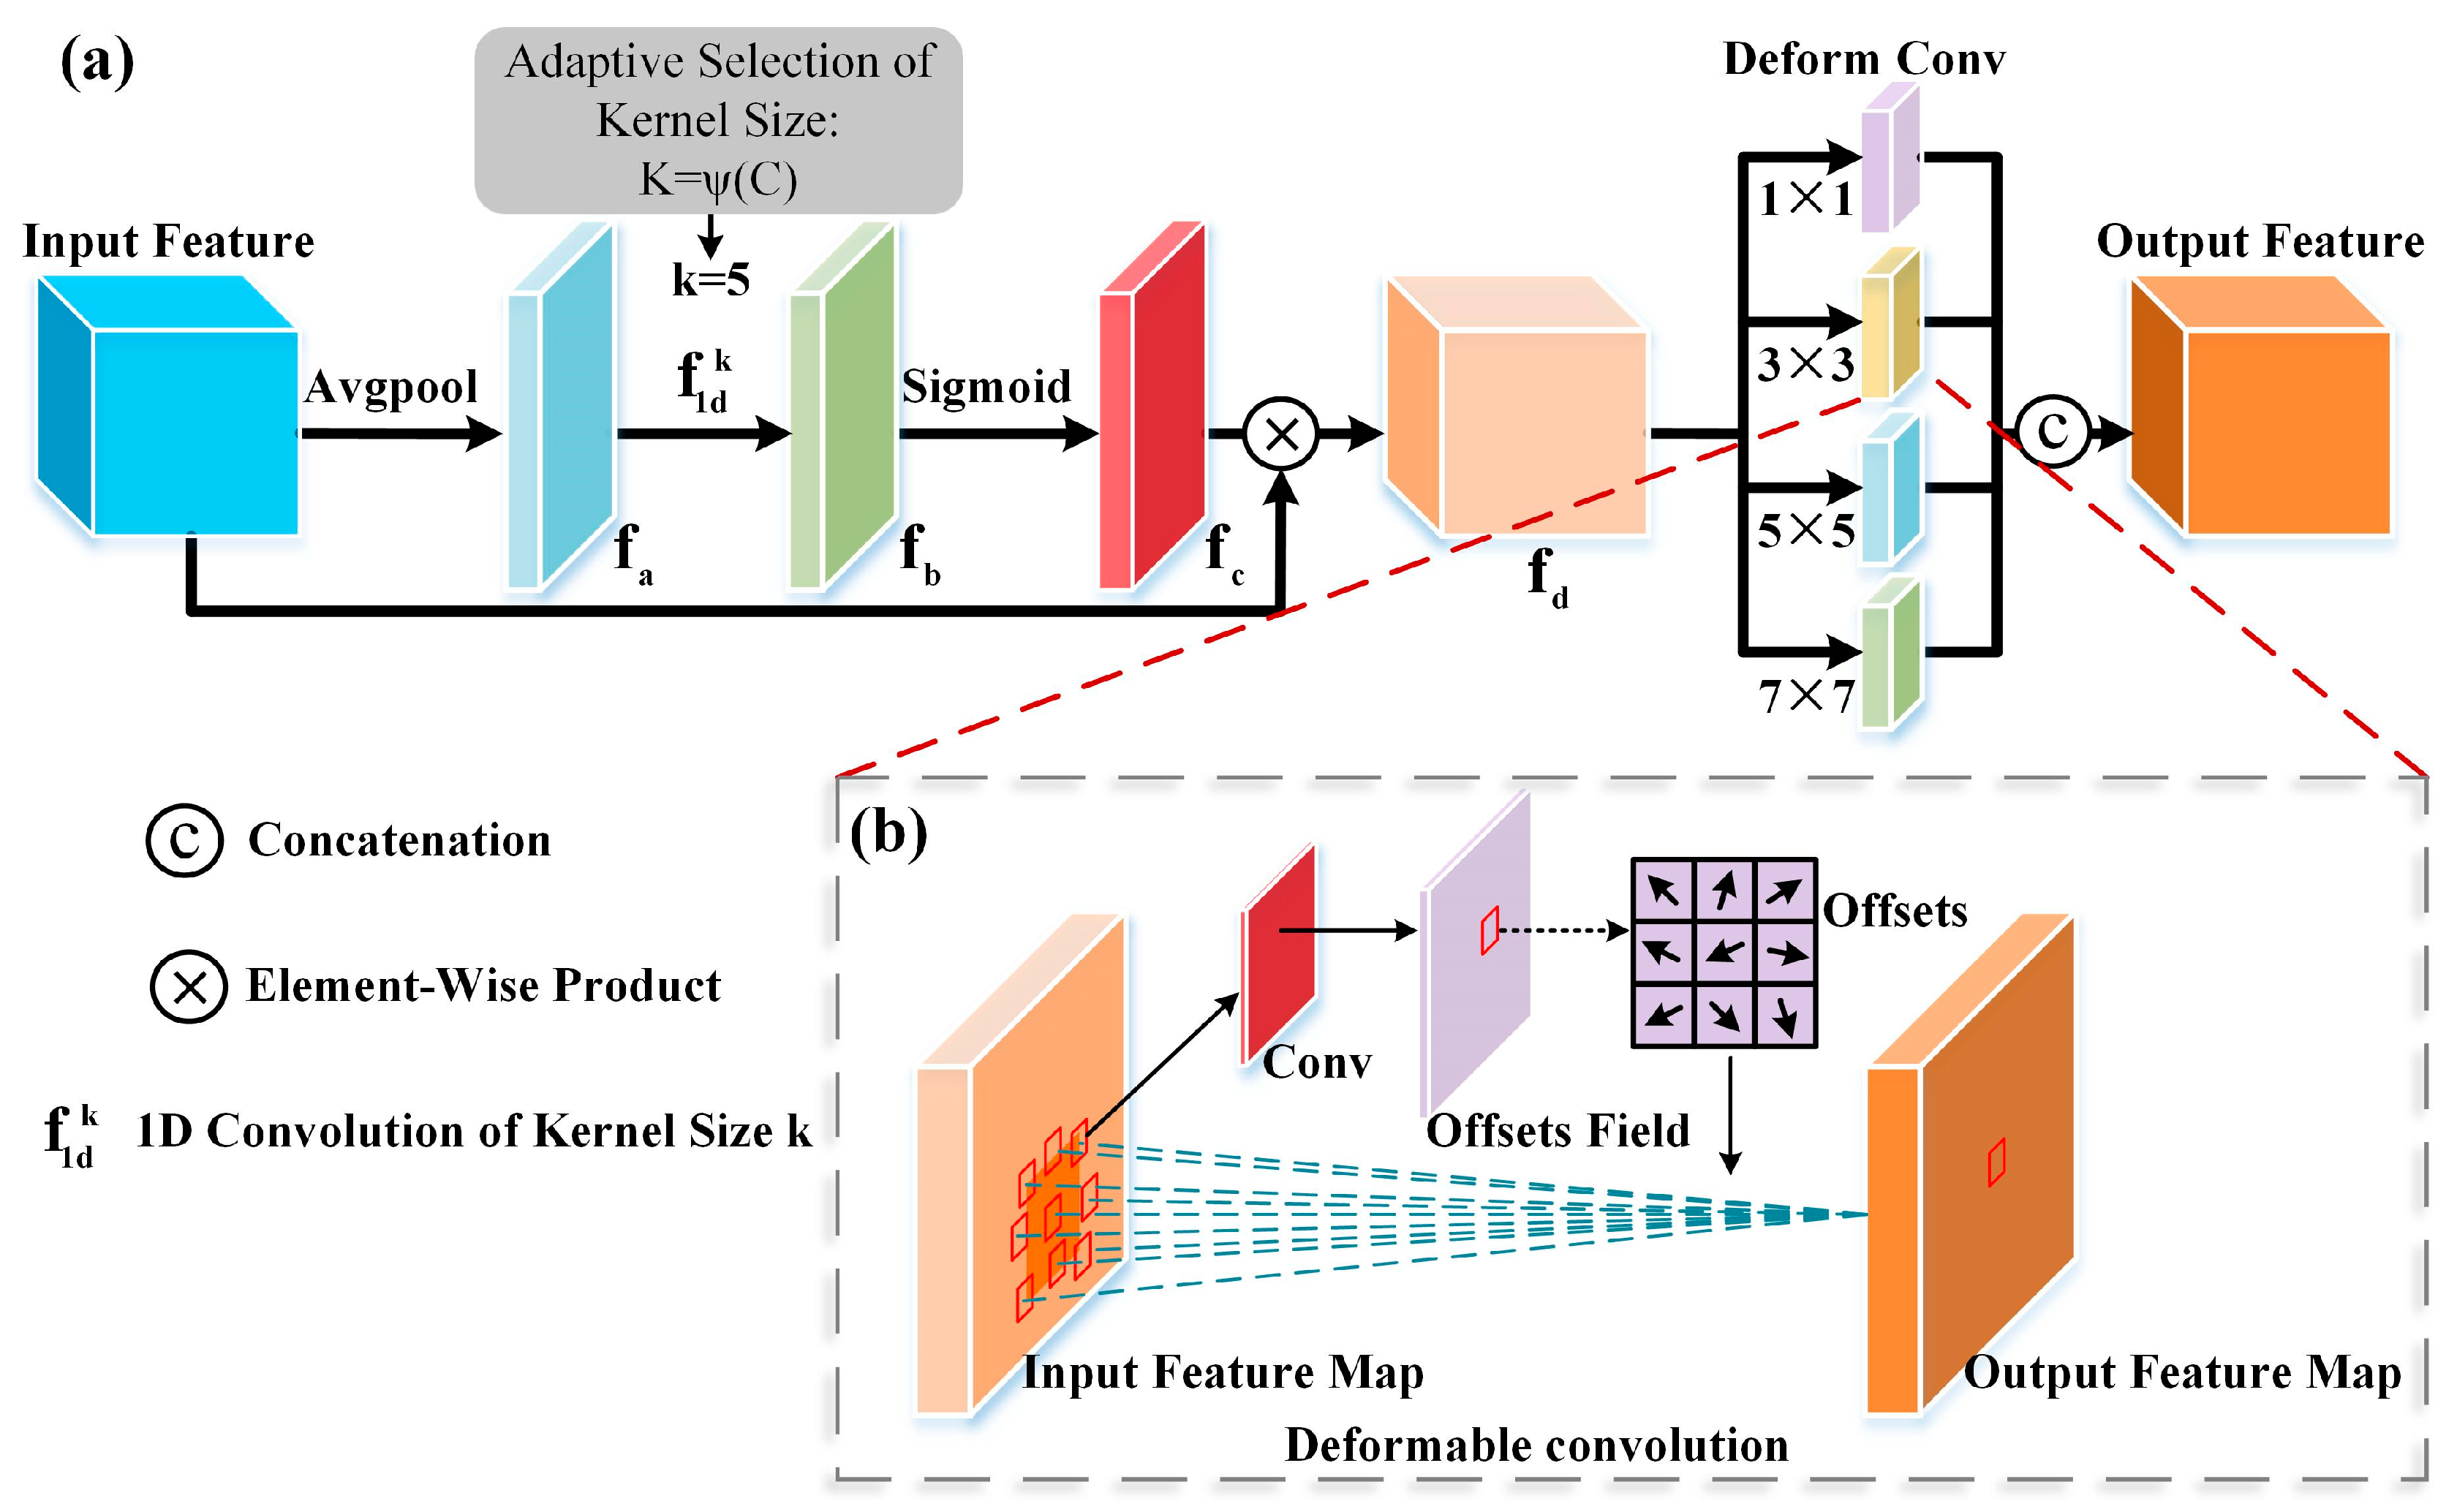
As shown in Figure 2a, the specific implementation of the EMF is as follows: The input features first enter the ECA Channel Attention Module, and the aggregated feature f a is obtained through global average pooling. Subsequently, a one-dimensional convolution is used to generate the channel attention weight f b , with a convolution kernel size of k = 5. Then, the f b is normalized by the sigmoid activation function to obtain the final channel attention weight f c . Element-wise multiplication of f c and the input features is performed to achieve adaptive optimization of channel features, obtaining f d . Then, f d enters the deformable convolution part with a feature pyramid structure. Before being input into the deformable convolution, the number of channels is reduced to 1/4 of the input feature channels via 1 × 1 convolution. The sizes of the deformable convolution kernels are 1, 3, 5, and 7, respectively, and the strides of all convolutions are set to 1. Through this process, multi-resolution features are simultaneously obtained. Finally, the multi-scale features are concatenated in the channel dimension to obtain the output feature map of the EMF.
In the EMF, deformable convolution conducts a new type of convolution calculation within an n × n grid. Offset values are set at each position in the n × n grid to perform the convolution operation. Its workflow is shown in Figure 2b.
The calculation process is described by Equations (1)–(3). In Equation (1), the original image feature f undergoes a traditional convolution operation within the regular grid R to obtain the output image feature z 1 .
z 1 ( p 0 ) = p n R w ( p n ) f ( p 0 + p n )
where w represents the weight to be updated, p 0 represents each position within the regular grid R , and p n represents the position during the traversal of R .
In Equation (2), within the regular grid R , an offset Δ p n is added to the position, and the original image feature f is convolved to obtain the output feature z 2 .
z 2 ( p 0 ) = p n R w ( p n ) f ( p 0 + p n + Δ p n )
In Equation (3), bi-linear interpolation G ( ) is used to calculate p and q .
g ( p ) = q G ( q , p ) f ( q )
where p represents an arbitrary position p = p 0 + p n + Δ p n , and q represents all spatial positions in the original feature map f .

3.3. Cross-Scale Adjacent Semantic Information Aggregation Module (CASAM)

Although we have incorporated the Multi-Scale Feature Extraction Module (EMF) into the CNN feature extractor, considering that the semantic features of R e s B l o c k _ i ( i = 1 , 2 , 3 ) in the backbone network are independent of each other. This implies that there may be information silos among these three R e s B l o c k , resulting in insufficient feature representation and affecting the performance of the model. Therefore, to make full use of the semantic information at different scales extracted by the encoder at various stages and further strengthen the information interaction of multi-scale semantic features, we introduce the CASAM to aggregate cross-scale adjacent semantic information, enabling information interaction and enhancement of multi-level scale features, and helping the network better capture the key features in the image.
Since this paper only inputs the features of R e s B l o c k _ i ( i = 1 , 2 , 3 ) in the backbone network, adjacent aggregation only occurs in cases of two adjacent scales and three adjacent scales. For this reason, we use three branches to form the entire module. The sizes of the feature maps f a ,   f b and f c are 2 H   ×   2 W   ×   C / 2 , H   ×   W   ×   C , and H / 2   ×   W / 2   ×   2 C , respectively. As shown in Figure 3.
The specific implementation of the CASAM is as follows:
(i) When aggregating two adjacent scales, first perform a 1 × 1 convolution on f b to integrate cross-channel information and introduce a non-linear transformation, optimizing the feature representation while keeping the number of channels unchanged, and output f b 1 . Meanwhile, on another branch, perform 1 × 1 and 3 × 3 convolutions, compressing the number of feature channels to half of the original, extracting and enhancing the effective channel information, and output f b 2 . If aggregating with the next scale, first perform 1 × 1 and 3 × 3 convolutions on f c , compressing the number of channels to half of the original and enhancing the features, then perform upsampling to restore its size to be consistent with f b , and output f c 1 . Subsequently, concatenate the two features along the channel dimension to obtain a richer feature map f d , then perform 1 × 1 and 3 × 3 convolutions to compress the number of channels to C and extract features, outputting f e . Finally, fuse the feature maps of the two scales by adding f e , f b 1 and f c 1 , enhancing the feature representation ability of the model, and finally output f f with a size of H   ×   W   ×   C . If aggregating with the feature map of the previous scale, perform max-pooling downsampling on f a , then perform a 3 × 3 convolution to expand the number of channels to C , effectively extracting local dominant features, and output f a 1 . The subsequent operations are similar to the above to fuse the feature maps of the two scales, and finally output f f with the same size of H   ×   W   ×   C .
(ii) When aggregating the semantic information of three adjacent scales, concatenate f a 1 , f b 2 and f c 1 along the channel dimension to form a feature map with a richer number of channels. Then, perform 1 × 1 and 3 × 3 convolutions to compress the number of channels to C and further extract feature information, outputting f e . Finally, perform an addition operation on f e , f a 1 , f b 1 and f c 1 to fuse the feature maps of the three scales, and finally output f f with a size of H   ×   W   ×   C . Finally, apply 3 × 3 and 1 × 1 convolutions to the fused feature maps f f generated in the three cases, respectively, to obtain a feature map f o u t with a unified number of channels of 32 to support subsequent module operations.

3.4. Differential-Perception-Enhanced Module (DPEM)

In the task of remote sensing change detection, the importance of each pixel in the image varies. Change targets such as building changes and wasteland changes need to be focused on, and these change areas usually only account for a small part of the image. Most traditional methods directly obtain differential semantics through pixel-level subtraction to extract change features. However, this approach hinders the network from learning the information of the difference map. Based on this, we propose the Differential-Perception-Enhanced Module (DPEM) to construct advanced differential semantic representations through a multi-dimensional feature regulation mechanism. First, the module constructs a cross-channel information interaction network with the help of a lightweight channel attention mechanism, adaptively enhancing the spectral–textural feature responses related to the change detection task, while suppressing redundant channel information to improve the pertinence of feature expression. Then, it uses the Spatial Attention module (SAM) to dynamically adjust the importance of each spatial position in the feature map. Finally, pixel-level subtraction is performed on the feature maps at two time instants to obtain high-quality feature differences, effectively suppressing the interference from background regions and highlight changes.
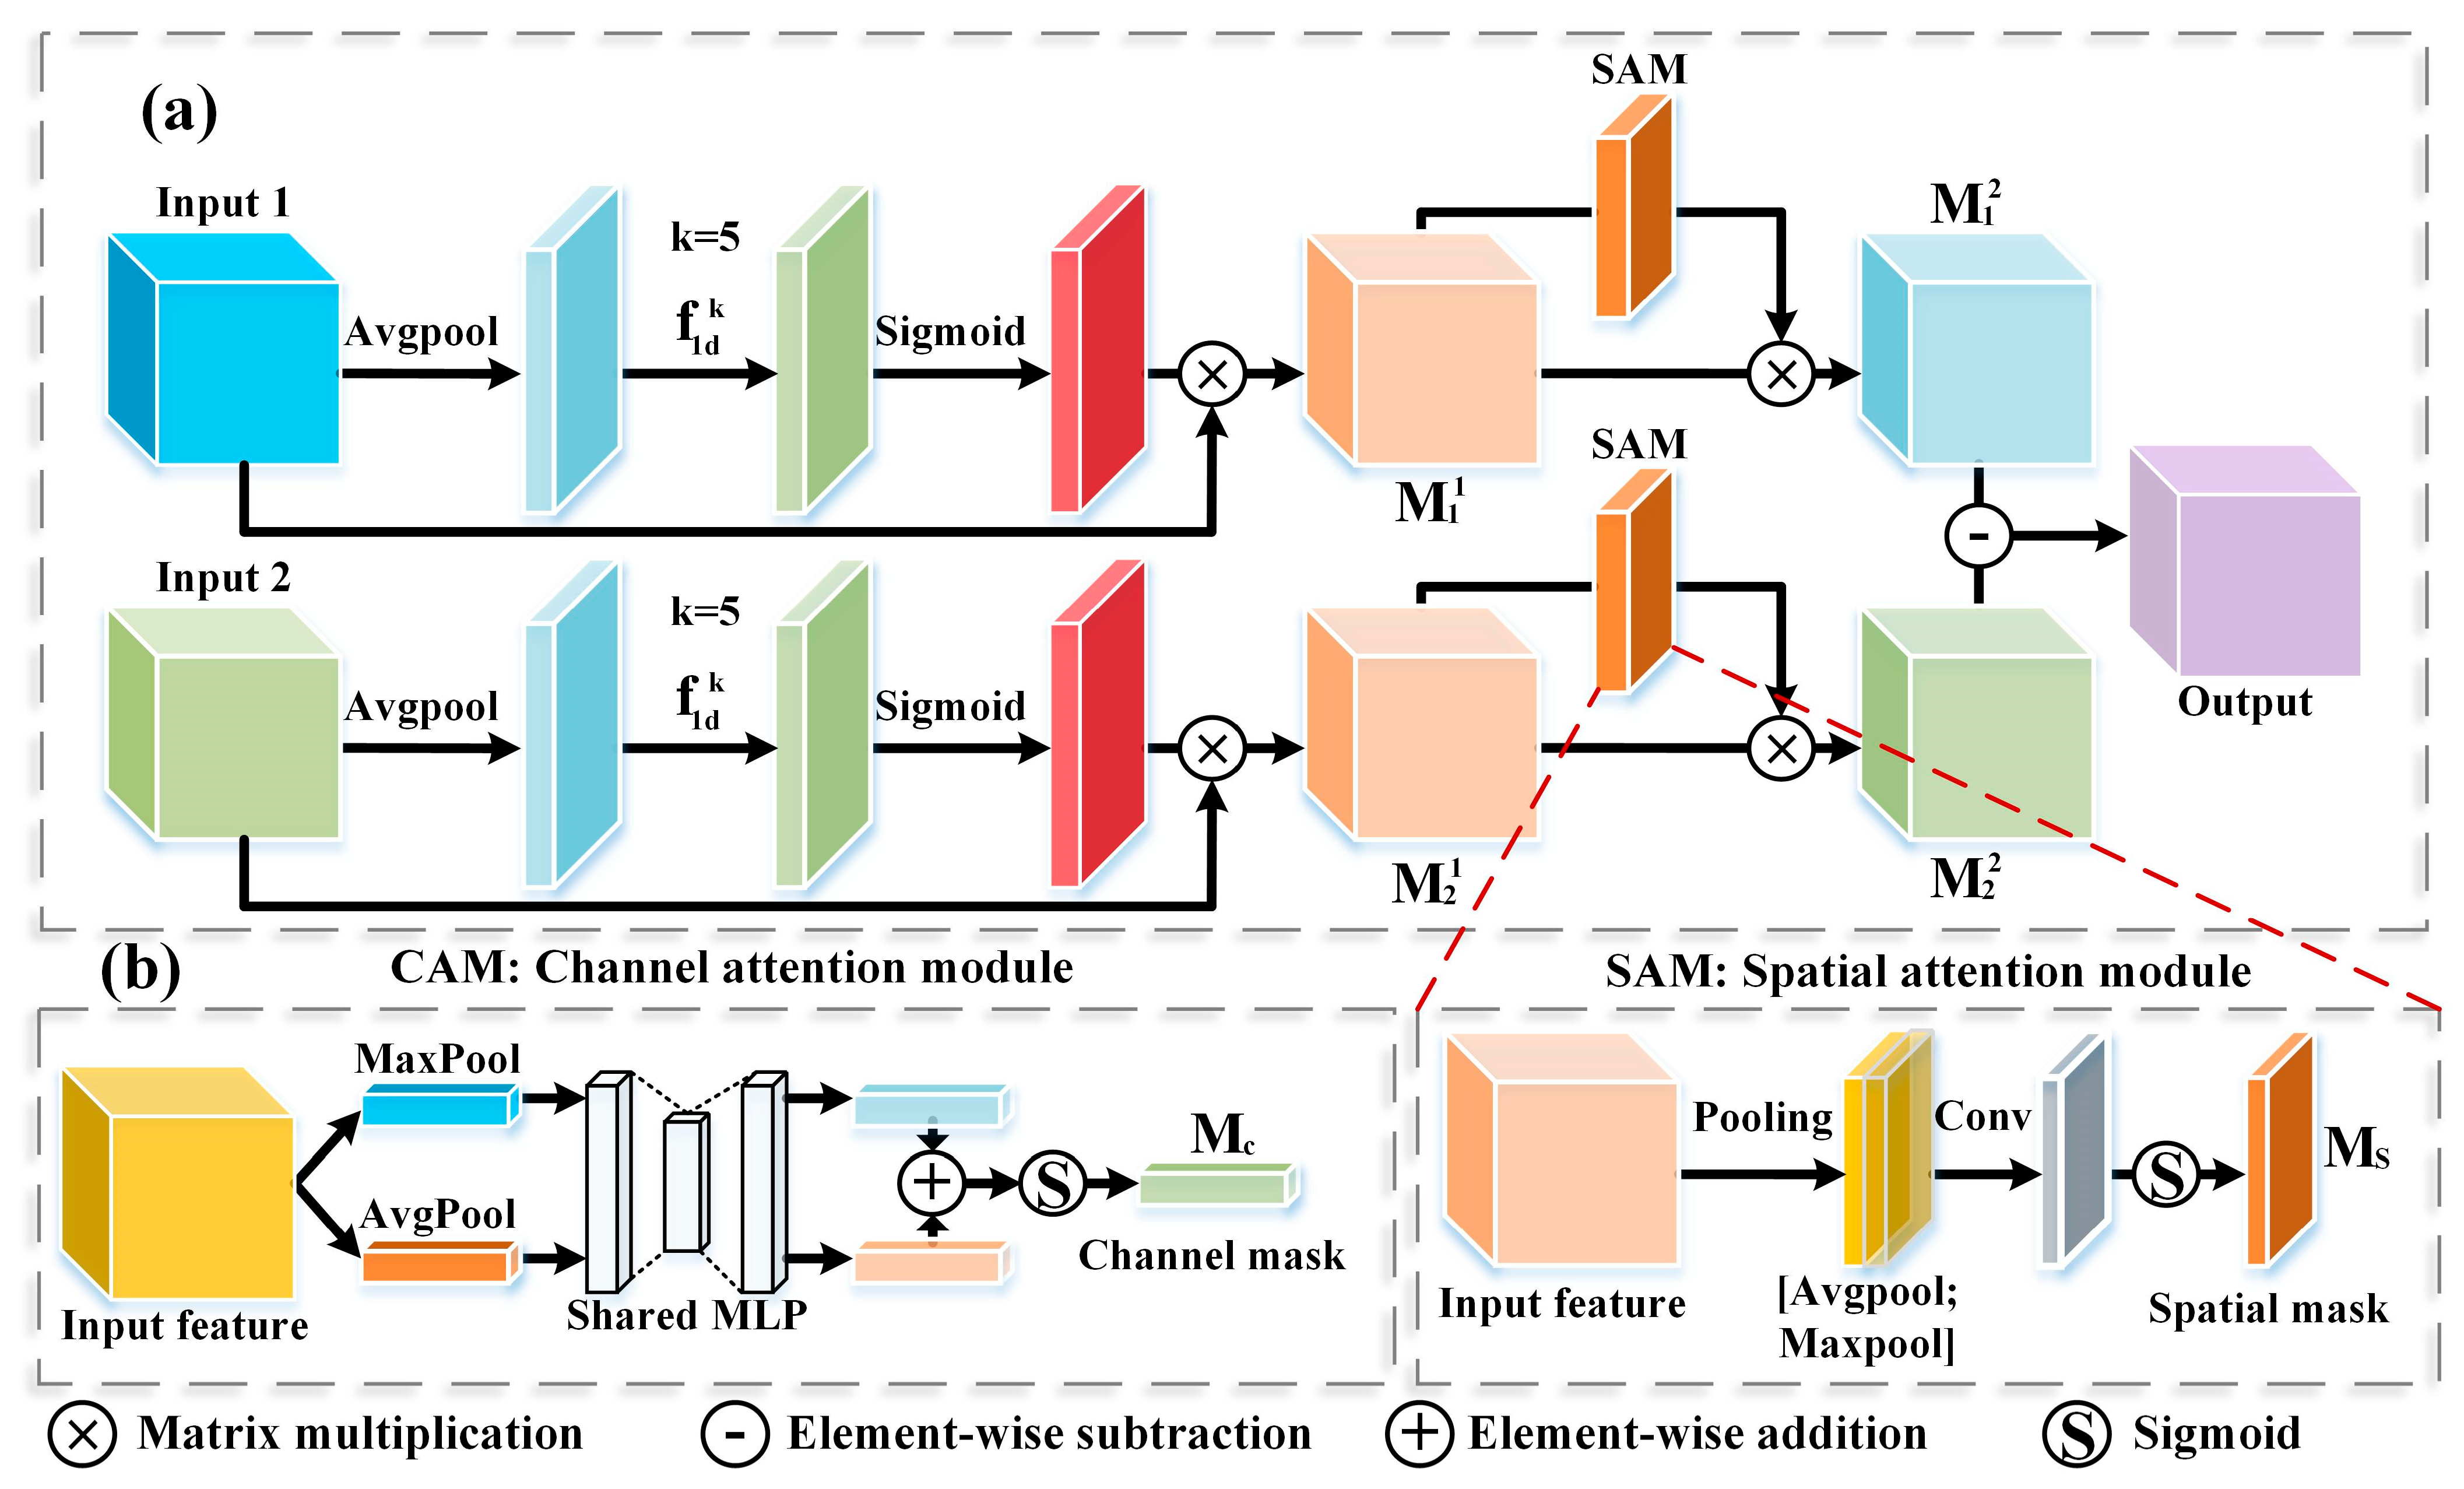
As shown in Figure 4a, the specific implementation of the DPEM is as follows: First, the global pooling unit is used to perform mapping and transmission on the input features I n p u t i ( i = 1 , 2 ) . Subsequently, a one-dimensional convolution is used to capture local cross-channel interactions and avoid the dimensionality reduction in the fully connected layer. Then, the feature map passes through the sigmoid layer to obtain a 1   ×   1   ×   C channel attention mask. Finally, the channel attention mask is multiplied by the input feature map to obtain the channel attention feature map M i 1 , as shown in Equation (4):
M i 1 = I n p u t i σ ( C o n v 1 D k ( A v g ( I n p u t i ) ) )
where I n p u t i represents the input feature map ( i = 1 , 2 ) , A v g ( ) represents global average pooling, C o n v 1 D k ( ) represents a one-dimensional convolution with a kernel size of k = 5 , σ ( ) represents the sigmoid activation function, and represents element-wise multiplication. M i 1 represents the channel attention feature map ( i = 1 , 2 ) .
To obtain the spatial attention feature map M i 2 ( i = 1 , 2 ) , average pooling, max-pooling, 7 × 7 convolution operation, and sigmoid operation need to be performed on M i 1 , as shown in Equation (5):
M i 2 = M i 1 σ ( f 7   ×   7 ( [ M a x ( M i 1 ) ; A v g ( M i 1 ) ] ) )
where M a x ( ) represents max-pooling, f 7   ×   7 ( ) represents a two-dimensional convolution with a kernel size of 7, and M i 2 represents the spatial attention feature map ( i = 1 , 2 ) .
Finally, pixel-level subtraction is performed on the channel–spatial feature maps M i 2 ( i = 1 , 2 ) containing the input feature maps at different times to obtain the differential-enhanced feature map o u t p u t , as shown in Equation (6):
o u t p u t = M 1 2 M 2 2

3.5. Transformer and Channel Attention Module (CAM)

Given that remote sensing images cover wide areas, change targets are discrete and have complex associations with the surrounding environment. Due to the inherent limitations of the local nature of convolutional operations, methods based solely on CNNs still struggle to capture long-range dependency features and achieve long-distance context modeling, even after multi-scale aggregation and differential perception enhancement. Therefore, as shown in Figure 1, we pass the features G i j ( 2 ) ( i { 1 , 2 } , j { 1 , 2 , 3 } ) and G 3 j ( 3 ) after multi-scale aggregation and differential perception enhancement through the Transformer module and CAM, respectively, to generate the feature maps G i j ( 4 ) ( i , j { 1 , 2 , 3 } ) . The Transformer uses encoder and decoder modules. Various Transformer modules [24,48] are plug-and-play in the proposed change detection network. We use the Transformer to model global context information, while the CAM models channel context information by highlighting channels related to changes. The following will introduce the CAM in detail. As shown in Figure 4b, the channel attention mask of the CAM is obtained through a dual-pooling strategy (average and max-pooling), shared MLP, and sigmoid normalization, as shown in Equation (7):
M i j ( k ) = σ ( M L P ( A v g ( G i j ( k ) ) ) + M L P ( M a x ( G i j ( k ) ) ) )
where G i j ( k ) represents the feature maps at different stages in Figure 1 and M i j ( k ) represents the channel attention mask corresponding to the input feature G i j ( k ) in Figure 4b, where i , j { 1 , 2 , 3 } , k { 2 , 3 } . M L P ( ) represents a multi-layer perceptron, which consists of two linear layers and a ReLU activation function.
Define T ( G i j ( k ) ) as the output of G i j ( k ) when passed into the Transformer module. Finally, the feature map G i j ( 4 ) is obtained through the CAM, as shown in Equation (8):
G i j ( 4 ) = T ( G i j ( k ) ) M i j ( k )

3.6. Overall Loss Function

As shown in Figure 1, in this paper, the feature maps G i j ( 4 ) with the same scale are finally concatenated along the channel dimension to obtain three fused feature maps G i ( i { 1 , 2 , 3 } ) . Then, these three fused feature maps are upsampled to the original image size and input into their respective CNN-based classifiers, which have the same structure. Finally, three predicted maps P i are output by the CNN-based classifiers. Let Y be the ground-truth value. Then the overall loss function of MDNet based on cross-entropy (CE) loss is:
L t o t a l = L c e ( P 1 , Y ) + L c e ( P 2 , Y ) + L c e ( P 3 , Y )
where L c e ( P 1 , Y ) is the cross-entropy loss between the predicted change map P 1 and the ground-truth value Y , and the same applies to L c e ( P 2 , Y ) and L c e ( P 3 , Y ) .

4. Experiments

This section validates the effectiveness of the proposed MDNet. First, three benchmark datasets are described, followed by the introduction of five comparison methods, and then experimental details and indicators are provided. To verify the effectiveness of different modules, ablation experiments of MDNet were carried out. In addition, the change detection results of MDNet and the performance of each comparison method on the datasets were analyzed and discussed.

4.1. Dataset Introduction

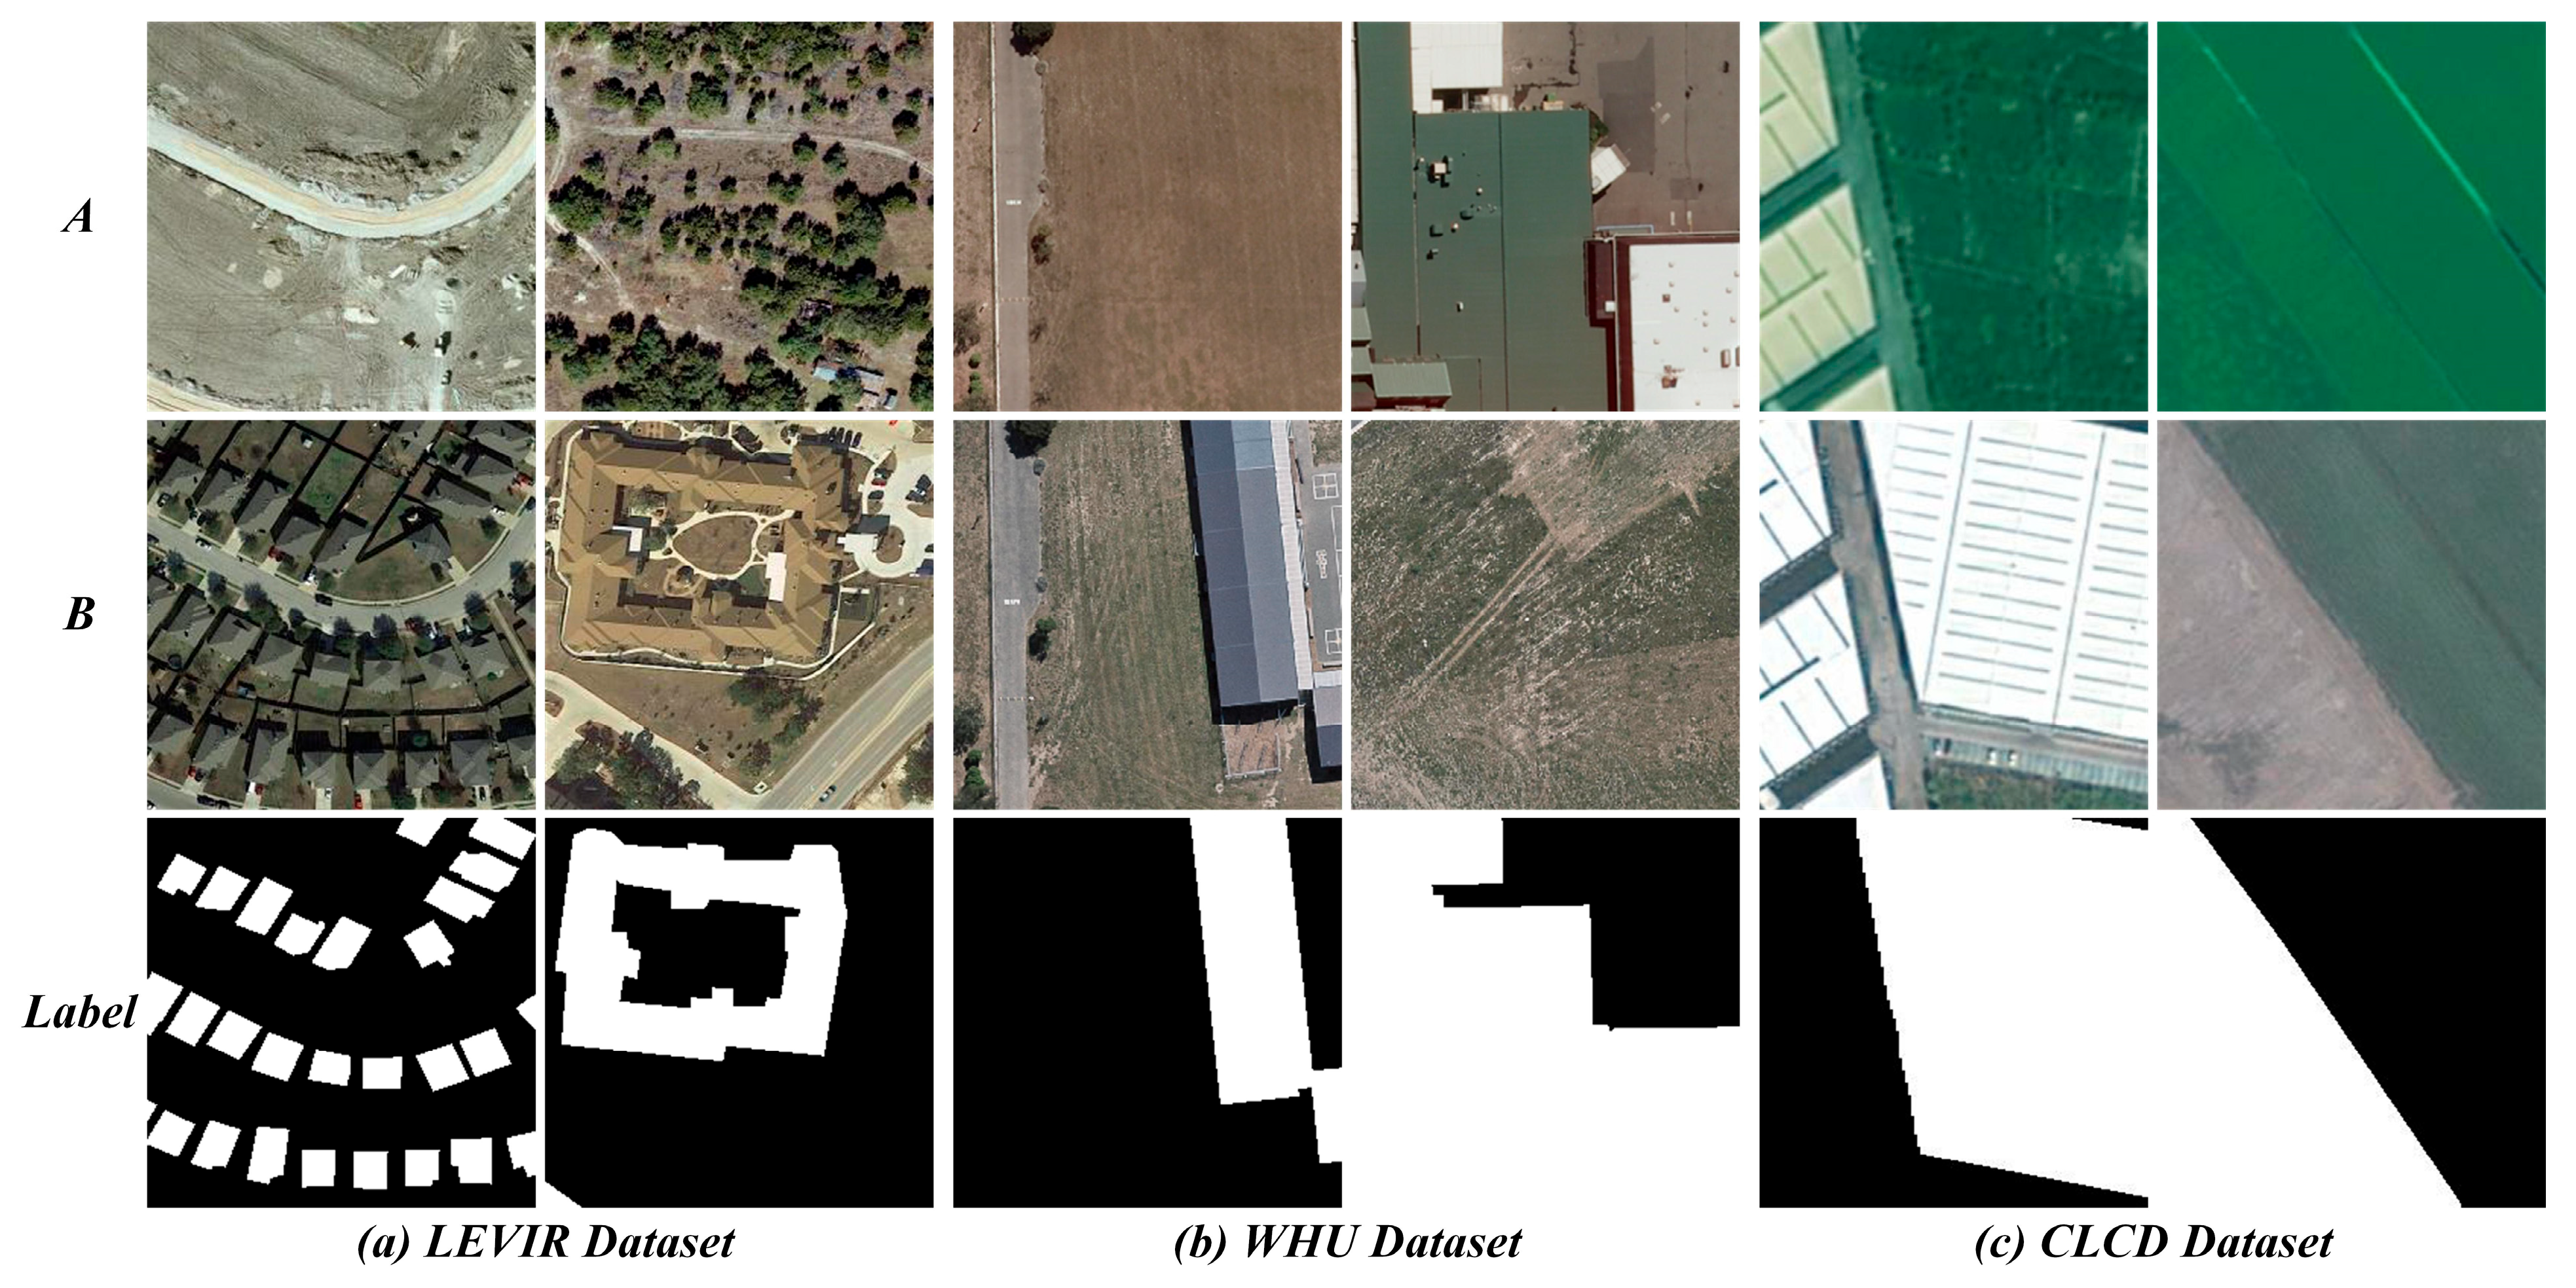
As shown in Figure 5. We evaluate our method on three diverse open-source datasets: LEVIR-CD, WHU-CD, and CLCD.
LEVIR-CD is a public dataset for land use change detection, containing 637 pairs of very-high-resolution (VHR, 0.5 m/pixel) bi-temporal image patches from Google Earth. Each patch is 1024 × 1024 pixels with a time span of 5–14 years, focusing on key challenges of land use changes such as building growth. It covers diverse building types including villas, high-rise apartments, small garages, and large warehouses. The dataset follows a 7:2:1 ratio division rule, where original images are non-overlappingly cropped into 16 sub-images of 256 × 256 pixels, finally forming a training set (7120 pairs), a test set (2048 pairs), and a validation set (1024 pairs).
WHU-CD is a public dataset for building change detection, containing a pair of high-resolution (HR) bi-temporal aerial images with a resolution of 0.2 m and size of 32,507 × 15,354 pixels. It focuses on areas that have experienced earthquake disasters and reconstruction over the years, mainly recording change scenarios such as building renovations. Through non-overlapping cropping, the original images were divided into 256 × 256 pixel sub-image patches, finally forming a training set (5947 samples), a validation set (744 samples), and a test set (744 samples).
The CLCD dataset is a public dataset for farmland change detection, containing 600 pairs of high-resolution bi-temporal remote sensing images taken in Guangdong Province, China, in 2017 and 2019. Each image is 512 × 512 pixels with a spatial resolution ranging from 0.5 to 2 m, covering land cover types such as buildings, roads, lakes, and bare land. To adapt to model input, the original images were non-overlappingly cropped into 256 × 256 pixel sub-images, finally forming 2400 pairs of samples. The dataset was divided into a training set (1440 pairs), a validation set (480 pairs), and a test set (480 pairs) according to a 6:2:2 ratio.

4.2. Compared Methods

To verify the effectiveness and superiority of MDNet, several state-of-the-art change detection methods were selected as comparison methods, including pure convolution-based methods, attention-based methods, Transformer-based methods, hybrid CNN–Transformer methods, and semi-supervised methods. The brief descriptions are as follows:
(i) FC-EF [49] is a change detection model that combines the U-Net architecture with the characteristics of fully convolutional networks. It adopts an early fusion strategy, splicing two bi-temporal images in the channel dimension to form a unified feature representation.
(ii) SNUNet [50] realizes hierarchical extraction of multi-level features through a weight-sharing NestedUNet architecture, optimizes intermediate-layer feature representation by embedding a channel attention mechanism, and further strengthens the effective fusion of multi-semantic level features.
(iii) BiT [30] is a Transformer-based network model, in which the encoder is designed to model the spatio-temporal context of compact pixel-level information, and then the decoder is used to optimize the original features.
(iv) AMTNet [51] is a feature-interactive siamese network based on a CNN–Transformer architecture, which realizes efficient modeling of contextual information in bi-temporal images through an attention mechanism and Transformer modules.
(v) WS-Net++ [52] is a semi-supervised change detection model that integrates CNN and wavelet transform. It analyzes the spatial and frequency domain features of images through wavelet transform to enhance boundary integrity, reduces the difference between unchanged and changed regions by means of semi-supervised methods, and reduces false detections while improving detection accuracy.

4.3. Implementation Details and Metrics

MDNet and all comparison models were implemented in the PyTorch(2.1.0) framework based on an NVIDIA GeForce RTX 4080 GPU. The parameter configurations of all comparison algorithms strictly follow the settings in the original literature. MDNet uses ImageNet-pre-trained ResNets as the CNN backbone. Without losing generality, we used the Transformer module of AMTNet [51] in the experiments. During the training phase, the input image size was set to 256 × 256 pixels. The model was trained for 200 epochs using an AdamW optimizer with a batch size of eight, an initial learning rate of 1 × 10⁻⁴, and weight decay of 0.01. The backbone network was ResNet-50. During the testing phase, only P 3 was used to generate the final result as the predicted change map.
To analyze the performance of MDNet and the comparison algorithms, we used the four most commonly used metrics for change detection tasks, including precision (Pre), recall (Rec), F1-score (F1), and Intersection over Union (IoU).

4.4. Ablation Experiments and Result Analysis

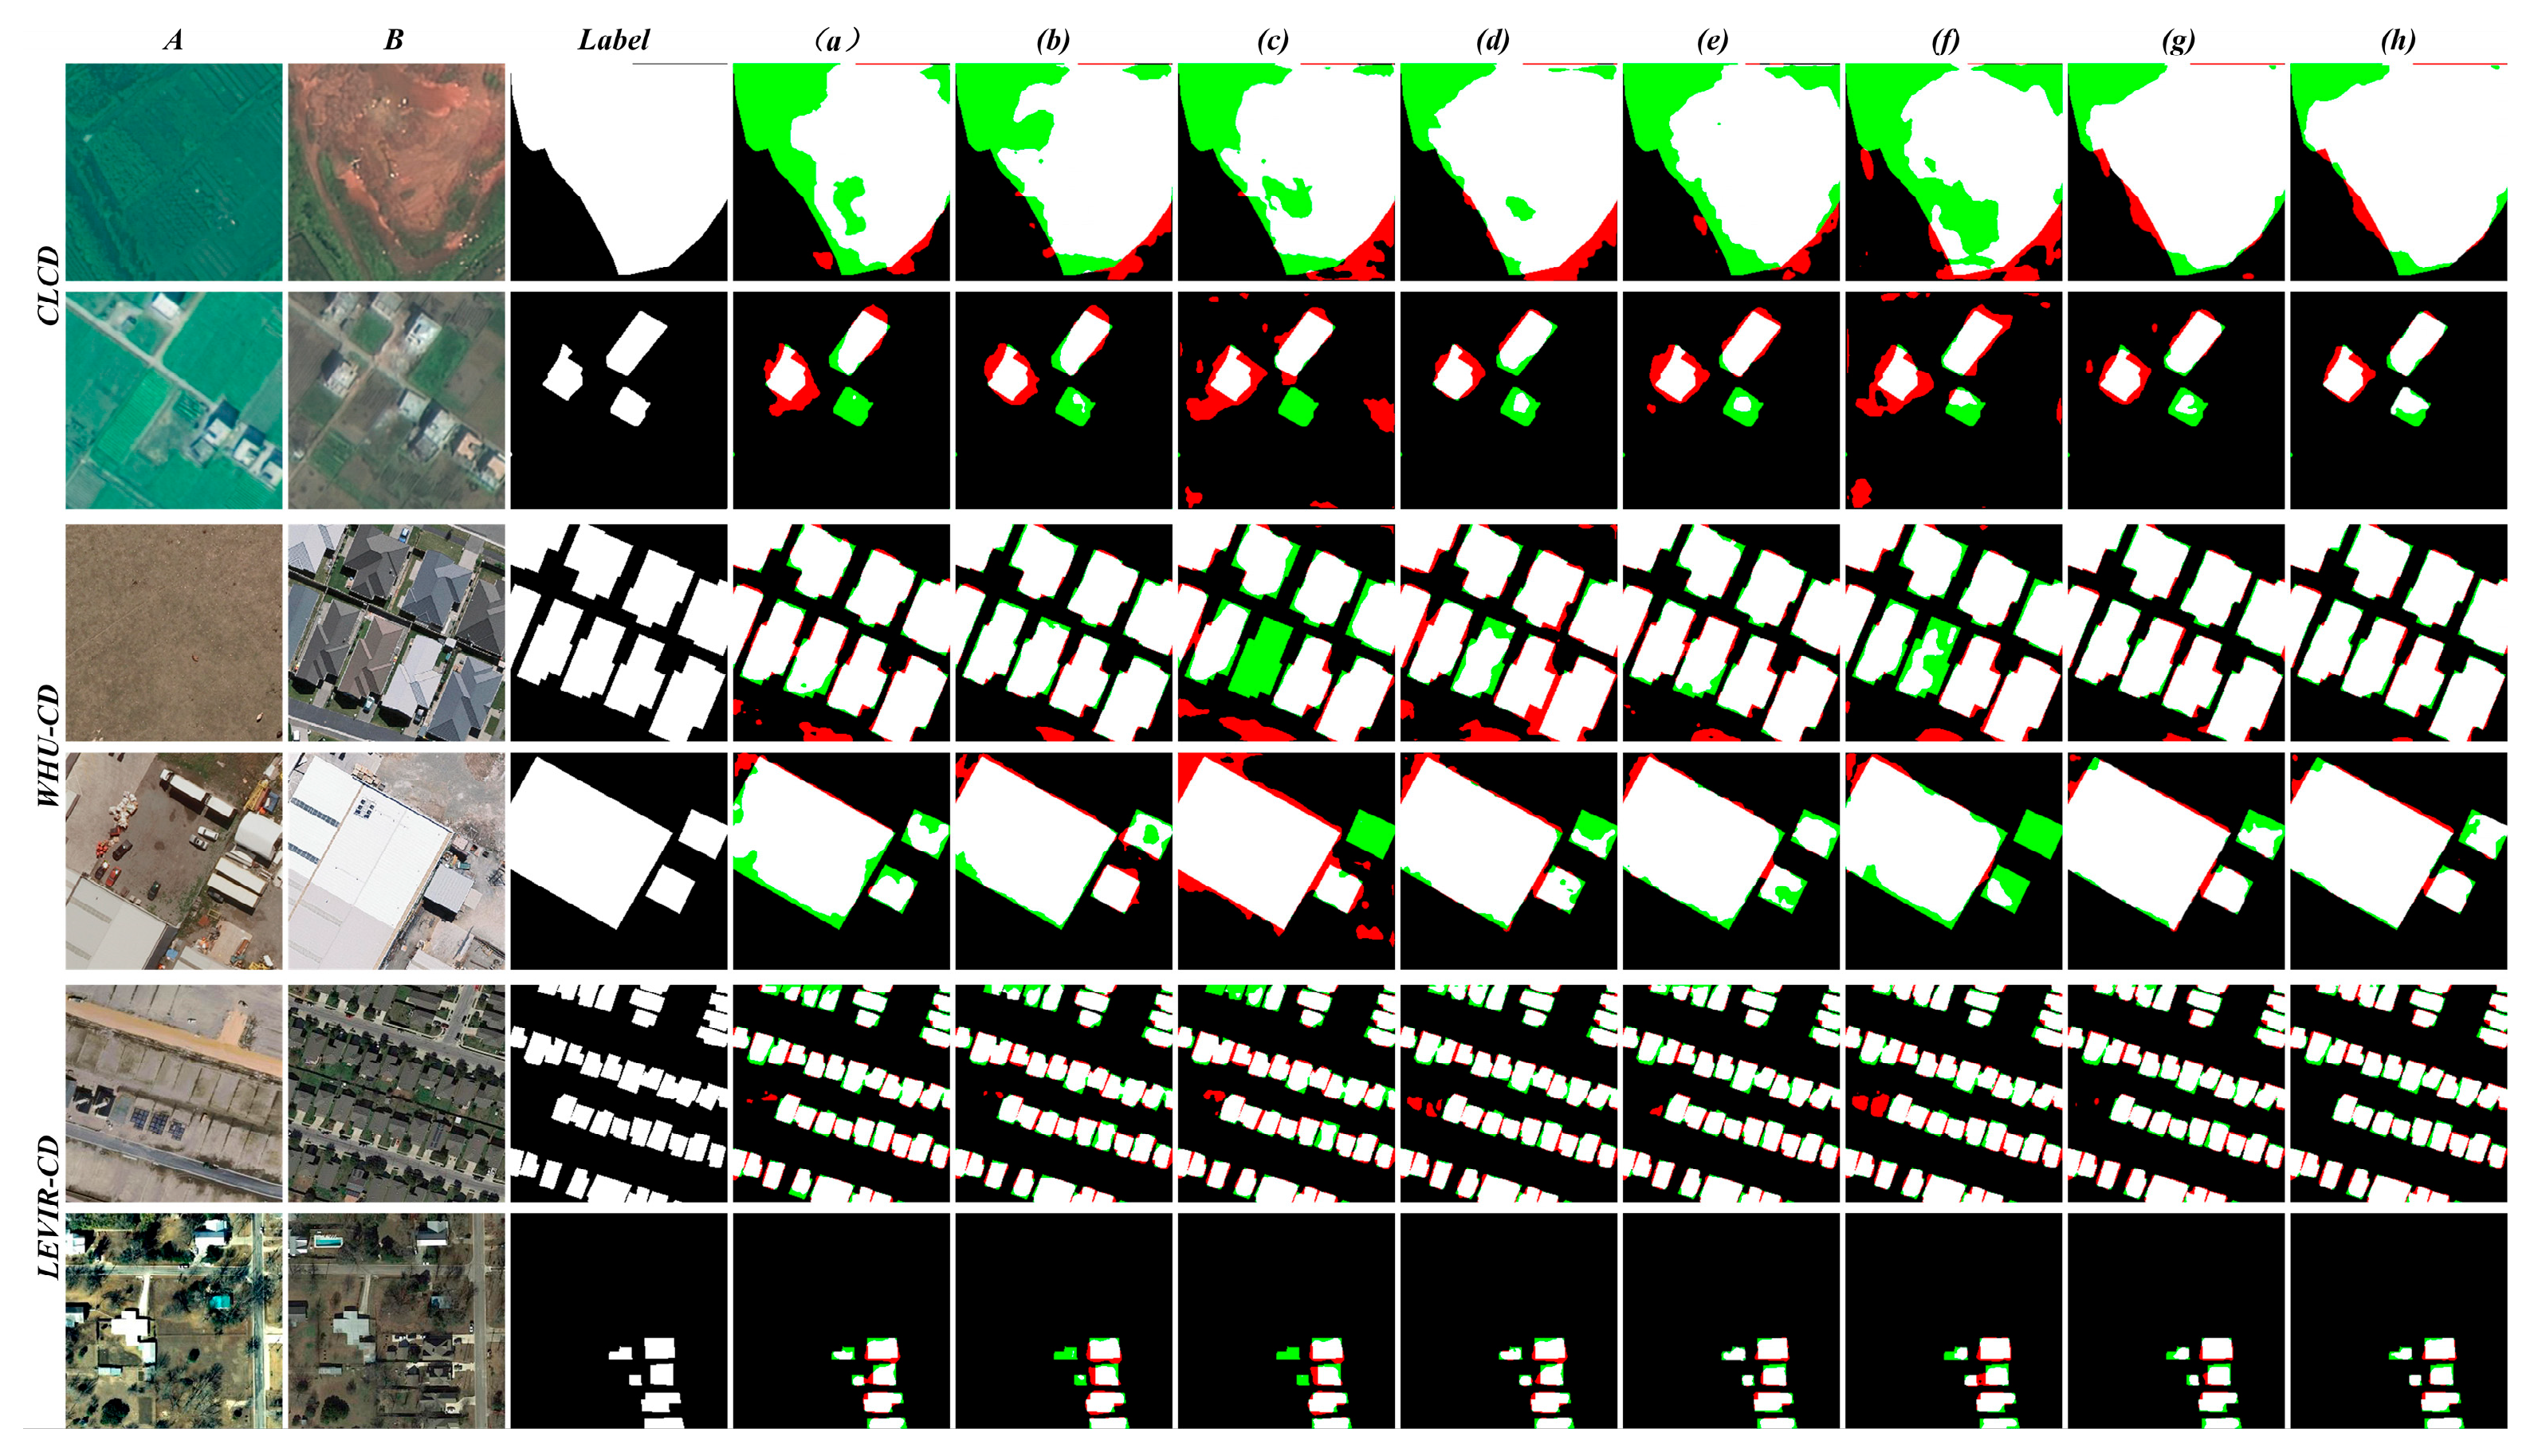
To quantitatively analyze the contribution of each module of MDNet to the overall model performance, we conducted systematic ablation experiments on three benchmark datasets: LEVIR-CD, WHU-CD, and CLCD. By removing key modules in MDNet and comparing the analysis results under uniform experimental settings, the influence degree of each module was effectively quantified. The specific ablation experiment design and results are shown in Table 1 and Figure 6.

4.4.1. EMF

The EMF can extract semantic features under different receptive fields, effectively capturing change targets of various sizes. The data in the first row of Table 1 show that removing the EMF causes the IoU scores for LEVIR-CD, WHU-CD, and CLCD to decrease by 1.73%, 1.55%, and 2.04%, respectively, with the F1 values also decreasing accordingly. The visualization results in Figure 6, Column a, further show that in the LEVIR-CD scene, the green areas increase, leading to missed detections of multiple small buildings, and the farmland edge changes in CLCD are blurred, indicating that the EMF is crucial for the detection of small and diverse targets. The above experimental results, from both quantitative data and qualitative analysis, collectively verify the importance of the EMF in our network architecture.

4.4.2. CASAM

The CASAM can effectively integrate multi-scale semantic information extracted at different stages of the CNN backbone network, enhance the information interaction and semantic consistency of multi-level scale features, and solve the problem of semantic discontinuity caused by scale jumps. To verify the necessity of this module, the CASAM was removed via ablation experiments for comparative analysis. The data in Row 2 of Table 1 show that removing the CASAM causes the IoU and F1 metrics of the three datasets to exhibit a downward trend. Among them, the F1 value of the WHU-CD dataset decreases by 1.65%, as building changes in this scene mostly have clear structural boundaries and rely on cross-layer feature fusion to improve contour representation accuracy. The visualization results in Column b of Figure 6 further demonstrate that after removing the CASAM, green patches with broken boundaries appear in the building change areas of the WHU-CD dataset, confirming that the lack of cross-layer feature aggregation leads to the loss of ground object structure information. The above experiments, from the two dimensions of quantitative indicators and qualitative visualization, collectively confirm that the CASAM plays an indispensable role in the change detection network proposed in this paper.

4.4.3. DPEM

The DPEM explicitly models spectral–structural differences by calculating bi-temporal feature disparities, effectively suppressing pseudo-change interferences caused by factors such as illumination variations and seasonal fluctuations. The data in Row 4 of Table 1 indicate that the model equipped with this module improves F1-scores by 2.17%, 2.21%, and 1.26% on the LEVIR-CD, WHU-CD, and CLCD datasets, respectively. The significant improvement on WHU-CD is closely related to the susceptibility of shadows and vegetation to be misclassified as changes in urban scenes. Conversely, the 1.08% decrease in IoU on CLCD reflects the necessity of enhancing features for low-contrast differences in farmland. The visualization results in Column d of Figure 6 show that the model without the DPEM generates numerous red noise points in the vegetation areas of CLCD, visually verifying the module’s ability to filter out pseudo-changes. The above experimental results show that the absence of the DPEM significantly weakens the model’s ability to capture complex difference patterns, confirming the key role of the differential feature enhancement mechanism in change detection tasks.

4.4.4. Transformer

Transformer captures long-range dependencies through self-attention mechanisms, constructs global contextual associations, and compensates for the locality limitations of convolutional operations. To verify its impact on model performance, this module was removed through ablation experiments for comparative analysis. The data in Row 5 of Table 1 show that the IoU scores of the model without Transformer decrease by 1%, 1.63%, and 1.82% on LEVIR-CD, WHU-CD, and CLCD datasets, respectively, with F1 values showing a concurrent downward trend. Among them, the impact on LEVIR-CD is minor, but the impact on CLCD is significant because the farmland scene requires global semantic associations to distinguish dispersed changes. The visualization results in Column e of Figure 6 show that large areas of edge defects and locally missed green areas appear in the farmland regions of CLCD, indicating that the lack of global modeling capability causes the model to rely solely on local contextual information, making it difficult to effectively integrate multi-regional structural features and thus affecting change detection accuracy. The above experiments, from both quantitative indicators and visual representations, collectively verify the critical role of Transformer in the change detection network proposed in this paper.

4.4.5. CAM

The CAM achieves targeted optimization of network representation by focusing on channel features that play a key role in change analysis. To verify its necessity, ablation experiments were conducted by removing this module. The data in Row 7 of Table 1 show that although removing the CAM yields performance close to the complete model on LEVIR-CD and WHU-CD, the F1-score on the CLCD dataset decreases from 78.68 to 78.23, representing a 0.45% reduction. This indicates that it is more important for feature selection in low-contrast scenarios. The visualization results in Column g of Figure 6. show that the model without the CAM misdetects some shadow areas in the CLCD scene, with red false detection spots appearing. This confirms that the channel attention mechanism effectively enhances the robustness of feature expression by suppressing redundant channel information. The above experiments confirm the positive impact of the channel attention mechanism on fine-grained change analysis from both quantitative indicator differences and qualitative visual representations.

4.4.6. EMF + CASAM

The EMF and CASAM adopt a parallel architecture design in the network, achieving collaborative extraction of multi-scale features through functional complementarity. The ablation experiment data in Table 1 show that removing either module alone only causes partial degradation of model performance, while removing both modules simultaneously makes the model completely lose the ability to extract multi-scale features. The F1 and IoU metrics on the three datasets all show significant degradation, with F1-scores decreasing by 2.67%, 3.32%, and 7.3%, respectively, and the corresponding decreases in IoU metrics reaching 3.31%, 4.85%, and 6.31%, verifying the complementarity of the two in multi-scale feature modeling. The visualization results in Column c of Figure 6. show that the model missing the EMF + CASAM misses the detection of multiple small building changes in the LEVIR-CD scene, with a significant increase in green areas, confirming the key role of cross-scale feature fusion in small-target detection. In the WHU-CD scene, due to the similarity between the land color in period A and the roof color in period B, the limitation of single-scale representation makes it difficult to distinguish the target area due to color confusion, resulting in missed detection.
Further analysis shows that the collaborative absence of the two modules causes the model to fail in integrating multi-level semantic information and cross-scale structural features—it can neither capture the fine features of small targets through the pyramid structure nor use cross-layer interaction to enhance the structural coherence of large-scale regions, especially causing significant missed detections in small-target detection scenarios. This phenomenon reveals that the adaptive representation of multi-scale features for target size differences is crucial. In the absence of multi-path feature interaction, the model’s ability to model pixel-level details and contextual dependencies is simultaneously weakened, ultimately leading to a comprehensive decline in detection performance. The experimental results fully verify the necessity of the EMF + CASAM in the change detection network proposed in this paper.

4.4.7. DPEM + Transformer

The DPEM and Transformer adopt a serial architecture design in the network, significantly enhancing the model’s adaptability to multi-scale targets and complex backgrounds through a closed-loop collaborative mechanism of “local difference enhancement–global context integration”. The ablation experiment data in Table 1 show that when both modules are removed simultaneously, the F1 and IoU metrics of the three datasets all exhibit significant degradation. The F1-scores decrease by 2.48%, 3.07%, and 6.44% on the LEVIR-CD, WHU-CD, and CLCD datasets, respectively, and the corresponding decreases in IoU metrics reach 2.99%, 4.35%, and 5.79%. This performance loss significantly exceeds the effect of removing either module alone, revealing that the synergistic effect of the two has a non-linear superposition characteristic. The visualization results in Column f of Figure 6 show that the model missing both the DPEM and Transformer has significant red false detection spots in the LEVIR-CD scene; a large area of green missed detection regions in the WHU-CD dataset; and in the CLCD scene, the farmland boundaries have large-area defects and the red change regions are sporadically distributed, reflecting a decrease in pseudo-change suppression ability.
This “local–global” collaborative modeling mechanism not only improves the feature distinguishability between change regions and backgrounds through difference enhancement but also enhances the semantic consistency of cross-temporal features via context integration. This forms multi-level suppression of pseudo-change interferences and multi-dimensional enhancement of real change signals. The experimental results not only verify the necessity of the DPEM + Transformer in the change detection network proposed in this paper but also provide a new solution path for simultaneously addressing scale diversity and background interference issues in complex scenarios.

4.4.8. Complete Model

The data in Row 8 of Table 1 show that the complete model achieves optimal performance on all three datasets, with F1-scores of 91.56%, 94.77%, and 78.68% on LEVIR-CD, WHU-CD, and CLCD, respectively, verifying the necessity of the multi-module collaborative design. The EMF and CASAM ensure the fine-grained detection of multi-scale targets and the DPEM and Transformer jointly optimize the discriminability of difference features and contextual relevance, while the CAM further refines feature weights. Column h of Figure 6 shows that the complete model has the least red and green area in all datasets. Especially in the complex farmland scene of the CLCD, it has the fewest red and green noise points, reflecting the model’s strong robustness against background interference. Through multi-path feature interaction and cross-mechanism collaboration, it forms a complete optimization chain from feature extraction and cross-scale aggregation to difference enhancement and context modeling, providing an effective solution for change detection tasks in complex environments.

4.5. Comparative Experiment and Result Analysis

4.5.1. Comparisons on the LEVIR-CD Dataset

Table 2 presents the quantitative performance evaluation results of each method. On the LEVIR-CD dataset, our proposed MDNet method significantly outperforms all comparative methods in recall, F1-score, and IoU metrics, demonstrating optimal performance. Although MDNet has an accuracy of 92.25%, slightly lower than WS-Net++’s 93.32%, it achieves a good balance between accuracy and recall (both exceeding 90%), effectively balancing false positives and false negatives. Compared with the suboptimal method WS-Net+++, MDNet improves the F1-score by 0.6% and IoU by 0.54%, indicating its stronger robustness against land cover scale diversity and complex background interferences. Compared with the BiT method, which relies on pure Transformer for spatio-temporal context modeling, MDNet combines Transformer and the CAM to balance local details and global contextual information. The F1-score of 89.31% for BiT is significantly lower than that of MDNet, further confirming the complementary advantages of the two mechanisms.
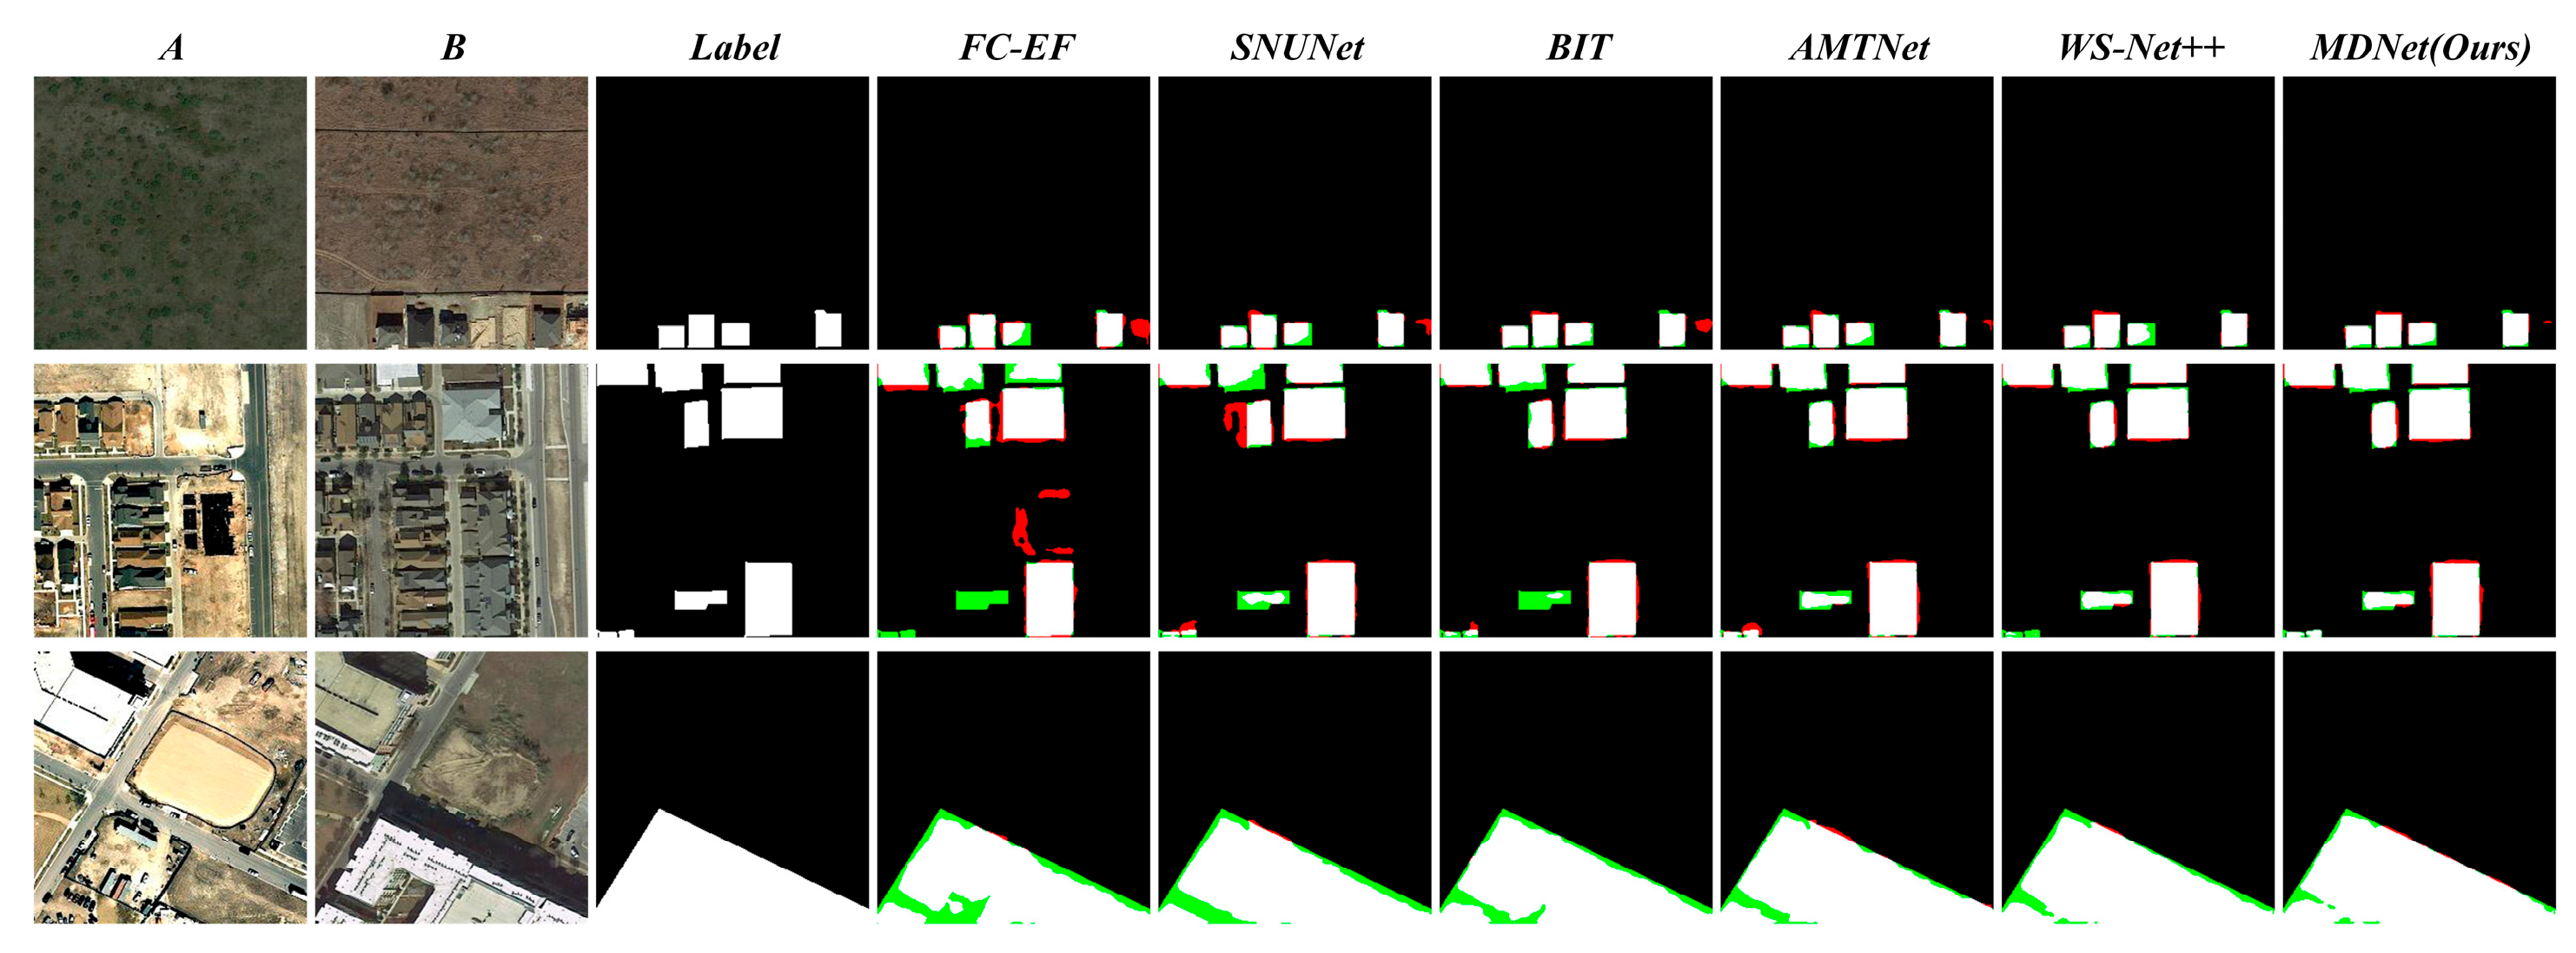
The qualitative visualization comparison results are shown in Figure 7, where the prediction results of different methods in typical scenarios differ significantly. In the first-row samples, methods such as FC-EF and SNUNet show significant missed detections (FNs, green areas) and false positives (FPs, red areas) in small building change regions, while MDNet, with the help of the EMF and CASAM, completely preserves detail information and effectively reduces missed detections and false positives. In the second- and third-row samples, MDNet significantly reduces green missed detection area compared with comparative methods, reflecting its effectiveness in distinguishing true change regions. The DPEM in MDNet explicitly enhances the spectral–structural differences in change regions, combined with Transformer and attention mechanisms to refine context modeling, minimizing misclassification.

4.5.2. Comparisons on the WHU-CD Dataset

Table 3 presents the performance comparison of each method on the WHU-CD dataset. MDNet demonstrates comprehensive advantages in complex urban building change scenarios, with a recall of 93.84%, F1-score of 94.77%, and IoU score of 90.21%, significantly outperforming existing methods. Compared with the suboptimal method WS-Net++, MDNet improves the F1-score and IoU by 0.75% and 0.8%, respectively, with core advantages in precision optimization under high recall and adaptability to complex scenarios. For the large-scale urban expansion and high-density building change scenarios in the WHU-CD dataset, MDNet enhances differential features through the DPEM, increasing the IoU by 4.57% compared with AMTNet, verifying its precise positioning capability for large-scale change area boundaries. It is worth noting that although WS-Net++ leads with the highest precision of 95.36%, its recall is relatively low. It is speculated that it may overfit the significant change regions in the training data, resulting in insufficient fine change detection capability.
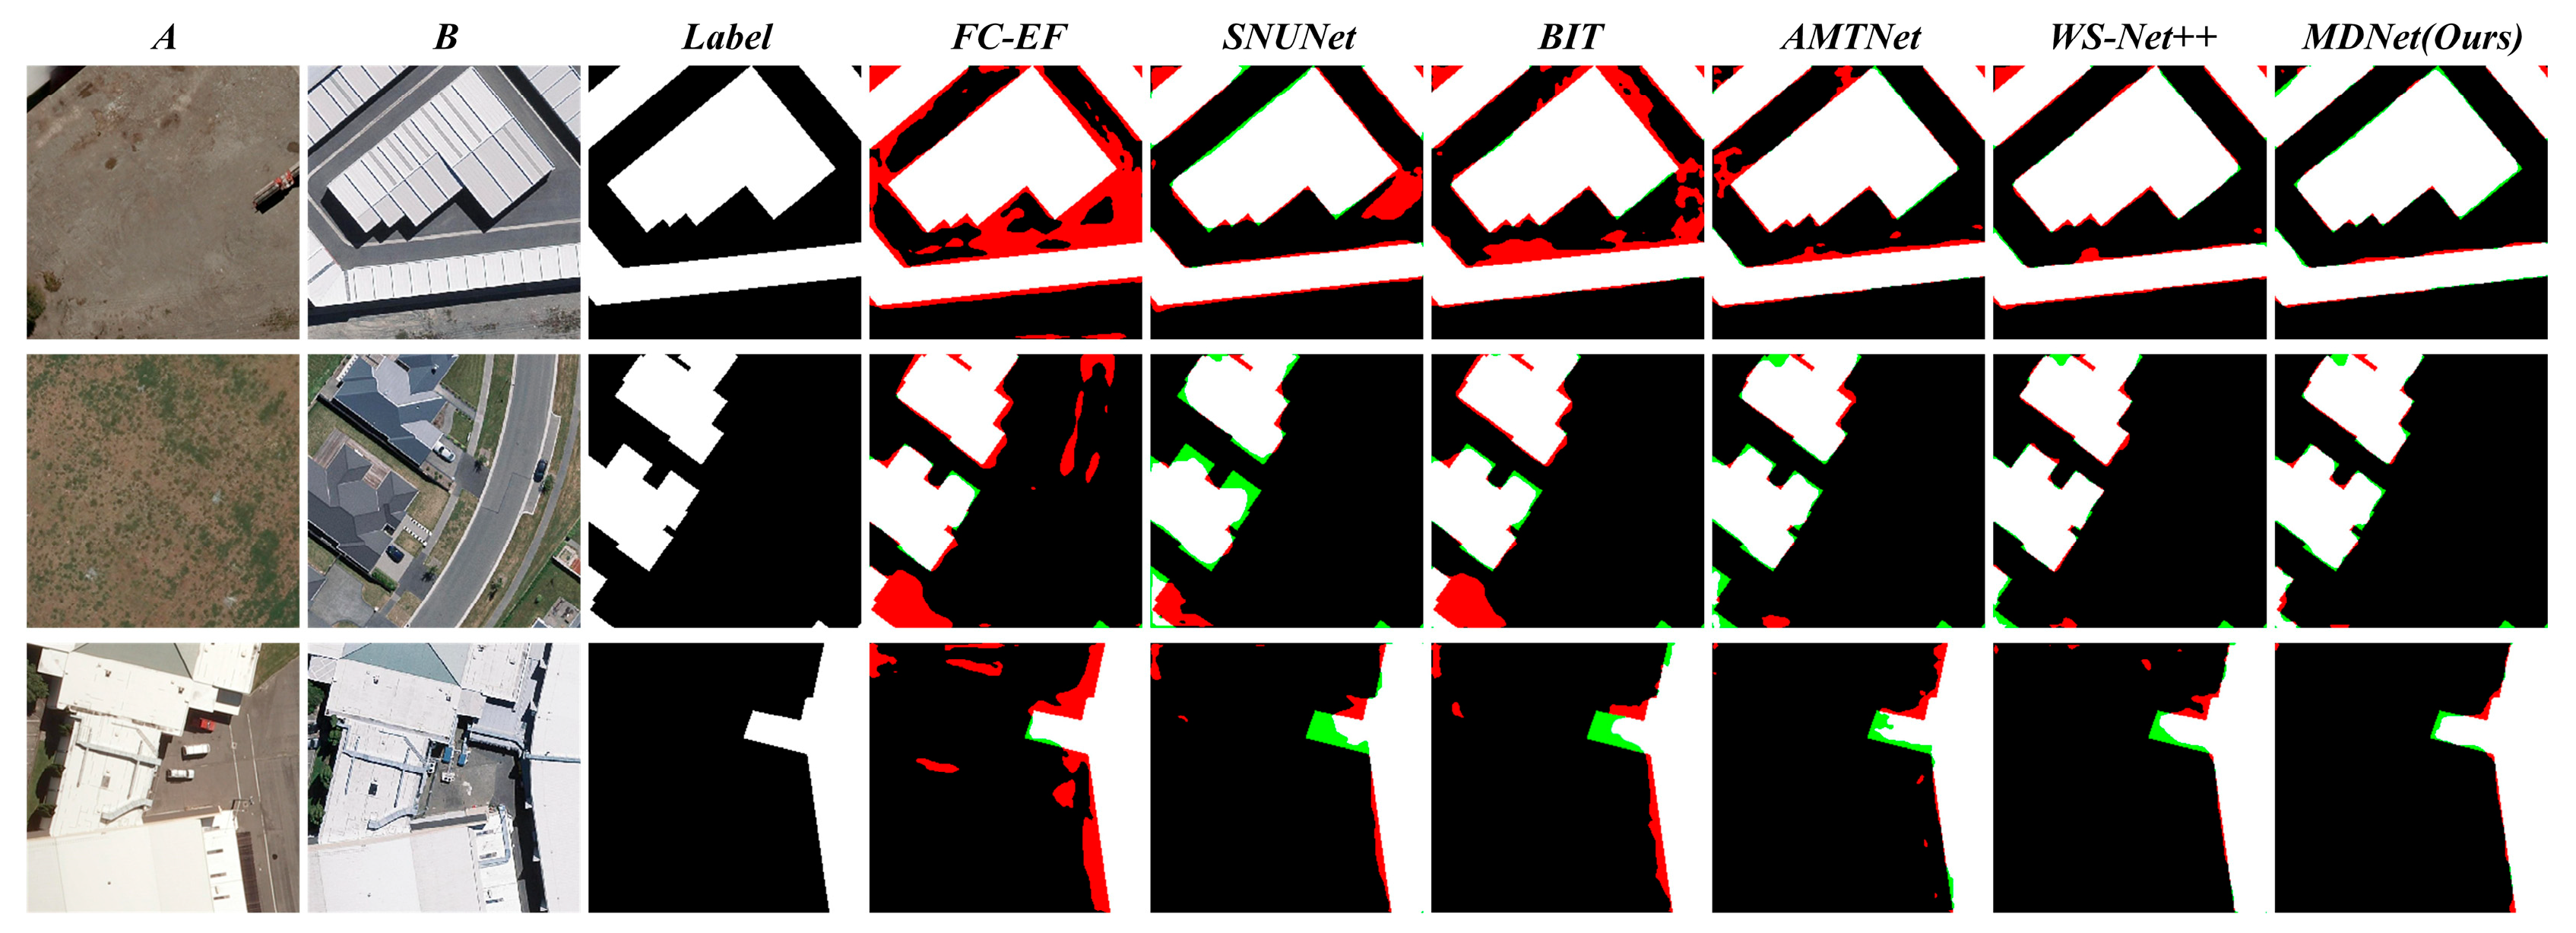
The qualitative visualization results are shown in Figure 8, and the differences among different methods in typical scenarios are significant: In the first-row samples, FC-EF and BiT exhibit obvious false positives (FPs, red area diffusion) at the edges of large newly built regions, while MDNet achieves edge sharpening and spatial integrity preservation of change regions through the CASAM’s cross-layer feature aggregation and Transformer’s long-range dependency modeling; in the second- and third-row samples, methods such as SNUNet and AMTNet easily misclassify unchanged regions as changes (FP) in similar building clusters. MDNet, however, explicitly enhances spectral–structural difference features through the DPEM, effectively distinguishing buildings from impervious surfaces with similar materials and colors, demonstrating high sensitivity to semantic differences in complex ground objects.

4.5.3. Comparisons on the CLCD Dataset

Table 4 shows the performance comparison of each method on the CLCD dataset. MDNet ranks second in accuracy, F1-score, and IoU metrics, slightly lower than WS-Net++ but significantly better than other comparative methods. It is worth noting that MDNet’s recall rate of 76.52% is higher than WS-Net++’s 75.47%, indicating fewer missed detections of real change regions, an advantage verified by the visualization results in Figure 9. As a small-scale dataset, CLCD has variable spatial resolutions ranging from 0.5 m to 2 m. In such scenarios, MDNet’s CNN–Transformer hybrid framework effectively reduces the strong dependency of pure Transformer models on training data scale, highlighting the adaptability of its architecture.
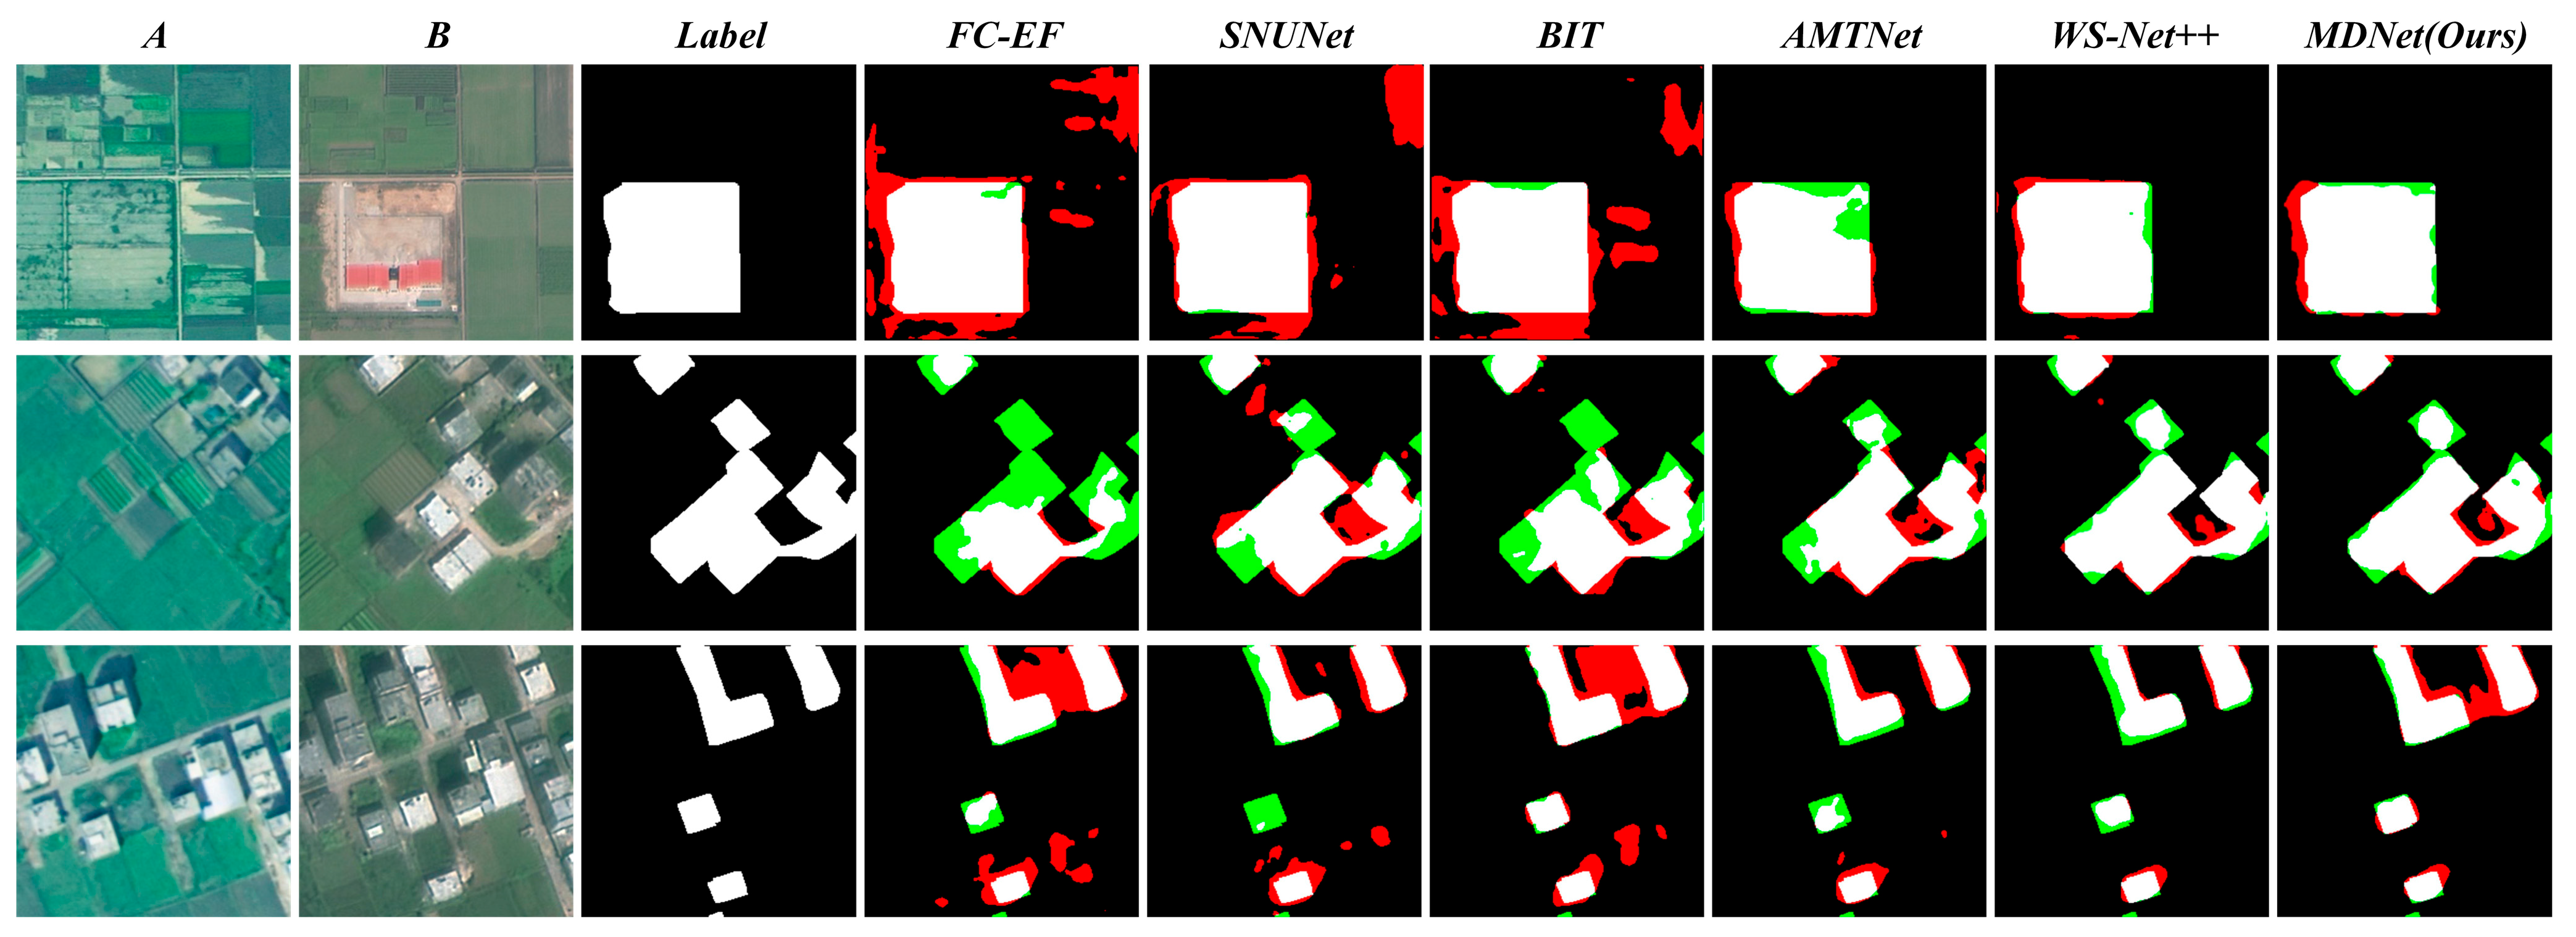
The qualitative visualization results are shown in Figure 9. In the first-row samples of seasonal vegetation-covered areas, FC-EF, SNUNet, and BiT produce dense false positives (FPs, red noise points), while MDNet effectively suppresses misclassifications caused by such background interferences through the differential feature enhancement mechanism of the DPEM; In the second- and third-row samples of scattered farmland change areas, methods such as SNUNet and AMTNet have numerous missed detections (FNs, green areas) and false positives (FPs, red areas). MDNet significantly reduces missed detections through the cross-layer semantic aggregation capability of the CASAM, but the boundaries of the predicted change regions still appear slightly blurred, reflecting that there is still room for optimization in fine-grained edge modeling. Overall, MDNet still demonstrates comprehensive advantages in overall performance in small dataset and multi-resolution scenarios.

4.6. Model Efficiency

Table 5 quantifies the computational cost and complexity of different methods using Floating-Point Operations (FLOPs) and parameter size (Params) to evaluate model computational efficiency. Among them, FC-EF, as a pure convolutional network architecture, has the lowest FLOPs and Params; although SNUNet has a small number of parameters, it generates extremely high numbers of FLOPs due to the extensive use of densely connected multi-scale features, leading to a significant increase in computational load. Compared with AMTNet, the proposed MDNet, despite having higher Params and FLOPs, exhibits superior performance in key metrics such as F1-score and IoU, as shown in Table 2, Table 3 and Table 4, achieving an average F1 gain of 1.72% across the three datasets; although WS-Net++ achieves better performance on the CLCD dataset, its Params and FLOPs are significantly higher than those of MDNet. Notably, although MDNet integrates modules such as the EMF, CASAM, DPEM, Transformer, and CAM, it still maintains highly competitive complexity. Its FLOPs (26.43 G) are 51.8% lower than those of SNUNet (54.83 G), which uses dense multi-scale connections; its Params (36.62 M) account for only 4.0% of those of WS-Net++ (906.16 M), as the latter introduces a large number of redundant parameters due to its wavelet transform and semi-supervised mechanism. In summary, MDNet achieves a good balance between computational efficiency and model complexity, verifying the superiority of this method in resource utilization efficiency. The improvement in detection accuracy and reliability can reasonably offset the additional computational overhead, providing a more practically valuable solution for change detection tasks.

4.7. Analysis of Model Generalization and Real-Time Application Feasibility

The generalization capability of change detection models is manifested in their adaptability to heterogeneous scenarios, unknown ground objects, and variable data characteristics. Although no out-of-distribution (OOD) testing has been performed, the consistent performance of MDNet across three heterogeneous datasets has confirmed its generalization potential. (i) In terms of cross-scenario adaptability, MDNet maintained top-tier or second-tier performance across high-density building changes (WHU-CD), urban-rural construction growth (LEVIR-CD), and low-contrast farmland changes (CLCD), as shown in Table 2, Table 3 and Table 4. This advantage is attributed to the DPEM’s adaptive suppression of pseudo-changes such as illumination variations and seasonal shifts. (ii) For scale robustness, the collaborative mechanism of the EMF and CASAM captures small-target details via deformable convolutions and enhances structural consistency in large regions through cross-layer interactions, enabling adaptation to 0.2–2 m resolution and scenarios with coexisting large and small targets. (iii) Transformer’s global modeling reduces reliance on local textures, effectively avoiding misclassification of similar textures in CLCD farmland scenarios, as shown in Figure 9, and mitigating overfitting to specific spatial patterns.
At the real-time application level, existing efficiency metrics and architectural design provide feasibility support. (i) In terms of computational load, its 26.43 G FLOPs are significantly lower than those of SNUNet (54.83 G) and WS-Net++ (40.59 G), as shown in Table 5. The adaptive convolutions of the EMF and adjacent-layer aggregation design of the CASAM effectively control redundant computations. (ii) With a parameter size of 36.62 M—only 4.0% of WS-Net++’s parameter count—its shared-parameter backbone and modular fusion reduce redundancy, making it suitable for memory-constrained devices. (iii) The modular architecture supports flexible adjustments, providing customization capabilities for real-time scenarios.
In summary, MDNet achieves cross-scenario generalization through structural design and gains advantages in computational efficiency and deployment flexibility. Its adaptability stems from the architecture itself rather than scenario-specific tuning, confirming its practical application value.

5. Conclusions

For the task of remote sensing change detection, this paper proposes a novel network, MDNet, which constructs a complete optimization framework of “multi-scale feature extraction—cross-scale aggregation—difference enhancement—context modeling”. The core components of this network include the EMF, CASAM, DPEM, Transformer, and CAM. The EMF and CASAM strengthen multi-scale semantic representation capabilities through a parallel collaborative mechanism. By means of deformable convolution in pyramid structures and cross-level feature interaction, they achieve fine-grained modeling of change targets of different sizes. The DPEM and Transformer collaboratively enhance global–local coupled modeling of spatio-temporal differences. The former strengthens spectral–structural differences by constructing a differential feature space, while the latter captures long-range dependencies using self-attention mechanisms, forming multi-level feature expressions from local differences to global associations. The CAM adaptively suppresses redundant information and enhances discriminative feature responses through a channel-wise feature screening mechanism, further optimizing the semantic consistency of model outputs. Based on a series of quantitative and qualitative comparisons on three popular change detection datasets, the superiority, robustness, and generalizability of MDNet are demonstrated. Our future research intends to focus on two aspects: first, optimizing the network architecture to reduce computational resource consumption while maintaining high accuracy; second, incorporating semi-supervised paradigms inspired by WS-Net++—specifically pseudo-label propagation and cross-scale consistency constraints—to enhance MDNet’s adaptability in small-data regimes like CLCD, thereby reducing annotation dependency while maintaining detection fidelity.

Author Contributions

Conceptualization, J.L.; Methodology, J.L. and M.Z.; Software, M.Z. and Z.Y.; Validation, X.W.; Formal analysis, Y.S.; Resources, Q.W.; Data curation, Y.S. and Q.W.; Writing – original draft, M.Z.; Writing – review & editing, M.Z. and X.W.; Visualization, Y.S. and Z.Y.; Supervision, J.L.; Project administration, J.L.; Funding acquisition, X.W. and Q.W. All authors have read and agreed to the published version of the manuscript.

Funding

This work was supported by the Guangxi Real-Scene 3D Digital and Intelligent Collaborative Production and Application Technology System project (No. 2024ZRBSHZ155), and the Guangxi Key Laboratory of Spatial Information and Geomatics Program (No. 21-238-21-24).

Data Availability Statement

The original data presented in the study are openly available at https://justchenhao.github.io/LEVIR/ (LEVIR-CD dataset, accessed on 18 January 2025), https://github.com/linyiyuan11/AMT_Net (WHU-CD dataset, accessed on 20 January 2025), and https://github.com/liumency/CropLand-CD (CLCD dataset, accessed on 3 February 2025).

Conflicts of Interest

The authors declare no conflicts of interest.

References

  1. Wu, C.; Zhang, L.; Du, B.; Chen, H.; Wang, J.; Zhong, H. UNet-like Remote Sensing Change Detection: A Review of Current Models and Research Directions. IEEE Geosci. Remote Sens. Mag. 2024, 12, 305–334. [Google Scholar] [CrossRef]
  2. Feng, Y.; Jiang, J.; Xu, H.; Zheng, J. Change Detection on Remote Sensing Images Using Dual-Branch Multilevel Intertemporal Network. IEEE Trans. Geosci. Remote Sens. 2023, 61, 4401015. [Google Scholar] [CrossRef]
  3. Li, Z.; Tang, C.; Liu, X.; Zhang, W.; Dou, J.; Wang, L.; Zomaya, A.Y. Lightweight Remote Sensing Change Detection with Progressive Feature Aggregation and Supervised Attention. IEEE Trans. Geosci. Remote Sens. 2023, 61, 5602812. [Google Scholar] [CrossRef]
  4. Cheng, G.; Huang, Y.; Li, X.; Lyu, S.; Xu, Z.; Zhao, H.; Zhao, Q.; Xiang, S. Change Detection Methods for Remote Sensing in the Last Decade: A Comprehensive Review. Remote Sens. 2024, 16, 2355. [Google Scholar] [CrossRef]
  5. Xu, Y.; Lei, T.; Ning, H.; Lin, S.; Liu, T.; Gong, M.; Nandi, A.K. From Macro to Micro: A Lightweight Interleaved Network for Remote Sensing Image Change Detection. IEEE Trans. Geosci. Remote Sens. 2025, 63, 4406114. [Google Scholar] [CrossRef]
  6. Afaq, Y.; Manocha, A. Analysis on Change Detection Techniques for Remote Sensing Applications: A Review. Ecol. Inform. 2021, 63, 101310. [Google Scholar] [CrossRef]
  7. Peng, D.; Bruzzone, L.; Zhang, Y.; Guan, H.; Ding, H.; Huang, X. SemiCDNet: A Semisupervised Convolutional Neural Network for Change Detection in High Resolution Remote-Sensing Images. IEEE Trans. Geosci. Remote Sens. 2021, 59, 5891–5906. [Google Scholar] [CrossRef]
  8. Bai, B.; Fu, W.; Lu, T.; Li, S. Edge-Guided Recurrent Convolutional Neural Network for Multitemporal Remote Sensing Image Building Change Detection. IEEE Trans. Geosci. Remote Sens. 2022, 60, 5610613. [Google Scholar] [CrossRef]
  9. Luo, F.; Zhou, T.; Liu, J.; Guo, T.; Gong, X.; Ren, J. Multiscale Diff-Changed Feature Fusion Network for Hyperspectral Image Change Detection. IEEE Trans. Geosci. Remote Sens. 2023, 61, 5502713. [Google Scholar] [CrossRef]
  10. Ying, Z.; Tan, Z.; Zhai, Y.; Jia, X.; Li, W.; Zeng, J.; Genovese, A.; Piuri, V.; Scotti, F. DGMA2-Net: A Difference-Guided Multiscale Aggregation Attention Network for Remote Sensing Change Detection. IEEE Trans. Geosci. Remote Sens. 2024, 62, 1–16. [Google Scholar] [CrossRef]
  11. Zhang, J.; Shao, Z.; Ding, Q.; Huang, X.; Wang, Y.; Zhou, X.; Li, D. AERNet: An Attention-Guided Edge Refinement Network and a Dataset for Remote Sensing Building Change Detection. IEEE Trans. Geosci. Remote Sens. 2023, 61, 5617116. [Google Scholar] [CrossRef]
  12. Chen, J.; Yuan, Z.; Peng, J.; Chen, L.; Huang, H.; Zhu, J.; Liu, Y.; Li, H. DASNet: Dual Attentive Fully Convolutional Siamese Networks for Change Detection in High-Resolution Satellite Images. IEEE J. Sel. Top. Appl. Earth Obs. Remote Sens. 2021, 14, 1194–1206. [Google Scholar] [CrossRef]
  13. Zhang, C.; Wang, L.; Cheng, S.; Li, Y. SwinSUNet: Pure Transformer Network for Remote Sensing Image Change Detection. IEEE Trans. Geosci. Remote Sens. 2022, 60, 5224713. [Google Scholar] [CrossRef]
  14. Yan, T.; Wan, Z.; Zhang, P.; Cheng, G.; Lu, H. TransY-Net: Learning Fully Transformer Networks for Change Detection of Remote Sensing Images. IEEE Trans. Geosci. Remote Sens. 2023, 61, 1–12. [Google Scholar] [CrossRef]
  15. Zhang, X.; Cheng, S.; Wang, L.; Li, H. Asymmetric Cross-Attention Hierarchical Network Based on CNN and Transformer for Bitemporal Remote Sensing Images Change Detection. IEEE Trans. Geosci. Remote Sens. 2023, 61, 2000415. [Google Scholar] [CrossRef]
  16. Lei, T.; Xu, Y.; Ning, H.; Lv, Z.; Min, C.; Jin, Y.; Nandi, A.K. Lightweight Structure-Aware Transformer Network for Remote Sensing Image Change Detection. IEEE Geosci. Remote Sens. Lett. 2023, 21, 6000305. [Google Scholar] [CrossRef]
  17. Jiang, H.; Peng, M.; Zhong, Y.; Xie, H.; Hao, Z.; Lin, J.; Ma, X.; Hu, X. A Survey on Deep Learning-Based Change Detection from High-Resolution Remote Sensing Images. Remote Sens. 2022, 14, 1552. [Google Scholar] [CrossRef]
  18. Chen, H.; Wu, C.; Du, B.; Zhang, L.; Wang, L. Change Detection in Multisource VHR Images via Deep Siamese Convolutional Multiple-Layers Recurrent Neural Network. IEEE Trans. Geosci. Remote Sens. 2020, 58, 2848–2864. [Google Scholar] [CrossRef]
  19. Xiang, S.; Wang, M.; Jiang, X.; Xie, G.; Zhang, Z.; Tang, P. Dual-Task Semantic Change Detection for Remote Sensing Images Using the Generative Change Field Module. Remote Sens. 2021, 13, 3336. [Google Scholar] [CrossRef]
  20. Hou, X.; Bai, Y.; Li, Y.; Shang, C.; Shen, Q. High-Resolution Triplet Network with Dynamic Multiscale Feature for Change Detection on Satellite Images. ISPRS J. Photogramm. Remote Sens. 2021, 177, 103–115. [Google Scholar] [CrossRef]
  21. Zhang, L.; Hu, X.; Zhang, M.; Shu, Z.; Zhou, H. Object-Level Change Detection with a Dual Correlation Attention-Guided Detector. ISPRS J. Photogramm. Remote Sens. 2021, 177, 147–160. [Google Scholar] [CrossRef]
  22. Zhang, M.; Liu, Z.; Li, W.-Y.; Liu, L.; Jiao, L. Remote Sensing Image Change Detection Based on Deep Multi-Scale Multi-Attention Siamese Transformer Network. Remote. Sens. 2023, 15, 842. [Google Scholar] [CrossRef]
  23. Song, K.; Jiang, J. AGCDetNet:An Attention-Guided Network for Building Change Detection in High-Resolution Remote Sensing Images. IEEE J. Sel. Top. Appl. Earth Obs. Remote Sens. 2021, 14, 4816–4831. [Google Scholar] [CrossRef]
  24. Wang, W.; Tan, X.; Zhang, P.; Wang, X. A CBAM Based Multiscale Transformer Fusion Approach for Remote Sensing Image Change Detection. IEEE J. Sel. Top. Appl. Earth Obs. Remote Sens. 2022, 15, 6817–6825. [Google Scholar] [CrossRef]
  25. Jiang, S.; Lin, H.; Ren, H.; Hu, Z.; Weng, L.; Xia, M. MDANet: A High-Resolution City Change Detection Network Based on Difference and Attention Mechanisms under Multi-Scale Feature Fusion. Remote Sens. 2024, 16, 1387. [Google Scholar] [CrossRef]
  26. Zhao, Y.; Chen, P.; Chen, Z.; Bai, Y.; Zhao, Z.; Yang, X. A Triple-Stream Network with Cross-Stage Feature Fusion for High-Resolution Image Change Detection. IEEE Trans. Geosci. Remote Sens. 2023, 61, 5600417. [Google Scholar] [CrossRef]
  27. Li, Z.; Cao, S.; Deng, J.; Wu, F.; Wang, R.; Luo, J.; Peng, Z. STADE-CDNet: Spatial–Temporal Attention with Difference Enhancement-Based Network for Remote Sensing Image Change Detection. IEEE Trans. Geosci. Remote Sens. 2024, 62, 5611617. [Google Scholar] [CrossRef]
  28. Sun, S.; Mu, L.; Wang, L.; Liu, P. L-UNet: An LSTM Network for Remote Sensing Image Change Detection. IEEE Geosci. Remote Sens. Lett. 2022, 19, 8004505. [Google Scholar] [CrossRef]
  29. Bandara, W.G.C.; Patel, V.M. A Transformer-Based Siamese Network for Change Detection. Available online: https://ieeexplore.ieee.org/document/9883686 (accessed on 12 January 2025).
  30. Chen, H.; Qi, Z.; Shi, Z. Remote Sensing Image Change Detection with Transformers. IEEE Trans. Geosci. Remote Sens. 2021, 60, 5607514. [Google Scholar] [CrossRef]
  31. Chen, P.; Zhang, B.; Hong, D.; Chen, Z.; Yang, X.; Li, B. FCCDN: Feature Constraint Network for VHR Image Change Detection. ISPRS J. Photogramm. Remote Sens. 2022, 187, 101–119. [Google Scholar] [CrossRef]
  32. Zhang, C.; Yue, P.; Tapete, D.; Jiang, L.; Shangguan, B.; Huang, L.; Liu, G. A Deeply Supervised Image Fusion Network for Change Detection in High Resolution Bi-Temporal Remote Sensing Images. ISPRS J. Photogramm. Remote Sens. 2020, 166, 183–200. [Google Scholar] [CrossRef]
  33. Lin, H.; Wang, X.; Li, M.; Huang, D.; Wu, R. A Multi-Task Consistency Enhancement Network for Semantic Change Detection in HR Remote Sensing Images and Application of Non-Agriculturalization. Remote Sens. 2023, 15, 5106. [Google Scholar] [CrossRef]
  34. Li, Y.; Zou, S.; Zhao, T.; Su, X. MDFA-Net: Multi-Scale Differential Feature Self-Attention Network for Building Change Detection in Remote Sensing Images. Remote Sens. 2024, 16, 3466. [Google Scholar] [CrossRef]
  35. Wu, B.; Xu, C.; Dai, X.; Wan, A.; Zhang, P.; Yan, Z.; Tomizuka, M.; Gonzalez, J.; Keutzer, K.; Vajda, P. Visual Transformers: Token-Based Image Representation and Processing for Computer Vision. Available online: https://arxiv.org/abs/2006.03677 (accessed on 12 January 2025).
  36. Carion, N.; Massa, F.; Synnaeve, G.; Usunier, N.; Kirillov, A.; Zagoruyko, S. End-To-End Object Detection with Transformers. In Proceedings of the European Conference on Computer Vision(ECCV) 2020, Glasgow, UK, 23–28 August 2020; Volume 12346, pp. 213–229. [Google Scholar] [CrossRef]
  37. Zhu, X.; Su, W.; Lu, L.; Li, B.; Wang, X.; Dai, J. Deformable DETR: Deformable Transformers for End-To-End Object Detection. Available online: https://arxiv.org/abs/2010.04159 (accessed on 12 January 2025).
  38. Jiang, B.; Wang, Z.; Wang, X.; Zhang, Z.; Chen, L.; Wang, X.; Luo, B. VcT: Visual Change Transformer for Remote Sensing Image Change Detection. IEEE Trans. Geosci. Remote Sens. 2023, 61, 1–14. [Google Scholar] [CrossRef]
  39. Tang, W.; Wu, K.; Zhang, Y.; Zhan, Y. A Siamese Network Based on Multiple Attention and Multilayer Transformers for Change Detection. IEEE Trans. Geosci. Remote Sens. 2023, 61, 5219015. [Google Scholar] [CrossRef]
  40. Wu, Y.; Li, L.; Wang, N.; Li, W.; Fan, J.; Tao, R.; Wen, X.; Wang, Y. CSTSUNet: A Cross Swin Transformer-Based Siamese U-Shape Network for Change Detection in Remote Sensing Images. IEEE Trans. Geosci. Remote Sens. 2023, 61, 5623715. [Google Scholar] [CrossRef]
  41. Feng, Y.; Xu, H.; Jiang, J.; Liu, H.; Zheng, J. ICIF-Net: Intra-Scale Cross-Interaction and Inter-Scale Feature Fusion Network for Bitemporal Remote Sensing Images Change Detection. IEEE Trans. Geosci. Remote Sens. 2022, 60, 4410213. [Google Scholar] [CrossRef]
  42. Wang, L.; Li, R.; Zhang, C.; Fang, S.; Duan, C.; Meng, X.; Atkinson, P.M. UNetFormer: A UNet-like Transformer for Efficient Semantic Segmentation of Remote Sensing Urban Scene Imagery. ISPRS J. Photogramm. Remote Sens. 2022, 190, 196–214. [Google Scholar] [CrossRef]
  43. Li, W.; Xue, L.; Wang, X.; Li, G. ConvTransNet: A CNN–Transformer Network for Change Detection with Multiscale Global–Local Representations. IEEE Trans. Geosci. Remote Sens. 2023, 61, 5610315. [Google Scholar] [CrossRef]
  44. Zhao, J.; Jiao, L.; Wang, C.; Liu, X.; Liu, F.; Li, L.; Yang, S. GeoFormer: A Geometric Representation Transformer for Change Detection. IEEE Trans. Geosci. Remote Sens. 2023, 61, 4410617. [Google Scholar] [CrossRef]
  45. He, K.; Zhang, X.; Ren, S.; Sun, J. Deep Residual Learning for Image Recognition. In Proceedings of the 2016 IEEE Conference on Computer Vision and Pattern Recognition (CVPR), Las Vegas, NV, USA, 27–30 June 2016; pp. 770–778. [Google Scholar] [CrossRef]
  46. Wang, Q.; Wu, B.; Zhu, P.; Li, P.; Zuo, W.; Hu, Q. ECA-Net: Efficient Channel Attention for Deep Convolutional Neural Networks. In Proceedings of the 2020 IEEE/CVF Conference on Computer Vision and Pattern Recognition (CVPR), Seattle, WA, USA, 14–19 June 2020. [Google Scholar] [CrossRef]
  47. Szegedy, C.; Liu, W.; Jia, Y.; Sermanet, P.; Reed, S.; Anguelov, D.; Erhan, D.; Vanhoucke, V. Going Deeper with Convolutions. In Proceedings of the 2015 IEEE Conference on Computer Vision and Pattern Recognition (CVPR), Boston, MA, USA, 7–12 June 2015; pp. 1–9. [Google Scholar] [CrossRef]
  48. Liu, M.; Chai, Z.; Deng, H.; Liu, R. A CNN-Transformer Network with Multiscale Context Aggregation for Fine-Grained Cropland Change Detection. IEEE J. Sel. Top. Appl. Earth Obs. Remote Sens. 2022, 15, 4297–4306. [Google Scholar] [CrossRef]
  49. Daudt, R.C.; Le Saux, B.; Boulch, A.; Gousseau, Y. Urban Change Detection for Multispectral Earth Observation Using Convolutional Neural Networks. In Proceedings of the IGARSS 2018—2018 IEEE International Geoscience and Remote Sensing Symposium, Valencia, Spain, 22–27 July 2018. [Google Scholar] [CrossRef]
  50. Fang, S.; Li, K.; Shao, J.; Li, Z. SNUNet-CD: A Densely Connected Siamese Network for Change Detection of VHR Images. IEEE Geosci. Remote Sens. Lett. 2022, 19, 8007805. [Google Scholar] [CrossRef]
  51. Liu, W.; Lin, Y.; Liu, W.; Yu, Y.; Li, J. An Attention-Based Multiscale Transformer Network for Remote Sensing Image Change Detection. ISPRS J. Photogramm. Remote Sens. 2023, 202, 599–609. [Google Scholar] [CrossRef]
  52. Xiong, F.; Li, T.; Yang, Y.; Zhou, J.; Lu, J.; Qian, Y. Wavelet Siamese Network with Semi-Supervised Domain Adaptation for Remote Sensing Image Change Detection. IEEE Trans. Geosci. Remote Sens. 2024, 62, 5633613. [Google Scholar] [CrossRef]
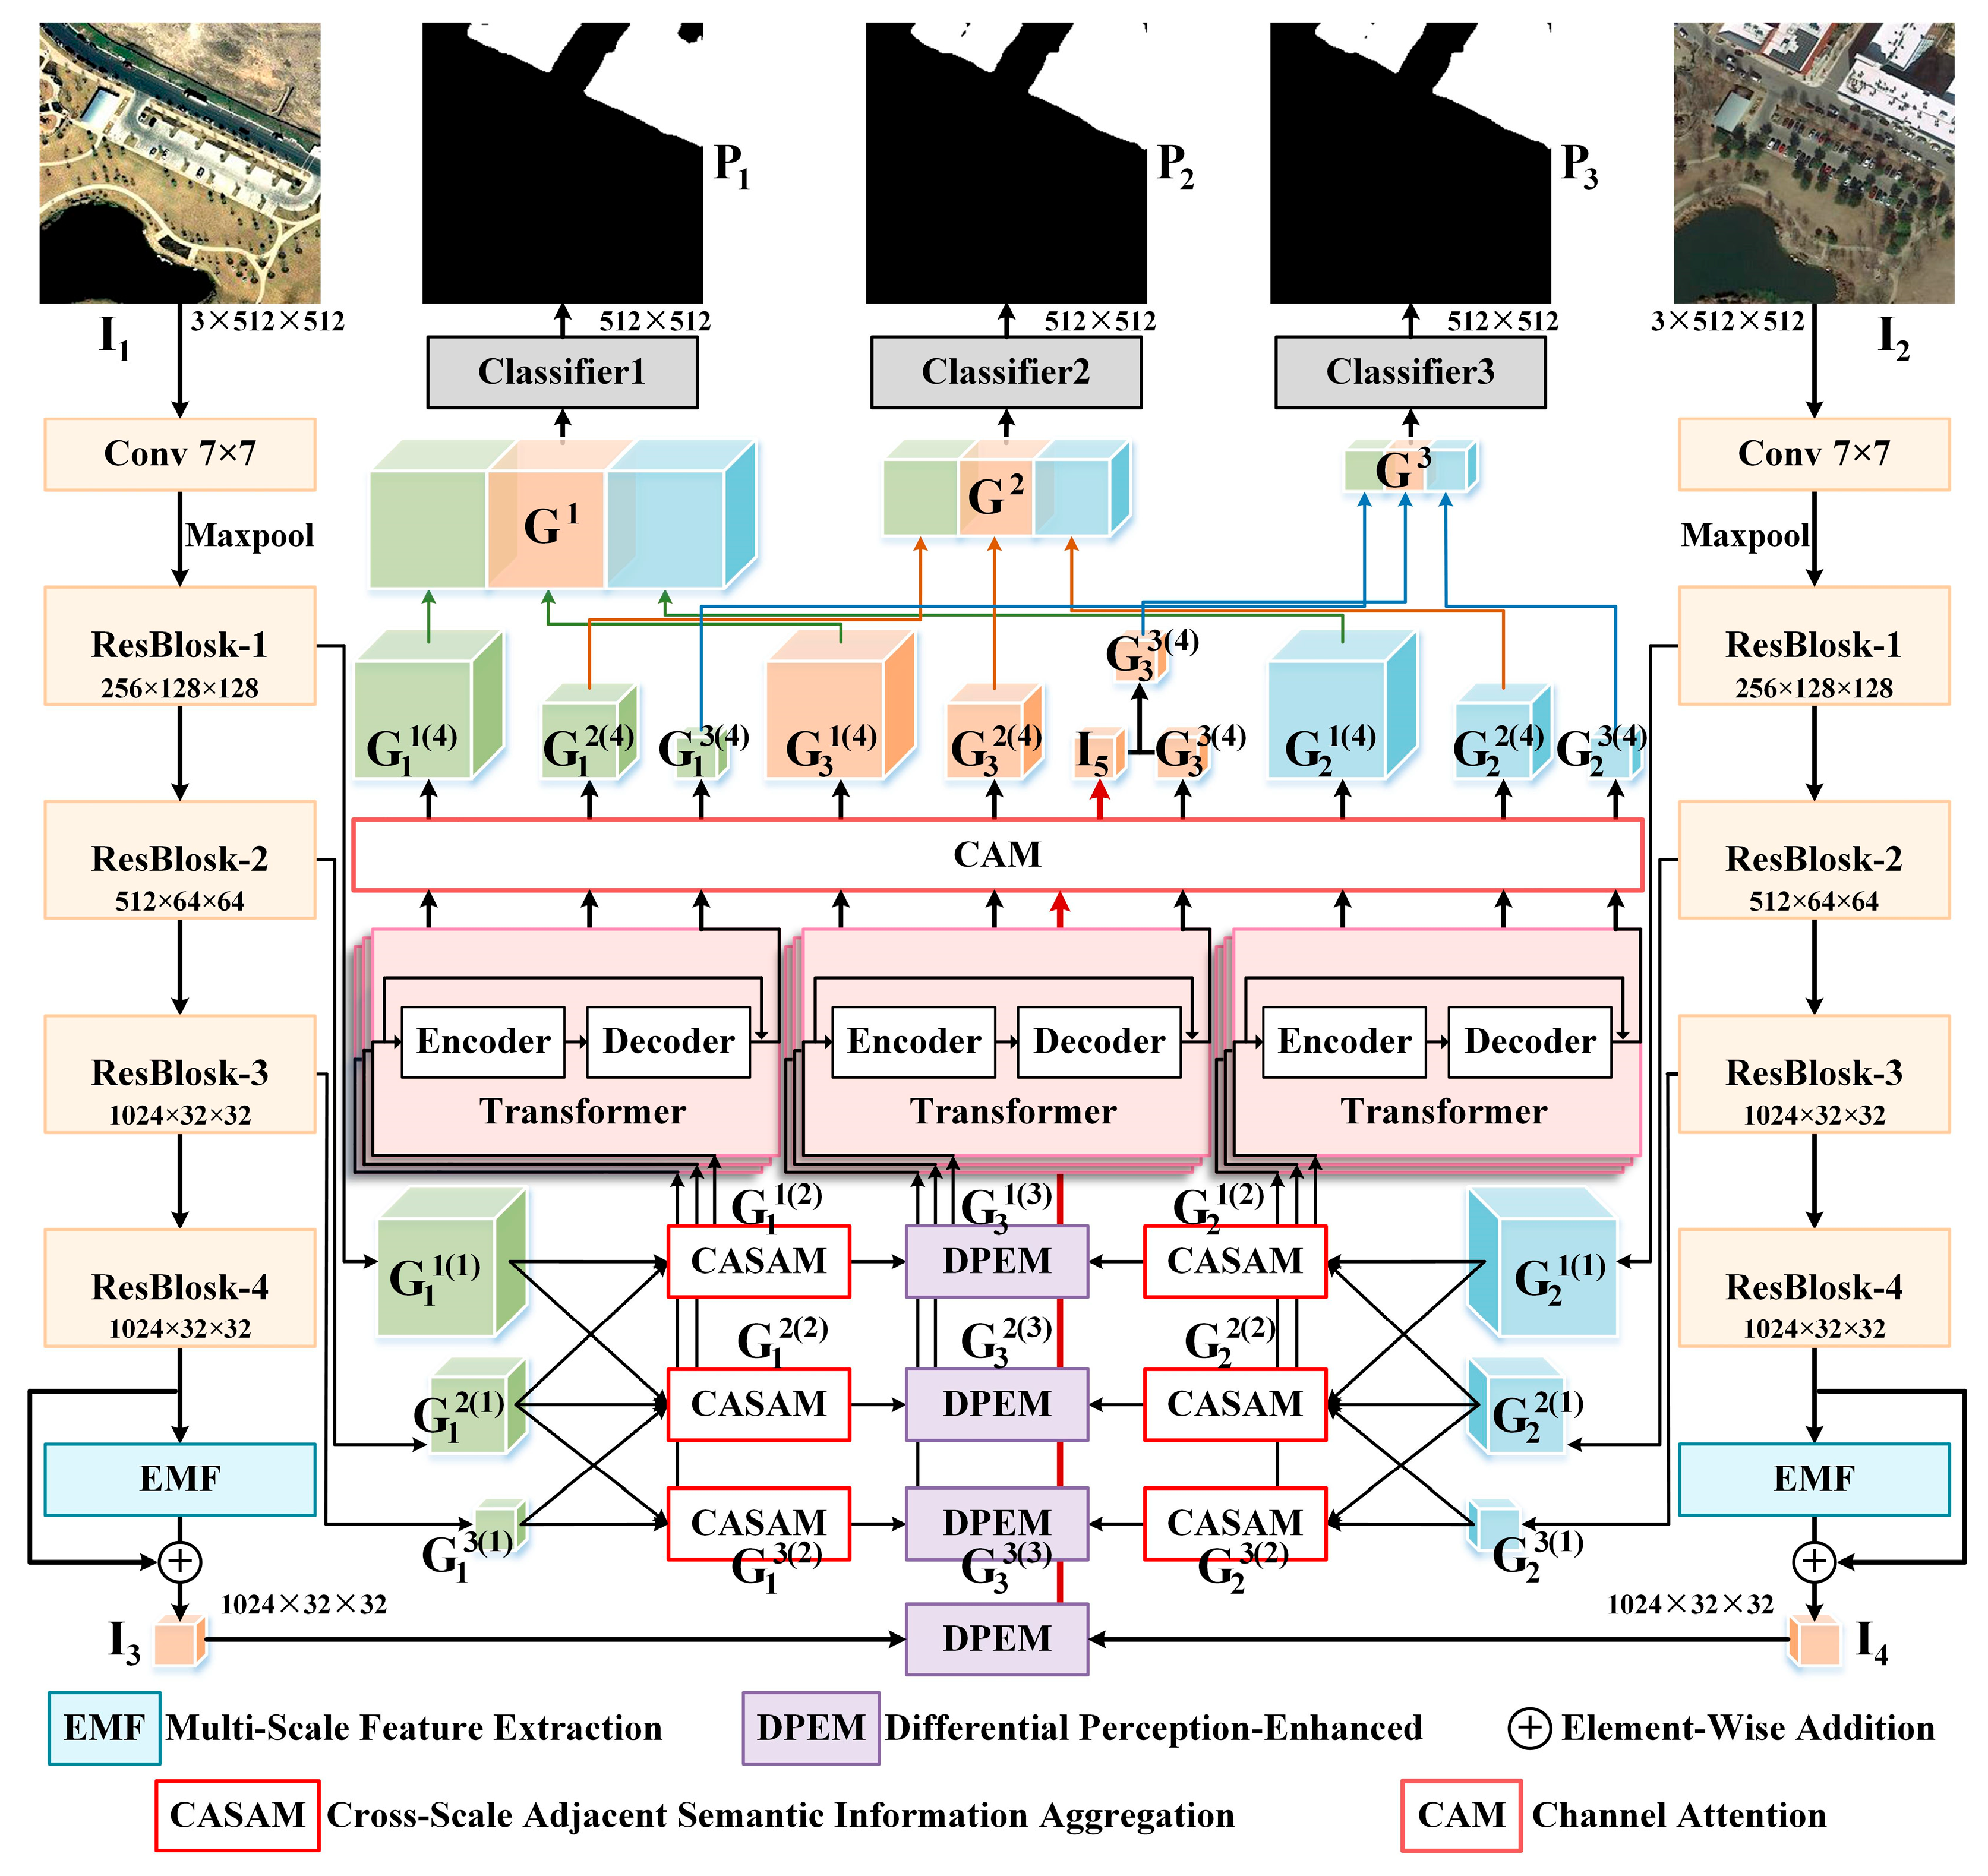
Figure 1. Architecture of the proposed MDNet. Information Flow: Bi-temporal images are input to share the ResNet50 backbone, and multi-scale features are generated through the EMF; after being fed into the CASAM for cross-scale aggregation, they are then input into the DPEM to generate differential features; the differential features and aggregated features are jointly processed by the Transformer and CAM, and finally undergo concatenation and classification via a CNN classifier, outputting 3 change maps.
Applsci 15 08794 g001
Figure 2. (a) The details of the EMF. (b) The implementation of deformable convolution. Information Flow: Input features are processed by global pooling and 1D convolution to enhance task-related spectral and texture features, then feature extraction is performed via multi-branch deformable convolutions (1 × 1, 3 × 3, 5 × 5, 7 × 7), and finally multi-scale features are output after concatenation.
Applsci 15 08794 g002
Figure 3. The details of the CASAM. MDNet only takes three hierarchical features as input from the backbone network; therefore, cross-scale aggregation involves merely two scenarios: aggregation of two adjacent scales and aggregation of three adjacent scales. To cover these scenarios, the CASAM is equipped with three branches, which can perform targeted fusion of semantic information under different scale combinations.
Applsci 15 08794 g003
Figure 4. (a) The details of the DPEM. Information Flow (a): After the input of features at two moments, the change-related channels are first enhanced via global pooling and 1D convolution. Then, change-related regions are highlighted through max/average pooling and 7 × 7 convolution. Finally, spatio-temporal differences are amplified by pixel-wise subtraction. (b) The Channel Attention Module. Information Flow (b): Input features capture change-related channel statistics via dual pooling (average/max); they learn channel attention weights through a shared MLP, and then generate channel masks via sigmoid operation; finally, refined features are output through element-wise multiplication.
Applsci 15 08794 g004
Figure 5. Example images from the LEVIR-CD, WHU-CD, and CLCD datasets. A and B represent the same location at different times. The labels represent the changed areas, where white represents the changed area and black represents the unchanged area.
Applsci 15 08794 g005
Figure 6. The visualization results of ablation experiments on CLCD, WHU-CD, and LEVIR-CD datasets. In the prediction results, white represents true positive (TP), black represents true negative (TN), red represents false positive (FP), and green represents false negative (FN). In brief, the lower the proportion of red and green, the better the prediction performance of the model. The images from left to right show the following: A is Image 1, B is Image 2, Label is the ground truth, and then (a)–(h) are the results of removing various modules, including the EMF, CASAM, EMF + CASAM, DPEM, Transformer, DPEM + Transformer, CAM, and the complete MDNet.
Applsci 15 08794 g006
Figure 7. Visualization results of different methods on the LEVIR-CD dataset. In the prediction results, white represents true positive (TP), black represents true negative (TN), red represents false positive (FP), and green represents false negative (FN). In brief, the lower the proportion of red and green, the better the prediction performance of the model. A and B represent two-phase remote sensing images, Label is the ground-truth change annotation, FC-EF, SNUNet, BIT, AMTNet, WS-Net++ are comparative models, and MDNet (Ours) is the proposed model.
Applsci 15 08794 g007
Figure 8. Visualization results of different methods on the WHU-CD dataset. In the prediction results, white represents true positive (TP), black represents true negative (TN), red represents false positive (FP), and green represents false negative (FN). In brief, the lower the proportion of red and green, the better the prediction performance of the model. A and B represent two - phase remote sensing images, Label is the ground-truth change annotation, FC-EF, SNUNet, BIT, AMTNet, WS-Net++ are comparative models, and MDNet (Ours) is the proposed model.
Applsci 15 08794 g008
Figure 9. Visualization results of different methods on the CLCD dataset. In the prediction results, white represents true positive (TP), black represents true negative (TN), red represents false positive (FP), and green represents false negative (FN). In brief, the lower the proportion of red and green, the better the prediction performance of the model. A and B represent two-phase remote sensing images, Label is the ground - truth change annotation, FC-EF, SNUNet, BIT, AMTNet, WS-Net++ are comparative models, and MDNet (Ours) is the proposed model.
Applsci 15 08794 g009
Table 1. Results of ablation experiments on LEVIR-CD, WHU-CD, and CLCD datasets (%).
ModelEMFCASAMDPEMTransformerCAMLEVIR-CDWHU-CDCLCD
F1IOUF1IOUF1IOU
MDNet×90.4382.3293.7988.6677.2562.39
MDNet×90.383.193.1289.0577.4762.86
MDNet××88.8980.7491.4585.3671.3858.12
MDNet×89.3981.592.5688.2477.4263.35
MDNet×90.6983.0593.588.5877.6562.61
MDNet××89.0881.0691.785.8672.2458.64
MDNet×90.8183.3994.1389.3578.2364.05
MDNet91.5684.0594.7790.2178.6864.43
The symbol “×” indicates that the corresponding module has been deleted, and “√” indicates that the corresponding module is retained. Bold fonts are used to highlight the best results.
Table 2. Performance evaluation of the LEVIR-CD dataset (%).
MethodPRF1IOU
FC-EF86.9180.1783.471.53
SNUNet89.1887.1788.1678.83
BiT89.2489.3789.3180.68
AMTNet91.8289.7190.7683.08
WS-Net++93.3288.9790.9683.51
MDNet (Ours)92.2590.6491.5684.05
The red bold font indicates the best performance and the black bold font indicates the second best.
Table 3. Performance evaluation of the WHU-CD dataset (%).
MethodPRF1IOU
FC-EF80.8775.4378.0564.01
SNUNet83.2591.3587.1177.17
BiT83.0588.885.8375.18
AMTNet92.8691.9992.2785.64
WS-Net++95.3692.794.0289.41
MDNet (Ours)94.3593.8494.7790.21
The red bold font indicates the best performance and the black bold font indicates the second best.
Table 4. Performance evaluation of the CLCD dataset (%).
MethodPRF1IOU
FC-EF71.747.657.2240.07
SNUNet70.8262.3766.3249.62
BiT61.4262.7562.0845.01
AMTNet78.6475.0676.8162.35
WS-Net++82.5875.4779.6465.34
MDNet (Ours)80.9776.5278.6864.43
The red bold font indicates the best performance and the black bold font indicates the second best.
Table 5. Model efficiency comparison table.
MethodFLOPs(G)Params(M)
FC-EF3.581.35
SNUNet54.8312.03
BiT8.753.49
AMTNet21.5624.67
WS-Net++40.59906.16
MDNet (Ours)26.4336.62
Disclaimer/Publisher’s Note: The statements, opinions and data contained in all publications are solely those of the individual author(s) and contributor(s) and not of MDPI and/or the editor(s). MDPI and/or the editor(s) disclaim responsibility for any injury to people or property resulting from any ideas, methods, instructions or products referred to in the content.