Article

Analysis of Penetration Performance Between a Hollow Penetrator and Seabed Clay by Coupled Eulerian–Lagrangian Method

1
School of Mechanical Engineering, Jiangsu University of Science and Technology, Zhenjiang 212100, China
2
School of Civil Engineering and Architecture, Jiangsu University of Science and Technology, Zhenjiang 212100, China
*
Author to whom correspondence should be addressed.
Appl. Sci. 2025, 15(16), 8778; https://doi.org/10.3390/app15168778
Submission received: 10 July 2025 / Revised: 5 August 2025 / Accepted: 5 August 2025 / Published: 8 August 2025
(This article belongs to the Section Marine Science and Engineering)

Abstract

Penetrating and coring technology is a critical approach for acquiring undisturbed long-columnar seabed sediment samples. The configuration and parameters of the penetrator structure directly affect penetration performance during the penetration process, which is critical for revealing penetration mechanics. A hollow penetrator structure was proposed, and its finite element model was built using the Coupled Eulerian–Lagrangian method with seabed clay to investigate the penetration performance. The penetration resistance exerted externally on the structure, the mean pressure distribution in the soil, and the soil flow after the penetration process were the main characteristics of the penetration performance. Sensitivity analysis on penetration velocity was carried out to balance the accuracy and the efficiency of the penetration simulation. Effects of penetrator structure parameters were assessed. Based on the simulations, the penetrator with a 15° penetrating head angle exhibited the minimum final penetration resistance, and the end face of the penetrating head had little effect on the soft clay penetration process. The diameter of the penetrator had a significant impact on the mean pressure distribution, and there was an almost linear relationship between its diameter and the penetration resistance. The results could provide critical evidence for optimizing the design of seabed sampling equipment.

1. Introduction

Penetrating and coring technology is an effective method for obtaining long columnar seabed sediment cores, which is widely used in marine mineral resource exploration, ocean and climate observation, marine geology research and other fields [1,2]. The Pressure Core Barrel (PCB) used in the International Deepsea Drilling Program recovered a 6.8 m core [3]. Additionally, the International Ocean Drilling Program’s PCS and EU-Fugro’s FPC collected multi-meter sediment cores per sampling [4,5,6,7,8]. Currently, the main target of the penetrating and coring projects in marine mineral resource exploration is to gather quantitative samples at a certain depth below the seabed, while analysis focused on the penetration process should be strengthened. In future exploration, this traditional penetrating mission may be displaced by miniaturized and precision-optimized coring technology integrated with Remotely Operated Vehicles (ROVs) [9,10], creating a demand for research on penetration performance of penetrators in clay within the deep-sea environment.
Experimental approaches have been applied to investigate the penetration performance in previous studies. Particle Image Velocimetry (PIV) was used as a visualization tool to monitor the penetration mechanics of bucket foundations and quantify soil deformation characteristics [11,12]. While all PIV implementations were conducted under two-dimensional plane-strain conditions, these fundamental limitations created a significant discrepancy between experimental findings and the three-dimensional real-world scenarios encountered in practical engineering applications. Meanwhile, X. Wang et al. and P. Ma et al. investigated the lateral bearing response of offshore wind turbine systems through centrifuge testing [13,14]. Additionally, Hossain et al. and Teh et al. conducted a series of centrifuge tests to investigate the bearing capacity of spudcan foundations for offshore jack-up drilling platforms [15,16]. Centrifuge testing incurs prohibitively high costs and faces significant challenges in observing soil deformation within scaled models. Furthermore, the deep-sea environment cannot be fully simulated in laboratory settings, highlighting the limitations of the experimental approaches.
In addition to experimental approaches, the Finite Element Method (FEM) has also been applied to analyzing the penetration process with large deformation clay. Traditional FEM faces severe mesh distortion during large deformation penetration analysis, causing computational errors and convergence issues. Advanced techniques like RITSS (Remeshing and interpolation technique with small strain model), ALE (Arbitrary Lagrangian–Eulerian), and CEL (Coupled Eulerian–Lagrangian) methods have been developed to address these limitations. When simulating interactions between mechanical structures and soil in marine engineering, such as pipeline launching, spudcan penetration, and anchors installation, the CEL method has been widely and efficiently used as RITSS involves intensive computations and ALE introduces artificial interface artifacts [17]. P. Hu et al. proposed a Coupled Eulerian–Lagrangian (CEL) numerical simulation method to model spudcan penetration tests, successfully reproducing the penetration behavior observed experimentally [18]. T. Wang et al. simulated the deep burial process of a T-shaped rod in soft clay using the CEL method, and the simulated penetration resistance agreed with the previous centrifugal test data [19]. W. Tu et al. effectively conducted CEL modelling to evaluate installation-phase penetration resistance mechanics for bucket foundations in clay deposits [20]. The CEL method has been proved to be an effective approach for analyzing penetration performance of mechanical structures in soil, including aspects like penetration resistance and soil flow characteristics.
The purpose of this study is to investigate the penetration performance between a penetrator structure and seabed clay, including the penetration resistance exerted externally on the structure, the variation in soil mean pressure and the soil flow, in order to develop a low-disturbance penetrator structure suitable for the deep-sea environment. Firstly, a hollow penetrator structure was presented, and its finite element model was developed using the CEL method. Secondly, sensitivity analysis of penetration velocity was assessed to determine an appropriate velocity value, considering both the accuracy and the efficiency of the simulation. Finally, simulations of the penetration process were carried out under different penetrator structure parameters. The results of this study can improve the understanding of the penetration mechanics between a hollow penetrator structure and seabed clay, and provide critical evidence for optimizing the design for subsea excavation equipment.

2. Finite Element Model

2.1. Model Description

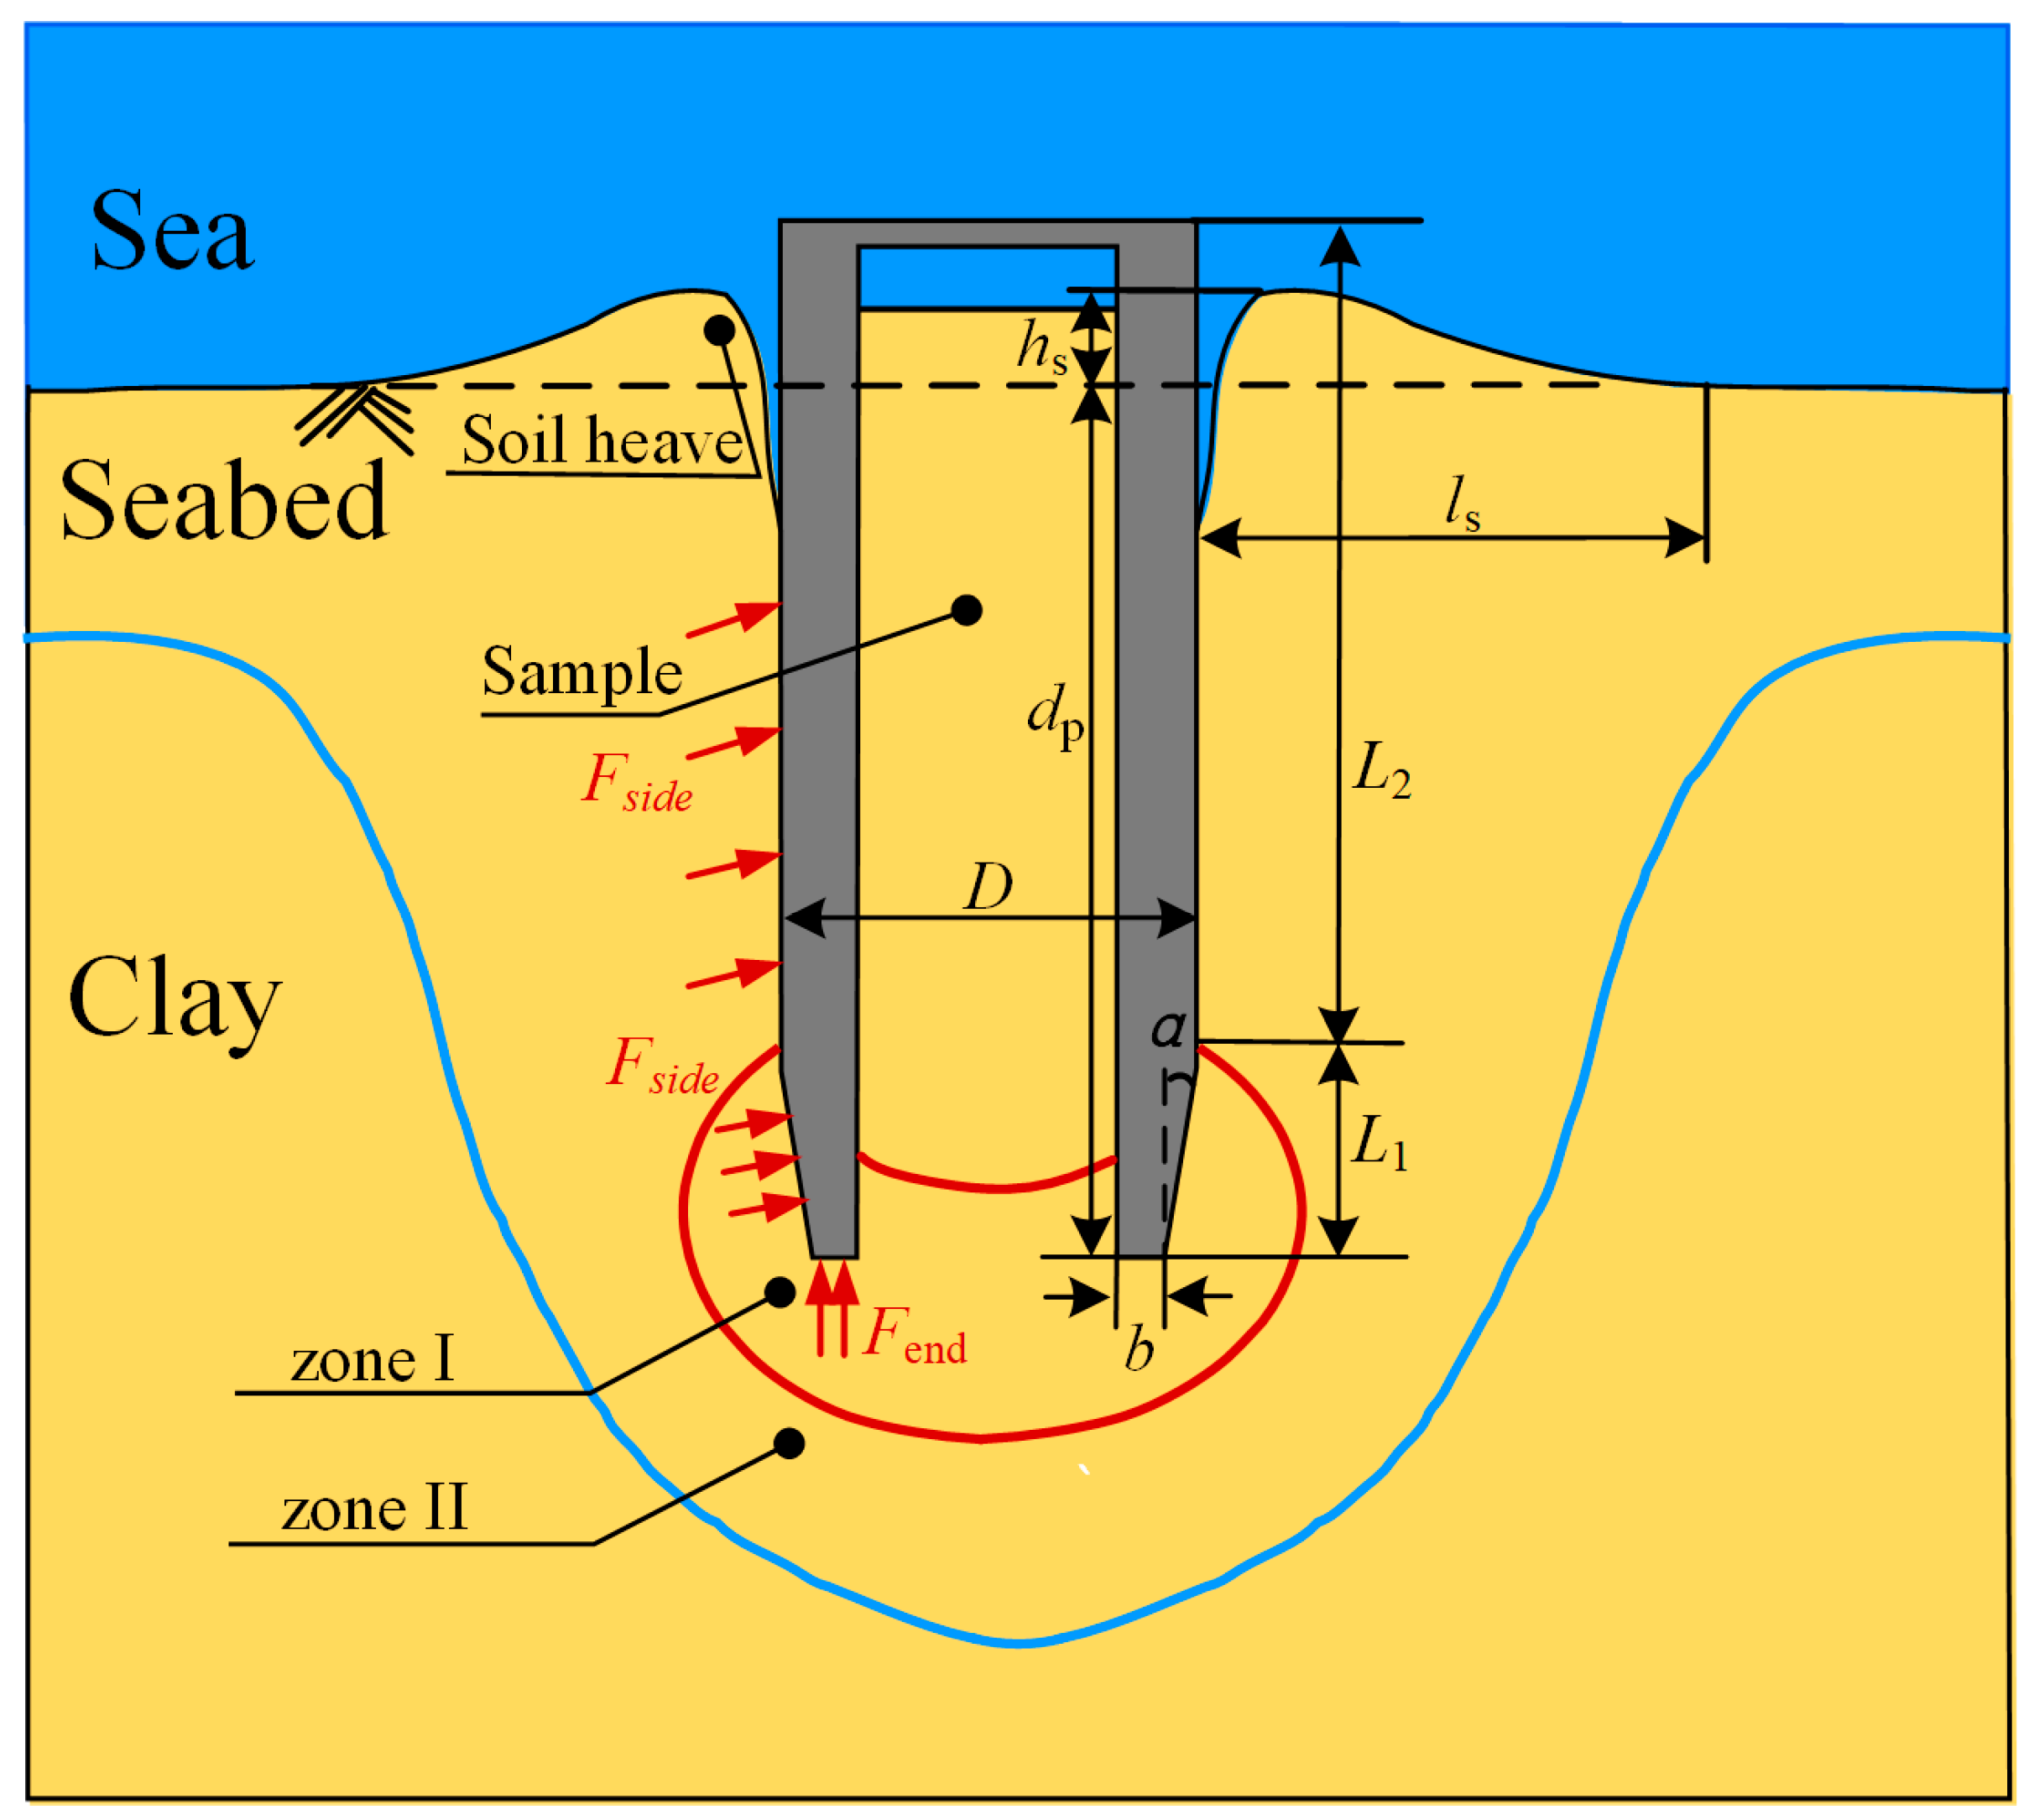
The penetrating and coring mechanism consists of a penetrating tube, a penetrating head, a sealing system with a ball valve, and a coring tube, as shown in Figure 1. Since this study primarily focuses on the penetration resistance exerted externally on the mechanism, the sealing system and the coring tube are simplified in subsequent analyses. The penetrator–soil interaction is shown in Figure 2. The definitions of the parameters illustrated in Figure 2 are presented in Table 1. According to the International Deep Sea Drilling Project (DSDP) and the Ocean Drilling Program (ODP), the standard diameter of drill pipes is typically 127 mm, with core diameters ranging from 51 mm to 86 mm [3,4,5]. This study focuses on a penetration diameter of 74 mm as the research subject.
For undrained clay, the mean pressure, defined as one-third of the sum of principal stresses, is a critical parameter due to its direct correlation with pore water pressure. Based on the distribution of mean pressure after the penetration process, the penetrator–soil interaction zones can be categorized into Zone I and Zone II, as shown in Figure 2. Zone I is the direct interaction area between the penetrator and the soil, where the soil is squeezed, resulting in a significant increase in mean pressure. Zone II represents the indirect interaction area, where the mean pressure exceeds its original plastic stress.
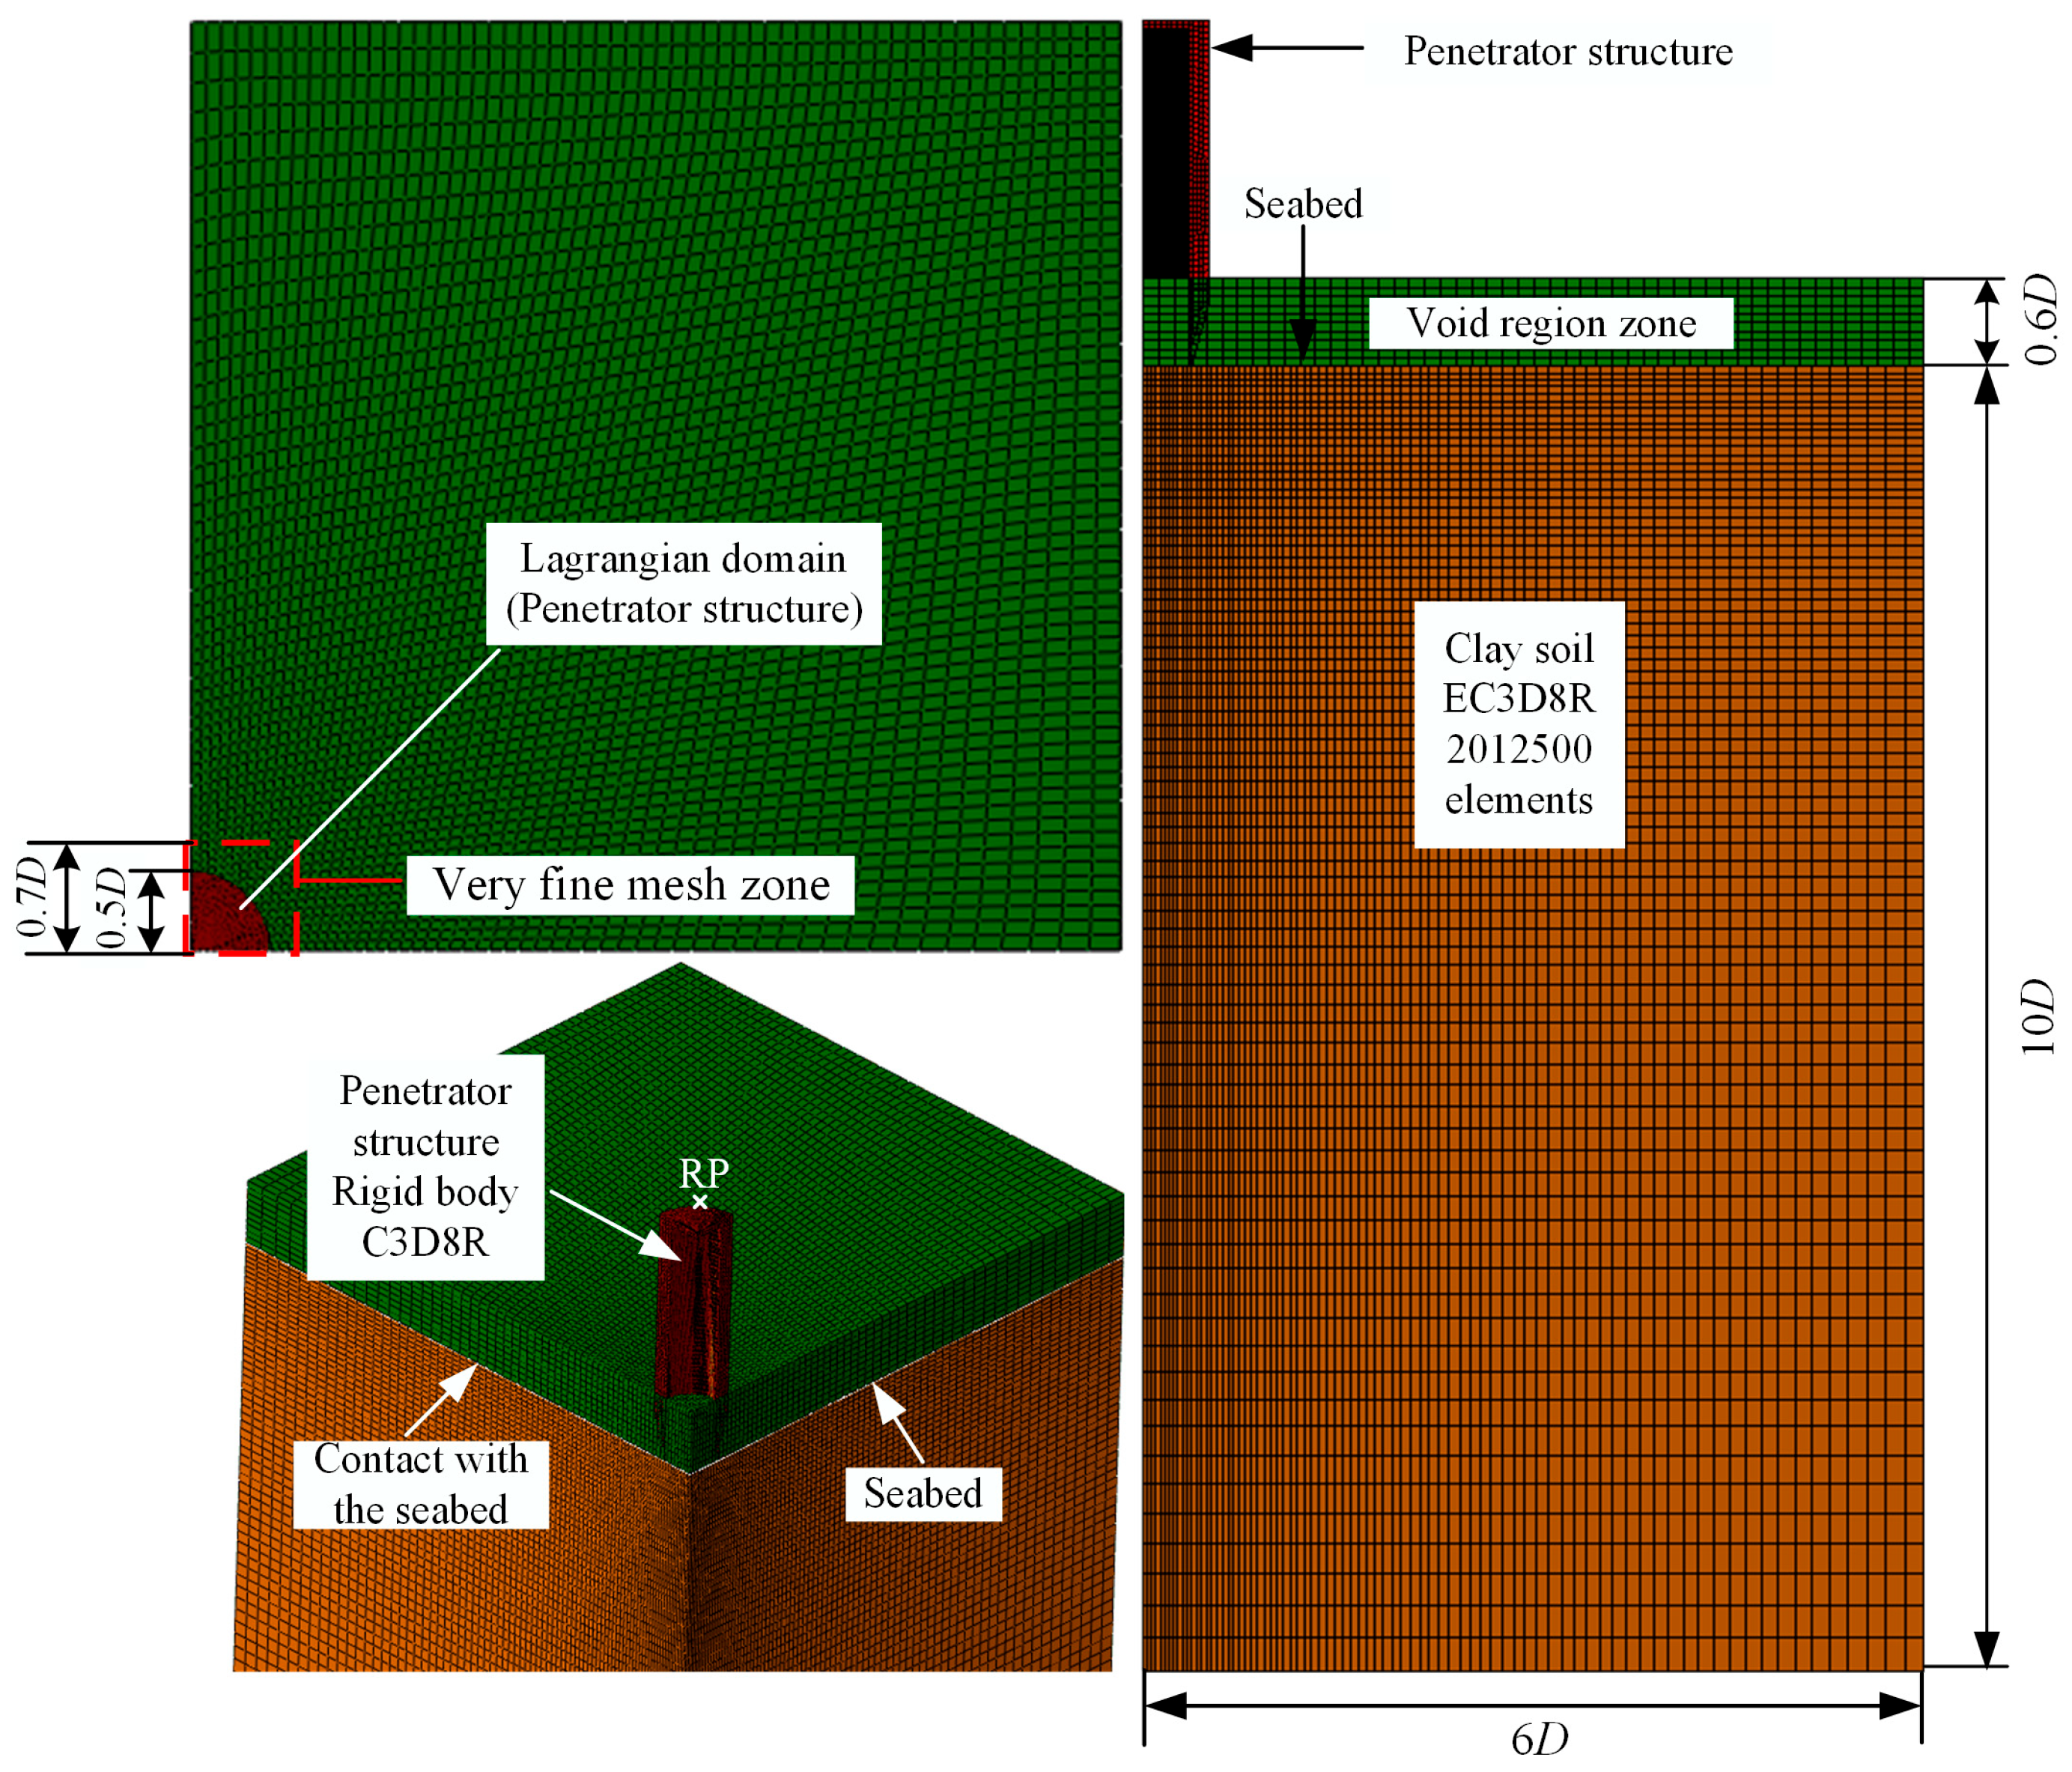
The finite element model (FEM) simulating the penetration process was developed in Abaqus 2022 software using the Coupled Eulerian–Lagrangian (CEL) method, where a symmetric model configuration was adopted to enhance computational efficiency [21,22]. The axisymmetric geometric model is detailed in Figure 3. To mitigate boundary effects [23,24], the finite element mesh of the soil domain was assigned dimensions of 6D in radius and 10D in height. A void layer was placed on top of the seabed to enable the soil to flow into the Eulerian elements during the penetration process [25,26]. The boundary conditions for the normal direction at the bottom and periphery of the soil domain were set to zero velocity, ensuring that the Eulerian material remained within the Eulerian domain.

2.2. FE Model Using the CEL Method

In geotechnical numerical analysis, soil is defined by an elastoplastic model. In ABAQUS, the elastic model and the plastic model are defined separately. This study adopts a combined Mohr–Coulomb model and linear elastic model. The linear elastic stress–strain relationship for soil is expressed as Equation (1).
ε 11 ε 12 ε 13 γ 11 γ 12 γ 13 = 1 / E ν / E ν / E 0 0 0 ν / E 1 / E ν / E 0 0 0 ν / E ν / E 1 / E 0 0 0 0 0 0 1 / G 0 0 0 0 0 0 1 / G 0 0 0 0 0 0 1 / G σ 11 σ 22 σ 33 σ 12 σ 13 σ 23
In Equation (1), E represents the elastic modulus of the soil. G represents the shear modulus of the soil. The relationship between G and E is G = E/[2/(1 + υ)], and υ represents the Poisson’s ratio of the soil.
In the Mohr–Coulomb model, the plastic failure of soil materials is governed by shear stress, as shown by the undrained shear strength, Su, in Equation (2).
S u = c + σ tan φ
In Equation (2), c represents the cohesion of the soil, and φ represents the internal friction angle of the soil. Normal stress, σ, can be simplified to the self-weight stress of the soil at a certain depth, as σ = γdp, where γ represents the unit weight of the soil and dp represents the depth of the soil.
Fside and Fend are the integral results of the stresses exerted on the sidewall and the end face of the penetrator structure. In Abaqus, this process is accomplished through the Explicit Stress Integration Algorithm.

2.3. Soil Constitutive Model and Mean Pressure

The soil model was provided in Abaqus for the penetration process, incorporating the following characteristics:
(1)
The clay was modelled as an undrained elastic–perfectly plastic material during the penetration process, which was described by the Tresca yield criterion with an associated flow rule;
(2)
The strain rate of the soil was not considered in this study;
(3)
The penetration process was conducted using a displacement-controlled method.
Marine clay deposits are usually non-homogeneous and exhibited linear variation of Su with depth [27]. The relationship between the undrained shear strength of the soil, Su (kPa), and depth, z (m), is Su = Sum + k z, where Sum (kPa) is the soil undrained shear strength at the ground surface and k (kPa/m) represents the rate of increase in shear resistance with depth. In general, the linear gradient k of Su with depth ranges between 0 and 3 [28]. Chen reported that the undrained shear strength of seafloor sediments in the South China Sea ranges from 1 to 3 kPa [29]. Sum = 2.0 and k = 1 were considered in this analysis to ensure the value of Su was the same as that of seafloor sediments in the South China Sea. The other parameters of the soil were also under consideration. The effective soil weight was adopted as γ = 8.7 kN/m3. The elastic modulus of the soil, E, was 500 times that of Su, and Poisson’s ratio, υ, was taken as 0.499 [30]. The penetrator structure was penetrated using a displacement-controlled method with a soil–structure interface friction coefficient of 0.25. In the numerical simulation, it was modelled as a rigid body to simplify computational analysis.
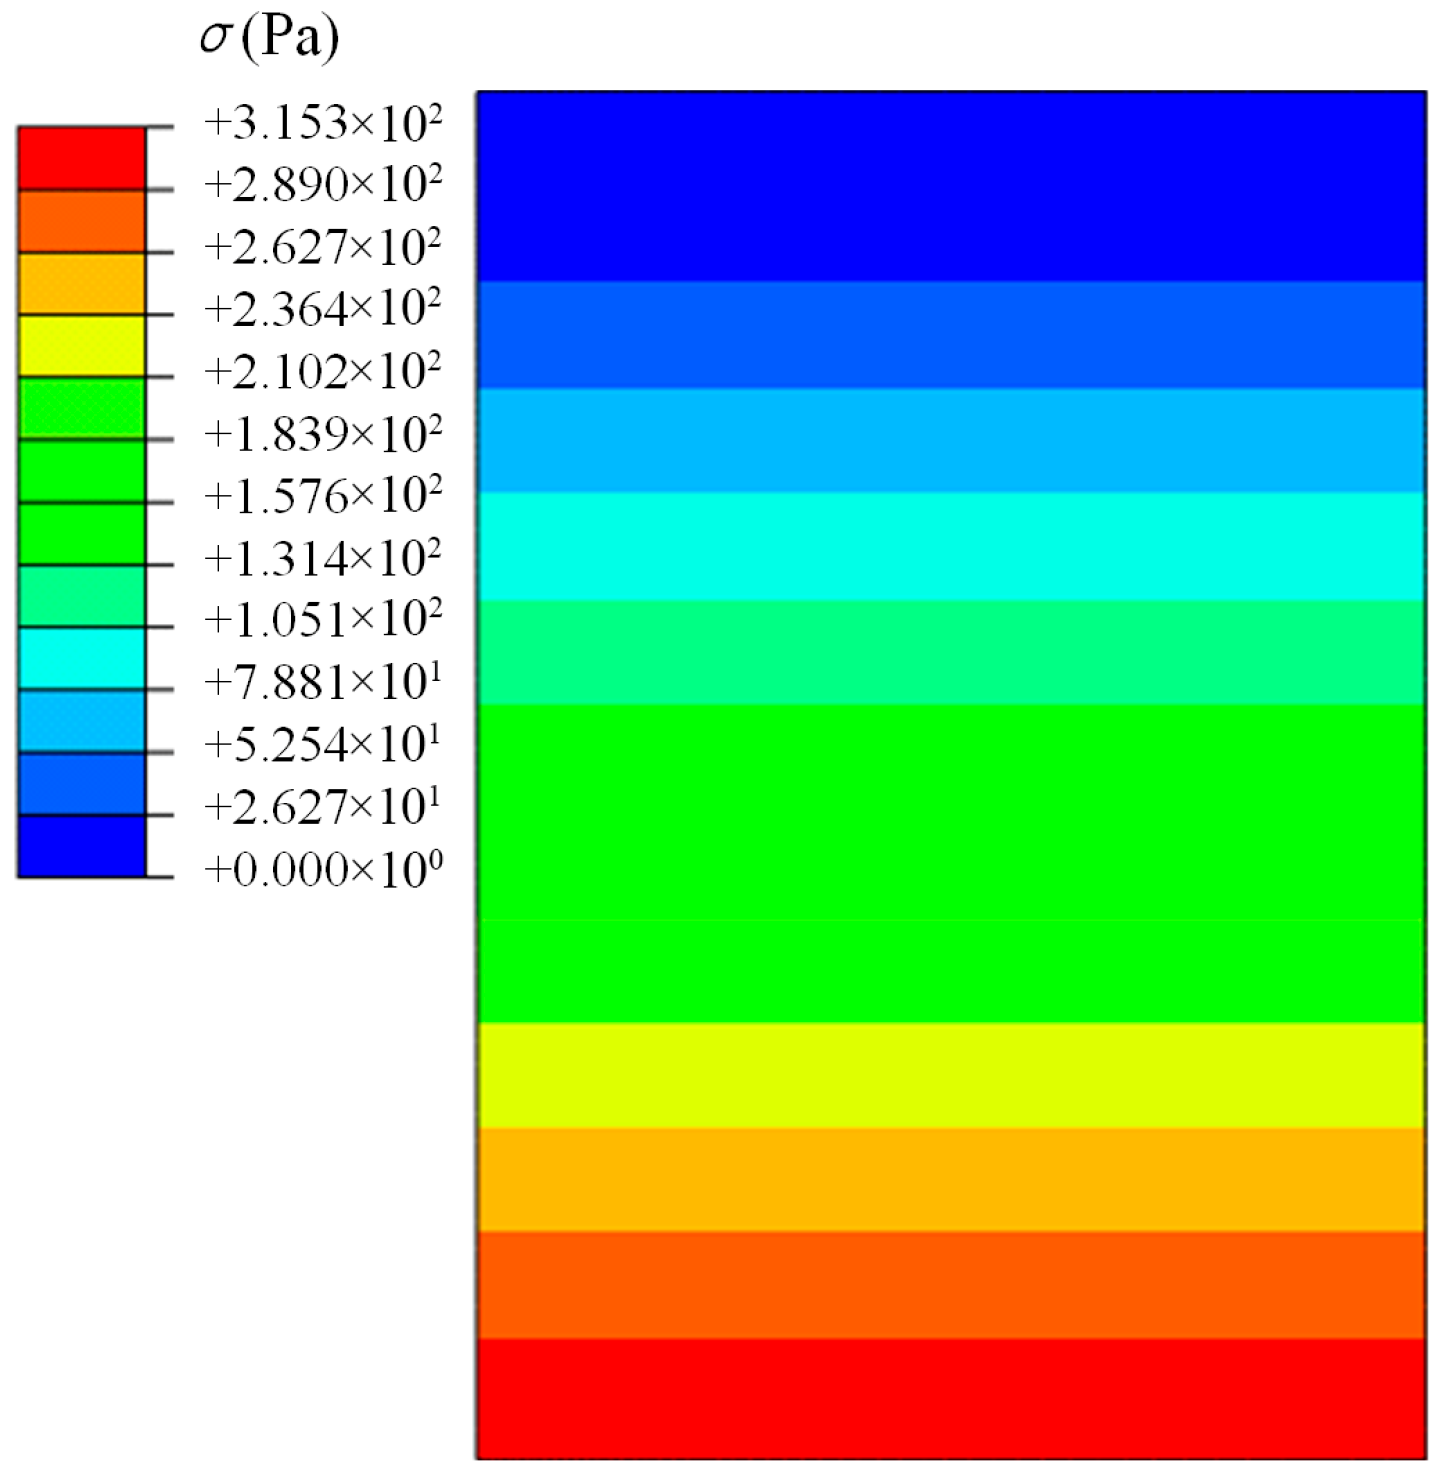
Although the Explicit module of ABAQUS cannot explicitly account for pore water pressure, the soil mean pressure is presented as it effectively represents pore water pressure behavior [31]. Figure 4 illustrates the mean soil pressure before penetration. The results demonstrate that the mean pressure increases linearly with depth, attaining a maximum mean pressure (σm) of 315.3 Pa.

2.4. Validation of the Method

The Coupled Eulerian–Lagrangian (CEL) methodology was applied in this study to investigate the large deformation behavior of an undrained soil constitutive model. This CEL methodology was conducted through comparative evaluation of pipe penetration behavior with RITSS method predictions and centrifuge model test results [32,33]. With a pipe diameter (Dp) of 0.8 m, the soil’s undrained shear strength (Su) followed the relationship Su = 2.3 + 3.6z kPa, where z represented depth. The effective unit weight of the soil was 6.5 kN/m3, and the pipe–soil interface exhibited a friction coefficient of 0.3. The penetration velocity of the pipe was set at 1/20th of its diameter (40 mm/s). This CEL model was assessed in this study, as shown in Figure 5. The vertical resistance, V (N), was normalized by DpSu, and the pipe displacement, W (m), was normalized by Dp, while Dp was the diameter of the pipe and Su was the undrained shear strength of the soil. The results simulated by the CEL method closely aligned with the predictions of the RITSS method and the centrifuge model test. Therefore, the CEL method can be effectively applied to simulate the penetration process of the penetrator under large soil deformation in this study.

3. Sensitivity Analysis of Penetration Velocity

Empirical evidence from Wang et al. [34] demonstrates that the performance of the CEL method is affected by the penetration velocity, as it can be very time-consuming to simulate the actual penetration process with the real penetration velocity. Thus, sensitivity analysis of the CEL method on penetration velocity needs to be conducted to identify the optimum penetration velocity. Four different penetration velocities, v = 7.4 mm/s, 5.55 mm/s, 3.7 mm/s, and 1.85 mm/s, were considered in this study. The penetration resistance of the penetrator structure is shown in Figure 6, where α = 15°, b/D = 0.027, and L2 = 160 mm.
Fend exhibited identical behavior for dp/D = 0.25; however, beyond a normalized depth of 0.25, Fend exhibited a positive correlation with velocity and demonstrated asymptotic convergence toward a stable value. The interaction between the end face of the penetrator and the soil could be regarded as a process of compression deformation. Since the soil was modelled as an elastic–perfectly plastic material, the soil was elastically deformed when dp was low at the beginning of the penetration process, and Fend presented a linear relationship with dp rather than penetration velocity. When dp was larger than the elastic deformation displacement limit of the soil, the soil was compressed due to plastic deformation. As the kinetic energy of the penetrator structure increased with its velocity, the interaction between the penetrator and the soil became more intense, resulting in an increase in soil deformation and the resistance of the end face on the penetrator, Fend.
The trend in Fside was consistent before dp/D = 1.0. When dp/D > 1.0, Fside showed positive correlations with velocity. Fside is mainly the friction between the side face of the penetrator structure and the hole wall of the soil during the penetration process. As shown in the above analyses, the normal pressure between the side face of the penetrator structure and the hole wall of the soil increased as its normal pressure increased when the soil was plastically deformed beyond its elastic deformation displacement limit. Combined with the parameters of the penetrator structure, the coring tube was in contact with the hole wall to create friction when dp/D = 1. When dp/D > 1, Fside was positive with respect to penetrating velocity due to the increase in friction. However, the interaction between the side face of the penetrator structure and the hole wall of the soil was instability due to the flow of the soil during the penetration process. As a result, the increase in Fside presented a disturbing phenomenon. The value of Ftotal was not significantly different, as the maximum average deviation of penetration resistance did not exceed 10%, which showed that the resistance was slightly influenced by the velocity effect.
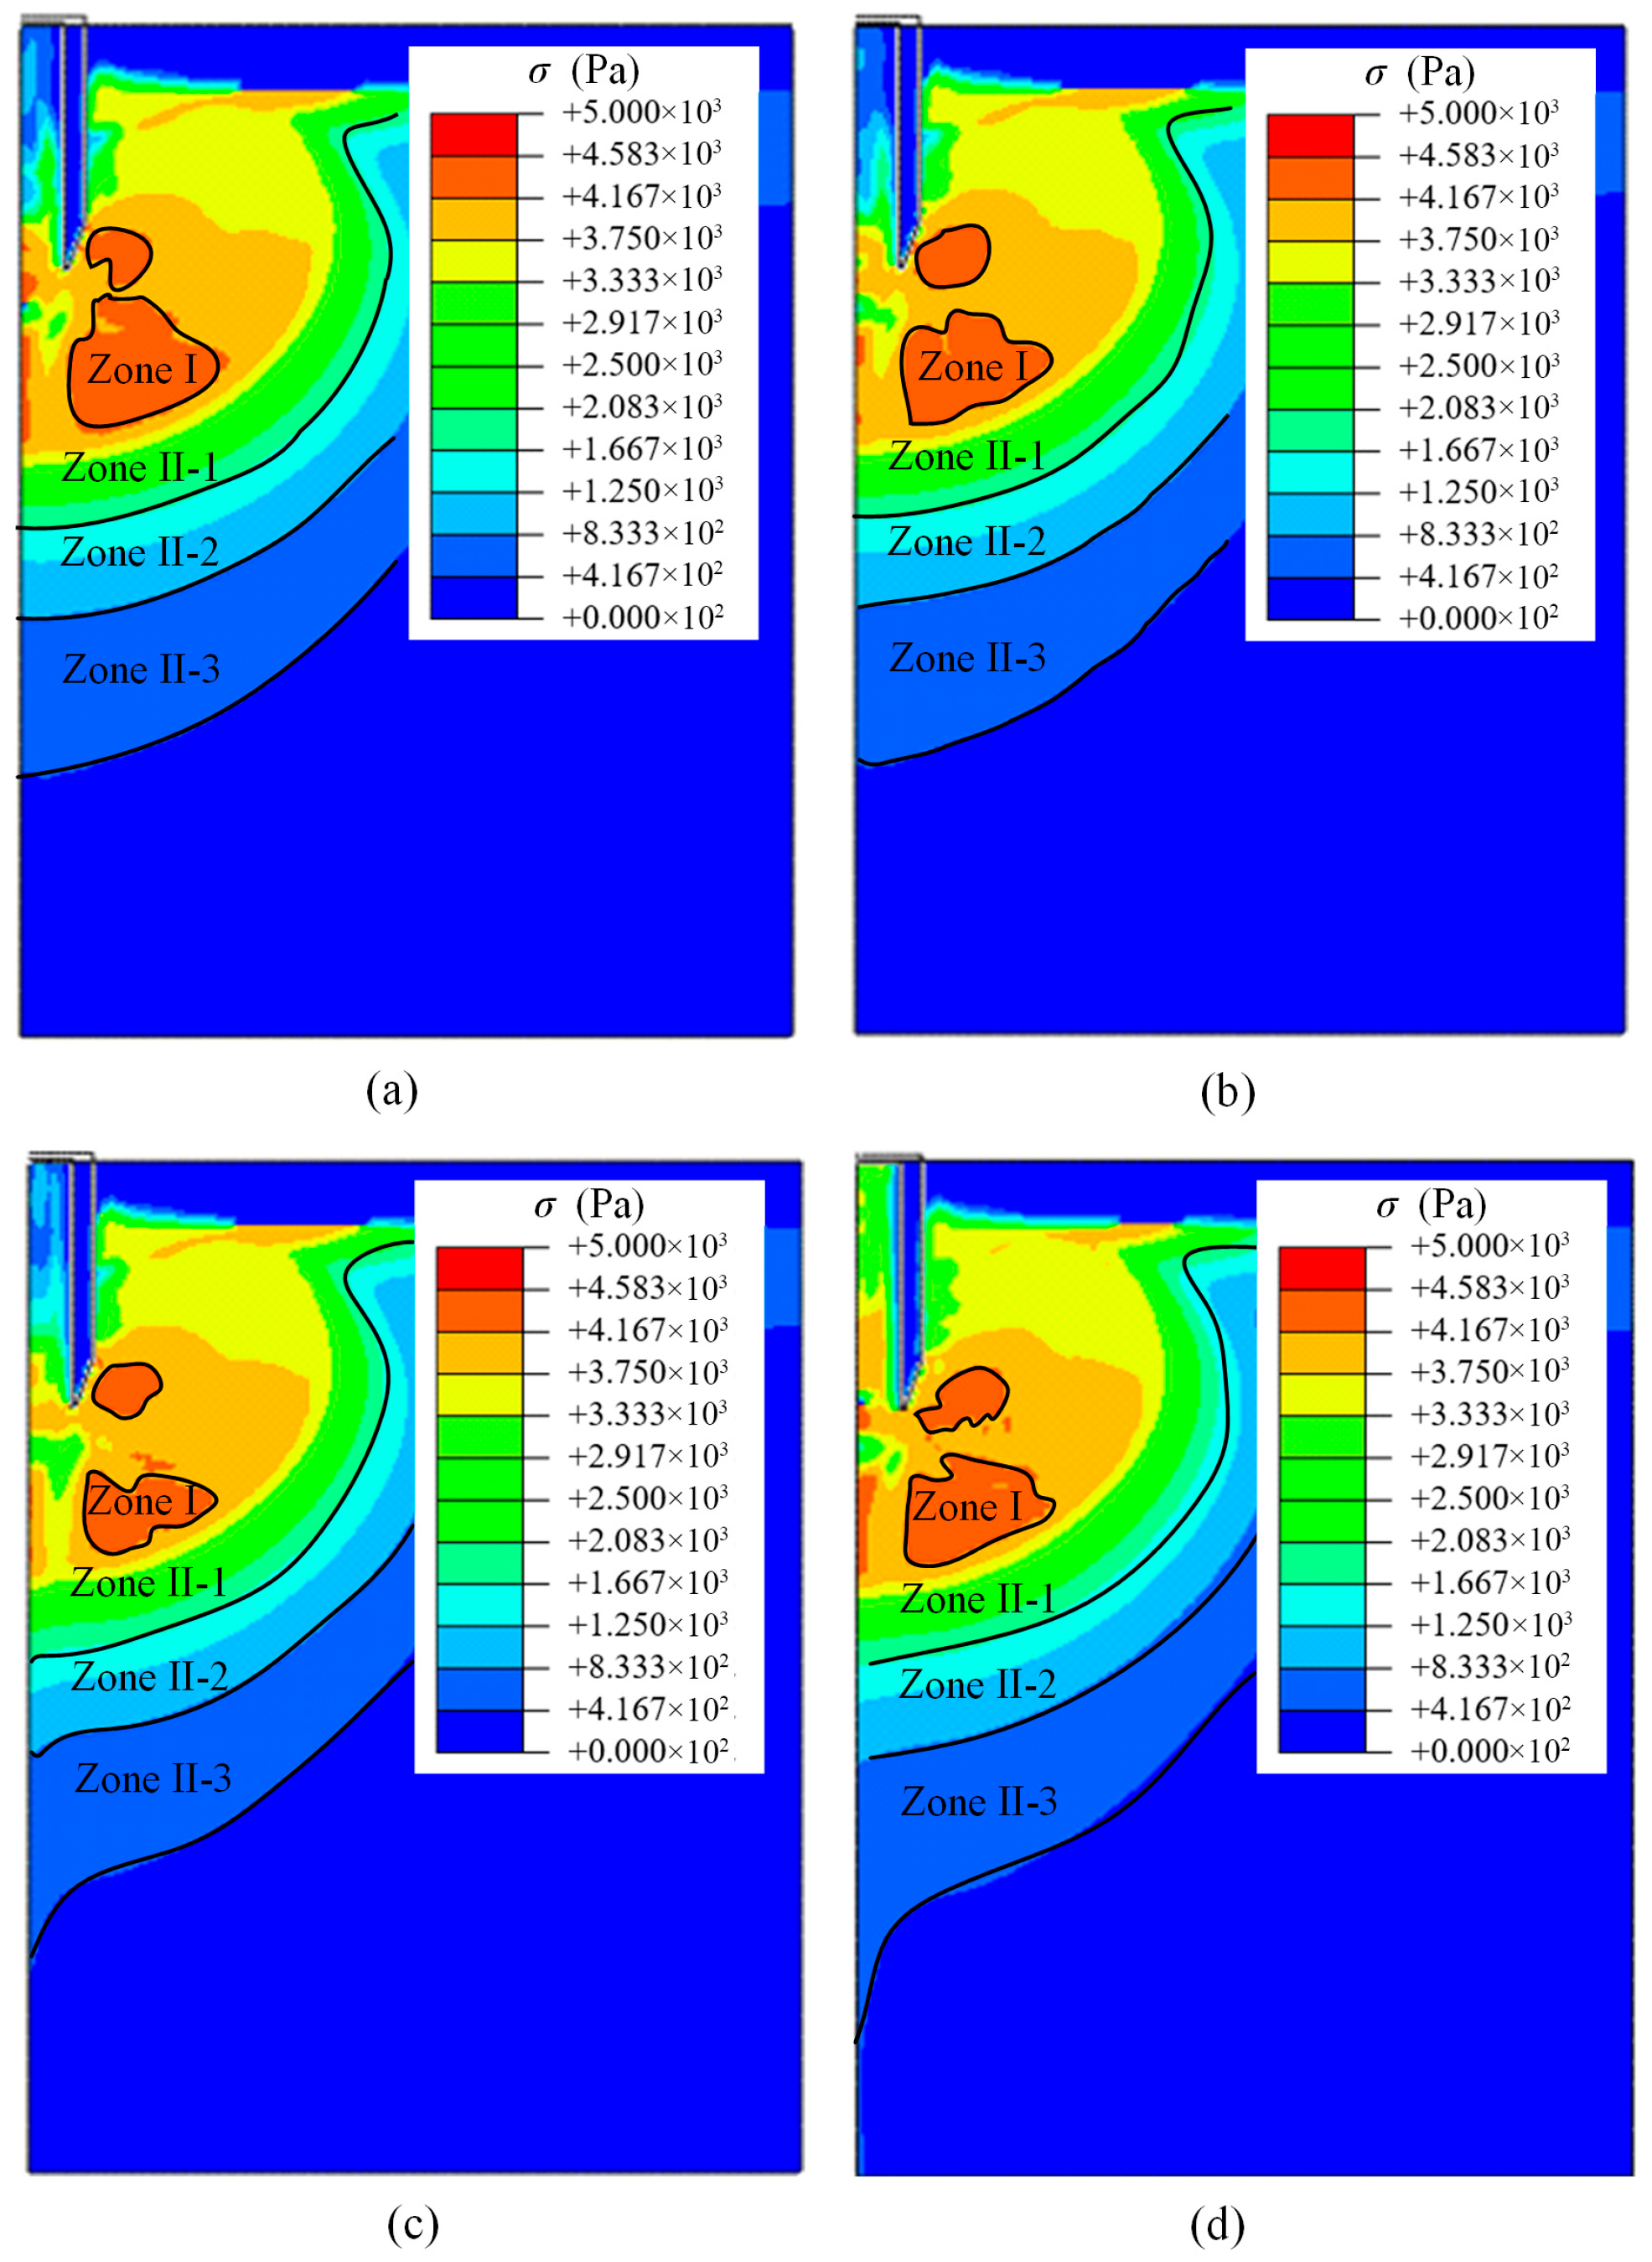
The mean pressures at maximum penetration depth at four different penetration velocities were analyzed, as shown in Figure 7. Based on the pressure variations in the soil induced by penetration, Zone II can be meticulously subdivided into Zone II-1, Zone II-2 and Zone II-3. Zone I presents the most pronounced soil compression with the highest pressure, with its minimum pressure being 13.2 times σm. Zone II-1 represents the second partitioned mean pressure area, exhibiting lower pressure compared with Zone I, with its minimum pressure being 10.3 times σm. Zone II-2 constitutes the third partitioned mean pressure area, characterized by reduced pressure compared with Zone II-1, with its minimum pressure being 2.65 times σm. Zone II-3, as the fourth partitioned mean pressure area, corresponds to the minimum pressure level, with its minimum pressure being 1.3 times σm. In this study, the area outside Zone II-3 is not studied, where the interaction between the penetrator and the soil is ignored. Amongst the four different penetration velocities, the maximum pressure was 15.9 times that of σm, the distribution pattern of mean pressure was generally consistent, and the size of Zone I also remained relatively consistent. When the velocity was 1.85 mm/s, the entire area of mean pressure was slightly larger.
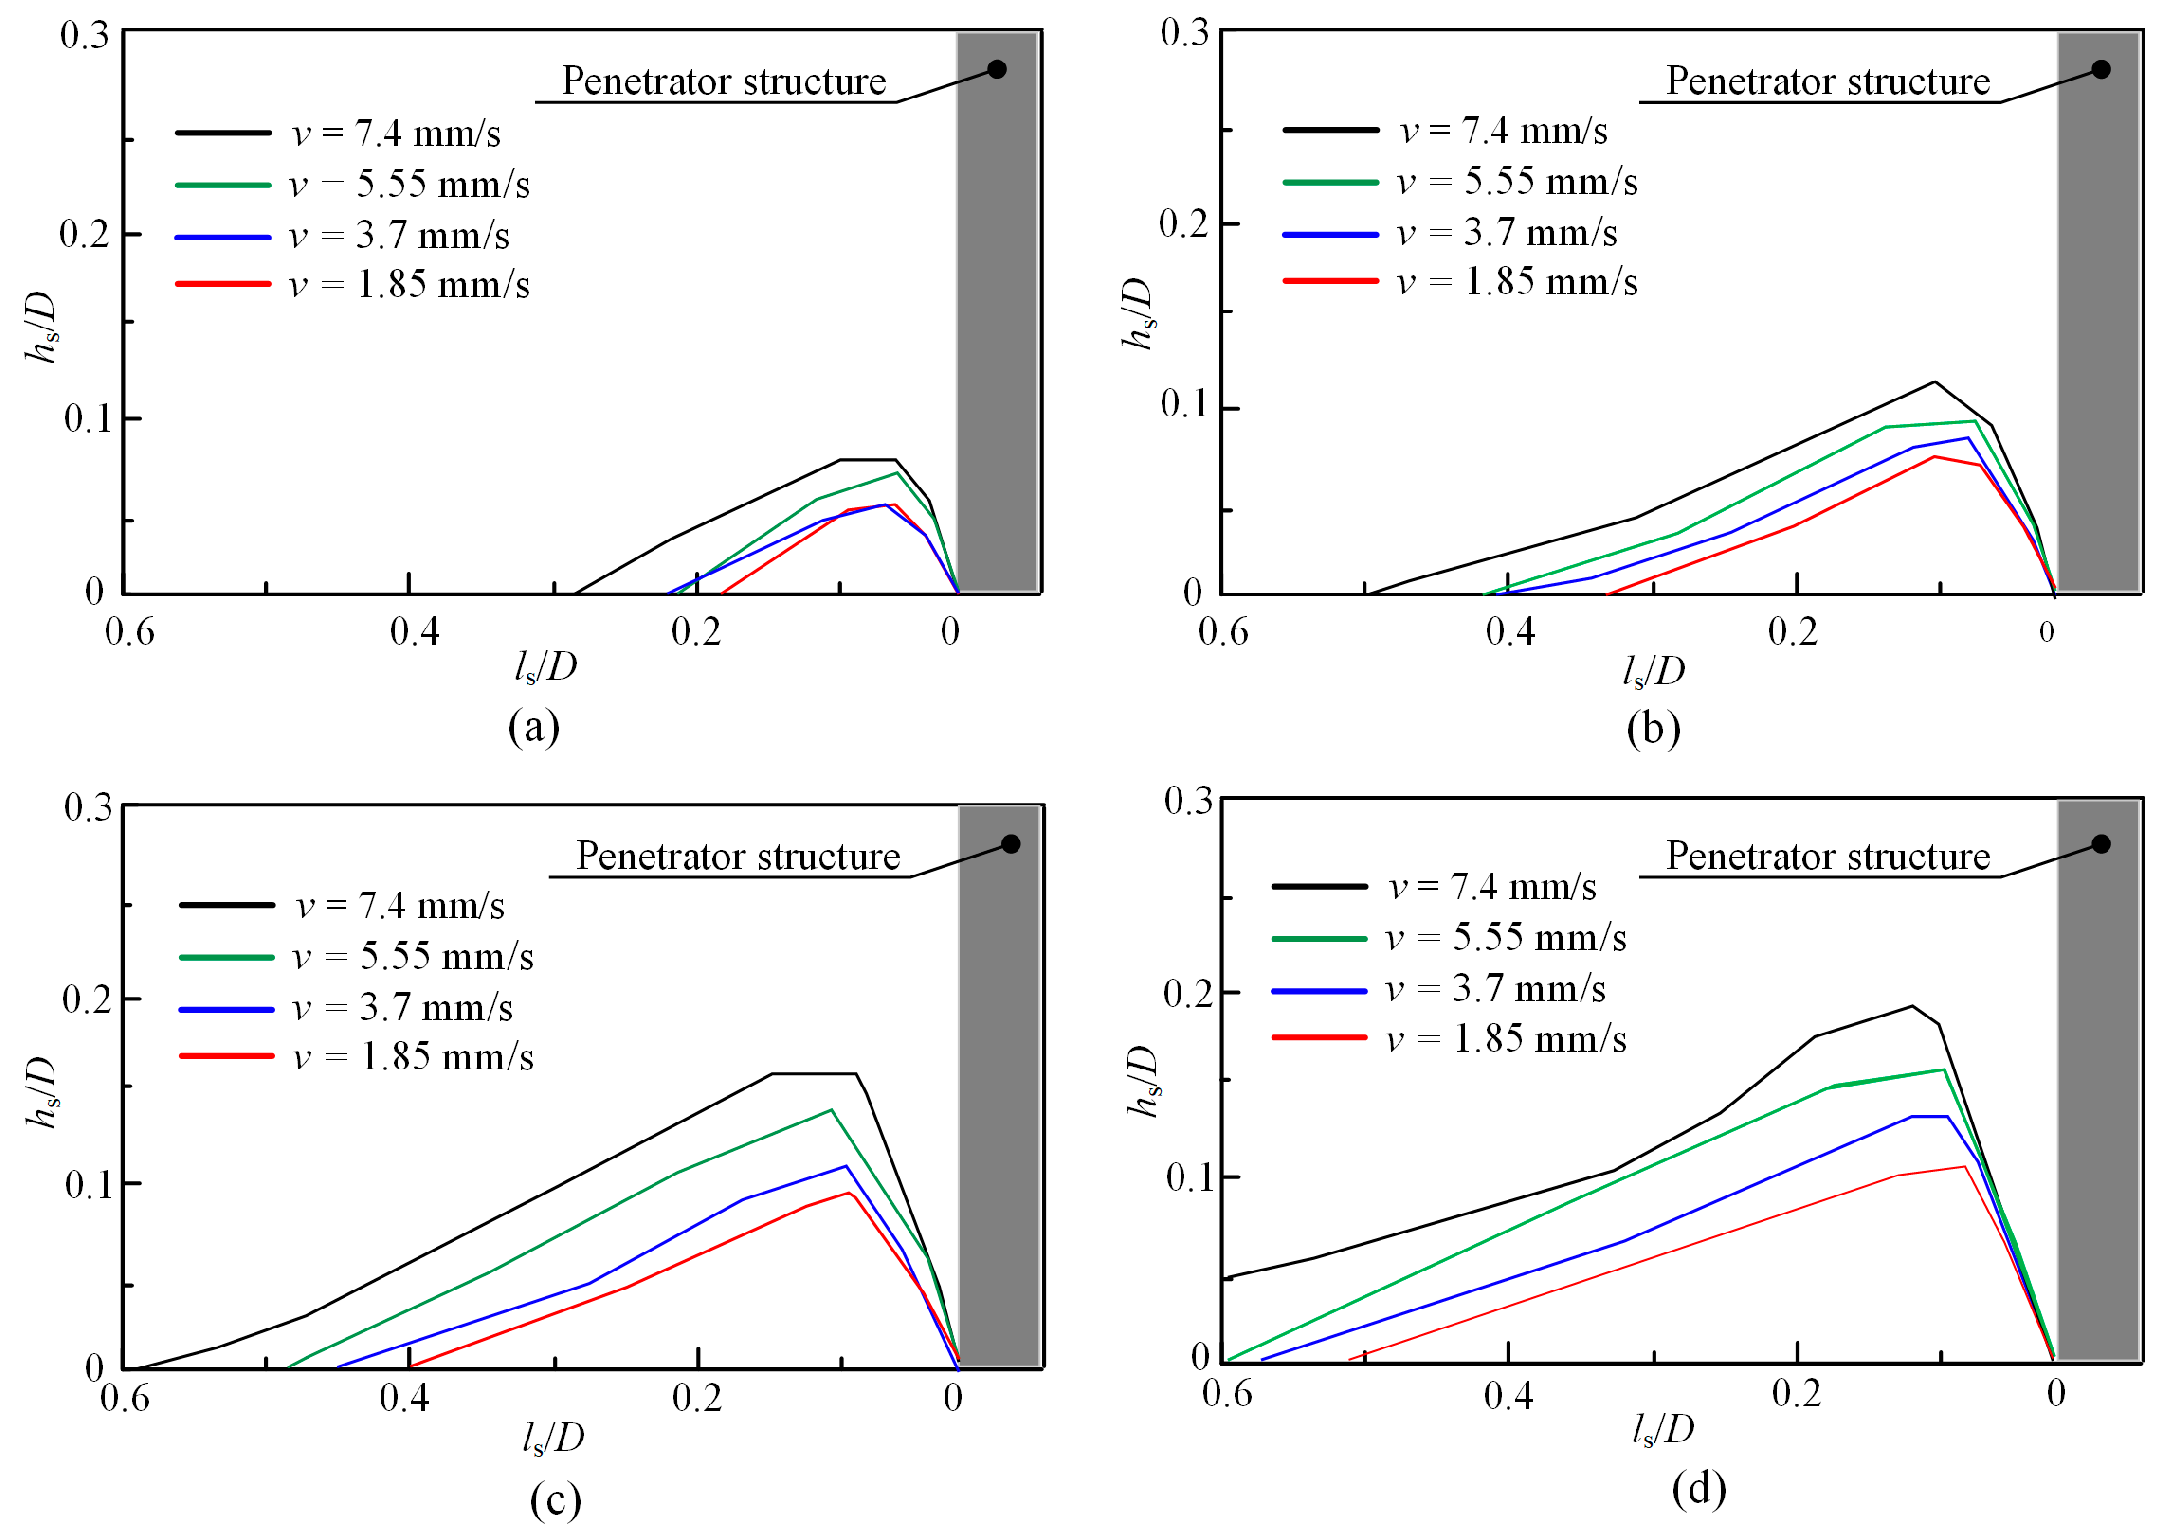
To investigate the influence of velocity on soil behavior, the performance of the soil heave at four different depths was analyzed (with normalized penetration depths for dp/D = 0.49, 0.96, 1.43, and 1.89), as shown in Figure 8. The height of the soil heave, hp, exhibited a positive correlation with penetration depth. Furthermore, with increasing penetration velocity, the soil heave became more pronounced. The penetration velocity of 7.4 mm/s was four times that of 1.85 mm/s, and the hp at different depths was approximately two times higher.
Due to the balance between CEL computational efficiency and the characteristic of the penetration performance, the proper penetration velocity was set to 7.4 mm/s in subsequent analyses. On the one hand, higher penetration velocity causes more pronounced soil heave, facilitating the observation of soil flow, while the resistance on the penetrator structure and the mean pressure of the soil are not sensitive to penetration velocity. On the other hand, the CEL computational efficiency at a penetration velocity of 1.85 mm/s is four times that of 7.4 mm/s.

4. Parametric Study of Penetrator Structure on the Penetration Performance

The parameters of the penetrator structure will affect the penetration performance during the penetration process. In this section, cross-simulation of penetrating head parameters was carried out first, including α (the angle of the penetrating head) and b (the width of the end face on the penetrating head), set as shown in Table 2. Then, the effect of the diameter on the penetration performance was presented through the normalized parameter, length/diameter ratio.

4.1. Effect of the Parameter of the Penetrating Head

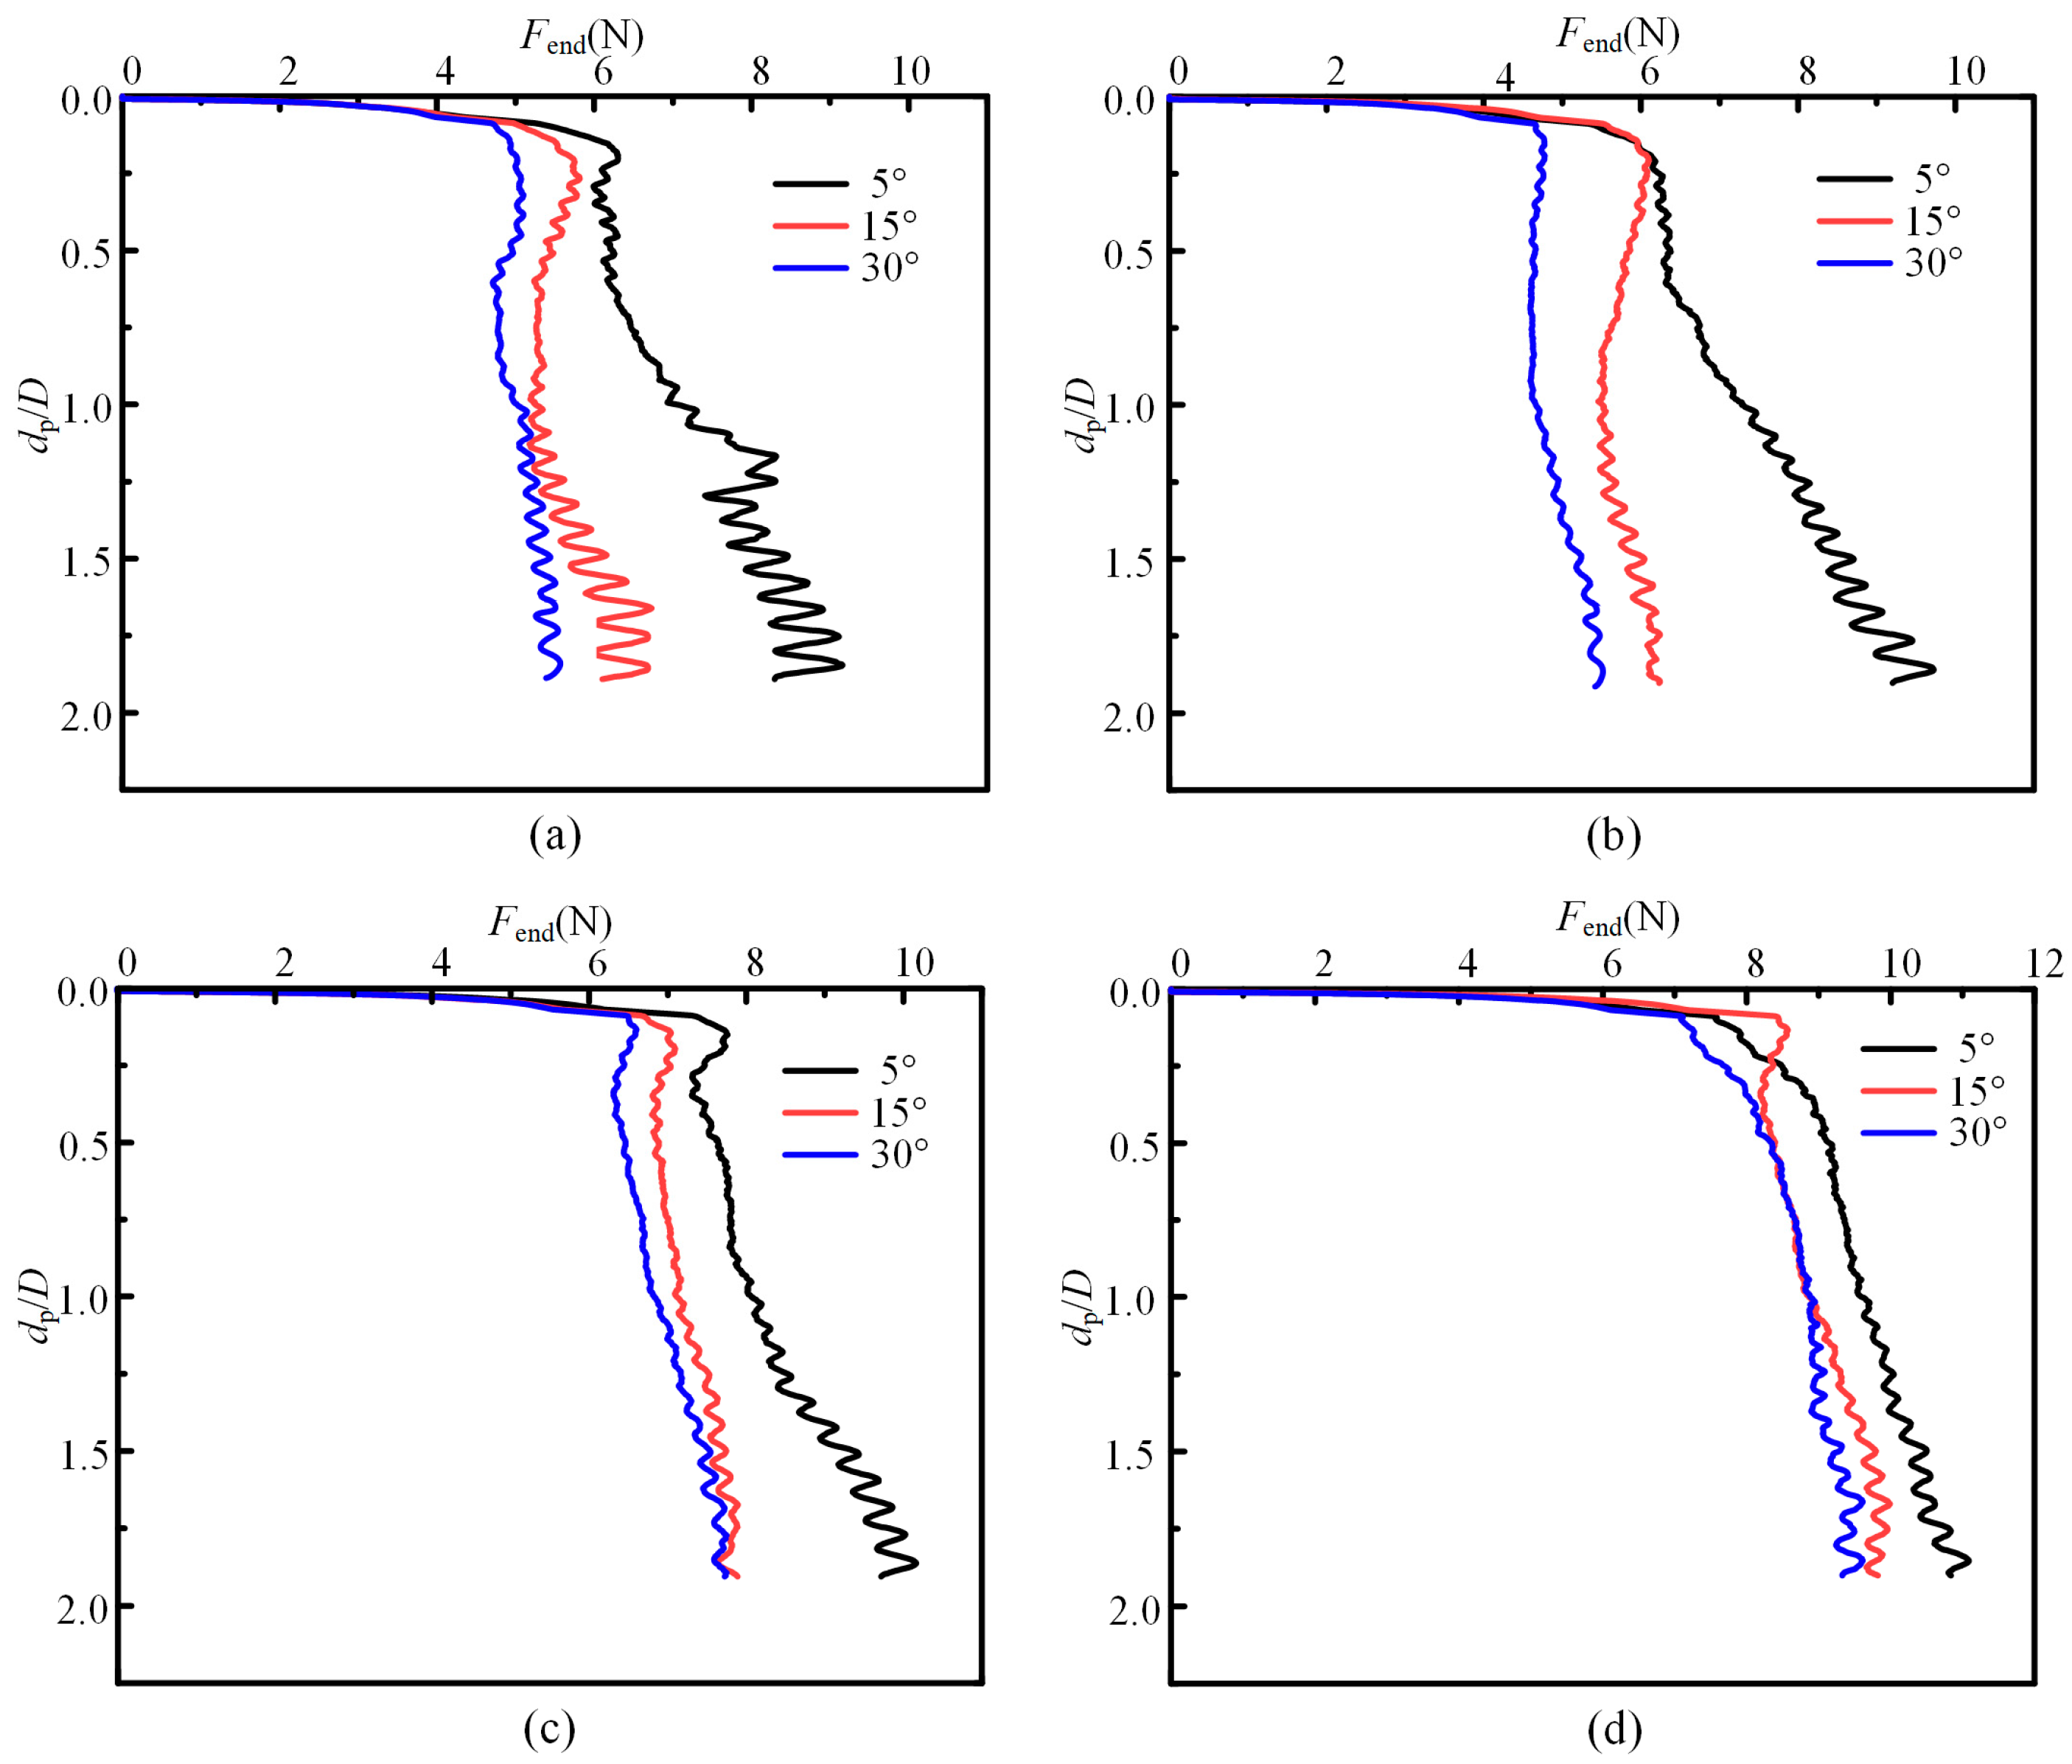
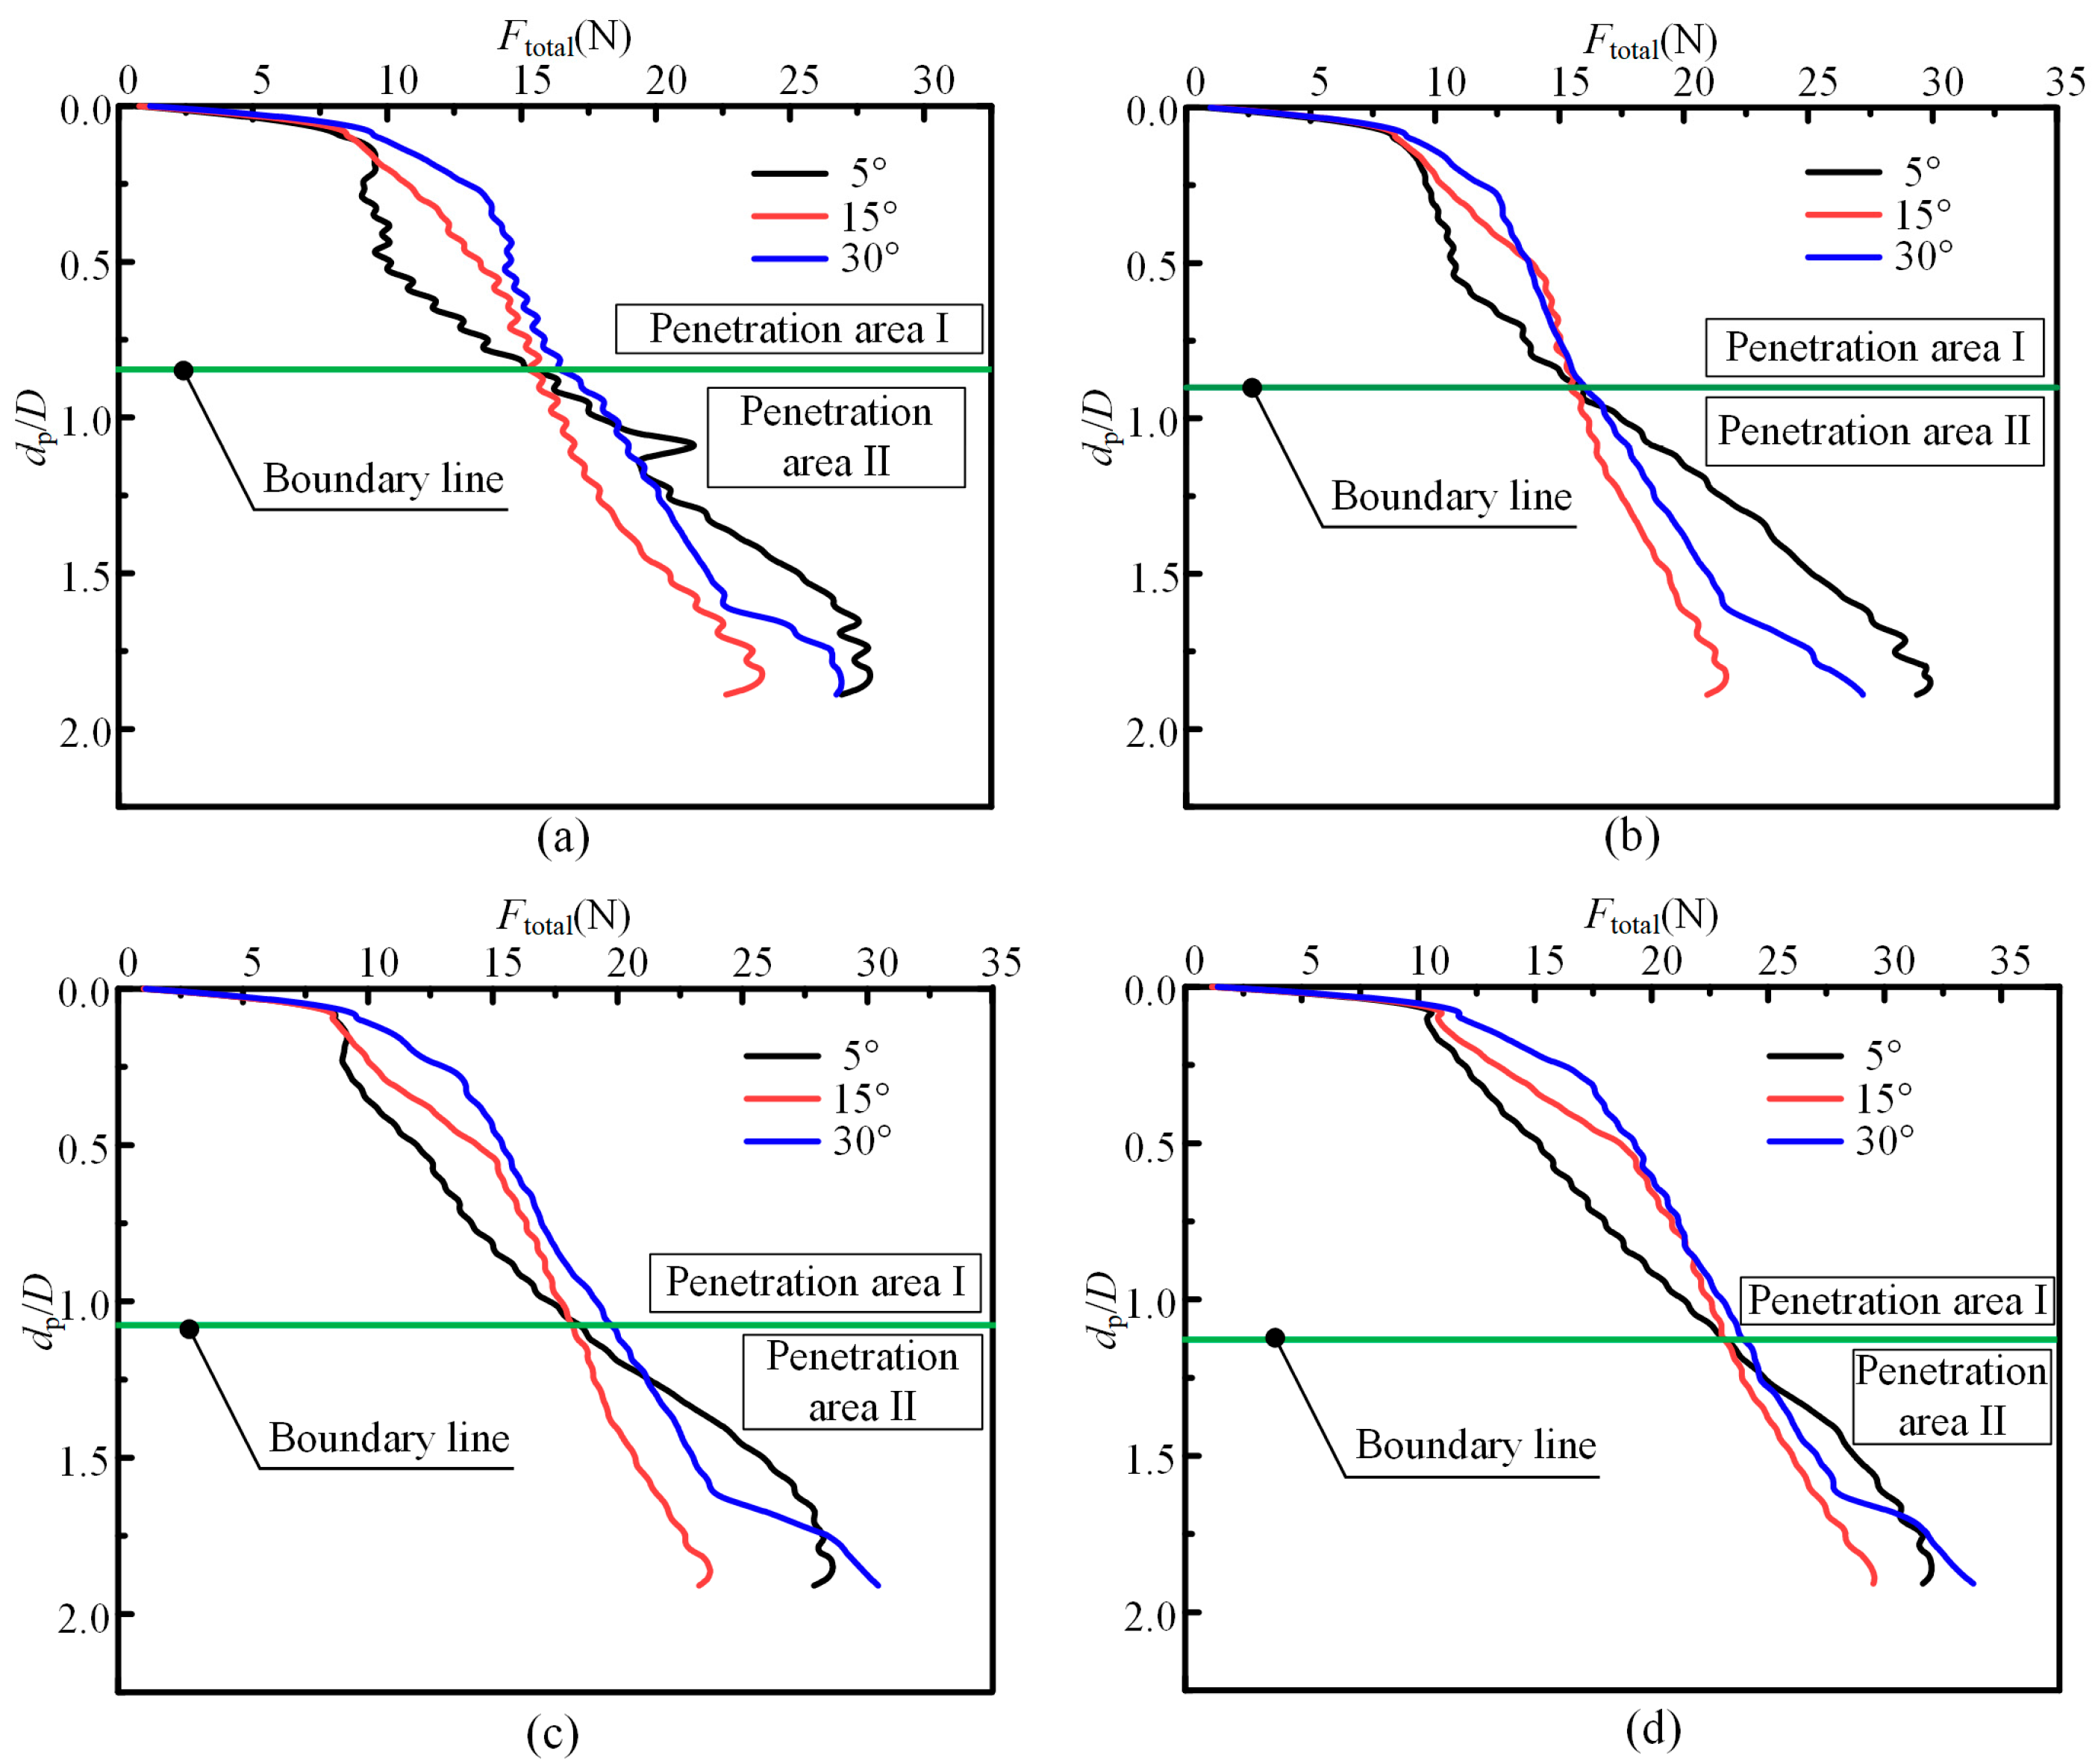
The results of the penetration resistance with different parameters combinations are presented in Figure 9, Figure 10 and Figure 11. As dp/D increased, Fend demonstrated a progressive increase and converged to a stable value, while Fside was positively correlated with dp/D through the entire penetration process. This phenomenon could be attributed to the progressive increase in lateral contact area between the penetrator structure and the soil with advancing penetration depth, resulting in a positive correlation between Fside and penetration depth. In contrast, the basal contact area remained constant throughout the process, while the compressive pressure between the end face of the penetrator structure and the soil could be regarded as constant. Combining Fend and Fside, the Ftotal on the 15° penetrating head angle penetrator structure became the smallest among all the penetrator structures when dp/D was approximately 1.0.
A boundary line was drawn to divide the penetration process into penetration area I and penetration area II, as shown in Figure 11. The value of the boundary line exhibited a continuous increase with the progressive augmentation of parameter b/D. At penetration area I, the penetration resistance with the 5° penetrating head angle was the smallest and the 30° penetrating head angle was the largest. At penetration area II, the penetration resistance with the 15° penetrating head was the smallest, and that with the 5° penetrating head was the largest. The simulation results of this study were similar to those of Shen Yi [35], which focused on the penetration mechanics between a penetrator and the lunar soil for extraterrestrial planetary explorations. It explored α = 15° as the optimal angle for the development of a low-disturbance penetrator structure in the deep-sea environment.
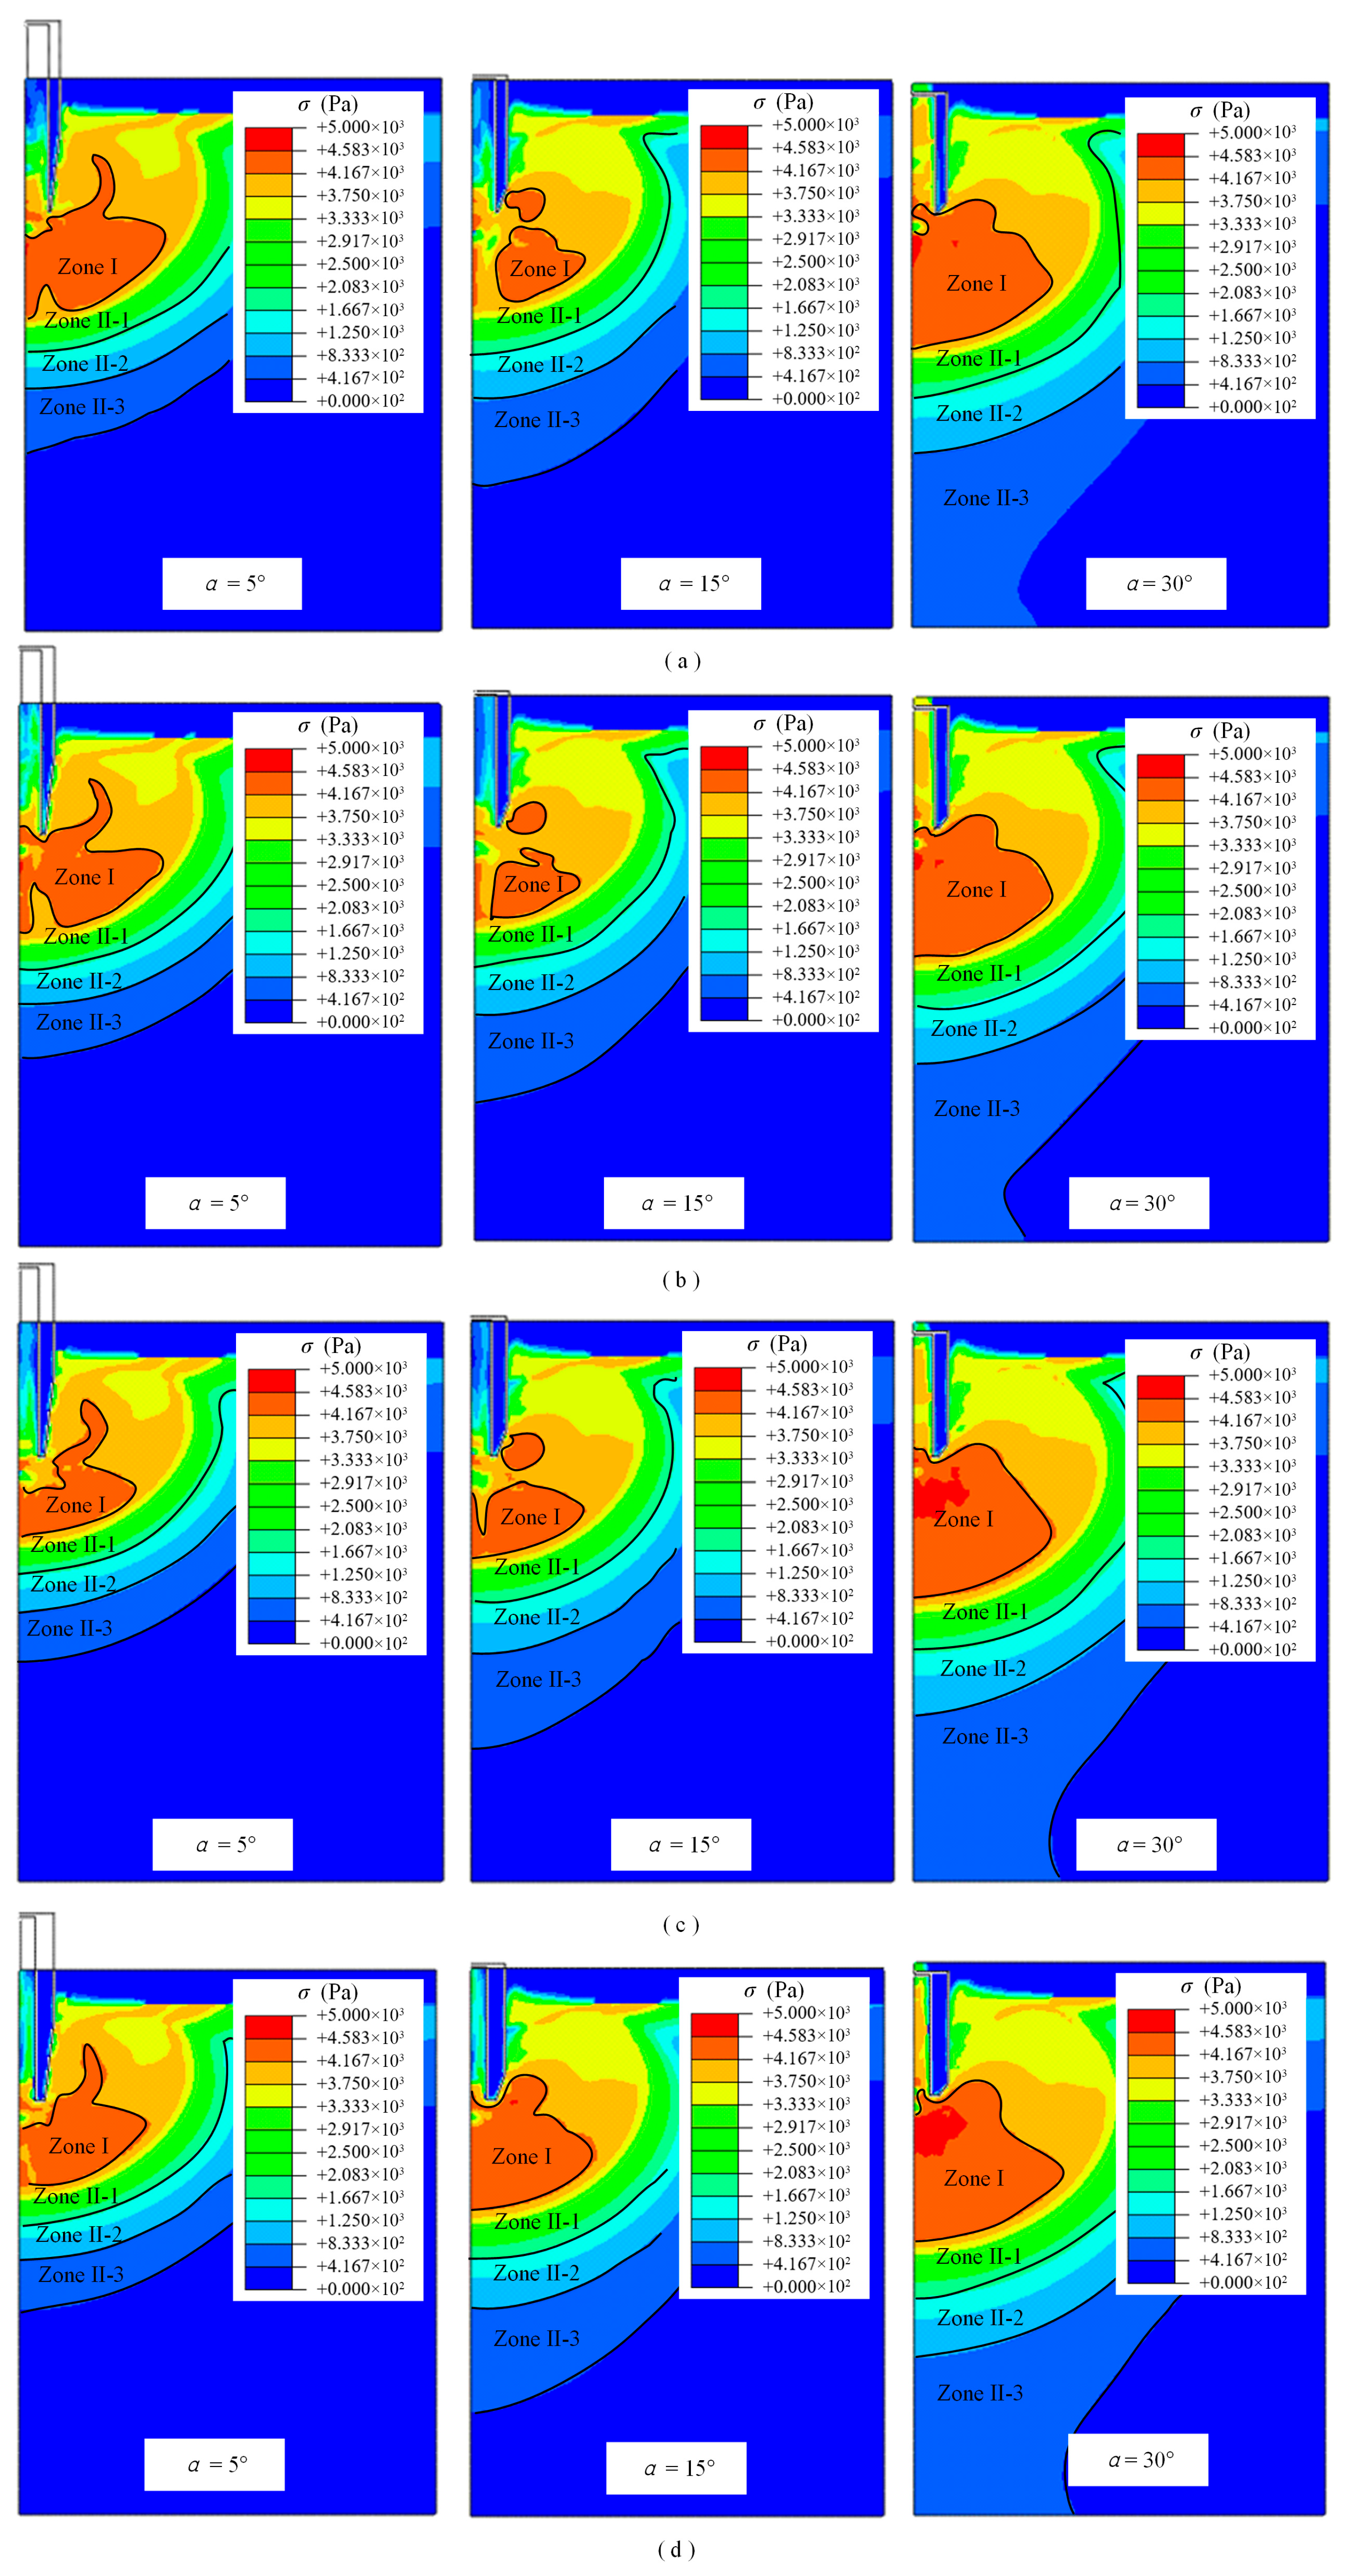
The mean pressure under different angles on the penetrating head is shown in Figure 12, when dp/D = 1.89. Under the same value of b/D, the area of mean pressure for the 30° penetrating head angle penetrator structure was significantly larger than that of the 5° and 15° penetrating head angle penetrator structures, with the 5° penetrating head angle penetrator structure exhibiting the smallest extent. However, for Zone I, the area under the 15° penetrating head angle penetrator structure was the smallest (approximately half of that under the 30° penetrating head angle penetrator structure). This further indicated that the penetrator–soil interaction under the 15° penetrating head angle penetrator structure was more moderate.
As shown in Figure 9, the larger the value of b/D, the greater the Fend, and Fend tended to converge. However, the value of Fend showed no significant variation, which may be attributed to the low undrained shear strength of the soil, resulting in a decreased sensitivity to b/D. Among the four different values of b/D in the current study, the Fend under the 5° penetrating head angle penetrator structure was the largest. Furthermore, as b/D increased, the Fend values for the three different penetrating head angle penetrator structures became closer.

4.2. Effect of Width of the End Face on the Penetrating Head Under Higher Su Condition

In order to increase the sensitivity of b/D, the Sum was stabilized at 20 kPa, which is 10 times the previous value, while the other parameters remained the same as in Section 3. The effects between 2.0 kPa and 20.0 kPa Sum on penetration resistance are shown in Figure 13. Under the two Sum conditions, the trend in penetration resistance remained consistent, showing a positive correlation with b/D, though numerical deviations became more significant at higher Sum values. The multiple of the increase in penetration resistance value was basically consistent with the multiple of the increase in Sum.
When dp/D was 0.026, the penetration resistance showed a drop at different b/D conditions, which might be caused by the plastic compaction of the soil. Taking the penetrator structure, where α = 15° and b/D = 0.135, under 20.0 kPa Sum condition as an example, the mean pressure characteristics during the compaction process are shown in Figure 14. When dp/D = 0.026, the penetration resistance reached its maximum, and the corresponding mean pressure peak was also at its highest. At dp/D = 0.037, the penetration resistance decreased, accompanied by a reduction in the mean pressure peak. At dp/D = 0.074, both the penetration resistance and mean pressure peak rebounded, and by dp/D = 0.095, they returned to their maximum levels. It is clear that the mean pressure at the tip of the penetrator structure changed throughout the cycle due to plastic compaction of the soil.

4.3. Effect of the Length/Diameter Ratio of the Penetrator Structure

To study the effect of penetration performance on length-to-diameter ratio of the penetrator structure, four different length-to-diameter ratios, L/D = 3.45, 2.65, 1.85, and 1.05, were considered by adjusting D, D = 57 mm, 74 mm, 106 mm, and 187 mm, based on the diameter of drill pipes for the mineral resource exploration mission described above. The penetration resistance at four different L/D ratios is shown in Figure 15, when the other parameters remained the same as in Section 3.
It is evident that in different penetrator structures, the penetration resistance increased with the depth of penetration. The trend in Ftotal aligned with Fside, and Fend tended to converge. However, the smaller the L/D ratio, the greater the penetration resistance, and the more pronounced its growth. At dp/D = 1.89, the Ftotal for the minimum L/D ratio was 4.8 times that of the maximum L/D ratio.
The penetration resistance is governed by the contact area between the penetrator and the soil. The following relationships can be formulated in this case, including the area of the end face on the penetrating head and the area of the side of the penetrating head, as shown in Equation (3).
S e n d = π b ( D b ) S s i d e = 2 π · d p D d p tan α 4 tan 2 α + 1 + π D d p L 1
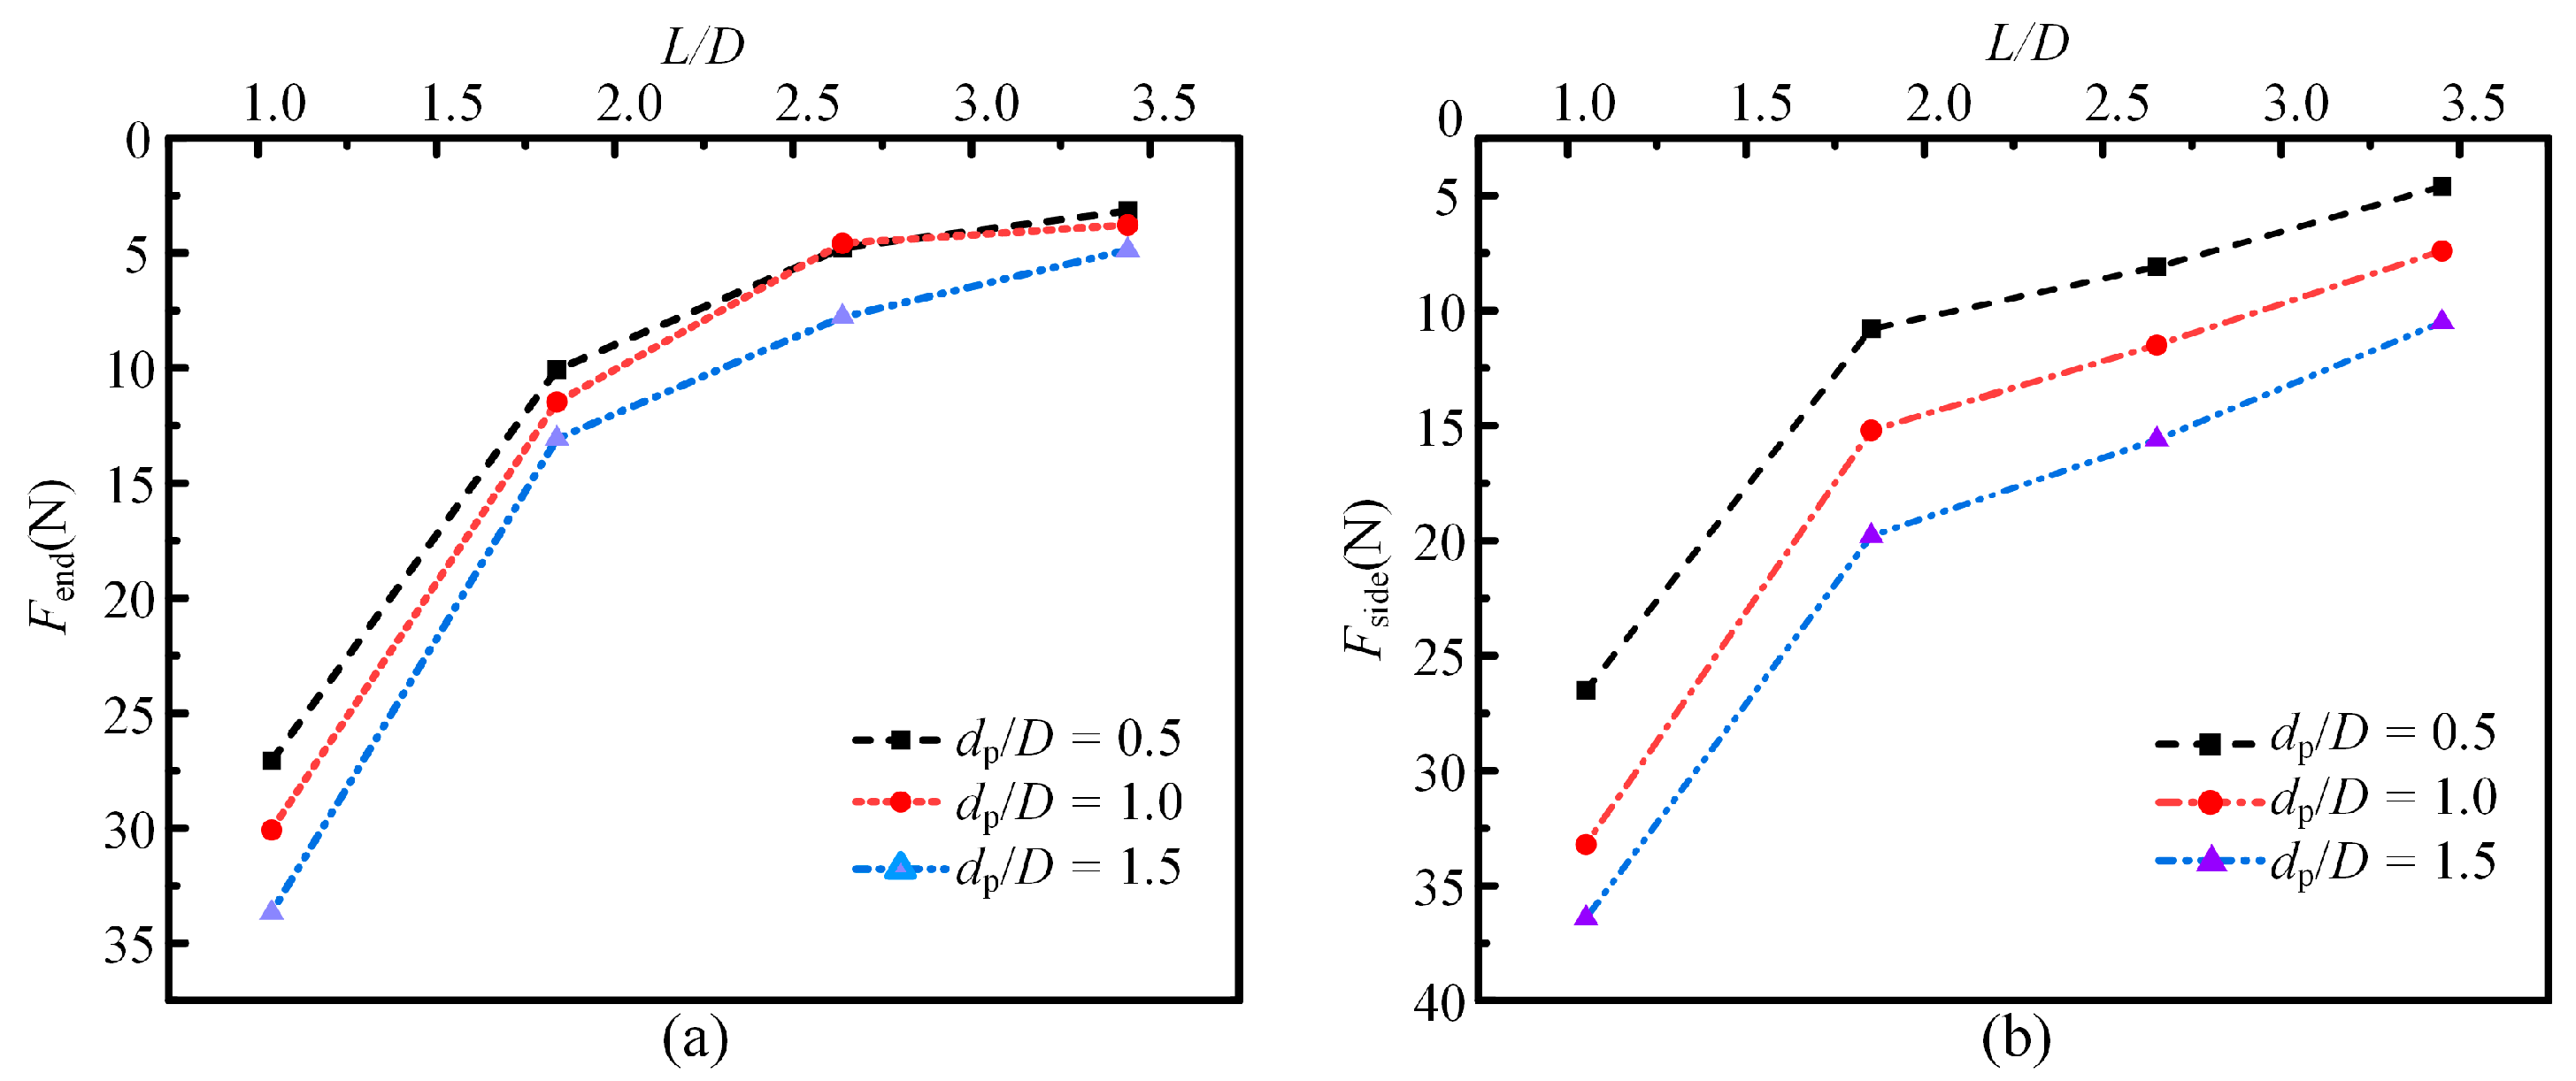
However, the relationship between the penetration resistance and penetrator diameter from the FEM results was not the simple linear relationship shown in Equation (3). As shown in Figure 16, the growth rate of penetration resistance relative to diameter varied: when the diameter was smaller (or L/D was greater), the growth rate was lower; when the diameter was larger (or L/D was smaller), the growth rate was higher. While Equation (3) could explain the overall trend of increasing force, it could not account for all aspects of the penetrator–soil interaction mechanism, such as differences in the compression deformation process on the penetrator end face under different L/D ratios.
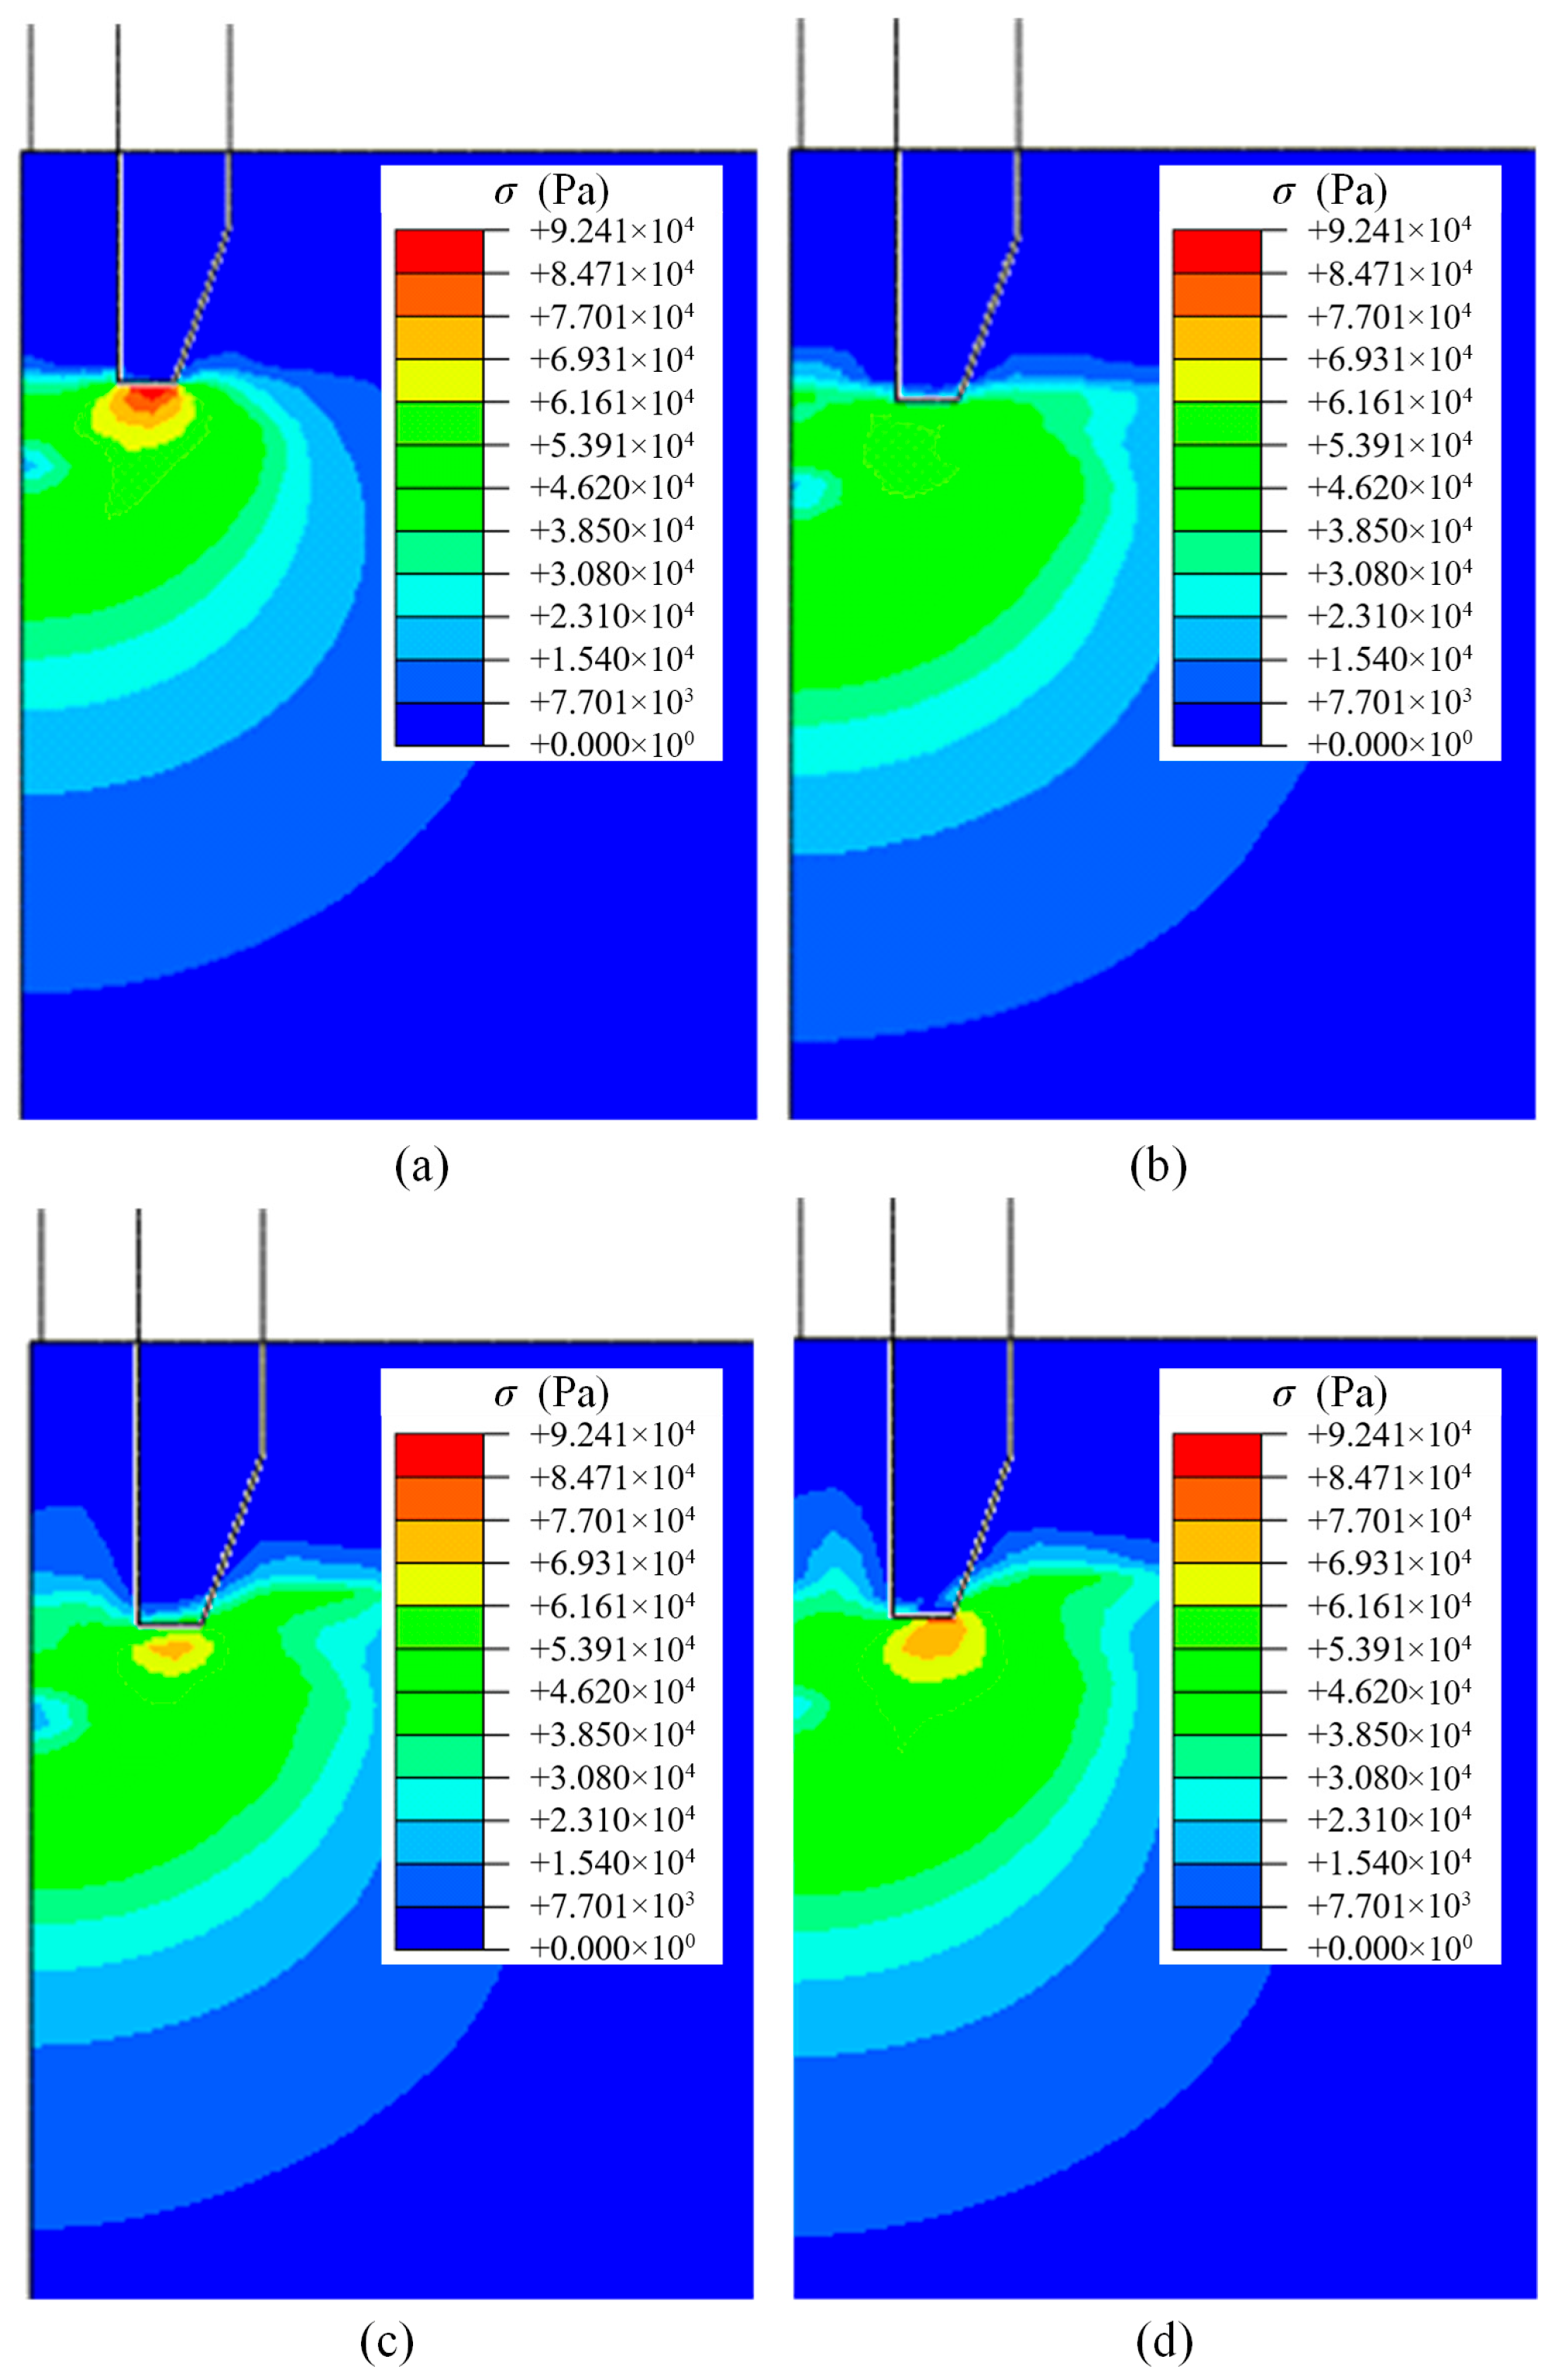
The mean pressure at maximum penetration depth for four different diameters is shown in Figure 17. As the L/D ratio decreased, the area of mean pressure gradually increased, while Zone I progressively diminished. When L/D = 1.05, Zone I nearly disappeared. Under a larger L/D ratio, the interaction between the penetrator structure and the soil tended to increase, while the unit action intensity increased, resulting in higher mean pressure. For a smaller L/D ratio, although Zone I (the primary interaction zone) was minimized, the penetrator structure influenced a significantly larger soil area. The resistance acting on the penetrator structure could be considered as an integration of the in situ mean pressure. Due to the substantial difference in integration domains (smaller L/D with higher pressure concentration vs. larger L/D with wider pressure distribution), it manifested as an inverse relationship between mean pressure and resistance—higher mean pressure with larger L/D corresponded to lower resistance, while smaller L/D with lower mean pressure produced higher resistance.
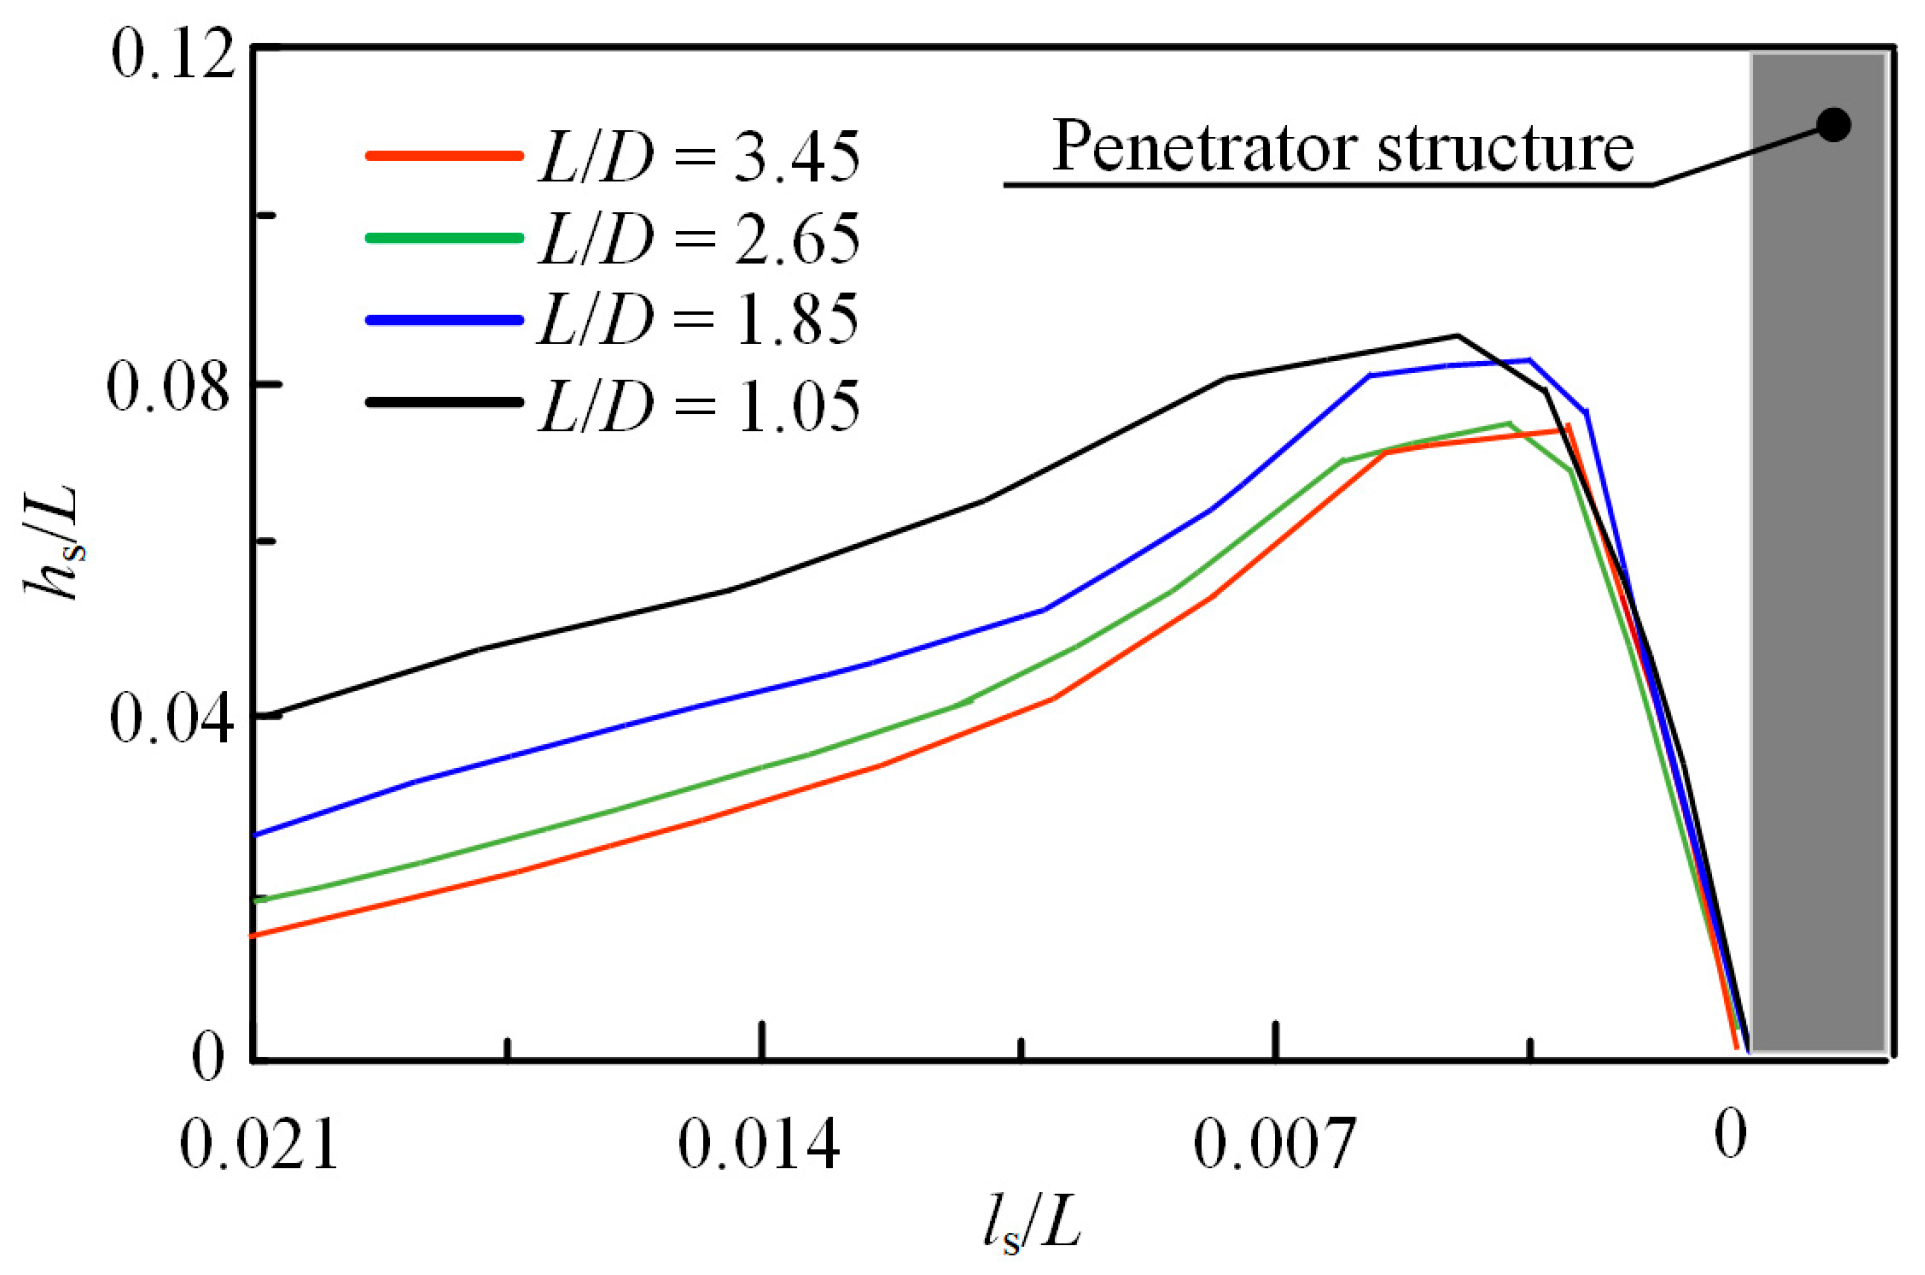
The performance of soil heave after the penetration process is shown in Figure 18. As D increased (L/D ratio decreased), the area of the interaction increased, hs became relatively larger, and the soil heave became more pronounced. The height of the soil heave, hs, and the distance from the penetrator structure to the margin of soil heave, ls, were normalized by L since the value of D varied for different L/D ratios in this section. As a result, hs/L was 0.0667, 0.0711, 0.072 and 0.073 when L/D was 3.45, 2.65, 1.85 and 1.05. In addition, the cross-sectional area of soil heave, Ssoil, was 0.0128, 0.0135, 0.0147 and 0.0165 at different L/D ratios. These data also show that as the L/D ratio decreased, the flow of the soil increased.

5. Conclusions

This study focused on the penetration process of a hollow penetrator structure in seabed clay based on the CEL method. A finite element model was developed to simulate the interaction between the penetrator structure and the seabed clay, with a sensitivity analysis of penetration velocity. The effects of penetrator structure parameters were investigated. The main conclusions are drawn as follows:
  • The CEL large deformation method effectively simulated the penetration processes, with the resistance of the side of the penetrator structure increasing synchronously with depth, while the resistance of the end face of the penetrator structure converged marginally.
  • The kinetic energy of the penetrator structure critically influenced soil flow, while penetration resistance and mean pressure remained almost constant under different velocity conditions. Balancing computational efficiency with simulation accuracy for penetration performance, the penetration velocity was set at 7.4 mm/s.
  • The penetrator structure with a 15° head angle achieved the minimal penetration resistance as depth increased progressively. This angle can be considered the optimal choice for developing a low-disturbance penetrator structure in the deep-sea environment.
  • Plastic deformation of the in situ soil primarily occurred at the end face on the penetrating head. The width of the end face on the penetrating head (b/D) was the key parameter governing the area of the interaction region. When Sum was small, b/D had little effect on Fend; however, at 10 times Sum, Fend showed a positive correlation with b/D.
  • The decrease in L/D ratios proportionally amplified both the penetration resistance and the soil heave characteristics. The selection of the penetrator structure diameter depends not only on the penetration performance described in this study but also on the requirements for soil sample collection in mineral resource exploration missions.
These results provide significant guidance for understanding the penetration mechanics between a hollow penetrator structure and seabed clay, as well as for optimizing the penetrator structure design. This study primarily discussed the penetration resistance exerted externally on the penetrator. However, some limitations remain: internal soil flow and the sample core will generate internal penetration resistance, affecting penetration performance; real-world conditions such as dynamic subsea condition, pore water pressure, or interactions with ROV-mounted systems will cause disturbance to the seabed clay, causing non-convergence of penetration resistance. These are aspects requiring investigation in future research.

Author Contributions

Conceptualization, J.L. and Z.Z.; methodology, J.L., Z.Z. and J.Z.; software, Z.Z. and H.H.; validation, J.L. and Z.Z.; formal analysis, J.L. and Z.Z.; investigation, J.L. and Z.Z.; resources, H.H. and J.Z.; data curation, J.L. and Z.Z.; writing—original draft preparation, J.L. and Z.Z.; writing—review and editing, H.H. and J.Z.; visualization, J.L. and Z.Z.; supervision, J.L. and J.Z.; project administration, J.L. and J.Z.; funding acquisition, J.Z. All authors have read and agreed to the published version of the manuscript.

Funding

This research was funded by the Science Fund for Distinguished Young Scholars of Jiangsu Province, grant number: BK20230014.

Institutional Review Board Statement

Not applicable.

Informed Consent Statement

Not applicable.

Data Availability Statement

The raw data supporting the conclusions of this article will be made available by the authors on request.

Acknowledgments

The authors are thankful to the anonymous reviewers, whose suggestions substantially improved the quality of the article.

Conflicts of Interest

The authors declare no conflicts of interest.

References

  1. Guo, D.; Chen, L.; Zhou, Z.; Wang, D.; Zhang, Y.; Yang, X.; Fang, X.; Wang, X.; Lu, H.; Dai, L.; et al. Development of a Pressure Coring System for the Investigation of Deep Underground Exploration. Int. J. Min. Sci. Technol. 2023, 33, 1351–1364. [Google Scholar] [CrossRef]
  2. Xie, H.; Gao, M.; Zhang, R.; Zhou, H.; Gao, F.; Chen, L.; Peng, X.; Li, X.; Ju, Y. Application Prospects of Deep In-Situ Condition-Preserved Coring and Testing Systems. Adv. Geo-Energy Res. 2024, 14, 12–24. [Google Scholar] [CrossRef]
  3. Peterson, M.N.A. Design and Operation of a Wireline Pressure Core Barrel; Scripps Institution of Oceanography: La Jolla, CA, USA, 1984. [Google Scholar] [CrossRef]
  4. Dickens, G.R.; Wallace, P.J.; Paull, C.K.; Borowski, W.S. Detection of Methane Gas Hydrate in the Pressure Core Sampler (PCS): Volume-Pressure-Time Relations during Controlled Degassing Experiments. In Proceedings of the Ocean Drilling Program: Scientific Results; Texas A&M University: College Station, TX, USA, 2000; Volume 164, pp. 113–126. [Google Scholar] [CrossRef]
  5. Abid, K.; Spagnoli, G.; Teodoriu, C.; Falcone, G. Review of Pressure Coring Systems for Offshore Gas Hydrates Research. Underw. Technol. 2015, 33, 19–30. [Google Scholar] [CrossRef]
  6. Burger, J.; Gupta, D.; Jacobs, P.; Shillinglaw, J. Overview on Hydrate Coring, Handling and Analysis; Westport Technology Center: Houston, TX, USA, 2006; p. 126. [Google Scholar]
  7. Schultheiss, P.; Holland, M.; Humphrey, G. Wireline Coring and Analysis under Pressure: Recent Use and Future Developments of the HYACINTH System. Sci. Drill. 2009, 7, 44–50. [Google Scholar] [CrossRef]
  8. Schultheiss, P.J.; Francis, T.J.G.; Holland, M.; Roberts, J.A.; Amann, H.; Parkes, R.J.; Martin, D.; Rothfuss, M.; Tyunder, F.; Jackson, P.D. Pressure Coring, Logging and Subsampling with the HYACINTH System. Geol. Soc. Lond. Spec. Publ. 2006, 267, 151–163. [Google Scholar] [CrossRef]
  9. Mazzeo, A.; Aguzzi, J.; Calisti, M.; Canese, S.; Vecchi, F.; Stefanni, S.; Controzzi, M. Marine Robotics for Deep-Sea Specimen Collection: A Systematic Review of Underwater Grippers. Sensors 2022, 22, 648. [Google Scholar] [CrossRef]
  10. Agarwala, N. Using Robotics to Achieve Ocean Sustainability During the Exploration Phase of Deep Seabed Mining. Mar. Technol. Soc. J. 2023, 57, 130–150. [Google Scholar] [CrossRef]
  11. Ragni, R.; Bienen, B.; O’Loughlin, C.D.; Stanier, S.A.; Cassidy, M.J.; Morgan, N. Observations of the Effects of a Clay Layer on Suction Bucket Installation in Sand. J. Geotech. Geoenviron. Eng. 2020, 146, 04020020. [Google Scholar] [CrossRef]
  12. Zou, X.; Jiang, Y.; Wang, Y. Failure Mechanism of Single Pile-Friction Footing Hybrid Foundation under Combined V–H–M Loadings by PIV Experiments and FE Method. Ocean Eng. 2023, 280, 114461. [Google Scholar] [CrossRef]
  13. Wang, X.; Yang, X.; Zeng, X. Centrifuge Modeling of Lateral Bearing Behavior of Offshore Wind Turbine with Suction Bucket Foundation in Sand. Ocean Eng. 2017, 139, 140–151. [Google Scholar] [CrossRef]
  14. Ma, P.; Liu, R.; Lian, J.; Zhu, B. An Investigation into the Lateral Loading Response of Shallow Bucket Foundations for Offshore Wind Turbines through Centrifuge Modeling in Sand. Appl. Ocean Res. 2019, 87, 192–203. [Google Scholar] [CrossRef]
  15. Hossain, M.S.; Hu, Y.; Randolph, M.F.; White, D.J. Limiting Cavity Depth for Spudcan Foundations Penetrating Clay. Geotechnique 2005, 55, 679–690. [Google Scholar] [CrossRef]
  16. Teh, K.L.; Leung, C.F.; Chow, Y.K.; Cassidy, M.J. Centrifuge Model Study of Spudcan Penetration in Sand Overlying Clay. Geotechnique 2010, 60, 825–842. [Google Scholar] [CrossRef]
  17. Wang, Q.; Zhou, X.; Zhou, M.; Tian, Y. Investigation on the Behavior of Stiffened Caisson Installation in Uniform Clay from Large Deformation Modeling. Int. J. Geomech. 2020, 20, 04020149. [Google Scholar] [CrossRef]
  18. Hu, P.; Wang, D.; Cassidy, M.J.; Stanier, S.A. Predicting the Resistance Profile of a Spudcan Penetrating Sand Overlying Clay. Can. Geotech. J. 2014, 51, 1151–1164. [Google Scholar] [CrossRef]
  19. Wang, T.; Wu, R.; Liu, W.; Bao, X. Simulation of T-Bar Penetration in Soft Clay with Adhesive Contact. Mar. Georesour. Geotechnol. 2020, 38, 154–163. [Google Scholar] [CrossRef]
  20. Tu, W.; He, Y.; El Naggar, M.H.; Liu, L.; Gu, X.; Cheng, X. Analysis of Bucket Foundation Installation in Clay Considering Soil Large Deformation. Ocean Eng. 2023, 287, 115754. [Google Scholar] [CrossRef]
  21. Bae, J.; Kim, Y.; Hossain, M.S. Developing an optimal shape for dynamically installed anchor. In Proceedings of the ASME 2023 42nd International Conference on Ocean, Offshore and Arctic Engineering, Melbourne, Australia, 11–16 June 2023; Volume 9, pp. 1–10. [Google Scholar] [CrossRef]
  22. Chen, X.; Wang, Z.; Kong, D.; Lou, X.; Zhu, B. Development of an Adaptive Meshing Upper Bound Limit Analysis Method for Large Deformation Axisymmetric Geotechnical Problems. Sci. Rep. 2025, 15, 5771. [Google Scholar] [CrossRef] [PubMed]
  23. Gao, P.; Liu, Z.; Shi, D.; Wang, F. Investigation on Perforation Drilling to Mitigate Punch-through Potential in Sand Overlying Soft Clay. Appl. Ocean Res. 2022, 119, 103026. [Google Scholar] [CrossRef]
  24. Ullah, S.N.; Hu, Y.; Stanier, S.; White, D. Lateral Boundary Effects in Centrifuge Foundation Tests. Int. J. Phys. Model. Geotech. 2017, 17, 144–160. [Google Scholar] [CrossRef]
  25. Chen, H.; Zhang, J.; Tong, L.; Sun, K.; Guo, Y.; Wei, C. Experimental Study of Soil Responses around a Pipeline in a Sandy Seabed under Wave-Current Load. Appl. Ocean Res. 2023, 130, 103409. [Google Scholar] [CrossRef]
  26. Tu, Y.; Tu, W.; Gu, X.; Xiao, K.; Zheng, M.; Shen, K. Influence of the Installation on the Bearing Performance of the Bucket Foundation under Combined Loading. Mar. Georesour. Geotechnol. 2025, 1–16. [Google Scholar] [CrossRef]
  27. Huang, M.; Tu, W.; Gu, X. Time Domain Nonlinear Lateral Response of Dynamically Loaded Composite Caisson-Piles Foundations in Layered Cohesive Soils. Soil Dyn. Earthq. Eng. 2018, 106, 113–130. [Google Scholar] [CrossRef]
  28. Chen, W.; Randolph, M.F. External Radial Stress Changes and Axial Capacity for Suction Caissons in Soft Clay. Geotechnique 2007, 57, 499–511. [Google Scholar] [CrossRef]
  29. Chen, C.; Long, J.; Li, G. Experimental study on mechanical properties of seafloor sediments of deep South China Sea. Ocean Eng. 2015, 33, 1–7. [Google Scholar] [CrossRef]
  30. Vulpe, C.; Gourvenec, S.; Power, M. A Generalised Failure Envelope for Undrained Capacity of Circular Shallow Foundations under General Loading. Geotech. Lett. 2014, 4, 187–196. [Google Scholar] [CrossRef]
  31. Zhou, H.; Liu, H.; Yuan, J.; Chu, J. Numerical Simulation of XCC Pile Penetration in Undrained Clay. Comput. Geotech. 2019, 106, 18–41. [Google Scholar] [CrossRef]
  32. Dingle, H.R.C.; White, D.J.; Gaudin, C. Mechanisms of Pipe Embedment and Lateral Breakout on Soft Clay. Can. Geotech. J. 2008, 45, 636–652. [Google Scholar] [CrossRef]
  33. Chatterjee, S.; Randolph, M.F.; White, D.J.; Wang, D. Large Deformation Finite Element Analysis of Vertical Penetration of Pipelines in Seabed. Front. Offshore Geotech. II 2010, 785–790. [Google Scholar] [CrossRef]
  34. Wang, D.; Bienen, B.; Nazem, M.; Tian, Y.; Zheng, J.; Pucker, T.; Randolph, M.F. Large Deformation Finite Element Analyses in Geotechnical Engineering. Comput. Geotech. 2015, 65, 104–114. [Google Scholar] [CrossRef]
  35. Shen, Y. Research on the Impact Type Penetrator and Its Mechanical Properties During Penetrating Lunar Regolith Pro-File. Ph.D. Thesis, Harbin Institute of Technology, Harbin, China, October 2017. [Google Scholar]
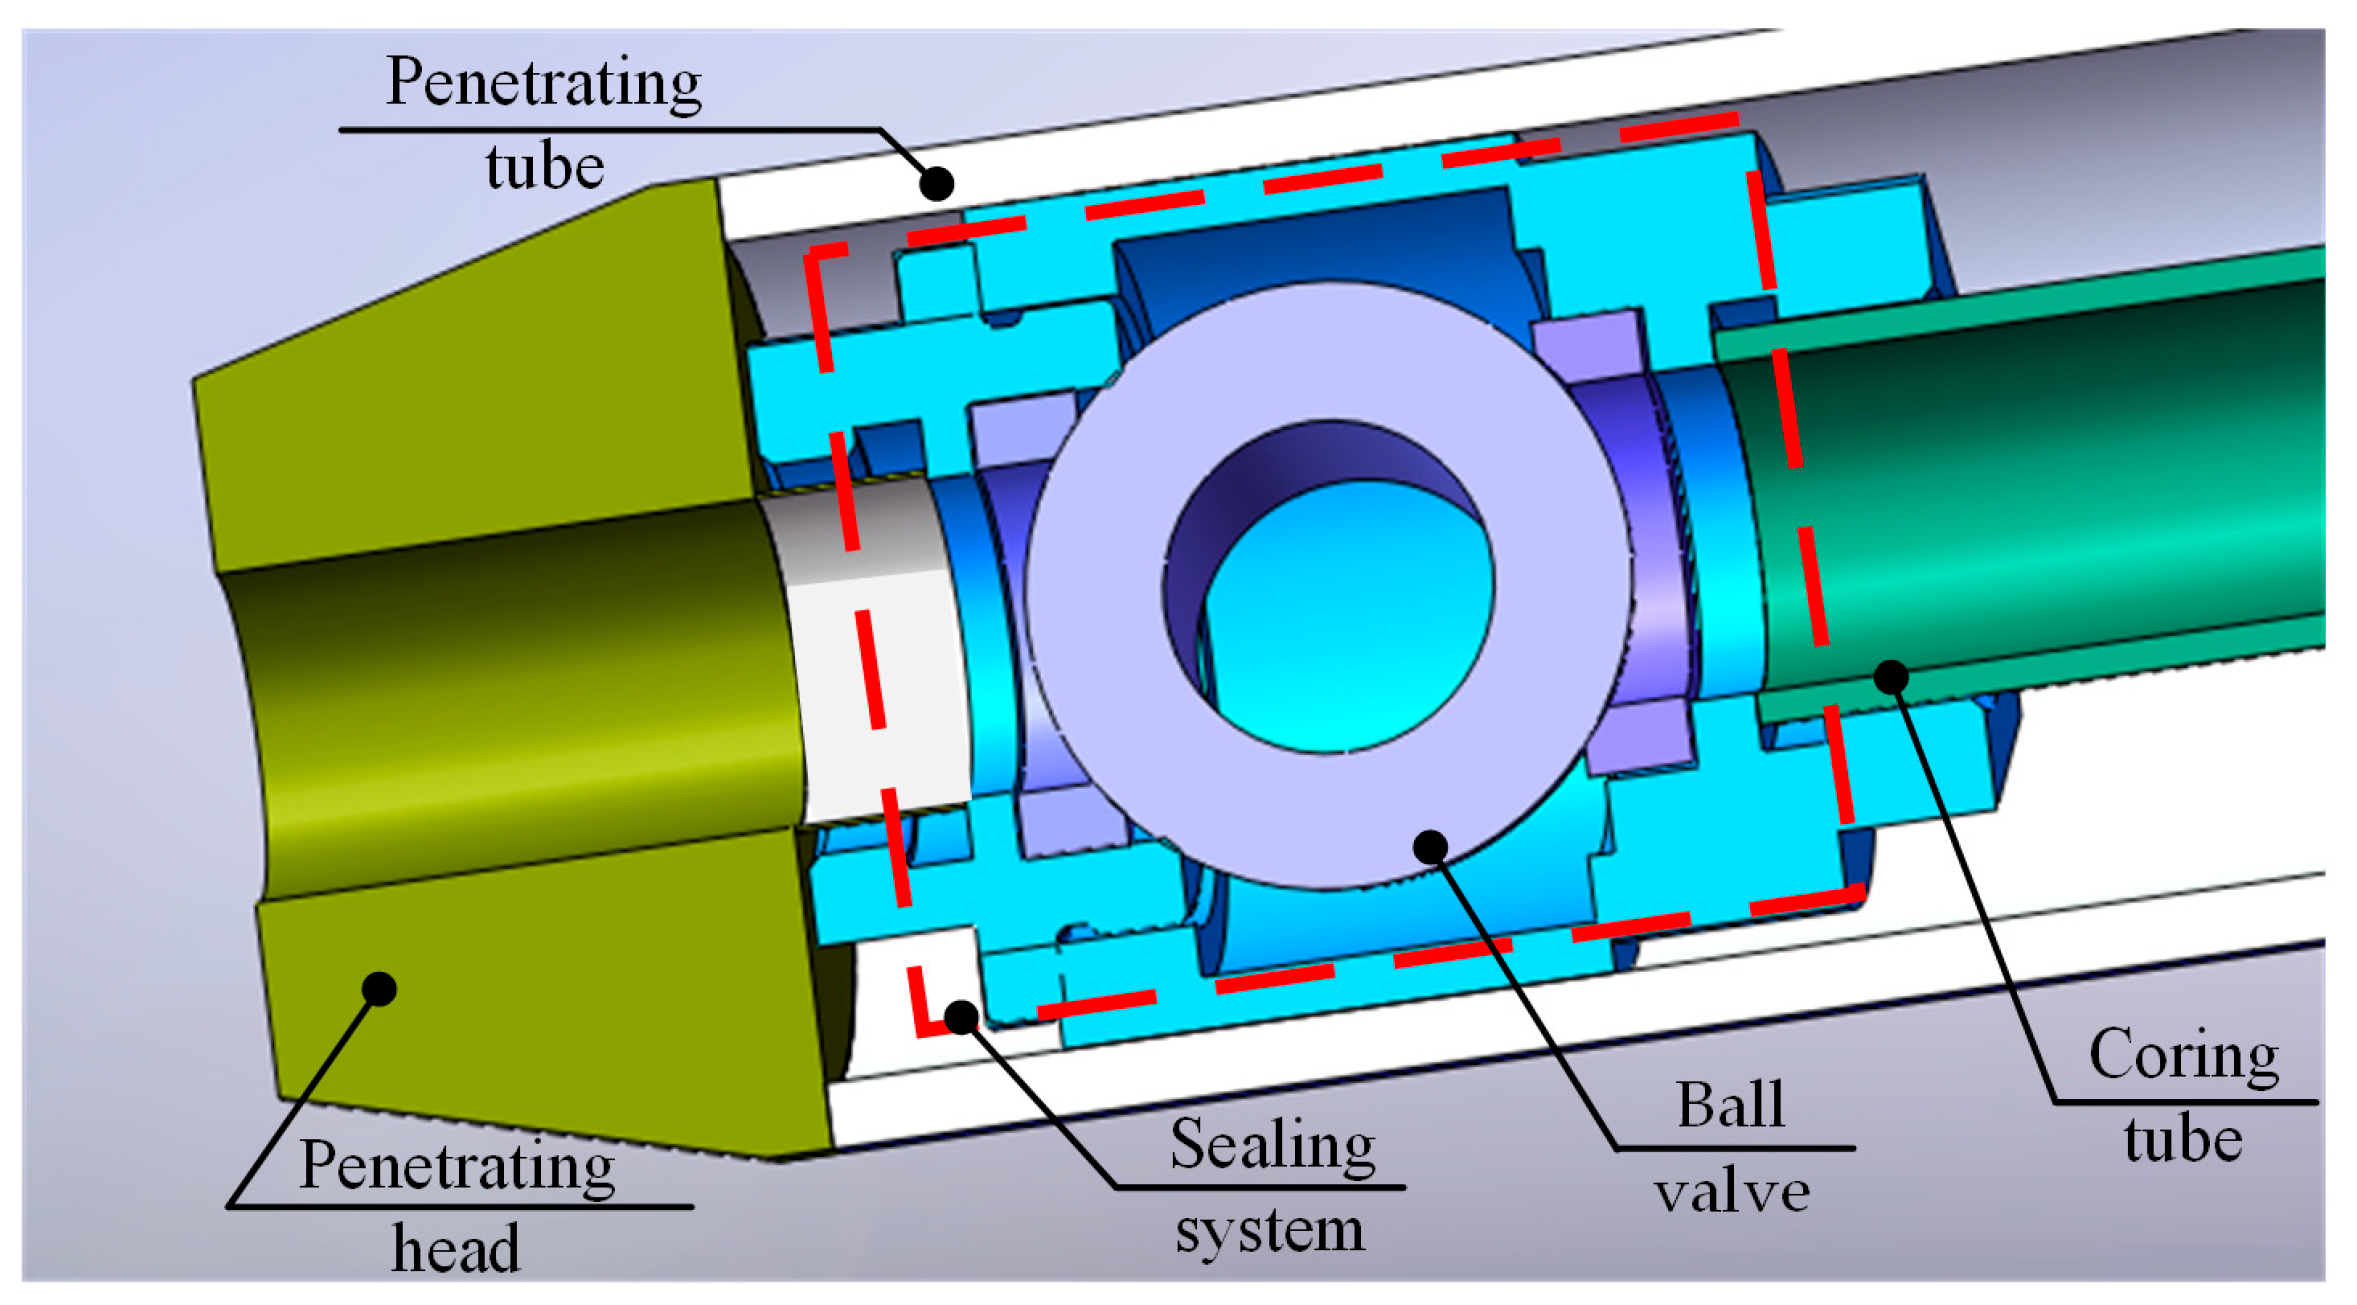
Figure 1. The penetrating and coring mechanism. It consists of a penetrating tube, penetrating head and sealing system. The area enclosed by the red dashed line represents the sealing system by a ball valve, and a coring tube.
Applsci 15 08778 g001
Figure 2. Illustration of the penetrator–soil interaction. Fend represents the resistance of the end face of the penetrator structure, due to the shear stress of clay on the end face of the penetrator structure during the penetration process. Fside represents the resistance of the side of the penetrator structure, a resultant force of the contact stress and friction force between the sidewall of the penetrator structure and the clay. The red line is the boundary between Zone I and Zone II. The blue line is the boundary between Zone II and the non-affected area. Zone I is the direct interaction area between the penetrator and the soil. Zone II represents the indirect interaction area.
Applsci 15 08778 g002
Figure 3. Illustration of the finite element mesh. The mesh type of the penetrator in Abaqus software is the “C3D8R” element (8-node Lagrangian bricks with reduced integration), and the mesh type of the soil is the “EC3D8R” element (8-node Eulerian bricks with reduced integration). The soil is meshed with 2012500 elements. The RP point is set directly above the penetrator and coupled with the penetrator to simplify subsequent operations.
Applsci 15 08778 g003
Figure 4. The mean pressure of the soil before penetration. σ represents mean pressure.
Applsci 15 08778 g004
Figure 5. Validation of the CEL method. V (N) represents vertical resistance. Dp (m) represents pipe diameter. Su (Pa) represents the soil’s undrained shear strength. W (m) represents pipe displacement.
Applsci 15 08778 g005
Figure 6. The penetration resistance of the penetrator structure, where α = 15°, b/D = 0.027, and L2 = 160 mm, at four different penetration velocities: (a) Fend; (b) Fside; (c) Ftotal.
Applsci 15 08778 g006
Figure 7. Mean pressure (σ) distribution at four different penetration velocities at the maximum penetration depth: (a) v = 7.4 mm/s; (b) v = 5.55 mm/s; (c) v = 3.7 mm/s; (d) v = 1.85 mm/s.
Applsci 15 08778 g007
Figure 8. Soil heave at four different penetration velocities and four different penetration depths: (a) dp/D = 0.49; (b) dp/D = 0.96; (c) dp/D = 1.43; (d) dp/D = 1.89.
Applsci 15 08778 g008
Figure 9. Fend with different penetrating head parameters: (a) α = 5°, 15°, 30° and b/D = 0.027; (b) α = 5°, 15°, 30° and b/D = 0.054; (c) α = 5°, 15°, 30° and b/D = 0.081; (d) α = 5°, 15°, 30° and b/D = 0.135.
Applsci 15 08778 g009
Figure 10. Fside with different penetrating head parameters: (a) α = 5°, 15°, 30° and b/D = 0.027; (b) α = 5°, 15°, 30° and b/D = 0.054; (c) α = 5°, 15°, 30° and b/D = 0.081; (d) α = 5°, 15°, 30° and b/D = 0.135.
Applsci 15 08778 g010
Figure 11. Ftotal with different penetrating head parameters: (a) α = 5°, 15°, 30° and b/D = 0.027; (b) α = 5°, 15°, 30° and b/D = 0.054; (c) α = 5°, 15°, 30° and b/D = 0.081; (d) α = 5°, 15°, 30° and b/D = 0.135. The boundary line was drawn to divide penetration area I and penetration area II. At penetration area I, the penetration resistance with the 5° penetrating head angle was the smallest, and that with the 30° penetrating head angle was the largest. At penetration area II, the penetration resistance with the 15° penetrating head was the smallest, and that with the 5° penetrating head was the largest. The value of the boundary line exhibited a continuous increase with the progressive augmentation of parameter b/D.
Applsci 15 08778 g011
Figure 12. Mean pressure (σ) distribution with different penetrating head parameters at the maximum penetration depth: (a) α = 5°, 15°, 30° and b/D = 0.027; (b) α = 5°, 15°, 30° and b/D = 0.054; (c) α = 5°, 15°, 30° and b/D = 0.081; (d) α = 5°, 15°, 30° and b/D = 0.135.
Applsci 15 08778 g012
Figure 13. The penetration resistance at different b/D under two Sum conditions: (a) Fend under Sum = 2.0 kPa; (b) Fend under Sum = 20.0 kPa; (c) Fside under Sum = 2.0 kPa; (d) Fside under Sum = 20.0 kPa; (e) Ftotal under Sum = 2.0 kPa; (f) Ftotal under Sum = 20.0 kPa.
Applsci 15 08778 g013
Figure 14. Mean pressure (σ) variations with the penetrator structure, where α = 15° and b/D = 0.135, under 20.0 kPa Sum condition: (a) dp/D = 0.026; (b) dp/D = 0.037; (c) dp/D = 0.074; (d) dp/D = 0.095.
Applsci 15 08778 g014
Figure 15. The penetration resistance at four different L/D ratios: (a) Fend; (b) Fside; (c) Ftotal.
Applsci 15 08778 g015
Figure 16. The penetration resistance from the FEM results at three different dp/D with four different L/D ratios: (a) Fend; (b) Fside.
Applsci 15 08778 g016
Figure 17. Mean pressure (σ) distribution at four different L/D ratios at the maximum penetration depth: (a) L/D = 3.45; (b) L/D = 2.65; (c) L/D = 1.85; (d) L/D = 1.05.
Applsci 15 08778 g017
Figure 18. Soil heave at four different L/D ratios at the maximum penetration depth.
Applsci 15 08778 g018
Table 1. Parameters of the penetrator structure and penetration performance.
ParameterDescriptionValue or Normalization
DDiameter of the penetrator structureD = 74 mm
L1Height of the penetrating head L 1 = D 2 tan α · 0.25
L2Height of the penetrating tube/
LHeight of the penetrator structure, which is equal to the sum of L1 and L2L/D
bWidth of the end face on the penetrating headb/D
αAngle of the penetrating head/
dpDepth of the penetration processdp/D
hsHeight of the soil heavehs/D
lsDistance from the penetrator structure to the margin of soil heavels/D
FendResistance of the end face of the penetrator structure /
FsideResistance of the side of the penetrator structure /
FtotalCombination of Fend and Fside/
Table 2. Penetrating head parameters in cross-simulation.
ParameterValueNormalized Value
α5°, 15°, 30°/
b2 mm, 4 mm, 6 mm, 10 mm0.027, 0.054, 0.081, 0.135
Disclaimer/Publisher’s Note: The statements, opinions and data contained in all publications are solely those of the individual author(s) and contributor(s) and not of MDPI and/or the editor(s). MDPI and/or the editor(s) disclaim responsibility for any injury to people or property resulting from any ideas, methods, instructions or products referred to in the content.