Article

The Effect of Practicing Selected Sports on the Value of the Center of Pressure (COP): A Pilot Study

1
Department of Physiotherapy, Wroclaw University of Health and Sport Sciences, al. Ignacego Jana Paderewskiego 35, 51-612 Wrocław, Poland
2
Vratislavia Medica Hospital, ul. Lekarska 1, 51-134 Wrocław, Poland
*
Author to whom correspondence should be addressed.
Appl. Sci. 2025, 15(16), 8774; https://doi.org/10.3390/app15168774
Submission received: 15 May 2025 / Revised: 13 June 2025 / Accepted: 15 June 2025 / Published: 8 August 2025

Abstract

The purpose of this study was to determine whether training for a marathon and powerlifting could affect the value of the center of pressure (COP) in static and dynamic testing assessed with the Free Med ground reaction force platform. A baropodometric mat was used to evaluate COP values, using Free Step computer software. The study was performed in three groups: marathon runners (M, n = 31), powerlifters (PL, n = 24), and a control group (C, n = 30). Basic descriptive statistics (mean ± standard deviation) were calculated for the COP in the static, anteroposterior (AP), and mediolateral (ML) directions, followed by dynamic test variables for the dominant (D) and non-dominant (ND) lower limbs. In each of the three study groups, one-factor ANOVA, two-factor MANOVA, and r-Pearson correlation coefficients between COP and D lower limb, as well as between COP and ND lower limb, were calculated. No statistically significant differences were observed between the means of the COP in the groups studied in the static test. A statistically significant difference between the COP of the D and ND lower limbs (p < 0.001) was observed in the dynamic test only in the M group. In both the C and PL groups, a significant relationship was observed between the two variables for the parameter of sway distance between the lower limbs (r = 0.75; p < 0.001 and r = 0.73; p < 0.001). Only in the M group were statistically significant differences found between the D and ND lower limbs in the dynamic study (p < 0.001). These athletes developed specific postural strategies characterized by the difference between the length of the sway path between the D and ND lower limbs. Further research is needed in these athlete groups to determine whether practicing these sports can affect the distribution of foot pressure on the ground.

1. Introduction

The center of pressure (COP) index is used in research as a way to measure equilibrium and posture because it depends on the position of the body to the support surface [1,2,3,4,5]. Any movement of the body that causes changes in the values of the forces acting on the ground in the anteroposterior (AP) and mediolateral (ML) directions can affect the point of application of the resultant force. The COP indicator contains a great deal of information about the manifestations of the regulatory function of the equilibrium system. It is commonly used in measurements to assess the stability and quality of this system and to evaluate postural strategies [1,2,3,4,5,6]. Based on the measurement of the COP displacement along the so-called sway path length, the degree of postural sway by the test subject can be quantified and can serve as an indirect measurement of equilibrium control. The amount and distribution of pressure can also be recorded; it provides additional information on the structure and function of the sole [7]. COP variables are the range of sway in the AP and ML directions [8]. This swaying is caused by slight muscle contractions to maintain equilibrium while standing. Increased sway is not necessarily an indicator of poorer equilibrium, but it is an indicator of reduced neuromuscular control [9,10,11]. According to Blaszczyk, Beck, and Sadowska, the neuromuscular system must exert 50% more effort to control stability toward the sagittal plane (AP) to maintain a stable posture [12]. It is essential to comprehensively and objectively evaluate the equilibrium system of athletes to assess their stability. Even when standing quietly, a certain amount of body deviation from vertical is observed, and this postural sway is considered an indicator of the efficiency of the equilibrium control system [4]. When the disturbance is minimal, the peroneus muscles and the flexors and extensors of the foot are the main muscle groups responsible for stabilizing the ankle joint (known as the ankle joint strategy). Adjustment at the hip level becomes more important for more severe disorders (hip strategy), involving the restoration of the center of gravity through significant movements at the hip joints [13,14,15]. Studying postural stability in sports can provide insight into the development of specific postural strategies [16]. According to Perrin et al., training allows athletes to acquire new equilibrium control skills, which vary depending on the sport practiced [17]. The severity of sway in the standing position can be assessed by measuring the COP motion parameters of the feet that are recorded by a computerized equilibrium platform [4]. The choice of method for assessing postural stability is motivated by factors such as reliability, so that noticeable differences in measurements are due to real variability in postural adaptation and not to random errors in the testing procedure [18,19]. Nowadays, commonly used tools for assessing static and dynamic body equilibrium include baropodometric platforms. Changes in the displacement direction of the COP exerted by the feet on the surface of the platform are recorded while taking measurements in the standing position. The signal that characterizes COP displacement under static conditions is the projection of the body’s overall center of gravity onto the support plane. The results of the measurements allow us to assess the functioning of the postural stability control system [12]. This control is not considered a simple sum of static reflexes, but rather a complex skill based on the interaction of dynamic sensory processes. The two main functional goals of postural behavior are postural orientation and postural equilibrium [12,20,21].
Several years of training can significantly affect the postural control system and lead to discipline-oriented optimal use of the sensorimotor modalities responsible for body equilibrium [22]. It is a key component of motor skills, as well as maintaining a stable posture and performing complex sports skills [23]. Equilibrium control means statically and dynamically balancing the destabilizing forces of gravity and inertia by stimulating the relevant muscle groups. Forces generated by muscles compensate for equilibrium [24]. For this study, we selected athletes from two different sports. The marathon is a dynamic sport, while powerlifting is a static sport. Athletes from various sports were selected to observe whether they developed specific postural strategies depending on the sport they played.
The analysis of our own research shows a further need to perform functional assessments of feet and ground pressure forces using baropodometric systems. With these assessments, many biomechanical indices of the foot in statics and dynamics can be collected [22]. However, further research is needed to fully understand the relationship between the structure, function, and biomechanics of athletes’ feet while playing different sports. There is controversial data regarding the relationship between foot morphology and lower limb sports injuries. Studies conducted on groups of people who do not practice any sports have shown some relationship, while studies involving athletes have not shown any significant relationship. The reason for these differences is not clear; hence, the need to conduct further studies in this area.
The purpose of this study was to determine whether training for a marathon and powerlifting could affect the value of the center of pressure (COP) in static and dynamic testing assessed with the Free Med ground reaction force platform.

2. Materials and Methods

2.1. Experimental Approach to the Problem and Participants

The Free Med ground reaction force platform baropodometric mat was used to evaluate COP values in the sagittal and frontal planes under dynamic and static conditions. The study was performed in three groups: marathon runners (M), powerlifters (PL), and a control group (C). The M group consisted of 31 people. They were participants in the 33rd PKO Wroclaw Marathon. The group trained 4–5 times a week, with each training session lasting 60 min. The PL group consisted of 24 participants in the Polish Under-23 Championships. This group trained 4–6 times a week, with each training session lasting 120 min. The C group consisted of 30 students from the Faculty of Physiotherapy of the Academy of Physical Education (APE) who did not participate in any sports or strenuous physical activity. Exclusion criteria were any injury or neuromuscular disease in the six months preceding the study, disorders of the labyrinth function, middle ear disease with symptoms of dizziness, body equilibrium problems associated with other diseases, and a lack of written consent for the study. All participants provided written informed consent to participate in the study. Basic anthropometric characteristics for the three groups are shown in Table 1. The study was conducted following the Declaration of Helsinki, and the project was approved by the Committee on Research Ethics of the same university.

2.2. Testing Procedures

The Free Med ground reaction force platform baropodometric mat was used to evaluate COP values in static and dynamic testing using Free Step computer software (Free Step v.1.0 User’s Guide: www.koordynacja.com.pl). We took all measurements in the experiments following the measurement protocols. The magnitude of body sway is influenced by acoustic, visual, and sensory stimuli. Therefore, to obtain reproducibility of the conditions for the realization of the study, the experiments were conducted in a quiet, warm room, after rest, at the same time of day, and in the same closed room in the Faculty of Physiotherapy’s research laboratory at the University of Health and Sport Sciences in Wroclaw. The test was performed under visual control (with eyes open), which allowed for a more stable posture [4].
Before proceeding with the testing procedure, it was determined which limb was dominant, according to the method developed by Bogdanowicz [25]. In both the static and dynamic tests, the test subject stood on a mat without shoes in the area to be measured. Before recording the static test, the subject was asked to place both feet in the area designated for data recording with feet parallel to each other at one level. The heels were to be parallel to each other and visible exactly at the bottom of the recording screen; the lower limbs were set at hip width; the upper limbs were positioned freely along the torso; the subject’s gaze was directed ahead; and their eyes were open. Study participants were asked to stand as still as possible. Once the correct position was assumed, the measurement was started by turning on the start button. The survey lasted for 5 s. When the close button was clicked, the collected data was autosaved. In addition, in the dynamic test, the person was asked to move freely to the end of the mat, then make a turn and walk back naturally, while alternating the movement of their upper limbs and directing their eyes ahead. The athletes were asked to get off the mat completely when changing directions. After collecting three steps for the left foot and three steps for the right foot, the test was considered complete and the stop button was pressed. When the close button was pressed, the collected data was autosaved (Free Step v.1.0 User’s Guide: www.koordynacja.com.pl).
The results were analyzed based on posturographic variables related to the COP displacements on the platform. During static testing, the following variables were assessed: COP (left-forward, right-forward, and center) as the maximum displacement of the COP of the feet from point 0, which is the calculated geometric center of gravity of the test subject in the frontal plane (in the left-forward, right-forward, or center direction); and COP (front-back) in the sagittal plane. The tolerance of the sway range was 0–5 mm. During dynamic testing, the COP (sway path length) was determined as the total path length traveled by the COP of the test subject’s feet on the support plane, expressed in mm. The tolerance of the sway range was 0–5 mm. The results obtained from the measurements given should be read according to the following principle: the lower the value, the better the equilibrium level. Displacement values, after being converted into digital form, were recorded in a computer system and presented on a monitor in real time. Based on these variables, the measuring device determined the position of the COP of the feet.

2.3. Statistical Analysis

Data was analyzed using the Statistica 10.0 statistical package (StatSoft, USA). The dataset was evaluated for normality using the Shapiro–Wilk test. Basic descriptive statistics (mean ± standard deviation) were calculated for the displacement variables of the body COP on the platform in the static test, separately in the sagittal and frontal planes. Then, the variables in the dynamic test were calculated for the D and ND lower limbs in all study groups. In all tests, the significance level was set as α- = 0.05. One-way ANOVA for the group factor (C, PL, and M) was performed for COP variables in the sagittal plane in the static test. A two-factor MANOVA was also conducted for the group factor (C, PL, and M) and the direction factor of COP displacement (front-left, front-right, and center) for COP displacement in the frontal plane. As a post-hoc test, the Bonferroni multiple comparisons test was used. The r-Pearson correlation coefficients, tested by the Student’s t-test, were determined and interpreted according to the following magnitude scale: 0.2, very weak correlation; 0.2–0.4, weak correlation; 0.4–0.6, moderate correlation; 0.6–0.8, strong correlation; and 0.8–0.9, very strong correlation [26]. The rank correlation coefficient was used to determine the correlation between the COP, and the D and ND lower limbs in the three study groups.

3. Results

The analysis of individual COP displacement parameters in static and dynamic testing was evaluated in the M, PL, and C groups.
Based on the anthropometric characteristics listed in Table 1, it can be concluded that powerlifters were shorter and had a higher body weight. Their BMI was also the highest of all the groups studied. The individuals in the M group were significantly older than individuals in both the PL group (p = 0.001) and the control (C) group (p = 0.003). The PL and C groups did not differ significantly in mean age (p = 1.000). The mean body height, body mass, and BMI of the groups was not significantly different.

3.1. Static Test

A one-way analysis of variance for the group factor (C, PL, M) was performed in the sagittal plane. No statistically significant differences were observed between the means of the COP variable (p > 0.05). The lowest average value for this variable was observed in the C group (Table 2, Figure 1).
There were no statistically significant differences between the group averages (Table 3).
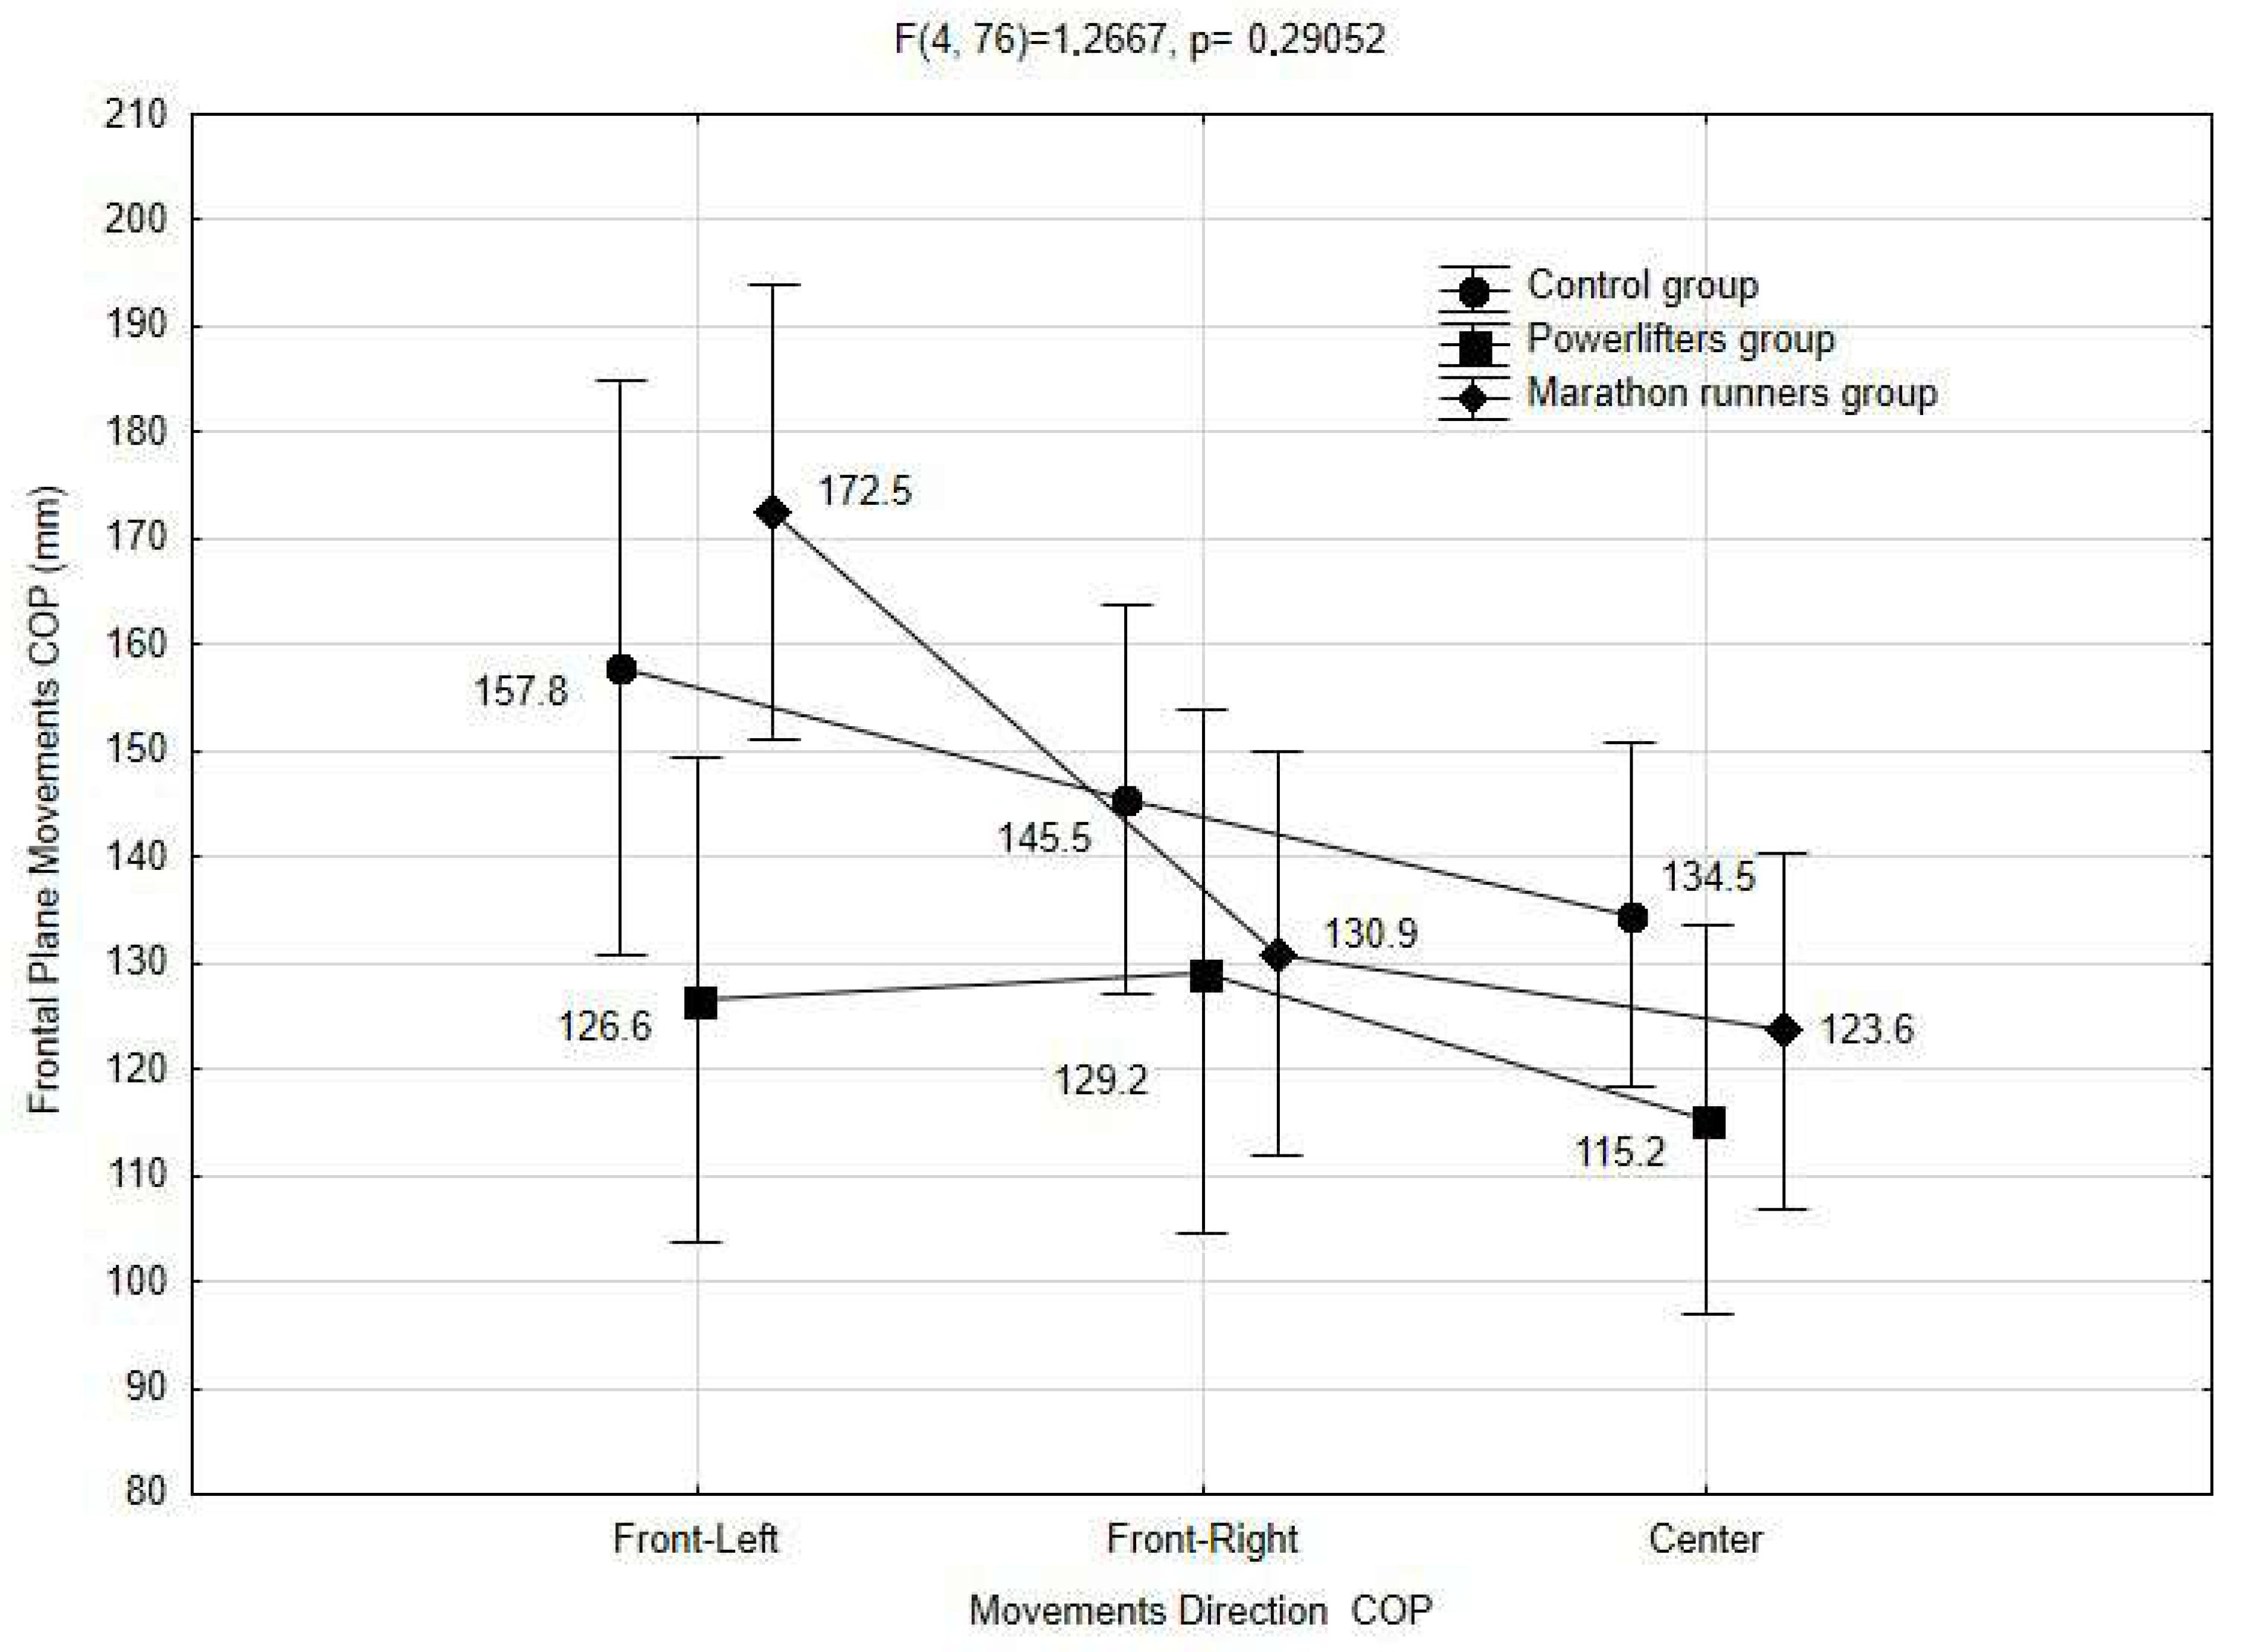
A two-factor analysis of variance was performed for the group factor (C, PL, M) and the direction of displacement factor (front-left, front-right, center) in the frontal plane. For the mean COP displacement (front-left, front-right, center), no statistically significant differences were observed (p > 0.05). A greater displacement of the COP in the front-left direction was noted in all study groups (Table 3, Figure 2).

3.2. Dynamic Study

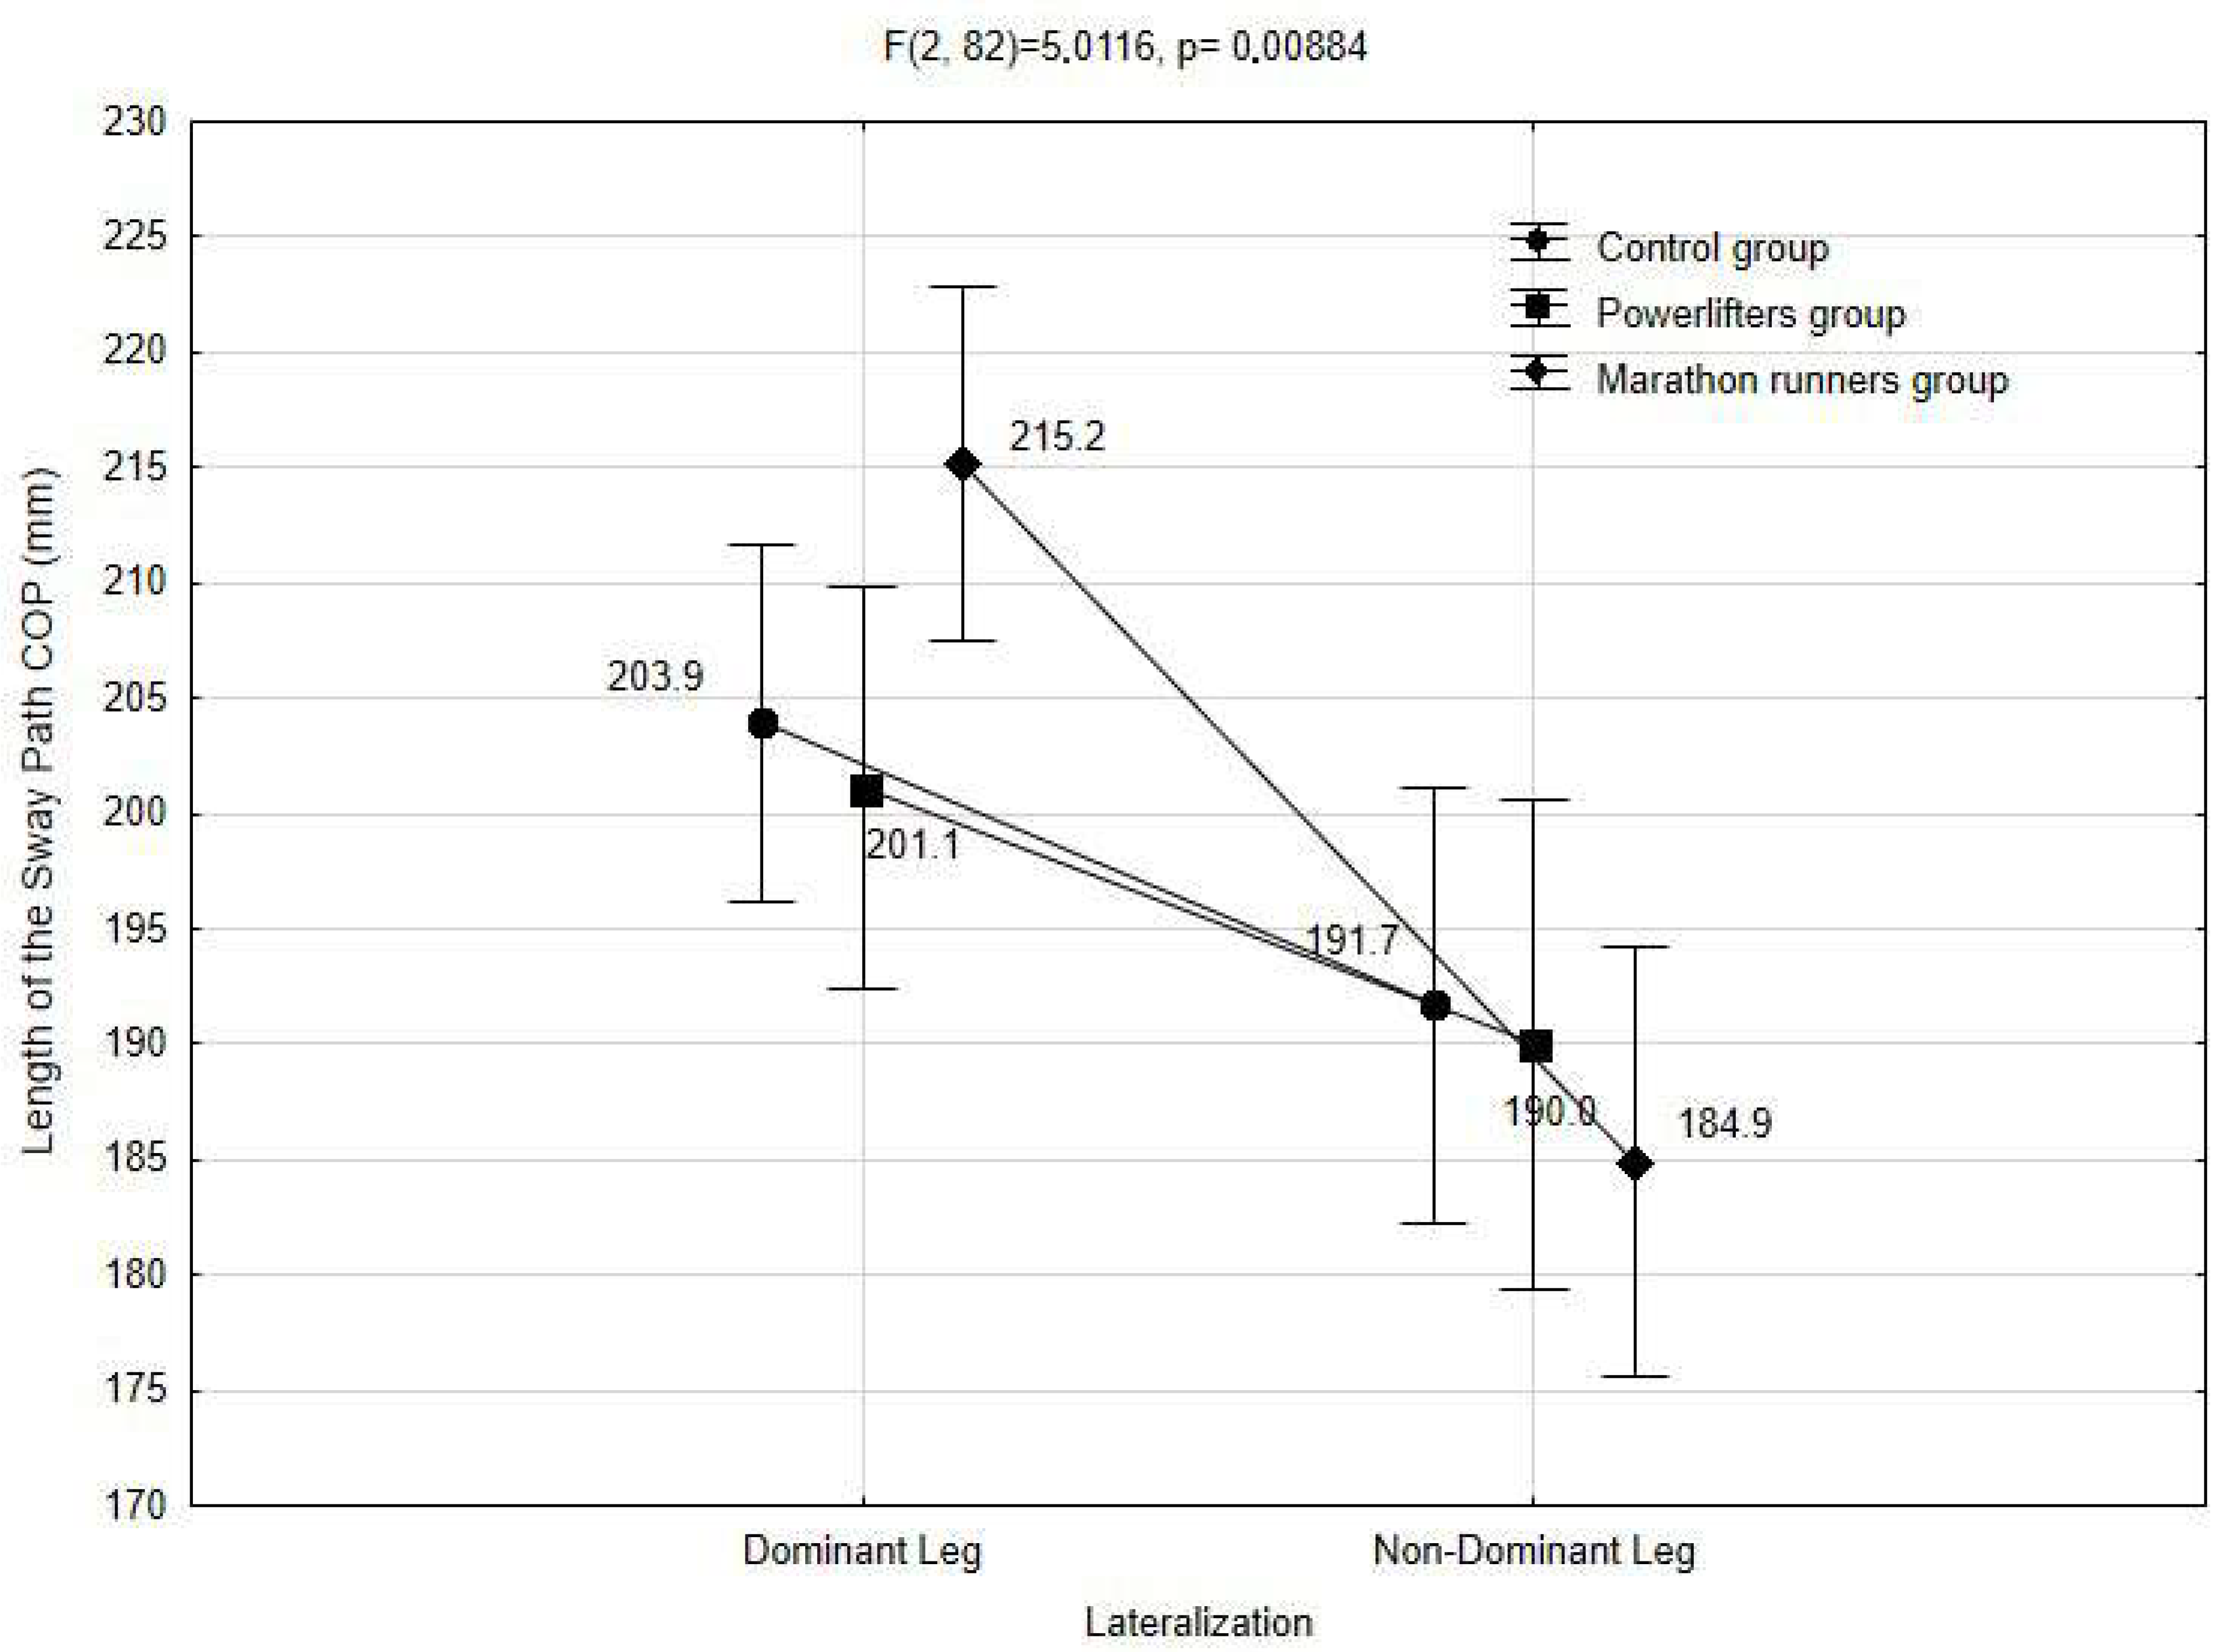
A statistically significant interaction was observed between the group factor (three study groups) and the lateralization factor (D limb and Non-dominant limb) (p = 0.009) (Table 4, Figure 3).
Statistically significant differences between the averages were determined using a post-hoc Bonferroni test (Table 5).
In the M group, a statistically significant difference was observed between the length of the sway path of the D and Non-dominant limbs (p < 0.001) (Table 5).
In both the C and PL groups, a significant relationship was observed between the two variables regarding the parameter of sway distance between the lower limbs (r = 0.75; p < 0.001 and r = 0.73; p < 0.001) (Table 6).

4. Discussion

Studying postural stability in sports can provide insight into the development of specific postural strategies [16]. Physical effort, that is, the total kinetic energy required to engage in an activity and to change the position of one part of the body relative to another, is one of the factors that strongly affects the stability of the body [12]. The type of physical activity, as well as the level of performance, can modulate dynamic and static postural control.
Long-distance running is a huge effort for the body. Among other things, it puts considerable strain on the musculoskeletal system, especially the feet, which are subject to considerable pressure due to their distal position and direct contact with the ground. Prolonged exertion can cause fatigue of the soft tissues stabilizing the sole vault of the foot, which in turn can affect the distribution of body weight across the different zones within the foot [27,28]. According to Reenald et al. [29], during prolonged running such as a marathon, the pressure and load on the feet are distributed differently than during daily activities. Hence, this type of physical activity can have a significant impact on the foot load center (COP). During long-distance running, the foot experiences repeated impacts and pressures, which can lead to a shift in the point of the greatest load, which is a natural response to prolonged exertion. Typically, the pressure shifts more to the forefoot and the toes, as well as to the lateral parts, depending on the running technique and the type of surface being run on. This prolonged load in certain areas can affect changes in the structure of the muscles and the bones of the feet. These changes may lead to painful corns, which can cause discomfort and pain, and may even lead to injury [29].
In another aspect, practicing powerlifting can affect the COP. When performing strength exercises such as squats or deadlifts, the feet play a key role in stabilizing the body and distributing forces. Particularly when lifting heavy weights, the pressure on the foot can be distributed evenly or concentrated in specific areas, depending on the lifting technique and the position adopted. Strength training can shift the center of the load on the feet, especially when the lifting method is incorrect or the weight being lifted is too heavy. This can result in increased pressure on particular areas of the foot (inner or outer), as well as on the toes or heels. Prolonged incorrect load distribution during powerlifting can cause discomfort and pain and can eventually lead to musculoskeletal problems in the feet [30].
The AP and ML directional components of the COP trajectory and their correlations can provide important information about the state of postural control [11]. Training allows athletes to acquire new equilibrium control skills that possibly vary depending on the sport [17]. The purpose of this study was to determine whether training for a marathon and powerlifting could affect COP values in static and dynamic testing, assessed with the Free Med ground reaction force platform. We analyzed athletes of different sports, such as those who do marathons and powerlifting, aiming to present the specific postural strategies associated with the practice of these sports. Running a marathon is a dynamic activity. According to Van Genta et al., Hollander et al., and Hoenig et al., during running, compensations for small disturbances in stability occur thanks to the functioning of the dynamic system [27,31,32]. In contrast, powerlifting is one of the static sports. The high-intensity nature of training and competition in this sport can result in numerous structural and functional adaptations of the musculoskeletal system. Athlete instability can have a significant impact on the final results of the competition [33,34,35,36]. In both sports, participation of the ankle joints, which are responsible for controlling the COP [14], is crucial.
In our study, we found that the average body height, body mass, and BMI of the groups were not significantly different. These results are consistent with data presented in Bieć and Kuczynski’s study of athletes and their non-sporting peers [16]. In a study conducted on a baropodometric mat, Demura et al. indicated that there was no statistically significant difference in the static test between the groups of people engaged in selected sports and the control group not engaged in intense physical activity [37]. This can be attributed to the high variability of the parameters studied in the different groups. This may also be due to the different levels of postural control of the subjects, even before they started playing the sport. Additionally, these results suggest that there may be fairly close inter-individual repeatability of the human locomotion program, independent of the sport practiced [37,38]. In turn, Winiarska et al. [13] and Ivanenko et al. [39] found that physically active people maintain better body equilibrium. They demonstrated the high effectiveness of training in the process of developing and improving the sense of equilibrium [13,39].
In our study of the evaluation of COP deflections in the sagittal plane in a static test, the lowest mean value was observed in the C group. According to Baudry et al. [38] and Maurer et al. [40], this may be because the agonist and antagonist group of muscles, the stabilizers of the ankle joints, and the glenohumeral muscles may have contracted excessively in the non-training group. This result may also be due to the specific stabilization in the AP direction by the triceps and calf muscles, which may have resulted in less mobility in the sagittal plane in this study group [38,40].
In the frontal plane, on the other hand, a greater displacement of COP in the front-left direction was noted in all study groups.
However, in the frontal plane, a greater shift of the COP in the anterior-left direction was observed in all research groups. This is also confirmed in the study by Rohan et al. This tendency is explained by the existing functional asymmetry, where the left foot has a supporting function [28].
In their study on a group of football players and non-athletes, Bieć and Kuczynski noted that training was effective in improving postural control in the frontal plane. These athletes developed specific postural strategies characterized by reduced COP [16].
In our study of measurements in the dynamic test, despite the finding of no statistically significant difference in the averages between the study groups (C, PL, M), the M group had the highest mean length of COP sway path for the D lower limb and the lowest mean length of COP sway path for the ND lower limb. The hypothesis posed by Willems et al. assumed a key role for the posterior tibialis muscle in controlling foot alignment during the support and gait phases. Fatigue of this muscle after long-distance running can lead to a lack of adequate stabilization of the ankle joints and foot, which can cause changes in the distribution of pressure on the soles of the feet [41]. The study population of runners consisted of active, healthy individuals without much running experience, and this, according to Hollander, can affect running stability. Thus, caution should be exercised when relating the results of these studies to a population of elite runners [31].
The r-Pearson test showed that there was a high correlation between the D and ND lower limbs in the dynamic test among athletes practicing powerlifting. Similar findings were reported by Storey et al., who indicated that this may be due to asymmetrical lower limb work when performing scissors in the toss technique [33].
In contrast, Matsuda et al. and Albaladejo-García et al. found that none of the tested groups of athletes in selected sports, compared to a control group of non-athletes, showed significant differences in the displacement of the COP between the D and ND lower limbs [42,43].
The motor programs that control both gait and posture are partly genetic and partly learned and can vary from sport to sport [44]. According to Leroy et al. and Chow et al., intense sports practice involves learning automatic movements. Their execution must become stereotyped and repetitive, and they often require a high degree of equilibrium with rapid changes in movement. In their study, these authors showed differences in loading patterns and postural adjustments depending on the sport practiced. The asymmetries found in spontaneous locomotion may be due to asymmetric muscle development caused by specialization in a particular discipline [45,46].
According to Asseman, Caron, and Cremieux, postural control can be disrupted by decreasing the base of support or by manipulating sensory feedback from the feet, for example, by using a prone surface [47].
Analysis of our research and that of Pauk et al. and Kozel et al. indicated the need to perform a COP assessment using baropodometric systems [48,49]. On the one hand, computer software is a research tool that allows us to carry out precise measurements. On the other hand, it allows us to compare our research with the results of other authors using the same research protocols [18]. It is important to obtain a good analysis of postural control. It is also necessary to consider that the reliability of various variables seems to depend on the conditions of the measured and analyzed signals [50].

4.1. Limitations

Several limitations of the study should be acknowledged. The reported results are based on study groups that varied in size, gender, and age. No sample size calculations were performed and training duration was not considered. Additionally, variations in training loads across individual clubs may have influenced the findings. We recognize these limitations and consider this study to be preliminary. It should be viewed as a pilot study, with the potential to serve as the foundation for more extensive future research aimed at exploring specific correlations between the type of sport practiced and the development of postural stability.

4.2. Practical Application

The results of this research can make an important contribution to better understanding the mechanisms affecting the behavior of the COP index. Understanding these transitions is valuable in sports science because postural stability is an important determinant of athletic level. Coaches and instructors could incorporate specially developed tools for the comprehensive assessment of postural stability, such as baropodometric systems, to meet the urgent need for efficient control of the training process. These assessment tools could also help prevent possible future injuries to athletes. This knowledge also seems crucial in sports because it can provide benchmarks for comparison, indicating how much effort is required to significantly improve postural control. Further investigation of the specific correlations between these factors and the development of postural stability is therefore warranted, as this may open up new perspectives in sports that require specific equilibrium abilities.

5. Conclusions

Only in the M group were statistically significant differences found between the D and ND lower limbs in this dynamic study. These athletes developed specific postural strategies characterized by the difference between the length of the sway path between the D and ND lower limbs. Further research is needed in these athlete groups to determine whether practicing these sports can affect the distribution of foot pressure on the ground.

Author Contributions

Conceptualization: A.H. (Arletta Hawrylak) and A.H. (Adam Hawrylak); data curation: A.H. (Arletta Hawrylak); formal analysis: A.H. (Arletta Hawrylak) and A.D.; funding acquisition: A.H. (Arletta Hawrylak); methodology: A.H. (Arletta Hawrylak) and A.D.; project administration: A.H. (Arletta Hawrylak); resources: A.H. (Arletta Hawrylak), A.D., and A.H. (Adam Hawrylak); software: A.H. (Adam Hawrylak); supervision: A.H. (Arletta Hawrylak) and A.H. (Adam Hawrylak); validation: A.D.; visualization: A.H. (Arletta Hawrylak); writing—original draft: A.H. (Arletta Hawrylak) and A.H. (Adam Hawrylak); writing—review and editing: A.D. All authors have read and agreed to the published version of the manuscript.

Funding

This research received no external funding.

Institutional Review Board Statement

The study was conducted in accordance with the Declaration of Helsinki and approved by the Ethics Committee of Wroclaw University of Health and Sport Sciences on 4 July 2009. The committee does not issue approval reference numbers at that time.

Informed Consent Statement

Informed consent was obtained from all subjects involved in the study.

Data Availability Statement

The data presented in this study are available on request from the corresponding author. The data are not publicly available due to privacy.

Acknowledgments

The authors would like to thank the participants for their cooperation.

Conflicts of Interest

The authors declare no conflicts of interest.

References

  1. Kuczyński, M.; Podbielska, M.; Bieć, D.; Paluszak, A.; Kręcisz, K. The basics of postural control assessment: What, how and why do we need to measure? Acta Bio-Opt. Inform. Med. Inżynieria Biomed. 2012, 18, 243–249. [Google Scholar]
  2. Romano, F.; Colagiorgio, P.; Buizza, A.; Sardi, F.; Ramat, S. In Extraction of traditional COP-based features from COM sway in postural stability evaluation. In Proceedings of the 2015 37th Annual International Conference of the IEEE Engineering in Medicine and Biology Society (EMBC), Milan, Italy, 25–29 August 2015; IEEE: Piscataway, NJ, USA, 2015; pp. 3715–3718. [Google Scholar]
  3. Masani, K.; Vette, A.H.; Abe, M.O.; Nakazawa, K. Center of pressure velocity reflects body acceleration rather than body velocity during quiet standing. Gait Posture 2014, 39, 946–952. [Google Scholar] [CrossRef] [PubMed]
  4. Ocetkiewicz, T.; Skalska, A.; Grodzicki, T. Evaluation of static balance with the use of the posturographic platform in poorly visionaries and blind persons. Gerontol. Pol. 2006, 14, 144–148. [Google Scholar]
  5. Riley, M.A.; Turvey, M.T. Variability and determinism in motor behavior. J. Mot. Behav. 2002, 34, 99–125. [Google Scholar] [CrossRef]
  6. Trajković, N.; Kozinc, Ž.; Smajla, D.; Šarabon, N. Relationship between ankle strength and range of motion and postural stability during single-leg quiet stance in trained athletes. Sci. Rep. 2021, 11, 11749. [Google Scholar] [CrossRef]
  7. De Cássia Libardoni, T.; da Silveira, C.B.; Sinhorim, L.M.B.; de Oliveira, A.S.; Dos Santos, M.J.; Santos, G.M. Reference values and equations reference of balance for children of 8 to 12 years. Gait Posture 2018, 60, 122–127. [Google Scholar] [CrossRef]
  8. Doyle, T.L.; Newton, R.U.; Burnett, A.F. Reliability of traditional and fractal dimension measures of quiet stance center of pressure in young, healthy people. Arch. Phys. Med. Rehabil. 2005, 86, 2034–2040. [Google Scholar] [CrossRef]
  9. Sturnieks, D.L.; St George, R.; Lord, S.R. Balance disorders in the elderly. Neurophysiol. Clin./Clin. Neurophysiol. 2008, 38, 467–478. [Google Scholar] [CrossRef]
  10. Marcolin, G.; Cogliati, M.; Cudicio, A.; Negro, F.; Tonin, R.; Orizio, C.; Paoli, A. Neuromuscular Fatigue Affects Calf Muscle Activation Strategies, but Not Dynamic Postural Balance Control in Healthy Young Adults. Front. Physiol. 2022, 13, 799565. [Google Scholar] [CrossRef]
  11. Krawczyk-Suszek, M.; Martowska, B.; Sapuła, R. Analysis of the Stability of the Body in a Standing Position When Shooting at a Stationary Target—A Randomized Controlled Trial. Sensors 2022, 22, 368. [Google Scholar] [CrossRef]
  12. Błaszczyk, J.; Beck, M.; Sadowska, D. Assessment of postural stability in young healthy subjects based on directional features of posturographic data: Vision and gender effects. Acta Neurobiol. Exp. 2014, 74, 433–442. [Google Scholar] [CrossRef]
  13. Winiarska, A.; Ziółkowska, A.; Świtaj, K.; Wojtczak, P. Balance of individuals at different age involved in physical activity–review of publications. J. Educ. Health Sport 2017, 7, 978–985. [Google Scholar]
  14. Winter, D.A.; Patla, A.E.; Ishac, M.; Gage, W.H. Motor mechanisms of balance during quiet standing. J. Electromyogr. Kinesiol. 2003, 13, 49–56. [Google Scholar] [CrossRef] [PubMed]
  15. Kovács, B.; Kóbor, I.; Gyimes, Z.; Sebestyén, Ö.; Tihanyi, J. Lower leg muscle–tendon unit characteristics are related to marathon running performance. Sci. Rep. 2020, 10, 17870. [Google Scholar] [CrossRef]
  16. Bieć, E.; Kuczyński, M. Postural control in 13-year-old soccer players. Eur. J. Appl. Physiol. 2010, 110, 703–708. [Google Scholar] [CrossRef]
  17. Perrin, P.; Deviterne, D.; Hugel, F.; Perrot, C. Judo, better than dance, develops sensorimotor adaptabilities involved in balance control. Gait Posture 2002, 15, 187–194. [Google Scholar] [CrossRef]
  18. Pinsault, N.; Vuillerme, N. Test–retest reliability of centre of foot pressure measures to assess postural control during unperturbed stance. Med. Eng. Phys. 2009, 31, 276–286. [Google Scholar] [CrossRef]
  19. De Sá Ferreira, A.; Baracat, P.J.F. Test–retest reliability for assessment of postural stability using center of pressure spatial patterns of three-dimensional statokinesigrams in young health participants. J. Biomech. 2014, 47, 2919–2924. [Google Scholar] [CrossRef]
  20. Moon, S.; Huang, C.-K.; Sadeghi, M.; Akinwuntan, A.E.; Devos, H. Proof-of-concept of the virtual reality comprehensive balance assessment and training for sensory organization of dynamic postural control. Front. Bioeng. Biotechnol. 2021. [Google Scholar] [CrossRef]
  21. Horak, F.B. Postural orientation and equilibrium: What do we need to know about neural control of balance to prevent falls? Age Ageing 2006, 35 (Suppl. S2), ii7–ii11. [Google Scholar] [CrossRef]
  22. Davlin, C.D. Dynamic balance in high level athletes. Percept. Mot. Ski. 2004, 98 (Suppl. S3), 1171–1176. [Google Scholar] [CrossRef]
  23. Shadkanlu Ostad, M.; Norasteh, A.A.; Babagoltabar Samakoush, H. Comparison of Static and Dynamic Balance of Athletes of Different Sports in Conditions With and Without Posture Disturbances. J. Sport Biomech. 2019, 4, 16–27. [Google Scholar] [CrossRef]
  24. Srokowska, A.; Foss, J.; Lewandowski, A.; Siedlaczek, M.; Srokowski, G.; Radzimińska, A.; Weber-Rajek, M.; Zukow, W. Statistical and dynamical functional evaluation of the selected foot parameters. J. Educ. Health Sport 2015, 5, 568–589. [Google Scholar]
  25. Bogdanowicz, M. Left-Handedness in Children; Wydawnictwo WSiP: Warszawa, Poland, 1992. [Google Scholar]
  26. Stanisz, A. An Affordable Statistic Course Using STATISTICA PL on Examples of Medicine; StatSoft Polska Sp. z oo Kraków: Krakow, Poland, 2006; p. 532. [Google Scholar]
  27. Van Gent, R.; Siem, D.; van Middelkoop, M.; Van Os, A.; Bierma-Zeinstra, S.; Koes, B. Incidence and determinants of lower extremity running injuries in long distance runners: A systematic review. Br. J. Sports Med. 2007, 41, 469–480. [Google Scholar] [CrossRef] [PubMed]
  28. Rohan, A.; Nyc, M.; Rogóż, A.; Furgiel, J. Changes in plantar pressure distribution after long-distance running. New Med. 2017, 21, 58–68. [Google Scholar] [CrossRef]
  29. Reenalda, J.; Maartens, E.; Homan, H.; Buurke, J.H. Continuous three dimensional analysis of running mechanics during a marathon by means of inertial magnetic measurement units to objectify changes in running mechanics. J. Biomech. 2016, 49, 3362–3367. [Google Scholar] [CrossRef] [PubMed]
  30. Bibro, M.; Drwal, A.; Jankowicz-Szymańska, A. The assessment of the effect of strength training of lower limbs on arching and force distribution of the sole in young men. Health Promot. Phys. Act. 2018, 3, 7–11. [Google Scholar] [CrossRef]
  31. Hollander, K.; Hamacher, D.; Zech, A. Running barefoot leads to lower running stability compared to shod running-results from a randomized controlled study. Sci. Rep. 2021, 11, 4376. [Google Scholar] [CrossRef]
  32. Hoenig, T.; Hamacher, D.; Braumann, K.-M.; Zech, A.; Hollander, K. Analysis of running stability during 5000 m running. Eur. J. Sport Sci. 2019, 19, 413–421. [Google Scholar] [CrossRef]
  33. Storey, A.; Smith, H.K. Unique aspects of competitive weightlifting. Sports Med. 2012, 42, 769–790. [Google Scholar] [CrossRef]
  34. Nagao, H.; Kubo, Y.; Tsuno, T.; Kurosaka, S.; Muto, M. A biomechanical comparison of successful and unsuccessful snatch attempts among elite male weightlifters. Sports 2019, 7, 151. [Google Scholar] [CrossRef]
  35. Hoover, D.L.; Carlson, K.M.; Christensen, B.K.; Zebas, C.J. Biomechanical analysis of women weightlifters during the snatch. J. Strength Cond. Res. 2006, 20, 627. [Google Scholar]
  36. Wu, W.; Kang, Z.; Mu, D.; Zhao, H.; Yang, F. T2 mapping for quantitative assessment of ankle cartilage of weightlifters. Sci. Rep. 2023, 13, 19160. [Google Scholar] [CrossRef]
  37. Demura, T.; Demura, S.-i.; Shin, S. Comparison of gait properties during level walking and stair ascent and descent with varying loads. Health 2010, 2, 1372. [Google Scholar] [CrossRef]
  38. Baudry, S.; Duchateau, J. Age-related influence of vision and proprioception on Ia presynaptic inhibition in soleus muscle during upright stance. J. Physiol. 2012, 590, 5541–5554. [Google Scholar] [CrossRef] [PubMed]
  39. Ivanenko, Y.; Gurfinkel, V.S. Human postural control. Front. Neurosci. 2018, 12, 171. [Google Scholar] [CrossRef] [PubMed]
  40. Maurer, C.; Peterka, R.J. A new interpretation of spontaneous sway measures based on a simple model of human postural control. J. Neurophysiol. 2005, 93, 189–200. [Google Scholar] [CrossRef]
  41. Willems, T.M.; De Ridder, R.; Roosen, P. The effect of a long-distance run on plantar pressure distribution during running. Gait Posture 2012, 35, 405–409. [Google Scholar] [CrossRef]
  42. Matsuda, S.; Demura, S.; Uchiyama, M. Centre of pressure sway characteristics during static one-legged stance of athletes from different sports. J. Sports Sci. 2008, 26, 775–779. [Google Scholar] [CrossRef]
  43. Albaladejo-García, C.; Moreno, F.J.; García-Aguilar, F.; Caballero, C. One-Leg Stance Postural Sway Is Not Benefited by Bicycle Motocross Practice in Elite Riders. J. Funct. Morphol. Kinesiol. 2023, 8, 25. [Google Scholar] [CrossRef]
  44. Bonavolontà, V.; Gallotta, M.C.; Zimatore, G.; Curzi, D.; Ferrari, D.; Vinciguerra, M.G.; Guidetti, L.; Baldari, C. Chronic Effects of Asymmetric and Symmetric Sport Load in Varsity Athletes across a Six Month Sport Season. Int. J. Environ. Res. Public Health 2023, 20, 2186. [Google Scholar] [CrossRef]
  45. Leroy, D.; Polin, D.; Tourny-Chollet, C.; Weber, J. Spatial and temporal gait variable differences between basketball, swimming and soccer players. Int. J. Sports Med. 2000, 21, 158–162. [Google Scholar] [CrossRef] [PubMed]
  46. Chow, T.-H.; Chen, Y.-S.; Wang, J.-C. Characteristics of plantar pressures and related pain profiles in elite sprinters and recreational runners. J. Am. Podiatr. Med. Assoc. 2018, 108, 33–44. [Google Scholar] [CrossRef] [PubMed]
  47. Asseman, F.; Caron, O.; Cremieux, J. Effects of the removal of vision on body sway during different postures in elite gymnasts. Int. J. Sports Med. 2005, 26, 116–119. [Google Scholar] [CrossRef] [PubMed]
  48. Pauk, J.; Daunoraviciene, K.; Ihnatouski, M.; Griskevicius, J.; Raso, J.V. Analysis of the plantar pressure distribution in children with foot deformities. Acta Bioeng. Biomech. 2010, 12, 29–34. [Google Scholar]
  49. Kozel, M.; Škrečková, G.; Potašová, M.; Kutiš, P.; Ondrušková, L. One-Side Weight Sports and the Impact of Their Load on the Feet and the Occurrence of Posture Disorders in Professional Football and Handball Players. Appl. Sci. 2024, 14, 10387. [Google Scholar] [CrossRef]
  50. Caballero, C.; Barbado, D.; Moreno, F. El procesado del desplazamiento del centro de presiones para el estudio de la relación complejidad/rendimiento observada en el control postural en bipedestación. Rev. Andal. Med. Deporte 2013, 6, 101–107. [Google Scholar] [CrossRef]
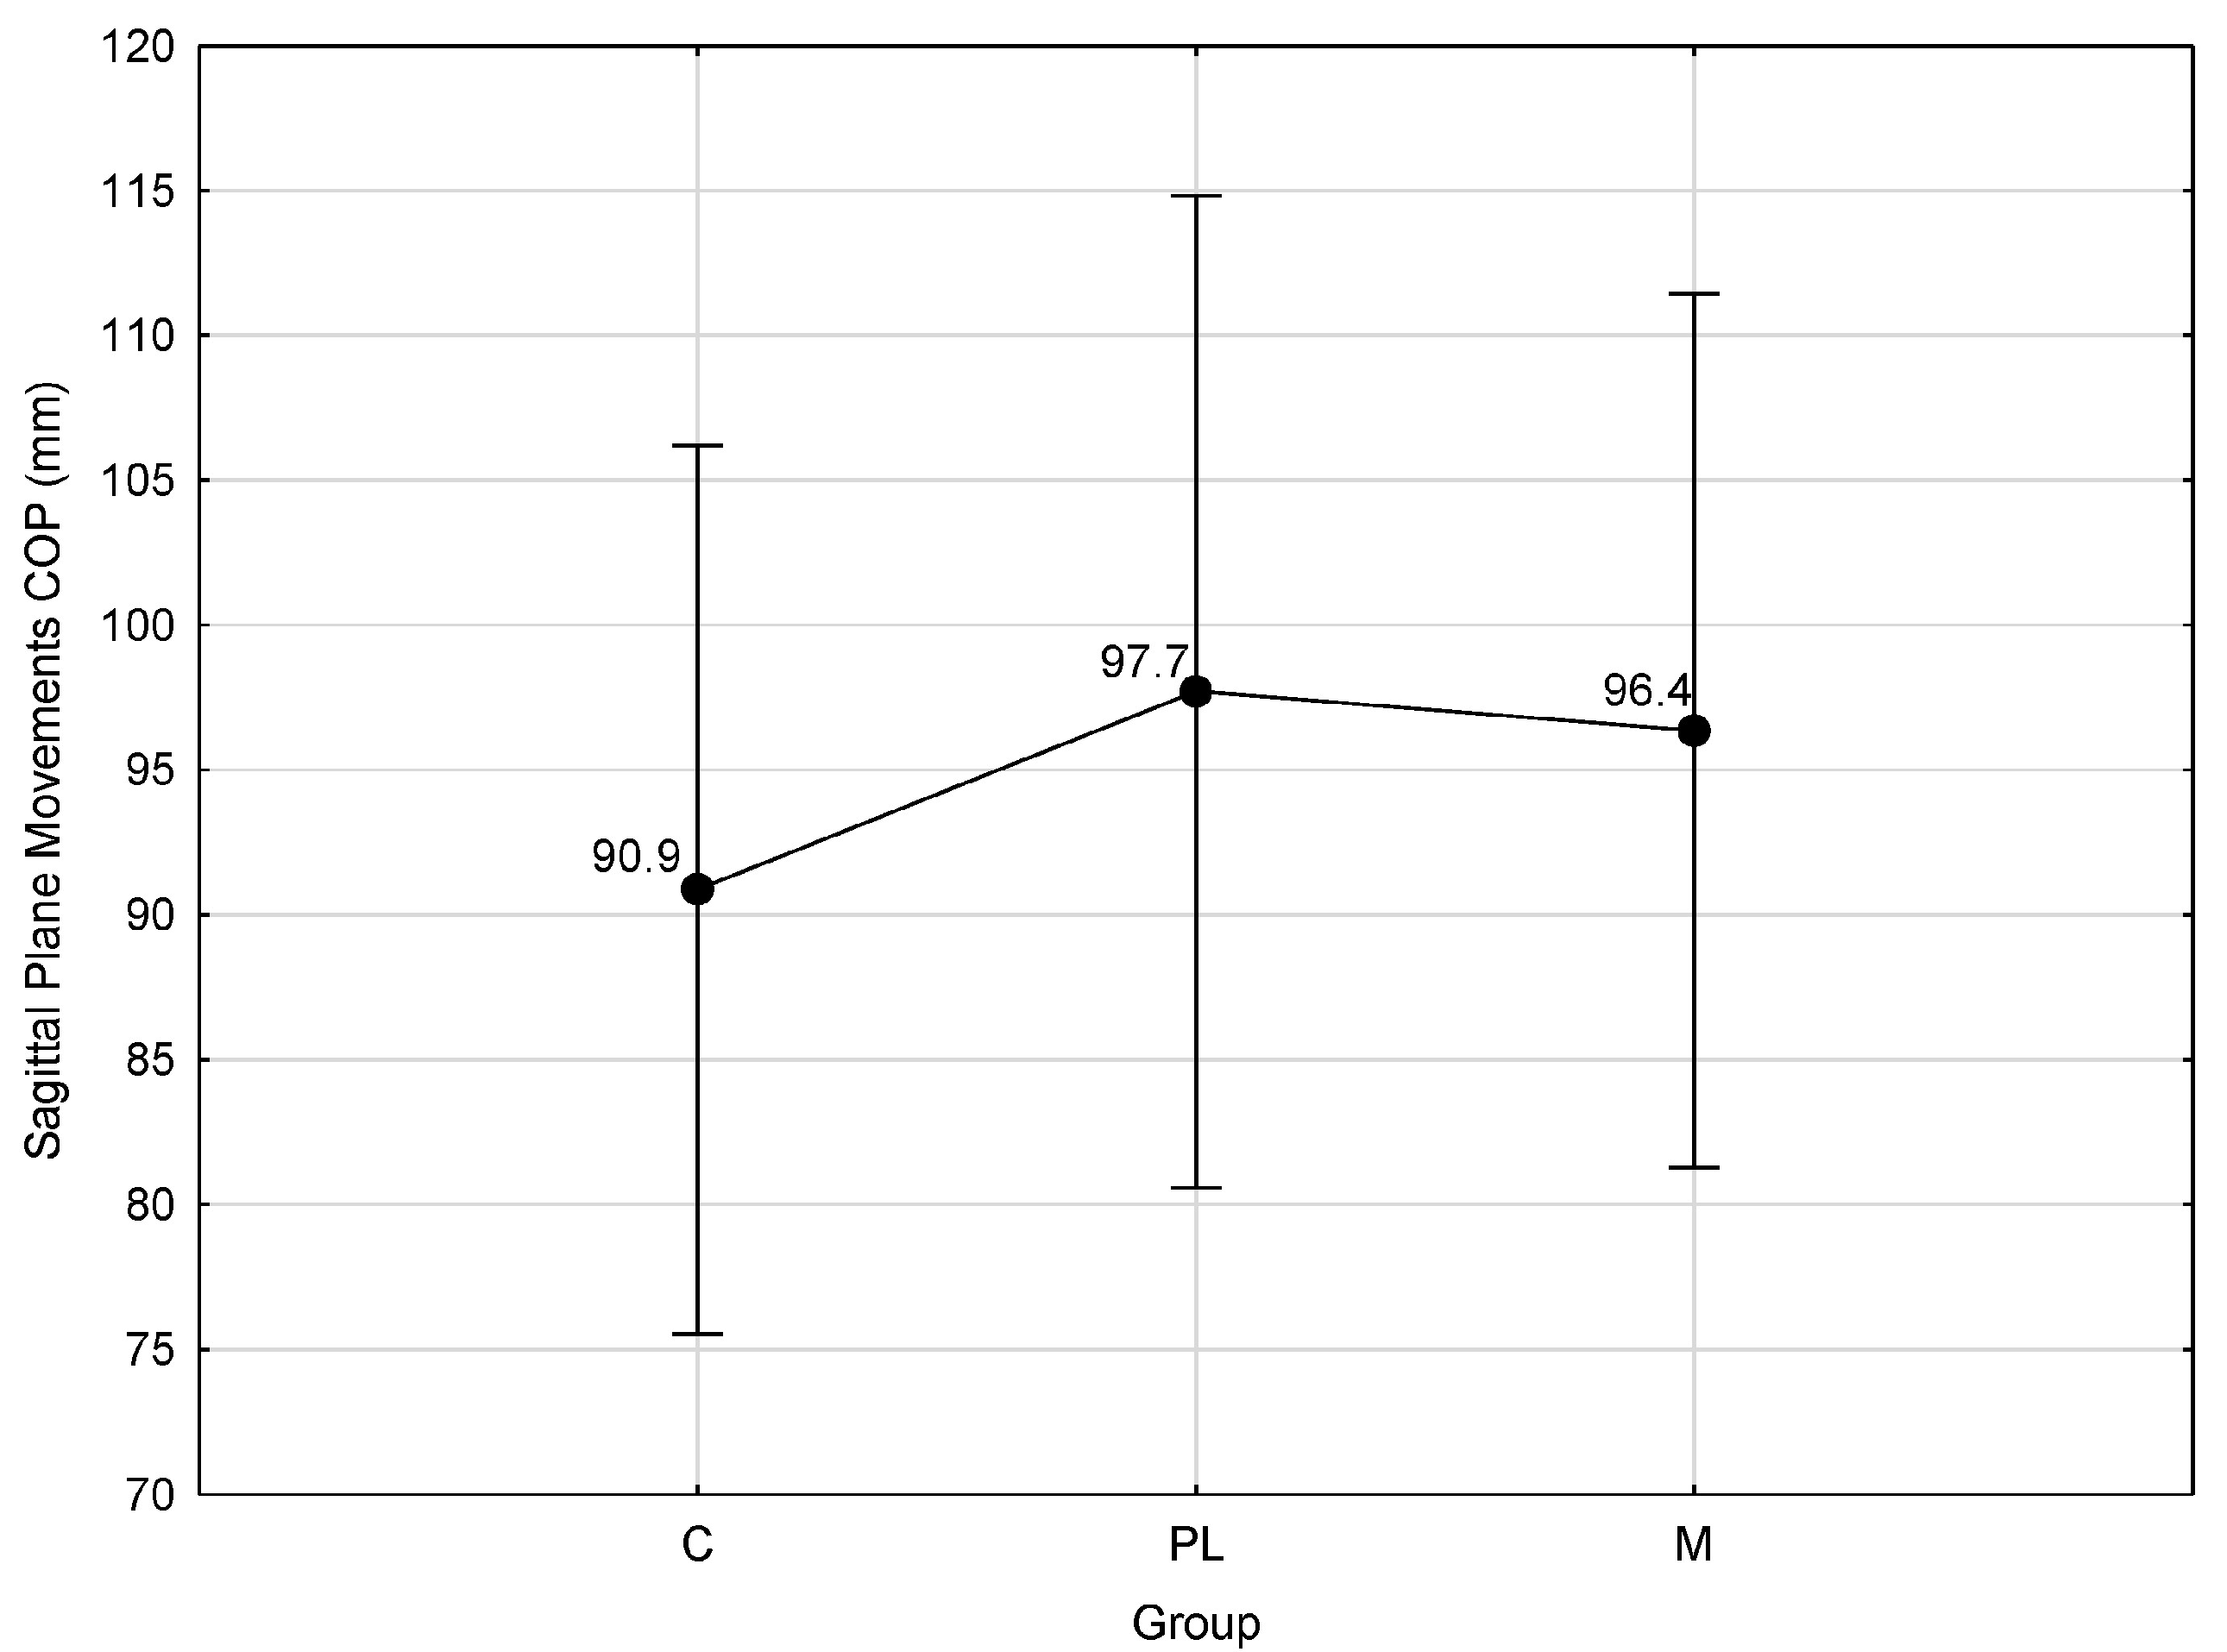
Figure 1. COP displacement characteristics measured in the sagittal plane by group (C, PL, M); means, 95% confidence intervals.
Applsci 15 08774 g001
Figure 2. Characteristics of the COP displacement measured in the frontal plane by group (C, PL, M) and the direction of displacement (front-left, front-right, center); means, 95% confidence intervals.
Applsci 15 08774 g002
Figure 3. Characteristics of COP sway path length (mm) of dominant (D) and non-dominant (ND) lower limbs, including three study groups; means, 95% confidence intervals.
Applsci 15 08774 g003
Table 1. Anthropometric characteristics of the groups.
VariableGROUPM ± SDdfFp
Age
(years)
C
PL
M
23.7 ± 1.29
22.83 ± 0.92
28.06 ± 2.73
df1 = 2,
df2 = 82
F = 12.206p = 0.0000
Body height (BH)
(cm)
C
PL
M
165.97 ± 6.56
163.12 ± 4.46
165.68 ± 4.70
df1 = 2,
df2 = 82
F = 2.1890p = 0.1185
Body mass
(BM)
(kg)
C
PL
M
60.17 ± 8.19
76.87 ± 88.08
59.97 ± 7.89
df1 = 2,
df2 = 82
F = 1.0949p = 0.3394
BMI
(kg/m2)
C
PL
M
21.88 ± 3.02
29.13 ± 34.57
21.84 ± 2.68
df1 = 2,
df2 = 82
F = 1.3360p = 0.2685
p < 0.001, C—Control group, PL—Powerlifters group, M—Marathon runners group.
Table 2. COP displacement characteristics and results of the one-way ANOVA in the AP direction (in the sagittal plane).
GROUPNMSD df F p
C3090.943.2df1 = 2,
df2 = 82
F = 0.2083p = 0.8124
PL2497.741.9
M3196.441.4
p < 0.001, C—Control group, PL—Powerlifters group, M—Marathon runners group.
Table 3. Characteristics of the COP (mm) and results of the two-way MANOVA in the ML direction for the front-left, front-right, and center (frontal plane).
GROUPCOP DisplacementNMSDdfFp
CFront-left5157.818.0df1 = 4
df2 = 76
F = 1.2667p = 0.2905
Front-right11145.527.6
Center14134.530.3
PLFront-left7126.615.9
Front-right6129.233.9
Center11115.226.6
MFront-left8172.533.9
p < 0.001, C—Control group, PL—Powerlifters group, M—Marathon runners group.
Table 4. Characteristics of the variable COP sway path length (mm) for D and ND lower limbs, including study groups, and results of the two-way MANOVA.
GROUPLateralizationNMSDdfFp
CDominant
limb
30203.911.5df1 = 2
df2 = 82
F = 5.0116p = 0.0088
Non-dominant
limb
191.718.2
PLDominant
limb
24201.113.6
Non-dominant
limb
190.020.9
MDominant
limb
31215.231.3
Non-dominant limb184.934.6
p < 0.001, C—Control group, PL—Powerlifters group, M—Marathon runners group.
Table 5. Post-hoc Bonferroni test for a two-way analysis of variance, using the following variables: Sway Path COP, 1 Factor GROUP, and 2 Factor Lateralization.
No.
Group
Post-Hoc Bonferroni Test; p-Value
Variable: SP COP (Sway Path)
GROUPLateralization{1}
M1
203.92
{2}
M2
191.69
{3}
M3
201.10
{4}
M4
190.00
{5}
M5
215.18
{6}
M6
184.87
1CDominant
limb
2CNon-dominant limb0.1803
3PLDominant
limb
1.00001.0000
4PLNon-dominant limb0.51931.00000.6031
5MDominant
limb
1.00000.00270.47140.0023
6MNon-dominant limb0.03281.00000.20141.00000.0000
p < 0.001, C—Control group, PL—Powerlifters group, M—Marathon runners group.
Table 6. The r-Pearson correlation coefficients of the variable COP sway path length between dominant (D) and non-dominant (ND) limbs in the three study groups.
r-Pearson
Variable: Length of Sway Path COP
α = 0.05
LateralizationGROUPMSDrR2tpN
Dominant
limb
C203.9211.490.750.565.990.000030
Non-dominant limbC191.6918.18
Dominant
limb
PL201.0913.640.730.535.000.000024
Non-dominant limbPL189.9920.89
Dominant
limb
M215.1831.340.290.081.620.116031
Non-dominant limbM184.8734.62
p < 0.001, C—Control group, PL—Powerlifters group, M—Marathon runners group.
Disclaimer/Publisher’s Note: The statements, opinions and data contained in all publications are solely those of the individual author(s) and contributor(s) and not of MDPI and/or the editor(s). MDPI and/or the editor(s) disclaim responsibility for any injury to people or property resulting from any ideas, methods, instructions or products referred to in the content.