Article

Research on Intelligent Predictions of Surrounding Rock Ahead of the Tunnel Face Based on Neural Network and Longitudinal Deformation Curve

1
School of Hydraulic and Civil Engineering, Ludong University, Yantai 264025, China
2
School of Civil Engineering, Central South University, Changsha 410075, China
3
National Engineering Laboratory for Construction Technology of High-Speed Railway, Central South University, Changsha 410075, China
4
Hunan Communications Research Institute Co., Ltd., Changsha 410118, China
5
Graduate School of Advanced Science and Engineering, Hiroshima University, Higashihiroshima 739-8527, Japan
*
Author to whom correspondence should be addressed.
Appl. Sci. 2025, 15(16), 8771; https://doi.org/10.3390/app15168771
Submission received: 14 May 2025 / Revised: 7 June 2025 / Accepted: 6 August 2025 / Published: 8 August 2025
(This article belongs to the Section Civil Engineering)

Abstract

Traditional methods for predicting surrounding rock grades ahead of tunnel faces encounter challenges: image-based approaches are susceptible to environmental interference, while parameter-based classification may disrupt construction. This study proposes an intelligent rock grade identification method by integrating longitudinal displacement profile (LDP) evolution patterns with deep learning. First, the numerical model was validated against V-D theoretical curves, and LDP evolution laws were systematically analyzed for three rock types (GSI = 15, 30, 50) under nine geological combinations. The results indicate that (1) homogeneous strata exhibit deformation peaks followed by declines; (2) GSI = 15 strata show significantly larger deformations; and (3) stratified schemes display pre-interface deformation peaks and post-interface deformation controlled by subsequent lithology. A novel hybrid neural network was developed to classify strata using LDP curves as input. The model achieved 93.25% training accuracy and 91.20% validation accuracy. Ablation experiments demonstrated their superiority over the other four models with partial module deletions, achieving improvements in test accuracy of 3.24%, 3.08%, 4.16%, and 6.48%, respectively, compared to those models. This lightweight solution effectively overcomes the limitations of manual expertise dependency in conventional models and environmental sensitivity in visual methods. By synergizing LDP evolution analysis with deep learning, this framework provides a reliable approach for real-time rock grade prediction during tunnel advancement.

1. Introduction

The geological conditions of mountain tunnel engineering are inherently complex, and the information obtained during the investigation phase often fails to comprehensively reflect the actual geological characteristics of the tunnel area. This necessitates the implementation of dynamic design methodologies during construction [1]. Dynamic design imposes stringent requirements on the efficiency and accuracy of surrounding rock classification at tunnel faces during construction phases. Traditional approaches relying on empirical formulas or numerical simulations exhibit limitations in dynamically characterizing the nonlinear deformation features of unexcavated rock masses ahead of tunnel faces [2]. Consequently, algorithm development and deep learning technologies have gained increasing prominence in tunnel and geotechnical engineering research [3,4,5,6,7].
Convolutional neural networks (CNNs), as prevalent deep learning architectures, have demonstrated extensive applications in image feature classification and recognition [8,9,10]. The inherent design of convolutional layers enables CNNs to autonomously extract higher-level abstract features from training datasets. Previous studies have validated the capability of classical models such as AlexNet and ResNet in automatic feature extraction from surrounding rock images [11]. The integration of Principal Component Analysis (PCA) with Probabilistic Neural Networks (PNNs) has shown potential for rock mass stability prediction [12], while Mask R-CNN implementations achieved over 85% accuracy in their mineral content quantification [13]. Although CNN technology effectively replaces manual feature extraction and risk warning tasks, the dynamic identification of rock mass characteristics during construction still faces the following challenges: (1) image acquisition difficulties caused by dust interference, non-uniform illumination, humidity fluctuations, and limited photographic windows [14] and (2) significant heterogeneity in apparent brightness, texture, and grayscale distribution induced by moisture variations and complex fracture patterns, which compromise recognition accuracy [15,16]. Notably, the longitudinal deformation induced by excavation is correlated with intrinsic rock properties, thereby circumventing the environmental interference inherent to image-based methods.
The complete deformation process of rocks surrounding tunnels comprises three distinct phases: pre-excavation for advanced deformation, stabilized deformation following initial support installation, and total deformation prior to secondary lining. Tunnel convergence manifests as a nonlinear process with complex mechanisms, primarily influenced by the surrounding rock stability, excavation-scale effects, and system performance support [17]. Current classification standards for convergence deformation include the Singh [18], Aydan [19], and Hoek [20] schemes based on relative deformation, as well as parameter-based systems utilizing absolute deformation, in situ stress, and stress ratios [21,22]. However, these methods require multiple in situ tests for parameter determination, inevitably disrupting construction operations. Utilizing longitudinal deformation data exclusively could substantially reduce such interference. The Longitudinal Deformation Profile (LDP), as a critical component of the Convergence–Confinement Method (CCM), enables dynamic assessment of support timing and time-dependent self-bearing capacity characteristics, providing practical guidance for construction management [23]. While existing research has extensively analyzed longitudinal deformation data in excavated sections [24,25], the unexcavated portions remain understudied due to challenges in data acquisition. Therefore, a systematic investigation of LDP characteristics ahead of tunnel faces is imperative for the accurate prediction of surrounding rock properties.
To address these challenges, this study aims to assess the following: (1) the comprehensive characterization of LDP curve features under various stratigraphic parameter combinations; (2) the development of a hybrid neural network architecture (SE-CNN-LSTM-Attention) integrating SENet, LSTM, and multiple attention mechanisms; (3) predictive modeling of unexcavated surrounding rock properties; and (4) systematic ablation experiments. This research extends CNN application modalities in rock mass identification and provides practical references for field implementation.

2. Fundamental Theory of Tunnel Surrounding Rock Response

2.1. Hoek–Brown Criterion

The strength criterion of intact rock was initially proposed by E. Hoek and E. T. Brown. Subsequently, by substituting Hoek–Brown parameters, the formulation was generalized to estimate rock mass strength, known as the generalized Hoek–Brown criterion [26]. The mathematical expression is formulated as follows:
σ 1 = σ 3 + σ ci ( m b σ 3 / σ ci + s ) a
where σ1 and σ3 denote the major and minor principal stresses at failure of the intact rock, respectively; σci represents the uniaxial compressive strength of the intact rock; and mb, S, and a are the rock mass parameters characterizing the degree of rock mass fracturing. When the intact rock material constant mi equals mb with s = 1 and α = 0.5, Equation (1) reduces the strength expression for intact rock. The Geological Strength Index (GSI) [27] is employed to determine the rock mass parameters mb, S, and a. E. Hoek et al. [27] introduced the disturbance factor D and proposed an updated methodology for deriving these parameters based on GSI. The calculation formulas are expressed as follows:
m b = m i exp ( G S I 100 28 14 D )
s = exp ( G S I 100 9 3 D )
a = 1 2 + 1 6 ( e G S I 15 e 20 3 )
where D represents the disturbance factor of the surrounding rock. The Geological Strength Index (GSI) is recognized as a quantitative indicator for evaluating rock mass strength and remains the sole method capable of directly determining rock mass mechanical parameters [28]. E. Hoek and M. S. Diederichs employed GSI to estimate the elastic modulus of surrounding rock [29] wherein multiple estimation formulas were systematically compared. Among these, the formulation with reduced empirical error was identified as follows:
E rm = 1 D / 2 1 + exp ( ( 75 + 25 D G S I ) / 11 ) × 10 5
where Erm denotes the elastic modulus; D represents the disturbance factor with a value range of 0–1; and GSI indicates the Geological Strength Index ranging from 0 to 100. An estimation formula for Poisson’s ratio of the surrounding rock was proposed by B. Vásárhelyi [30], utilizing rock material parameters and the Geological Strength Index (GSI) under conditions where the Poisson’s ratio for the intact rock remained undetermined:
ν rm = 0.002 G S I 0.003 m i + 0.457
where νrm is denoted as Poisson’s ratio of the surrounding rock.

2.2. Longitudinal Deformation Profile of Surrounding Rock

The Longitudinal Deformation Profile (LDP) describes the longitudinal variation in radial displacement at unsupported tunnel walls. A fitting formula for the LDP was initially derived by M. Panet [31] through elastic analysis. Subsequently, T. Unlu and H. Gercek [32] further extended this formulation by incorporating Poisson’s ratio. N. Vlachopoulos and M. S. Diederichs [33] proposed the V-D theoretical curve, which correlates with the plastic zone radius in unsupported tunnels and the longitudinal distance from the excavation face. The theoretical expression is formulated as follows:
u * = 1 ( 1 u 0 * ) e 3 X * 2 R * ( X * 0 ) u 0 * e X * ( X * < 0 )
u 0 * = u 0 u max = 1 3 e 0.15 R *
where u* represents the dimensionless ratio of surrounding rock deformation to the maximum deformation at distal locations; X* denotes the dimensionless ratio of the longitudinal distance from the excavation face to tunnel radius; R* indicates the dimensionless ratio of the maximum plastic zone radius to the circular tunnel radius; umax is defined as the maximum deformation of surrounding rock at distal locations after complete geostress release; and u0 is characterized as the radial displacement of surrounding rock at the tunnel face.

3. Numerical Modeling and Validation

The numerical model in this study was constructed in COMSOL Multiphysics 6.2 finite element software based on the Hoek–Brown criterion. Post-establishment validation was performed via comparative analysis with the V-D theoretical curve defined in Equations (7) and (8).

3.1. Numerical Model Development

As the Longitudinal Deformation Profile (LDP) characterizes the longitudinal variation in radial displacement at unsupported tunnel walls, a circular tunnel with full-face excavation and no support was selected for modeling.

3.1.1. Fundamental Model Settings

(1) Geometric Parameters
The rock mass was assumed homogeneous and isotropic, with groundwater effects and time-dependent behaviors excluded. Key geometric parameters included the following: tunnel radius: R = 6 m; full-face excavation advance length: l = 1 m; buried depth: H = 50 m; excavated section length: L1 = 99 m; and unexcavated section length: L2 = 101 m. The computational domain configuration is illustrated in Figure 1a, with LDP data collected post-excavation.
(2) Meshing Parameters
A hexahedral mesh configuration was adopted in this model, characterized by progressive refinement near the excavation face. Specifically, in the Solid Mechanics module of COMSOL Multiphysics, the “discretization” of the displacement field was set to “quadratic”, and the hexahedral mesh was generated through a sweep operation. The shape functions were 20-node quadratic Serendipity elements. The final mesh consisted of 44,415 hexahedral elements, as shown in Figure 1b.

3.1.2. Parameter Determination for Numerical Modeling

Three distinct cases were established for numerical validation, with key parameters including the uniaxial compressive strength of intact rock (σci), rock density (ρ), the Geological Strength Index (GSI), and intact rock material constant (mi), as detailed in Table 1. The disturbance factor D was assigned a value of 0 according to the criteria specified in Table 2 [27]. The elastic modulus (E) and Poisson’s ratio (ν) of the surrounding rock were calculated using Equations (5) and (6), respectively.

3.2. Numerical Model Validation

The accuracy of the numerical model was preliminarily verified through comparative analysis with the V-D theoretical curve. The statistical evaluation of the Root Mean Square Error (RMSE) and Coefficient of Determination (R2) between numerical results and theoretical predictions is summarized in Table 3. The simulated data were subjected to normalization processing, and the comparative results between numerical simulations and the V-D theoretical method are presented in Figure 2.

4. Analysis of LDP Characteristics Under Different Stratigraphic Parameters

Traditionally, the Longitudinal Deformation Profile (LDP) describes the longitudinal variation in radial displacement at unsupported tunnel walls. However, in scenarios with unfavorable stratigraphic parameters, tunnel support becomes essential. Practical engineering applications typically acquire LDP data from the tunnel’s inner surface in excavated sections, whereas obtaining longitudinal deformation data ahead of the tunnel face remains challenging due to inaccessibility [34]. To enable accurate prediction of surrounding rock properties ahead of the tunnel face, systematic analysis of the LDP within the face advance zone is imperative.

4.1. Numerical Modeling Framework

(1) Geometric and Meshing Parameters
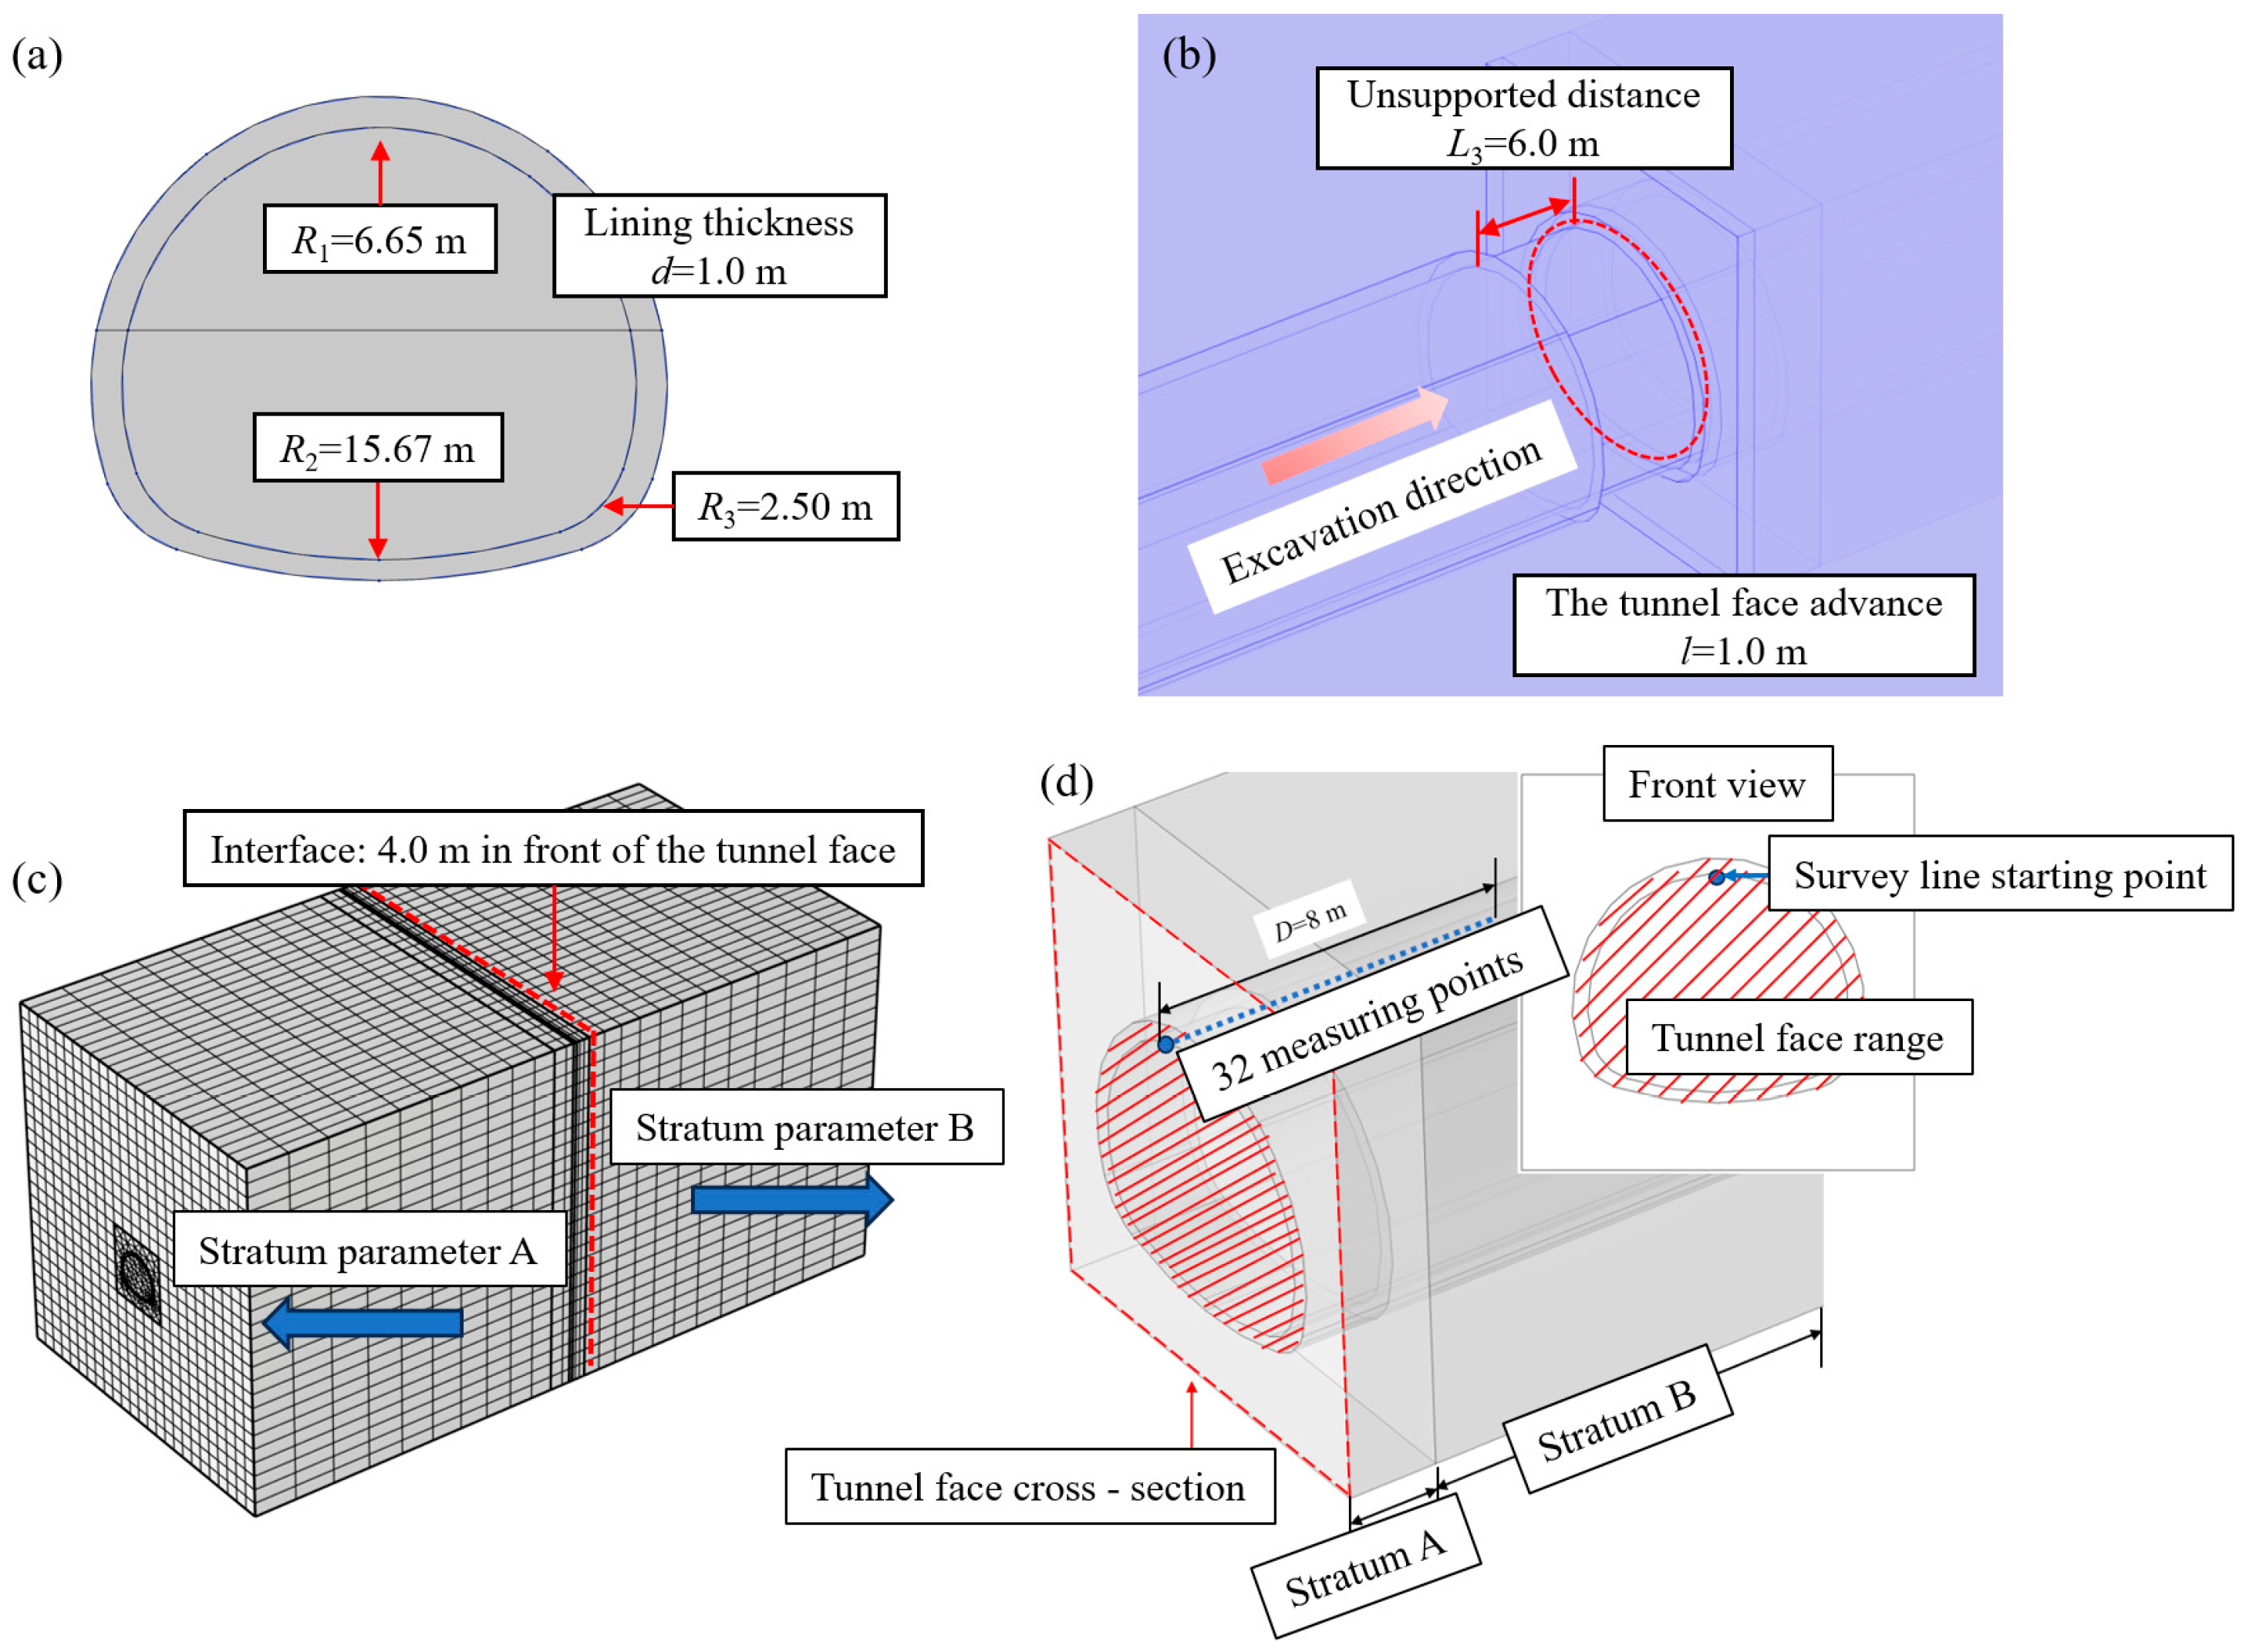
The horseshoe-shaped tunnel cross-section was composed of three circles with distinct radii, as illustrated in Figure 3a. Full-face excavation with an advance length of l = 1 m was implemented, maintaining the computational domain configuration shown in Figure 1a. Key parameters included the following: burial depth: H = 49 m; excavated section length: L1 = 99 m; unexcavated section length: L2 = 101 m; unsupported distance behind the face: L3 = 6 m; and LDP data were collected post-excavation. The mesh configuration (Figure 3c) comprised 21,728 elements.
(2) Stratigraphic and Lining Parameters
The support system was simplified to a single lining layer with the following properties: density: 2500 kg/m3; Young’s modulus: 28.5 GPa; and Poisson’s ratio: 0.25. Stratigraphic parameters remained consistent with those in Section 2.1, encompassing three distinct parameter sets as specified in Table 1. Stratigraphic combination schemes are detailed in Table 4.
(3) LDP Monitoring Point Configuration
To simulate practical construction conditions, monitoring points were distributed along a finite-length section ahead of the tunnel face. A total monitoring line length, D = 8 m, was established, with specific positioning shown in Figure 3d. Deformation data were recorded at 0.25 m intervals.

4.2. Characteristic Analysis of Surrounding Rock Longitudinal Deformation Profile

The computed LDP curves for all cases and comparative z-direction displacement contour maps at the z = −50 m cross-section (Cases 3, 6, 9) are presented in Figure 4. Analysis of Figure 4a reveals that Case 1 exhibits significantly smaller longitudinal deformation magnitudes compared to Cases 2 and 3. The longitudinal deformation curves of Cases 2 and 3 predominantly overlap in the pre-interface zone, whereas distinct divergence emerges post-interface. Case 2 demonstrates deformation attenuation, while Case 3 undergoes rapid deformation escalation. As illustrated in Figure 4b, Cases 4–6 exhibit marked numerical discrepancies. Case 6 achieves maximum deformation magnitude of −3.47 mm at 0.5 m ahead of the tunnel face, followed by an abrupt post-interface reduction in deformation. Figure 4c identifies Case 9 to have peak deformation (−4.49 mm) localized at 0.75 m ahead of the face. Cases 7 and 8 demonstrate negligible divergence prior to the interface; however, post-interface deformation magnitudes diverge significantly, with Case 8 exceeding Case 7. The characteristic features of LDP curves across all cases are systematically summarized in Table 5.
In summary, homogeneous strata cases generally exhibit deformation patterns characterized by an initial increase followed by gradual attenuation. Conversely, cases involving stratigraphic interfaces exhibit biphasic behavior, where deformation follows an increase–decrease trend prior to the interface, while post-interface deformation magnitudes are governed by lithological parameters of the subsequent stratum.

5. A Prediction Model for Rock Mass Classification Ahead of the Driving Face

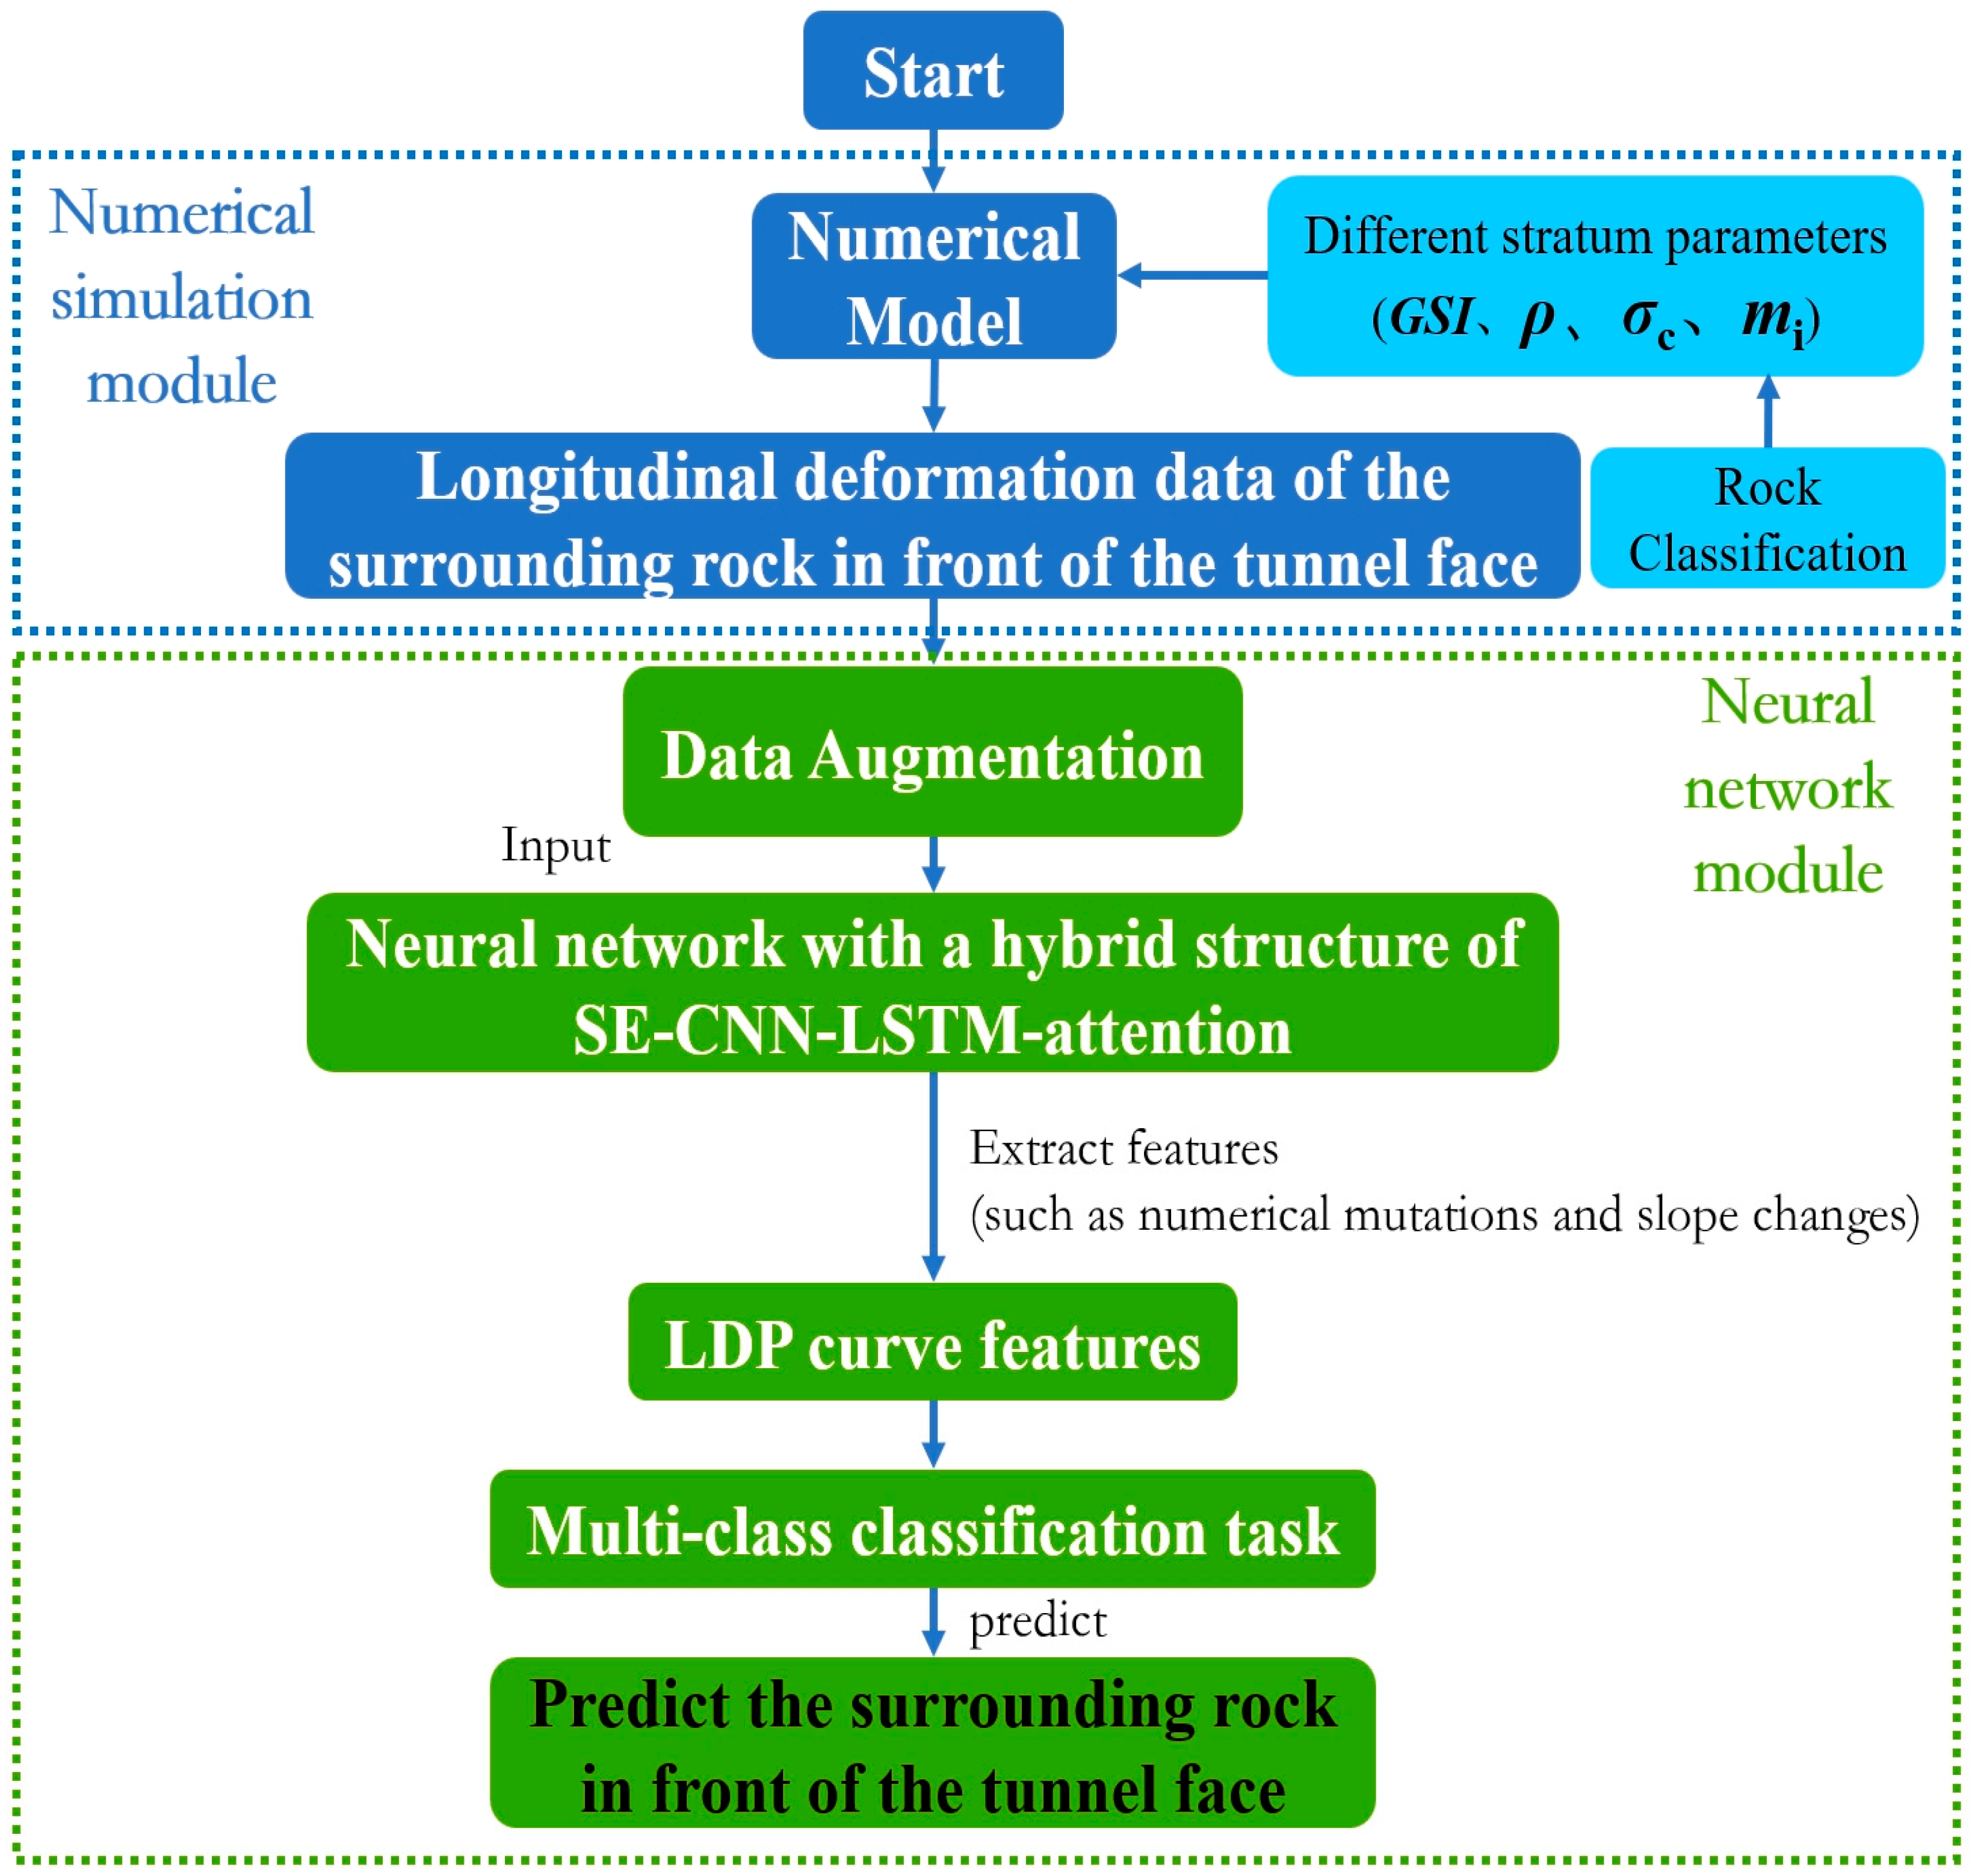
The implementation of neural networks to automate the identification of LDP curve characteristics contributes to enhanced construction efficiency and reduced labor costs. To address diverse rock mass combinations, this study proposes a hybrid architecture integrating SENet-enhanced CNN, LSTM, and multiple attention mechanisms to predict and classify rock mass grades ahead of the excavation face. The detailed procedural flowchart is shown in Figure 5.

5.1. Intelligent Prediction Fundamentals for Rock Mass Classification

5.1.1. SE-CNN Architecture

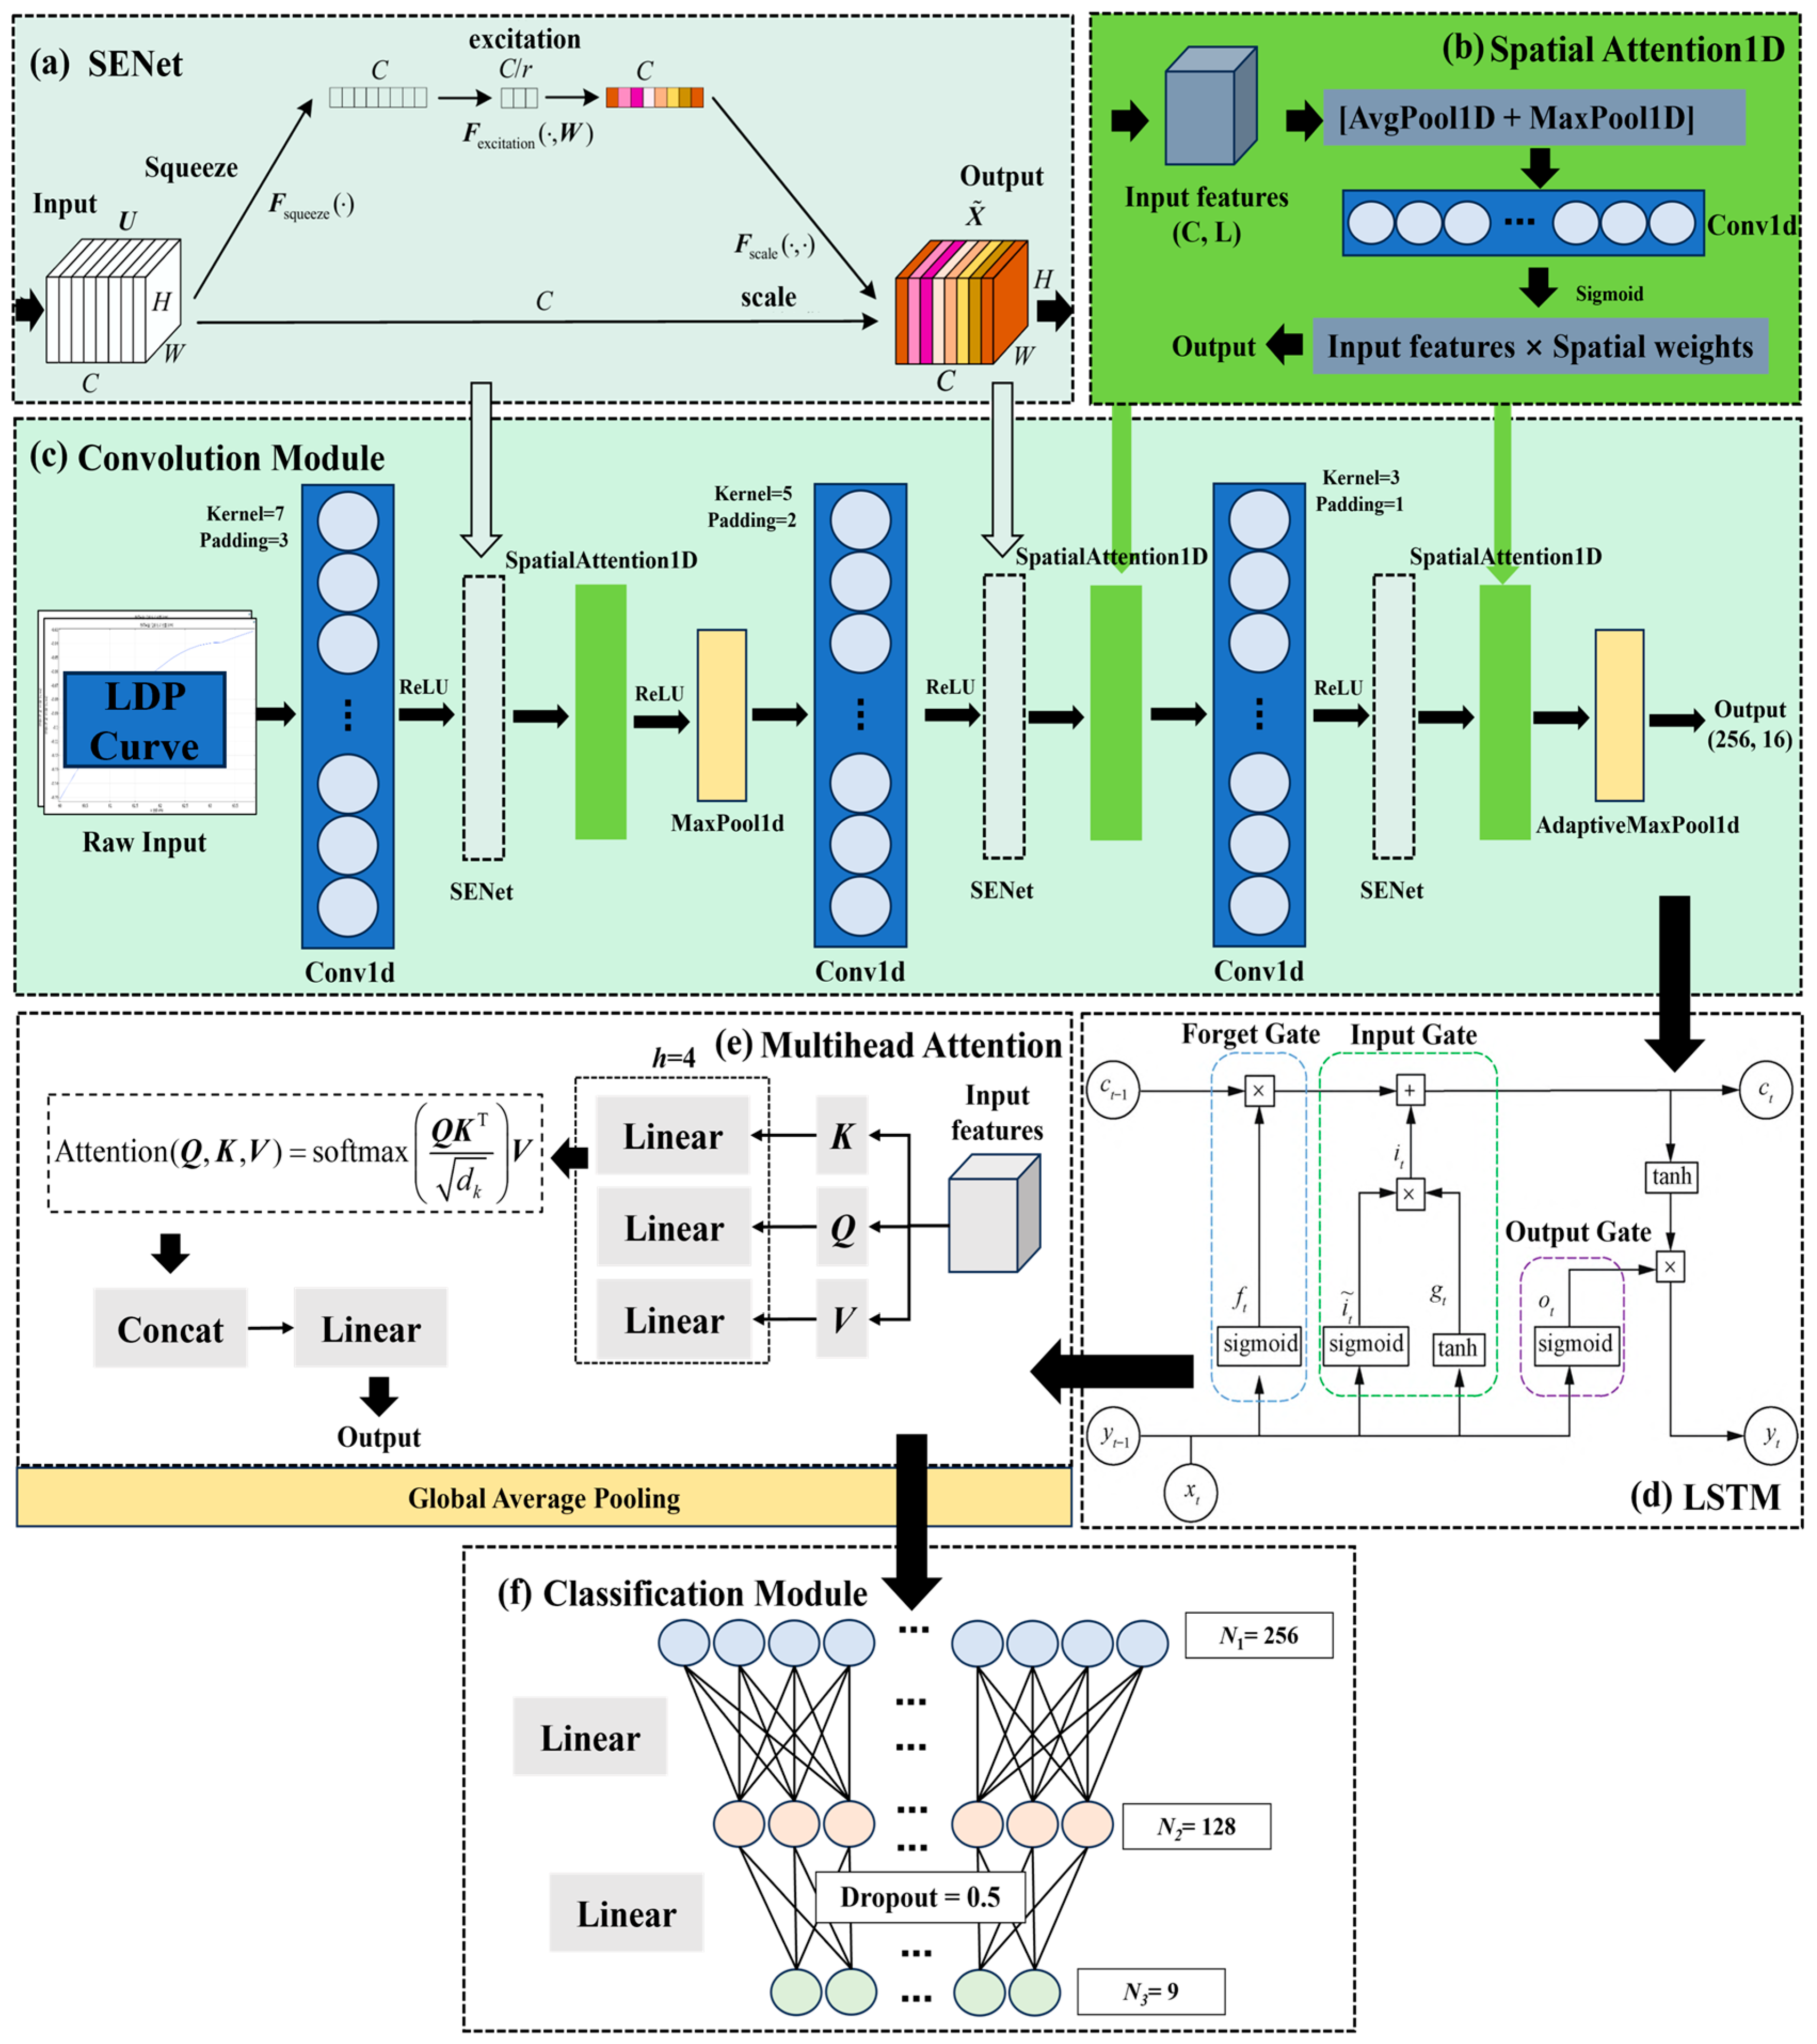
The Squeeze-and-Excitation Network (SENet), proposed by Hu et al. [35], introduces a channel attention mechanism to explicitly model interdependencies between feature channels in convolutional neural networks (CNNs). By embedding SENet modules after CNN convolutional layers, the resulting SE-CNN architecture enhances feature representation by adaptively recalibrating channel-wise feature responses, thereby amplifying critical features while suppressing less relevant ones. This mechanism is particularly effective for extracting instability-related patterns from simulation data in rock mass classification tasks. The SENet module comprises four key components, as shown in Figure 6a.
(1) Transformation
A standard convolutional operation generates uncalibrated feature maps, U R H × W × C , where H, W, and C denote the height, width, and channel dimensions, respectively.
(2) Squeeze Operation
Global Average Pooling (GAP) aggregates spatial information within each channel to produce channel-wise statistics z R C . For the c-th channel, the following is calculated:
z c = F squeeze ( u c ) = 1 H × W i = 1 H j = 1 W u c ( i , j )
This equation eliminates spatial interference while preserving channel-wise relationships, forming a compressed descriptor that captures global contextual information for tunnel face surrounding rock prediction.
(3) Excitation Operation
A gating mechanism with two fully connected (FC) layers learns nonlinear channel dependencies as follows:
s = F excitation ( z , W ) = σ [ g ( z , W ) ] = σ [ W 2 δ ( W 1 z ) ]
where W 1 R ( C / r ) × C and W 2 R C × ( C / r ) are learnable weights; δ() denotes ReLU activation; σ() is the sigmoid function; and r is a reduction ratio controlling model complexity.
(4) Scale Operation
The learned channel-wise weights s were applied to the original feature map U via element-wise multiplication across channels, generating the recalibrated output X ˜ :
x ˜ c = F scale u c , s c = s c u c
X ˜ = [ x ˜ 1 , , x ˜ c , , x ˜ C ]
The SENet module was designed to explicitly model inter-channel relationships within neural networks. Through Global Average Pooling (GAP) and fully connected layers, SENet adaptively learns channel-wise weights to amplify informative feature channels critical to target tasks while suppressing less contributive ones, thereby enhancing model performance [35].

5.1.2. Long Short-Term Memory (LSTM)

LSTM demonstrates superior memory retention in processing time-series data. Figure 6d illustrates the fundamental unit structure of an LSTM neural network [36]. The schematic defines the following: Xt: input feature vector at time step t; yt−1: network output at time step t−1; and ct−1: cell state at time step t−1 [37]. The LSTM unit integrates the following three gating mechanisms:
(1) Forget gate: This governs the retention/discard of historical cell states;
(2) Input gate: This incorporates dual activation functions for feature normalization;
(3) Output gate: This regulates current state propagation.
In this study, LSTM treated specific positions along stratigraphic Longitudinal Deformation Profiles as sequential time steps, effectively capturing spatiotemporal dependencies.

5.1.3. Attention Mechanism

This study implements spatial attention and multi-head attention mechanisms (Figure 6b,e). The spatial attention module performs geometric transformation on deformation data and autonomously identifies critical spatial regions. For input features of dimension H × W × C (H: height; W: width; C: channels), the spatial attention mechanism generates an H × W weight matrix. Each spatial position in the input feature map is scaled by the corresponding weight through element-wise multiplication as follows:
γ ( x ) = Sigmoid ( Conv 1 d ( mean ( x ) ; max ( x ) ) )
The multi-head self-attention mechanism is an improvement over the standard self-attention mechanism. It divides the self-attention mechanism into multiple parallel heads for repeated linear projections, performs attention calculations on the different projected results, processes hierarchical information in the input sequence after attention computation, and calculates global attention. In essence, it integrates multiple independent self-attention modules. By dividing the time series into h subspaces, each head performs self-attention calculations within the subspaces to enhance the expressive power of attention. The results from h heads are concatenated and integrated into extracted features. Each head independently focuses on implicit information at different hierarchical levels of the time-series data to capture fine-grained features, synthesize diverse features, and dynamically update the weight matrix to obtain the final output.

5.2. SE-CNN-LSTM-Attention Hybrid Architecture Development

5.2.1. Architectural Configuration

Conventional 1D-CNNs exhibit limited capacity in capturing global temporal dependencies due to constrained receptive fields, whereas the hybrid architecture integrating SENet, LSTM, and attention mechanisms enables the explicit modeling of long-range feature dependencies. For instance, deformation characteristics at stratigraphic interfaces require holistic assessment through sequential data integration across adjacent segments. The proposed architecture is systematically detailed in Table 6 and schematically represented in Figure 6.

5.2.2. Loss Function and Optimizer

The model employs CrossEntropyLoss, which is suitable for multi-class classification tasks. The optimizer uses Adam, with the number of epochs set to 300, the learning rate (lr) set to 0.0001, and the batch size for each training iteration set to 64.

5.3. Model Parameter Determination

Model parameters were determined based on the tabulated methodology summarized by Wang et al. [38] and the Appendix of the Chinese National Standard GB/T 50218-2014 “Standard for Engineering Rock Mass Classification” [39]. The Basic Quality Index (BQ) of the rock mass was calculated using the quantitative parameters Rc (saturated uniaxial compressive strength in MPa) and Kv (rock mass integrity index), following the formula below:
BQ = 100 + 3 R c + 250 K v
The saturated uniaxial compressive strength (Rc) is typically lower than the natural-state ultimate strength. As groundwater effects were excluded, the intact rock uniaxial compressive strength (σci) was conservatively equated to Rc. Parameter values (Table 7) were assigned via simple random sampling.
Ten parameterized models were established for each label category (Table 8), yielding 90 models and corresponding 1D deformation profiles.
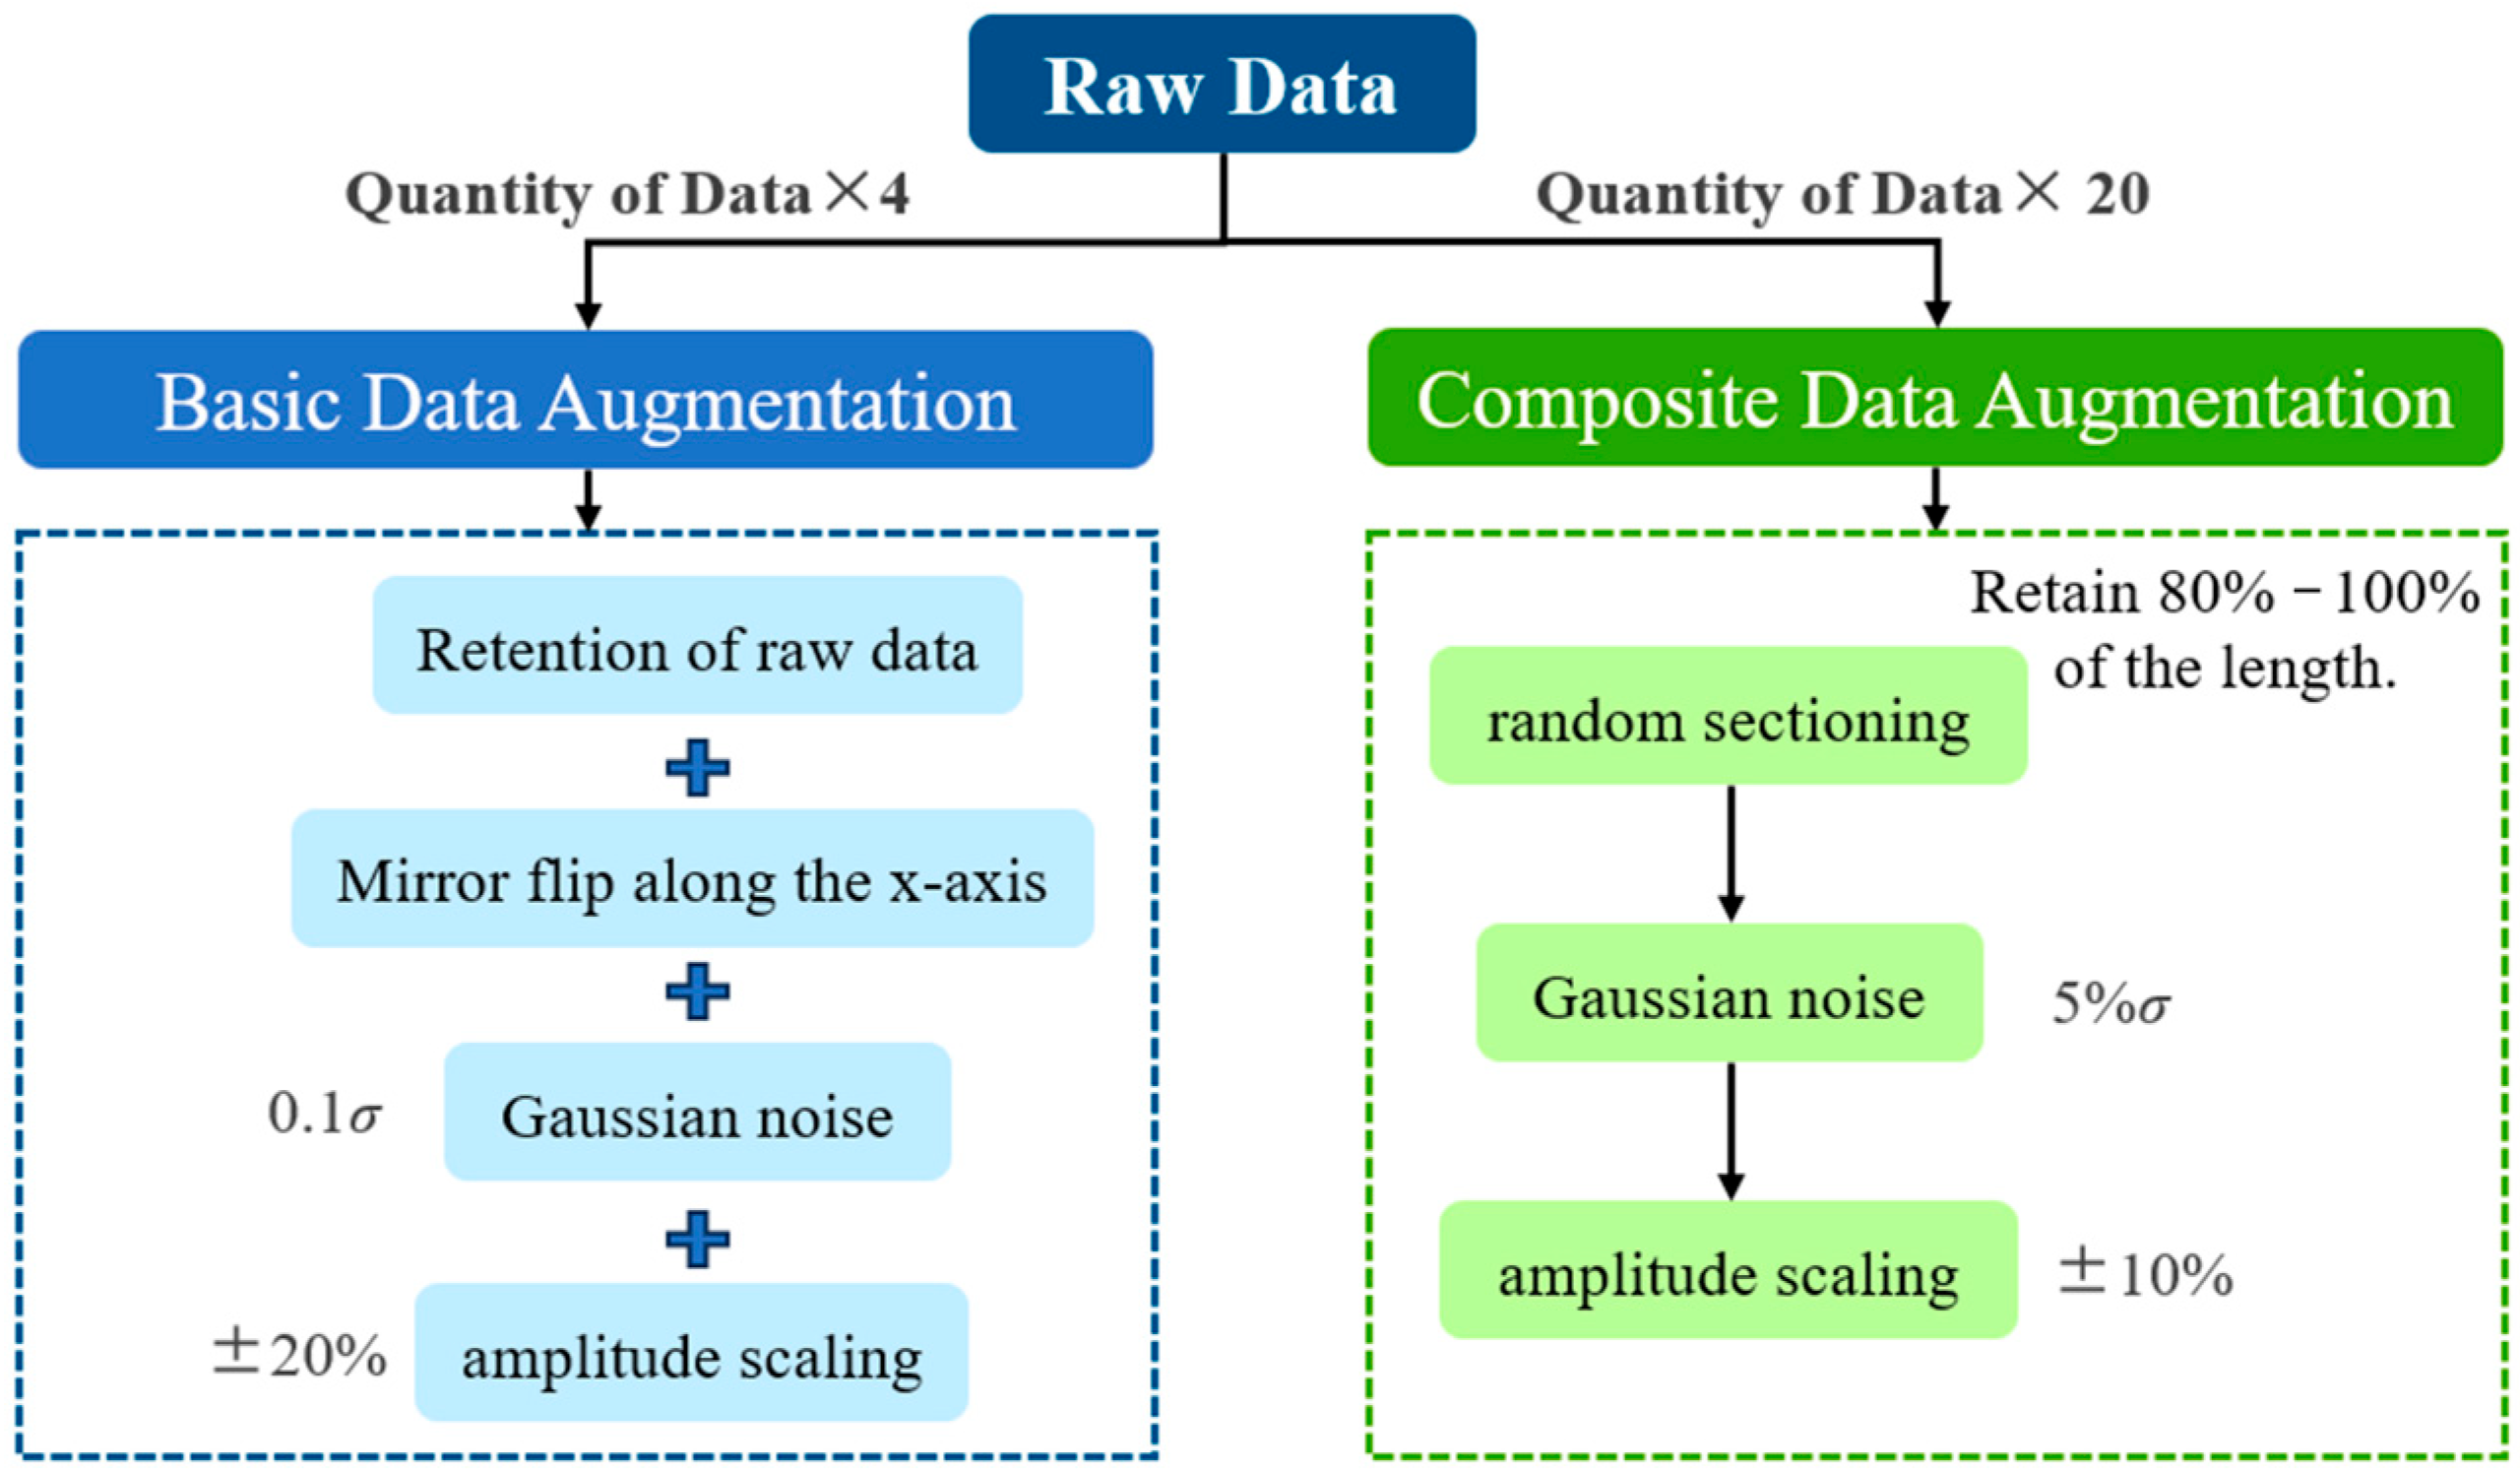
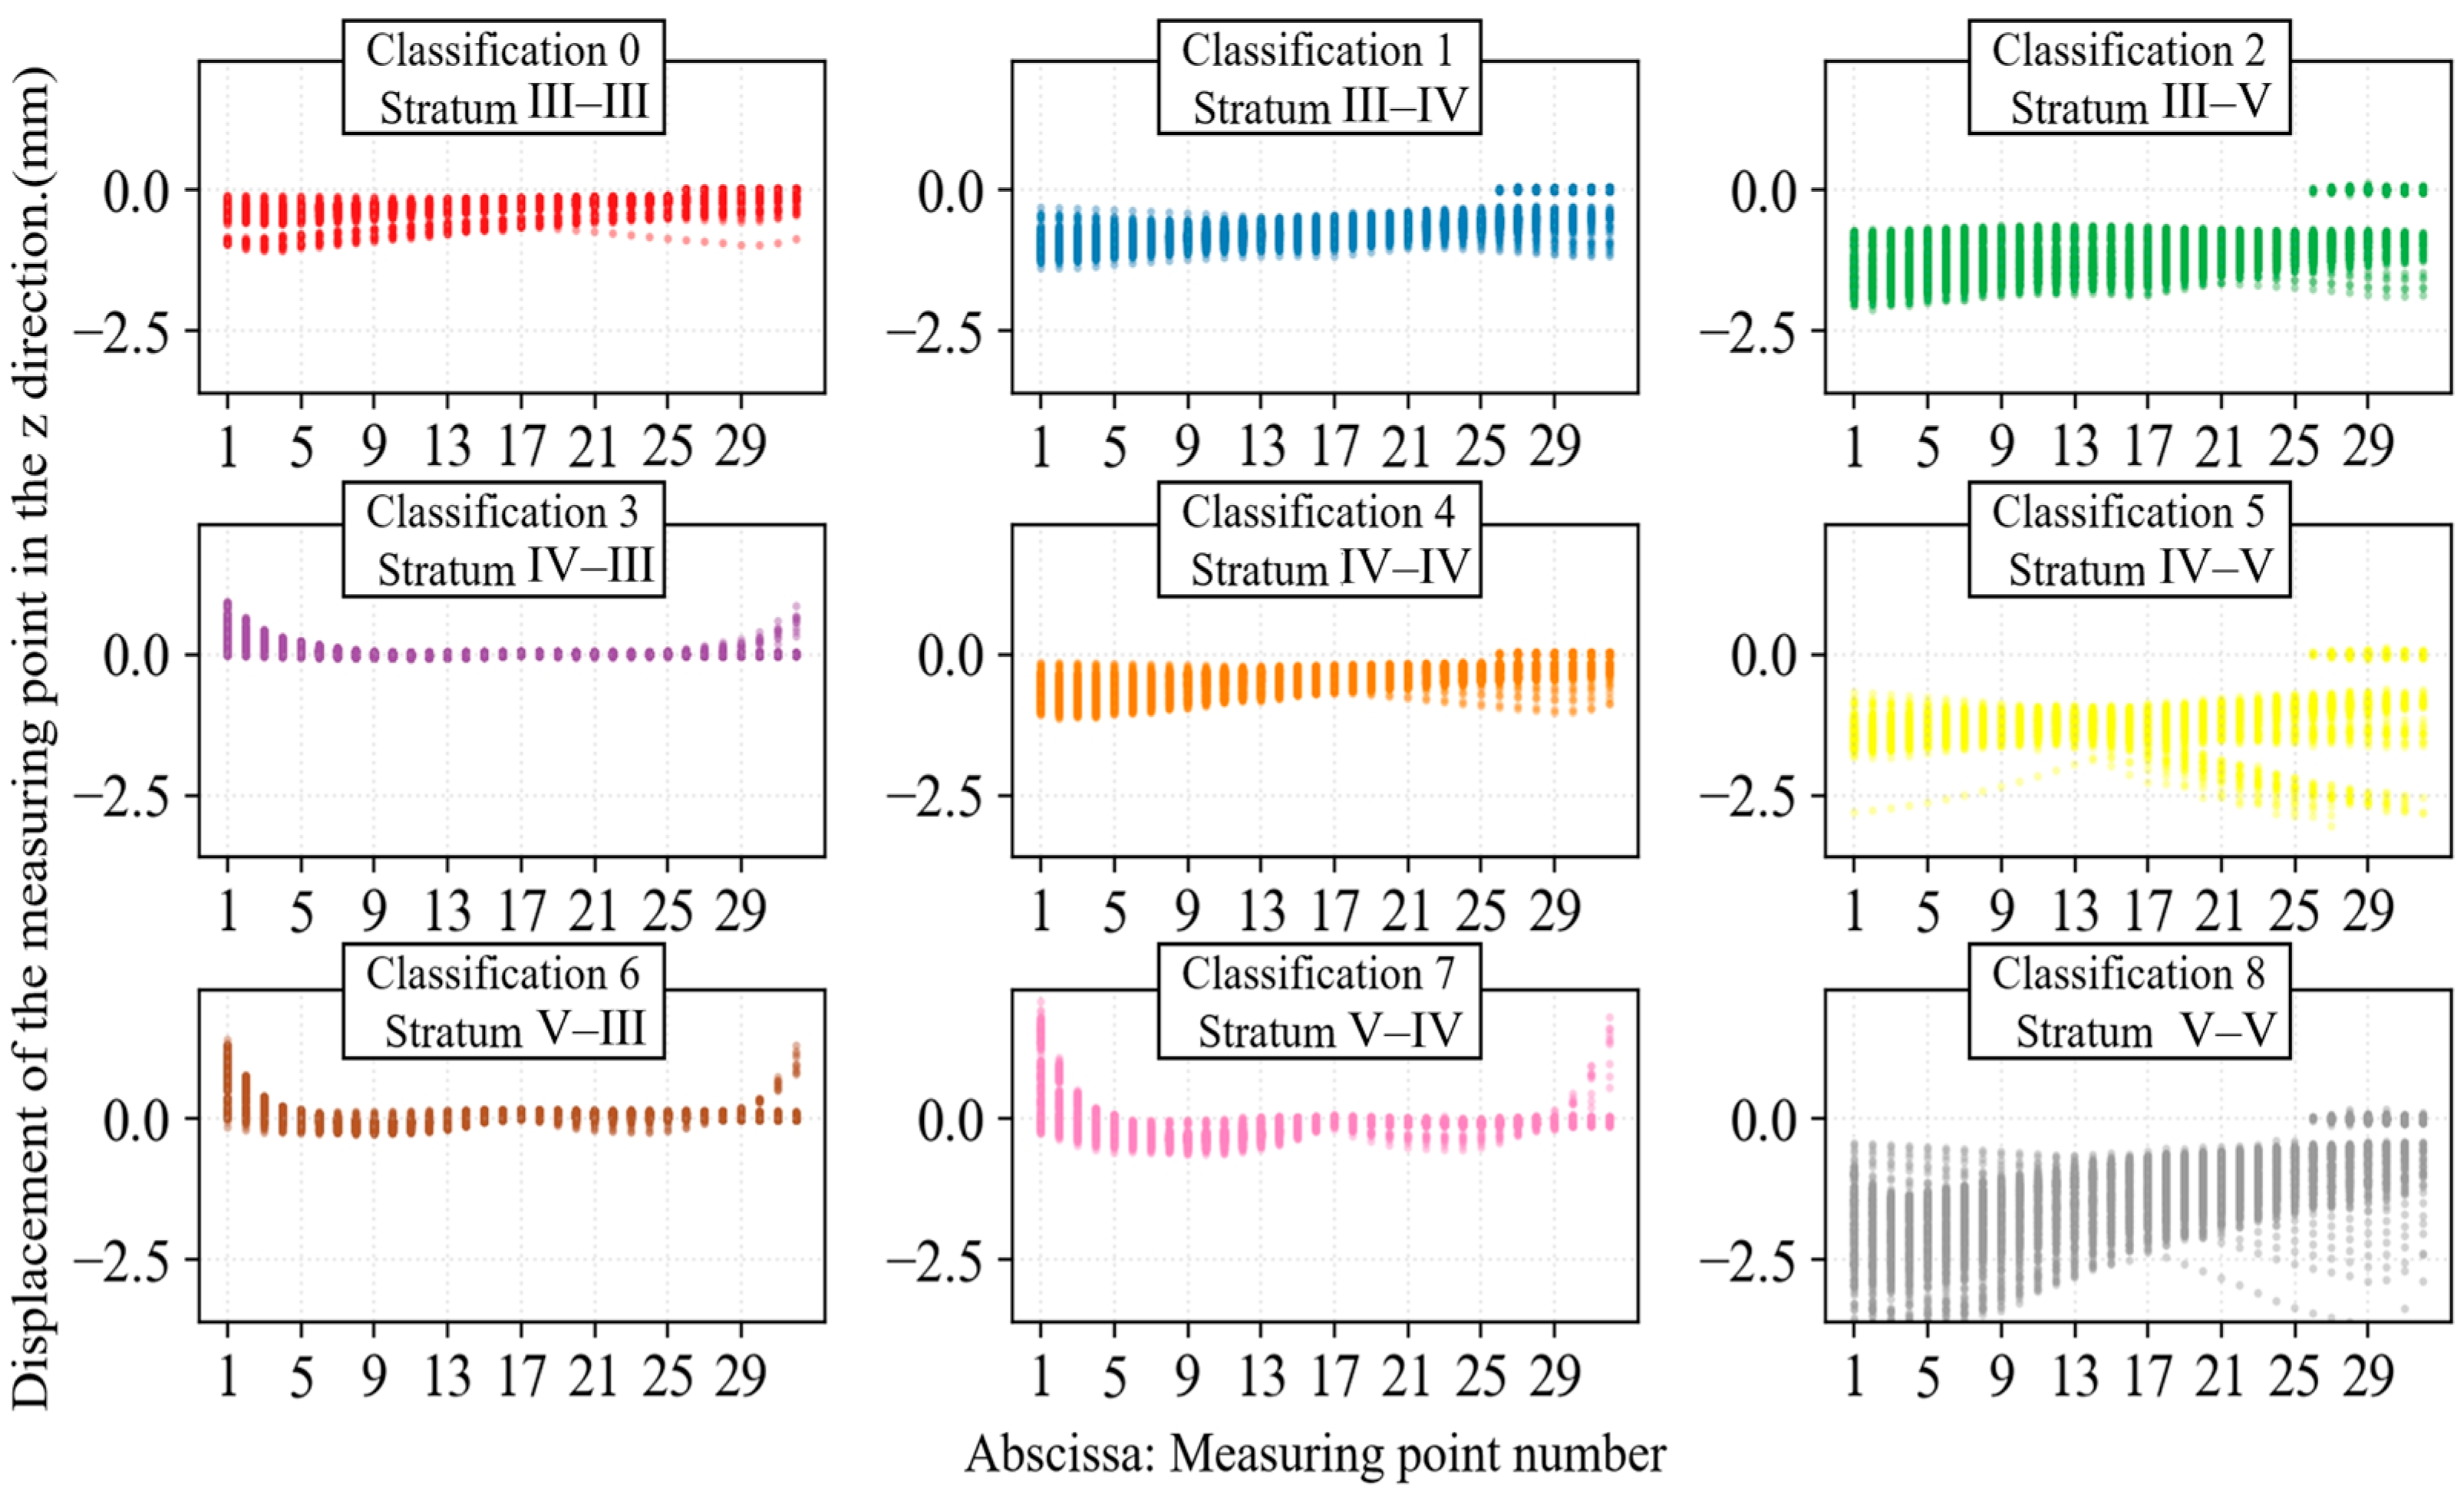
Through basic augmentation, the amount of data becomes four times that of the original data. Then, the original data undergoes 20 rounds of composite augmentation. Eventually, the amount of data obtained is 24 times that of the original data. The specific data augmentation process is shown in Figure 7. This expanded the dataset to 2160 samples (240 per category), divided into training and test sets at a 7:3 ratio. The data distribution is visualized in the scatter plot in Figure 8.

5.4. Results and Analysis

(1) Analysis of Model Loss Function
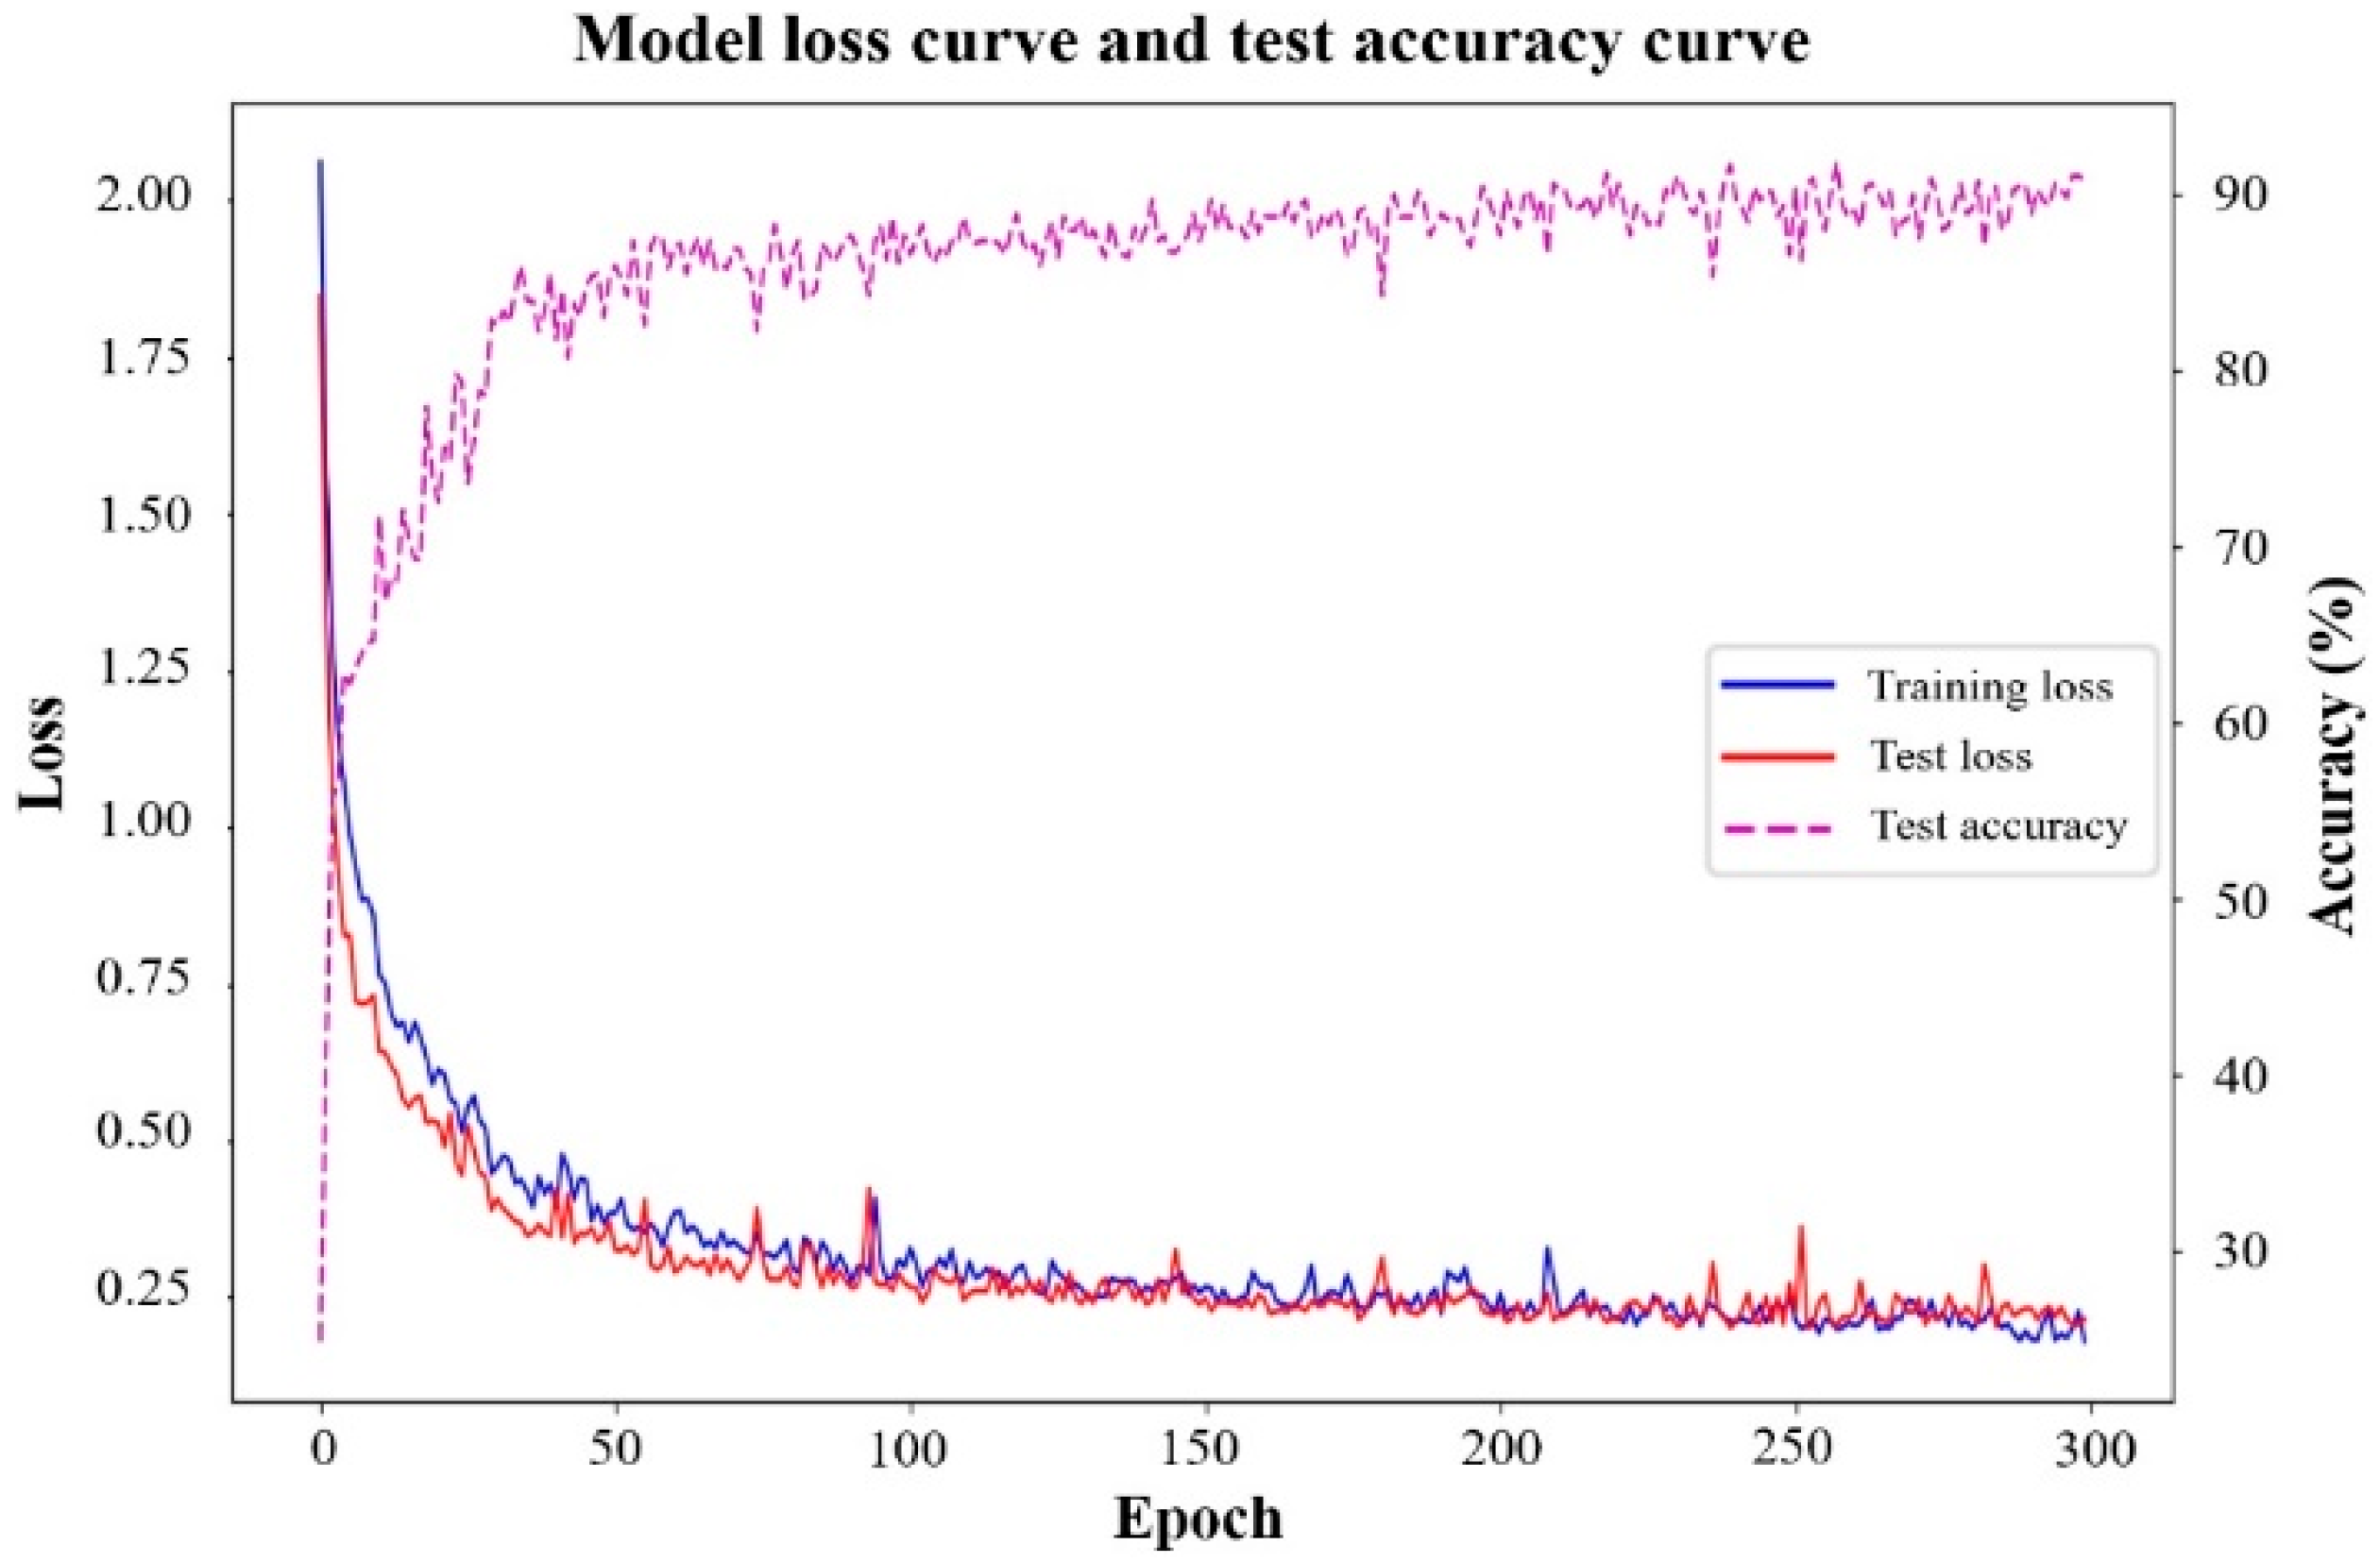
The training and validation loss curves, along with accuracy metrics, are shown in Figure 9. The results indicate that both training and validation losses converge to low and comparable values, with no evident signs of overfitting or underfitting observed. This demonstrates the robust overall training performance of the model.
(2) Analysis of Model Evaluation Metrics
The key metrics for the machine learning model evaluation typically included precision, recall, F1-Score, and support. To comprehensively assess the hybrid SE-CNN-LSTM-Attention architecture proposed in this study, the model’s performance metrics on the training and test sets are statistically summarized in Table 9 and Table 10.
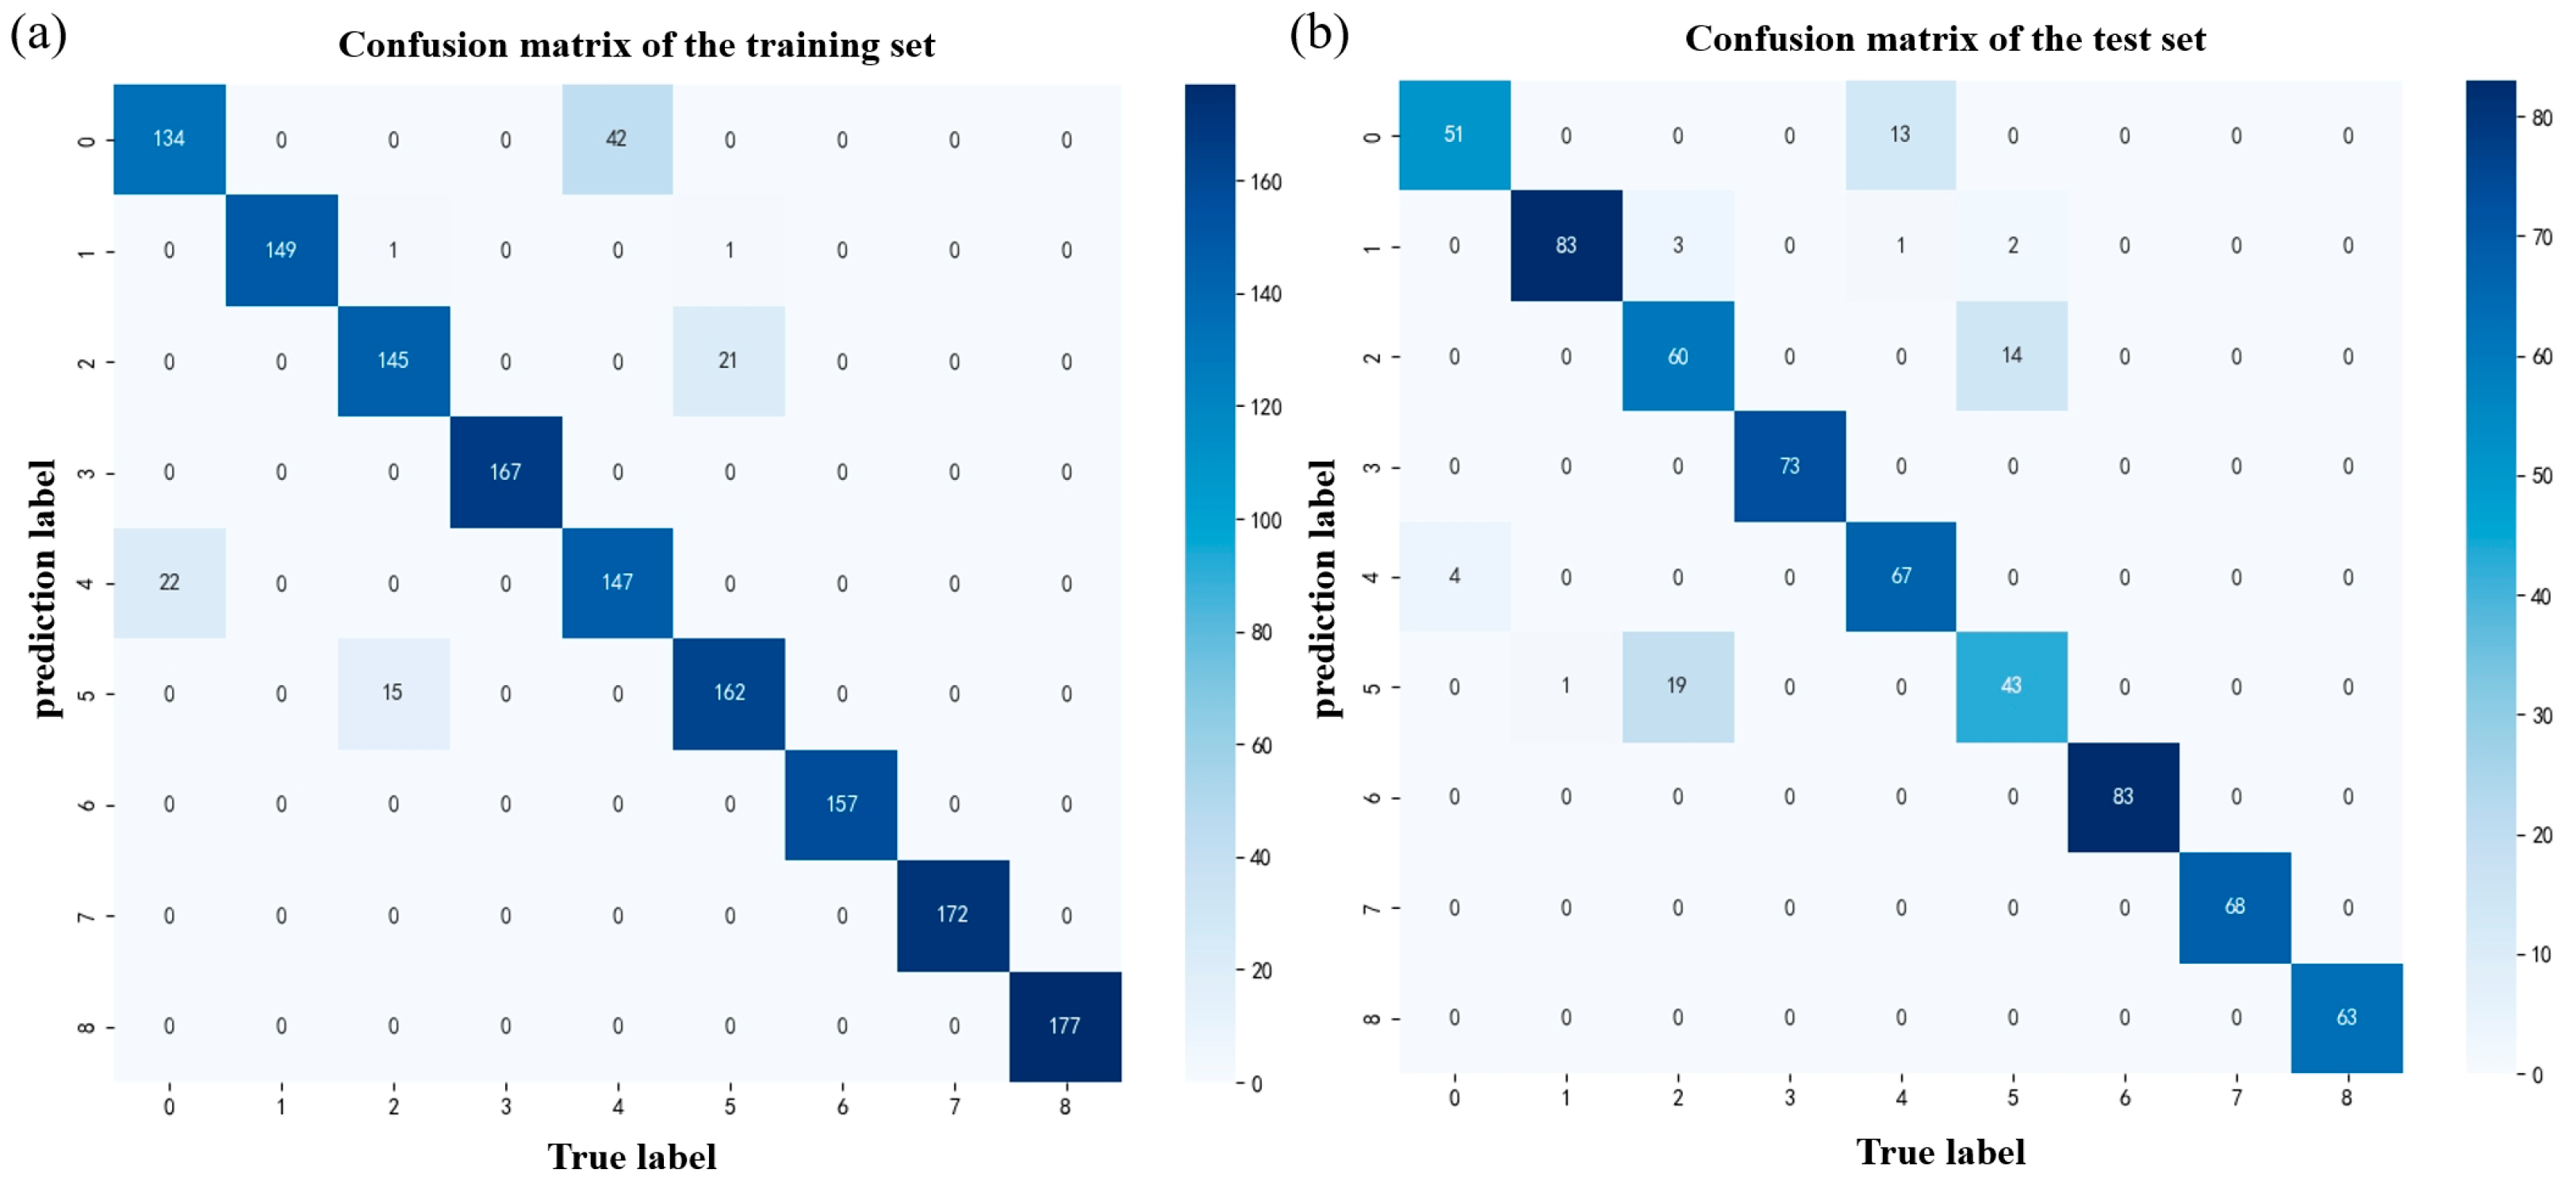
As shown in the table, except for the relatively low data in Class 5 of the test set, the remaining data are generally between 0.8 and 1. This indicates that the model has good performance and high accuracy. Finally, the accuracy of the model on the training set is 93.25%, and the accuracy on the test set is 91.20%. From the confusion matrix in Figure 10, it can be observed that when the true label is from Class 5, the predicted label sometimes appears as Class 2. The reason for this is that after data augmentation, since mirror flipping operations occur along the x-axis in basic augmentation alongside operations that randomly increase and decrease the amplitude in both basic and composite augmentations, the augmented data of Class 2 and Class 5 show highly similar features. Therefore, further research is needed to improve the performance of the model when predicting Class 5 data.
(3) Confusion Matrix
The classification confusion matrix of the model is illustrated in Figure 10. The results demonstrate high predictive accuracy in determining the grade of the surrounding rock ahead of the tunnel face based on the LDP (Load Deformation Profile) curve characteristics, with consistent performance across most rock mass classifications.

6. Discussion

To validate the performance of the proposed hybrid architecture, ablation experiments were conducted on the SE-CNN-LSTM-Attention model. The proposed SE-CNN-LSTM-Attention hybrid architecture was compared with the following variants: SE-CNN-LSTM, CNN-LSTM-Attention, CNN-Attention, and baseline CNN. The architectural configurations of all evaluated models are systematically compared in Table 11. This comparative analysis isolates the contributions of SENet channel recalibration, LSTM temporal modeling, and attention-based feature prioritization from the overall predictive performance. Please note that in the table, “SA” refers to spatial attention, “CNN3” represents three convolutional blocks, and “Attn” refers to the multi-head attention module.
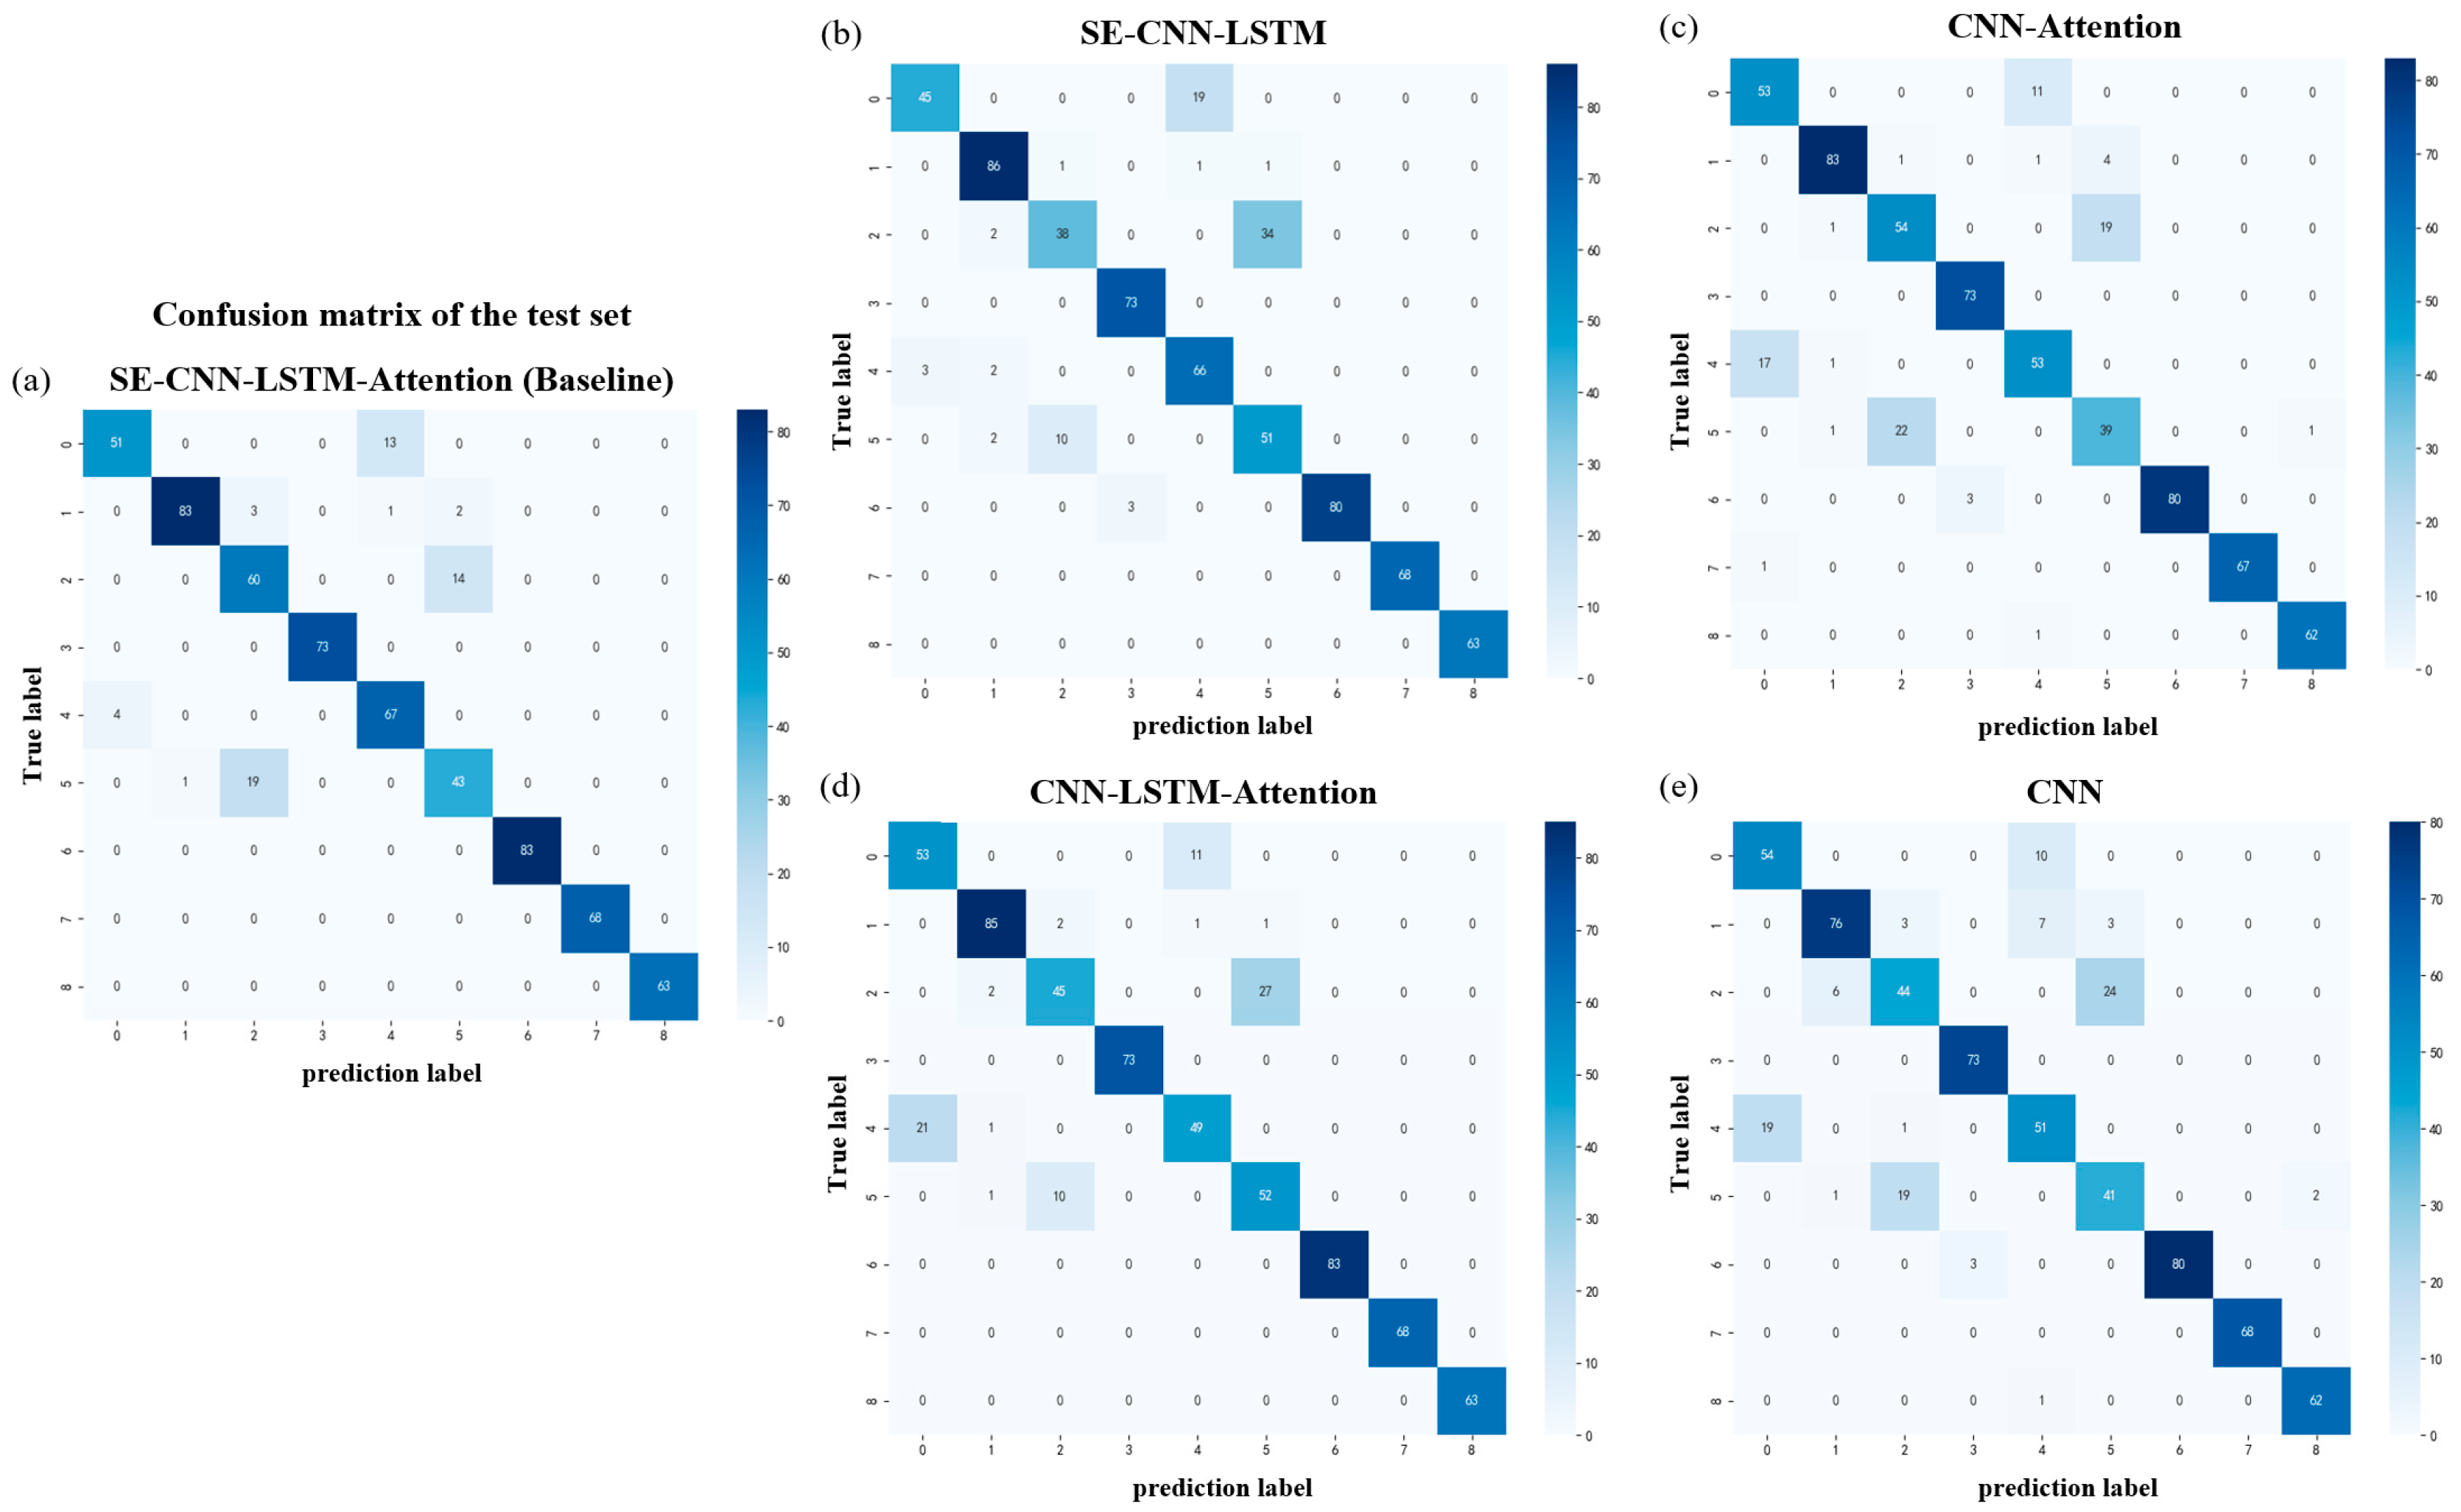
The hyperparameters and training data used in the table models were identical to those of the SE-CNN-LSTM-Attention hybrid neural network. The evaluation metrics of each model on the test set are presented in Table 12, and the classification confusion matrices are shown in Figure 11.
As demonstrated in Table 12, the SE-CNN-LSTM-Attention hybrid architecture achieves accuracy improvements of 3.24%, 3.08%, 4.16%, and 6.48% on the test set compared to the SE-CNN-LSTM, CNN-LSTM-Attention, CNN-Attention, and baseline CNN models, respectively. The results indicate that the SE-CNN-LSTM-Attention architecture delivers the best performance on the test set. In conclusion, the proposed SE-CNN-LSTM-Attention hybrid neural network demonstrates robust capabilities for stratigraphic prediction.

7. Conclusions

(1) The Longitudinal Deformation Profile (LDP) characteristics were systematically analyzed for nine stratigraphic combinations across three distinct rock mass types. Homogeneous strata exhibited deformation patterns, characterized by an initial increase followed by gradual attenuation. Rock masses with a Geological Strength Index (GSI) of 15 demonstrated significantly higher deformation magnitudes. For cases involving stratigraphic interfaces, pre-interface deformation followed an increase–decrease trend, while post-interface deformation magnitudes were governed by the lithological parameters of the subsequent stratum.
(2) A hybrid SE-CNN-LSTM-Attention neural network was proposed for predicting the surrounding rock properties ahead of tunnel faces. Utilizing LDP curves as input features, the model achieved classification accuracy rates of 93.25% on the training set and 91.20% on the test set, demonstrating robust predictive capability for stratigraphic characterization.
(3) Comparative ablation studies against four benchmark architectures (SE-CNN-LSTM, CNN-LSTM-Attention, CNN-Attention, and baseline CNN) revealed significant performance enhancements. The proposed model improved the test set accuracy by 3.24%, 3.08%, 4.16%, and 6.48%, respectively, validating the efficacy of the synergistic integration of SENet channel attention, LSTM temporal modeling, and spatial-contextual attention mechanisms.
Notably, the current training data were exclusively derived from numerical simulations, with tunnel burial depth fixed as a constant. Future work will incorporate burial depth as an input variable and validate the model against field-monitored data from practical engineering projects.

Author Contributions

Conceptualization, Y.W. and H.F.; methodology, S.S., Y.W., H.F., Y.P., Y.L. and Z.L.; software, S.S. and Z.Z.; validation, R.S., Y.W., Y.P., Y.L. and Z.L.; formal analysis, R.S. and Y.W.; investigation, R.S., Y.W. and Z.Z.; resources, Y.W. and H.F.; data curation, R.S., H.F. and Y.W.; writing—original draft preparation, R.S. and S.S.; writing—review and editing, R.S. and S.S.; visualization, R.S.; supervision, Z.Z.; project administration, Y.P., Y.L. and Z.L.; funding acquisition, Y.W. and H.F. All authors have read and agreed to the published version of the manuscript.

Funding

This research was sponsored by the Hunan Provincial Communications Science Research Institute Co., Ltd., through the Science and Technology Project of Hunan Provincial Department of Transportation (202220). We also received support from the Science and Technology Project of Hubei Provincial Department of Transportation (2020-186-2-6) and the National Key Research and Development Program of China (2022YFB2603301).

Institutional Review Board Statement

Not applicable.

Informed Consent Statement

Not applicable.

Data Availability Statement

The data are available from the corresponding author upon reasonable request.

Acknowledgments

The authors give thanks to the editors and anonymous reviewers for their constructive comments.

Conflicts of Interest

The authors declare that this study received funding from Hunan Communications Research Co., Ltd. The funder was involved in the study design and the decision to submit the manuscript for publication. However, it was not directly involved in the data collection, data analysis, data interpretation, or the writing of this article.

References

  1. Gaurav, T.; Bhardwaj, P.; Madhavi, L.G.; Babu, G.L.S. Analysis of Tunnel Support Requirements Using Deterministic and Probabilistic Approaches in Average Quality Rock Mass. Int. J. Geomech. 2018, 18, 04018017. [Google Scholar] [CrossRef]
  2. Sun, Z.Y.; Zhang, D.L.; Hou, Y.J.; Li, A. Whole-process Deformation Laws and Determination of Stability Criterion of Surrounding Rock of Tunnels Based on Statistics of Field Measured Data. Chin. J. Geotech. Eng. 2021, 43, 1261–1270. (In Chinese) [Google Scholar] [CrossRef]
  3. Li, H.; Tan, Y.; Zeng, D.; Su, D.; Qiao, S. Attitude-Predictive Control of Large-Diameter Shield Tunneling: PCA-SVR Machine Learning Algorithm Application in a Case Study of the Zhuhai Xingye Express Tunnel. Appl. Sci. 2025, 15, 1880. [Google Scholar] [CrossRef]
  4. Liu, H.; Ma, T.; Lin, Y.; Peng, K.; Hu, X.; Xie, S.; Luo, K. Deep Learning in Rockburst Intensity Level Prediction: Performance Evaluation and Comparison of the NGO-CNN-BiGRU-Attention Model. Appl. Sci. 2024, 14, 5719. [Google Scholar] [CrossRef]
  5. Yang, T.; Wen, T.; Huang, X.; Liu, B.; Shi, H.; Liu, S.; Peng, X.; Sheng, G. Predicting Model of Dual-Mode Shield Tunneling Parameters in Complex Ground Using Recurrent Neural Networks and Multiple Optimization Algorithms. Appl. Sci. 2024, 14, 581. [Google Scholar] [CrossRef]
  6. Dung, C.V.; Anh, L.D. Autonomous Concrete Crack Detection Using Deep Fully Convolutional Neural Network. Autom. Constr. 2019, 99, 52–58. [Google Scholar] [CrossRef]
  7. Song, R.J. Numerical Simulation Study on Optimization of Freezing Pipe Position under Seepage Conditions Based on Simulated Annealing Algorithm. KSCE J. Civ. Eng. 2024, 28, 5441–5451. [Google Scholar] [CrossRef]
  8. Chen, F.; Tong, T.; Hua, J.; Cui, C. Crack Identification for Bridge Condition Monitoring Combining Graph Attention Networks and Convolutional Neural Networks. Appl. Sci. 2025, 15, 5452. [Google Scholar] [CrossRef]
  9. Liu, X.; Yin, C. 3D Reconstruction of Asphalt Pavement Macro-Texture Based on Convolutional Neural Network and Monocular Image Depth Estimation. Appl. Sci. 2025, 15, 4684. [Google Scholar] [CrossRef]
  10. Zhang, C.; Li, N.; Dong, X.; Liu, B.; Liu, M. Machine Learning-Based 3D Soil Layer Reconstruction in Foundation Pit Engineering. Appl. Sci. 2025, 15, 4078. [Google Scholar] [CrossRef]
  11. Zhang, W.Y.; Wang, H.; Wang, Z.B. Ore Image Classification Based on Improved CNN. Comput. Electr. Eng. 2022, 99, 107800. [Google Scholar] [CrossRef]
  12. Gong, L.; Qi, Y.D.; Wang, J.; He, S.L. Application of PCA-PNN Model in Safety Prediction and Evaluation of Surrounding Rock of Railway Tunnel. J. Railw. Sci. Eng. 2020, 17, 940–946. (In Chinese) [Google Scholar] [CrossRef]
  13. Lei, M.F.; Zhang, Y.B.; Wang, W.D.; Lei, N.J.; Zeng, C.; Xiao, Y.Z.; Huang, J.; Gong, C.J. Investigation and Application on Lithology Intelligent Recognition Method Based on Mask R-CNN. J. Railw. Sci. Eng. 2022, 19, 3372–3382. (In Chinese) [Google Scholar] [CrossRef]
  14. Li, S.C.; Liu, H.L.; Li, L.P.; Shi, S.S.; Zhang, Q.Q.; Sun, S.Q.; Hu, J. A Quantitative Method for Rock Structure at Working Faces of Tunnels Based on Digital Images and Its Application. Chin. J. Rock Mech. Eng. 2017, 36, 1–9. (In Chinese) [Google Scholar] [CrossRef]
  15. Reid, T.R.; Harrison, J.P. A Semi-Automated Methodology for Discontinuity Tracing. Rock Mech. Rock Eng. 2000, 33, 271–294. [Google Scholar] [CrossRef]
  16. Lemy, F.; Hadjigeorgiou, J. Discontinuity Trace Map Construction Using Photographs of Rock Exposures. Int. J. Rock Mech. Min. Sci. 2003, 40, 903–917. [Google Scholar] [CrossRef]
  17. Jiao, Y.Y.; Ou, G.Z.; Wang, H. Prediction of tunnel squeezing based on evidence theory. J. Basic Sci. Eng. 2021, 29, 1156–1170. (In Chinese) [Google Scholar] [CrossRef]
  18. Sun, Y.; Feng, X.; Yang, L. Predicting Tunnel Squeezing Using Multiclass Support Vector Machines. Adv. Civ. Eng. 2018, 2018, 4543984. [Google Scholar] [CrossRef]
  19. Chen, Y.; Li, T.; Zeng, P. Dynamic and Probabilistic Multi-class Prediction of Tunnel Squeezing Intensity. Rock Mech. Rock Eng. 2020, 53, 3521–3542. [Google Scholar] [CrossRef]
  20. Dwivedi, R.D.; Singh, M.; Viladkar, M.N. Prediction of Tunnel Deformation in Squeezing Grounds. Eng. Geol. 2013, 161, 55–64. [Google Scholar] [CrossRef]
  21. Aydan, T.; Akagi, T.; Kawamoto, T. The squeezing potential of rocks around tunnels:theory and prediction. Rock Mech. Rock Eng. 1993, 26, 137–163. [Google Scholar] [CrossRef]
  22. Singh, M.; Singh, B.; Choudhari, J. Critical Strain and Squeezing of Rock Mass in Tunnels. Tunn. Undergr. Space Technol. 2007, 22, 343–350. [Google Scholar] [CrossRef]
  23. Yu, J.; Ma, Q.F.; Tu, B.X.; Liu, S.Y.; Zhou, J.F.; Cai, Y.Y. A New Approach of Coupling Between LDP and GRC For Quantitative Evaluation of Time-dependent Self-carrying Capacity of Surrounding Rock. J. Beijing Jiaotong Univ. 2018, 42, 9–18. [Google Scholar] [CrossRef]
  24. Song, F.; Rodriguez-Dono, A.; Olivella, S.; Zhong, Z. Analysis and Modelling of Longitudinal Deformation Profiles of Tunnels Excavated in Strain-softening Time-dependent Rock Masses. Comput. Geotech. 2020, 125, 104589. [Google Scholar] [CrossRef]
  25. Wang, Z.L.; Wang, M.N.; Li, D.G. Analysis and Modeling of Longitudinal Deformation Profiles Considering the Reinforcement Effect of Tunnel Face in Weak Rocks. KSCE J. Civ. Eng. 2022, 26, 5372–5383. [Google Scholar] [CrossRef]
  26. Hoek, E.; Brown, E.T. The Hoek-Brown Failure Criterion and GSI 2018 Edition. J. Rock Mech. Geotech. Eng. 2019, 11, 445–463. [Google Scholar] [CrossRef]
  27. Hoek, E.; Carranza-Torres, C.; Corkum, B. Hoek-Brown Failure Criterion-2002 Edition. In Proceedings of the North American Rock Mechanics Society NARMS-TAC 2002, Toronto, ON, Canada, 7–10 July 2002; University of Toronto Press: Toronto, ON, Canada, 2002; pp. 267–273. [Google Scholar]
  28. Wu, S.C. Rock Mechanics; Higher Education Press: Beijing, China, 2021; p. 151. (In Chinese) [Google Scholar]
  29. Hoek, E.; Diederichs, M.S. Empirical Estimation of Rock Mass Modulus. Int. J. Rock Mech. Min. Sci. 2006, 43, 203–215. [Google Scholar] [CrossRef]
  30. Vásárhelyi, B. A Possible Method for Estimating The Poisson’s Rate Values of The Rock Masses. Acta Geod. Geophys. Hung. 2009, 44, 313–322. [Google Scholar] [CrossRef]
  31. Panet, M. Le Calcul des Tunnels Par La Méthode De Convergence-Confinement; Press de l’école Nationale des Ponts Chaussées: Paris, France, 1995; p. 178. [Google Scholar]
  32. Unlu, T.; Gercek, H. Effect of Poisson’s Ratio on The Normalized Radial Displacements Occurring Around the Face of A Circular Tunnel. Tunn. Undergr. Space Technol. 2003, 18, 547–553. [Google Scholar] [CrossRef]
  33. Vlachopoulos, N.; Diederichs, M.S. Improved Longitudinal Displacement Profiles for Convergence Confinement Analysis of Deep Tunnels. Rock Mech. Rock Eng. 2009, 42, 131–146. [Google Scholar] [CrossRef]
  34. Tang, X.J. Theoretical Research and Application of Tunnel Convergence-Confinement Method. Ph.D. Thesis, Huazhong University of Science and Technology, Wuhan, China, 2009. (In Chinese). [Google Scholar]
  35. Hu, J.; Shen, L.; Sun, G. Squeeze-and-excitation Networks. In Proceedings of the 2018 IEEE/CVF Conference on Computer Vision and Pattern Recognition, Salt Lake City, UT, USA, 18–23 June 2018; IEEE: New York, NY, USA, 2018; pp. 7132–7141. [Google Scholar] [CrossRef]
  36. Greff, K.; Srivastava, R.K.; Koutník, J.; Steunebrink, B.R.; Schmidhuber, J. LSTM: A Search Space Odyssey. IEEE Trans. Neural Netw. Learn. Syst. 2017, 28, 2222–2232. [Google Scholar] [CrossRef]
  37. Dong, X.Q.; Jing, L.T.; Tian, R.; Dong, X.Y. Prediction Method of Transformer Top Oil Temperature Based on LSTM Model. J. Electr. Power 2023, 38, 38–45. (In Chinese) [Google Scholar] [CrossRef]
  38. Wang, X.G.; Hu, B.; Wang, J.D.; Jia, P.F.; Jiao, W. Quantitative Research on Hoek-Brown Strength Criterion Based on GSI. Chin. J. Rock Mech. Eng. 2015, 34, 3805–3812. (In Chinese) [Google Scholar] [CrossRef]
  39. GB/T 50218-2014; Standard for Engineering Rock Mass Classification: 2014. China Planning Press: Beijing, China, 2014.
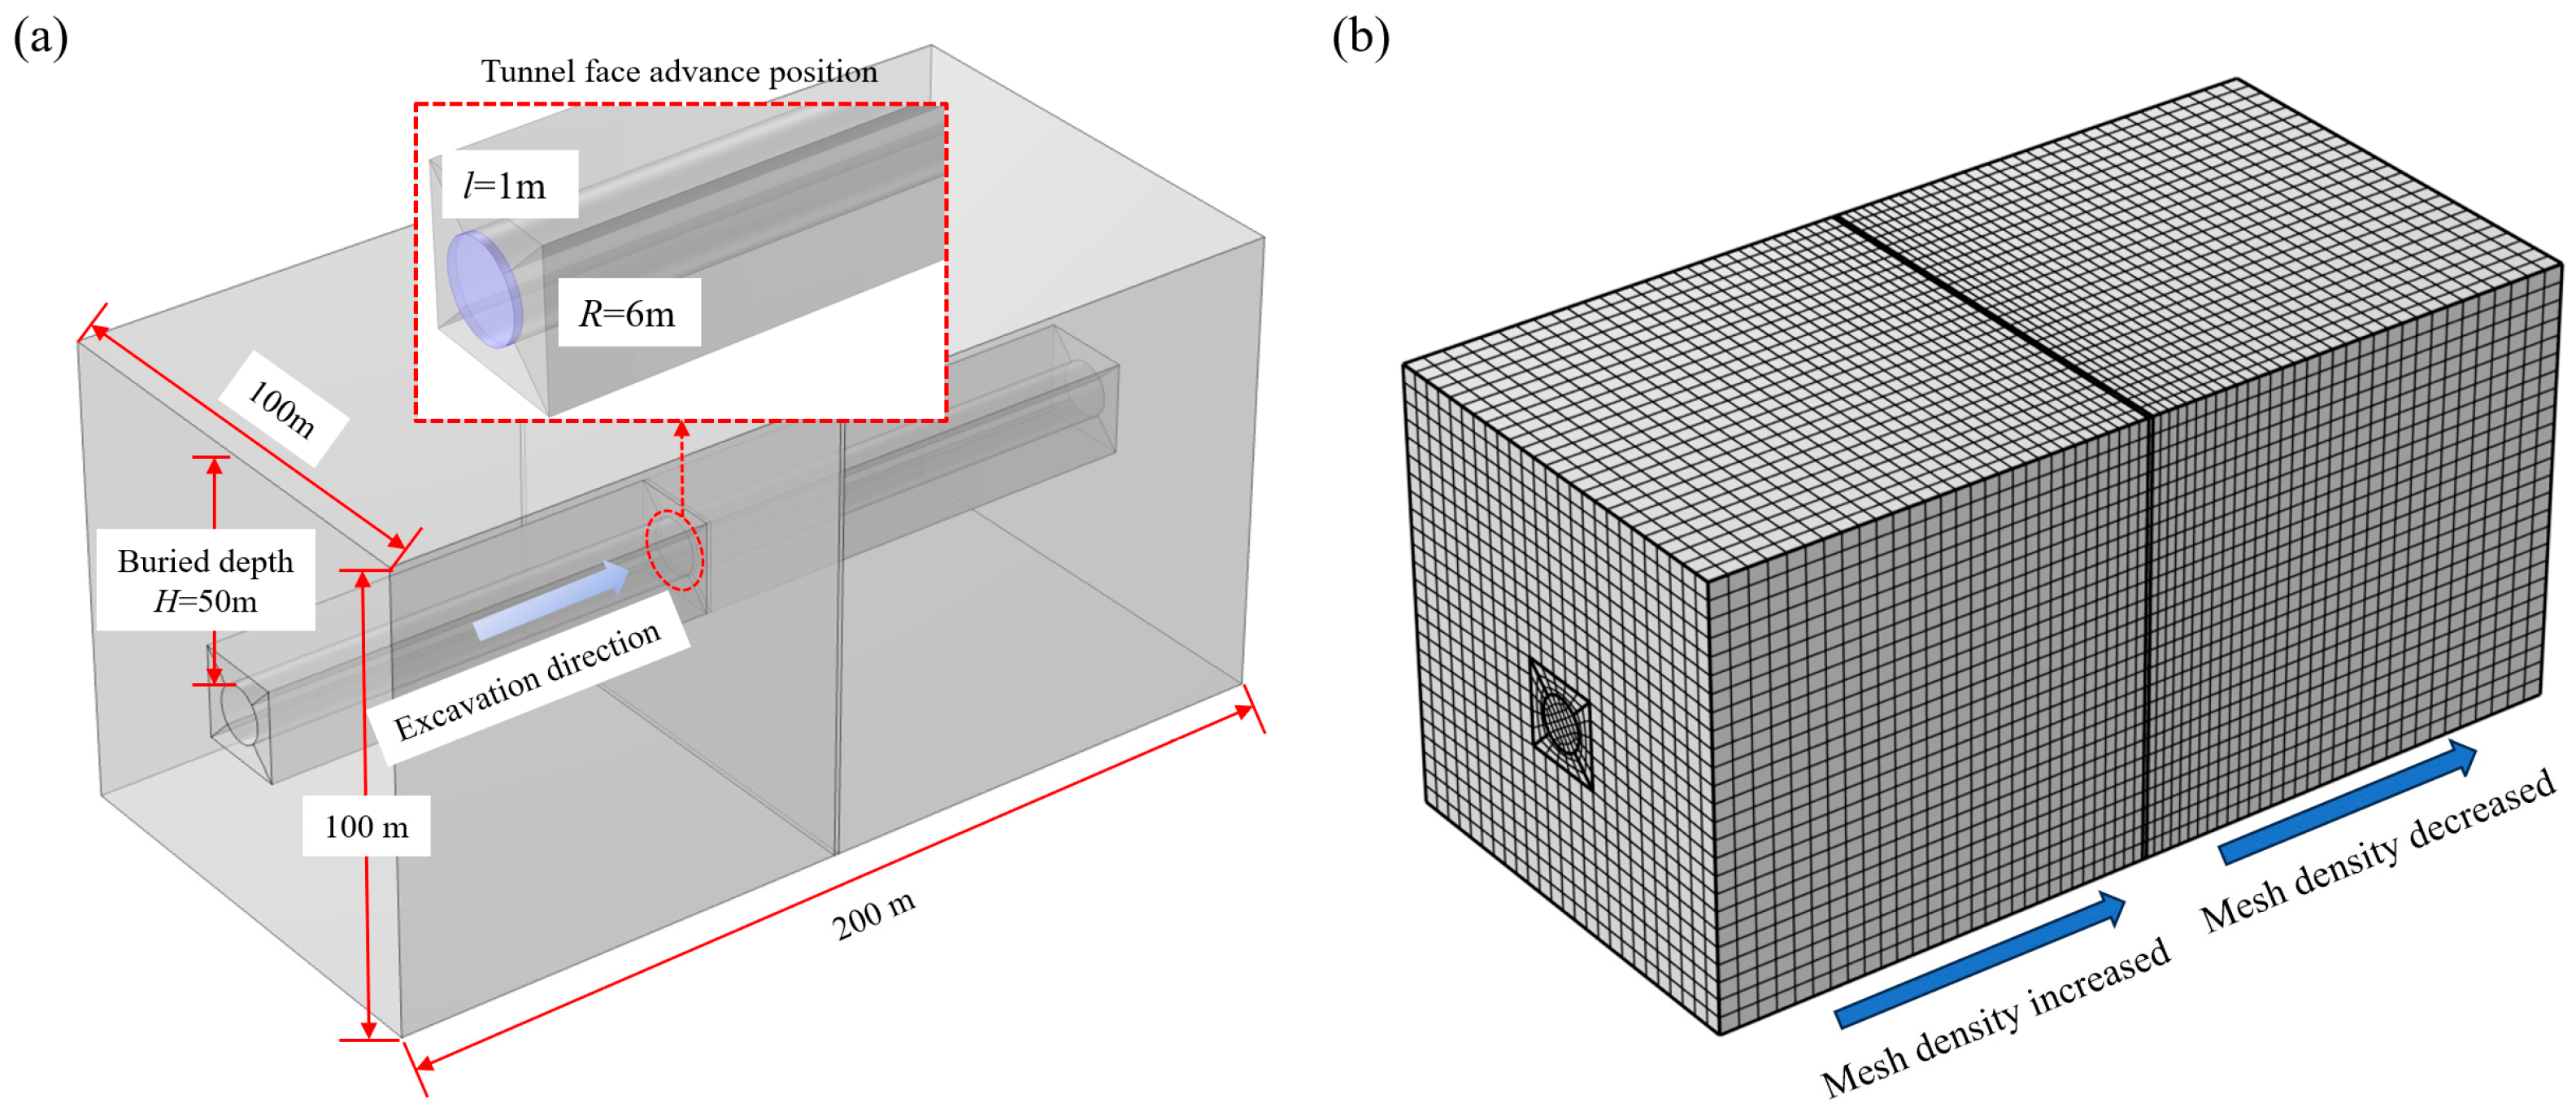
Figure 1. (a) Geometric model for the numerical simulation of circular unsupported tunnels. (b) A mesh model for the numerical simulation.
Applsci 15 08771 g001
Figure 2. (a) Comparison results of LDP curves under Condition A. (b) Comparison results of LDP curves under Condition B. (c) Comparison results of LDP curves under Condition C.
Applsci 15 08771 g002
Figure 3. (a) Tunnel cross-section model; (b) schematic diagram of tunnel and tunnel face positions; (c) mesh model; and (d) schematic diagram of measuring point positions.
Applsci 15 08771 g003
Figure 4. (a) Comparison results of LDP curves for Scheme 1, Scheme 2 and Scheme 3 and displacement cloud charts in the z-direction for the section where z = −50 m of Scheme 3. (b) Comparison results of LDP curves for Scheme 4, Scheme 5 and Scheme 6 and displacement cloud charts in the z-direction for the section where z = −50 m of Scheme 6. (c) Comparison results of LDP curves for Scheme 7, Scheme 8 and Scheme 9 and displacement cloud charts in the z-direction for the section where z = −50 m of Scheme 9.
Applsci 15 08771 g004
Figure 5. The flowchart of the program for predicting the surrounding rock in front of the tunnel face using LDP curves.
Applsci 15 08771 g005
Figure 6. Schematic diagram of the complete structure of the hybrid architecture neural network.
Applsci 15 08771 g006
Figure 7. Data augmentation flowchart.
Applsci 15 08771 g007
Figure 8. Scatter plots of datasets by category.
Applsci 15 08771 g008
Figure 9. Loss functions of the model’s training set and validation set.
Applsci 15 08771 g009
Figure 10. Confusion matrices of the model’s training set and test set.
Applsci 15 08771 g010
Figure 11. Confusion matrices of training sets and test sets for each variant model in the ablation experiment.
Applsci 15 08771 g011
Table 1. Parameter value table for numerical simulation.
Categories of Geological ParametersΡ (kg/m3)σci (MPa)GSImi
Condition A2.5 × 103355020
Condition B2.3 × 103153020
Condition C2.1 × 10351520
Table 2. Recommended values of the rock mass disturbance coefficient D in tunnel engineering.
ConditionDescription of Rock Mass CharacteristicsThe Recommended Value of D
1Tunnel boring machines cause minimal disturbance to the surrounding rock during excavation or blasting based on excellent quality control0
2Mechanical or manual (non-blasting) excavation of poor-quality rock masses causes minimal disturbance to the surrounding rock0
3The squeezing leads to the uplift of the tunnel bottom and requires the installation of an invert0.5 (when there is no invert)
4Poor-quality blasting results in severe local damage of 2 to 3 m in the surrounding rock of hard rock tunnels0.8
Table 3. Statistical table of RMSE and R2 for each condition.
Categories of Geological ParametersRMSER2
Condition A0.0270.996
Condition B0.0300.996
Condition C0.0330.995
Table 4. Statistics table of different stratum combination schemes.
Combination Scheme NumberParameters of the Surrounding Rock in the Initial ExcavationParameters of the Surrounding Rock in Front of the Tunnel Face
1AA
2AB
3AC
4BA
5BB
6BC
7CA
8CB
9CC
Table 5. A summary of the characteristics of LDP curves for different stratum combination schemes.
Scheme NumberParameters of the Surrounding RockCharacterization of the LDP Curve
1A-AThe deformation amount increases slightly and then decreases slowly, and the overall deformation amount is very small
2A-BThe deformation amount increases slightly and then decreases slowly. After passing through the stratum interface, the deformation amount decreases rapidly, and the overall deformation amount is relatively small
3A-CThe deformation amount increases slightly and then decreases slowly. After passing through the stratum interface, it increases rapidly, and the overall deformation amount is moderate
4B-ABefore reaching the stratum interface, the deformation amount first increases and then decreases. After passing through the interface, it remains basically unchanged, and the overall deformation amount is relatively small
5B-BThe deformation amount first increases and then decreases slowly, and the overall deformation amount is relatively small
6B-CBefore reaching the stratum interface, the deformation amount first increases and then decreases. After passing through the interface, it decreases rapidly, and the overall deformation amount is relatively large
7C-ABefore reaching the stratum interface, the deformation amount first increases and then decreases, and the overall deformation amount is relatively small
8C-BBefore reaching the stratum interface, the deformation amount first increases and then decreases, and the overall deformation amount is relatively small
9C-CThe deformation amount first increases and then decreases, and the overall deformation amount is relatively large
Table 6. Specific structure table of the SE-CNN-LSTM-Attention hybrid model.
Module NameModule LevelComponent NameInput DimensionOutput DimensionFunction Description
Input1Raw Input32(1, 32)Input of original features
Convolution module2Conv1d(1, 32)(64, 32)Extract local features through convolution
3BatchNorm1d(64, 32)(64, 32)Standardize channel features to accelerate training
4ReLU(64, 32)(64, 32)Nonlinear activation
5SEBlock(64, 32)(64, 32)Channel attention
6SpatialAttention1D(64, 32)(64, 32)Spatial attention
7MaxPool1d (2)(64, 32)(64, 16)Down-sampling to reduce the computational load
8Conv1d(64, 16)(128, 16)Further extract features through convolution
9ReLU(128, 16)(128, 16)Nonlinear activation
10SEBlock(128, 16)(128, 16)Secondary fine-tuning of channel attention
11SpatialAttention1D(128, 16)(128, 16)Secondary fine-tuning of spatial attention
12Conv1d(128, 16)(256, 16)Increase in the number of convolution channels
13ReLU(128, 16)(128, 16)Nonlinear activation
14SEBlock(256, 16)(256, 16)Final fine-tuning of channel attention
15SpatialAttention1D(256, 16)(256, 16)Final fine-tuning of spatial attention
16AdaptiveMaxPool1d(256, 16)(256, 16)Adaptively fix the output length
LSTM module17LSTM(16, 256)(16, 256)Treat positions as time steps to capture sequence dependencies
Multi-head attention module18MultiheadAttention(16, 256)(16, 256)Focus on different features to enhance the extraction of key information
Classification module19Global Average Pooling(16, 256)256Perform dimensional Average Pooling to generate a global feature vector
20Linear256128Reduce the dimension through a fully connected layer
21Dropout128128Randomly mask 50% of neurons to prevent overfitting
22Linear1289Output classification results
Table 7. Simple random sampling table of numerical simulation parameters.
Grade of Surrounding RockBQρ (kg/m3)Rc (MPa)GSIKvmi
Grade IIImaximum value4202.6 × 10340700.820
minimum value3902.5 × 1033050
Grade IVmaximum value3102.4 × 10320500.620
minimum value2952.3 × 1031530
Grade Vmaximum value2302.2 × 10310300.420
minimum value2152.1 × 103515
Table 8. Classification table of different labels.
Classification NumberSurrounding Rock Grade at the Initial ExcavationSurrounding Rock Grade in Front of the Tunnel Face
0IIIIII
1IIIIV
2IIIV
3IVIII
4IVIV
5IVV
6VIII
7VIV
8VV
Table 9. Statistical table of evaluation indicators for the training set of the SE-CNN-LSTM-Attention model.
Formation ClassificationPrecisionRecallF1-ScoreSupport
00.85900.76140.8072176
11.00000.98680.9933151
20.90060.87350.8869166
31.00001.00001.0000167
40.77780.86980.8212169
50.88040.91530.8975177
61.00001.00001.0000157
71.00001.00001.0000172
81.00001.00001.0000177
Macro avg0.93530.93410.93401512
Weighted avg0.93380.93250.93251512
Accuracy0.93251512
Table 10. Statistical table of evaluation indicators for the test set of the SE-CNN-LSTM-Attention model.
Formation ClassificationPrecisionRecallF1-ScoreSupport
00.92730.79690.857164
10.98810.93260.956589
20.73170.81080.796274
31.00001.00001.000073
40.82720.94370.881671
50.72880.68250.704963
61.00001.00001.000083
71.00001.00001.000068
81.00001.00001.000063
Macro avg0.91140.90740.9080648
Weighted avg0.91520.91200.9123648
Accuracy0.9120648
Table 11. Statistical table of the structures of various models.
Model NameComposition of the Core ModuleDescription of Differences (in Comparison with the Model in this Paper)Key Parameter Configuration
SE-CNN-LSTM-Attention (Baseline)SE + SA + CNN3 + LSTM + AttnnoneConv1d (k = 7, 5, 3), SE (reduction = 16), SA (k = 5, 5, 3), LSTM (h = 256), MultiheadAttn (4 head)
SE-CNN-LSTMSE + CNN3 + LSTM-SA, -AttnConv1d (k = 7, 5, 3), SE (reduction = 16), LSTM (h = 256)
CNN-LSTM-AttentionCNN3 + LSTM + Attn-SE, -SAConv1d (k = 7, 5, 3), LSTM (h = 256), MultiheadAttn (4 head)
CNN-AttentionCNN3 + Attn-SE, -SA, -LSTMConv1d (k = 7, 5, 3), MultiheadAttn (4 head)
CNNCNN3-SE, -SA, -LSTM, -AttnConv1d (k = 7, 5, 3)
Table 12. Comparison results of SE-CNN-LSTM-Attention with SE-CNN-LSTM, CNN-LSTM-Attention, CNN-Attention, and CNN on the test set.
Model NameAccuracyPrecisionRecallF1-Score
Macro AvgWeighted AvgMacro AvgWeighted AvgMacro AvgWeighted Avg
SE-CNN-LSTM-Attention
(Baseline)
91.20%0.91140.91520.90740.91200.90800.9123
SE-CNN-LSTM87.96%0.88540.88970.87620.87960.87320.8774
CNN-LSTM-Attention88.12%0.87930.88620.87850.88120.87550.8804
CNN-Attention87.04%0.86550.87240.86550.87040.86500.8709
CNN84.72%0.84260.84880.84550.84720.84720.8432
Disclaimer/Publisher’s Note: The statements, opinions and data contained in all publications are solely those of the individual author(s) and contributor(s) and not of MDPI and/or the editor(s). MDPI and/or the editor(s) disclaim responsibility for any injury to people or property resulting from any ideas, methods, instructions or products referred to in the content.