Article

Flow Velocity Distribution Downstream of Nanofibrous Filter in Minichannel Determined by Particle Image Velocimetry Method

by
Andrzej Krupa
1,*,
Izabela Wardach-Święcicka
1,
Karol Ronewicz
2 and
Anatol Jaworek
1
1
Institute of Fluid Flow Machinery, Polish Academy of Sciences, Fiszera 14, 80-231 Gdańsk, Poland
2
Independent Researcher, 80-126 Gdańsk, Poland
*
Author to whom correspondence should be addressed.
Appl. Sci. 2025, 15(15), 8728; https://doi.org/10.3390/app15158728
Submission received: 10 July 2025 / Revised: 4 August 2025 / Accepted: 5 August 2025 / Published: 7 August 2025

Abstract

The paper presents the results of investigations of flow velocity field distribution downstream of the nanofibrous filter in a minichannel determined by the particle image velocimetry (PIV) method. The nonwoven nanofibrous filter was produced by electrospinning technology from a PVDF polymer dissolved in DMAC and acetone mixture. The nanofibers were deposited onto a mesh scaffold made of stainless steel wires 0.2 mm in diameter and with a 2 mm pitch. The gas velocity in the channel with the inserted nanofibrous filter was below 1.2 m/s. The flow field distribution in the channel was investigated by the Dantec FlowMap System. It was shown that the turbulence can be generated downstream of the filter, even for low Reynolds numbers smaller than 1300. This turbulence was attributed to the inhomogeneity of the fibrous filter structure. Another cause of this phenomenon could be the large area of the boundary layer at the channel walls compared to the channel cross section.

1. Introduction

Submicron particles, regardless of their sources, are very dangerous to human health. Submicron particles from the range of 100 to 1000 nm, and nanoparticles (<100 nm), are reported to have adverse health effects on humans exposed to such particles in indoor (houses, offices, shops, galleries), semi-closed (i.e., with permanent but limited air exchange, like transportation carriages, trains, busses, or subway stations), and urban open air environments, where they spend the majority of time each day. The particles can be of natural origin (fungal, bacteria, viruses, skin remnants) or can be produced by humans’ activities, including, cooking, toasting, frying, smoking, fireplace burning, walking, wearing of clothes, machining, wearing of moving parts of various machines, etc. [1,2,3,4,5,6,7,8,9], and/or can be infiltrated from the outdoors with the ventilated air [10,11,12,13,14,15,16].
For example, in the case of an underground station, the particles originate from the natural abrasion of the construction elements of trains and rails, or due to the movement of passengers [17,18,19,20,21,22,23,24,25]. Such particles have a great propensity to be deposited in the human’s airways during inhalation, due to impaction or Brownian diffusion [26,27]. Such micro- and nanoparticles can circulate in the environment due to the air motion, forced by the natural convection, heating, ventilation, or air-conditioning systems, or by humans’ movement. Optimized filtration devices used for the removal of indoor particles are therefore required in order to protect human health by effectively operating HVAC systems.
Nonwoven fibrous filters, electret filters [28], or electrostatic precipitators [29,30,31] are usually used to remove fine particles from the ambient air to decrease their concentration in the indoor environment. The optimal solution to the problem of nanoparticle removal can be the nanofibrous filters. Nanofibrous filtration is one of the modern methods for the removal of fine inorganic dust or microorganisms (bacteria, viruses, and spores) of a size smaller than one micron from the air [32,33]. Nanofibrous filters, with nanopores between fibers of usually <200 nm, can be produced by the electrospinning method, which generates polymer fibers of a diameter of <200 nm [34,35,36,37,38,39,40]. Compared to other methods used for the production of commercial filters, the electrospun nonwoven filters are made of fibers of more uniform diameters [41,42,43,44].
Studies of the process of filtration of various aerosol contaminants by nanofibrous filters were carried out by Przekop and Gradoń [45], and Jackiewicz et al. [46]. The nanofibers used by these authors were produced by polymer melt blowing [47]. Podgórski and Bałazy [48] proposed a model of motion and deposition of particles on the filter’s fibers, which could be used for computational modeling. However, melt blowing technology does not offer the possibility to produce nanofibers with controlled fiber diameters and a controlled degree of fibers’ alignment. The interest in nanoparticle filtration by fibrous filters with the simultaneous inactivation of microorganisms started at the beginning of this century [49,50,51,52,53]. The inactivation of microorganisms was carried out via the deposition of active chemical agents onto the nanofibrous substrate [54,55,56,57]. Metal oxide nanoparticles blended with nanofibers produced by electrospraying were used in order to act as a catalyst for the protection against chemical contaminants [58,59,60,61]. The current state of knowledge in the field of filtration of viruses by various types of filters was discussed by De Almeida et al. [62].
The filtration efficiency of the electrospun filters used for the respiratory masks was investigated by Salkovskiy and Fadeev [63]. The filtration efficiency for the aerosol particles of dioctyl phthalate (DOP) was estimated to be >99.999999%. That means that the penetration of particles through this type of filter was four orders of magnitude smaller than the Occupational Safety and Health Standard requirements, by a pressure drop of 255 Pa (26 mm H2O) at a flow rate of 85 L/min. The effect of fibrous filter loading on the filtration efficiency, pressure drop, and clogging of nanofibrous filters was studied by many teams, using various filtration models (analytical and numerical) and experimentally [64,65,66,67,68,69,70]. A microchannel design for fine particle filtration was proposed by Aghdasi et al. [71]. The authors determined the filtration efficiency for microparticles considering the dielectrophoretic forces, but did not determine the flow field in such a channel.
Various methods of testing of filtration devices, including fibrous filters and electrostatic precipitators, in terms of ISO standards have been reviewed by Zheng and Kanaoka [68]. The authors claimed that the filtration velocity of the fibrous filter can be higher for smaller fiber diameters of the filter than for larger ones. Furthermore, the maximum penetration of particles through a filter occurs for smaller particles [65]. When nanofibrous filters are used for the filtration, the Cunningham slip correction factor for gaseous molecules increases, and the drag force of the flowing gas on the fiber becomes smaller for finer fibers that results in a decreased pressure drop [66,67,68]. A similar effect was observed by Kirsh et al. [72,73] for a pair of cylinders, which can be a model of the nanofibrous filter. The drag force decreased with the increasing Knudsen number. The Knudsen number was defined by the authors as the mean free path of gas molecules to the fiber radius.
A decrease in the pressure drop across fibrous filters with micron-sized fibers, caused by gaseous molecules slipping, was presented by Kirsch et al. [74]. This effect was more significant for filters with fibers of high non-uniformity. The empirical formula derived by Kirsch et al. [74] was confirmed by experiments carried out by Choi et al. [75], for nanofibrous filters with a large inhomogeneity, and the model was extended for the Knudsen number up to 20. Leung and Hung [65] noticed that nanofibrous filters are more efficient in particle filtration than the microfiber media. This effect was attributed to increased particle interception in such a filter. The authors used nanofibrous filters with thicknesses ranging from 10 to 100 µm. The advantage of microfiber filters was their higher particle mass loading.
The flow resistance decreases with the fiber diameter decreasing [76,77,78]. This slipping causes a lower pressured drop across the filter, which is attributed to bypassing the nanofibers by gaseous molecules due to a relatively low Knudsen number (Kn):
Kn = 2λ/d
where λ is the mean free path of air molecules and d is the nanofiber diameter. Assuming the mean free path of gaseous molecules to be 60 nm, and a median fiber diameter of 430 nm, the Knudsen number for the filter used can be estimated to be about Kn = 0.28.
The PIV method of flow field visualization in gas cleaning devices was formerly used for the measurement of gas flow velocity in electrostatic precipitators or their laboratory models (cf. for example, [79,80,81,82,83,84,85]). The authors determined the dust particles’ motion and an effect of the discharge and electrodes’ geometry on the collection efficiency. Gas flow through a commercial pleated filter was investigated by Kang et al. [86] using the PIV method. The authors determined the velocity distributions downstream of a rectangular pleat filter. The PIV technique was used by Pliszka et al. [87] to investigate the process of nanofibers’ formation by electrospinning. Recently, the PIV technique was also used for investigations of the filtration efficiency of face masks with respect to the removal of coronavirus SARS-CoV-2 [88]. The authors used DEHS seed particles mimicking the coronavirus because they can be conveyed in air for several hours until they evaporate. The unsteady fan–intake interaction flow using a time-resolved stereoscopic PIV method in a channel was carried out by Migliorini et al. [89]. The flow field in a nanofibrous filter has hitherto not been investigated by the PIV method.
This paper presents the results of experimental investigations of the air velocity field measured downstream of a nonwoven fabric filter produced by the electrospinning method, and mounted in a minichannel. The experimental tests were carried out for DEHS aerosol seed particles of diameters ranging from about 500 nm to 2 µm, dispersed into the flowing air. The velocity field was visualized in the form of magnitude of the velocity vector, represented by the color scale. The flow direction was presented by a field of arrows. The novelty of this research is the determination of the flow field distribution downstream of a nanofibrous nonwoven filter by the PIV method. The goal of these investigations was to provide an insight into the process of nanofiltration and the turbulent flow formation downstream of a nanoporous nonwoven filter by low Reynolds numbers.

2. Materials and Methods

2.1. Nonwoven Nanofibrous Filter Production by Electrospinning

Electrospinning is a method of production of nanofibers from a viscous polymer solution by pulling outwards the liquid with charge carriers induced at the surface of the solution meniscus by the electric field. Due to the tangential stress, a thin nanometer jet is generated. The polymer solution is fed under low pressure, with a constant flow rate, to a metal capillary nozzle, which is maintained at high voltage. The solvent evaporates from the jet ejected from the nozzle, under controlled conditions (temperature and humidity), and the remaining dry or semidry polymer fiber, with a diameter of the order of a few hundred nanometers, is collected on the surface of a grounded flat substrate or on a rotating cylinder. The deposited several layers of the fibers form a filtration mat.
A scheme of setup used for the electrospinning is shown in Figure 1a, and a photograph of the stand in Figure 1b. The electrospinning device consisted of a single capillary nozzle with an inner diameter of 0.4 mm and an outer diameter of 0.5 mm, connected to a high voltage source. The capillary was energized from a high-voltage power supply SL300 30 kV (SPELLMAN, Hauppauge, NY 11788, USA), providing a DC voltage of 13.5 kV of positive polarity. The polymer solution was fed into a syringe of a volume of 2 mL, and infused with a constant flow rate of 1 mL/h to the capillary nozzle by a Fusion 200 High Precision Dual syringe pump (CHEMYX Inc., Stafford, TX 77477, USA). An aluminum frame with a stainless steel mesh, used as the substrate, was placed beneath the capillary outlet, on a heated rotating table H3.1 (DANLAB, Aulum, Denmark), which was grounded. The distance of the capillary nozzle tip to the substrate was 120 mm. The heated table was placed on a movable platform, allowing the simultaneous progressive and rotational motion of the substrate in order to obtain an even distribution of the nonwoven fabric on the surface of several substrates at a time.
Polymer nanofibers were produced from a solution of polyvinylidene fluoride (PVDF, Mw = 455,000 g/mol, Sigma-Aldrich, St. Louis, MO 63103, USA) with a mass concentration of 15% (0.9 g PVDF) in a mixture of 2.48 g Dimethylacetamide (DMAC, Sigma-Aldrich, St. Louis, MO 63103, USA) and 2.84 g acetone (Chempur, Piekary Śląskie, Poland). The PVDF solution was obtained by stirring the polymer at room temperature for 8 h using a magnetic stirrer. The electrospinning process was carried out in ambient air of 45–50% relative humidity and at room temperature. The nonwoven fabric was deposited on a mesh scaffold made of stainless steel wires 0.2 mm in diameter, and with 2 mm mesh, embedded in a 15 mm × 15 mm aluminum frame. The diameter of the fibers obtained in this process, deposited on the mesh, and estimated from SEM micrographs was between 100 and 700 nm. The thickness of the nanofibrous filter was controlled by the time of electrospinning.
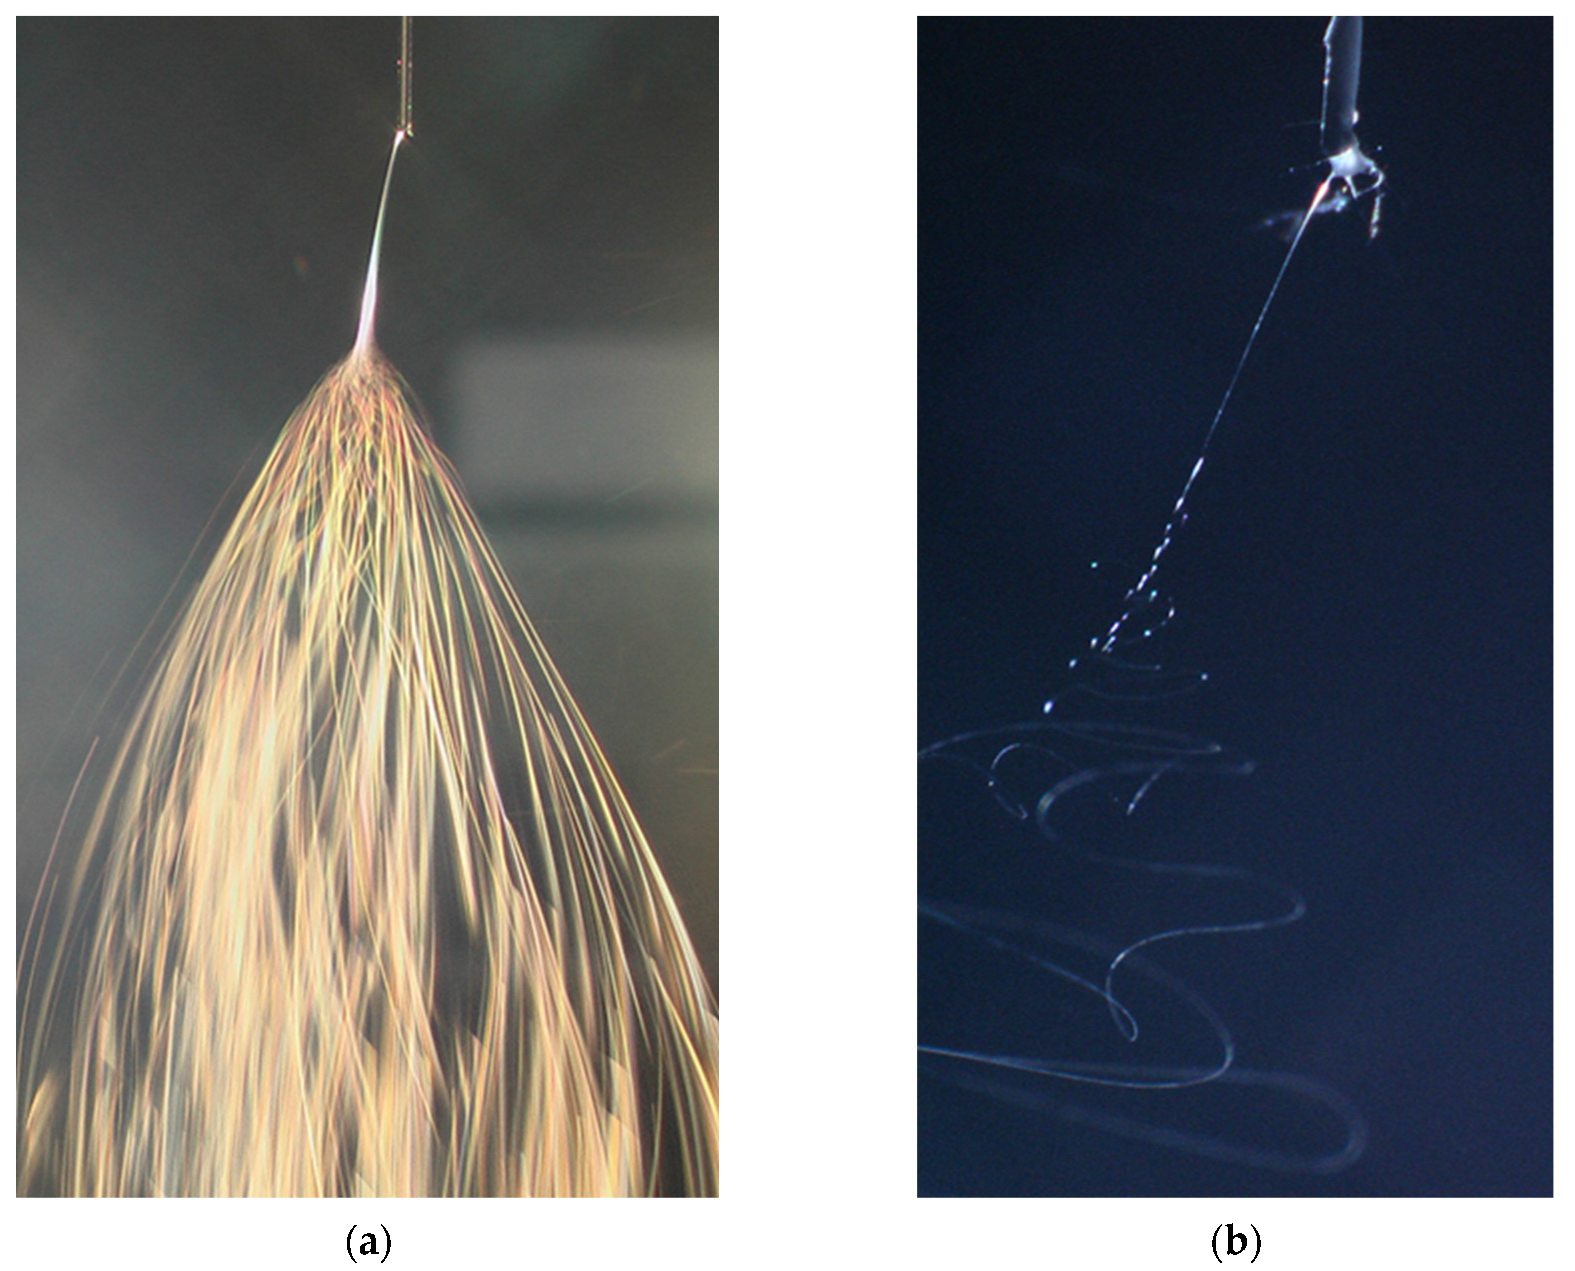
Figure 2 shows a photograph of the PVDF jet pulled out from a capillary nozzle, taken by a continuous illumination (Figure 2a), and illuminated by a stroboscopic lamp of 3 µs flash (Figure 2b). A single polymer fiber can be seen in this photograph. The fibers bend (whip) randomly into many loops, forming a cone plume under continuous illumination. The velocity of free nanofibers in the interelectrode space can vary from 2 m/s to 200 m/s [90], depending on the physical properties of the solution and fabrication conditions (electric field).
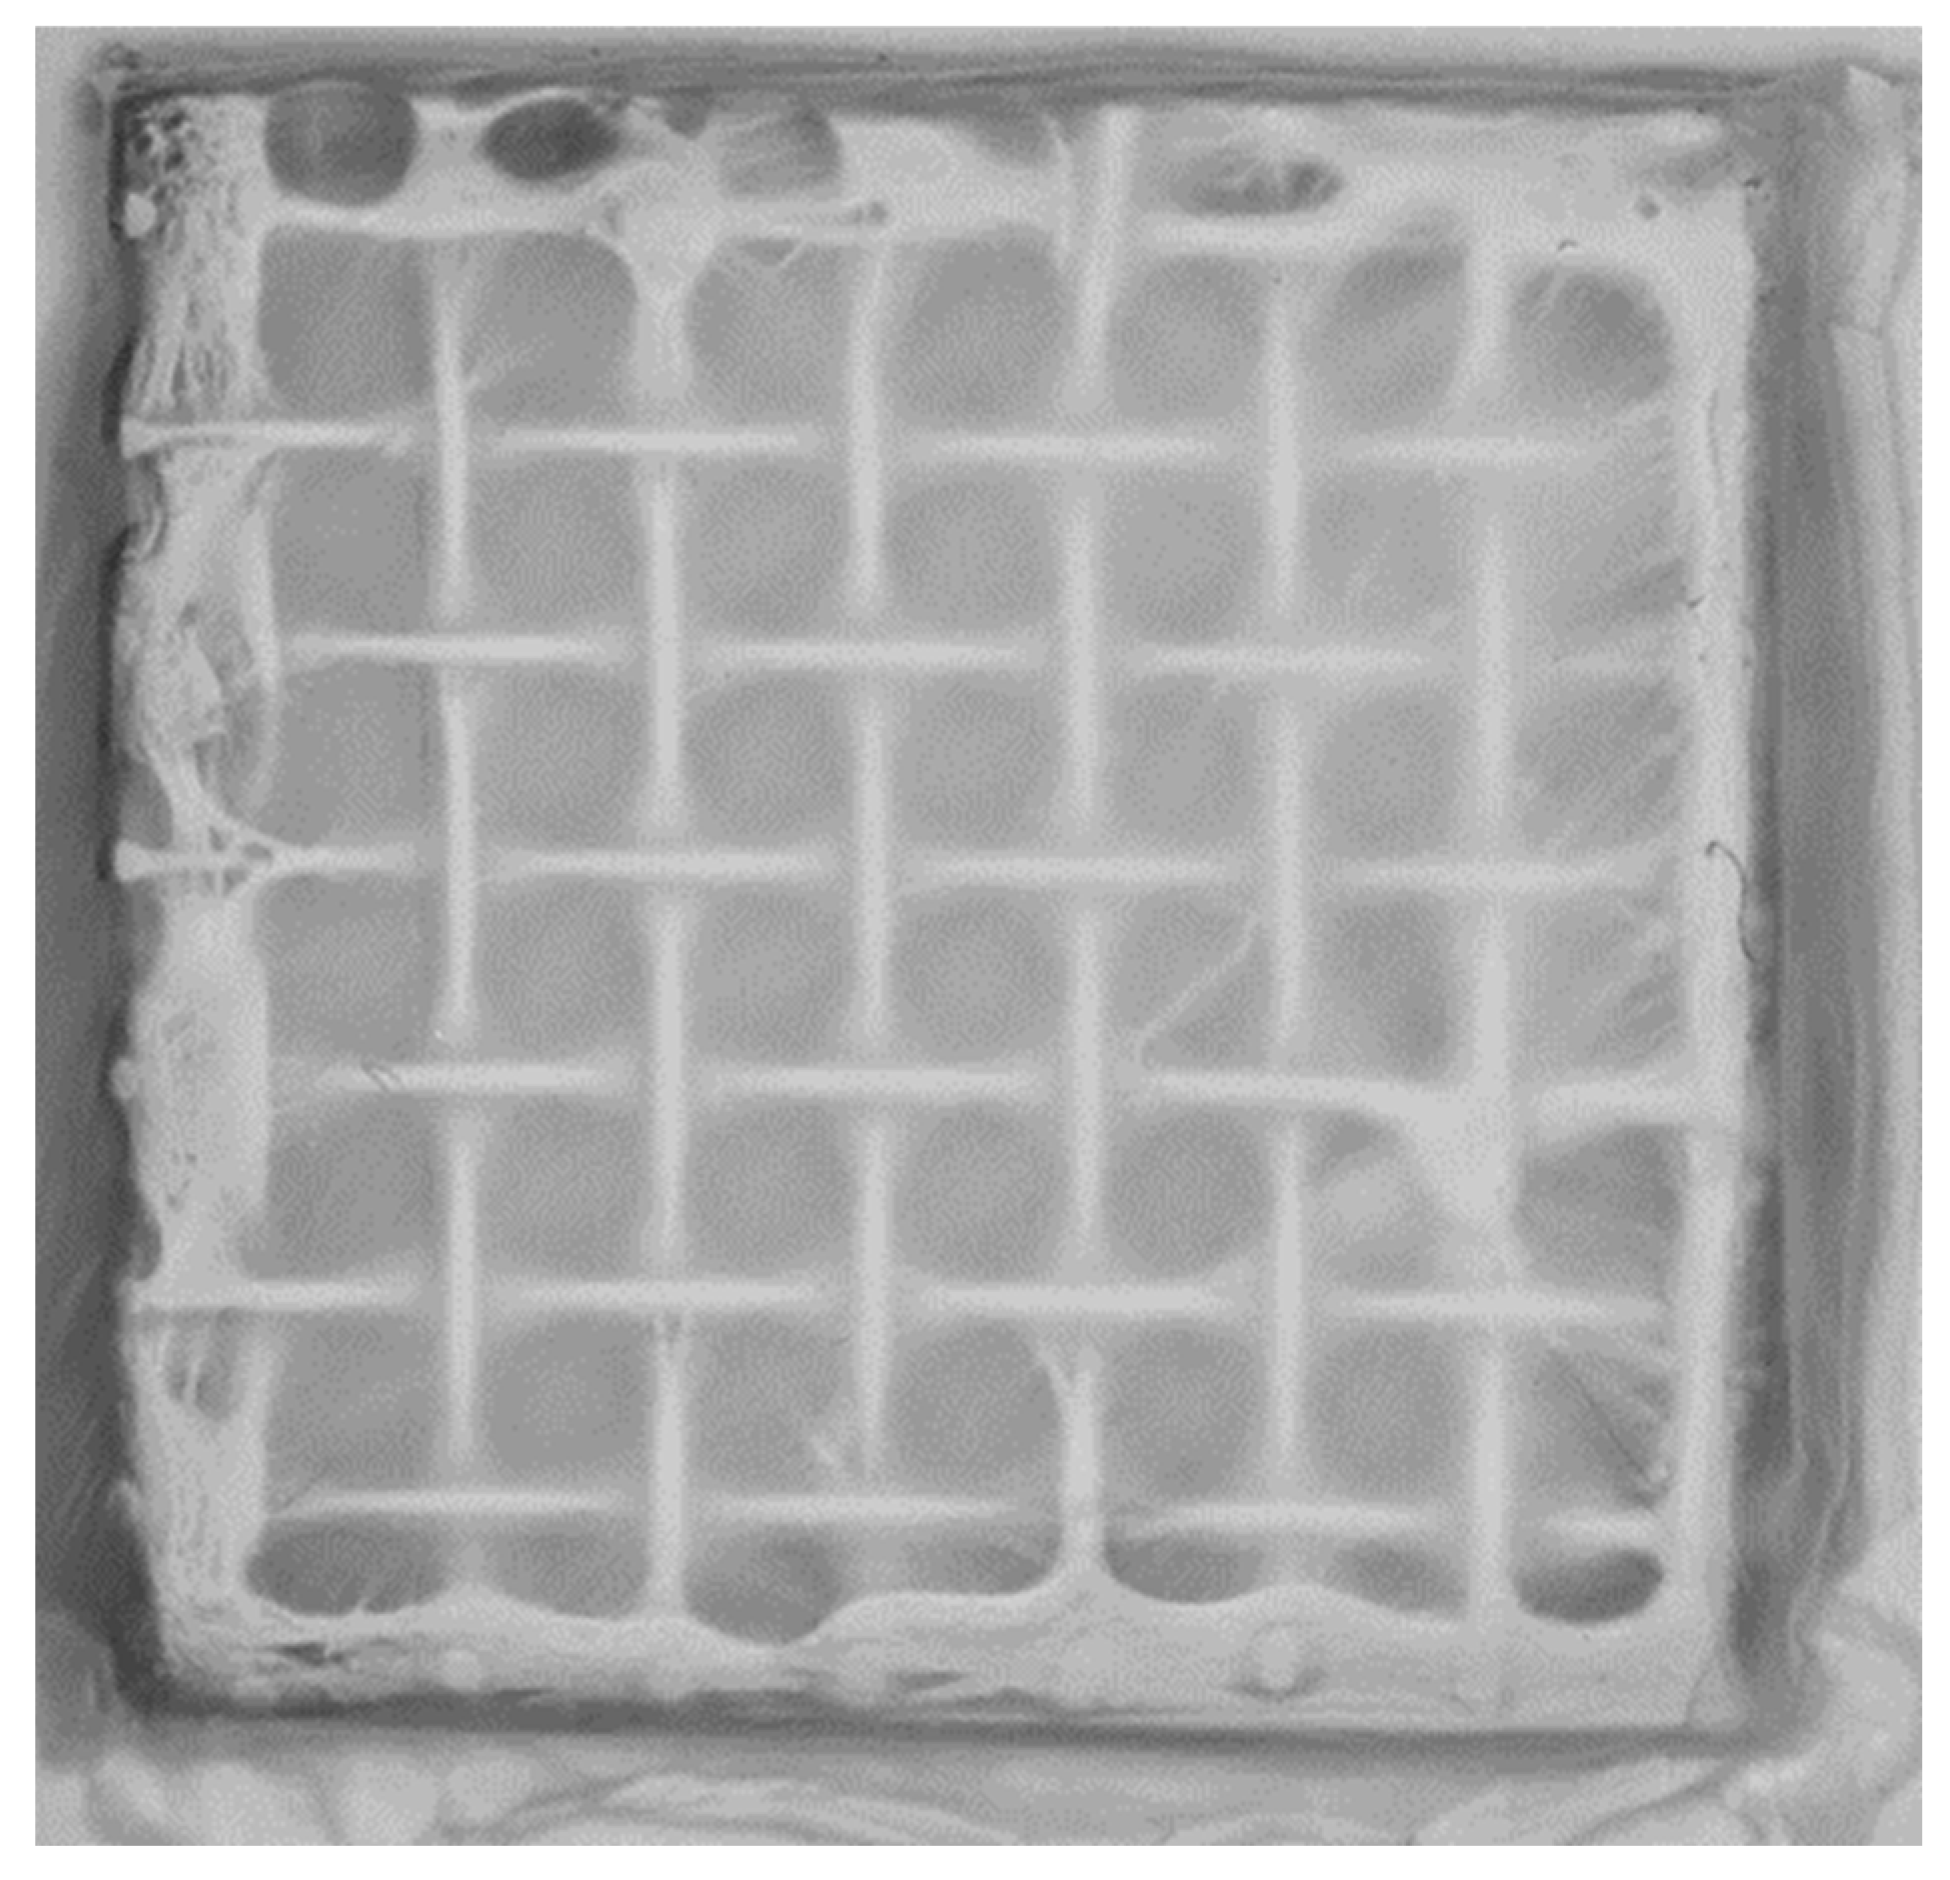
Figure 3 shows a photograph of a clean PVDF nanofibrous filter specimen deposited onto a metal mesh scaffold by the electrospinning process by a time of 10 min. After this time, the estimated weight of the nonwoven nanofibrous filter was about 2.5 mg (11 g/m2).
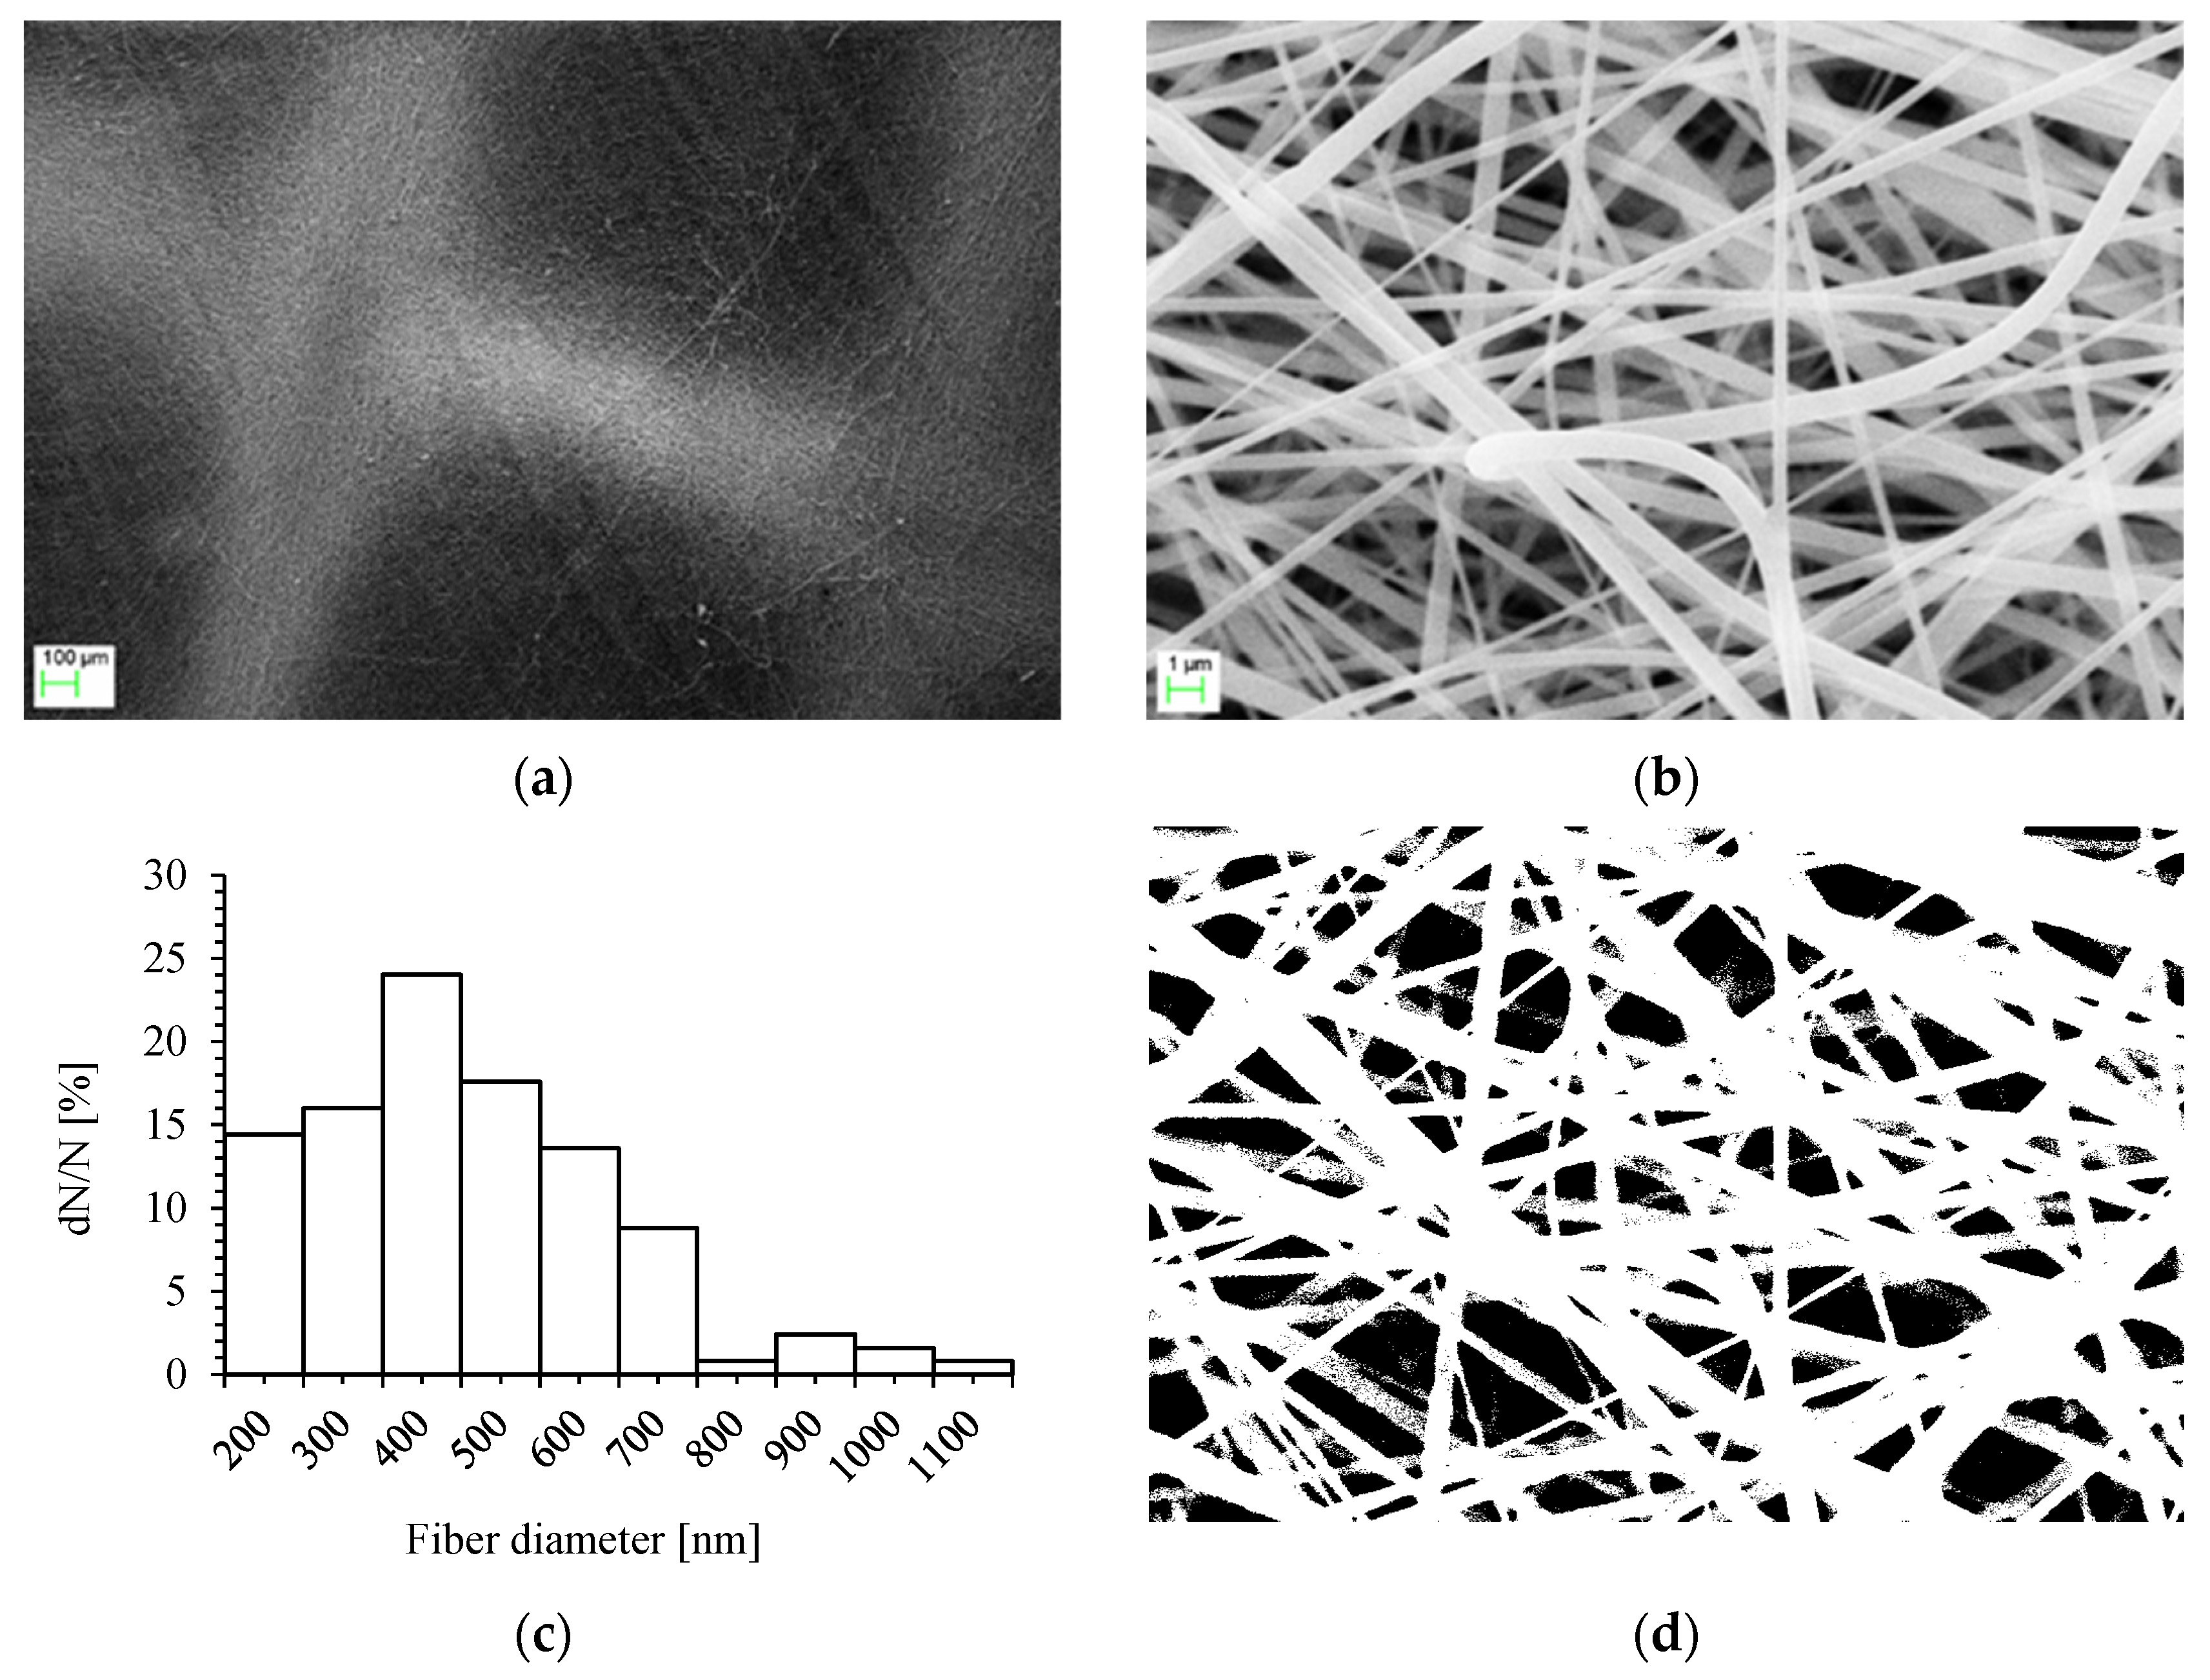
The morphology of the PVDF nanofibrous filter was examined using a scanning electron microscope (SEM) EVO 40 (ZEISS, Oberkochen, Germany). SEM micrographs of the metal mesh scaffold with a PVDF nanofibrous filter are shown in Figure 4. Figure 4a shows a SEM image of a fragment of metal mesh covered with a semi-transparent nanofibrous filter, and Figure 4b shows a close-up view of the filter’s fibers. The diameter distribution of the fibers obtained in these investigations, deposited on the metal mesh, and estimated from a SEM micrograph is shown in Figure 4c. Most of the fibers are of a diameter in the range between 100 and 700 nm. The mean diameter of the fibers was 460 nm, and the median diameter was 431 nm.
The porosity of the nanofibrous filter was determined from the SEM micrographs using the method developed by Ghasemi-Mobarakeh et al. [91]. The gray SEM picture was converted to the b/w image by adjusting the brightness threshold to the mean value of brightness (Figure 4d). The black and white pixels were determined by the graphical analysis. The mean value of brightness of a gray image was 163/255. After the conversion of the grayscale image to b/w (binary), the mean value of porosity was determined to be about 40%.

2.2. Experimental Stand

The experiments were carried out in a laboratory setup comprised of a small-scale vertical rectangular channel with a nanofibrous filter inside, seed particle generator, differential pressure gauge, gas flow meter, outlet suction fan, and PIV measuring system. A schematic of this setup is shown in Figure 5. A photograph of the experimental stand with a PIV system and CCD camera, and a nanofibrous filter channel mounted on a tripod is shown in Figure 6. The system was designed to study the distribution of the flow field velocity downstream of a nonwoven nanofibrous filter by the PIV method. The metal mesh with the deposited nanofibrous filter on its upstream side was fixed in the middle of the channel length, and the aerosol flowed from the bottom of the channel upwards.
The channel was made of an acrylic plate with 10 mm thickness. An optical glass window of 0.4 mm thickness was mounted in one of the side walls of the channel in order to record the seed particles’ motion with the PIV camera. A Nikon FlowSense M2 CCD camera equipped with a macro-photography lens was used for the recording of the seed particle trajectories. The channel was of an inner square cross section of 15 × 15 mm. A scaffold with a nanofibrous filter was placed in the middle of the channel length.
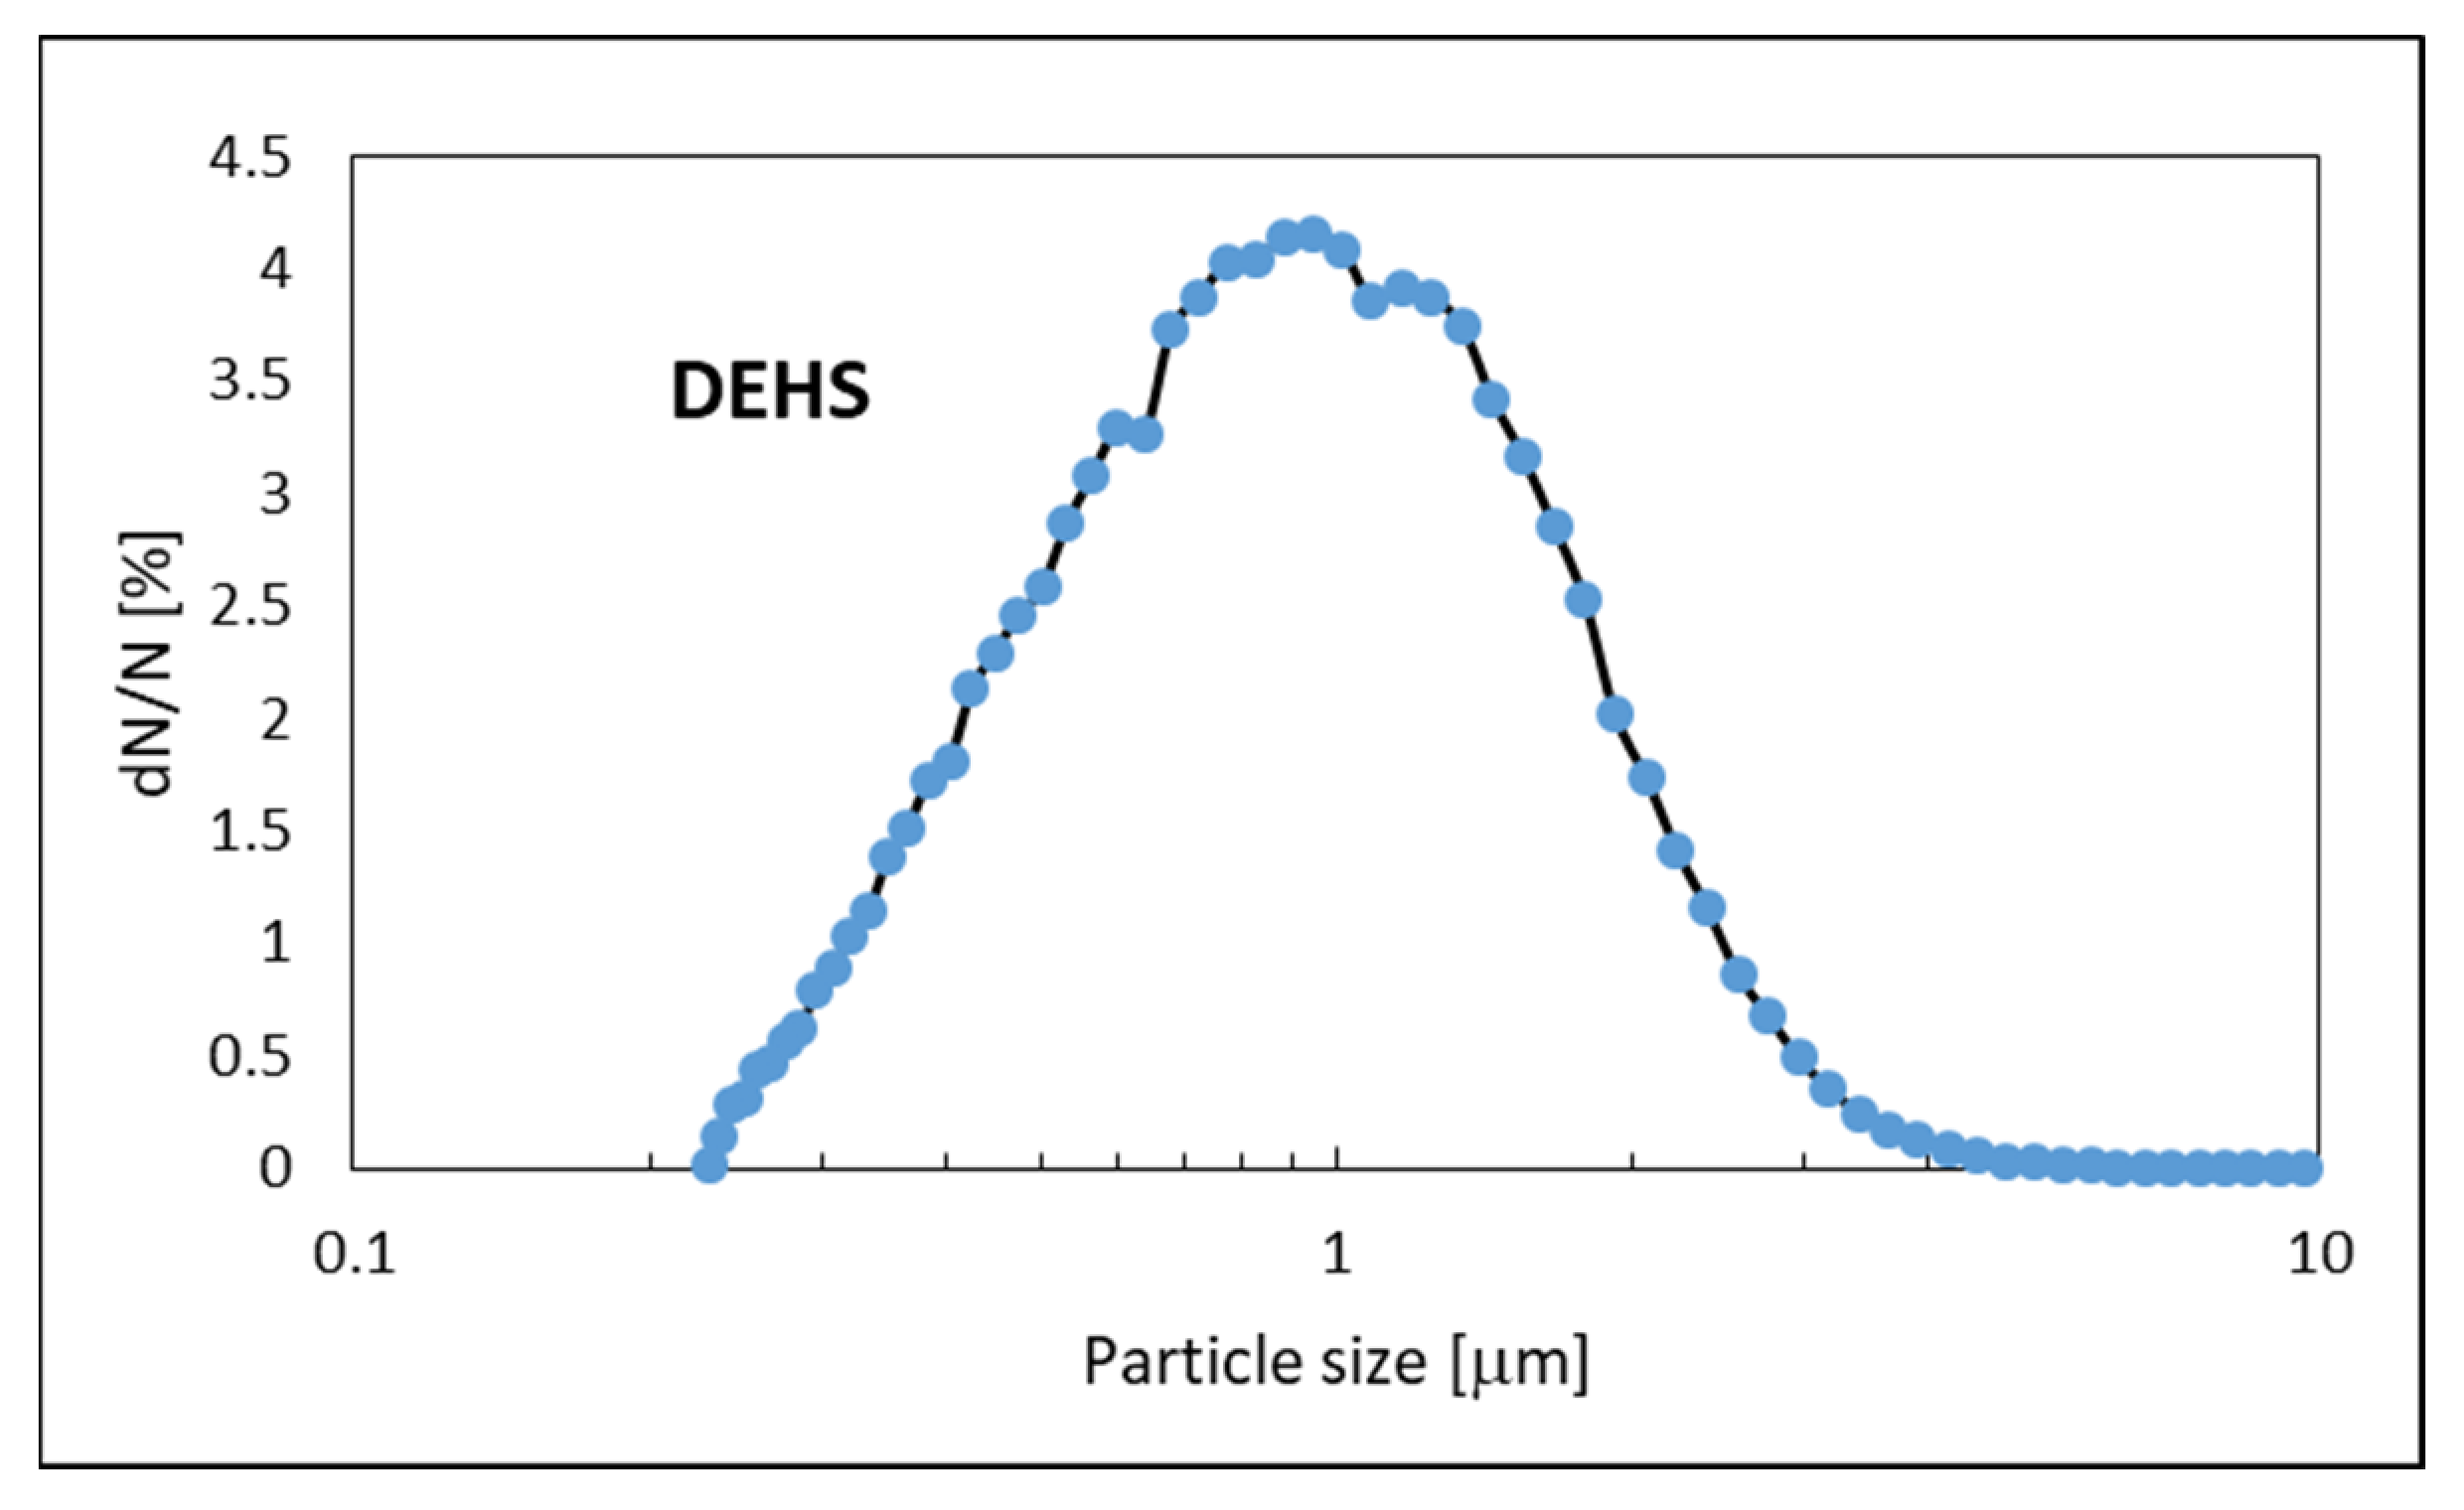
The seed particles were injected at the inlet of the channel and drawn upwards through the channel by an outlet suction fan. The seed particles were produced by spraying Di-ethylhexyl-sebacate (DEHS) using an atomizer aerosol generator ATM 226 (TOPAS GmbH, Dresden, Germany). This aerosol generator complies with the VDI 3491 Standards (VDI Germany 2016) [92]. The size of the particles was measured by a laser aerosol particle size spectrometer LAP 322 (TOPAS GmbH, Dresden, Germany). Figure 7 shows a size distribution of DEHS seed particles used for PIV measurements. The mean size of these particles was about 1 µm. The air flow rate was measured using flowmeter RTV-10-300 (ROTAMETR, Gliwice, Poland). The pressure drop through the nanofibrous filter was measured by the pressure gauge TESTO 512 (TESTO, Titisee-Neustadt, Germany). The measurements were carried out at ambient temperature and humidity.
The Reynolds number for a DEHS particle in a flow is as follows:
Rep = ρu0dp/η
in which ρ is the air density, u0 is the average air velocity in the channel, dp is the diameter of a particle, and η is the air dynamic viscosity. In normal conditions, for a particle with a diameter dp = 1 µm and air velocity u0 = 1 m/s, the Reynolds number for the particle is Rep = 0.071.
The Stokes number for a particle approaching a single fiber is
St = τu0/df
where τ is the characteristic relaxation time of the motion of a particle, u0 is the average air velocity in the channel, and df is the characteristic dimension of the obstacle (diameter of a fiber). The characteristic time for the particle can be determined from the following relation:
τ = ρpdp2/18η
where ρp is the particle density, dp is the diameter of a particle, and η is the air dynamic viscosity. For a particle with a diameter dp = 1 µm, gas velocity u0 = 1 m/s, ρp = 900 kg/m3, τ = 2.75 µs. For this value of characteristic time, the Stokes number for the particle is St = 6.4.
The flow velocity distribution through the nanofibrous filter was examined by the PIV method, with DEHS aerosol as the dispersed seed particles. The DEHS aerosol flowed through the channel upwards, and was partially deposited on the nanofibrous filter, but some of the particles penetrated through the filter downstream. Since the particle filtration efficiency by the nanofibrous filter was high for the particles with a diameter <1 µm, a high concentration of seed particles in the front of the nanofibrous filter was required to obtain a sufficient concentration of these particles in the measurement channel downstream of the filter. The particle filtration resulted in a short clogging time of the filter during the measurements that increased the flow resistance and distorted the velocity field measured by the PIV method. For this reason, a virgin filter was used for each PIV measurement series.
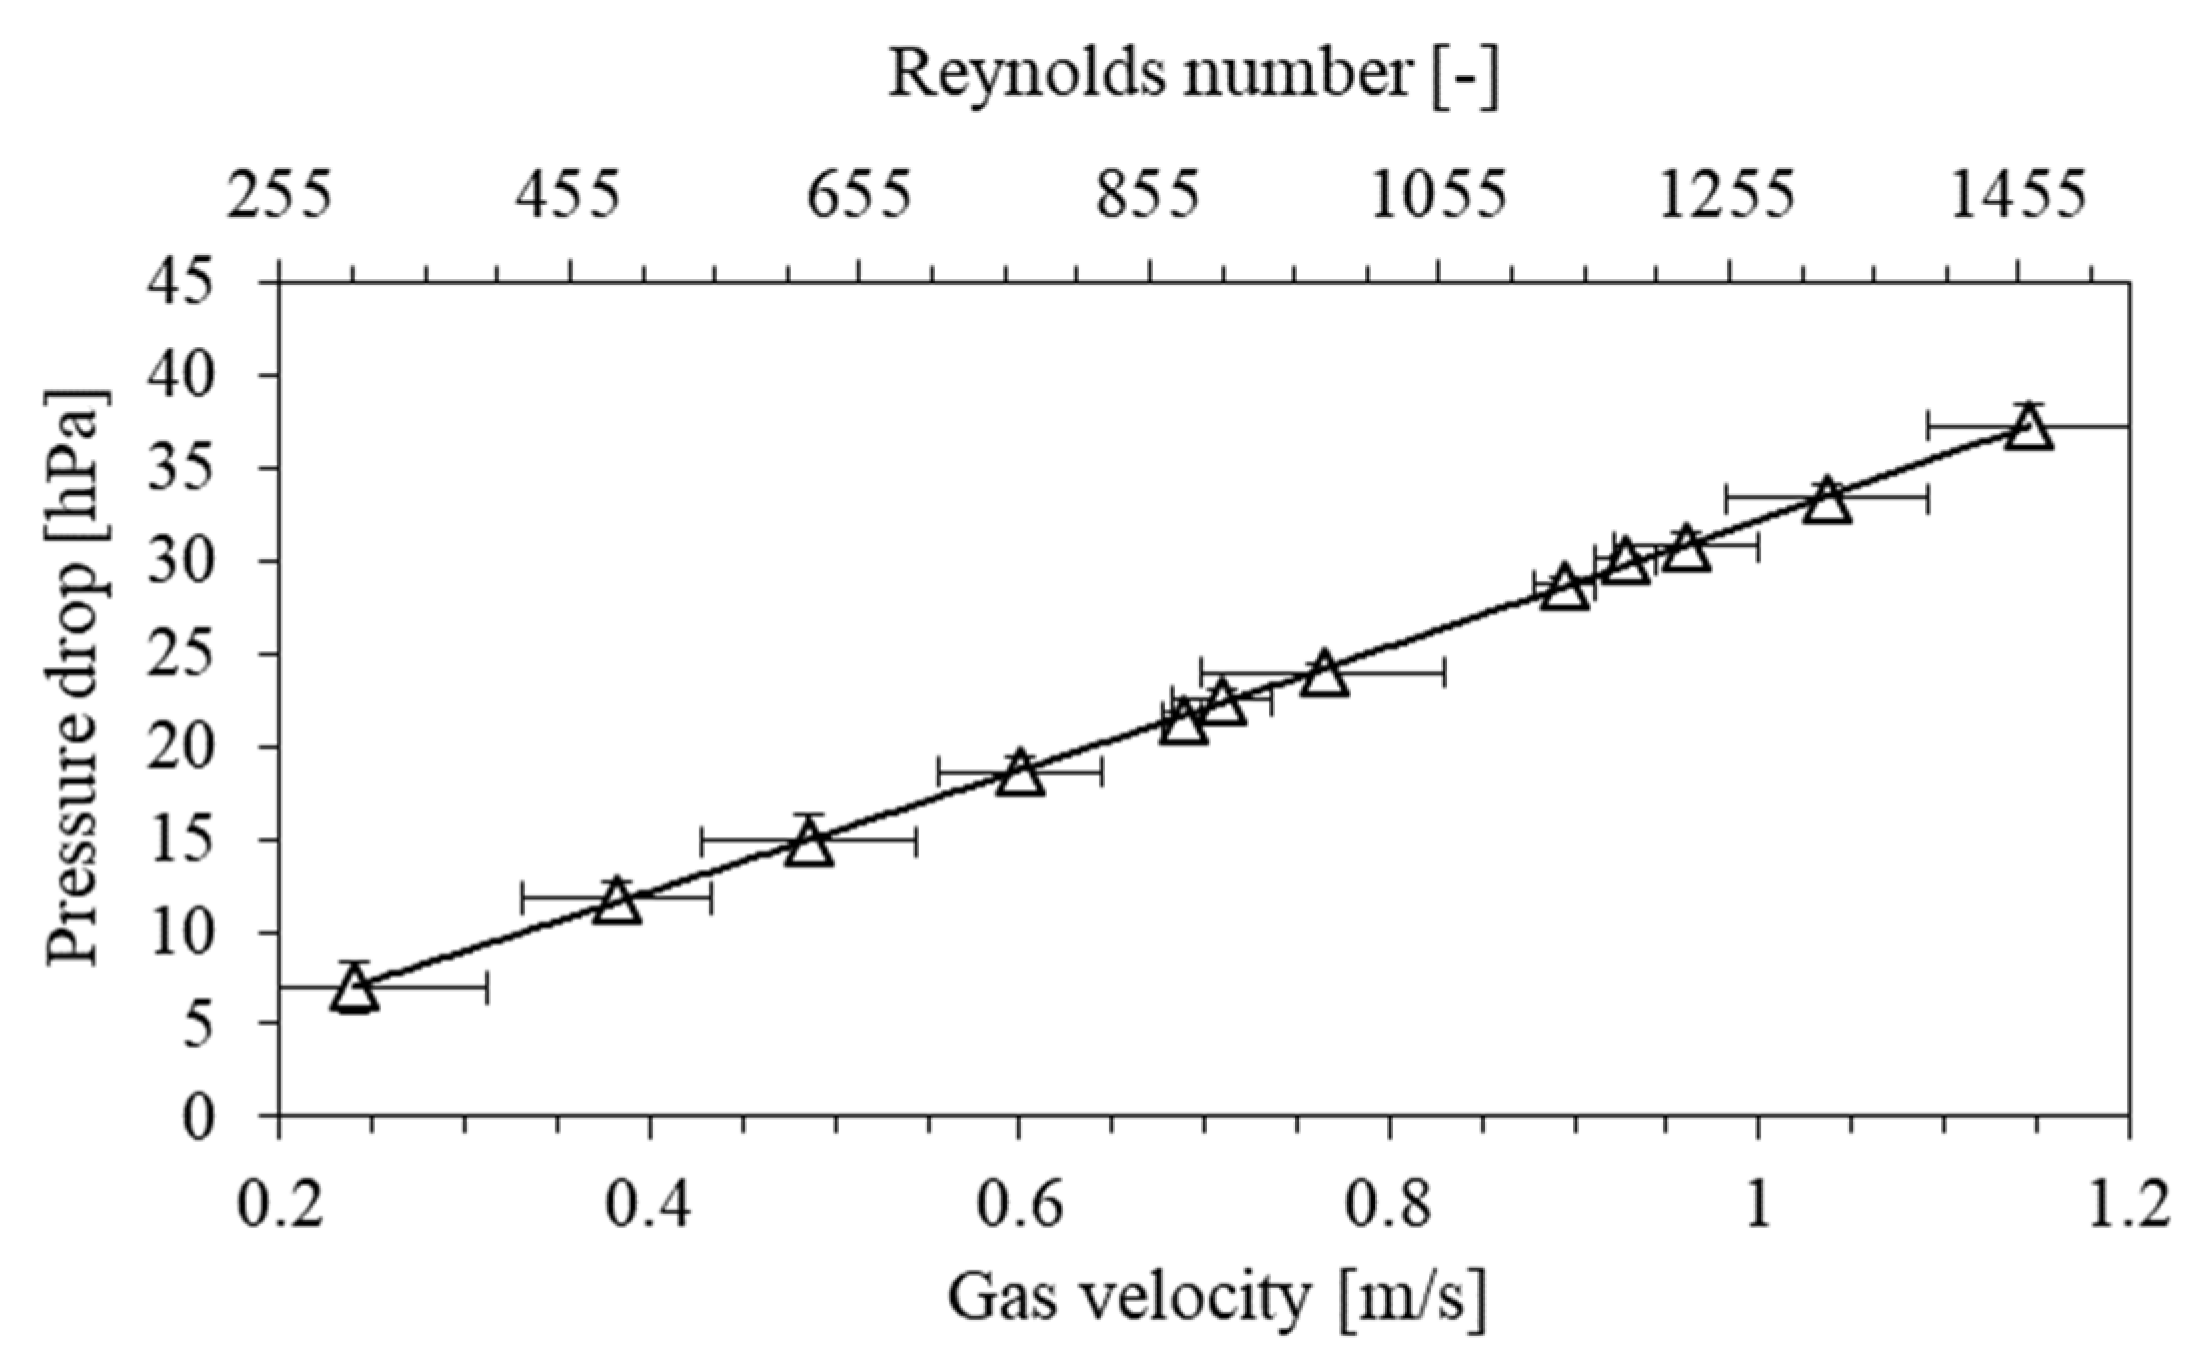
The pressure drop across the nanofibrous filter vs. air velocity in the channel is shown in Figure 8. The pressure drop on the nanofibrous filter changes linearly with the air velocity. The upper auxiliary scale is the Reynolds number determined for the same gas velocity as that of abscissa. The Reynolds number for the channel has been determined from the following equation:
Re = ρu0D/η
in which ρ is the air density, u0 is the mean air velocity in the channel, D is the hydraulic diameter of the channel, and η is the air dynamic viscosity. The hydraulic diameter of the channel was determined from the equation D = 4S/L, where S is the area of the cross section of the channel, L = 4a is the perimeter of the channel, and a is the width of the side wall of the channel of the square cross section.

3. Results

The flow velocity field is determined by the PIV method by the measurement of the displacement of seed particles. Two consecutive positions of the particles in a given time interval are compared from the images recorded by a camera. The recorded images taken from the area of the channel illuminated by the laser-sheet light are divided into several separate computational areas, and their displacement is determined in each such area using a numerical cross-correlation procedure. The time-averaged displacement of seed particles within a single computational area is taken as the maximum of the displacement spectrum function. The particle velocity in the computational area is calculated from the following equation:
V = s t ,
where V is the velocity of the seed particles in the considered computational area, s is the time-averaged displacement of the seed particles in the two images, and t is the time interval between the two images.
The plane laser sheet was produced by two coupled twin Nd-YAG lasers with a wavelength of λ = 532 nm (the second harmonic), which generates two light pulses shifted by the t time interval. The optical system was equipped with a controllable attenuator in order to adjust the output power of the laser beam. The circular beam obtained at the laser output was converted into a laser plane sheet of about 1 mm thickness by a cylindrical lens. The laser sheet illuminated the measuring channel along the channel length, perpendicular to the plane of the nanofibrous filter (cf. Figure 5). Images of the seed particles in the laser plane were recorded by a FlowSense M2 CCD camera with a matrix of 1186 × 1600 pixels. The recorded images were transmitted to a PC with DANTEC’s Dynamic Studio v. 3.31 for analyzing the velocity fields in two dimensions. In the measurements of a two-dimensional velocity field, only one CCD camera was used, taking the images of the channel before and after the nanofibrous filter.

3.1. Metal Mesh

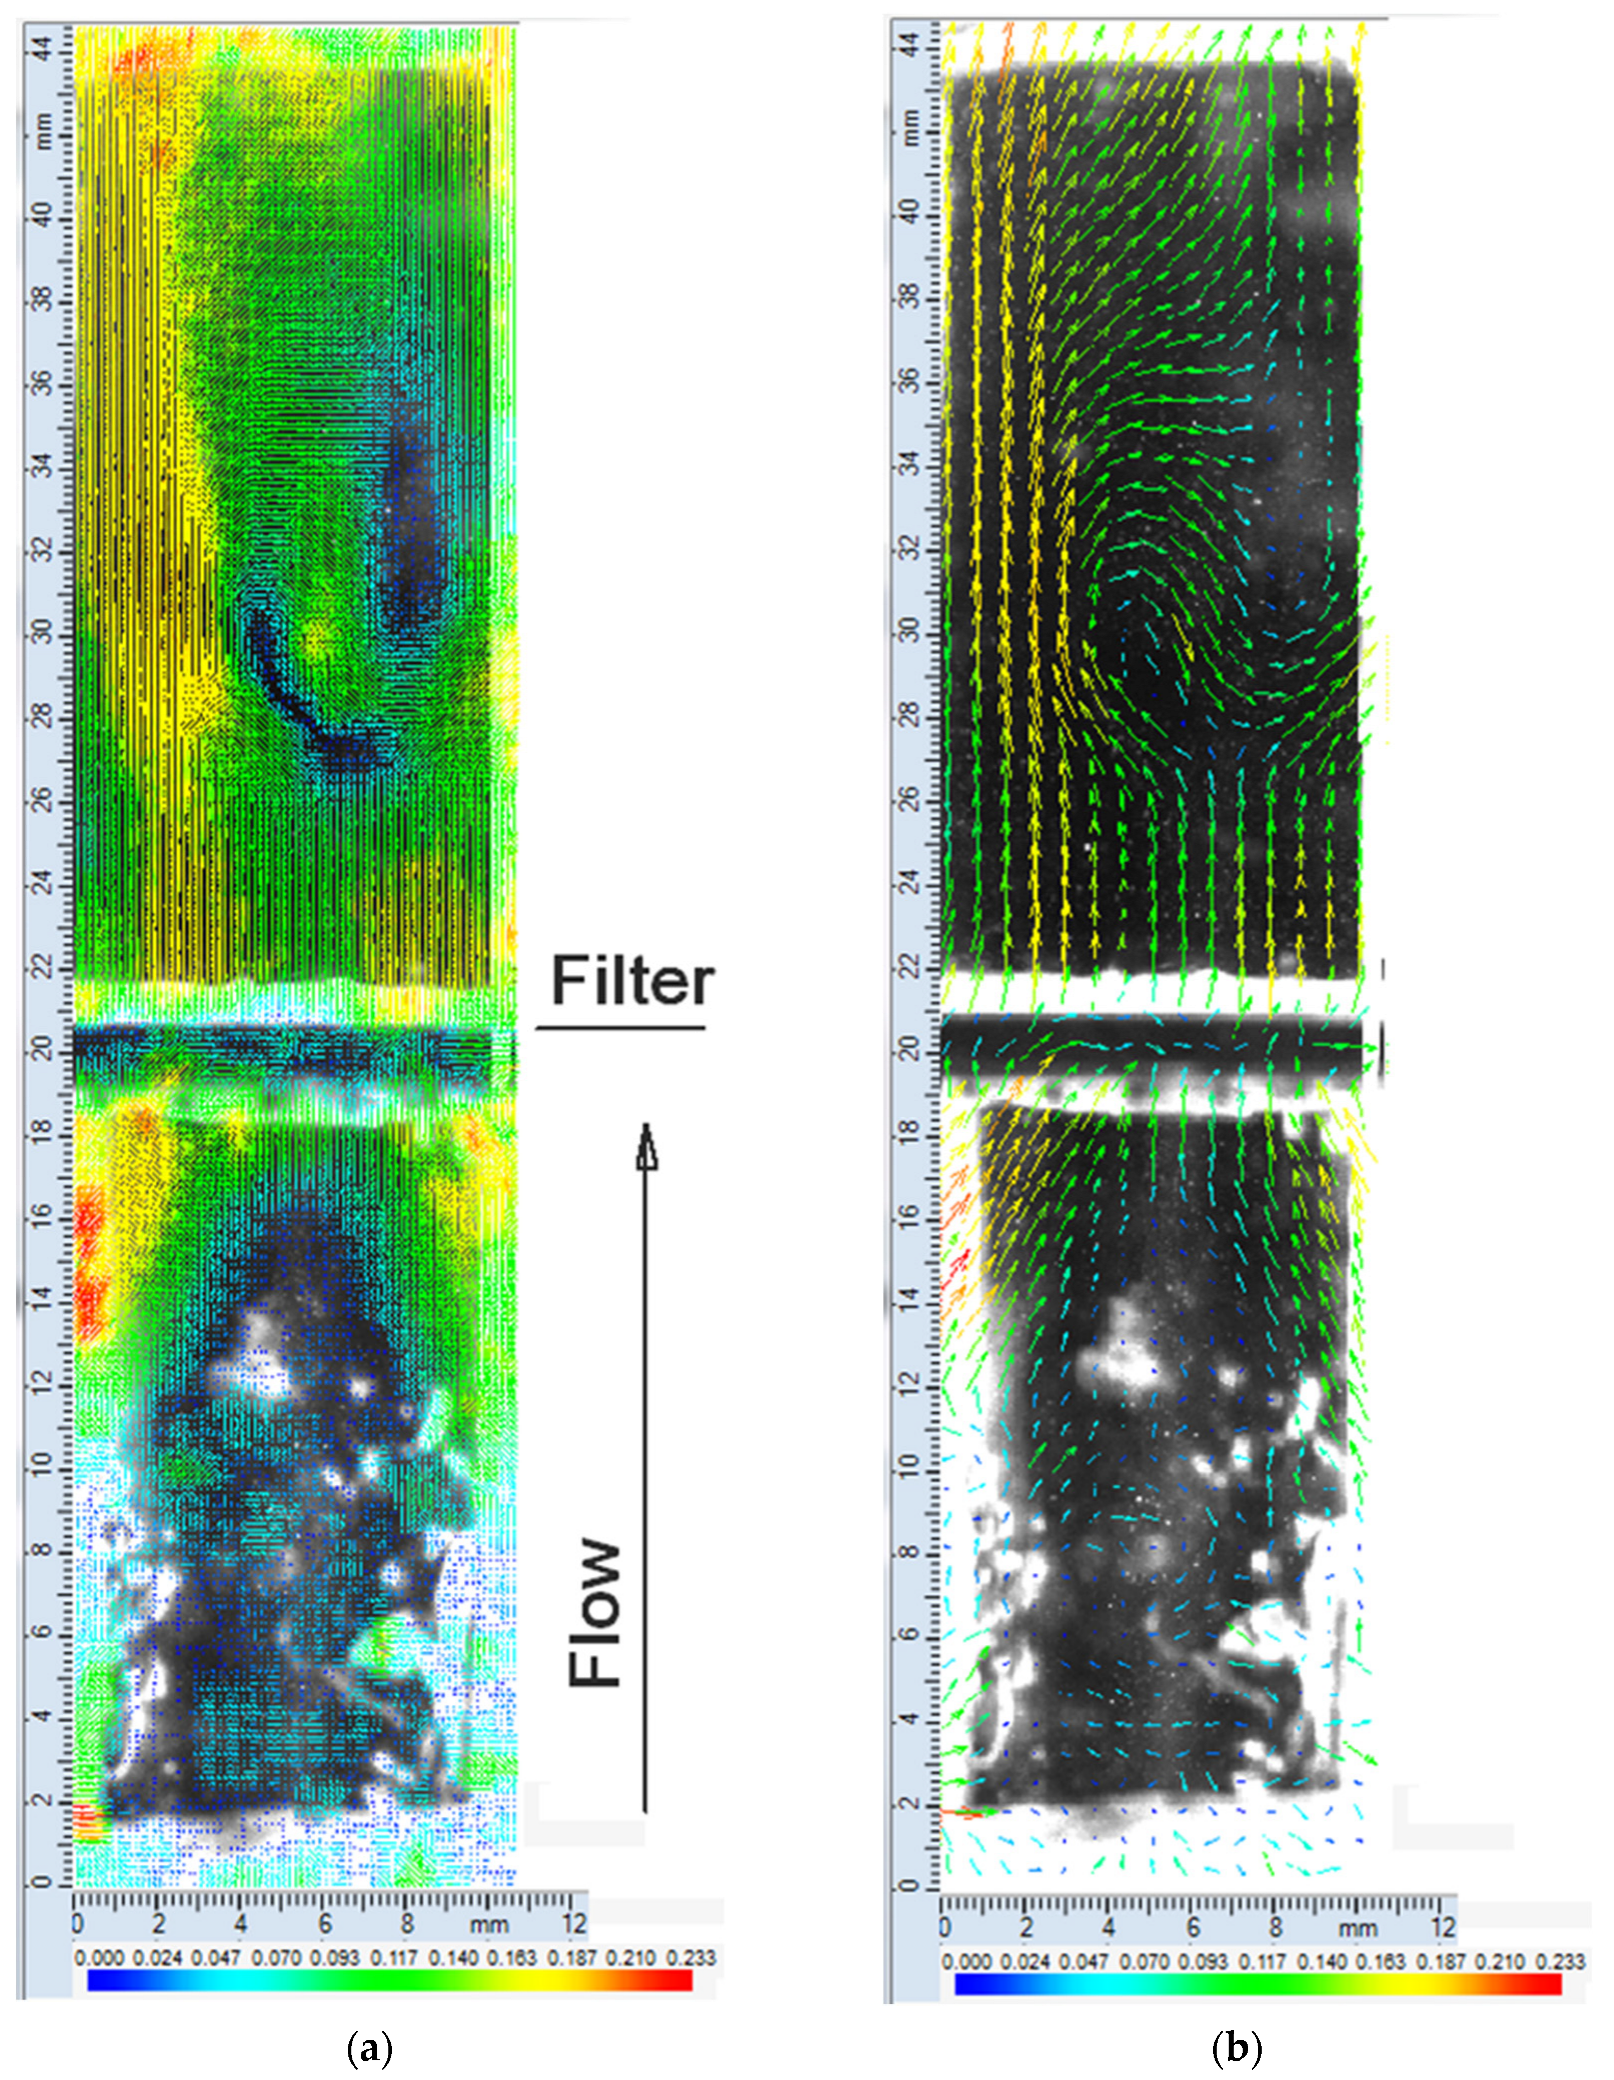
Figure 9 shows an image of the time-averaged velocity field in the channel with the metal mesh frame, without the nanofibrous filter. These measurements were carried out for reference. The velocity field in Figure 9a is the magnitude of the velocity vector in the color scale. The color scale bar is at the bottom of the diagram. Figure 9b shows the velocity field in vector representation. The measurements were carried out for a volume flow rate of 162 L/h. The time-averaged flow velocity in the channel was about 0.2 m/s, and the Reynolds number for this velocity is Re = 212, at normal temperature and pressure.
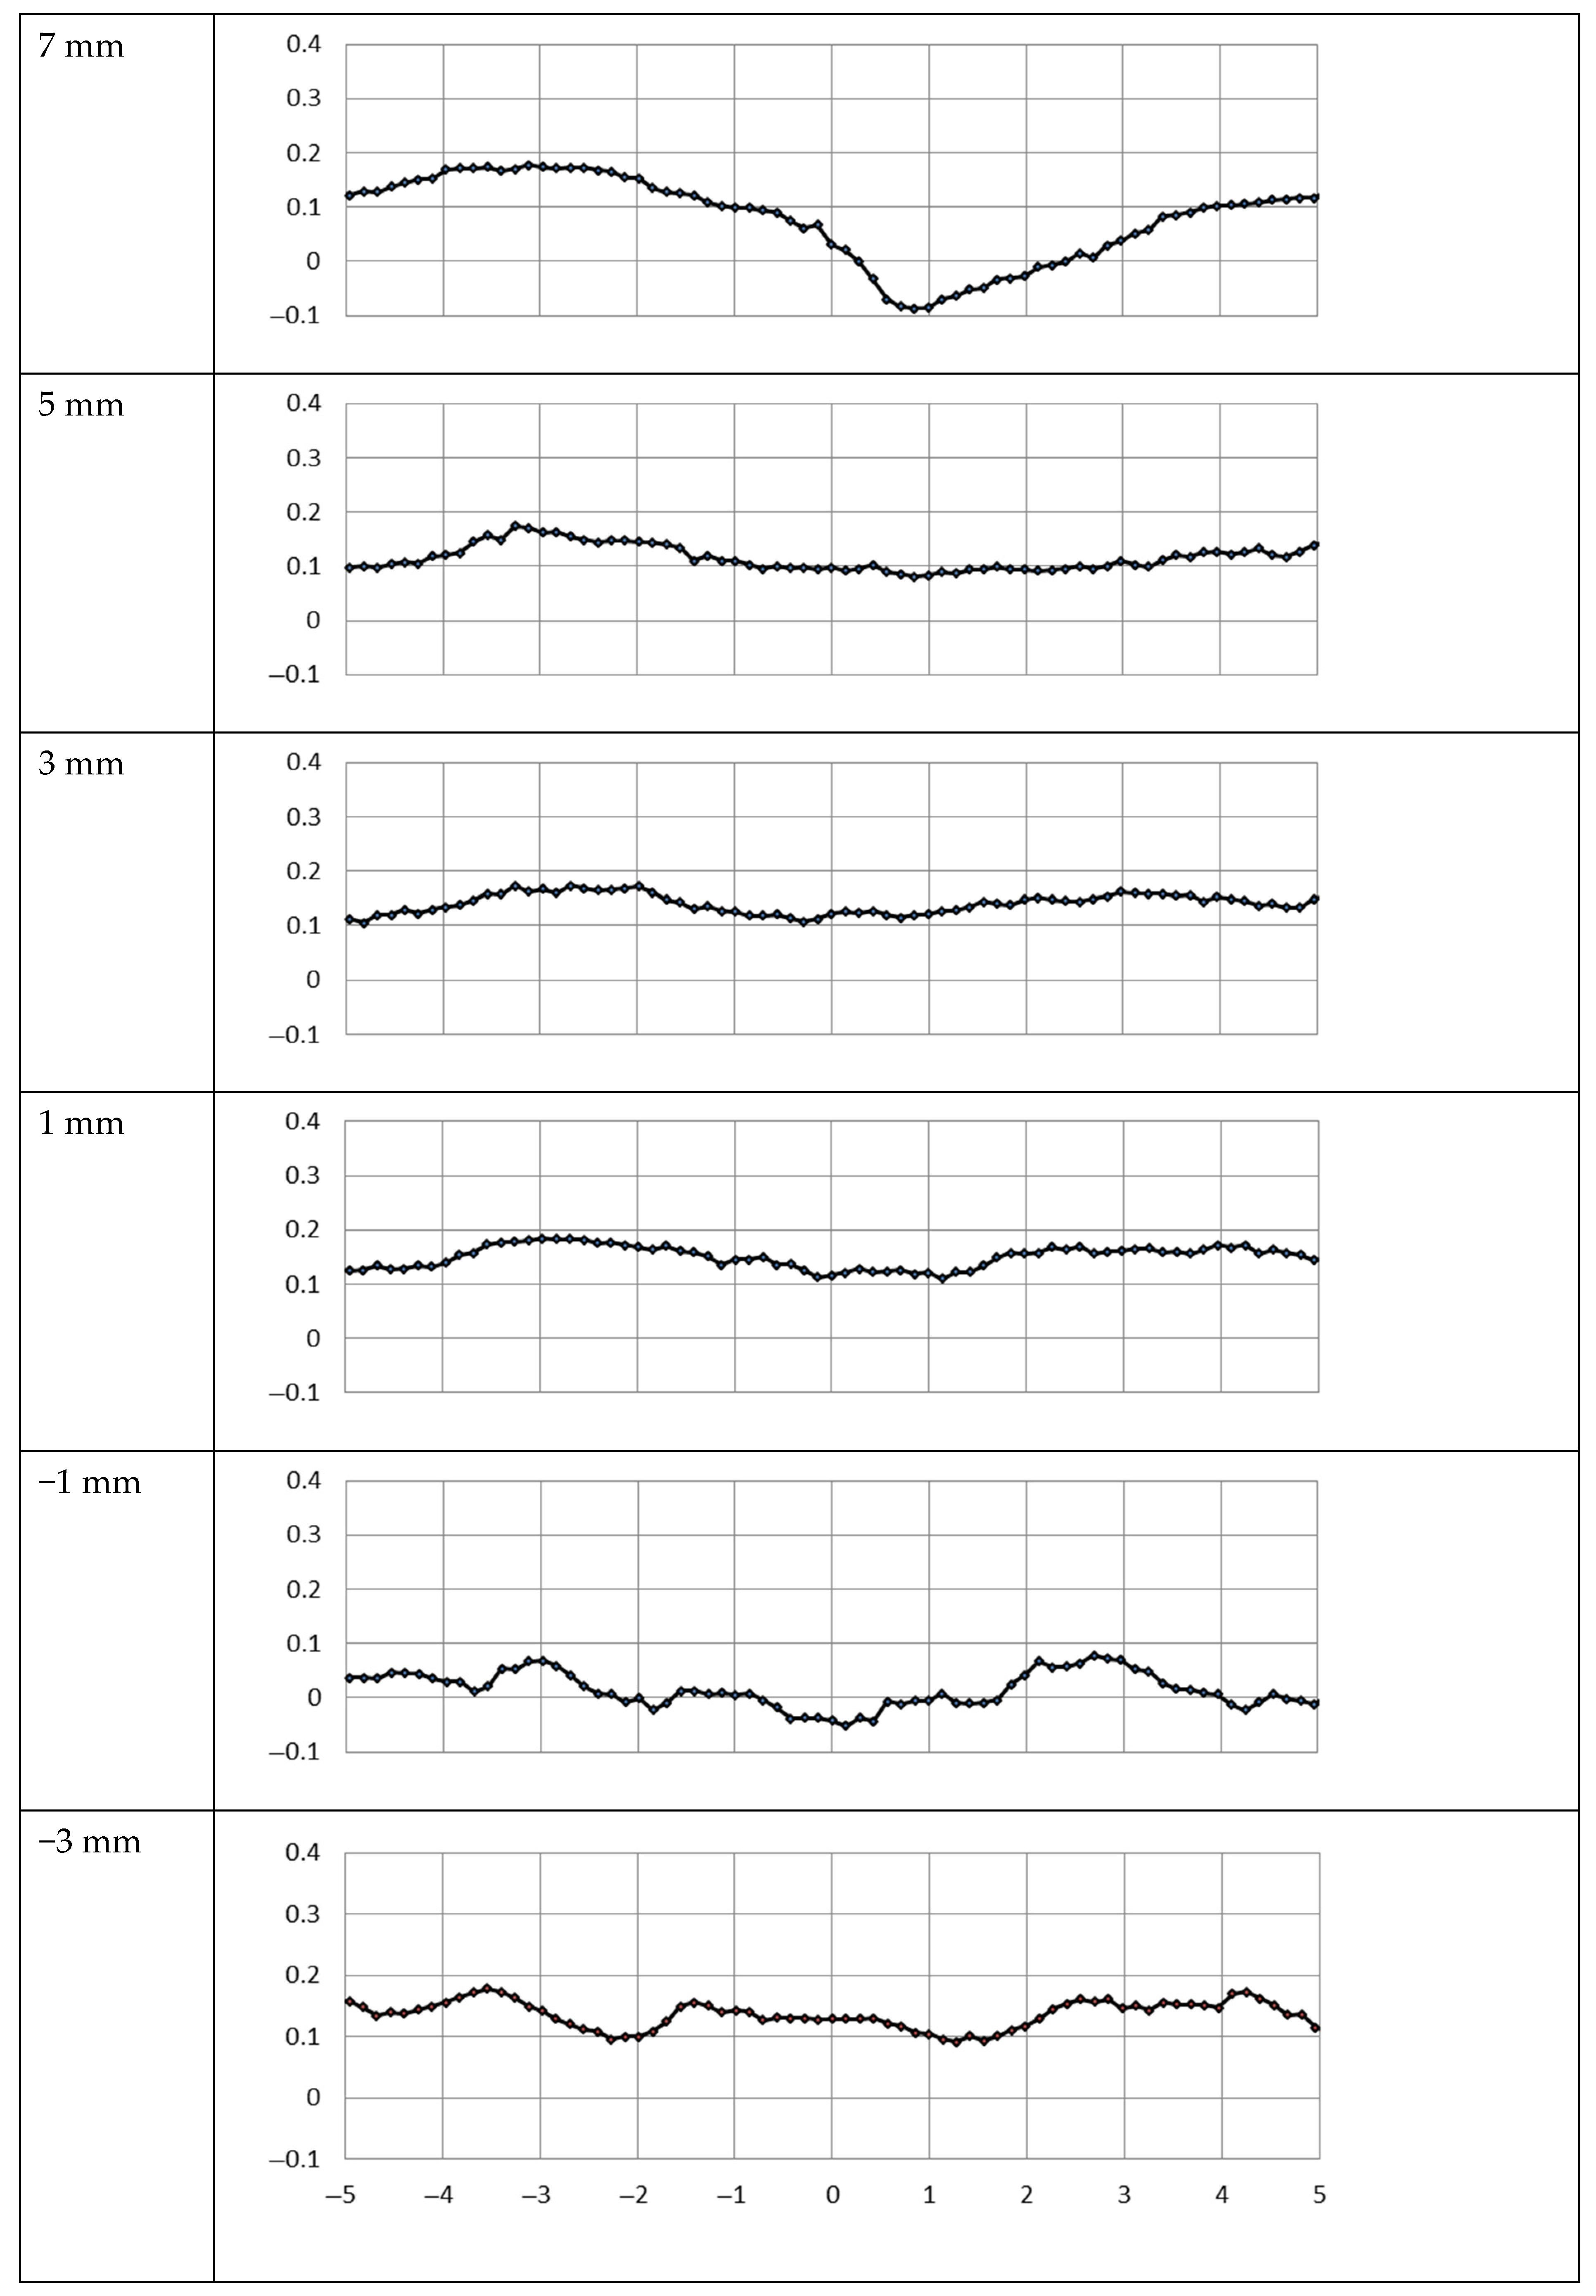
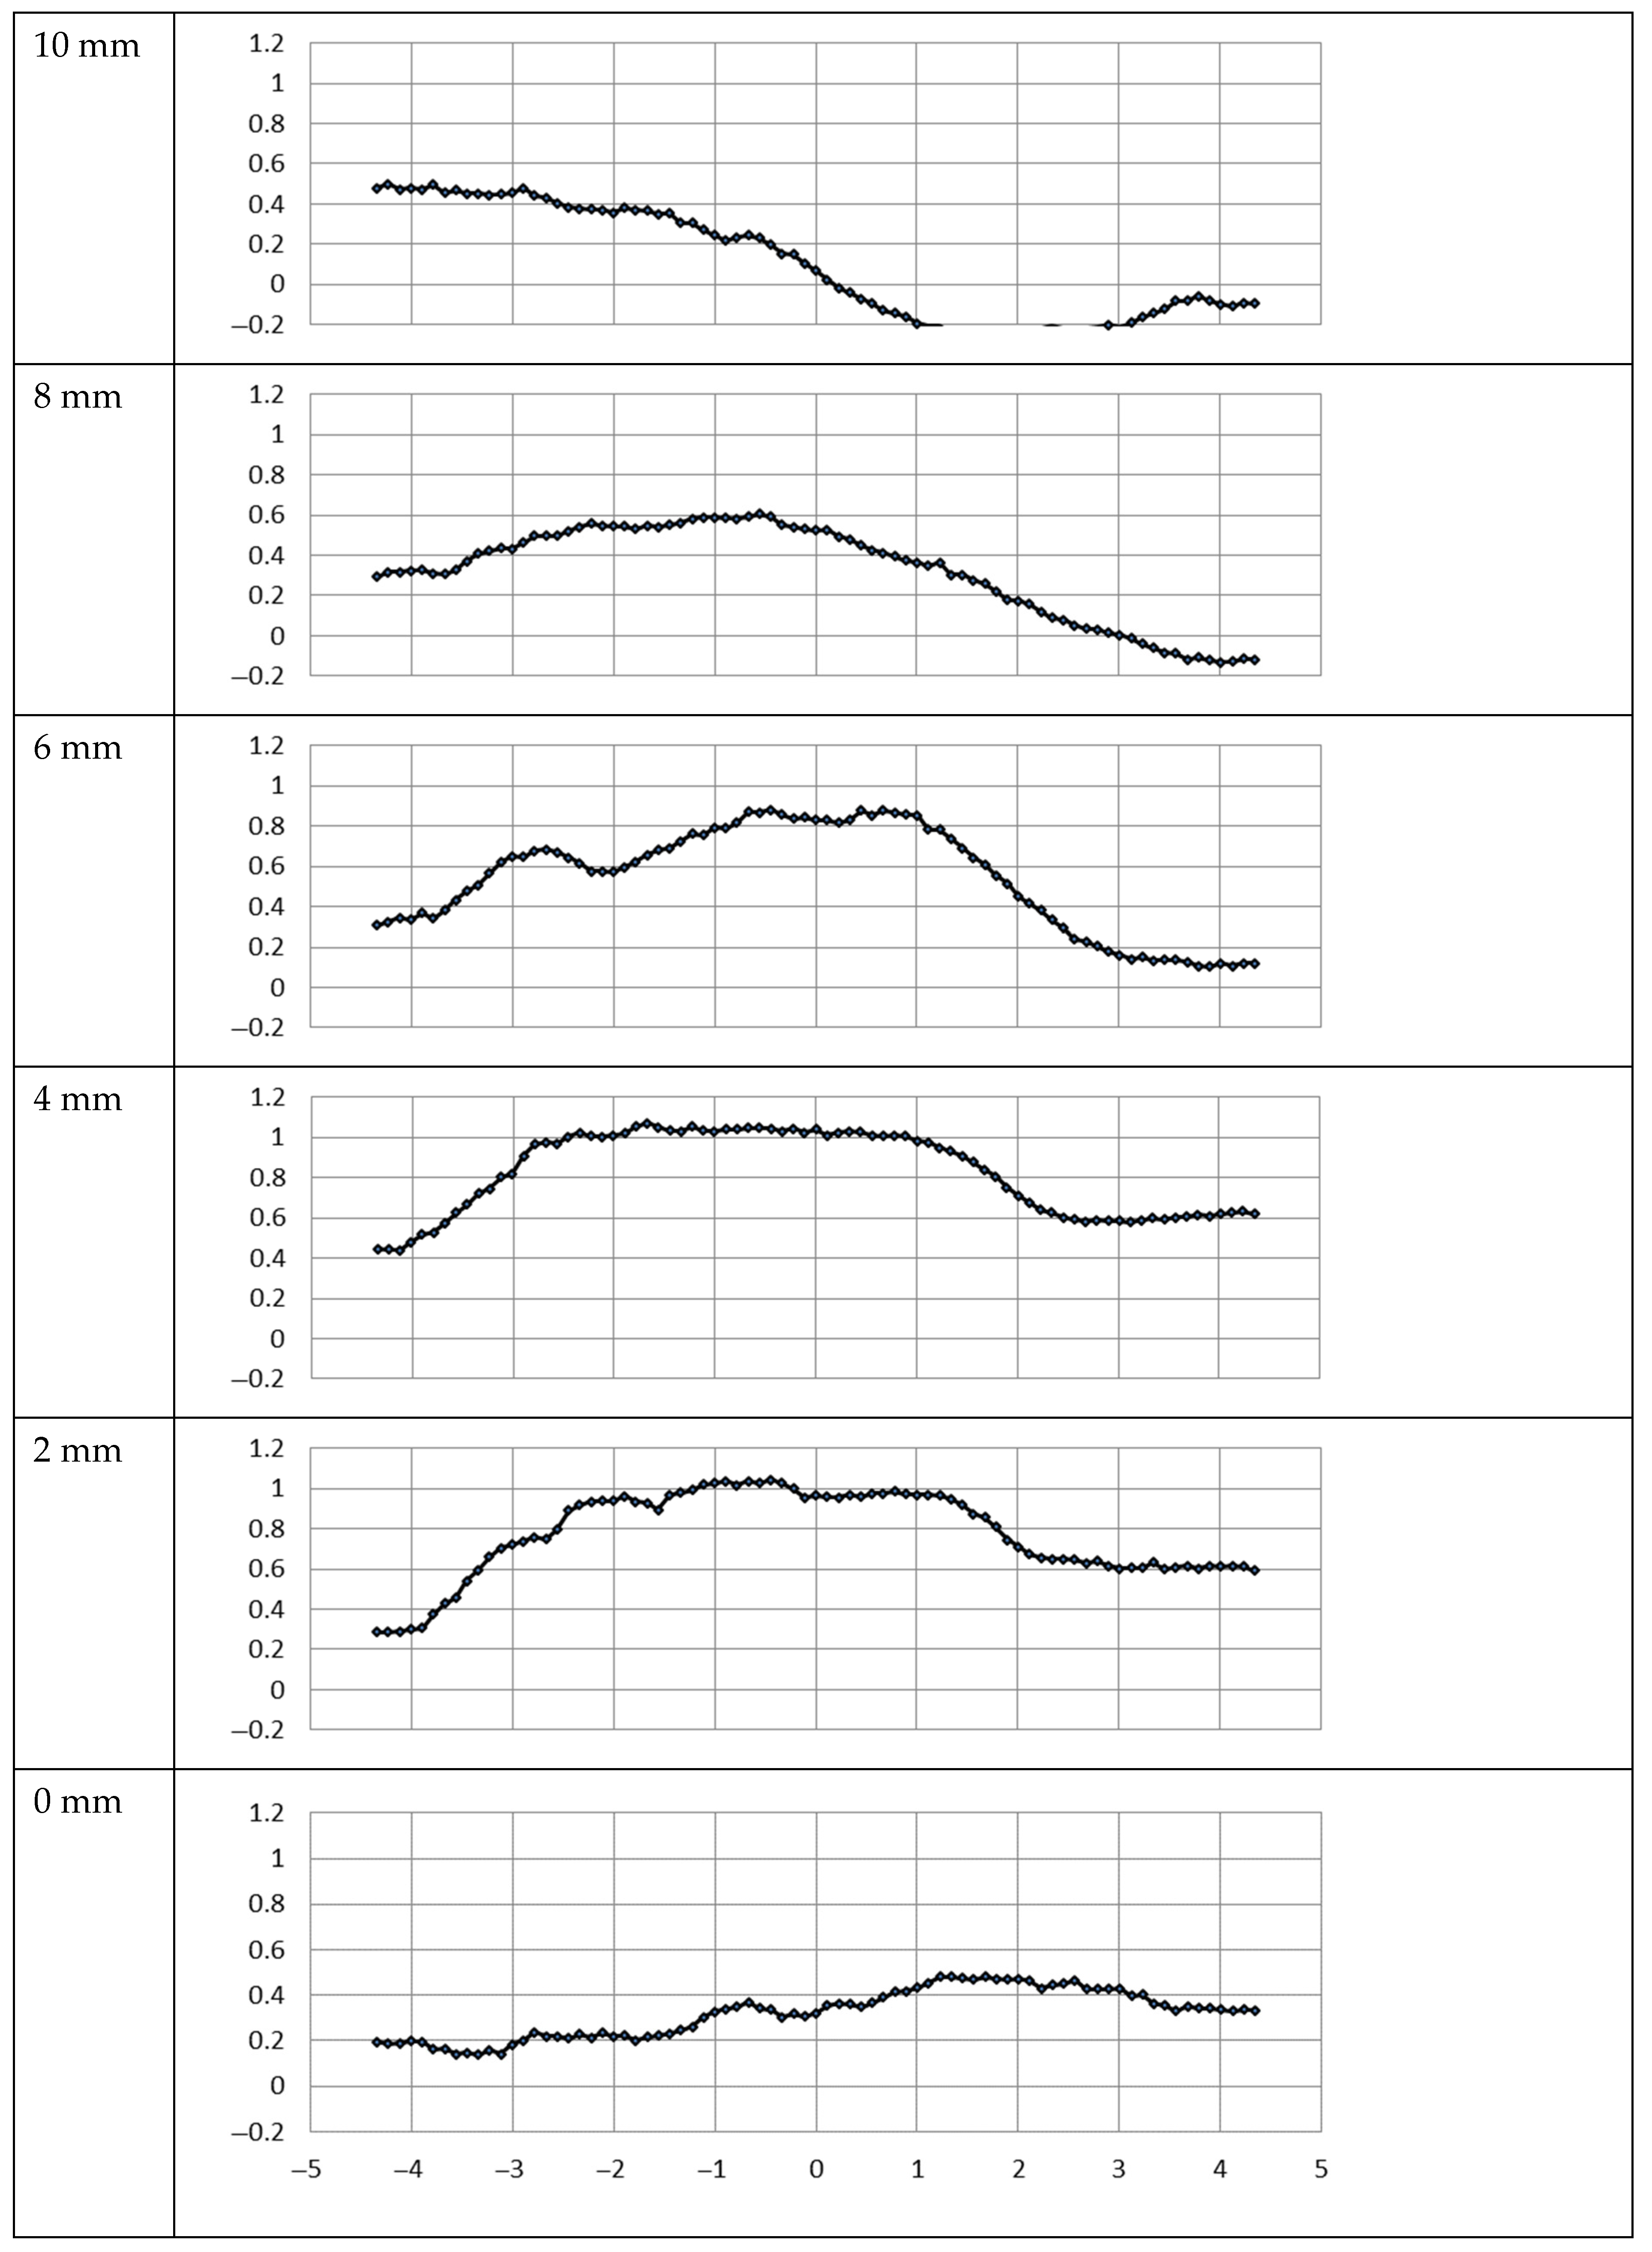
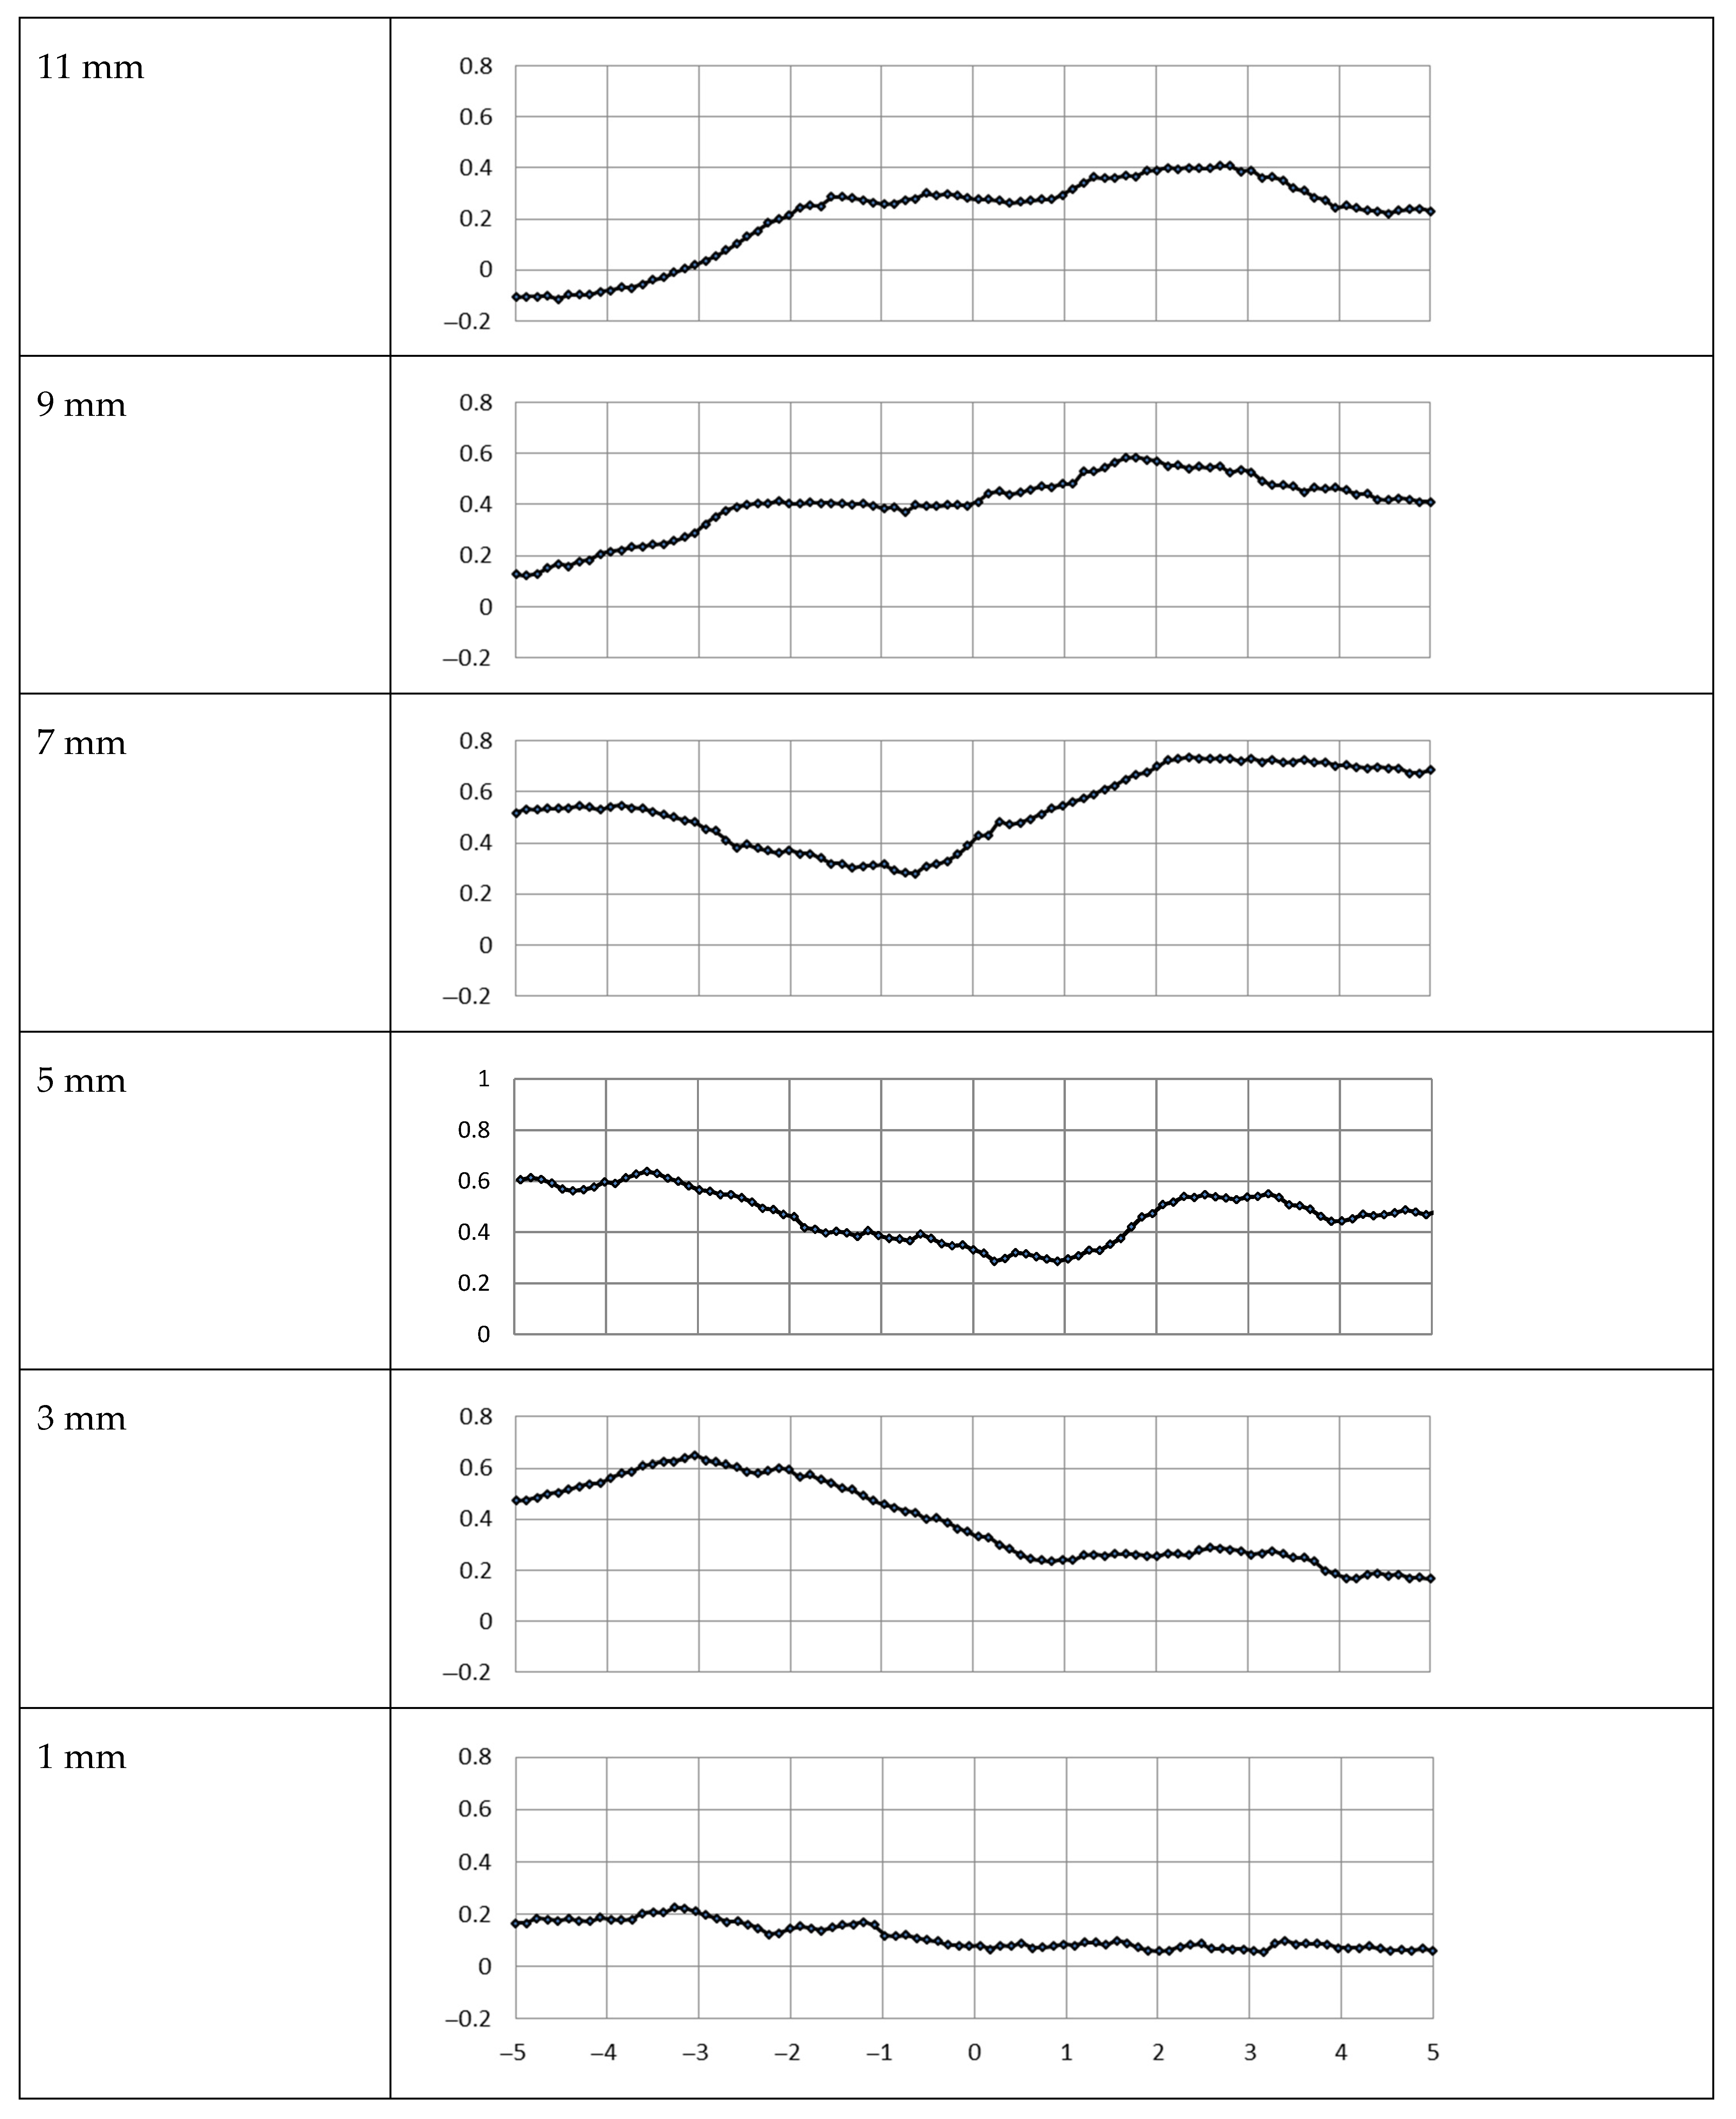
Figure 10 presents the velocity vector component perpendicular to the plane of the metal mesh, and at six cross sections, at different distances from the mesh plane, determined from the flow field shown in Figure 9. The distribution of the component of the velocity vector shown in Figure 10, at distances to 3 mm downstream of the mesh upwards, is slightly uneven, and varies between about 0.1 and 0.2 m/s. At a distance of 5 mm, this component of the velocity vector becomes more uniform, and is about 0.15 m/s, but it starts to vary from −0.1 to 0.2 m/s at a distance of 7 mm due to a large vortex produced in the channel. Although the Reynolds number in this case is Re = 212, which is much lower than that for which the turbulent flow occurs (usually Re = 2340), a single vortex can be noticed at a distance of about 1/3 of the hydraulic diameter of the channel downstream of the mesh (>5 mm).
The flow field upstream of the mesh is also turbulent, but this turbulence results from the differences in the hydraulic diameter of the channel and the inlet connector. At the cross section close to the mesh (−1 mm distance), the velocity vector was measured to be positive and negative, which indicates the existence of small local flow vortices. Small-scale vortices of a size of double the pitch of the mesh can also be noticed upstream of the mesh in Figure 9a. Although the aerosol flow in the channel is turbulent at the inlet, the flow downstream of the metal mesh is stabilized, and the vortices are suppressed close to the mesh, which is confirmed by Figure 9b.

3.2. PVDF Filter

Figure 11 shows images of the time-averaged velocity field for a flow rate in the channel of 960 L/h with the metal mesh with deposited PVDF nanofibrous filter. The time averaged velocity field was determined from about 50 individual measurements. Figure 12 presents the magnitude of velocity vector component perpendicular to the plane of mesh at different distances from the mesh downstream, determined from the flow field shown in Figure 11. Similarly, Figure 13 and Figure 14 show images of the time-averaged velocity field for a flow rate in the channel of 650 L/h and the magnitude of velocity vector, respectively.
Figure 11 shows the velocity field in the channel for the volume flow rate of air through the channel of 960 L/h. The time-averaged flow velocity in the channel determined from this flow rate was 1.19 m/s, and the Reynolds number about Re = 1260. The velocity vectors of seed particles downstream of the filter, are perpendicular to the plane of the filter and are almost symmetrical to the mid plane of the channel. The maximum velocity of about 1.1 m/s was at the center of the channel. However, at a distance of about of 1/2 of hydraulic diameter of the channel a vortex flow was formed due to small differences in the velocities caused probably by the inhomogeneity in the filter structure (thickness and porosity), and its clogging.
Figure 12 shows the distribution of velocity vector component perpendicular to the filter plane in the channel at different cross sections, determined from the velocity field shown in Figure 11. The distribution of vertical component of velocity vector at these cross sections, close to the filter plane, was not uniform, but was distorted by the presence of the filter. Downstream of the filter, the component of velocity vector perpendicular to the filter plane reaches a value of about 1 m/s. in the mid-plane of the channel, and decreases to 0.2–0.3 m/s close to the channel walls. At a distance of about 8 mm from the filter, a negative velocity vector occurs due to the generated vortices.
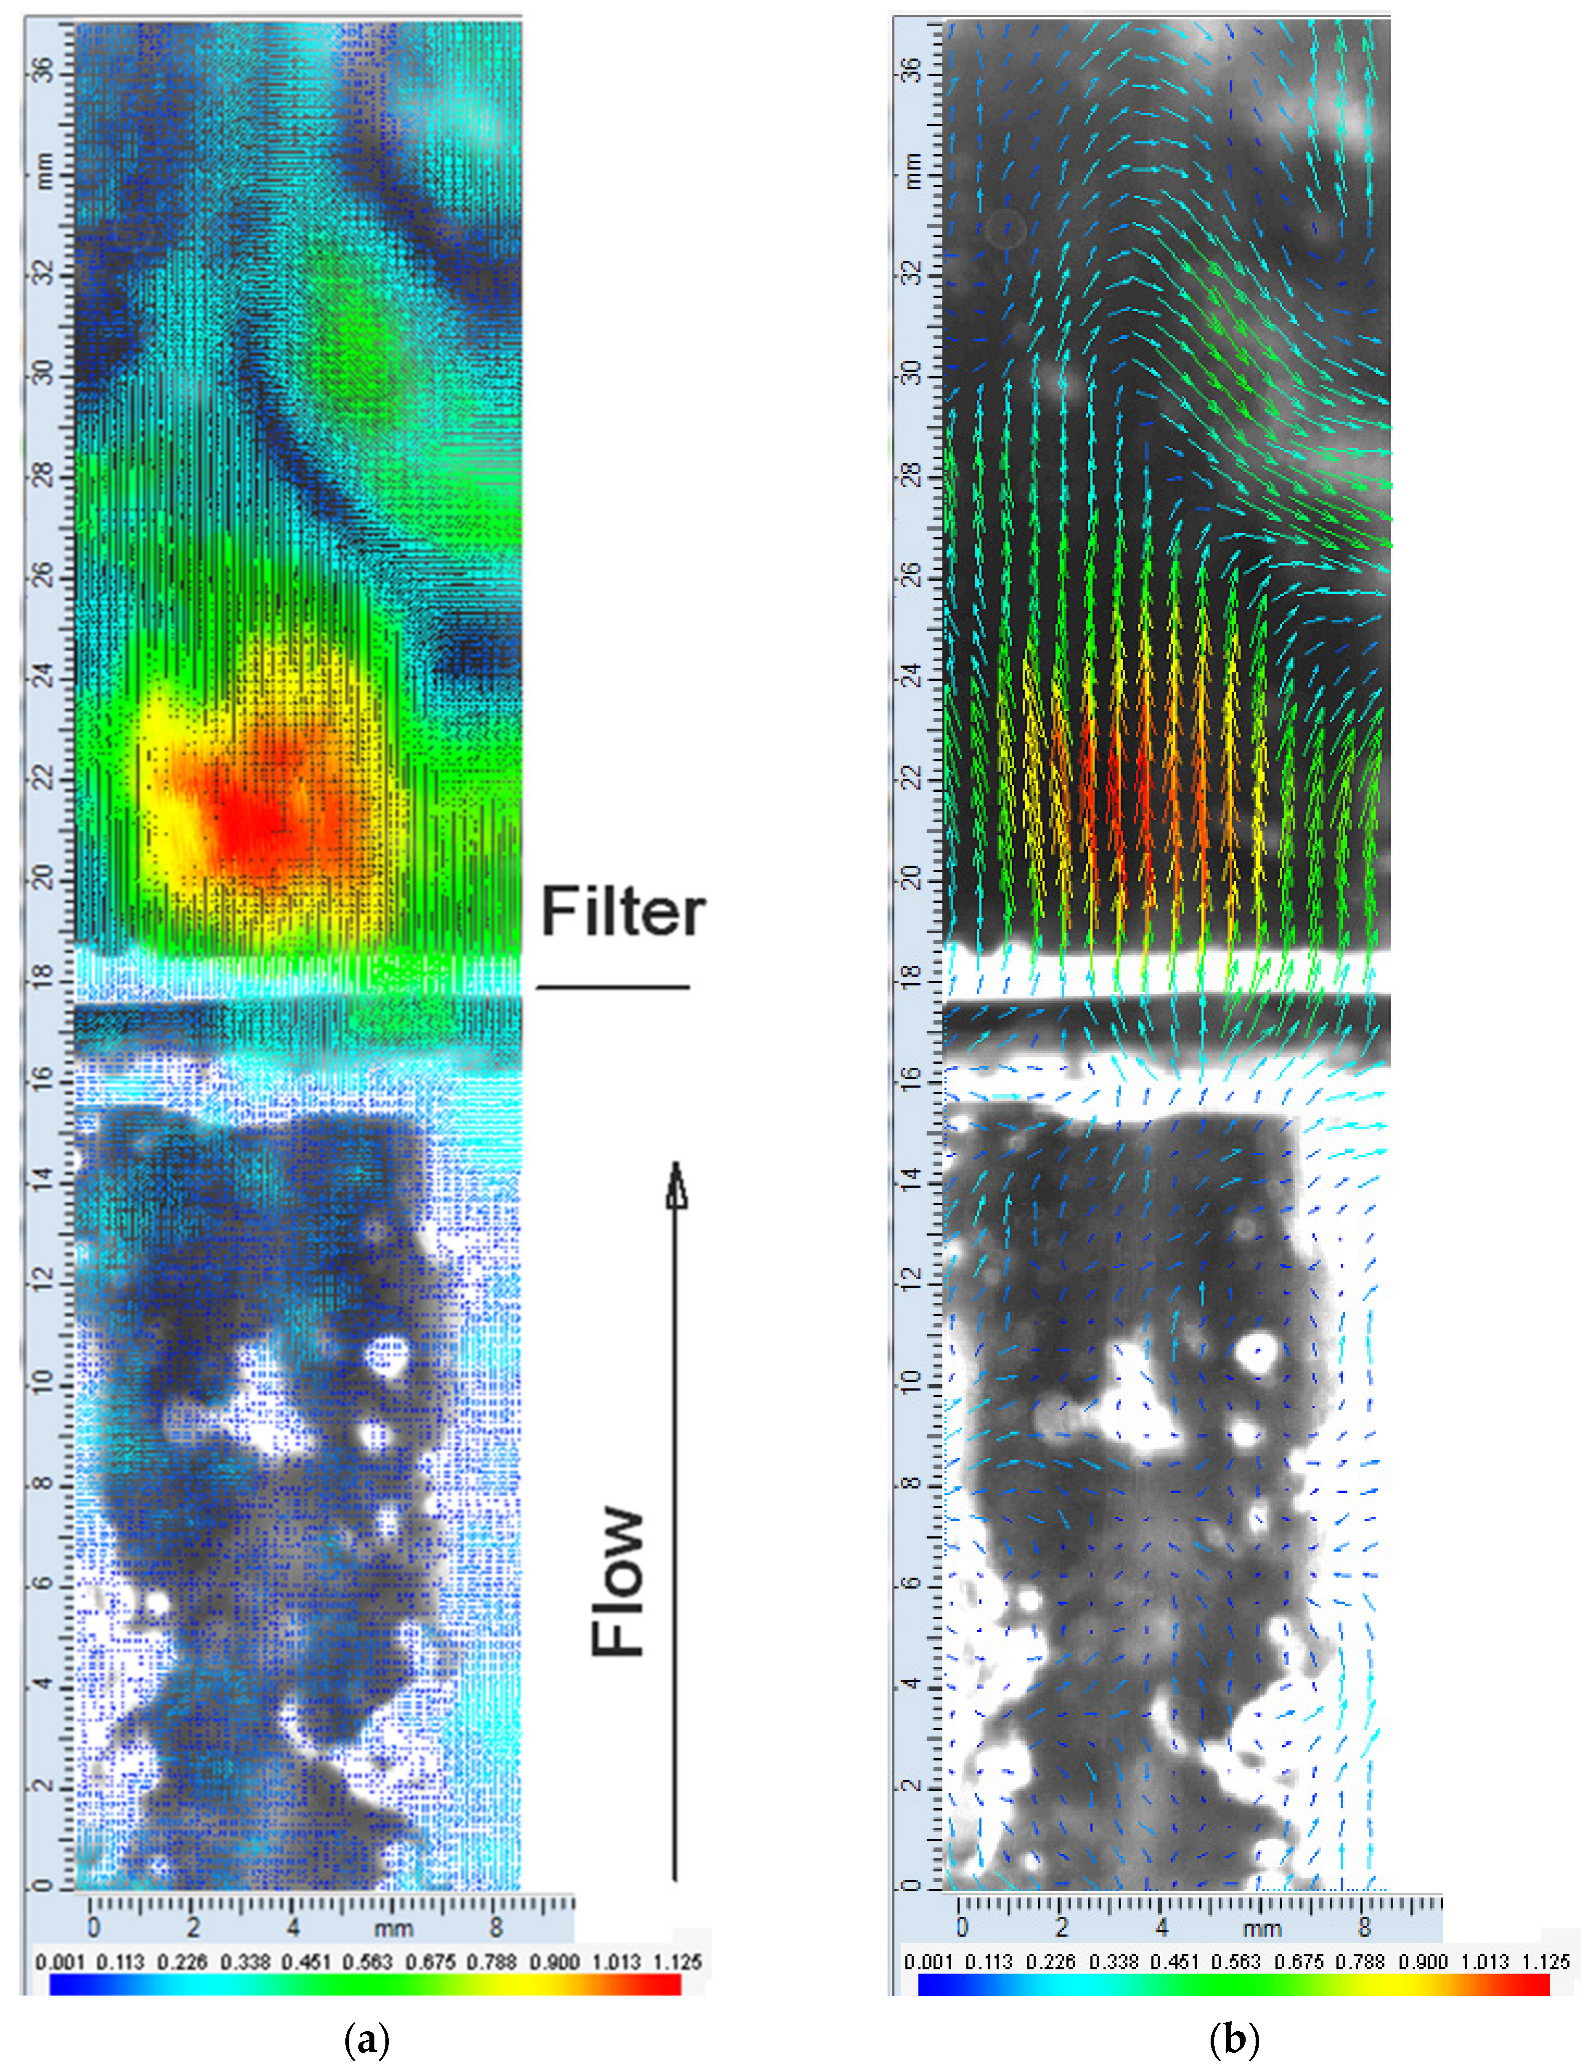
Figure 13 shows the velocity field in the channel for a volume flow rate of air through the channel of 650 L/h. The time-averaged flow velocity in the channel was about 0.8 m/s, and the Reynolds number Re = 853. The velocity vectors downstream of the filter close to its plane are perpendicular to the plane. The vortices in the channel are generated at a distance of about 2/3 of hydraulic diameter from the filter plane. The vortices are generated due to non-uniformity of the velocity vector magnitude at the filter outlet caused by filter inhomogeneity and non-uniform filter clogging.
Figure 14 shows the distribution of the velocity vector component perpendicular to the filter plane in the channel at different cross sections determined from the velocity field shown in Figure 13. The distribution of this component of the velocity vector at different cross sections is not distributed uniformly at any distance from the filter. The maximal magnitude of the velocity vector component perpendicular to the filter plane at the center cross section reaches a value of about 0.73 m/s.

4. Discussion

The results of the measurements of the flow velocity field in a minichannel downstream of the nanofibrous filter show that the non-uniformity of the velocity vector profile downstream of the filter can occur due to turbulent vortices generated in the channel, also for low Reynolds numbers. This effect can be caused by the inhomogeneity of the nanofibrous filter, i.e., the nonuniform thickness of the filter and the non-even distribution of the pores in it. The second cause of turbulence can be the presence of a relatively large boundary layer compared to the channel cross section. Due to the small cross section of the channel, the boundary layer can be estimated to be about 20% of the channel width. Such a large area occupied by the boundary layer can lead to a turbulence downstream of the nanofibrous filter, besides a low Reynolds number, which was estimated to be smaller than 1300, for the investigated flow velocities. These results indicate that it is necessary to take into account the problem of the boundary layer when designing the nanofibrous filters in a minichannel. In order to obtain a more uniform gas flow in the channel, the produced nonwoven nanofibrous filter should be uniform over its entire area, which requires further research on improving this technology.
The inhomogeneity of the fibrous filter structure, which is a natural effect of the production process, was investigated by Podgórski et al. [93]. The authors observed a local higher particle penetration in the zones of the higher porosity of the filter. From their theoretical considerations and experiments resulted that the penetration can be smaller for nanofibrous filter media. The effect of the inhomogeneity of the fibrous filter structure was recently investigated by Azimian et al. [78]. The numerical simulations carried out for the nanofibrous filter with a mean fiber diameter of about 300 nm, 42 µm filter thickness, and 93% porosity showed that the gas flow velocity through the filter medium and at its outlet had high non-uniformity. There were regions in the filter in which the local velocity magnitude was about four times larger than the mean velocity in the channel. Investigations of the inhomogeneity of electrospun fibers were carried out, for example, by Bilek and Sidlof in 2011 [94] or Bilek and Hruza, 2015 [95], but those results refer to water filtration. This problem will require further investigation. Another problem is the reduction in the random motion of particles in minichannels, which is particularly important in liquid flowing in a microchannel. Such a motion, also known as Gaussian noise, had been considered by Agrawal [96] for a channel with Y and T junctions. This noise distorts the information about the flow of conveying liquid. The image filtration can improve the quality of measurements.
In the current paper, the effect of filter inhomogeneity on local differences in the flow velocity vector was observed using the PIV measurements. This inhomogeneity caused a turbulence in the whole cross section of the minichannel downstream of the nanofibrous filter, besides a low Reynolds number (<1300).
A similar non-uniform flow velocity in front and downstream of commercial pleated filters in large channels was observed by Kang et al. [86], which also used the PIV method. A flow of smaller non-uniformity was obtained at larger distances from the filter; however, a certain flow recirculation was observed directly behind a pleat, for all investigated pleated media, regardless of the pleat geometry.

5. Conclusions

The paper presents the results of investigations of the flow velocity field in a minichannel of a cross section of 15 mm × 15 mm with an inserted nanofibrous filter, determined by the PIV method. The nonwoven fibrous filter was produced from PVDF solution by the electrospinning method, and was deposited on a substrate made of thin steel wire mesh, with a wire diameter of 0.2 mm. The flow velocity field was determined using DEHS seed particles dispersed to the flowing air at the channel inlet. The mean diameter of seed particles was about 1 µm. The gas face velocity in the channel was <1.2 m/s, and the Reynolds numbers for the channel, Re < 1300.
The results of the measurements of velocity field distribution in the area behind the nanofibrous filter show the occurrence of a relatively large area of turbulence, which can be caused by a wide boundary layer at the channel walls, compared to a small channel cross section, which can interact with non-uniform gas velocity in different filter areas downstream, caused by the inhomogeneity of the nanofibrous filter structure (non-uniform thickness and differences in the pore size). The differences in the pore size cause also the differences in particle penetration and pore clogging. It can be concluded that making a nanofibrous filter of uniform distribution of nanofibers and pore size is crucial from an application point of view to ensure a uniform gas flow. In the case of nanofibrous filters, this goal can be achieved by using a multi-nozzle electrospinning system to produce a more uniform nonwoven fabric over its entire area. This goal requires, however, further laboratory research.
The future research should be directed towards reducing the pressure drop across the nanofibrous filter by keeping high filtration efficiency. This can be achieved by a detailed analysis of the mechanisms governing the particles’ deposition onto nanofibers, including also the electrostatic effects due to fibers and/or particles’ triboelectrification when they are conveyed by the gas. A valuable extension of the experimental results would be numerical modeling of the downstream flow of gas after a nanofibrous filter of a non-uniform structure. A separate practical problem will be the filter regeneration after its clogging by nanoparticles, which is a difficult task due to the mechanical fragileness of nanofibers.

Author Contributions

All authors contributed to the study conception and design. Experimental investigation and analysis were performed by A.K., I.W.-Ś. and K.R., the supervision by A.K. Data curing was carried out by A.K., I.W.-Ś., K.R. and A.J. The first draft of the manuscript was written by A.K., I.W.-Ś. and K.R. The final version of the manuscript was edited by A.K. and A.J. The resources were provided by the Institute. All authors have read and agreed to the published version of the manuscript.

Funding

This research was funded internally by the Institute of Fluid Flow Machinery, Polish Academy of Sciences, within the project No. O1/Z4/T3.

Institutional Review Board Statement

Not applicable.

Informed Consent Statement

Not applicable.

Data Availability Statement

Datasets generated during the current study are available from the corresponding author on reasonable request.

Acknowledgments

The work was carried out at the Institute of Fluid-Flow Machinery of the Polish Academy of Sciences as the statutory work within the project No. O1/Z4/T3.

Conflicts of Interest

The authors declare no conflicts of interest.

References

  1. Afshari, A.; Matson, U.; Ekberg, L.E. Characterization of indoor sources of fine and ultrafine particles: A study conducted in a full-scale chamber. Indoor Air 2005, 15, 141–150. [Google Scholar] [CrossRef]
  2. Wallace, L.; Ott, W. Personal exposure to ultrafine particles. J. Expo. Sci. Environ. Epidemiol. 2011, 21, 20–30. [Google Scholar] [CrossRef]
  3. Buonanno, G.; Stabile, L.; Morawska, L. Personal exposure to ultrafine particles: The influence of time-activity patterns. Sci. Total Environ. 2014, 468–469, 903–907. [Google Scholar] [CrossRef]
  4. Lunden, M.M.; Delp, W.W.; Singer, B.C. Capture efficiency of cooking-related fine and ultrafine particles by residential exhaust hoods. Indoor Air 2015, 25, 45–58. [Google Scholar] [CrossRef] [PubMed]
  5. Hyun, J.; Lee, S.-G.; Hwang, J. Application of corona discharge-generated air ions for filtration of aerosolized virus and inactivation of filtered virus. J. Aerosol Sci. 2017, 107, 31–40. [Google Scholar] [CrossRef]
  6. Abdillah, S.F.I.; Wang, Y.-F. Ambient ultrafine particle (PM0.1): Sources, characteristics, measurements and exposure implications on human health. Environ. Res. 2023, 218, 115061. [Google Scholar] [CrossRef]
  7. Pertegal, V.; Riquelme, E.; Lozano-Serra, J.; Cañizares, P.; Rodrigo, M.A.; Saez, C.; Lacasa, E. Cleaning technologies integrated in duct flows for the inactivation of pathogenic microorganisms in indoor environments: A critical review of recent innovations and future challenges. J. Environ. Manag. 2023, 345, 118798. [Google Scholar] [CrossRef] [PubMed]
  8. Salunkhe, A.R.; Dudhwadkar, S.; Raju, N.P.; Tandon, S. Public health risk assessment and speciation of air-borne microorganisms in an office building. J. Aerosol Sci. 2024, 179, 106362. [Google Scholar] [CrossRef]
  9. Moreno-Martín, V.; Lopez, M.; Roldan, C.; Bou, D.; Fraga, S.; Teixeira, J.P.; Lopez-Lilao, A.; Sanfelix, V.; Moliner, R.; Monfort, E.; et al. Potential human exposure and risks of incidental nanoparticles released during rotary dry cutting of ceramic tiles. J. Aerosol Sci. 2025, 183, 106485. [Google Scholar] [CrossRef]
  10. McAuley, T.; Fisher, R.; Zhou, X.; Jaques, P.; Ferro, A. Relationships of outdoor and indoor ultrafine particles at residences downwind of a major international border crossing in Buffalo, NY. Indoor Air 2010, 20, 298–308. [Google Scholar] [CrossRef]
  11. Rim, D.; Wallace, L.; Persily, A. Infiltration of outdoor ultrafine particles into a test house. Environ. Sci. Technol. 2010, 4, 5908–5913. [Google Scholar] [CrossRef] [PubMed]
  12. Stephens, B.; Siegel, J.A. Comparison of test methods for determining the particle removal efficiency of filters in residential and light-commercial central HVAC systems. Aerosol Sci. Technol. 2012, 46, 504–513. [Google Scholar] [CrossRef]
  13. Stephens, B.; Siegel, J.A. Ultrafine particle removal by residential heating, ventilating, and air-conditioning filters. Indoor Air 2013, 23, 488–497. [Google Scholar] [CrossRef]
  14. Azimi, P.; Zhao, D.; Stephens, B. Estimates of HVAC filtration efficiency for fine and ultrafine particles of outdoor origin. Atmos. Environ. 2014, 98, 337–346. [Google Scholar] [CrossRef]
  15. Yu, Z.; Fan, T.; Liu, Y.; Li, L.; Liu, J.; Yang, B.; Ramakrishna, S.; Long, Y.-Z. Efficient air filtration through advanced electrospinning techniques in nanofibrous Materials: A review. Sep. Purif. Technol. 2024, 349, 127773. [Google Scholar] [CrossRef]
  16. Fang, X.; Chang, R.; Zuo, J.; Zhang, W.E.; Zou, Y.; Li, K. How do environmental and operational factors impact particulate matter dynamics in building construction?-Insights from real-time sensing. J. Environ. Manag. 2025, 380, 125098. [Google Scholar] [CrossRef]
  17. Ma, C.J.; Lee, K.B.; Kim, S.D.; Sera, K. Thermal and hygroscopic properties of indoor particulate matter collected on an underground subway platform. Asian J. Atmos. Environ. 2015, 9, 165–172. [Google Scholar] [CrossRef]
  18. Font, O.; Moreno, T.; Querol, X.; Martins, V.; Sánchez Rodas, D.; de Miguel, E.; Capdevila, M. Origin and speciation of major and trace PM elements in the Barcelona subway system. Transp. Res. Part D Transp. Environ. 2019, 72, 17–35. [Google Scholar] [CrossRef]
  19. Ngoc, L.T.N.; Lee, Y.Y.C.; Chun, H.S.; Moon, J.Y.; Choi, J.S.; Park, D.; Lee, Y.Y.C. Correlation of α/γ-Fe2O3 nanoparticles with the toxicity of particulate matter originating from subway tunnels in Seoul stations, Korea. J. Hazard. Mater. 2020, 382, 121175. [Google Scholar] [CrossRef] [PubMed]
  20. Park, D.; Oh, M.; Yoon, Y.; Park, E.; Lee, K. Source identification of PM10 pollution in subway passenger cabins using positive matrix factorization. Atmos. Environ. 2012, 49, 180–185. [Google Scholar] [CrossRef]
  21. Moreno, T.; Reche, C.; Minguillón, M.C.; Capdevila, M.; de Miguel, E.; Querol, X. The effect of ventilation protocols on airborne particulate matter in subway systems. Sci. Total Environ. 2017, 584–585, 1317–1323. [Google Scholar] [CrossRef]
  22. Moreno, T.; de Miguel, E. Improving air quality in subway systems: An overview. Environ. Pollut. 2018, 239, 829–831. [Google Scholar] [CrossRef]
  23. Lee, H. Generation characteristics of the airborne wear particles emitted from the wheel–rail contact for various train velocities and their generation relation with the train velocity. Atmos. Environ. X 2020, 5, 100068. [Google Scholar] [CrossRef]
  24. Passi, A.; Nagendra, S.M.S.; Maiya, M.P. Assessment of exposure to airborne aerosol and bio-aerosol particles and their deposition in the respiratory tract of subway metro passengers and workers. Atmos. Pollut. Res. 2021, 12, 101218. [Google Scholar] [CrossRef]
  25. Passi, A.; Nagendra, S.; Maiya, M.P. Assessment of indoor and outdoor exposure to airborne particles in subway metro stations and their associated health risks. WIT Trans. Ecol. Environ. 2021, 252, 85–96. [Google Scholar] [CrossRef]
  26. Hinds, W.C. Aerosol Technology: Properties, Behavior, and Measurement of Airborne Particles, 2nd ed.; Wiley: New York, NY, USA, 1999. [Google Scholar]
  27. Podgórski, A.; Maisser, A.; Szymański, W.W.; Jackiewicz, A.; Gradoń, L. Penetration of monodisperse, singly charged nanoparticles through polydisperse fibrous filters. Aerosol Sci. Technol. 2011, 45, 215–233. [Google Scholar] [CrossRef]
  28. Chang, D.-Q.; Chen, S.-C.; Fox, A.R.; Viner, A.S.; Pui, D.Y.H. Penetration of sub-50 nm nanoparticles through electret HVAC filters used in residence. Aerosol Sci. Technol. 2015, 49, 966–976. [Google Scholar] [CrossRef]
  29. Woo, S.-H.; Cheon, T.-W.; Lee, G.; Kim, J.B.; Bae, G.-N.; Kwon, S.-B.; Jang, H.R.; Yook, S.-J. Performance evaluation of a hybrid dust collector for removing particles during subway train operation. Aerosol Sci. Technol. 2019, 53, 562–574. [Google Scholar] [CrossRef]
  30. Afshari, A.; Ekberg, L.; Forejt, L.; Mo, J.; Rahimi, S.; Siegel, J.; Chen, W.; Wargocki, P.; Zurami, S.; Zhang, J. Electrostatic precipitators as an indoor air cleaner—A Literature Review. Sustainability 2020, 12, 8774. [Google Scholar] [CrossRef]
  31. Lee, Y.; Kim, Y.-S.; Lee, H.; Park, Y.; Lee, G.; An, S.-H.; Han, B.; Kim, Y.-J.; Kim, H.-J. Retrofitting of an air handling unit by a two-stage electrostatic precipitator. IEEE Trans. Ind. Appl. 2024, 60, 1656–1664. [Google Scholar] [CrossRef]
  32. Abdulhamid, M.A.; Muzamil, K. Recent progress on electrospun nanofibrous polymer membranes for water and air purification: A review. Chemosphere 2023, 310, 136886. [Google Scholar] [CrossRef]
  33. Liu, H.; Zhu, Y.; Zhang, C.; Zhou, Y.; Yu, D.-G. Electrospun nanofiber as building blocks for high-performance air filter: A review. Nano Today 2024, 55, 102161. [Google Scholar] [CrossRef]
  34. Ramakrishna, S.; Fujihara, K.; Teo, W.E.; Lim, T.C.; Ma, Z. An Introduction to Electrospinning and Nanofibers; World Scientific: Singapore, 2005. [Google Scholar]
  35. Teo, W.E.; Ramakrishna, S. A review on electrospinning design and nanofibre assemblies. Nanotechnology 2006, 17, 89–106. [Google Scholar] [CrossRef] [PubMed]
  36. Jaworek, A.; Krupa, A.; Sobczyk, A.T.; Lackowski, M.; Czech, T.; Ramakrishna SSundarrajan, S.; Pliszka, D. Electrospray nanocoating of microfibres. Solid State Phenom. 2008, 140, 127–132. [Google Scholar] [CrossRef]
  37. Lackowski, M.; Krupa, A.; Jaworek, A. Nonwoven filtration mat production by electrospinning method. J. Phys. Conf. Ser. 2011, 301, 012013. [Google Scholar] [CrossRef]
  38. Lackowski, M.; Krupa, A.; Jaworek, A. Nanofabric nonwoven mat for filtration smoke and nanoparticles. Pol. J. Chem. Technol. 2013, 15, 48–52. [Google Scholar] [CrossRef]
  39. Baghali, M.; Jayathilaka, W.A.D.M.; Ramakrishna, S. The Role of Electrospun Nanomaterials in the Future of Energy and Environment. Materials 2021, 14, 558. [Google Scholar] [CrossRef]
  40. Yao, S.; Ramakrishna, S.; Chen, G. Recent Advances in Metal–Organic Frameworks Based on Electrospinning for Energy Storage. Adv. Fiber Mater. 2023, 5, 1592–1617. [Google Scholar] [CrossRef]
  41. Yun, K.M.; Hogan, C.J., Jr.; Matsubayashi, Y.; Kawabe, M.; Iskandar, F.; Okuyama, K. Nanoparticle filtration by electrospun polymer fibers. Chem. Eng. Sci. 2007, 62, 4751–4759. [Google Scholar] [CrossRef]
  42. Zhang, S.; Liu, H.; Yin, X.; Li, Z.; Yu, J.; Ding, B. Tailoring mechanically robust poly (m-phenylene isophthalamide) nanofiber/nets for ultrathin high-efficiency air filter. Sci. Rep. 2017, 7, 40550. [Google Scholar] [CrossRef]
  43. Wang, C.; Wang, W.; Qi, H.; Dai, Y.; Jiang, S.; Ding, B.; Wang, X.; Li, C.; Zeng, J.; Wu, T.; et al. Electrospinning and electrospun nanofibers: From academic research to industrial production. Prog. Mater. Sci. 2025, 154, 101494. [Google Scholar] [CrossRef]
  44. Zhou, G.; Ma, Y.; Wei, B.; Chen, J.; Zhang, Y.; Hu, S.; Li, J.; Wang, Y. Sustainable self-powered PVDF fibrous filter medias based on triboelectric nanogenerator with efficient dust collection for personal occupational protection. J. Colloid Interface Sci. 2025, 696, 137871. [Google Scholar] [CrossRef] [PubMed]
  45. Przekop, R.; Gradoń, L. Deposition and filtration of nanoparticles in the composites of nano-and microsized fibers. Aerosol Sci. Technol. 2008, 42, 483–493. [Google Scholar] [CrossRef]
  46. Jackiewicz, A.; Bałazy, A.; Podgórski, A. Investigation of aerosol dispersion in fibrous filters. Pol. J. Chem. Technol. 2008, 10, 66–72. [Google Scholar] [CrossRef]
  47. Podgórski, A. Estimation of the upper limit of aerosol nanoparticles penetration through inhomogeneous fibrous filters. J. Nanoparticles Res. 2009, 11, 197–207. [Google Scholar] [CrossRef]
  48. Podgórski, A.; Bałazy, A. Novel formulae for deposition efficiency of electrically neutral, submicron aerosol particles in bipolarly charged fibrous filters derived using Brownian dynamics approach. Aerosol Sci. Technol. 2008, 42, 123–133. [Google Scholar] [CrossRef]
  49. Khandaker, M.; Progri, H.; Arasu, D.T.; Nikfarjam, S.; Shamim, N. Use of polycaprolactone electrospun nanofiber mesh in a face mask. Materials 2021, 14, 4272. [Google Scholar] [CrossRef]
  50. Liang, L.; Wu, L.; Xu, W.; Liu, C.; Liu, X.; Cheng, H.; Liu, Y.; Zhang, G.; Che, H.; Sun, J.; et al. The characterization and quantification of viable and dead airborne biological particles using flow cytometry and double fluorescent staining. J. Aerosol Sci. 2022, 165, 106019. [Google Scholar] [CrossRef]
  51. Peimbert, M.; Alcaraz, L.D. Where environmental microbiome meets its host: Subway and passenger microbiome relationships. Mol. Ecol. 2022, 32, 2602–2618. [Google Scholar] [CrossRef]
  52. Su, Q.; Huang, Y.; Wei, Z.; Zhu, C.; Zeng, W.; Wang, S.; Long, S.; Zhang, G.; Yang, J.; Wang, X. A novel multi-gradient PASS nanofibrous membranes with outstanding particulate matter removal efficiency and excellent antimicrobial property. Sep. Purif. Technol. 2023, 307, 122652. [Google Scholar] [CrossRef]
  53. Wu, Y.; Li, X.; Zhong, Q.; Wang, F.; Yang, B. Preparation and filtration performance of antibacterial PVDF/SiO2/Ag composite nanofiber membrane. J. Build. Eng. 2023, 74, 106864. [Google Scholar] [CrossRef]
  54. Yu, K.-P.; Lee, G.W.-M.; Lin, S.-Y.; Huang, C.P. Removal of bioaerosols by the combination of a photocatalytic filter and negative air ions. J. Aerosol Sci. 2008, 39, 377–392. [Google Scholar] [CrossRef]
  55. Richter, W.R.; Wood, J.P.; Wendling, M.Q.S.; Rogers, J.V. Inactivation of Bacillus anthracis spores to decontaminate subway railcar and related materials via the fogging of peracetic acid and hydrogen peroxide sporicidal liquids. J. Environ. Manag. 2018, 206, 800–806. [Google Scholar] [CrossRef]
  56. Dehghan, S.F.; Golbabaei, F.; Mousavi, T.; Mohammadi, H.; Kohneshahri, M.H.; Bakhtiari, R. Production of nanofibers containing magnesium oxide nanoparticles for the purpose of bioaerosol removal. Pollution 2020, 6, 185–196. [Google Scholar] [CrossRef]
  57. Sohrabi, M.; Abbasi, M.; Sadighzadeh, A. Fabrication and evaluation of electrospun polyacrylonitrile/silver nanofiber membranes for air filtration and antibacterial activity. Polym. Bull. 2023, 80, 5481–5499. [Google Scholar] [CrossRef]
  58. Jaworek, A.; Krupa, A.; Lackowski, M.; Sobczyk, A.T.; Czech, T.; Ramakrishna, S.; Sundarrajan, S.; Pliszka, D. Nanocomposite fabric formation by electrospinning and electrospraying technology. J. Electrost. 2009, 67, 435–438. [Google Scholar] [CrossRef]
  59. Jaworek, A.; Krupa, A.; Lackowski, M.; Sobczyk, A.T.; Czech, T.; Ramakrishna, S.; Sundarrajan, S.; Pliszka, D. Electrostatic method for the production of polymer nanofibers blended with metal-oxide nanoparticles. J. Phys. Conf. Ser. 2009, 146, 012006. [Google Scholar] [CrossRef]
  60. Blosi, M.; Costa, A.L.; Ortelli, S.; Belosi, F.; Ravegnani, F.; Varesano, A.; Tonetti, C.; Zanoni, I.; Vineis, C. Polyvinyl alcohol/silver electrospun nanofibers: Biocidal filter media capturing virus-size particles. J. Appl. Polym. Sci. 2021, 138, 51380. [Google Scholar] [CrossRef] [PubMed]
  61. Park, K.; Kang, S.; Park, J.-W.; Hwang, J. Fabrication of silver nanowire coated fibrous air filter medium via a two-step process of electrospinning and electrospray for anti-bioaerosol treatment. J. Hazard. Mater. 2021, 411, 125043. [Google Scholar] [CrossRef]
  62. De Almeida, D.S.; Martins, L.D.; Aguiar, M.L. Air pollution control for indoor environments using nanofiber filters: A brief review and post-pandemic perspectives. Chem. Eng. J. Adv. 2022, 11, 100330. [Google Scholar] [CrossRef]
  63. Salkovskiy, Y.; Fadeev, A. High-efficiency retention of ultrafine aerosols by electrospun nanofibers. Sci. Rep. 2022, 12, 20850. [Google Scholar] [CrossRef] [PubMed]
  64. Thomas, D.; Penicot, P.; Contal, P.; Leclerc, D.; Vendel, J. Clogging of fibrous filters by solid aerosol particles Experimental and modelling study. Chem. Eng. Sci. 2001, 56, 3549–3561. [Google Scholar] [CrossRef]
  65. Leung, W.W.-F.; Hung, C.-H. Investigation on pressure drop evolution of fibrous filter operating in aerodynamic slip regime under continuous loading of sub-micron aerosols. Sep. Purif. Technol. 2008, 63, 691–700. [Google Scholar] [CrossRef]
  66. Wang, J.; Kim, S.C.; Pui, D.Y.H. Investigation of the figure of merit for filters with a single nanofiber layer on a substrate. J. Aerosol Sci. 2008, 39, 323–334. [Google Scholar] [CrossRef]
  67. Bao, B.; He, W.; Zhao, H.; Xu, B.; Lin, Z. Modeling penetration through fibrous filter during dynamic filtration. Aerosol Air Qual. Res. 2015, 15, 648–656. [Google Scholar] [CrossRef]
  68. Zheng, C.-H.; Kanaoka, C. Recent advances in dust collection technology and ISO standardization in bag filtration. J. Zhejiang Univ.-Sci A (Appl. Phys. Eng.) 2018, 19, 21–33. [Google Scholar] [CrossRef]
  69. Pei, C.; Ou, Q.; Pui, D.Y.H. Effects of temperature and relative humidity on laboratory air filter loading test by hygroscopic salts. Sep. Purif. Technol. 2021, 255, 117679. [Google Scholar] [CrossRef]
  70. Berry, G.; Beckman, I.; Cho, H. A comprehensive review of particle loading models of fibrous air filters. J. Aerosol Sci. 2023, 167, 106078. [Google Scholar] [CrossRef]
  71. Aghdasi, M.; Nazari, M.; Yonesi Holari, S.; Hashemi, N.N. Designing a new microchannel to collect microparticles using dielectrophoretic forces: Numerical and experimental investigation. J. Electrost. 2024, 127, 103879. [Google Scholar] [CrossRef]
  72. Kirsh, A.A.; Stechkina, I.B.; Fuchs, N.A. Effect of the gas slip on the pressure drop in a system of parallel cylinders at small Reynolds numbers. J. Colloid Interface Sci. 1971, 37, 458–461. [Google Scholar] [CrossRef]
  73. Kirsh, V.A.; Budyka, A.K.; Kirsh, A.A. Simulation of nanofibrous filters produced by the electrospinning method: 2. The effect of gas slip on the pressure drop. Colloid J. 2008, 70, 584–588. [Google Scholar] [CrossRef]
  74. Kirsch, A.A.; Stechkina, I.B.; Fuchs, N.A. Effect of gas slip on the pressure drop in fibrous filters. J. Aerosol Sci. 1973, 4, 287–293. [Google Scholar] [CrossRef]
  75. Choi, H.-J.; Kumita, M.; Seto, T.; Inui, Y.; Bao, L.; Fujimoto, T.; Otani, Y. Effect of slip flow on pressure drop of nanofiber filters. J. Aerosol Sci. 2017, 114, 244–249. [Google Scholar] [CrossRef]
  76. Zhao, X.; Wang, S.; Yin, X.; Yu, J.; Ding, B. Slip-effect functional air filter for efficient purification of PM2.5. Sci. Rep. 2016, 6, 35472. [Google Scholar] [CrossRef]
  77. Xia, T.; Bian, Y.; Zhang, L.; Chen, C. Relationship between pressure drop and face velocity for electrospun nanofiber filters. Energy Build. 2018, 158, 987–999. [Google Scholar] [CrossRef]
  78. Azimian, M.; Naderi, M.; Soltani, P.; Cheng, L.; Naderi, K.; Linden, S.; Wiegmann, A. Experimental and CFD analysis of fluid flow through nanofiber filter media. Sci. Rep. 2024, 14, 16128. [Google Scholar] [CrossRef] [PubMed]
  79. Mizeraczyk, J.; Dekowski, J.; Podliński, J.; Kocik, M.; Ohkubo, T.; Kanazawa, S. Laser flow visualization and velocity fields by particle image velocimetry in an electrostatic precipitator model. J. Visualiz. 2003, 6, 125–133. [Google Scholar] [CrossRef]
  80. Niewulis, A.; Podliński, J.; Kocik, M.; Barbucha, R.; Mizeraczyk, J.; Mizuno, A. EHD flow measured by 3D PIV in a narrow electrostatic precipitator with longitudinal-to-flow wire electrode and smooth or flocking grounded plane electrode. J. Electrost. 2007, 65, 728–734. [Google Scholar] [CrossRef]
  81. Podliński, J.; Berendt, A.; Mizeraczyk, J. Particle Image Velocimetry of airflow in electrohydrodynamic device for dust particle collection. Int. J. Plasma Environ. Sci. Technol. 2013, 7, 82–88. [Google Scholar]
  82. Krupa, A.; Podliński, J.; Mizeraczyk, J.; Jaworek, A. Velocity field of EHD flow during back corona discharge in electrostatic precipitator. Powder Technol. 2019, 344, 475–486. [Google Scholar] [CrossRef]
  83. Yuan, Z.; Yanagawa, K.; Ehara, Y. Visualization and analysis of a re-entrained particle with an electrostatic precipitator using PIV method. J. Electrost. 2022, 119, 103751. [Google Scholar] [CrossRef]
  84. Tański, M.; Reza, A.; Przytuła, D.; Garasz, K.; Tomaszewski, A. Electrostatic precipitator with Surface Dielectric Barrier Discharge ionizer. J. Clean. Prod. 2023, 404, 136990. [Google Scholar] [CrossRef]
  85. Yan, D.; Zhang, X.; Li Abbas, G.; Yu, Y.; Zhang, Z. EHD flow auxiliary particle collection in HVDC electrostatic precipitator based on PIV flow visualization technology. Phys. Scr. 2023, 98, 045002. [Google Scholar] [CrossRef]
  86. Kang, S.; Bock, N.; Swanson, J.; Pui, D.Y.H. Characterization of pleated filter media using particle image velocimetry. Sep. Purif. Technol. 2020, 237, 116333. [Google Scholar] [CrossRef]
  87. Pliszka, D.; Sundarrajan, S.; Jaworek, A.; Krupa, A.; Lackowski, M.; Ramakrishna, S. Optimization of electrospray process by PIV in nanostructured membrane preparation. Adv. Sci. Technol. 2008, 60, 117–122. [Google Scholar] [CrossRef]
  88. Kähler, C.J.; Hain, R. Fundamental protective mechanisms of face masks against droplet infections. J. Aerosol Sci. 2020, 148, 105617. [Google Scholar] [CrossRef]
  89. Migliorini, M.; Zachos, P.K.; MacManus, D.G.; Giannouloudis, A. Experimental investigation of unsteady fan-intake interactions using time-resolved stereoscopic particle image velocimetry. Exp. Therm. Fluid Sci. 2025, 166, 111482. [Google Scholar] [CrossRef]
  90. Sundarrajan, S.; Pliszka, D.; Jaworek, A.; Krupa, A.; Lackowski, M.; Ramakrishna, S. A novel process for the fabrication of nanocomposites membranes. J. Nanosci. Nanotechnol. 2009, 9, 4442–4447. [Google Scholar] [CrossRef]
  91. Ghasemi-Mobarakeh, L.; Semnani, D.; Morshed, M. A novel method for porosity measurement of various surface layers of nanofibers mat using image analysis for tissue engineering applications. J. Appl. Polym. Sci. 2007, 106, 2536–2542. [Google Scholar] [CrossRef]
  92. VDI Germany 2016. Available online: www.vdi.de/fileadmin/pages/vdi_de/redakteure/richtlinien/inhaltsverzeichnisse/2417322.pdf (accessed on 10 March 2025).
  93. Podgórski, A.; Bałazy, A.; Gradoń, L. Application of nanofibers to improve the filtration efficiency of the most penetrating aerosol particles in fibrous filters. Chem. Eng. Sci. 2006, 61, 6804–6815. [Google Scholar] [CrossRef]
  94. Bilek, P.; Sidlof, P. Optical measuring and vizualization of efficiency and homogenity of nanofiber filtration materials. In Proceedings of the Nanocon 2011 Conference Proceedings 3rd International Conference, Brno, Czech Republic, 21–23 September 2011; pp. 503–508. [Google Scholar]
  95. Bilek, P.; Hruza, J. Influence of structure uniformity of nanofibrous filters on their homogeneity of filtration efficiency. In Proceedings of the Nanocon 2014 Conference Proceedings 6th International Conference, Brno, Czech Republic, 5–7 November 2014; pp. 427–436. [Google Scholar]
  96. Agrawal, V. Development of Image Filtration Algorithms for PIV and PTV Technique in Suspension Flow of Bifurcating Micro-Channels. Bachelor’s Thesis, Indian Institute of Technology Guwahati, Guwahati, India, 2015. [Google Scholar]
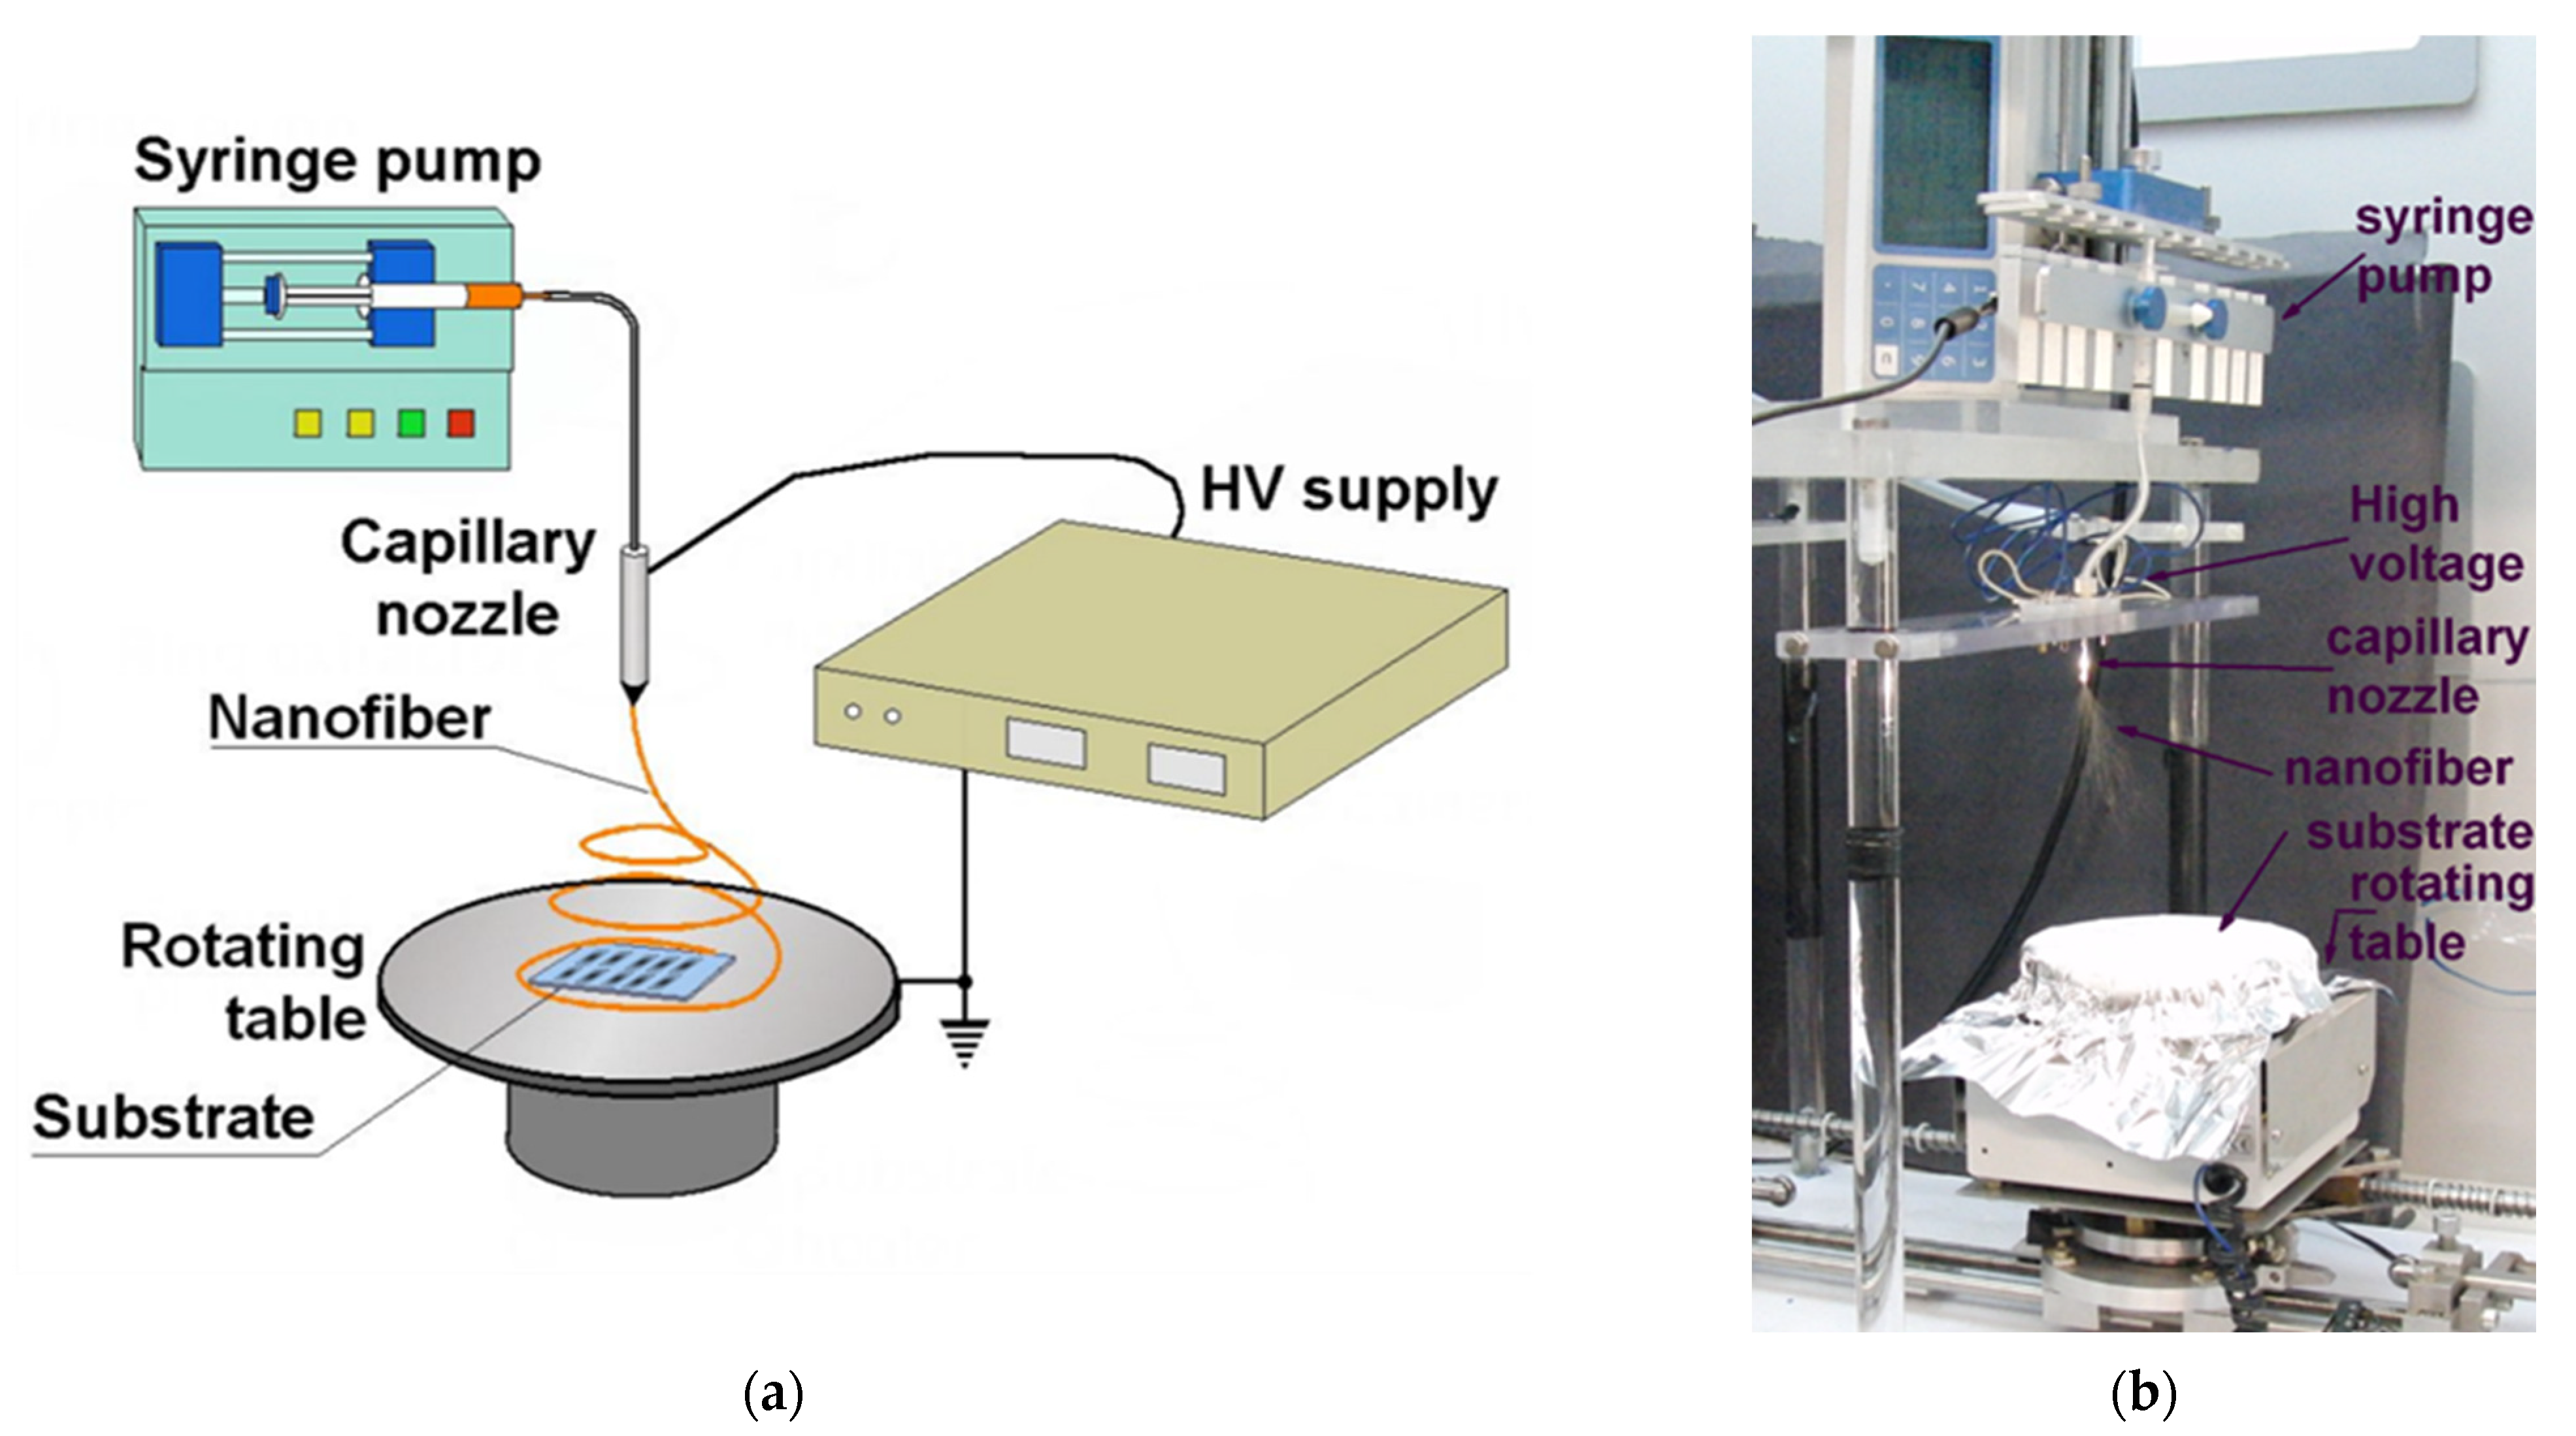
Figure 1. Setup for the production of polymer nanofibrous filter by electrospinning: (a) schematic; photograph of the stand (b).
Applsci 15 08728 g001
Figure 2. Photograph of PVDF nanofiber produced by electrospinning: (a) in continuous light; (b) in the stroboscopic light (exposure time 3 μs).
Applsci 15 08728 g002
Figure 3. Metal mesh scaffold with PVDF nanofibrous filter. Electrospinning time of 10 min. Capillary nozzle voltage +13.5 kV. Polymer solution flow rate 1 mL/h.
Applsci 15 08728 g003
Figure 4. SEM micrographs of metal mesh scaffold with PVDF nanofibrous filter for two magnifications. Electrospinning time of 10 min: magnification (a) 100×, (b) 10,000×. Fiber diameter distribution (c); b/w conversion of SEM image of the nanofibrous filter (d).
Applsci 15 08728 g004
Figure 5. Schematic of the laboratory setup used to study the distribution of flow velocity field through nanofibrous filter by the PIV method.
Applsci 15 08728 g005
Figure 6. A photograph of PIV experimental stand for flow field measurement: (a) the laser, CCD camera, and nanofibrous filter channel mounted in the frame; (b) the photograph taken during the PIV measurements.
Applsci 15 08728 g006
Figure 7. Size distribution of seed particles produced by ATM 226 atomizer aerosol generator (TOPAS) from DEHS.
Applsci 15 08728 g007
Figure 8. Pressure drop across the nanofibrous filter vs. air velocity in the channel. Auxiliary abscissa is for Reynolds number.
Applsci 15 08728 g008
Figure 9. Time-averaged flow velocity field in the channel (in m/s) with stainless steel mesh without nonwoven fibrous filter. Time between laser pulses 200 µs: (a) velocity vector modulus (in color); (b) vector representation.
Applsci 15 08728 g009
Figure 10. Velocity component (in m/s) perpendicular to the mesh plane at different distances (in mm) from the mesh plane determined from the velocity field shown in Figure 9. Steel mesh without nonwoven fibrous filter.
Applsci 15 08728 g010
Figure 11. Time-averaged flow velocity field in the channel (in m/s) with stainless steel mesh with PVDF nonwoven nanofibrous filter. Volume air flow rate through the channel 960 L/h. Time between laser pulses 200 µs: (a) velocity vector modulus (in color); (b) vector representation.
Applsci 15 08728 g011
Figure 12. Velocity component (in m/s) perpendicular to the filter plane at different distances (in mm) from the filter plane, determined from the velocity field shown Figure 11. Steel mesh with PVDF nonwoven fabric filter.
Applsci 15 08728 g012
Figure 13. Time-averaged flow velocity field in the channel (in m/s) with stainless steel mesh with PVDF nonwoven nanofibrous filter. Volume air flow rate through the channel 650 L/h. Time between laser pulses 150 µs: (a) velocity vector modulus (in color); (b) vector representation.
Applsci 15 08728 g013
Figure 14. Velocity component (in m/s) perpendicular to the filter plane at different distances (in mm) from the filter plane, determined from the velocity field shown Figure 13. Steel mesh with PVDF nonwoven fabric filter.
Applsci 15 08728 g014
Disclaimer/Publisher’s Note: The statements, opinions and data contained in all publications are solely those of the individual author(s) and contributor(s) and not of MDPI and/or the editor(s). MDPI and/or the editor(s) disclaim responsibility for any injury to people or property resulting from any ideas, methods, instructions or products referred to in the content.