1. Introduction
Concrete is a fundamental material in the construction industry due to its versatility, mechanical strength, and durability. However, in its fresh state, it presents several challenges that can impact its long-term performance. During this phase, concrete is highly susceptible to environmental factors such as temperature, humidity, wind, and solar radiation, which influence the cement hydration process and, consequently, the heat generation, strength development, and overall stability of the material [
1].
Understanding and monitoring the early-age behavior of concrete is essential, as this phase significantly influences long-term performance. Previous research has established strong correlations between hydration kinetics and mechanical evolution [
2], proposed frameworks to describe key early-age [
3], and emphasized the importance of early mechanical response in advanced construction technologies such as 3D printing [
4]. Therefore, real-time monitoring of fresh concrete properties is essential to ensure quality control and prevent potential structural defects.
Key properties in the fresh state include consistency, workability, aggregate stability, and compactability, all of which determine the material’s performance [
5]. Previous studies have investigated various mix designs to optimize these characteristics. Lian and Zhuge (2010) [
6] experimentally explored optimum mix designs for enhanced permeable concrete, focusing on balancing strength with permeability. Hüsken and Brouwers (2008) [
7] proposed a theoretical and experimental methodology for earth-moist concrete to improve compaction and surface finish, while Kett (2009) [
8] provided an extensive compilation of mix design strategies and test methods for engineered concretes. Together, these studies emphasize the relevance of tailoring fresh concrete properties through controlled mixture proportions to meet specific performance demands in both conventional and specialized construction contexts. To assess these properties, different sensor technologies have been implemented, enabling real-time measurement of critical parameters [
9].These sensors provide accurate data that facilitate decision-making during construction and enhance the overall quality of the final product [
10].
Over the past decades, sensor technology for concrete monitoring has undergone significant advancements. Early systems relied on electrical resistance sensors [
11,
12], which laid the foundation for more sophisticated techniques, such as ultrasonic and electromagnetic sensors [
13,
14,
15]. More recently, high-precision sensor systems, including fiber optic [
16], piezoelectric [
17], and magnetostrictive sensors [
18], have been developed to enhance structural health monitoring. These technologies allow for the accurate measurement of key parameters such as stress, strain, cracking, and temperature. High-precision fiber optic sensors, such as the SOFO system used by Glišić and Simon (2000) [
19], have proven effective for monitoring early-age concrete, although their cost and installation complexity limit their use in large-scale or industrial applications. Several studies have demonstrated the potential of piezoelectric-based monitoring systems for characterizing early-age behavior of concrete. For instance, Gu et al. (2006) [
20] and Kong et al. (2013) [
21] used embedded piezoceramic transducers and smart aggregates to track hydration and strength evolution, while Dragašius et al. (2021) [
22] reviewed their widespread use in structural health monitoring due to their high sensitivity and adaptability. Despite their precision, these systems remain limited in construction applications due to cost, fragility, and complex integration.
Innovative applications in this field include cement-based carbon nanotube sensors for natural frequency identification [
23] and smart piezoelectric sensors for mechanical monitoring [
24]. Additionally, comprehensive reviews on the piezoresistive properties of cement-based sensors have highlighted the critical role of conductor content and fabrication methods in sensor performance [
25]. These multifunctional sensors have demonstrated the ability to detect stress, strain, cracks, temperature, and humidity, which are essential for evaluating the durability and performance of concrete structures [
26,
27].
Beyond hardware advancements, the integration of cutting-edge data analysis methods, such as the Internet of Things (IoT), machine learning, and artificial intelligence, has significantly improved the ability to predict and control concrete behavior. These technologies enable real-time data processing and pattern recognition, enhancing decision-making in construction [
28,
29,
30]. Kampli et al. (2024) have demonstrated the effectiveness of low-cost IoT-based systems for real-time estimation of concrete strength during curing [
31], as also explored in recent EMI-based studies using deep learning approaches for early-age strength prediction [
32].
Despite these advancements, challenges remain regarding the high cost and limited durability of high-precision sensors in construction environments [
33]. However, efforts to develop low-cost, reliable alternatives have shown promising results. For example, cost-effective sensors with Bluetooth communication protocols have been successfully used for real-time monitoring of concrete strength, reducing both operational costs and energy consumption [
34,
35]. Furthermore, microcontroller-based sensor systems have been validated for applications such as concrete curing monitoring [
36] or wireless sensors to monitor temperature and humidity in structures [
37,
38].
This work aims to develop and validate a low-cost, wireless Arduino-based sensor system to monitor temperature and humidity in early-age concrete elements, particularly in precast production environments, and assess its impact on improving quality control. The system is designed to track key parameters such as temperature and humidity in early-age self-compacting concrete, aiming to improve efficiency and quality in precast concrete production, particularly in demanding industrial environments.
Operationally, the goal of this study is to validate a low-cost, wireless sensing workflow that can support precast quality control through a defined set of metrics derived from temperature and humidity histories. Specifically, the system targets (i) thermal metrics (peak temperature Tp, time to peak tp, early age heating rate dT/dt, and depth gradient ΔT (surface–core)), (ii) moisture metrics (early age surface humidity loss rate dRH/dt and stabilized RH range), and (iii) a maturity-based indicator M(t) to estimate strength development under varying curing conditions.
The proposed system integrates DS18B20 temperature sensors and Soil Moisture Sensor v1.2 units, connected to an Arduino board. The collected data are wirelessly transmitted to a computer via Bluetooth for storage and further analysis. A custom-developed Arduino IDE script is used to manage data acquisition and transmission.
To validate the proposed monitoring system, this study was designed in two phases: first, a controlled laboratory evaluation using cylindrical concrete specimens; and second, a field validation in an industrial environment with precast New Jersey barriers. This sequential approach allowed progressive assessment of sensor performance under increasing complexity. To evaluate the system’s performance and sensor accuracy, preliminary tests were conducted both in a controlled laboratory setting and in an industrial production environment using cylindrical concrete specimens. Following these initial validations, the system was deployed to monitor New Jersey barrier specimens under varying environmental conditions, one stored indoors in a warehouse and another exposed to outdoor conditions. The collected data were analyzed to assess the feasibility of the monitoring system in optimizing the production chain of precast concrete elements and improving final product quality.
This paper is structured into three main sections.
Section 2 details the materials used, sensor system design, experimental procedures, and data analysis methodology.
Section 3 presents and interprets the findings, emphasizing correlations between temperature and humidity variations and the early-age behavior of concrete, as well as the influence of embedded sensors on mechanical performance. Finally,
Section 4 summarizes the key outcomes of this study, highlights system limitations, and outlines potential future research directions for further optimization.
2. Materials and Methods
A test campaign was conducted with the aim of assessing the feasibility of using low-cost sensors in monitoring the behavior of fresh concrete at early stages in order to enhance the quality of concrete products. For this purpose, appropriate sensors were selected to collect data on the parameters of interest, and a functioning system was designed using the Arduino microcontroller board.
The campaign proceeded in two major steps: the first involved conducting test trials on cylindrical concrete specimens under controlled conditions at the School of Civil Engineering of the University of Castilla-La Mancha. The second step entailed installing sensors either on prefabricated concrete elements or at the facilities of COTUBO Prefabricados (La Carlota, Córdoba, Spain), a manufacturer specialized in precast concrete components.
2.1. Employed Sensors
To establish the data collection system, various specific components have been selected. The DS18B20 temperature sensor (Maxim Integrated, San Jose, CA, USA) has been utilized for temperature measurement, while the Soil Moisture Sensor v1.2 (DFRobot, Shanghai, China) [
39] sensor has been chosen for humidity measurement. Additionally, a real-time clock (RTC) module DS3231 (KEYESTUDIO, Shenzhen, China) has been incorporated to record the timestamp of the collected data. For data transfer between the Arduino board and a PC, the HC-05 Bluetooth module (HiLetgo, Shenzhen, China) has been employed [
40]. This setup ensures data recording for subsequent analysis.
Each of the employed sensors underwent capacitive calibration. Furthermore, initial samples were taken to determine their placement on the test specimens. Particularly concerning the humidity sensor, its design exposes its electronic components excessively to various atmospheric agents. To protect these components, three waterproofing tests were conducted: waterproofing with general-purpose silicone adhesive, waterproofing with neutral silicone adhesive, and waterproofing with PVC tubing and neutral silicone adhesive. The effectiveness of the waterproofing tests was assessed by comparing the measurement data obtained from the sensors without waterproofing and with waterproofing.
In addition to the waterproofing procedures, the reliability of the sensors was verified through a preliminary calibration phase. The DS18B20 temperature sensors were compared against a certified laboratory thermometer under stable environmental conditions to ensure accuracy. For the Soil Moisture v1.2 humidity sensors, controlled saturation and drying cycles were conducted to confirm response stability and detect potential deviations prior to embedding. These checks allowed the exclusion of outlier units and ensured consistent performance during data collection.
2.2. Data Collection System
A system has been designed that utilizes the Arduino microcontroller to collect data from the chosen humidity and temperature sensors within the selected specimens. The system components and their connections are depicted in
Figure 1.
The measurements taken by the embedded sensors are transmitted to the Arduino board via a wired connection. The Arduino board receives these data and wirelessly transmits it via Bluetooth to a PC, where it is then recorded using the Tera Term program (version 5.0, summer 2023).
2.3. Preliminary Tests
2.3.1. Ordinary Concrete Specimens
In this preliminary test, the designed operating system was verified by monitoring the behavior of concrete under stable temperature conditions, with humidity being monitored but not actively controlled due to minimal climate variation. For this purpose, humidity and temperature sensors were implanted into two cylindrical specimens of conventional concrete, made with ordinary Portland cement. These specimens had a diameter of 15 cm and a height of 30 cm, in accordance with the specifications of the UNE-EN 12390-1:2021 standard [
41]. Furthermore, the specimens were manufactured following the procedures described in UNE-EN 12390-2:2019 [
42]. During the test period, the specimens were placed in a stable environment with regulated climate control. The laboratory conditions were maintained at a constant temperature of 22 ± 1 °C and relative humidity of 55 ± 5%, under standard climate-controlled conditions. The mix design included CEM I 42.5 R Portland cement, a water-to-cement ratio of 0.50, natural sand (0–4 mm), and gravel (4–12 mm), targeting a compressive strength of 30 MPa.
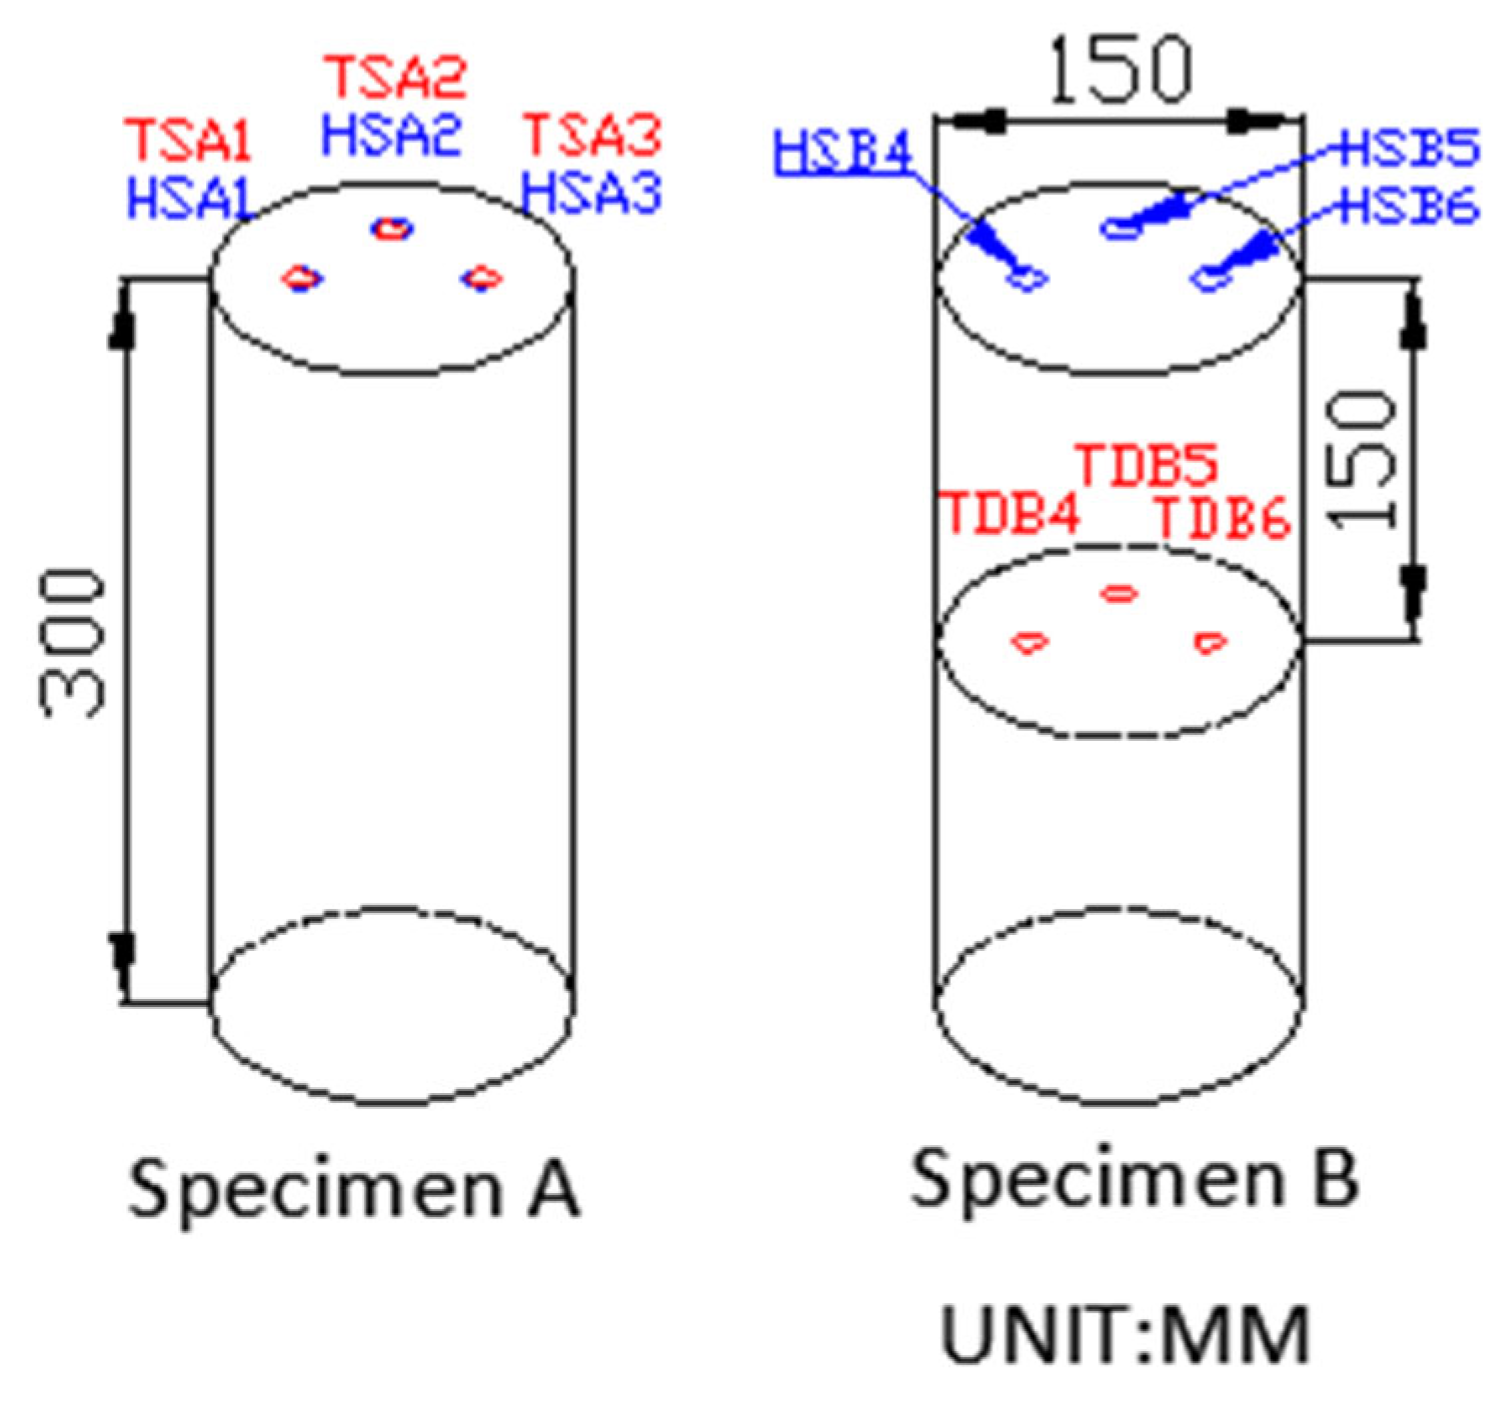
Three temperature sensors and three humidity sensors were used in each specimen. The temperature sensors have been placed at different depths in each specimen to observe data variations based on depth. Due to the fact that the humidity sensors consist of two parts—a probe that can be embedded in the concrete and a control module that cannot—the sensors have been placed near the surface of both specimens, ensuring the probe is embedded in the concrete while the control module remains accessible to the air. The sensor locations are indicated in
Figure 2.
For specimen A, three pairs of sensors were placed equidistant from the edge of the specimen, following a uniform distribution across its entire surface. All sensors were located near the surface of the specimen.
For specimen B, three pairs of sensors were inserted equidistantly along the edge of the specimen, following a similar uniform distribution as specimen A. However, unlike specimen A, in specimen B, the three temperature sensors were placed at a greater depth, reaching the core of the specimen at a depth of approximately 15 cm.
The nomenclature of the sensors shown in
Figure 2 uses the following designations in sequential order:
T: Temperature sensor;
H: Humidity sensor;
S: Surface;
D: Depth;
A: Specimen A;
B: Specimen B.
The use of multiple sensors is carried out to ensure the accuracy of the data collected in the same area and to be able to calculate an average between them.
2.3.2. Self-Compacting Concrete Specimens
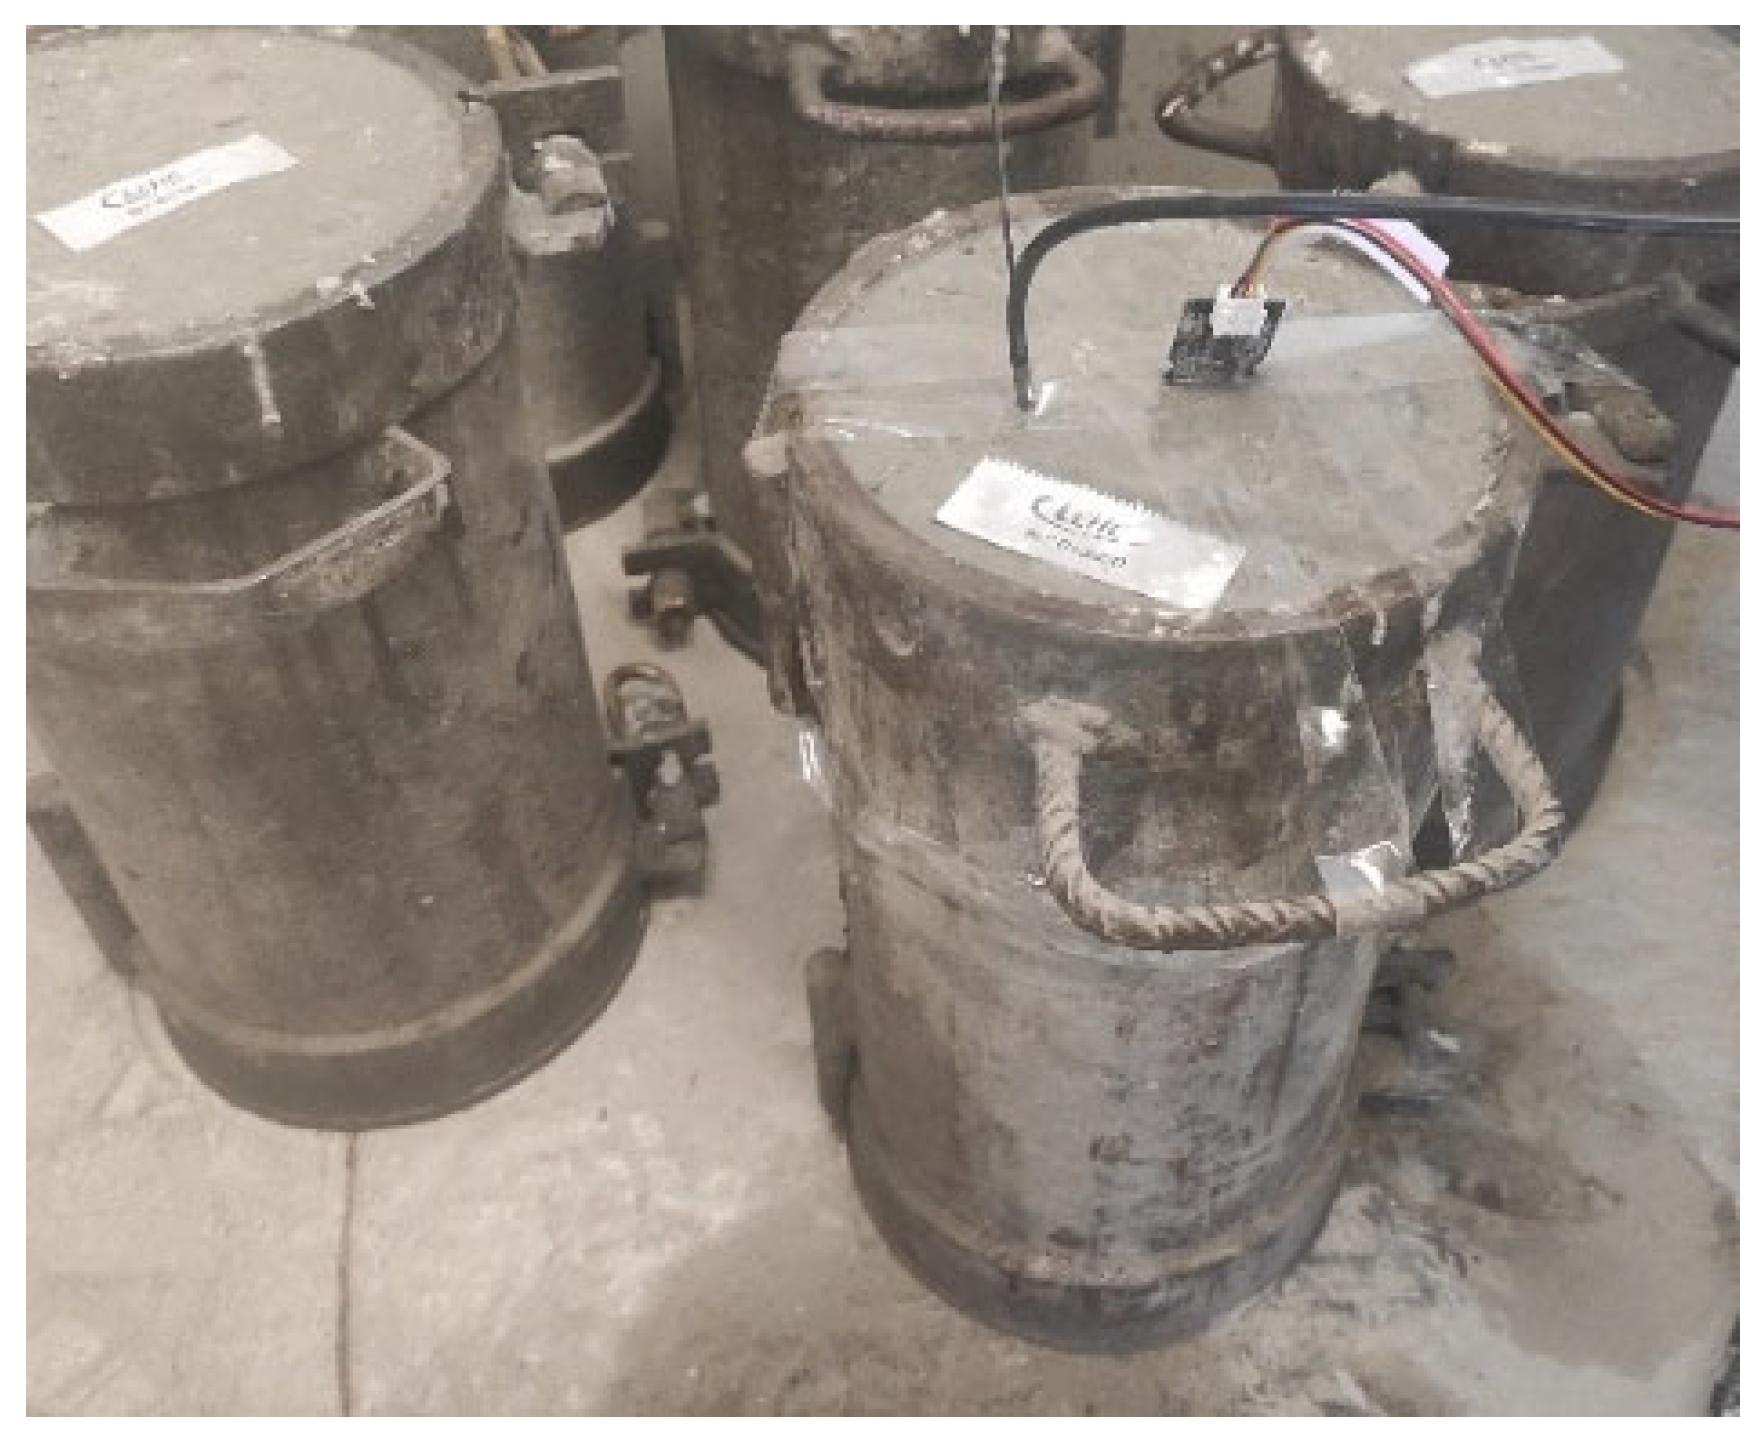
In this preliminary test, a second trial was conducted to verify the functionality of the designed system. This test was performed on a cylindrical specimen made of self-compacting concrete at a precast concrete factory. In this trial, a temperature sensor and a humidity sensor were implanted in a cylindrical specimen, near the upper flat surface as depicted in
Figure 3. The same self-compacting concrete mixture was used to produce four other specimens without sensors. These specimens, including the one containing the sensors, were subsequently used to conduct strength tests. The facility where the specimens were manufactured does not have climate control systems to adjust the temperature and humidity; however, due to its conditions, the environment remains stable. Although no active climate control systems were present, the indoor temperature remained between 30 °C and 33 °C, with relative humidity ranging from 40% to 50%.
The self-compacting concrete used was a factory-standard mix with a target compressive strength of 25 MPa and slump-flow class SF2 (700 ± 50 mm), composed of Portland cement, limestone filler, siliceous aggregates, and superplasticizers.
2.4. Tests on the New Jersey Barriers
At the factory where the tests were conducted, multiple production lines manufacture various concrete products, primarily using self-compacting concrete, except for pipes that use semi-dry concrete. The manufacturing process begins with mold preparation, followed by pouring concrete and curing. Initially, products are kept inside to protect them from atmospheric conditions, improving the curing process. Once they reach sufficient strength, they are transported outdoors for exposure until delivery. The experimental specimens were exposed to two environmental conditions post-production: the controlled environment of the facility and the unpredictable outdoor conditions. Due to the high temperatures in August (exceeding 40 °C) and logistical challenges, it was decided to conduct a single controlled test to better assess sensor data reliability. The outdoor testing in La Carlota (Córdoba) during July exposed the specimens to extreme summer conditions, with peak daytime temperatures exceeding 40 °C and relative humidity dropping to 25–35%, according to local meteorological records.
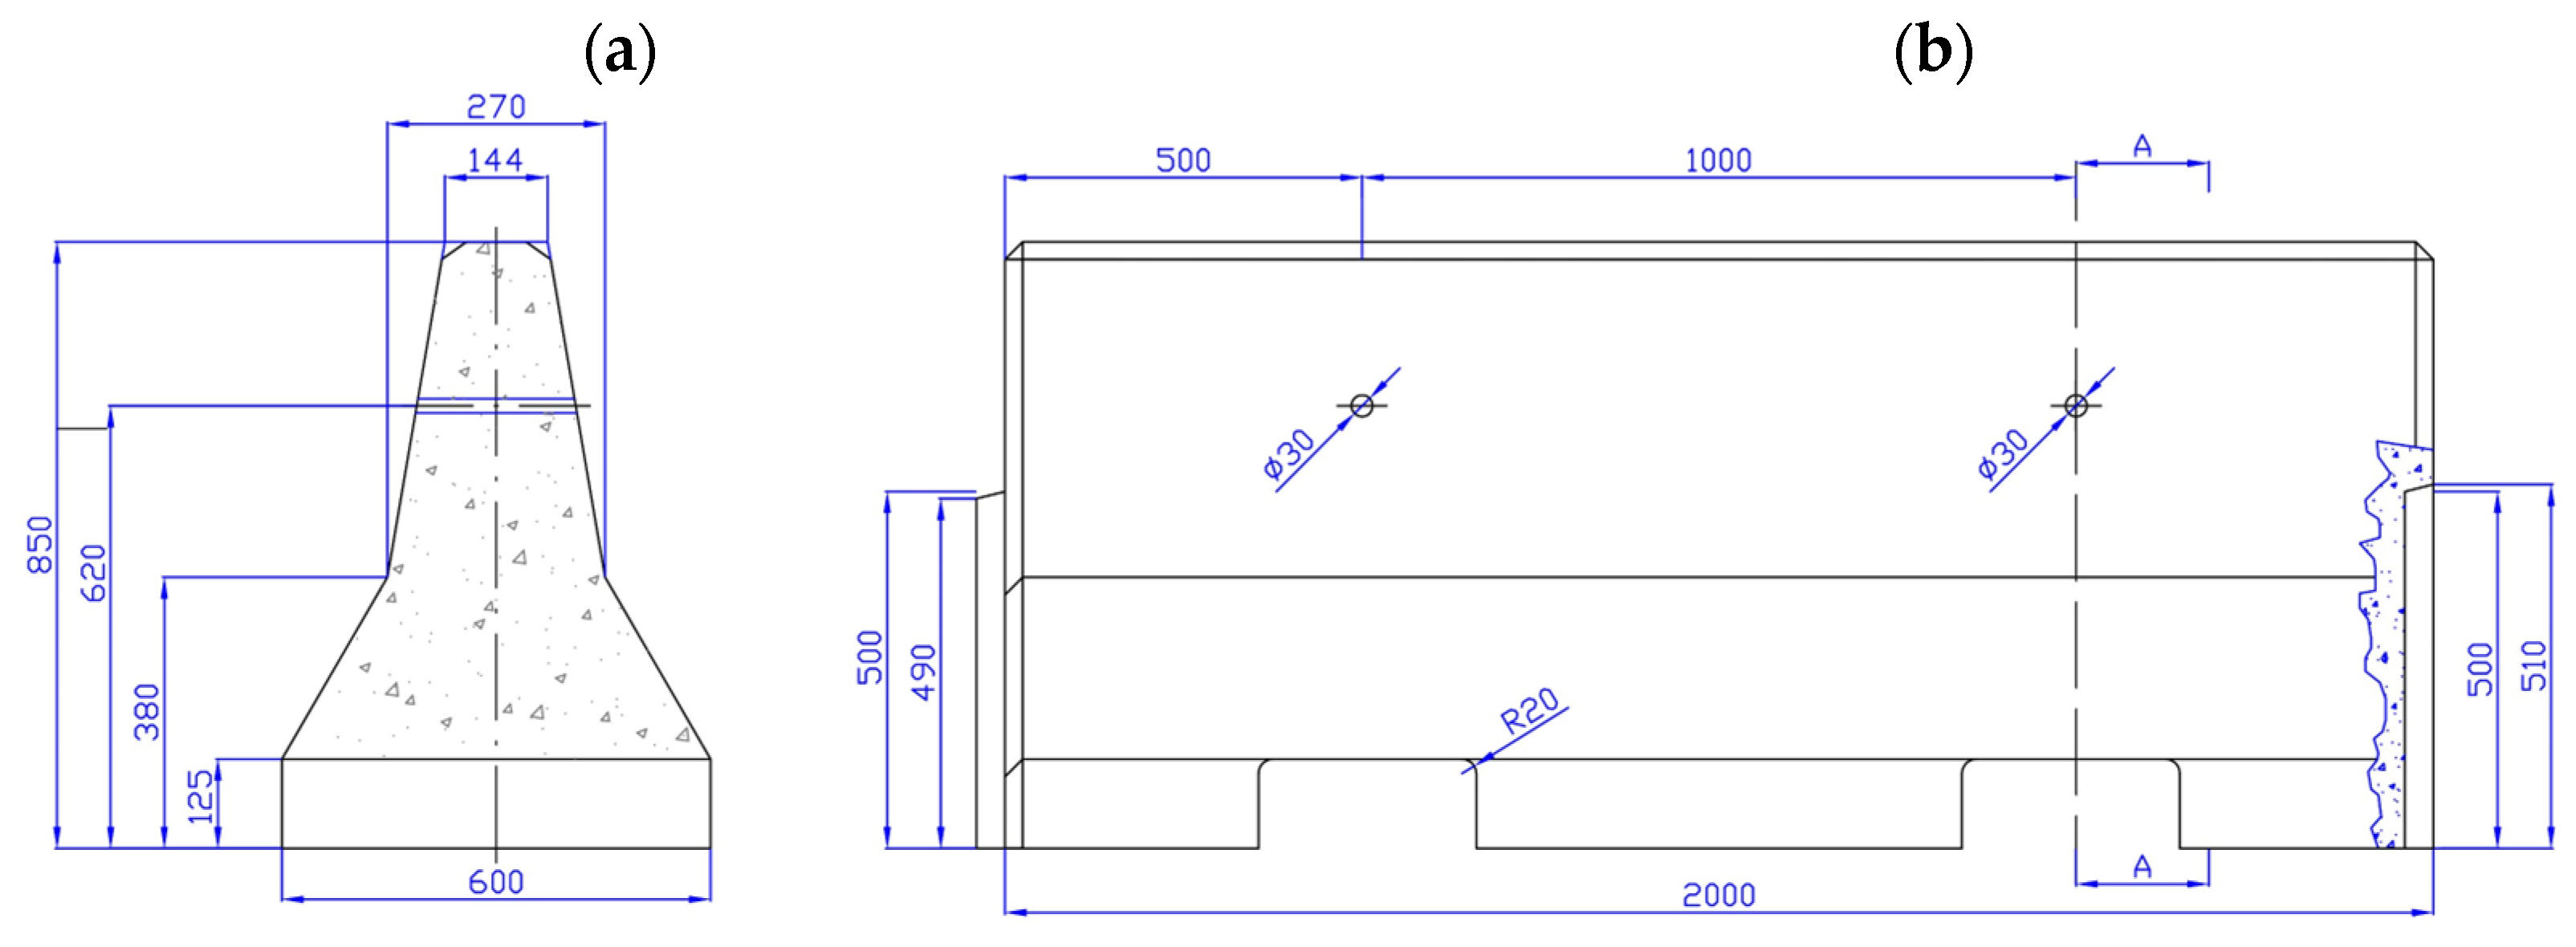
The New Jersey-type concrete barriers used in this experimental campaign are safety elements made of self-compacting reinforced concrete. The concrete is characterized by a compressive strength of 25 N/mm
2. These barriers measure 0.85 m in height, 0.6 m in width, and 2 m in length, with drainage outlets positioned at 0.62 m, as illustrated in
Figure 4.
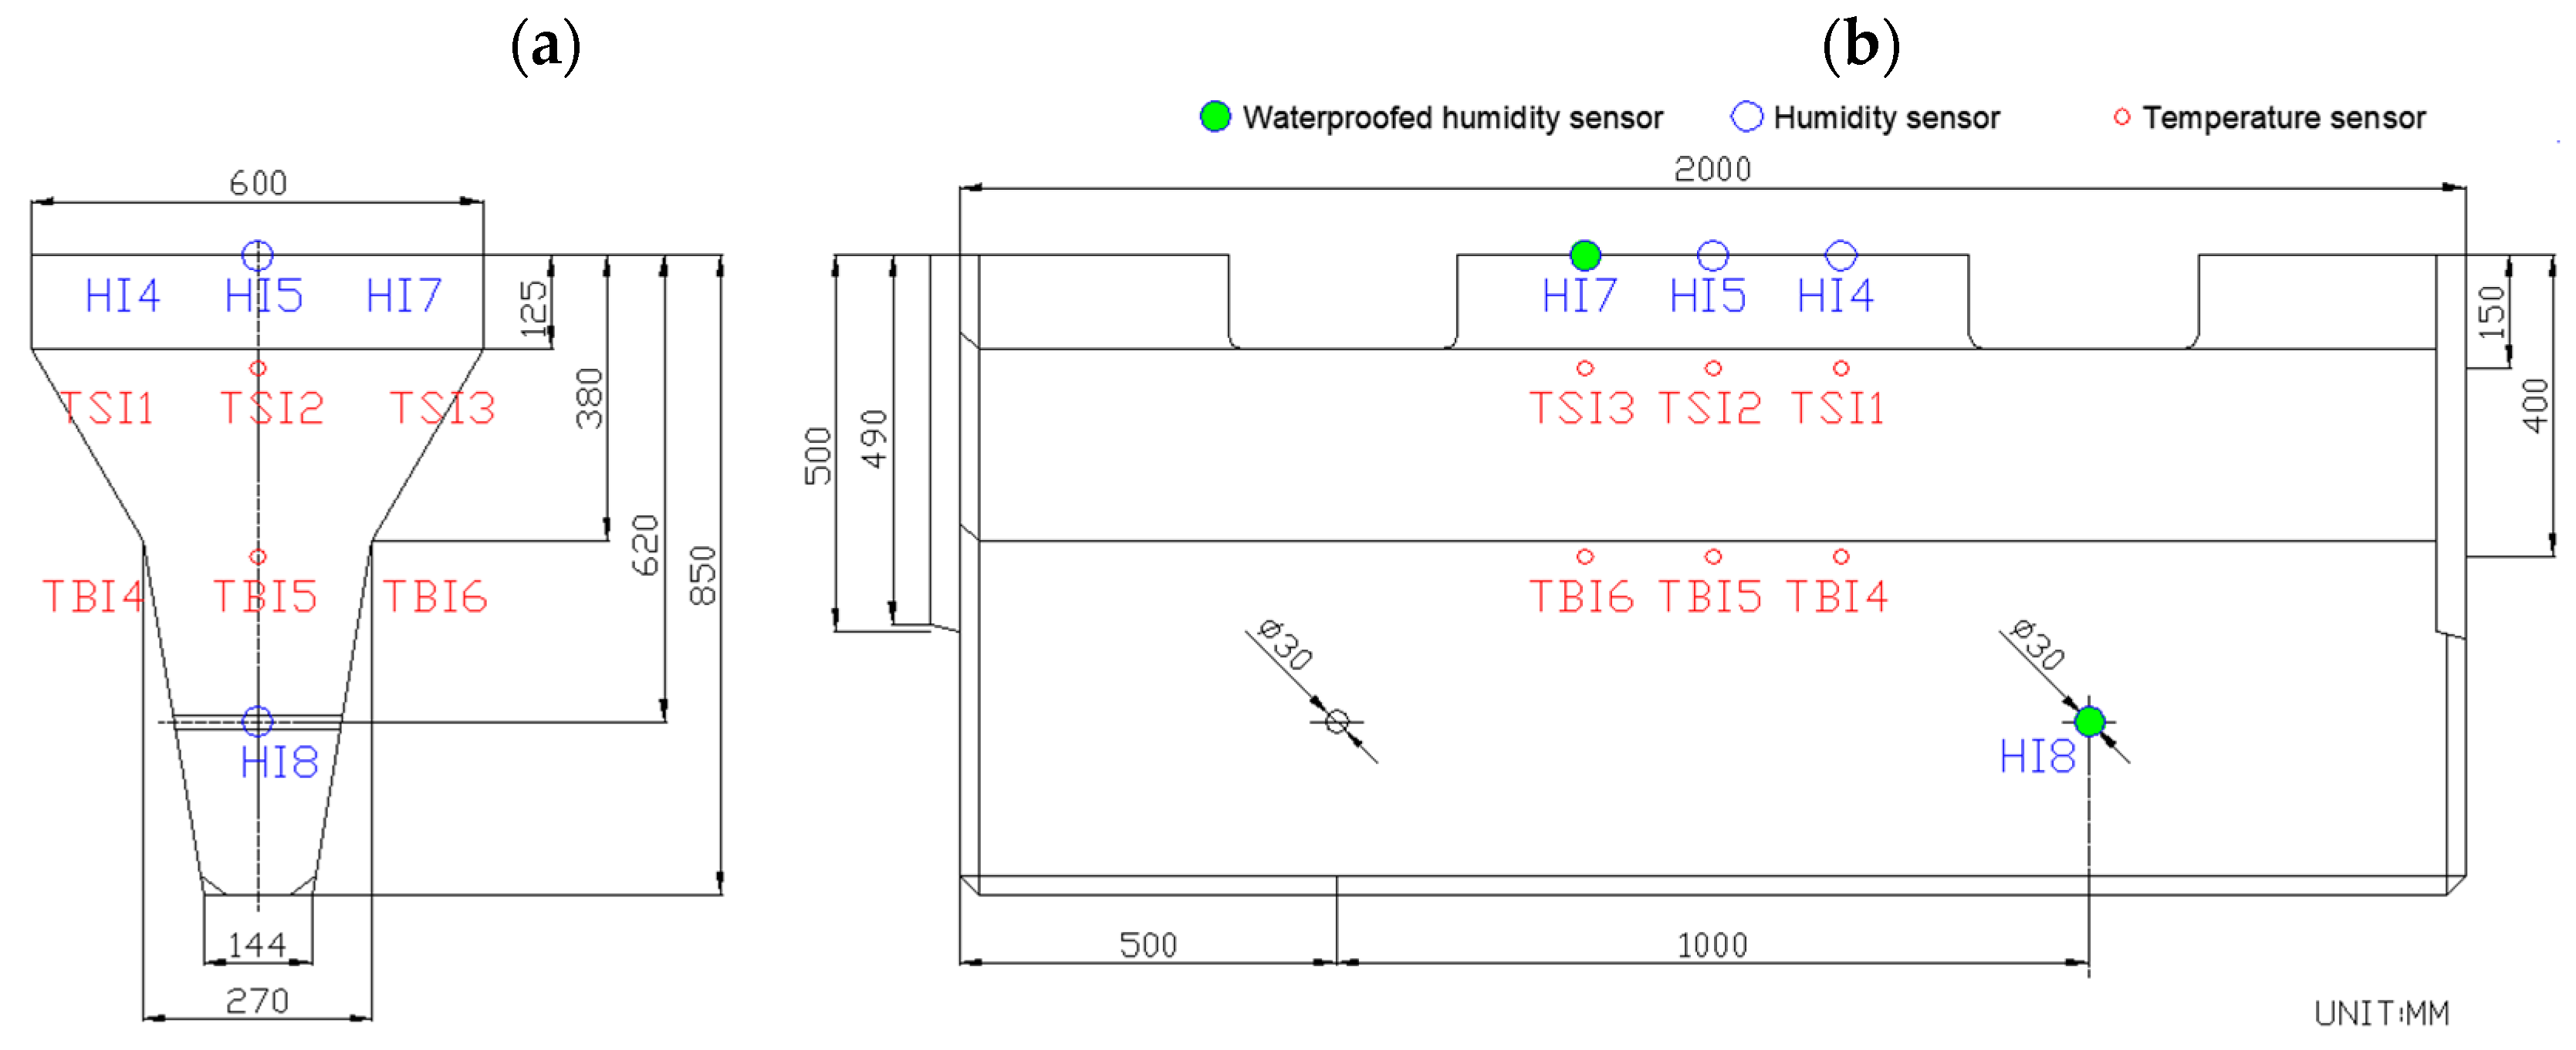
The sensor nomenclature uses the following designations in sequential order:
Figure 5 depicts the sensor locations on the New Jersey barrier specimen. Six temperature sensors (TSI1, TSI2, TSI3, TBI4, TBI5, and TBI6) and four humidity sensors (HI4, HI5, HI7, and HI8) were placed in the specimen. Half of the temperature sensors were placed near the surface of the specimen at a depth of 15 cm, like the previous tests conducted on cylindrical specimens in the laboratory. The other 3 temperature sensors (TBI4, TBI5, and TBI6) have been placed at a depth of 40 cm in the concrete core. This allows for the observation of temperature differences at different depths within the concrete. Furthermore, it has been proposed to utilize a PVC pipe, which is used to form the drains of the specimen, to waterproof the humidity sensor (HI7) and position it, along with a temperature sensor, at this location.
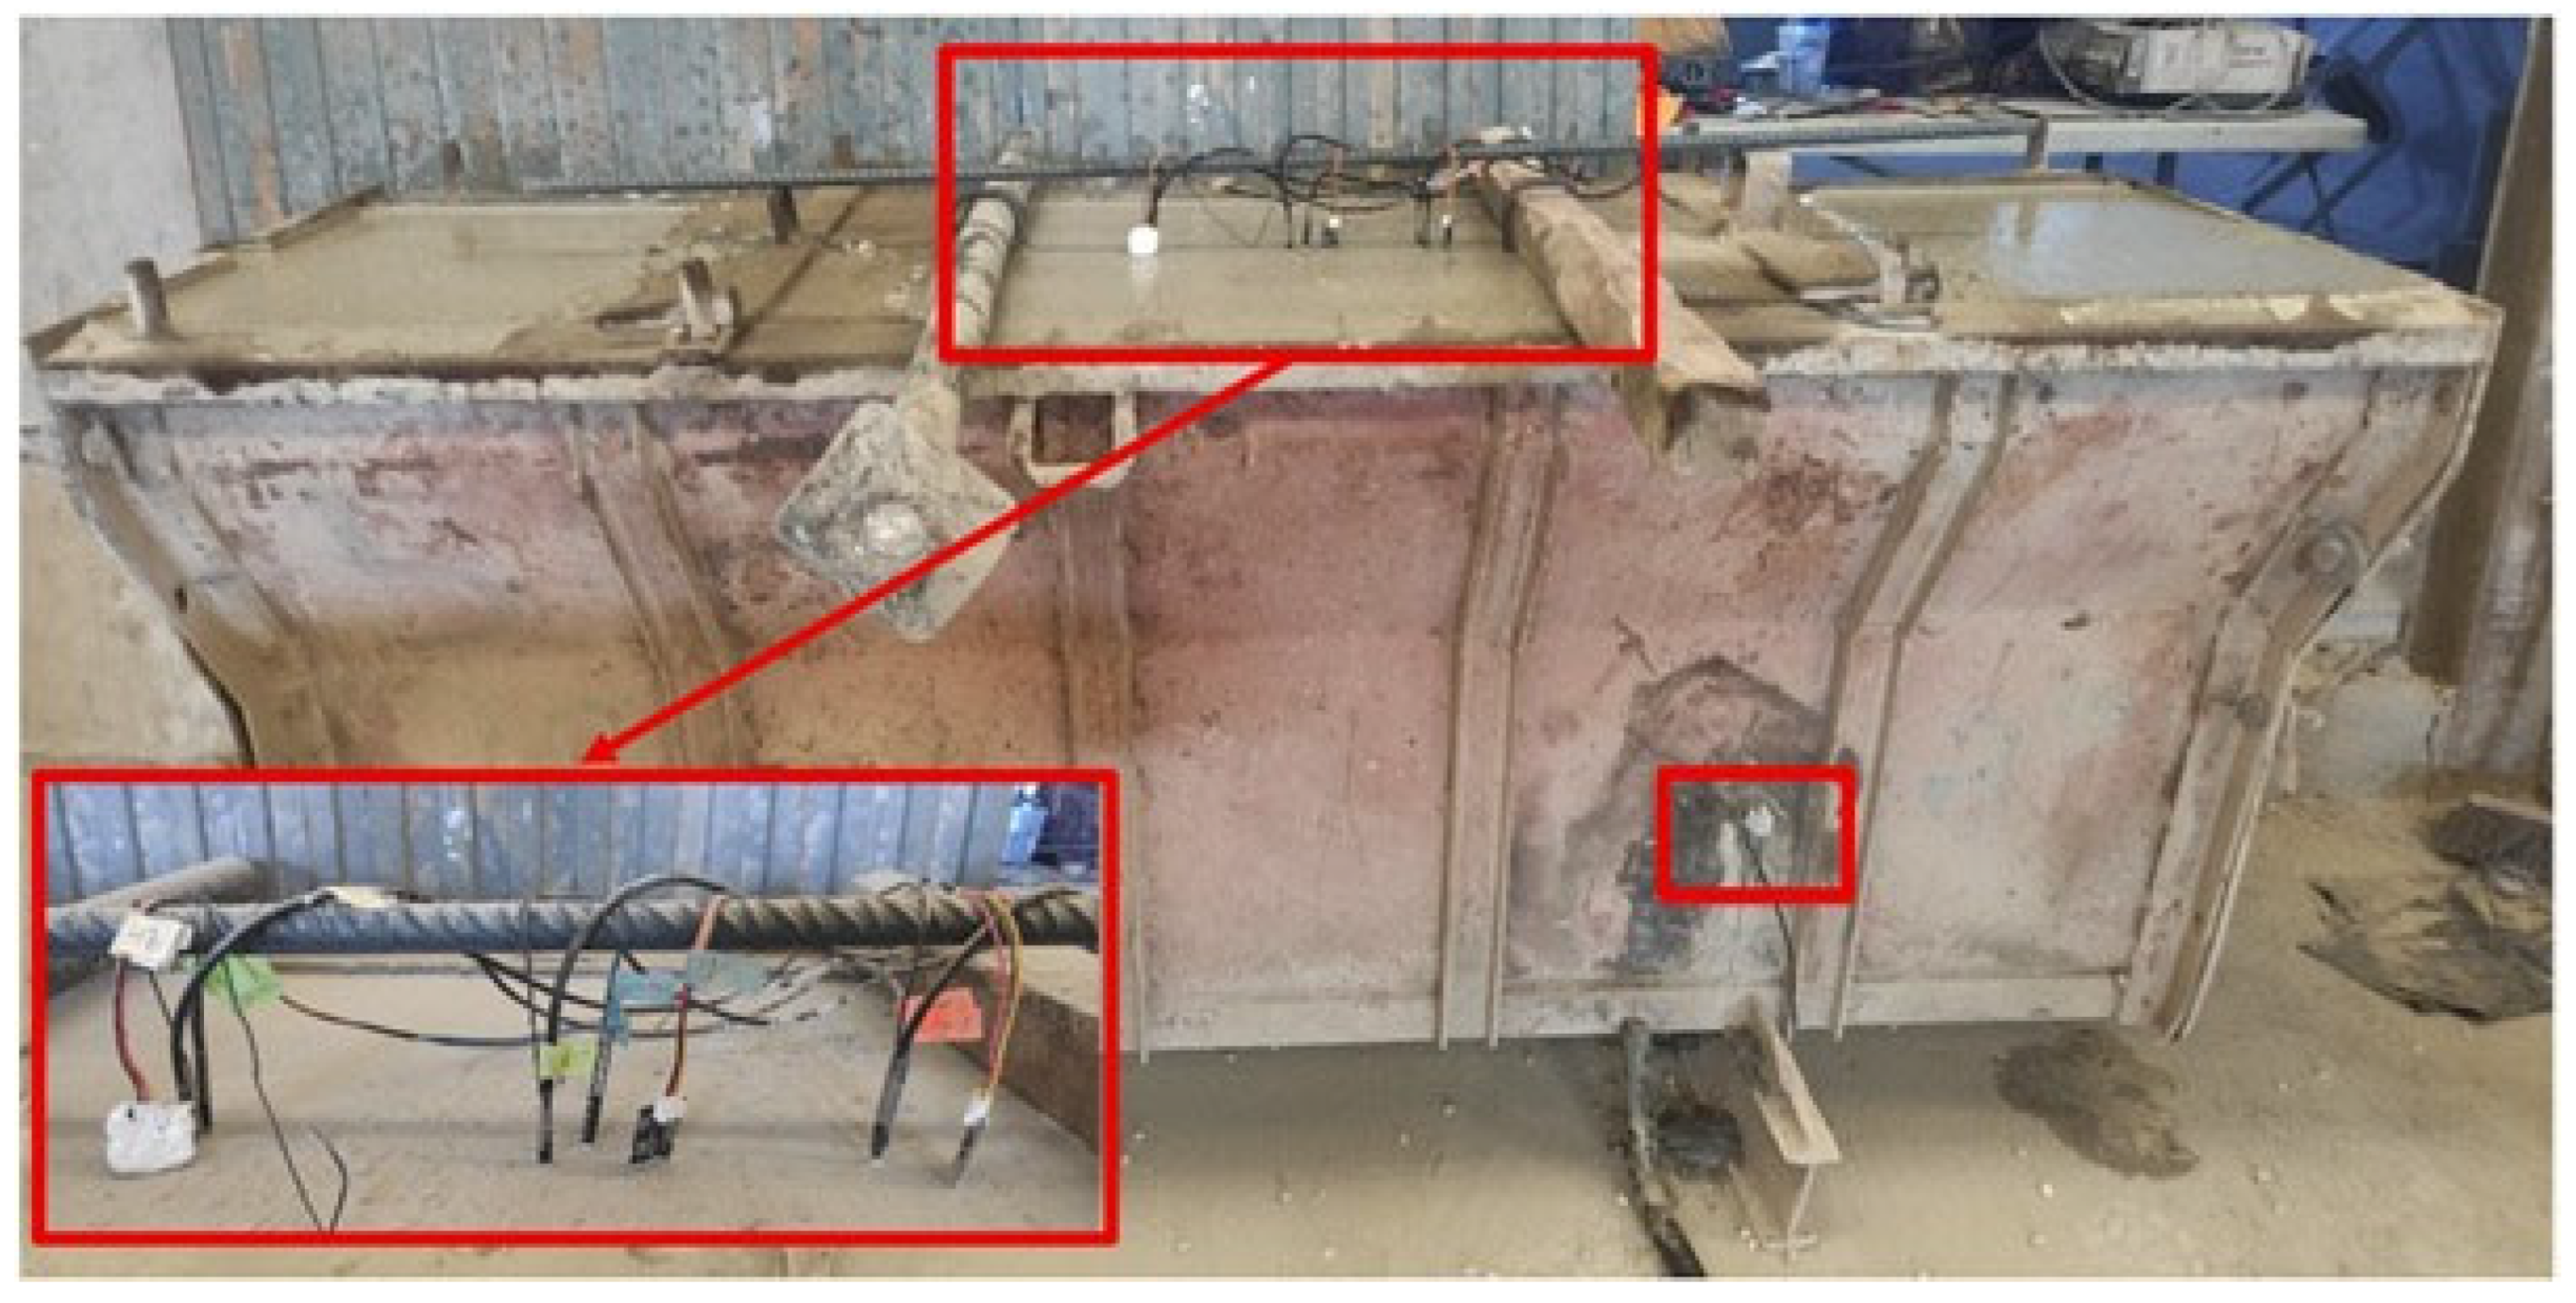
The sensors were connected to the Arduino board located in a nearby area, as can be seen in the photograph in
Figure 6.
Additionally, 7 sensors were placed to measure ambient temperature. These sensors were placed divided into two groups and located in two different areas. Sensors T8 and T9 were placed in a zone closer to the specimen, inside the factory, while sensors T10, T11, T12, T13, and T14 were positioned in an area further away from the specimen, near the exterior zone of the factory unaffected by the concrete volume.
Diagram of Sensor Connection with Arduino Mega
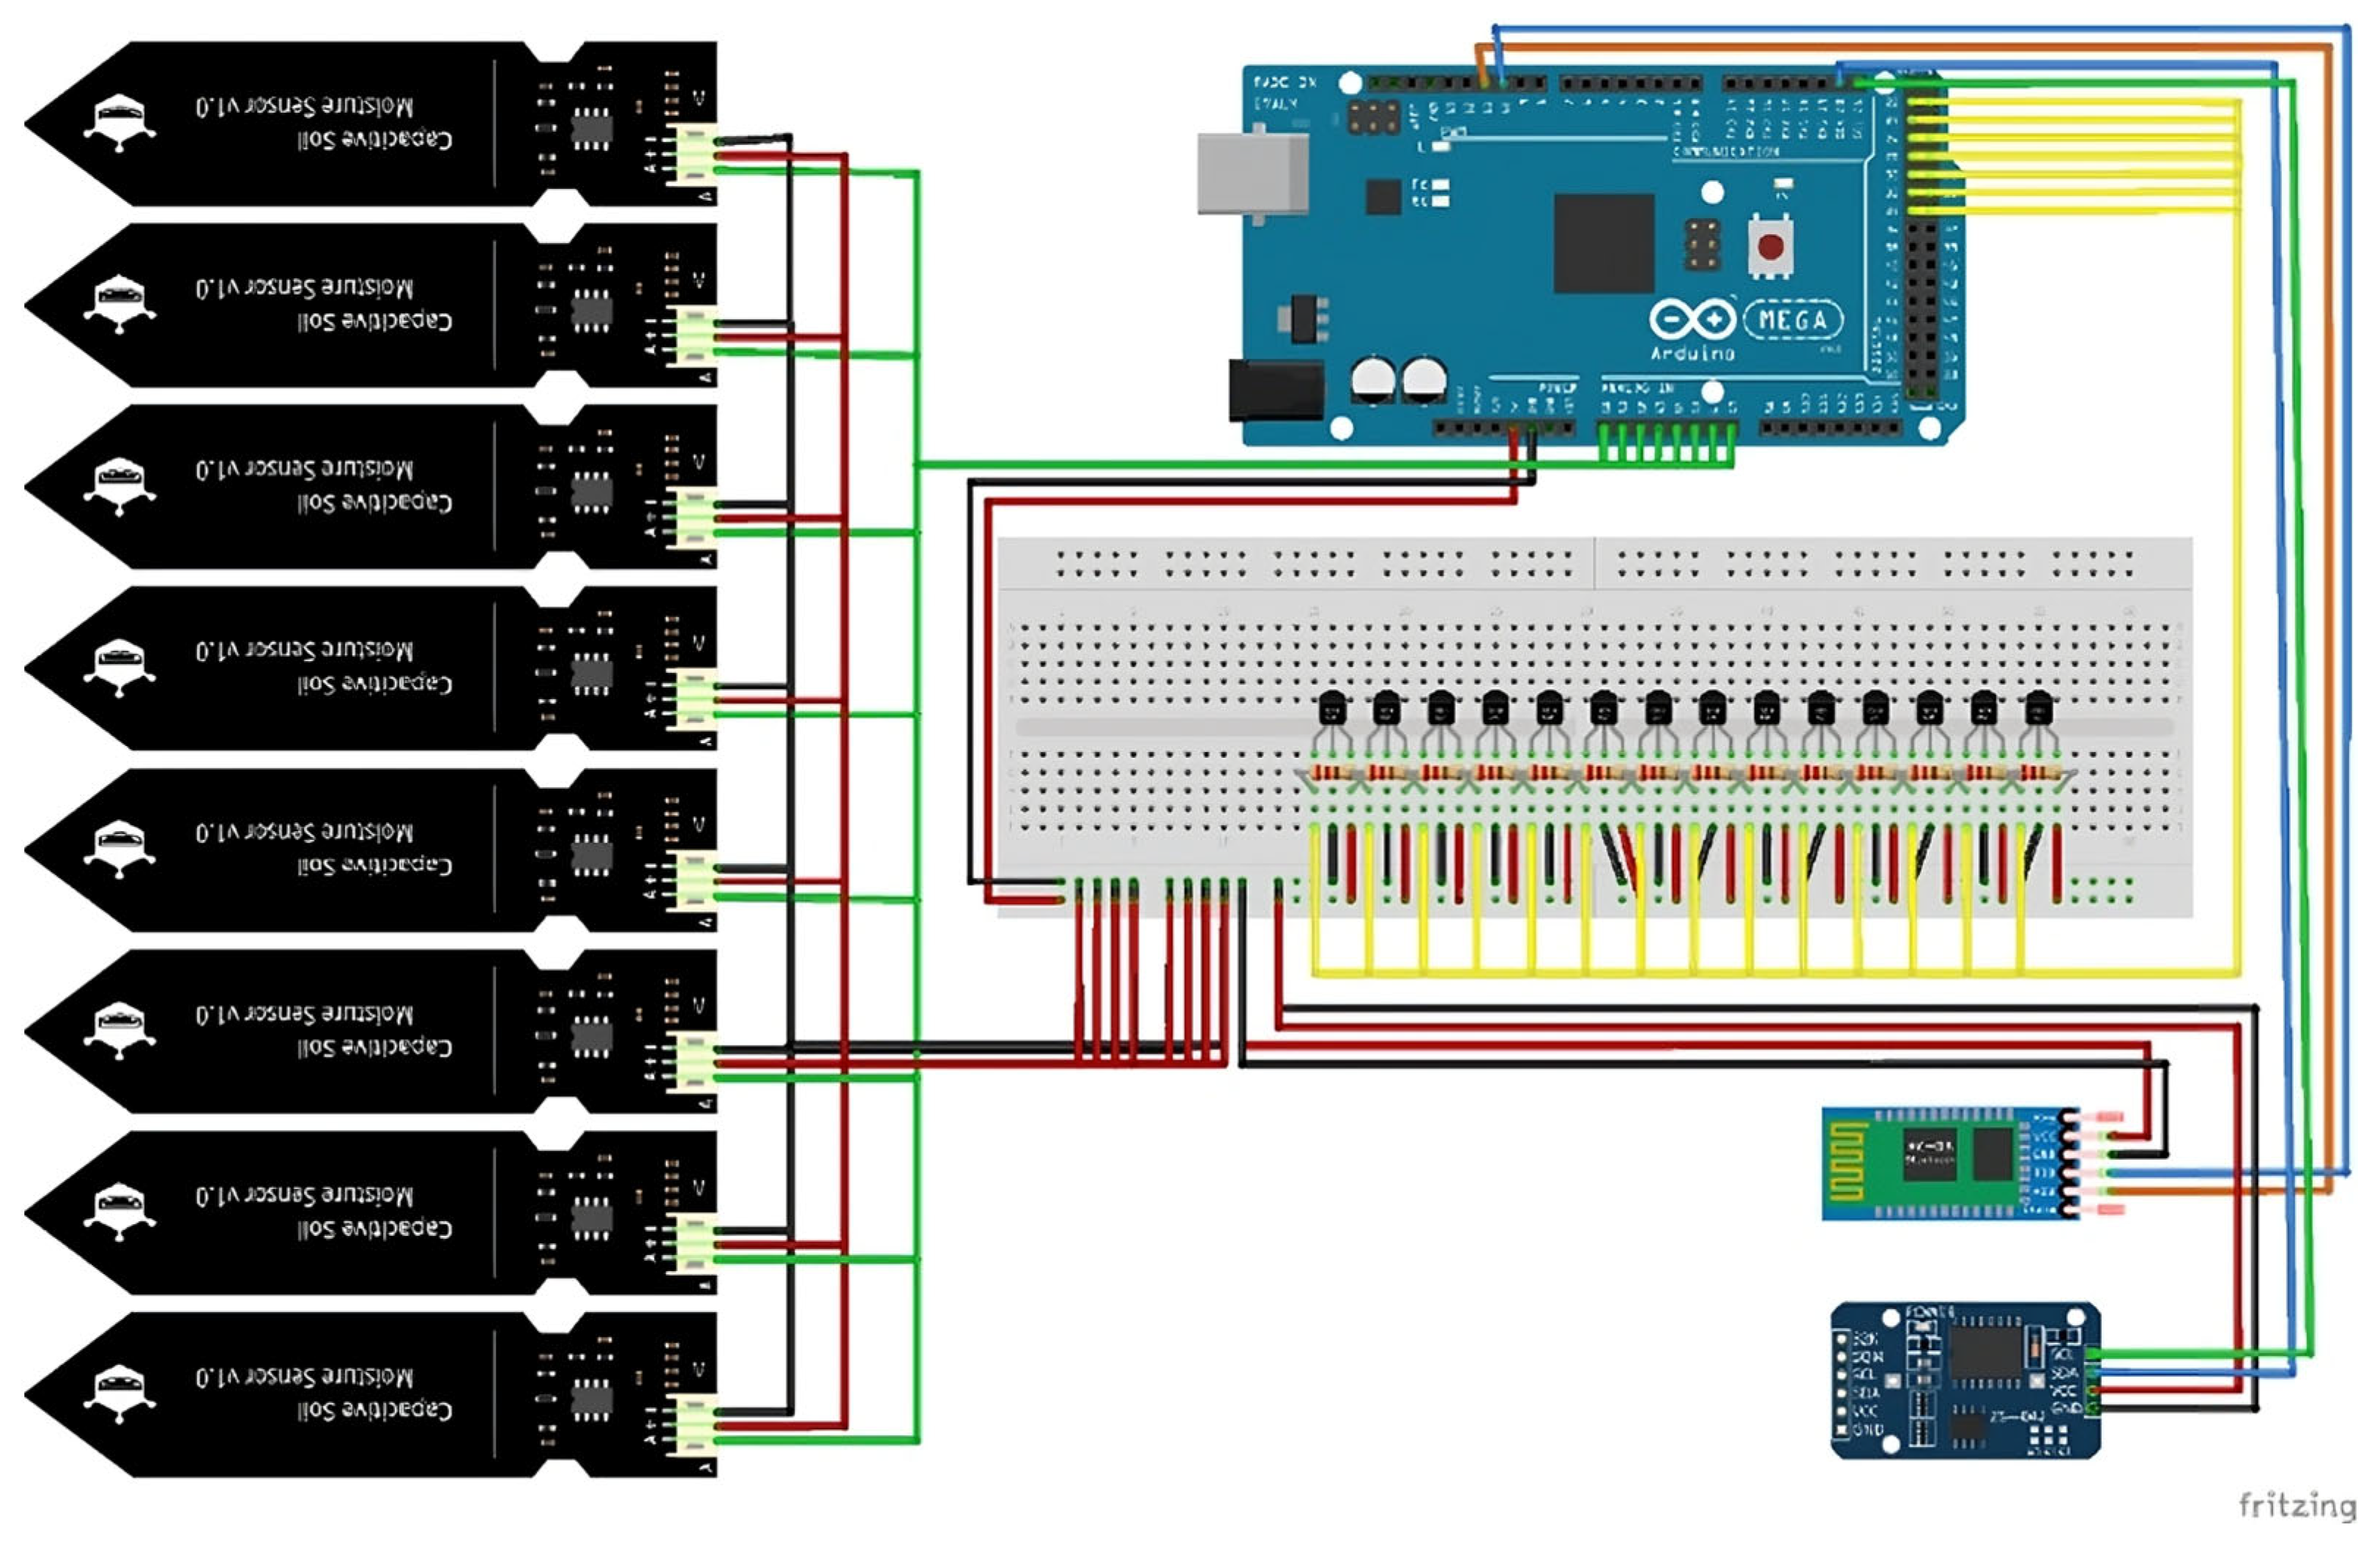
A total of 10 sensors were placed—6 temperature sensors and 4 humidity sensors. All these sensors need to be connected to the same Arduino board to conduct the test. Details of the circuit connection between the sensors and Arduino are shown in
Figure 7.
It should be noted that the temperature sensors are represented using the symbol of the DS18B20 temperature sensor in its encapsulated format instead of the waterproof probe in order to simplify the diagram representation. However, the connections are the same as shown in the diagram.
2.5. Quality Control Metrics and Property Links
The monitoring system supports QC by computing the following: (a) Tp, tp, dT/dt|0–12h, and ΔT (surface–core) to assess heat of hydration and thermal gradients; (b) dRH/dt|0–24h and stabilized RH to screen for surface desiccation risk; and (c) a maturity index M(t) from internal temperature histories. Using the Nurse Saul formulation, M(t) = Σ(Ta − T0)Δt, with Ta the concrete temperature, T0 a datum temperature, and Δt the logging interval. When calibration data for a given mix are available, strength can be estimated via a maturity–strength function f_c(t) = F(M(t)) determined experimentally for that mix. In this study, we report the QC metrics (Tp, tp, ΔT, dRH/dt) and compute M(t) from the recorded temperature curves as a basis for plant-level curing management; quantitative f_c–M calibration is identified as future work for each plant mix.
3. Results
This section includes all the experimental campaign results.
3.1. Results of Preliminary Test at UCLM Laboratory
This section presents the results from the preliminary laboratory tests conducted on cylindrical concrete specimens. The main goal is to assess whether the recorded data align with expected theoretical values. The accuracy of the data is evaluated through comparative analysis of temperature measurements at different depths, and variations in temperature between surface and depth are examined.
The data collected by the surface temperature sensors show high consistency (see
Figure 8), with minimal differences between measurements. Temperatures start around 20 °C, rise to approximately 23 °C at 8 h, and then decrease steadily to around 15 °C after 33 h. The curves later fluctuate within the 18–24 °C range, stabilizing towards the end of the test. The maximum standard deviation is 0.18 °C, indicating a high degree of data reliability. Similar to the surface data, the depth sensors show homogeneous temperature trends (
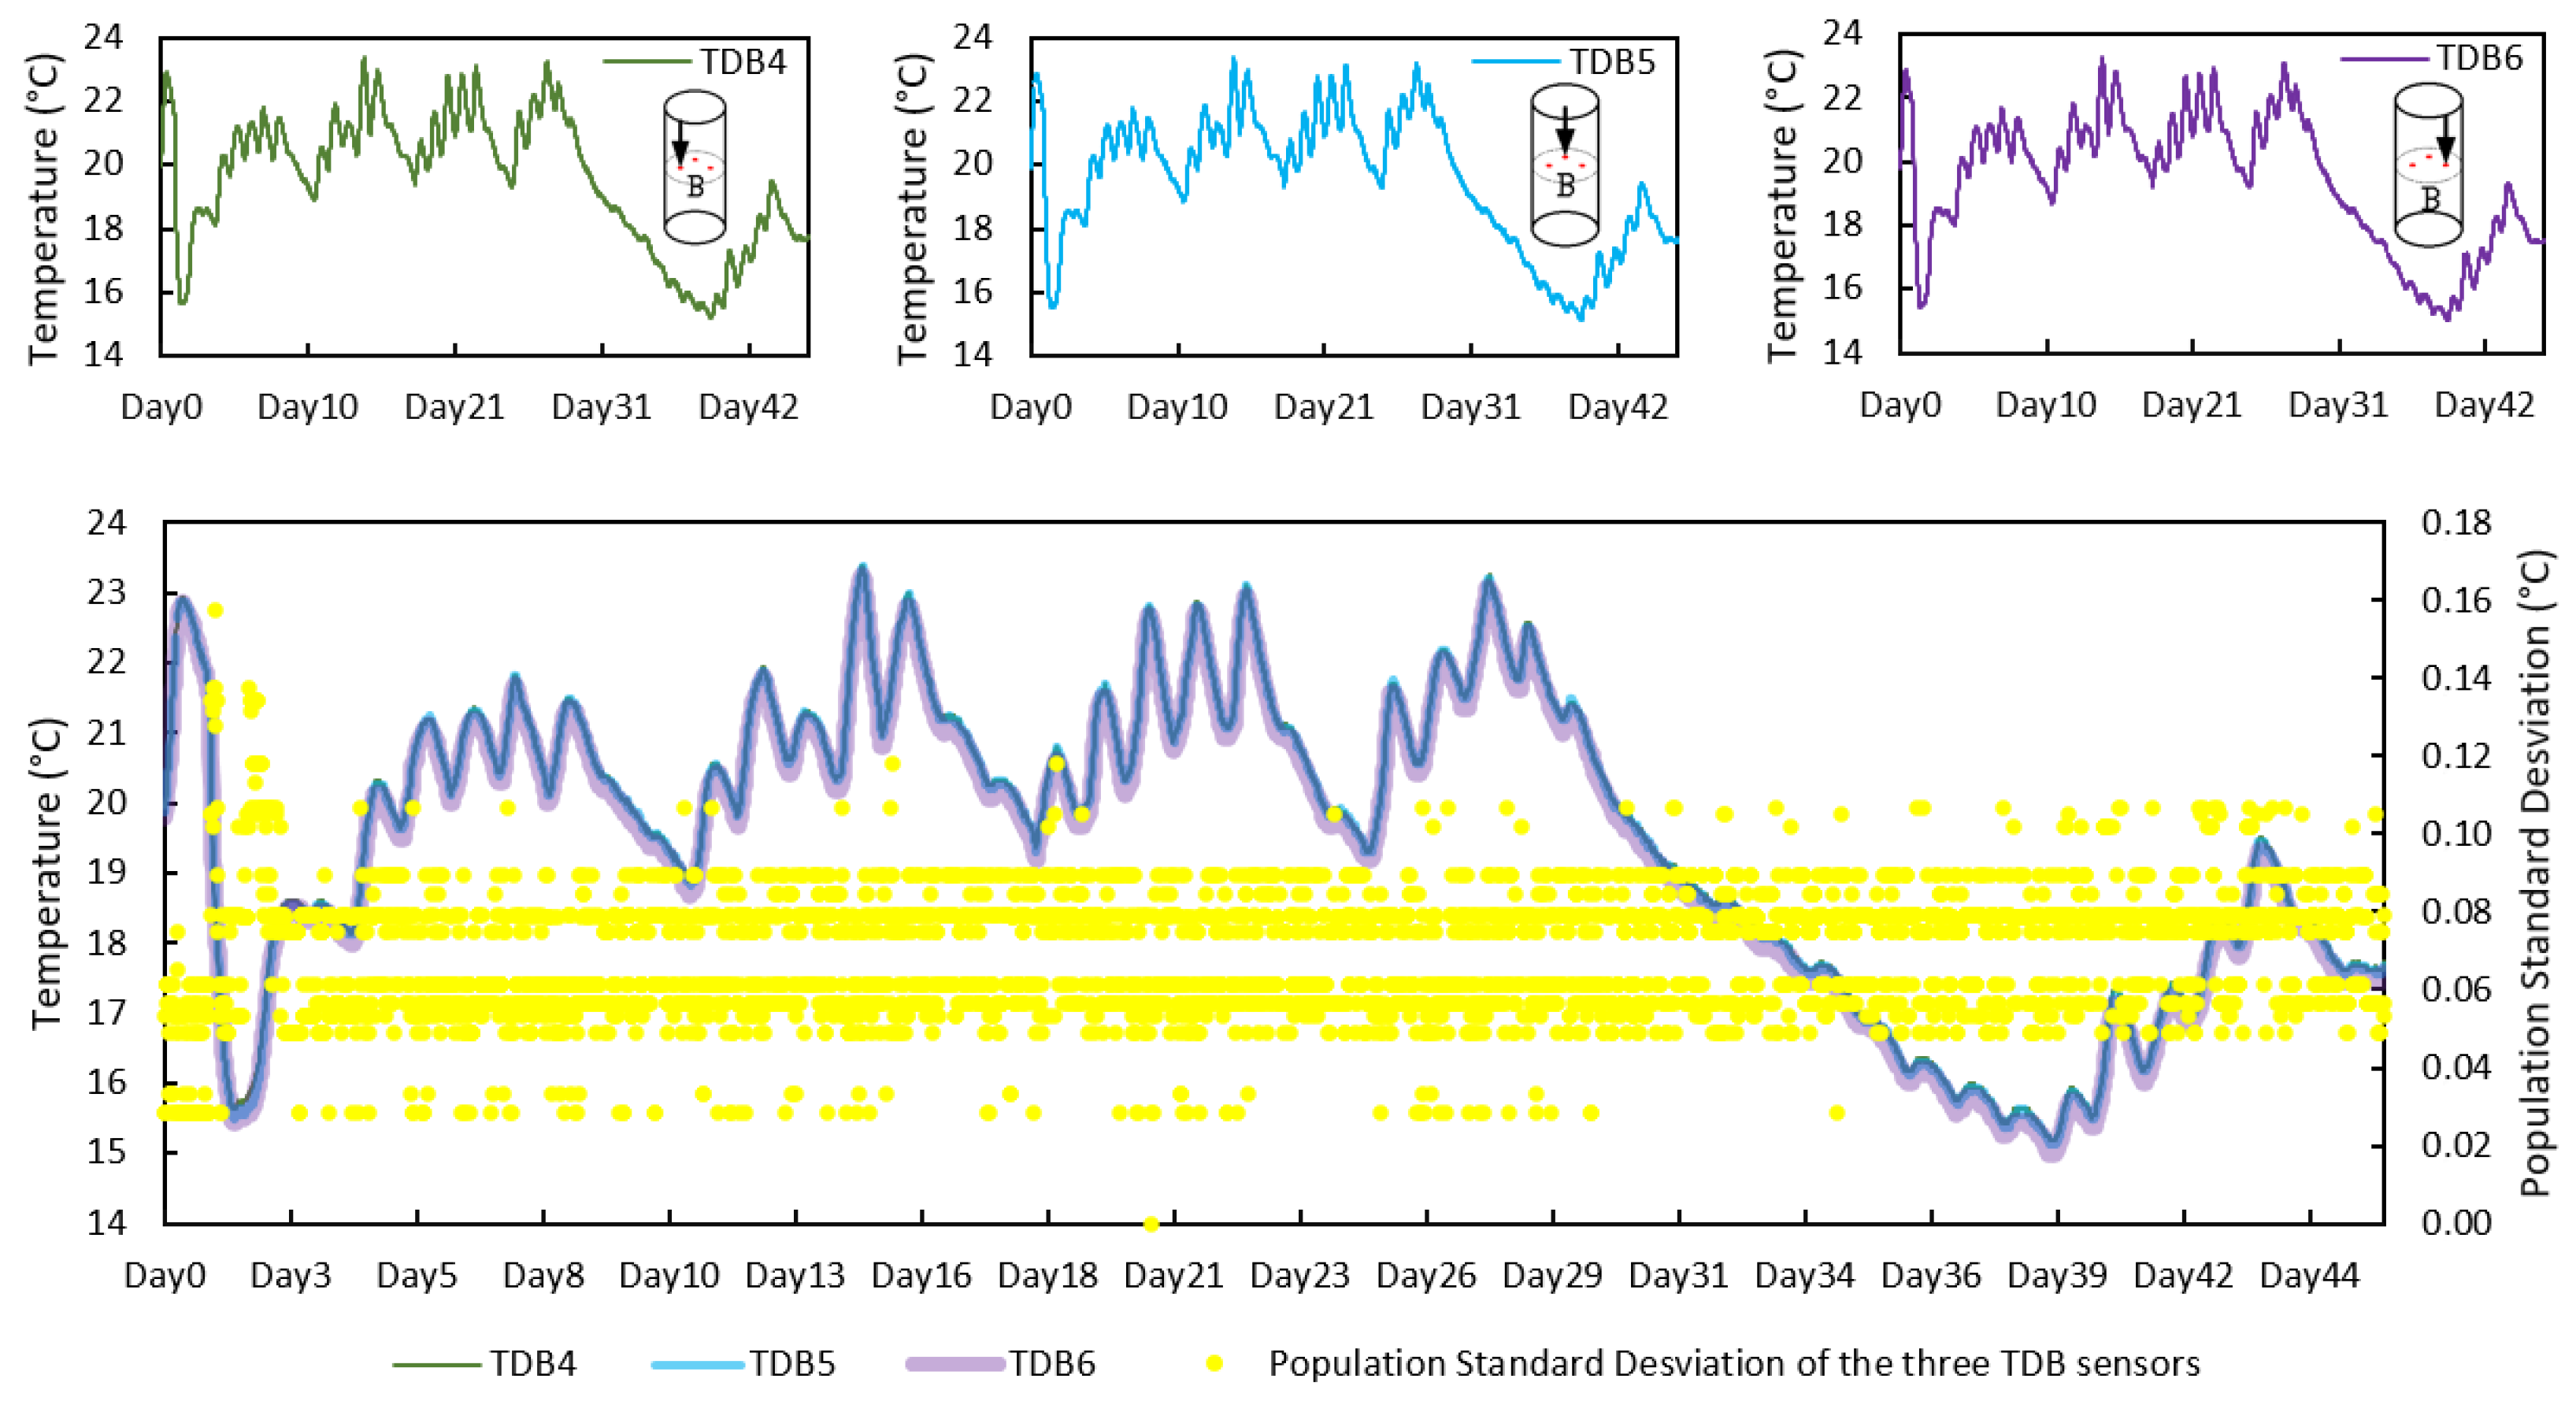
Figure 9), with a maximum standard deviation of 0.16 °C. This suggests that temperature variations in deeper zones are more uniform compared to surface zones.
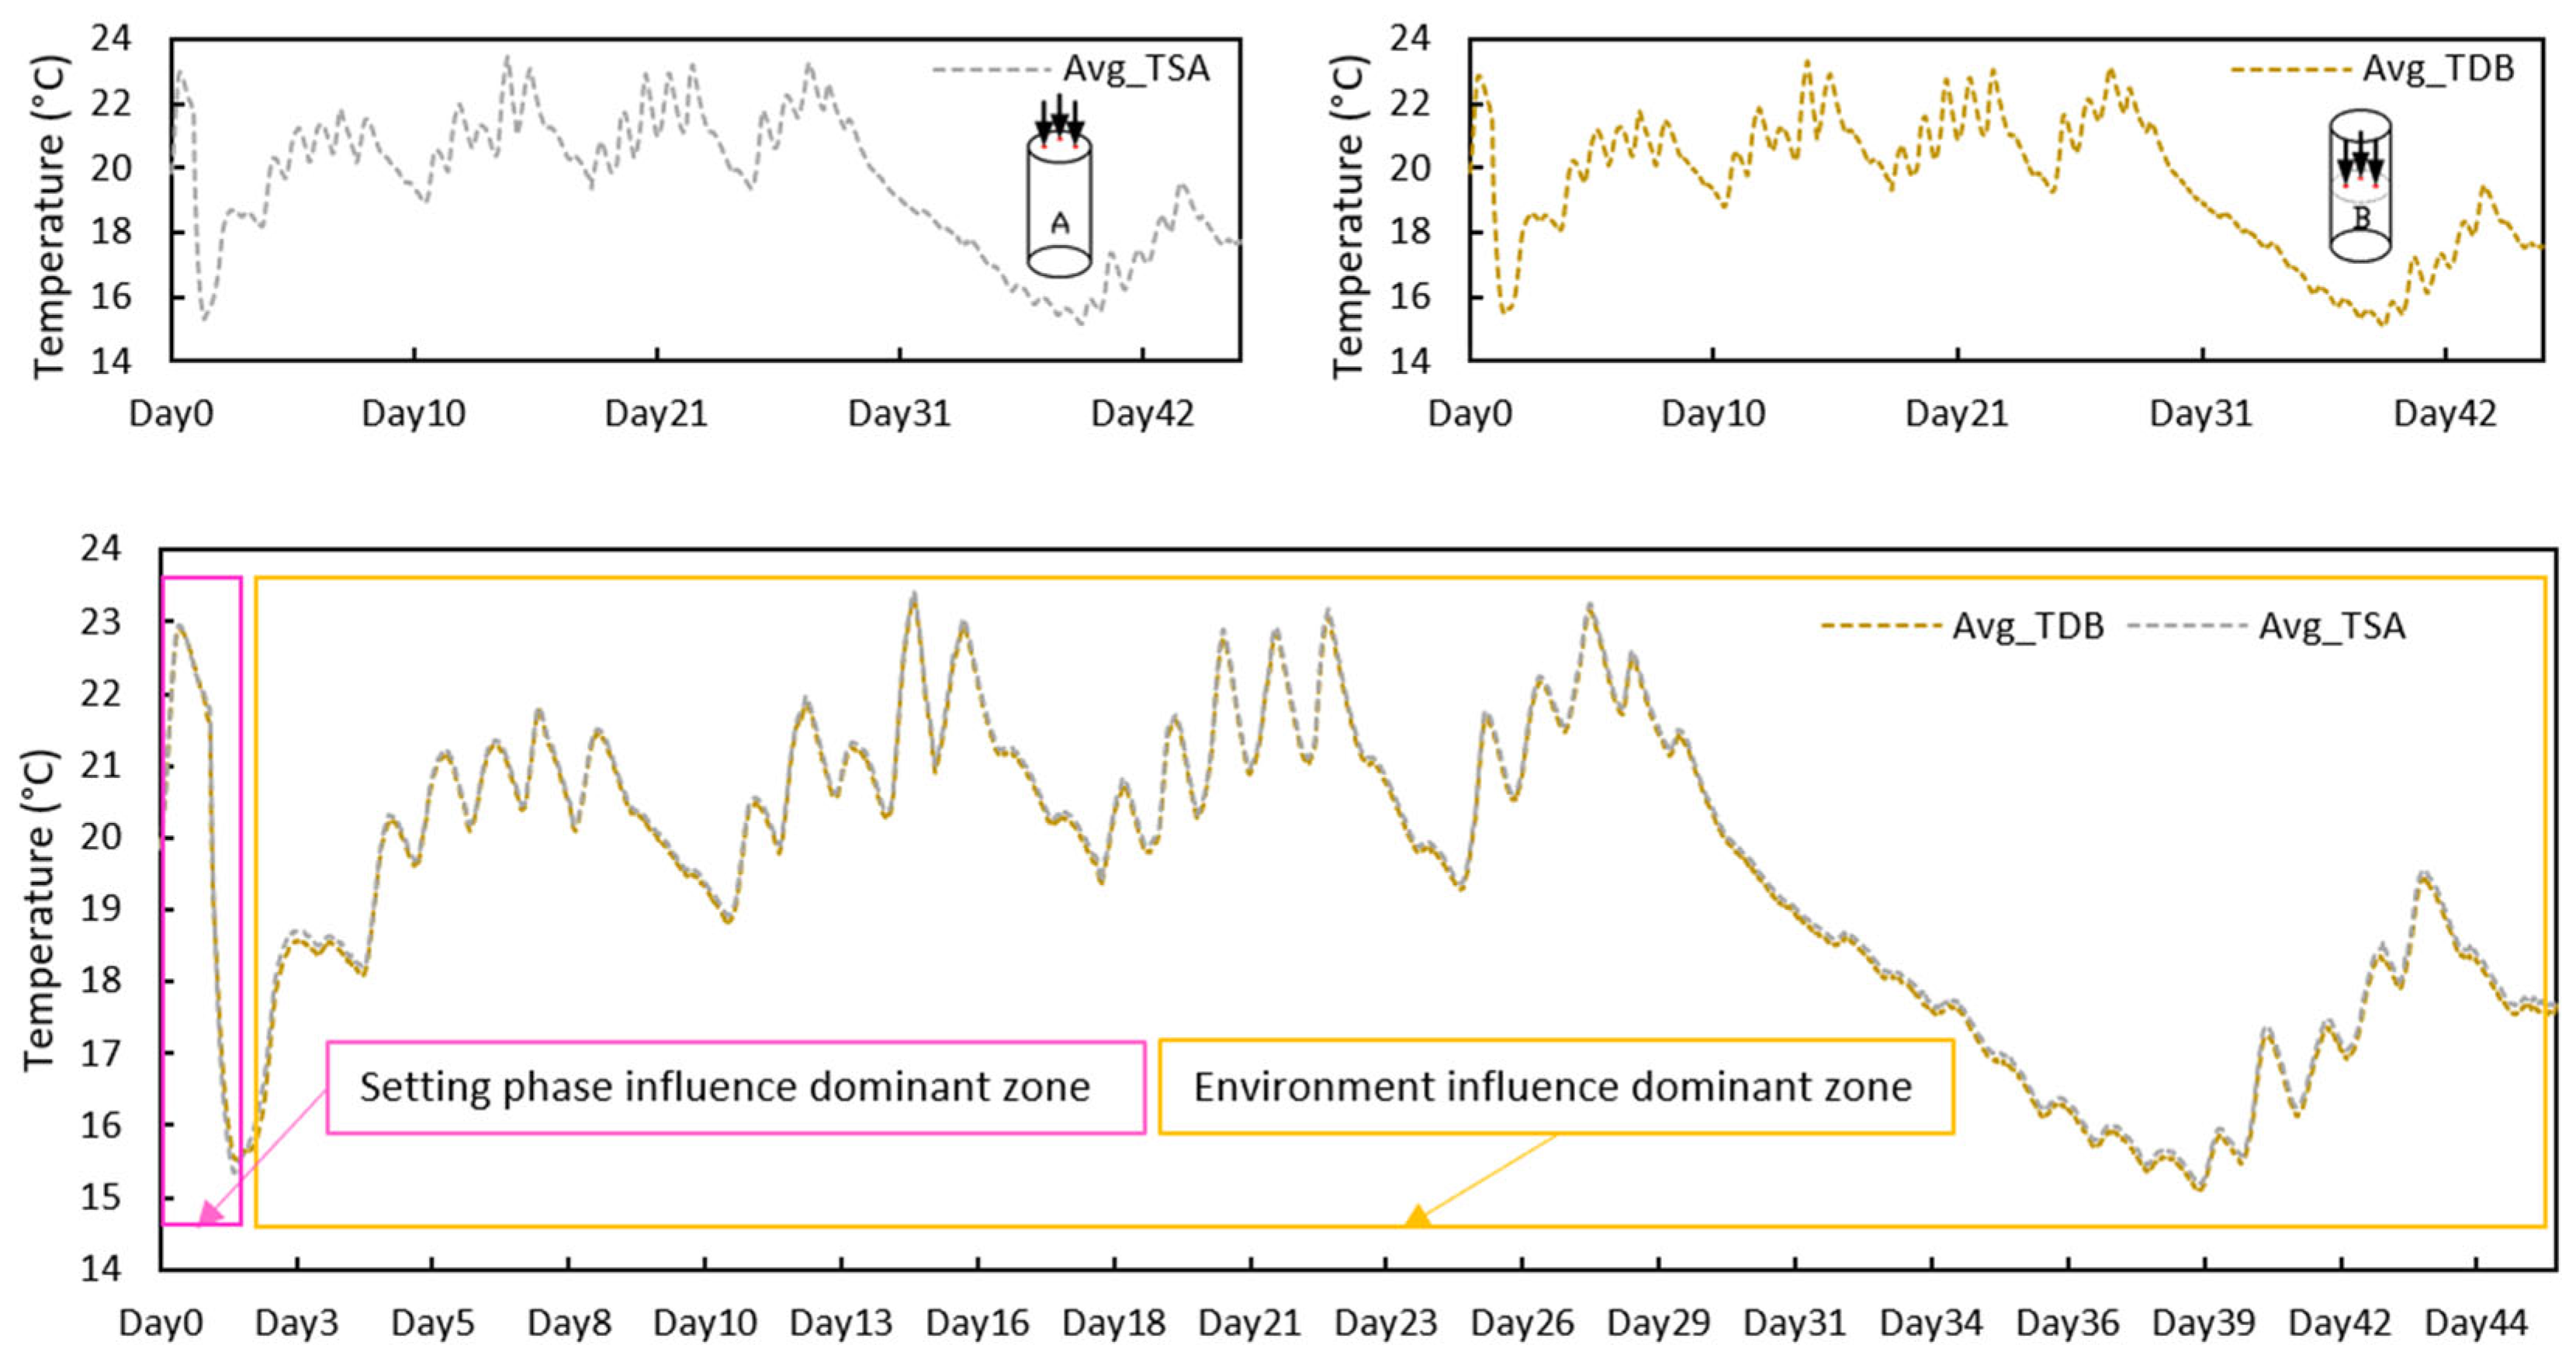
The averages of temperature curves in the superficial and depth zones of the concrete are presented in
Figure 10. Both surface and depth temperature averages follow the same trend, indicating a relatively uniform temperature distribution throughout the specimen. Significant temperature changes are observed during the early setting phase of the concrete, after which the influence of ambient temperature becomes more dominant.
The surface temperature sensors exhibited a mean value of 19.53 °C, with a standard deviation (SD) of ±0.18 °C and a coefficient of variation (CV) of 0.92%. Depth sensors showed slightly lower dispersion, with an SD of ±0.16 °C and a CV of 0.83%, indicating excellent consistency in both regions.
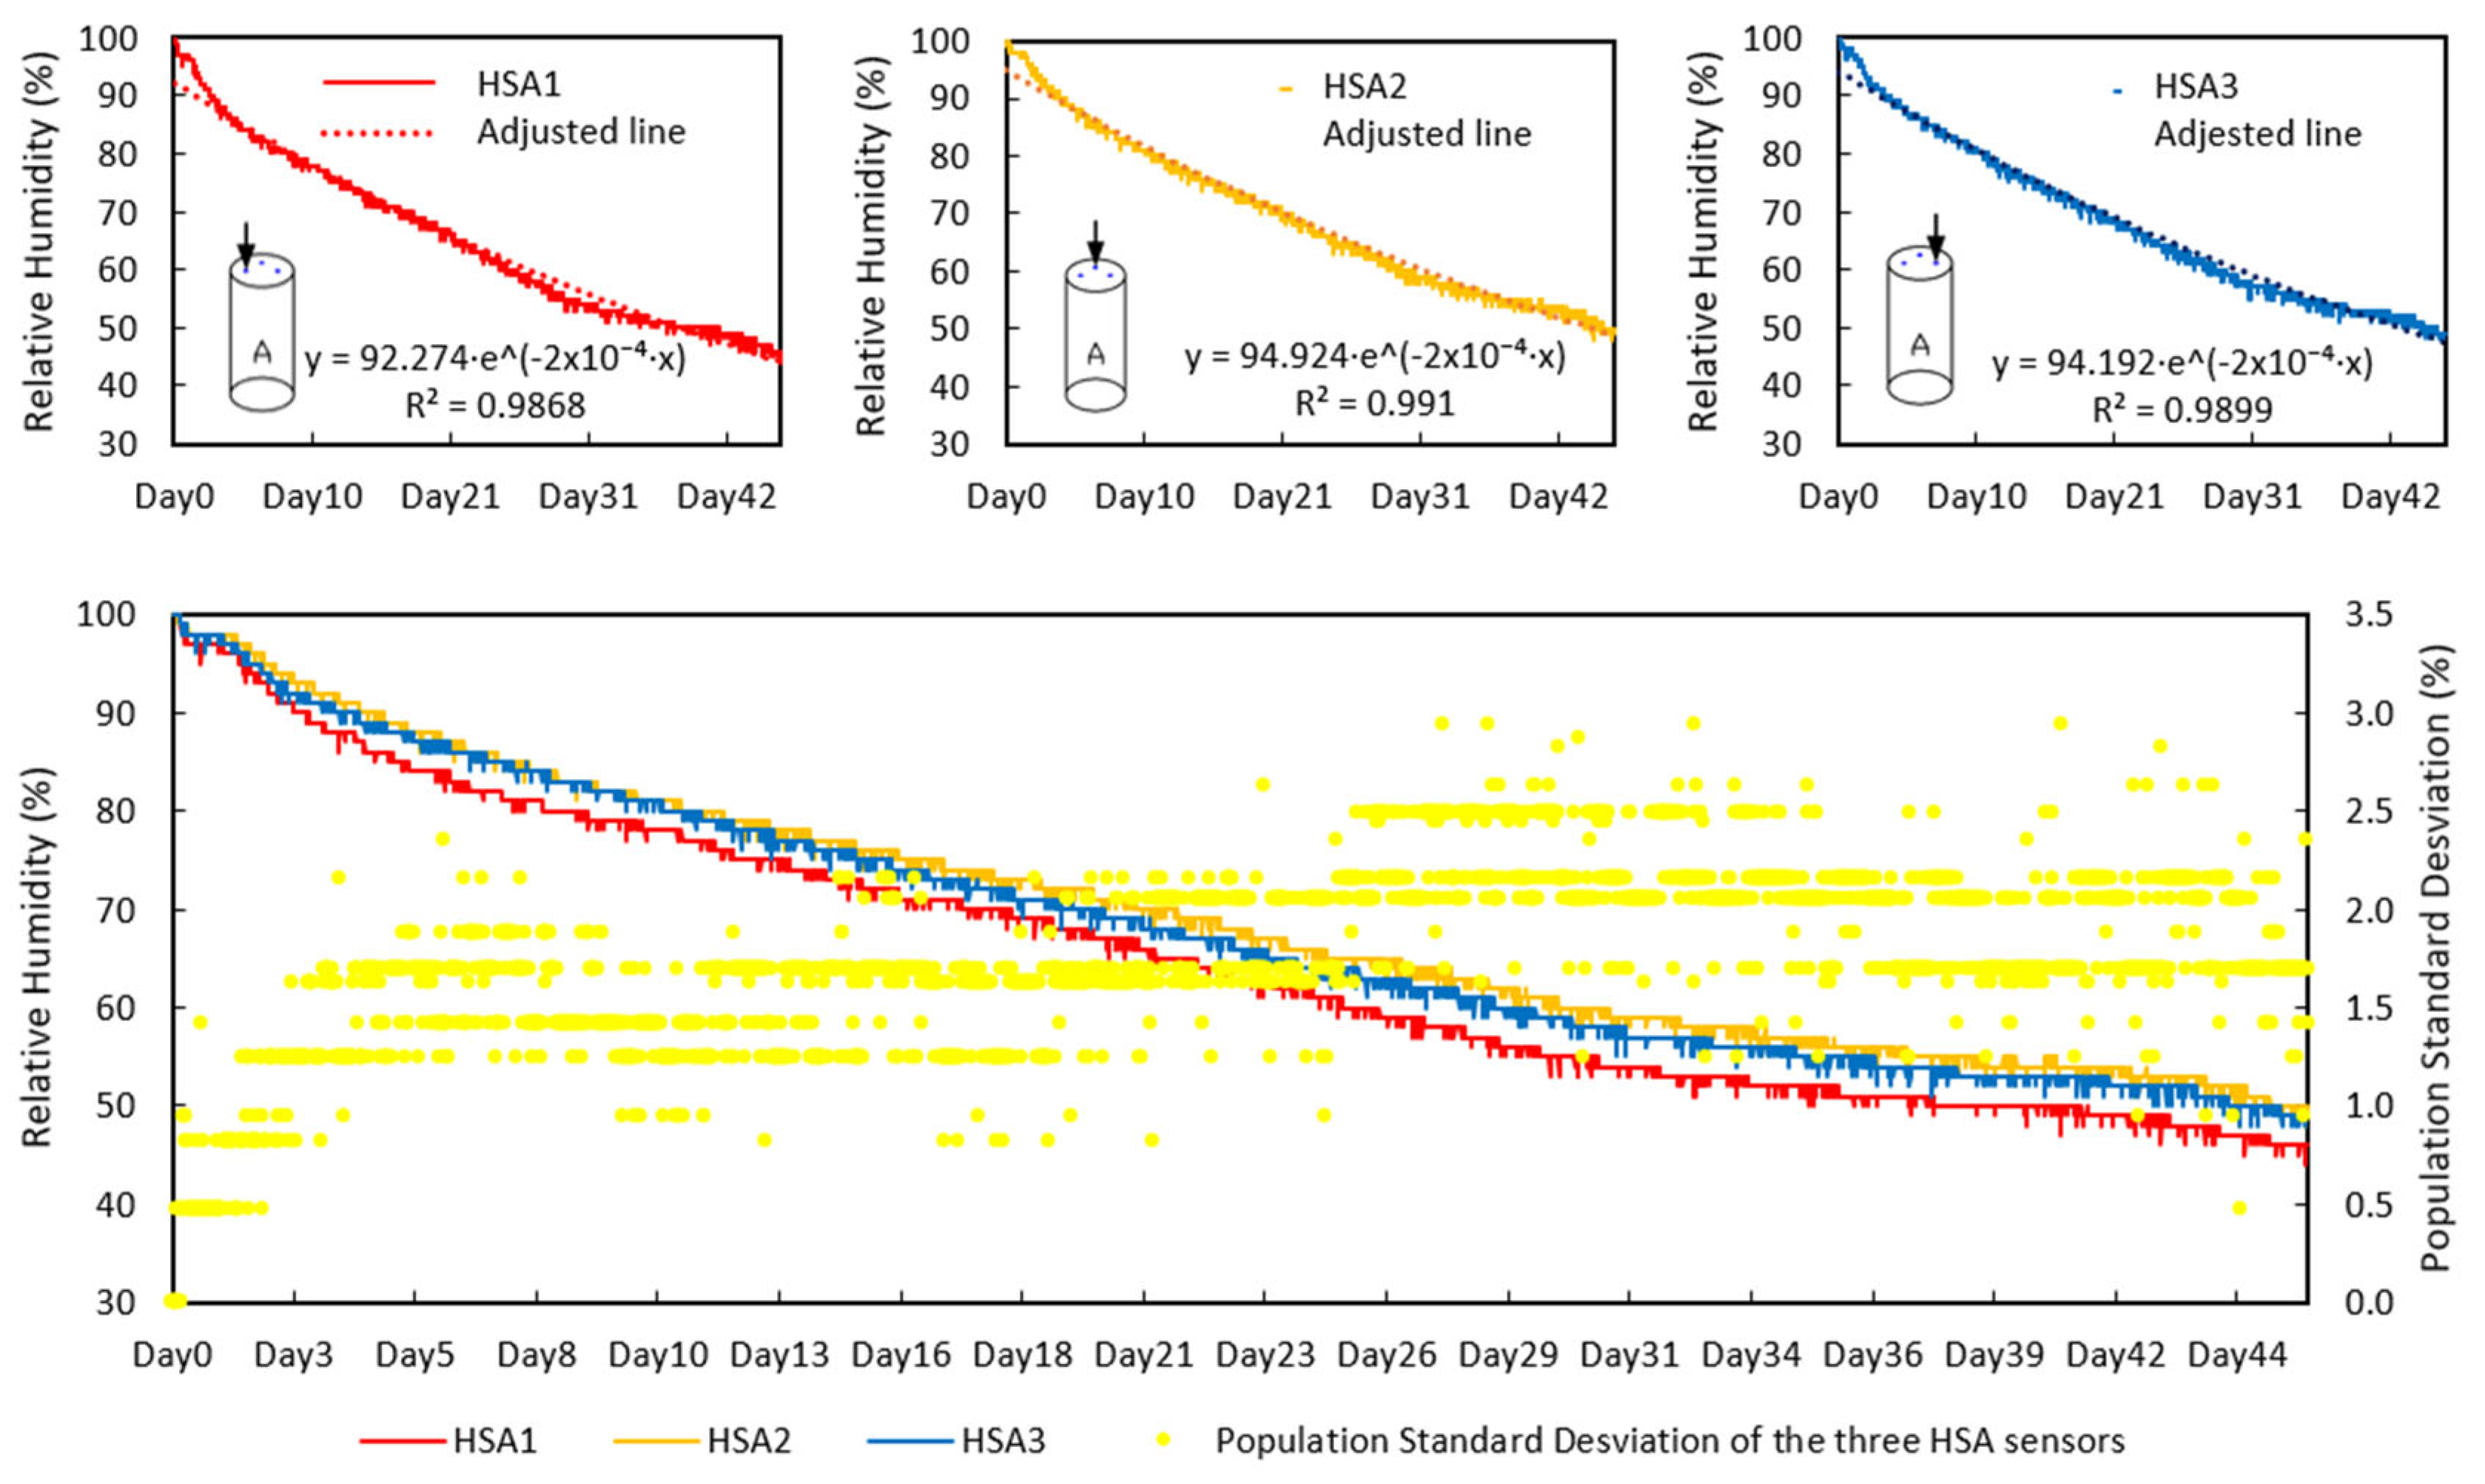
In
Figure 11, the curves of relative humidity data collected by three humidity sensors (HSA1, HSA2, and HSA3) from the superficial zone of specimen A are displayed. The three relative humidity curves start with a maximum value of 100% and decrease exponentially over time, showing a similar trend. Data collected at the end of the experiment indicate that the relative humidity reaches approximately 45%. Humidity data in specimen A presented a mean value of 72.39% and a maximum standard deviation of 2.94%, resulting in a coefficient of variation (CV) of 4.06%. These values suggest good consistency between sensors, with only minor variations in moisture loss across the surface. Specifically, the curve corresponding to the humidity sensor HSA1 exhibits a steeper decline than the other two curves from the same area, possibly due to slightly different local conditions or the sensor’s sensitivity. In contrast, specimen B (
Figure 12) showed greater variability in humidity data, with a mean value of 65.0%, a maximum standard deviation of 7.04%, and a CV of 10.8%, suggesting more heterogeneous internal moisture distribution in the deeper zones.
The results of the relative humidity data are consistent with theoretical expectations. The water content in concrete tends to decrease as it reacts with the cement or evaporates from the surface. Therefore, a downward trend in water content within the concrete over time is expected. The deviation curve starts at a value of 0 and increases during the initial days of the experiment. Subsequently, it oscillates within a specific range until the end of the experiment.
Despite these variations, both specimens exhibit consistent overall humidity trends, supporting the need for multiple humidity sensors to improve data accuracy. A clear relationship between temperature fluctuations and moisture loss is observed, especially during the early hours of the test when rapid temperature changes correspond to a steeper decrease in humidity.
Below, the relationship between humidity and temperature variations is analyzed. In
Figure 13, it can be observed that abrupt changes in temperature during the initial hours of the experiment correspond to a steeper slope in humidity decrease. In the temperature segment with stable oscillations, the humidity curve shows a gradual and uniform decline. These repetitive cycles cease at day 31, and the internal temperature continues to decrease until reaching a minimum on day 39. During this period, the rate of decrease in the humidity curve softens until the temperature begins to rise again. In conclusion, the rate of moisture loss on the concrete surface is closely related to the internal temperature of the concrete.
3.2. Results of Verification Test at the Factory
As part of the system validation process in an industrial environment, a set of sensors was installed on cylindrical specimens of self-compacting concrete at the factory. These sensors were intended to monitor temperature and humidity evolution under real production conditions. Unfortunately, due to an unexpected electrical failure at the facility, the data acquisition system was interrupted, and the sensors were only able to record data for approximately one hour. As a result, the environmental monitoring test could not be completed.
Despite this limitation, the cylindrical specimen containing the embedded sensors was preserved and later used to evaluate the potential influence of sensor placement on the mechanical properties of the concrete. This was carried out by comparing its performance in indirect tensile strength tests (Brazilian test) with that of similar specimens without sensors.
The results are presented in
Table 1. Specimen P1, which contained embedded sensors, exhibited a tensile strength of 6 N/mm
2. In contrast, specimens P2 and P3, which did not contain sensors, reached values of 7.5 N/mm
2 and 9.6 N/mm
2, respectively. This represents a reduction of up to 37.5% in tensile strength for the instrumented specimen. Although the sample size is limited, this trend suggests that the presence and location of sensors may negatively affect the mechanical performance of the concrete, particularly in small specimens where the relative volume of the sensor is more significant. This observation is presented as preliminary and highlights the need for further investigation.
Additionally, specimen P4 was tested under uniaxial compression and reached a compressive strength of 60.4 N/mm2, serving as a reference for the concrete’s overall mechanical performance.
Although only one specimen with embedded sensors was subjected to the Brazilian tensile strength test, the result provides preliminary evidence on the influence of sensor implantation in small-scale precast elements. This test was conducted under real industrial conditions, and its main objective was to assess the feasibility and limitations of embedded instrumentation in a less controlled setting. Despite its limited statistical value, this test helped identify potential interferences and informed the refinement of future experimental procedures.
However, as can be seen in the image of
Figure 14, the sensor does not significantly determine the fracture of the specimen.
3.3. Results of Test on New Jersey Barrier Specimen
Figure 15 displays the temperature curves obtained from the six temperature sensors. All temperature sensors in the New Jersey specimen recorded similar trends, with temperatures starting around 33 °C, peaking after 8 h, and then gradually decreasing. The maximum deviation between surface and depth sensors was less than 1 °C, indicating consistent data. The temperature curves also follow the expected pattern of heat evolution due to cement hydration.
This similarity is even greater when analyzing the results of the sensors by zones; that is, the three sensors located closest to the surface (TSI1, TSI2, and TSI3) show very similar results among themselves, with an average standard deviation of less than 1 °C (0.96 °C). The data from the three sensors located inside the concrete volume (TBI4, TBI5, and TBI6) present an even lower deviation of 0.47 °C. Additionally, in the gradual cooling phase, a more stable deviation with less oscillation is shown compared to the surface zone. This indicates that as the heat evolution process inside the concrete approaches its end, the temperature at greater depth becomes more homogeneous compared to variations in the surface zone. As a result, it can be concluded that the degree of data consistency in the deep zone is higher and more homogeneous. This suggests that the surface zone is more affected by ambient conditions, while the inner core retains heat longer due to the insulating properties of the concrete. The convergence of all temperature curves after 24 h suggests thermal equilibrium between the concrete and the surrounding environment.
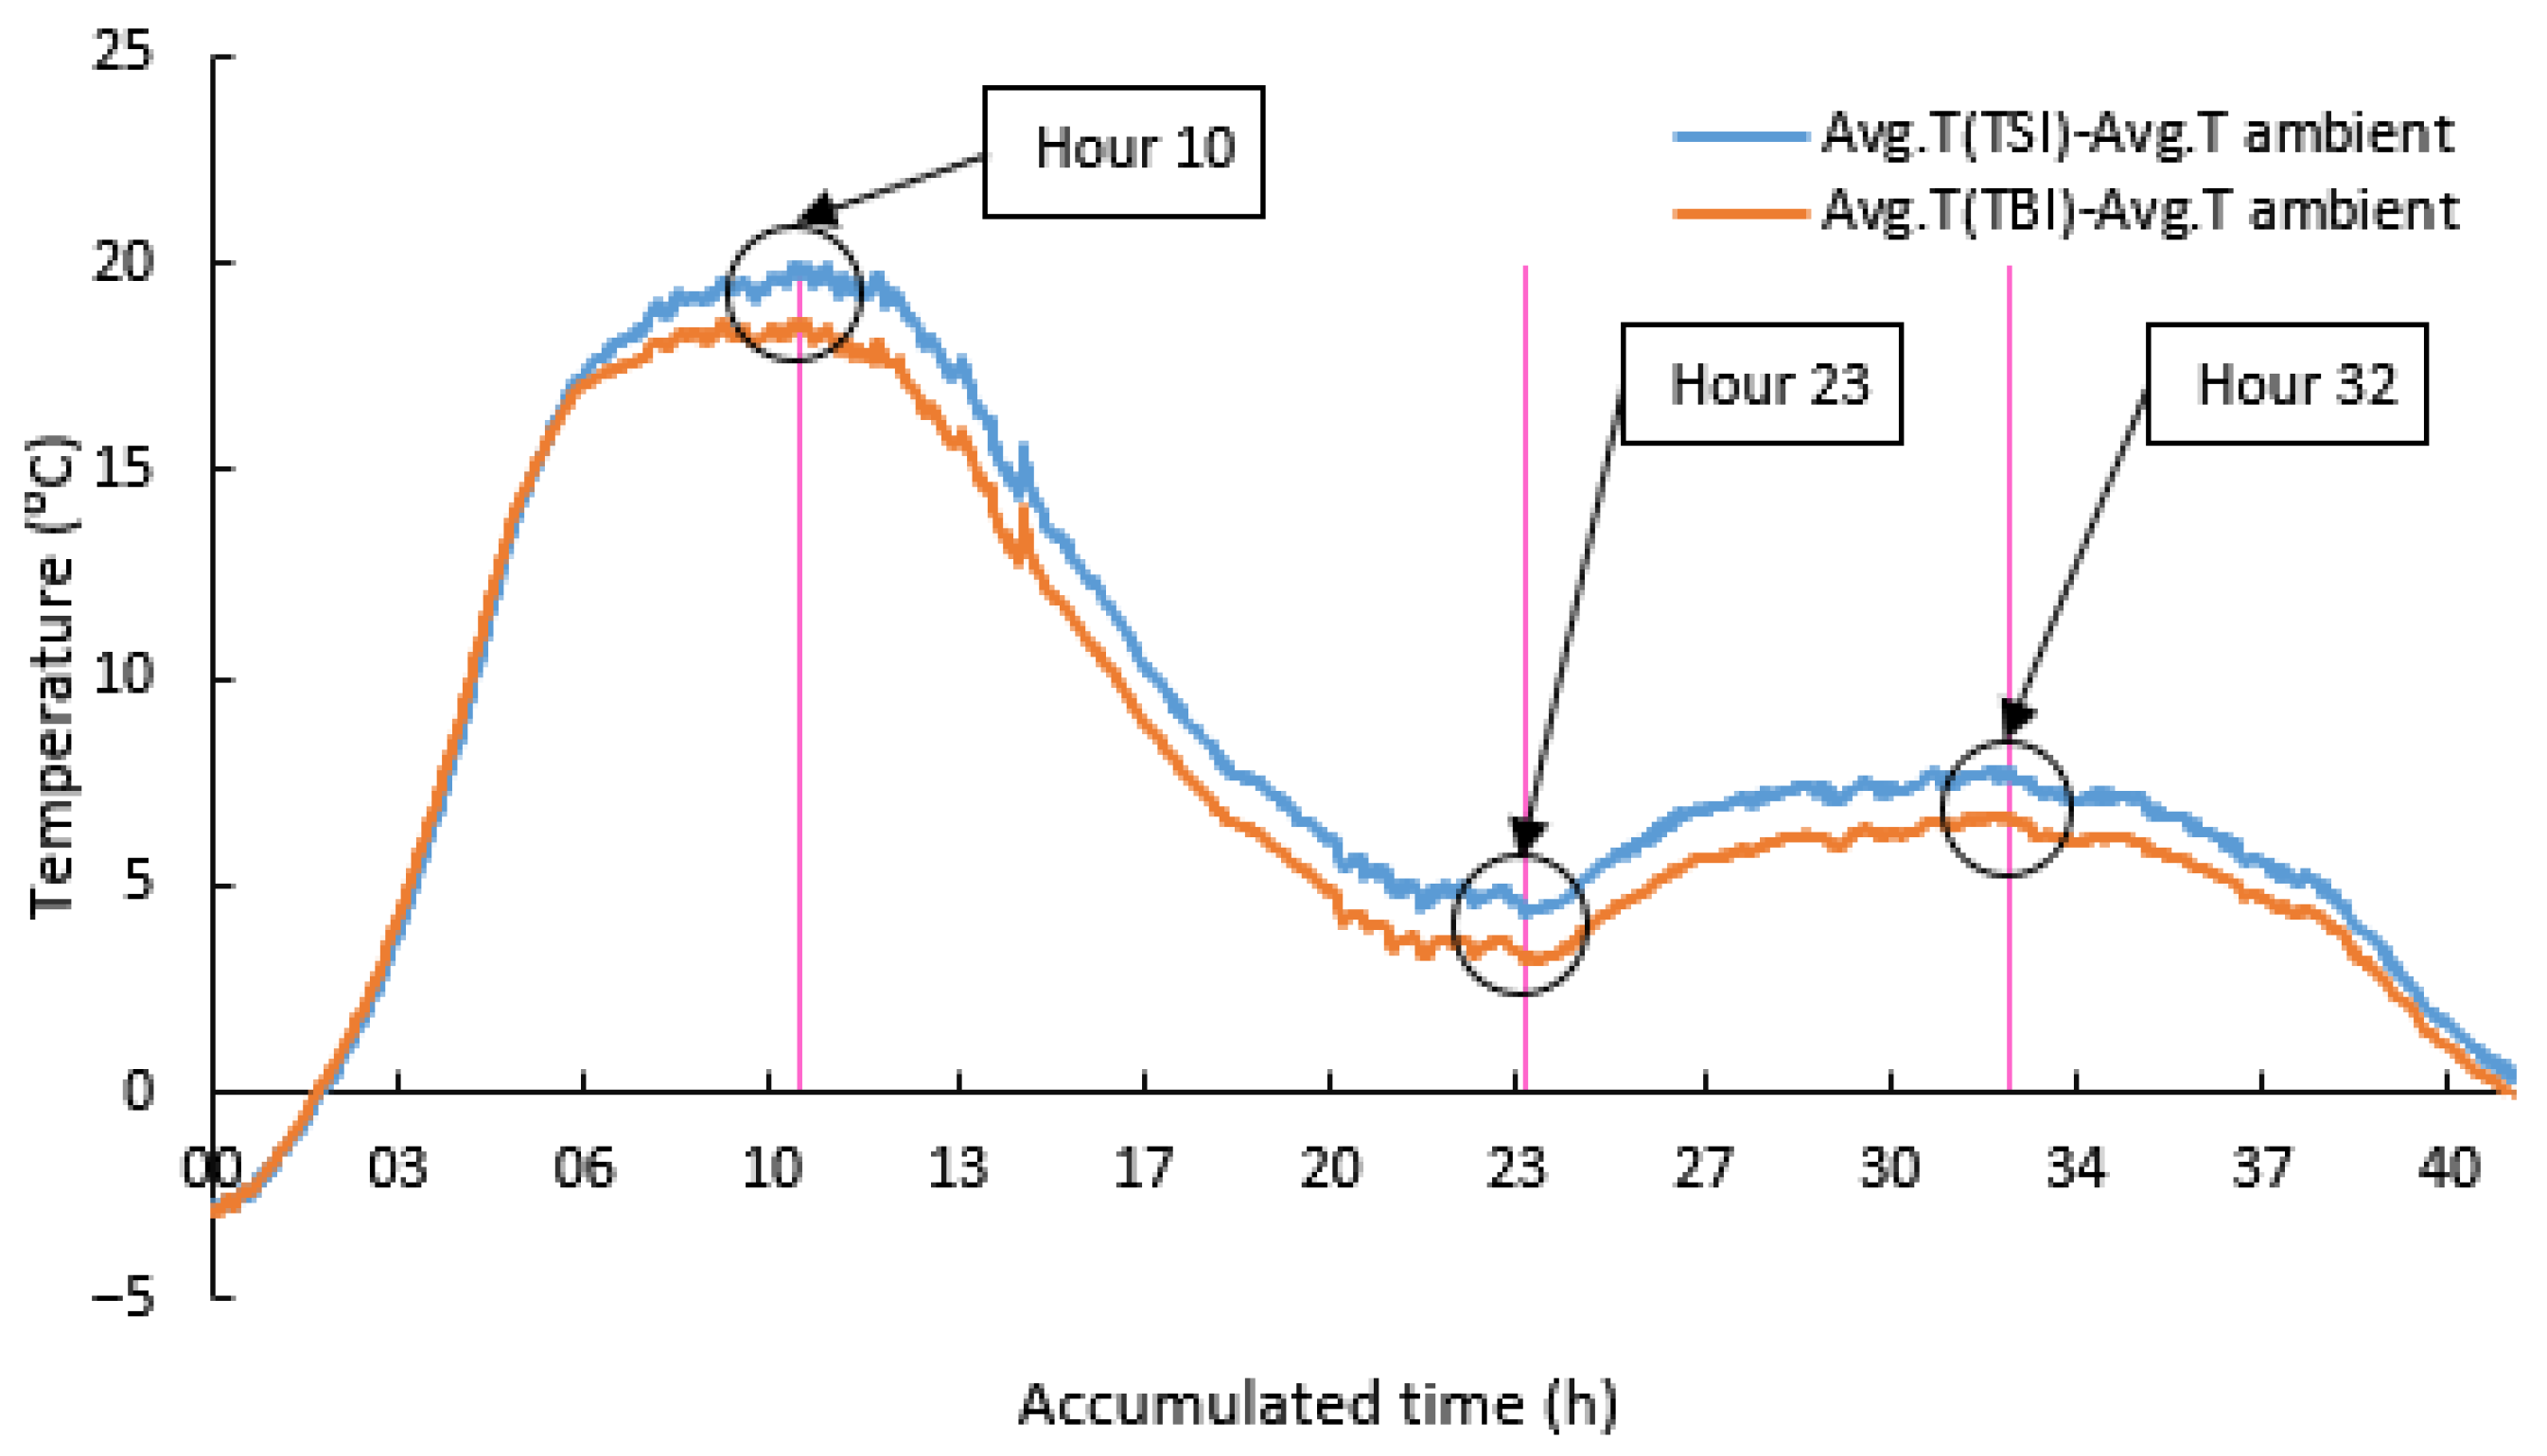
Additionally, in
Figure 16, the internal temperature results of the specimen are compared with the external temperature data. It is observed that the maximum temperature in the deep zone is slightly lower than the maximum temperature reached in the surface zone. This result may be related to the location of the sensors inside the concrete, where the sensors in the deep zone were placed in a narrowing between the mold walls, which could have allowed for faster heat dissipation. This phenomenon is also reflected in the gradual descent phase of the curve, where temperatures in the deep zone present lower values than in the surface. Nevertheless, both curves follow a progressive downward trend until they converge and approach the ambient temperature, with a peak offset between them due to the concrete’s thermal conductivity.
Surface sensors showed a mean temperature of 32.83 °C (SD = ±0.96 °C), while core sensors averaged 31.52 °C (SD = ±0.47 °C), confirming more homogeneous behavior at depth.
Furthermore,
Figure 17 presents an estimated thermal evolution curve derived from the internal temperature data collected by the embedded sensors. This curve is not a direct calorimetric measurement but rather an interpretative representation of the heat evolution process during cement hydration. It highlights the typical thermal behavior observed in early-age concrete, including an initial temperature rise of approximately 6 °C/h, peaking around 8 h, followed by a sharp drop and a secondary peak at approximately 32 h. These two peaks correspond to the initial and final setting phases, respectively. The purpose of this figure is to contextualize the temperature trends observed in
Figure 15 and
Figure 16 and to illustrate the expected thermal signature of the hydration process based on the experimental data.
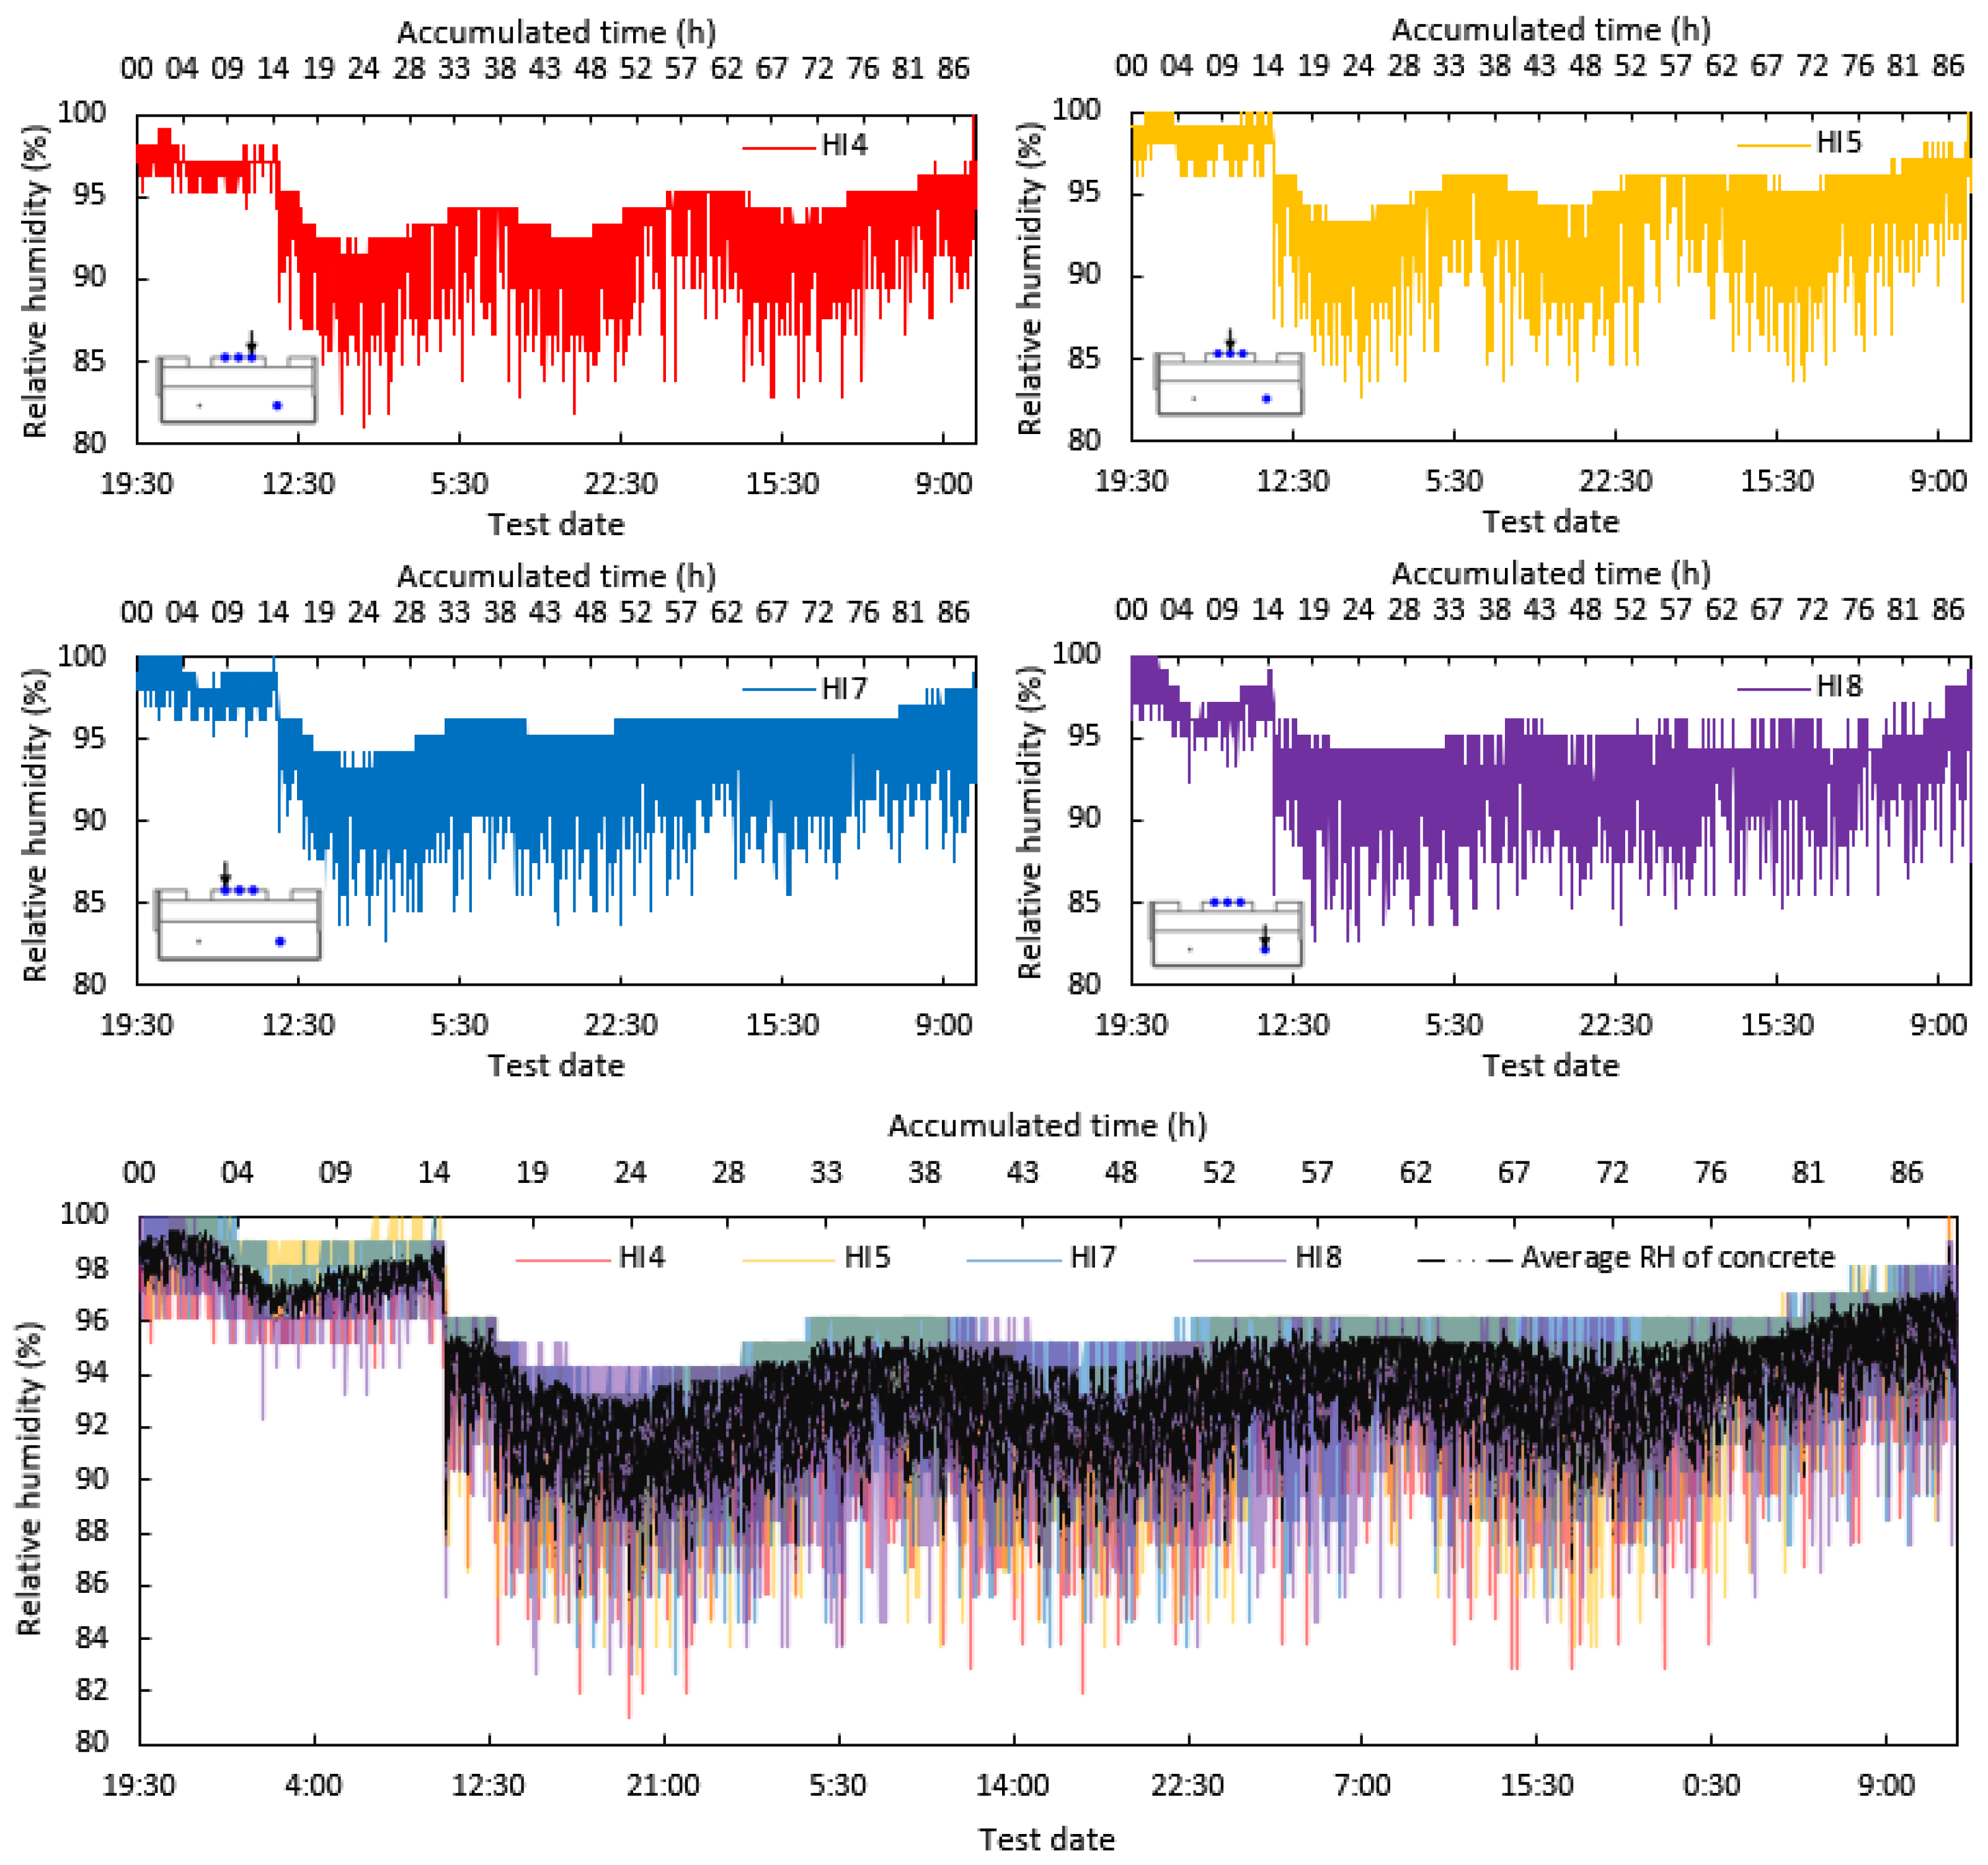
Figure 18 presents the time evolution of relative humidity as recorded by the different sensors (HI4, HI5, HI7, and HI8) embedded in the New Jersey-type concrete barrier specimens. Each subplot corresponds to a specific sensor, with its identifier shown in the upper left corner and its location marked in the lower right. The data reveal distinct thermal and moisture gradients depending on the sensor position. For instance, sensors located closer to the surface show more pronounced fluctuations in relative humidity, particularly during the early hours of curing, likely due to greater exposure to ambient conditions. In contrast, sensors embedded deeper within the concrete exhibit more stable readings, reflecting the insulating effect of the material. These trends support the hypothesis that sensor location significantly influences the measured environmental conditions within the concrete mass.
Humidity sensors exhibited similar trends, with a significant change observed around 14 h into the test. The relative humidity initially decreased and then oscillated within a specific range until the test concluded. The average humidity value was 69.17%, with a standard deviation of ±5.06% and a coefficient of variation of 7.3%, reflecting acceptable consistency despite varying exposure.
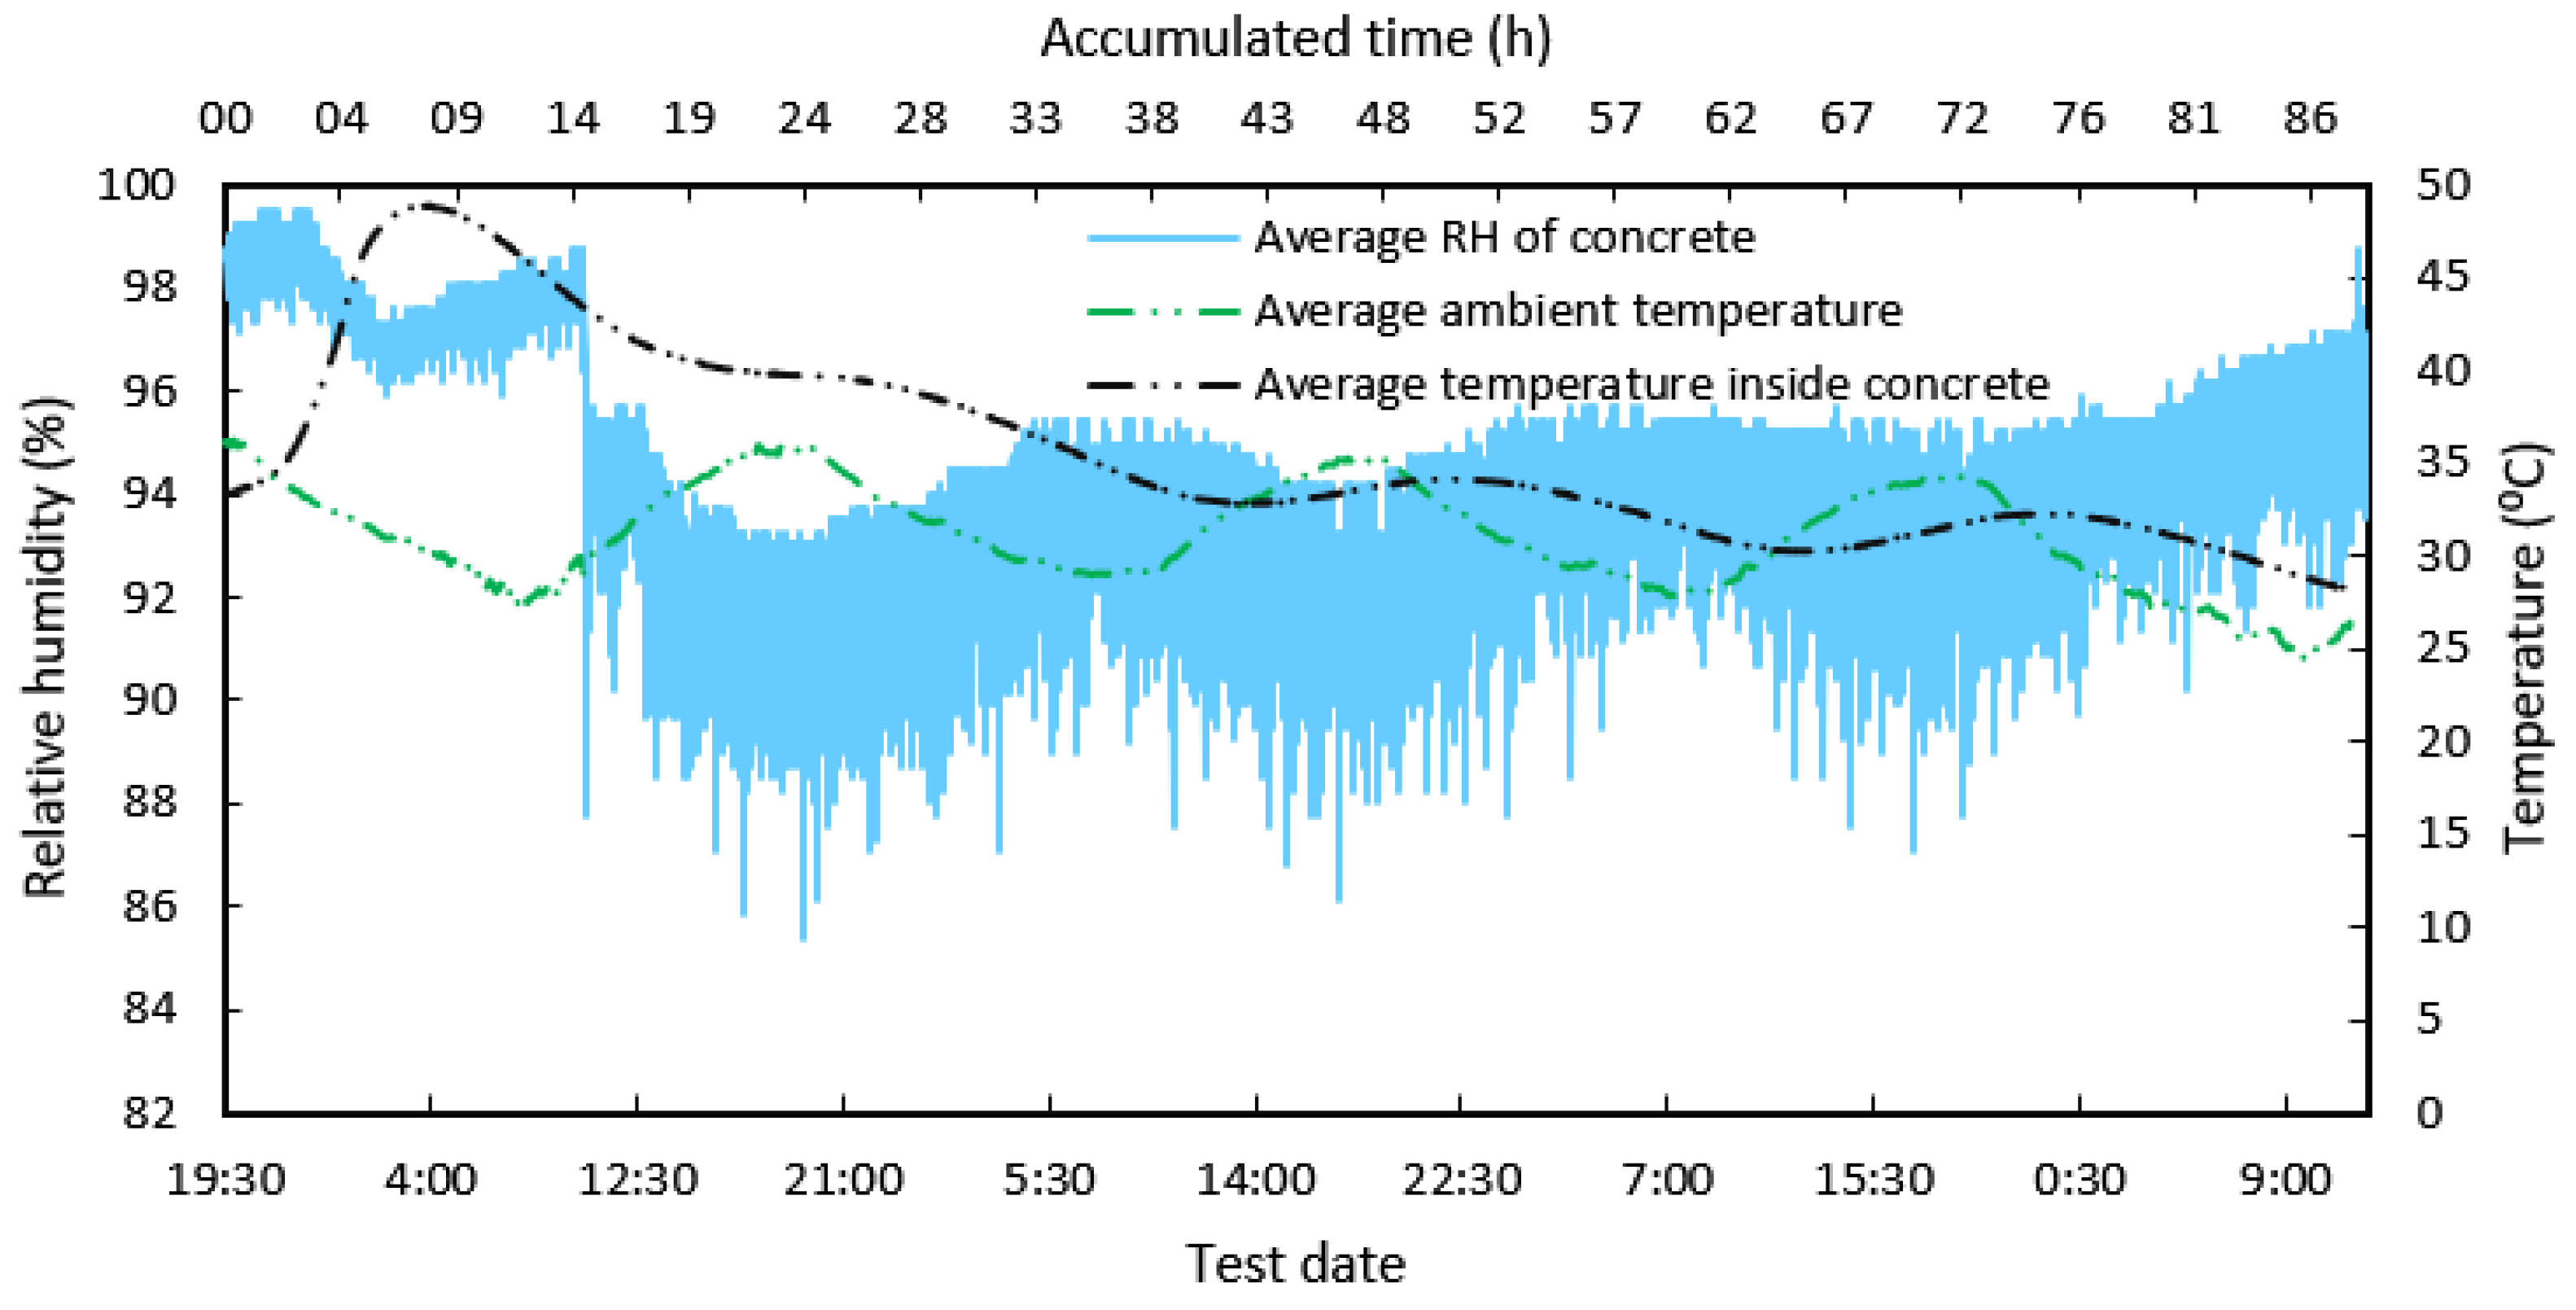
It is important to note that all relative humidity variation curves display a sudden decrease of approximately 4% around 14 h from the start of the test, observed across all areas measured by the moisture sensors. Additionally, all curves follow a similar oscillation pattern over time. This prompted a detailed analysis of the relationship between relative humidity and the temperature inside the concrete, as well as with ambient temperature.
Figure 19 illustrates the temporal evolution of three key parameters: internal concrete temperature, ambient temperature, and relative humidity. During the first 14 h, the internal temperature of the concrete rises from approximately 33 °C to a peak of 35 °C, while the relative humidity drops from 100% to around 94%. This inverse relationship suggests that the heat generated by cement hydration accelerates moisture migration from the concrete interior to the surface. After this initial phase, the internal temperature begins to decline, and the ambient temperature—rising to approximately 27 °C—becomes the dominant factor influencing further humidity loss. The relative humidity continues to decrease gradually, stabilizing around 90%. These trends indicate a transition from hydration-driven thermal effects to environmental control over surface moisture. The consistency of the curves supports interpretation, even though no statistical correlation analysis was performed.
In summary, during the phase where chemical reactions inside the concrete predominate, the observed trends suggest that surface humidity is influenced by the heat released from cement hydration. As this process progresses, the observed data suggest that ambient temperature becomes the predominant factor influencing surface humidity loss.
Based on the internal temperature histories, the maturity index M(t) was computed to illustrate how the proposed workflow can feed a strength vs. time estimator once a plant-specific f_c–M calibration is available. In the present feasibility study, M(t) is reported as a QC indicator together with Tp, tp, ΔT (surface–core), and dRH/dt, which capture the hydration peak, thermal gradient risk, and early age evaporation tendency, respectively.
From the temperature and humidity histories of the New Jersey specimen, the following quality-control metrics were derived: The surface temperature reached a peak of T
p ≈ 49.46 °C at t
p ≈ 9.7 h, while the core registered T
p ≈ 48.56 °C at t
p ≈ 9.17 h, yielding a peak depth gradient of ΔT (surface–core) ≈ 0.9 °C. The average early-age heating rate over the first nine hours was approximately 1.65 °C/h. In terms of moisture, the average early-age loss rate was dRH/dt ≈ −0.18 %/h during the first 24 h, with a transient drop of about 11.25 % around 14 h. In addition, an illustrative maturity index M(t) was computed using the Nurse–Saul formulation (with T
0 = −10 °C), obtaining M(24 h) = 1104 °C·h and M(48 h) = 2064 °C·h. These metrics provide actionable information for curing management (e.g., insulation or misting when ΔT or dRH/dt exceed targets) and form the basis for future strength estimation once plant-specific f_c–M calibrations are established. For improved readability, the data are presented in
Table 2.
4. Conclusions
High-precision systems (e.g., fiber optic SOFO, embedded/surface-bonded piezoceramics) offer superior sensitivity for strain and damage detection and have been successfully used to characterize early-age processes; however, they entail higher costs and more specialized installation. In contrast, the Arduino-based approach prioritizes affordability, ease of deployment, and continuous logging of thermal and moisture proxies that are directly actionable for curing management in precast plants. In practice, both families are complementary: High-precision systems excel in detailed diagnostics, while low-cost networks enable frequent, distributed monitoring to enforce QC routines (e.g., alarms on Tp, tp, ΔT, and dRH/dt) across many elements.
The results from the New Jersey barrier test indicate that temperature variations are more uniform in deeper zones compared to shallower ones. This pattern suggests that, for structures with significant thickness, using sensors at specific depths may suffice, potentially optimizing instrumentation and reducing costs. Implementing temperature sensors at various depths can not only enhance quality control by monitoring thermal gradients but also help prevent issues such as surface cracking, thereby improving the durability of structural elements.
Data analysis from humidity sensors indicates that using closely spaced sensor arrays is recommended to achieve more accurate measurements. While individual readings may vary significantly, averaging data from multiple sensors in the same zone provides consistent trends in relative humidity. This approach is crucial for managing issues related to rapid evaporation that can compromise concrete integrity. An abrupt change in humidity readings during the New Jersey barrier test suggests the need for further investigation, possibly by repeating the test under controlled conditions to distinguish between intrinsic concrete properties and external factors.
Relative humidity results from the New Jersey barrier test show a less pronounced decreasing trend compared to previous laboratory tests, highlighting the importance of extended monitoring to validate theoretical expectations. The use of neutral silicone adhesive and PVC tubing for waterproofing humidity sensors proved effective in the protected environment of the New Jersey specimen, with no significant alterations observed during testing. However, a more rigorous assessment of their effectiveness under extreme conditions is required to confirm their performance in less controlled environments.
Statistical analysis confirmed the precision of the proposed sensor system, with temperature coefficient of variation values below 3% in all configurations and humidity coefficient variations below 11%. These results support the reliability of the Arduino-based monitoring system for early-age concrete assessment in both laboratory and industrial environments.
From a QC standpoint, the system provides actionable metrics—Tp, tp, ΔT (surface–core), dRH/dt, and M(t)—to support curing decisions (e.g., insulation or misting when ΔT or dRH/dt exceed target ranges). While the present study demonstrates feasibility and reports these metrics, plant-specific f_c–M calibrations are planned to translate maturity into quantitative strength predictions under differing curing regimes. A direct accuracy benchmark against high-precision SHM systems lies outside the scope of this feasibility campaign; however, we outline a path for future co-located trials to quantify accuracy differences in factory environments and to link M(t) outputs with plant-specific f_c–M calibrations.
Finally, the effectiveness of general-purpose silicone adhesive as a waterproofing method remains inconclusive due to an incident during testing that interrupted the process. Additionally, strength tests revealed that implanted sensors negatively impact indirect tensile strength results, although this effect diminishes as specimen size increases. These findings suggest a need for reevaluation of instrumentation in strength testing, considering the balance between measurement accuracy and sensor interference.
Together, these results emphasize the importance of well-planned sensor design and continuous monitoring in improving the quality and durability of concrete, highlighting opportunities to optimize both instrumentation and assessment methods in the future.

