Article

Physics-Based Data Augmentation Enables Accurate Machine Learning Prediction of Melt Pool Geometry

School of Mechanical and Electronic Engineering, Wuhan University of Technology, Wuhan 430070, China
*
Author to whom correspondence should be addressed.
Appl. Sci. 2025, 15(15), 8587; https://doi.org/10.3390/app15158587
Submission received: 18 June 2025 / Revised: 30 July 2025 / Accepted: 31 July 2025 / Published: 2 August 2025

Abstract

Featured Application

The proposed physics-augmented learning framework enables accurate melt pool geometry prediction in L-PBF under sparse data conditions, supporting intelligent process optimization and quality control in metal additive manufacturing.

Abstract

Accurate melt pool geometry prediction is essential for ensuring quality and reliability in Laser Powder Bed Fusion (L-PBF). However, small experimental datasets and limited physical interpretability often restrict the effectiveness of traditional machine learning (ML) models. This study proposes a hybrid framework that integrates an explicit thermal model with ML algorithms to improve prediction under sparse data conditions. The explicit model—calibrated for variable penetration depth and absorptivity—generates synthetic melt pool data, augmenting 36 experimental samples across conduction, transition, and keyhole regimes for 316 L stainless steel. Three ML methods—Multilayer Perceptron (MLP), Random Forest, and XGBoost—are trained using fivefold cross-validation. The hybrid approach significantly improves prediction accuracy, especially in unstable transition regions (D/W ≈ 0.5–1.2), where morphological fluctuations hinder experimental sampling. The best-performing model (MLP) achieves R2 > 0.98, with notable reductions in MAE and RMSE. The results highlight the benefit of incorporating physically consistent, nonlinearly distributed synthetic data to enhance generalization and robustness. This physics-augmented learning strategy not only demonstrates scientific novelty by integrating mechanistic modeling into data-driven learning, but also provides a scalable solution for intelligent process optimization, in situ monitoring, and digital twin development in metal additive manufacturing.

1. Introduction

Laser Powder Bed Fusion (L-PBF) is one of the most prominent technologies currently used in Additive Manufacturing (AM) methods for fabricating metal parts, providing unprecedented advantages for manufacturing complex-shaped metal components and dominating the metal additive manufacturing market with applications in various industries such as aerospace, automotive, pharmaceuticals, and even the energy industry [1,2,3,4,5].
In L-PBF, a laser beam selectively melts metal powders layer by layer to form melt pools, which solidify and stack into near-net-shaped parts. The quality and performance of the final product are affected by multiple factors, including raw powder properties, process parameters, and post-processing treatments [6,7,8]. The melt pool—defined as the localized region of melt powder along the laser scanning path—is central to the process. Its thermal behavior and geometric characteristics strongly influence the solidification dynamics, defect formation, and ultimately the microstructure and mechanical performance of the fabricated part [9]. However, melt pool instability can lead to serious issues such as increased porosity, poor surface finish, and mechanical degradation [10,11,12]. To mitigate such defects, many studies have explored the influence of process parameters—particularly laser power, scanning speed, and energy density—on melt pool geometry and quality [13,14,15]. While higher laser power tends to increase melt pool size, excessive energy input can lead to keyhole formation and instability. By contrast, insufficient energy may result in lack-of-fusion defects due to incomplete melting. Therefore, understanding and predicting melt pool characteristics under different processing conditions is essential for process control and defect mitigation [16].
Traditional simulation tools, such as finite element modeling (FEM), have been extensively used to capture melt pool evolution and thermal history [17,18,19]. Recent reviews [20] have highlighted how FEM approaches remain the primary tool for multiscale thermo-mechanical analysis in L-PBF, despite challenges in computational cost, parameter calibration, and scalability. While FEM provides valuable physical insight, its high resource demands and reliance on precise material models limit its applicability for real-time or data-intensive scenarios.
To overcome these limitations, recent studies have explored data-driven approaches, particularly machine learning (ML), which can capture complex nonlinear relationships and generalize across materials and systems [21]. ML has found success in AM applications such as defect detection, topology optimization, process monitoring, and post-processing [22,23,24,25,26]. For instance, Ankit et al. [27] used ML to predict porosity based on chemical composition with over 90% accuracy. Similarly, Anwaruddin et al. [28] applied deep learning to predict porosity and density in L-PBF-processed parts. While ML has demonstrated predictive power in AM, its application to melt pool geometry prediction remains limited [29,30,31]. A major challenge lies in data scarcity. High-fidelity experimental data in metal AM are difficult and expensive to obtain. Additionally, ML models often lack physical interpretability and may fail to generalize under sparse or noisy conditions [32,33]. Combining physics-based modeling with machine learning has emerged as a promising solution. This hybrid approach improves model robustness, reduces dependency on large datasets, and enhances interpretability [34]. One effective strategy is physics-informed data augmentation. Mondal et al. [35] combined an analytical heat transfer model with Gaussian process regression to predict melt pool geometry under limited data conditions. Zhu et al. [36] employed physics-informed neural networks to simulate temperature and flow fields in L-PBF, achieving physically consistent predictions even with sparse data. Sharma et al. [37] further enhanced multiphysics modeling by incorporating gas–melt pool interactions into a deep learning framework, showing that physics-guided learning reduces data requirements while improving prediction transparency. Ritto et al. [38] integrated stochastic physical modeling with ML to detect multiple damage scenarios in digital twins. Ren et al. [39] used FEA and ML to identify thermal patterns in directed energy deposition (DED). These studies highlight the potential of hybrid modeling in AM, particularly for low-volume, highly customized production. These hybrid strategies bridge the gap between computational modeling and experimental validation, providing more robust and interpretable models.
In this work, an explicit-model-augmented machine learning framework is presented for predicting melt pool geometry in L-PBF. A physics-based analytical model is first calibrated using experimental data to simulate melt pool width and depth. This model is then used to generate physically consistent synthetic data to augment a limited dataset of 36 parameter combinations, covering conduction, transition, and keyhole mode. Three ML algorithms—multilayer perceptron (MLP), random forest, and XGBoost—are trained using fivefold cross-validation. The results show that the hybrid model improves predictive accuracy, reduces dependency on large datasets, and enhances physical interpretability. This study provides an efficient and generalizable approach for intelligent process optimization in metal additive manufacturing.

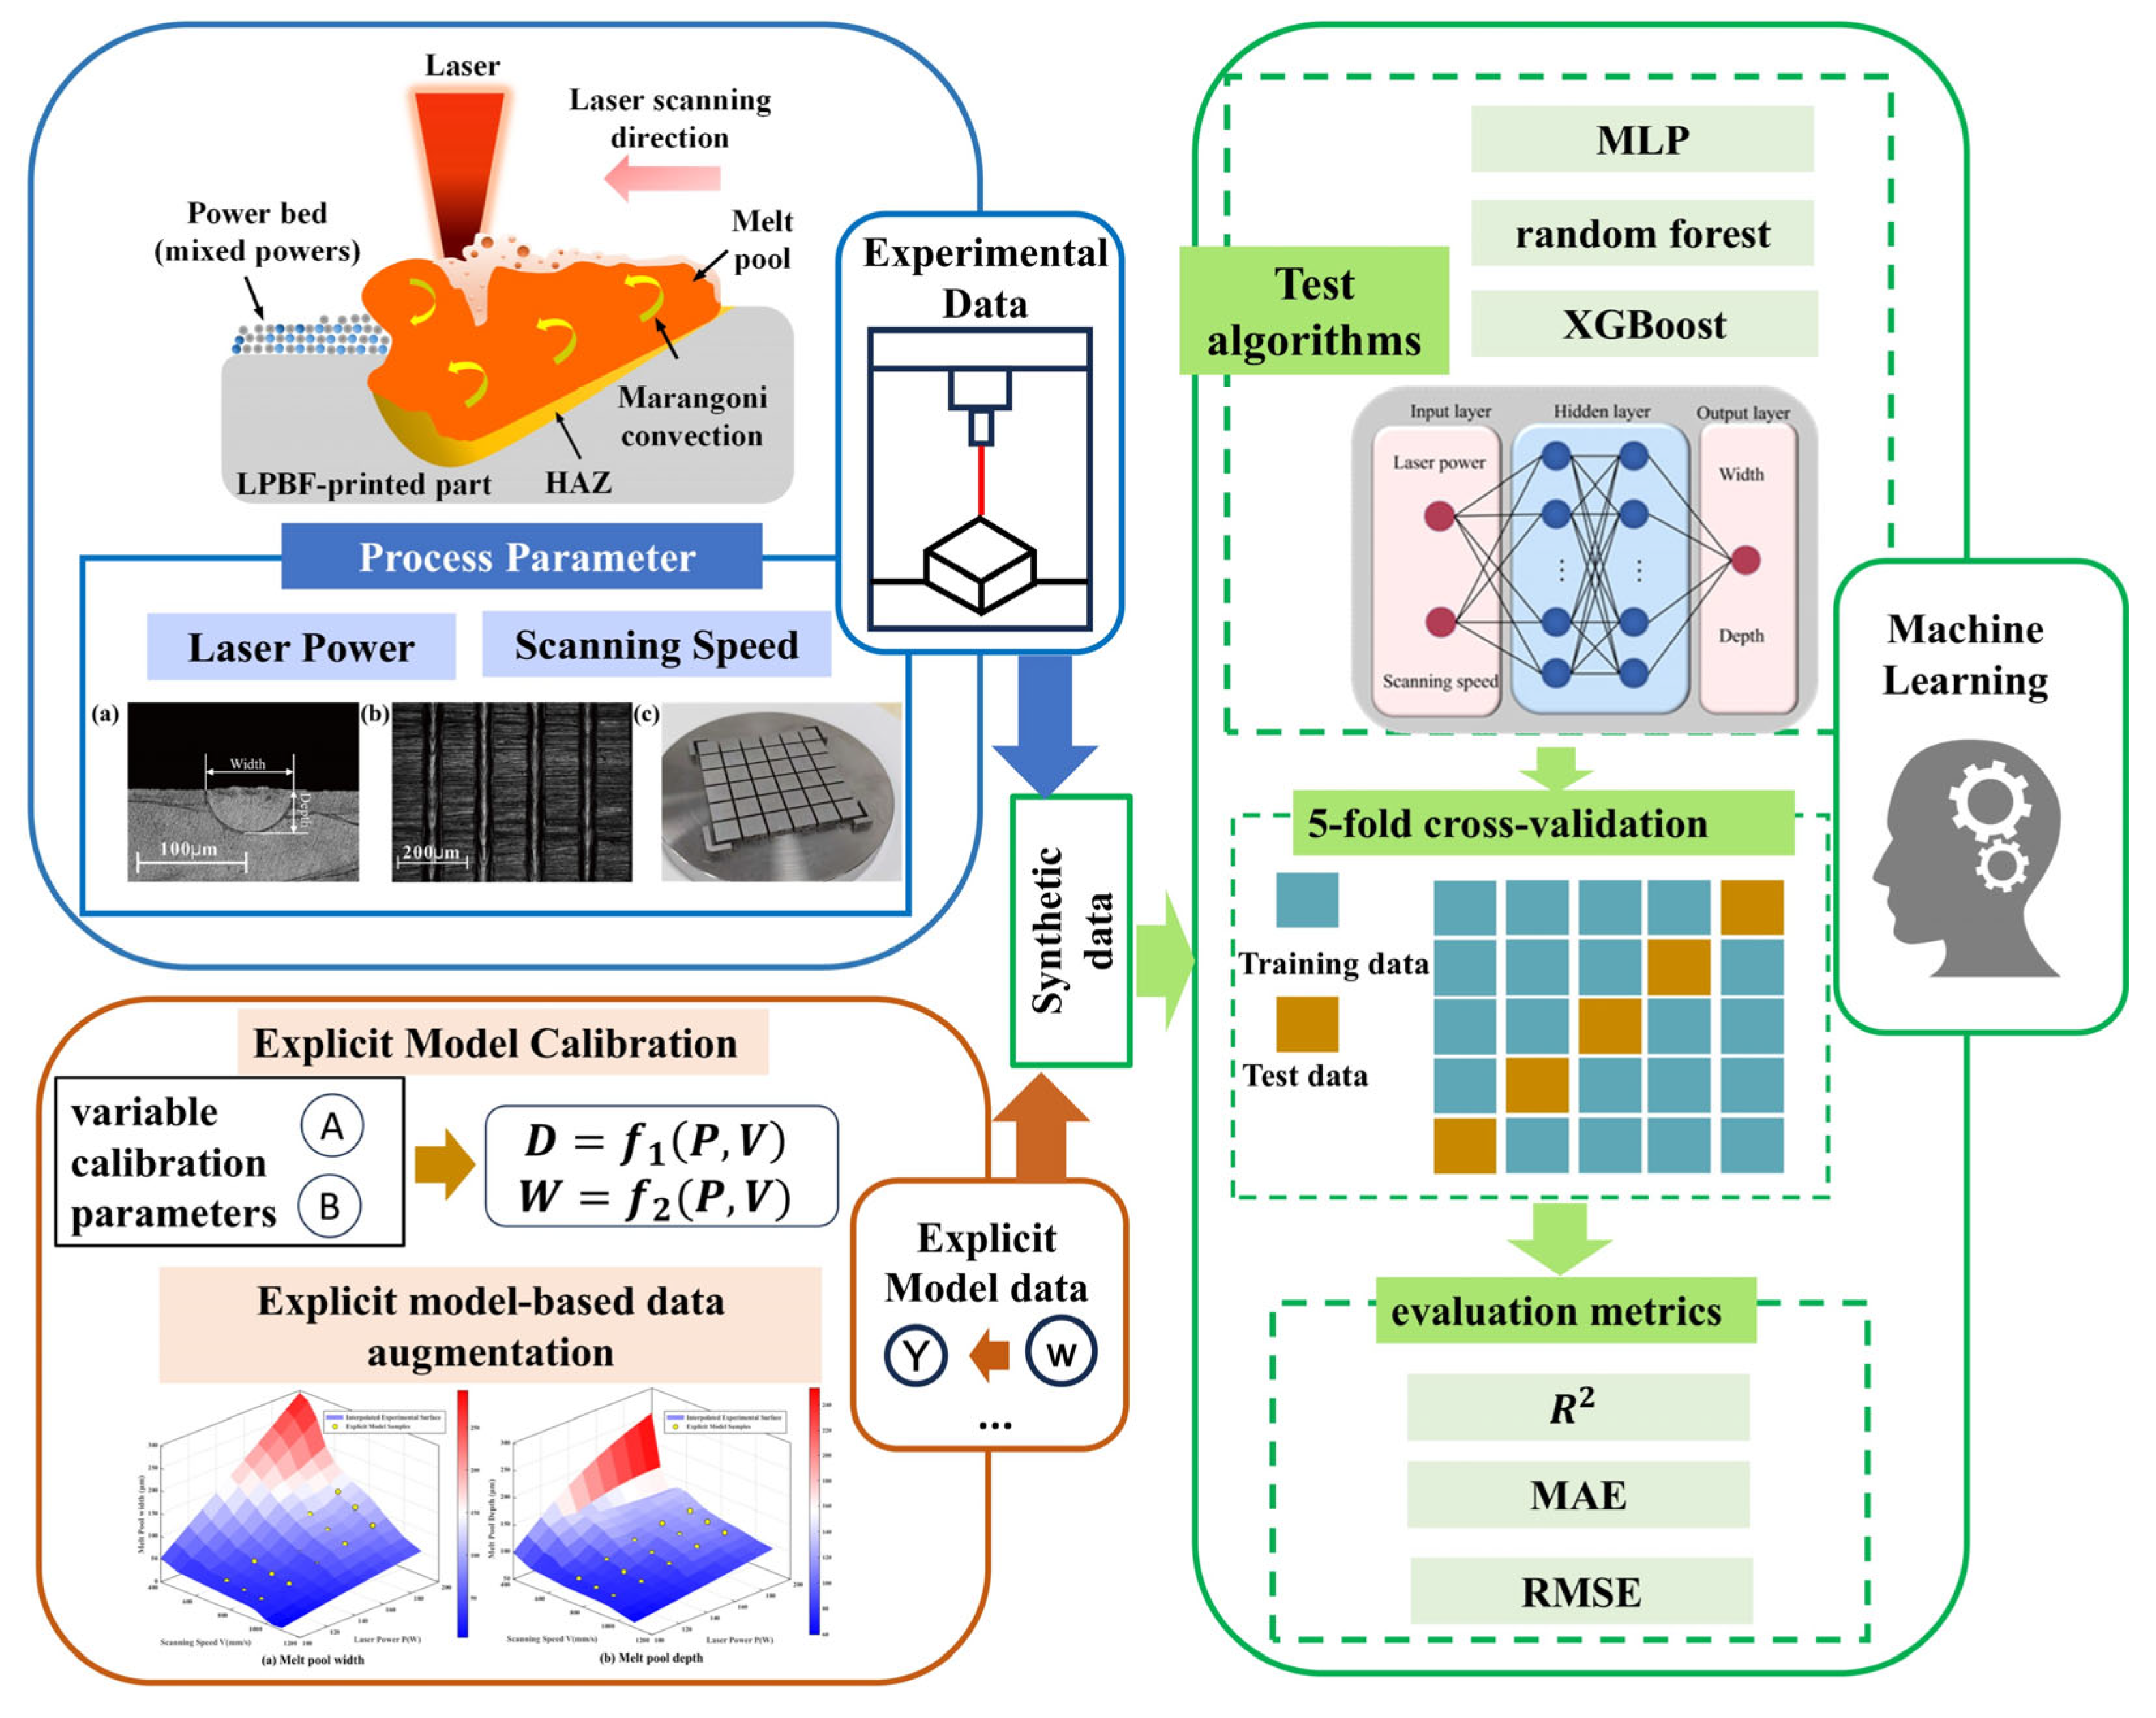
2. Materials and Methods

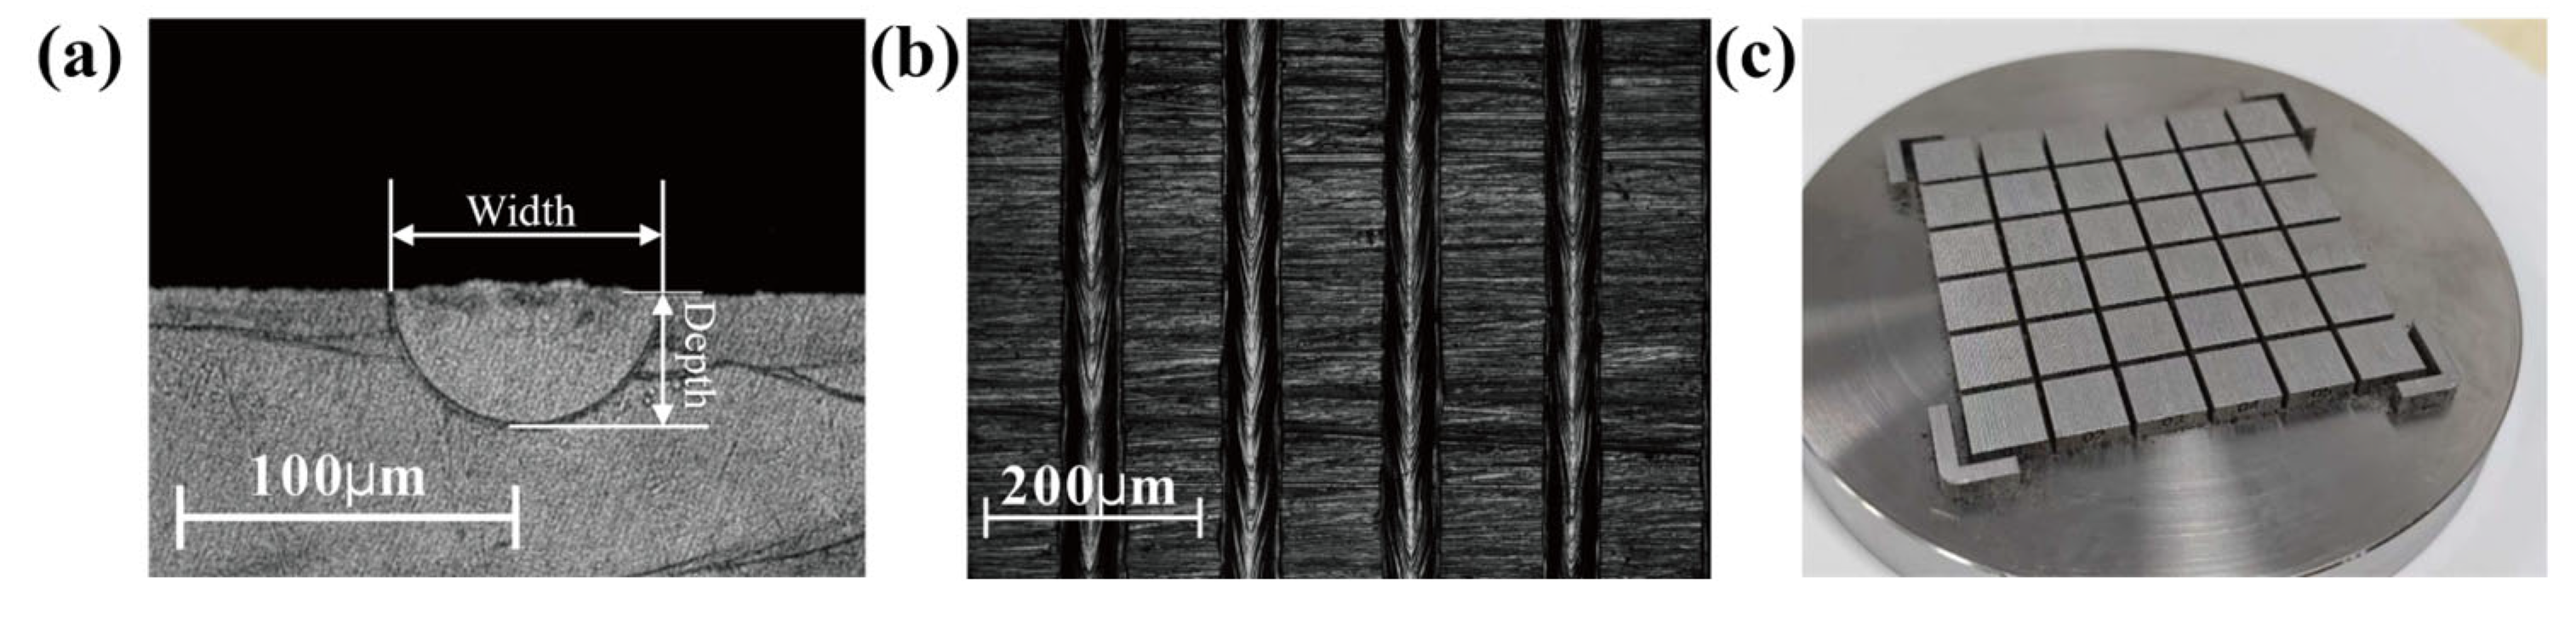
2.1. Experimental Materials and Design

The material used in this study was atomized 316 L stainless steel powder provided by BLT Corporation, whose detailed chemical composition is listed in Table 1. The powder exhibits high sphericity, excellent flowability, and uniform spreading, making it suitable for laser powder bed fusion (L-PBF) processing. To remove surface moisture, the powder was sieved using a 250-mesh standard sieve and dried in a vacuum oven at 80 °C for 4 h prior to use.
L-PBF fabrication was conducted on an HBD-80 machine equipped with a Yb fiber laser (wavelength 1040 nm, maximum power 200 W), with an effective build size of Ø120 mm × 80 mm. Throughout the printing process, the build chamber was shielded with argon gas to maintain an oxygen concentration below 1000 ppm and suppress oxidation.
To avoid unstable or low-energy regimes that lead to process defects, a total of 36 sets of process parameter combinations were systematically designed using different levels of laser power and scanning speed to cover a wide range of energy input conditions. The process parameters are shown in Table 2. As illustrated in Figure 1, under each process condition, 15 single-track melt pool samples were fabricated using L-PBF, and the cross-sectional dimensions were measured and averaged to minimize experimental uncertainties.

2.2. Explicit Model-Based Data Augmentation

To compensate for the limited availability of experimental melt pool data and improve model generalization, this study integrates a physics-based explicit model to generate synthetic data. The analytical model adopted here builds upon the work of Parand et al. [29], which demonstrated improved predictive accuracy over the classic Rosenthal model by incorporating empirical coefficients derived from extensive L-PBF experimental datasets.
In this study, the melt pool geometry is characterized by its depth (D) and width (W), modeled as nonlinear functions of process parameters and thermophysical material properties. The governing equations are provided in Table 3.
The explicit model improved in the article is based on the evaluation of Parand et al. [29] from extensive experimental data processing, and significantly outperforms the Rosenthal melt pool geometry estimation. To accurately fit the problem across different measures and parameters, the nonlinear regression model is transformed into a constrained optimization problem, which is solved using the SciPy (v. 4.5.11) constrained optimization package and the trust domain method. In Equation (1), the model is structured as a product of power-law terms, where the constant variable is the multiplier (w0), and each parameter has an exponential variable. Based on the constraints, Equations (2)–(5) are solved for the geometric estimation of the melt pool size.
y = w 0 P w 1 V w 2 ρ w 3 C P w 4 k w 5 ( T m T 0 ) w 6
where,
( a ) w 1 + w 3 + w 5 = 0 ( b ) 2 w 1 + w 2 3 w 3 + 2 w 4 + w 5 = 1 ( c ) 3 w 1 w 2 2 w 4 3 w 5 = 0 ( d ) w 4 w 5 + w 6 = 0
min W y w 0 P w 1 V w 2 ρ w 3 C P w 4 k w 5 ( T m T 0 ) w 6 2 2 s . t . : ( w 1 + w 3 + w 5 ) 2 + ( 2 w 1 + w 2 3 w 3 + 2 w 4 + w 5 1 ) 2 + ( 3 w 1 w 2 2 w 4 3 w 5 ) 2 + ( w 4 w 5 + w 6 ) 2 = 0
D = 0.37 × 10 6 × P 0.51 V 0.46 ρ 0.46 C p 0.46 k 0.06 ( T m T 0 ) 0.51
W = 0.44 × 10 6 × P 0.59 V 0.36 ρ 0.39 C p 0.39 k 0.21 ( T m T 0 ) 0.60
This study proposes a physics-informed machine learning framework, considering the laser penetration depth and absorption rate, thus changing the fixed coefficients in Equations (4) and (5) to variable calibration parameters A and B, as shown in Table 3. It has been observed that there is an important relationship between laser penetration depth and absorption rate, and high energy input conditions, the complex physical reactions increase the depth of the melt pool [40], while a large number of small pore walls are generated that reflect the laser multiple times, thereby increasing the absorption rate. In simulating the melt pool shape and dimensions, most studies treat this as a fixed value, and the deviation between simulated and actual melt pool shape and dimensions is significant.

2.3. Framework Overview and Motivation

To model the complex nonlinear relationship between process parameters and melt pool geometry, a machine learning (ML) framework is developed and trained on the augmented dataset comprising both experimental and synthetic samples. While the physics-based explicit model provides interpretable predictions of melt pool width and depth, its applicability is limited in high-dimensional spaces and in capturing multivariate couplings under varying processing conditions. Therefore, ML models are employed not to replace physical modeling, but to enhance its generalizability and flexibility by learning from both measured and simulated data. The melt pool dimensions—depth (D) and width (W)—are predicted using three representative ML algorithms: Multilayer Perceptron (MLP), Random Forest (RF), and Extreme Gradient Boosting (XGBoost). These algorithms were selected based on their ability to handle nonlinear, multivariable regression problems with small-to-moderate training datasets, and have been previously validated in metal additive manufacturing scenarios. Each model accepts laser power (P) and scan speed (V) as inputs and outputs two independent regression targets: melt pool width and depth. The dataset used for training consists of 36 experimental samples and 15 synthetic samples generated from the calibrated explicit model, yielding a total of 51 data points. To ensure the robustness of the models and reduce overfitting in the small-sample context, a fivefold cross-validation (5-CV) strategy is applied. Model performance is quantitatively evaluated using three widely adopted regression metrics: the coefficient of determination (R2), mean absolute error (MAE), and root mean square error (RMSE). These metrics are used to compare model accuracy on both the original dataset and augmented datasets. Hyperparameter tuning is performed using Bayesian optimization via the Tree-structured Parzen Estimator (TPE) algorithm, implemented in the HyperOpt package. Search spaces for each model’s key parameters (e.g., learning rate, number of estimators, max depth for XGBoost; number of layers and neurons for MLP) are defined based on preliminary grid tests, and the optimization objective is to maximize R2 while minimizing MAE.
As shown in Figure 2, the proposed framework integrates physics-informed data generation with ML-based regression to achieve interpretable, accurate, and computationally efficient melt pool prediction. The enhanced model not only reduces dependency on expensive experimental data, but also enables reliable prediction over a wider process window, thereby offering practical value for real-time process design and control in L-PBF.

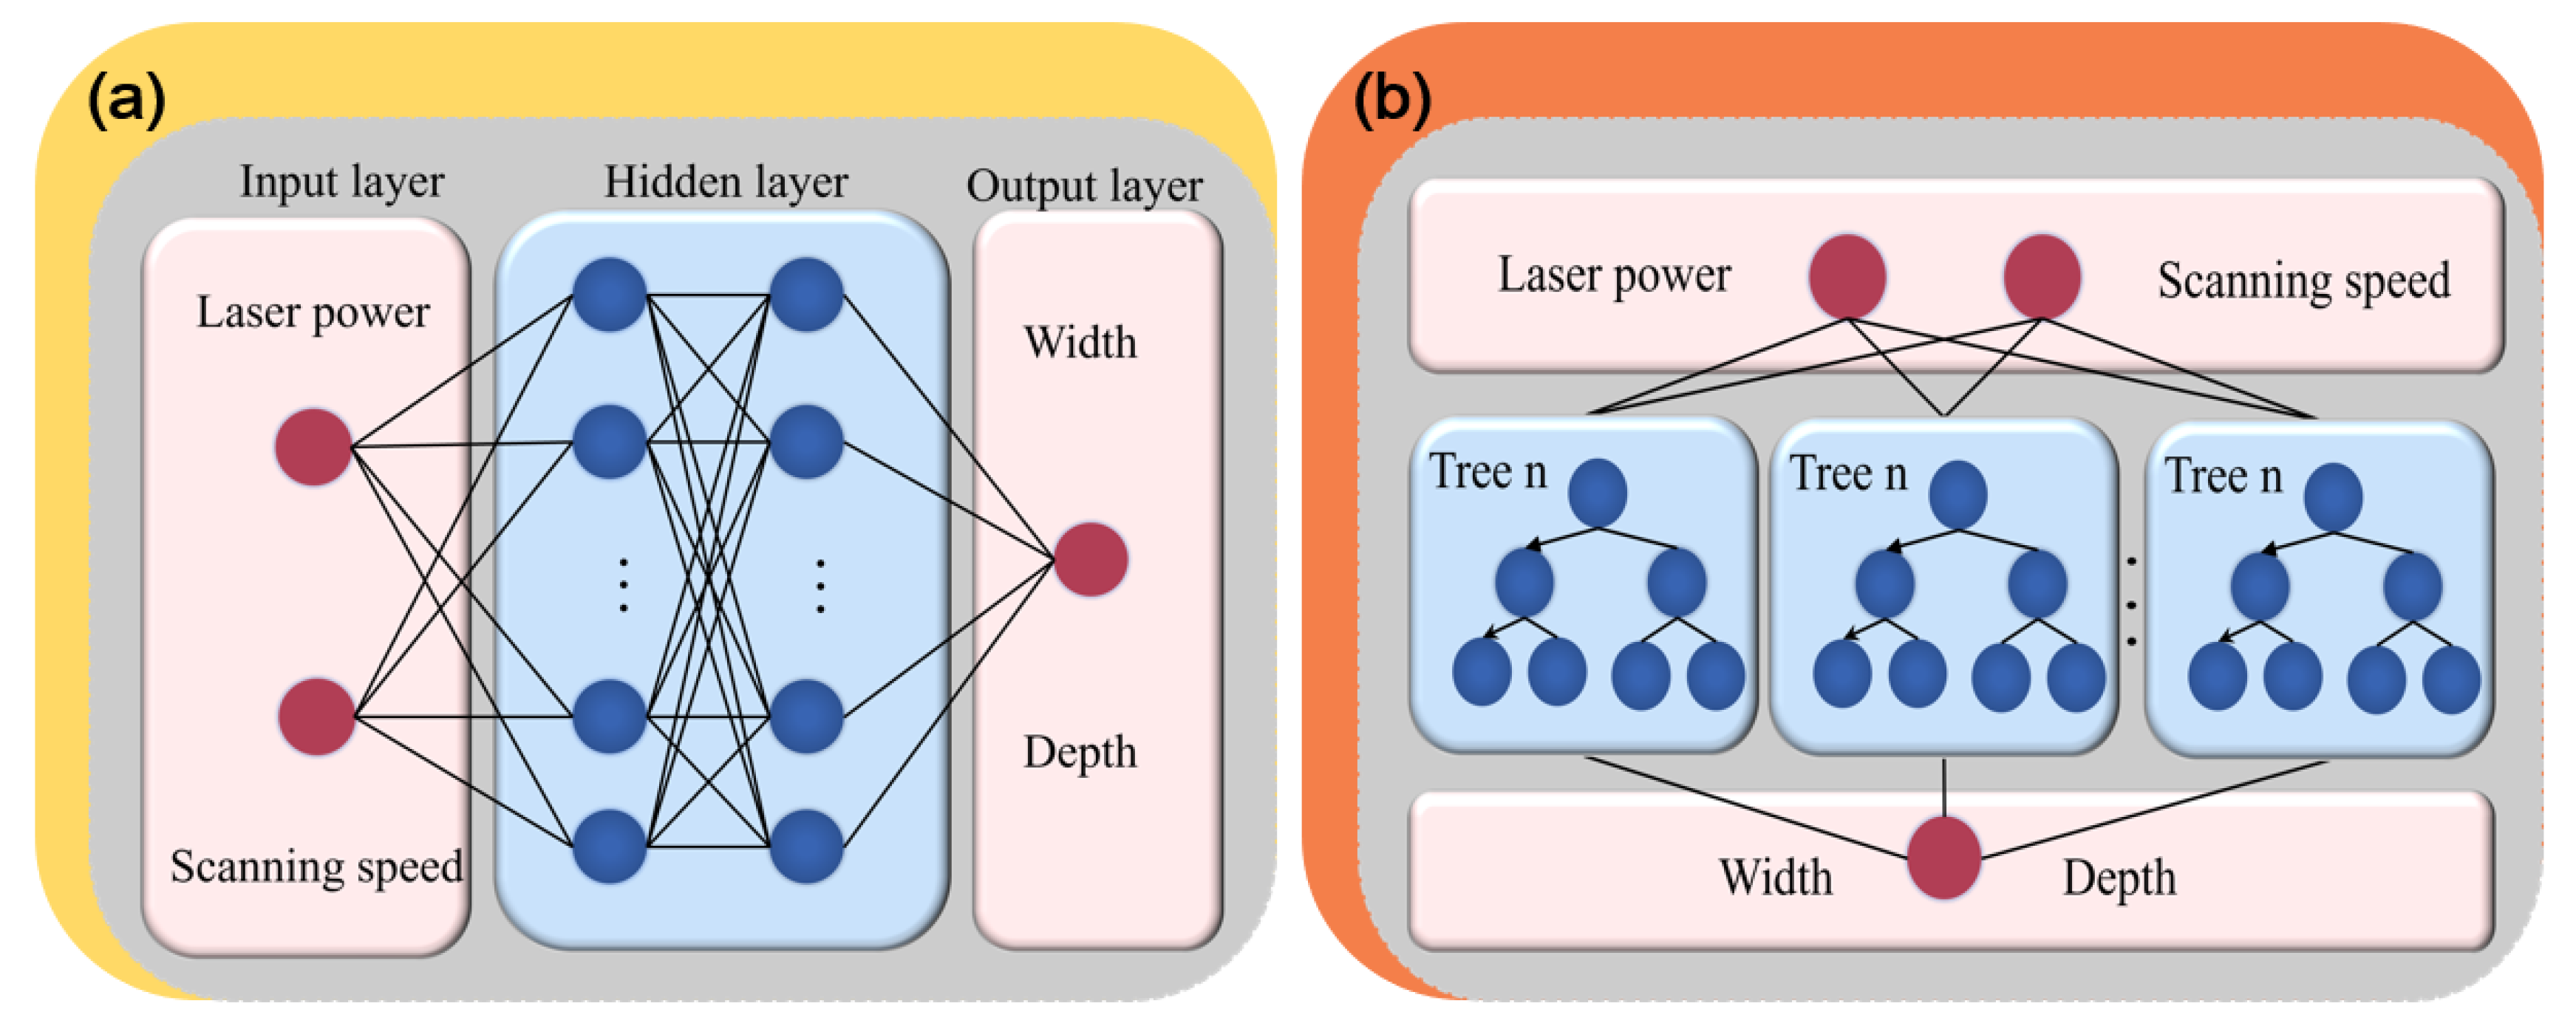
2.4. Machine Learning Modeling and Optimization

To achieve robust and accurate prediction of melt pool geometry, three supervised machine learning (ML) algorithms with complementary modeling characteristics were employed: (i) Multilayer Perceptron (MLP), (ii) Random Forest (RF), and (iii) eXtreme Gradient Boosting (XGBoost). These models were trained using the augmented dataset comprising 36 experimental samples and 15 physically consistent synthetic samples, and evaluated in terms of generalization and predictive accuracy.
MLP, a type of feedforward artificial neural network, consists of an input layer, one or more hidden layers, and an output layer. Each neuron computes a weighted sum of inputs and applies a nonlinear activation function (e.g., ReLU) to produce the output. Weight updates are achieved via backpropagation by minimizing the loss between the predicted and actual values, typically using a mean squared error (MSE) loss function. A schematic of the MLP architecture is shown in Figure 3a. To stabilize training and improve convergence, all input features were normalized. The network was trained using the Adam optimizer, a learning rate of 0.001, and a maximum of 1000 epochs. Several architectures with different hidden layer configurations were tested, and 5-fold cross-validation was used to evaluate performance. The best-performing architecture (Model 4), which comprises five layers of decreasing neuron sizes, is summarized in Table 4.
Random Forest is an ensemble learning algorithm that combines multiple decision trees to enhance robustness and mitigate overfitting. Each tree is trained on a bootstrap sample, and final predictions are averaged. Hyperparameters including the number of estimators, maximum tree depth, and minimum sample splits were optimized using Bayesian optimization. The model structure is illustrated in Figure 3b, and optimal parameters are listed in Table 5.
XGBoost is a gradient boosting framework optimized for speed and regularization. It builds additive regression trees sequentially, where each tree corrects the residual errors of the previous ensemble. Compared to standard Gradient Boosting Decision Tree (GBDT), XGBoost introduces L1/L2 regularization (α and λ) and shrinkage to control overfitting—features particularly important for small sample sizes. Hyperparameter tuning was also conducted via Bayesian optimization. The final parameter selection is detailed in Table 5.
All models underwent hyperparameter tuning using the Tree-structured Parzen Estimator (TPE) algorithm implemented in the HyperOpt Python3.11 library. The objective was to maximize the coefficient of determination (R2) and minimize error metrics. The search space for each algorithm was defined based on preliminary sensitivity analysis. To ensure robustness and mitigate overfitting under small sample conditions, 5-fold cross-validation was adopted throughout the optimization and validation process. The performance of each model was evaluated using three metrics:
  • R 2 (coefficient of determination): measures how well predictions approximate actual values.
  • MAE (mean absolute error): evaluates average absolute deviation.
  • RMSE (root mean squared error): penalizes larger errors more severely.
The calculation of these three evaluation metrics is shown below:
R 2 = 1 i = 1 n ( Y ^ i Y ¯ ) 2 / i = 1 n ( Y i Y ¯ ) 2
M A E = 1 n i = 1 n Y ^ i Y ¯ i
R M S E = i = 1 n ( Y ^ i Y i ) 2 n
where Y is the actual value; Y ¯ the mean of the actual value; Y ^ is the predicted value; and n is the number of test samples.

3. Results and Discussion

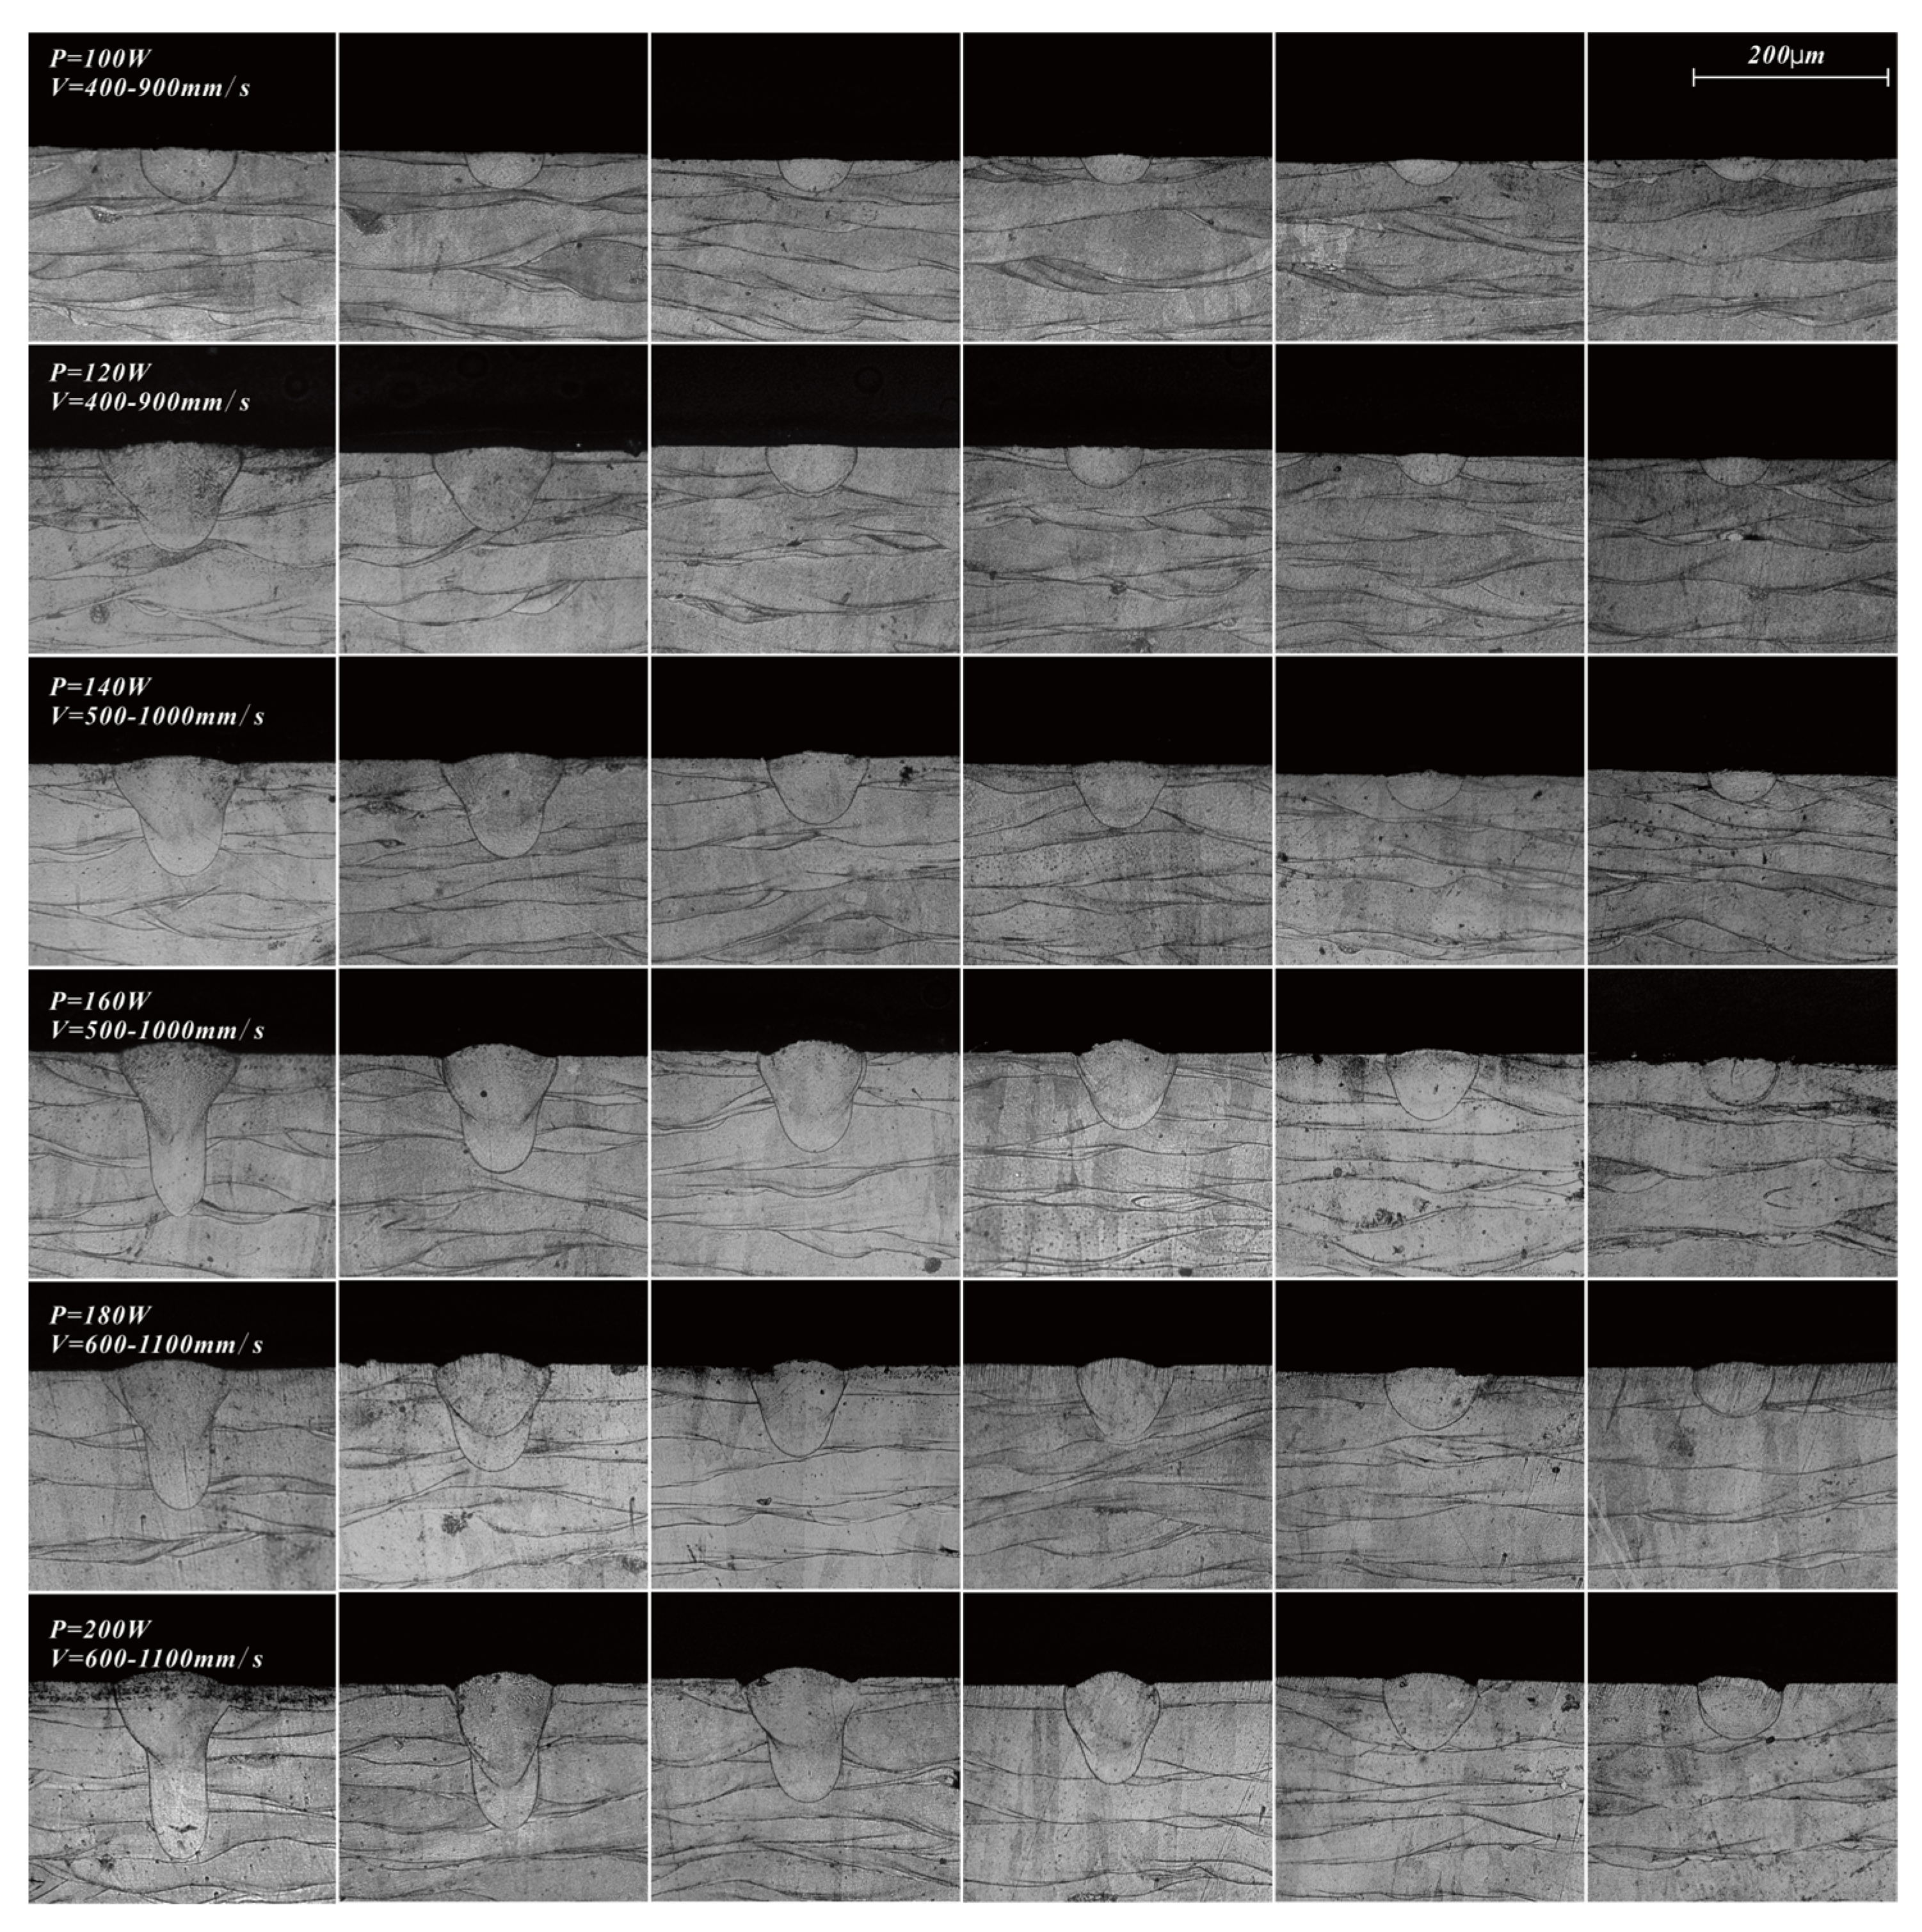
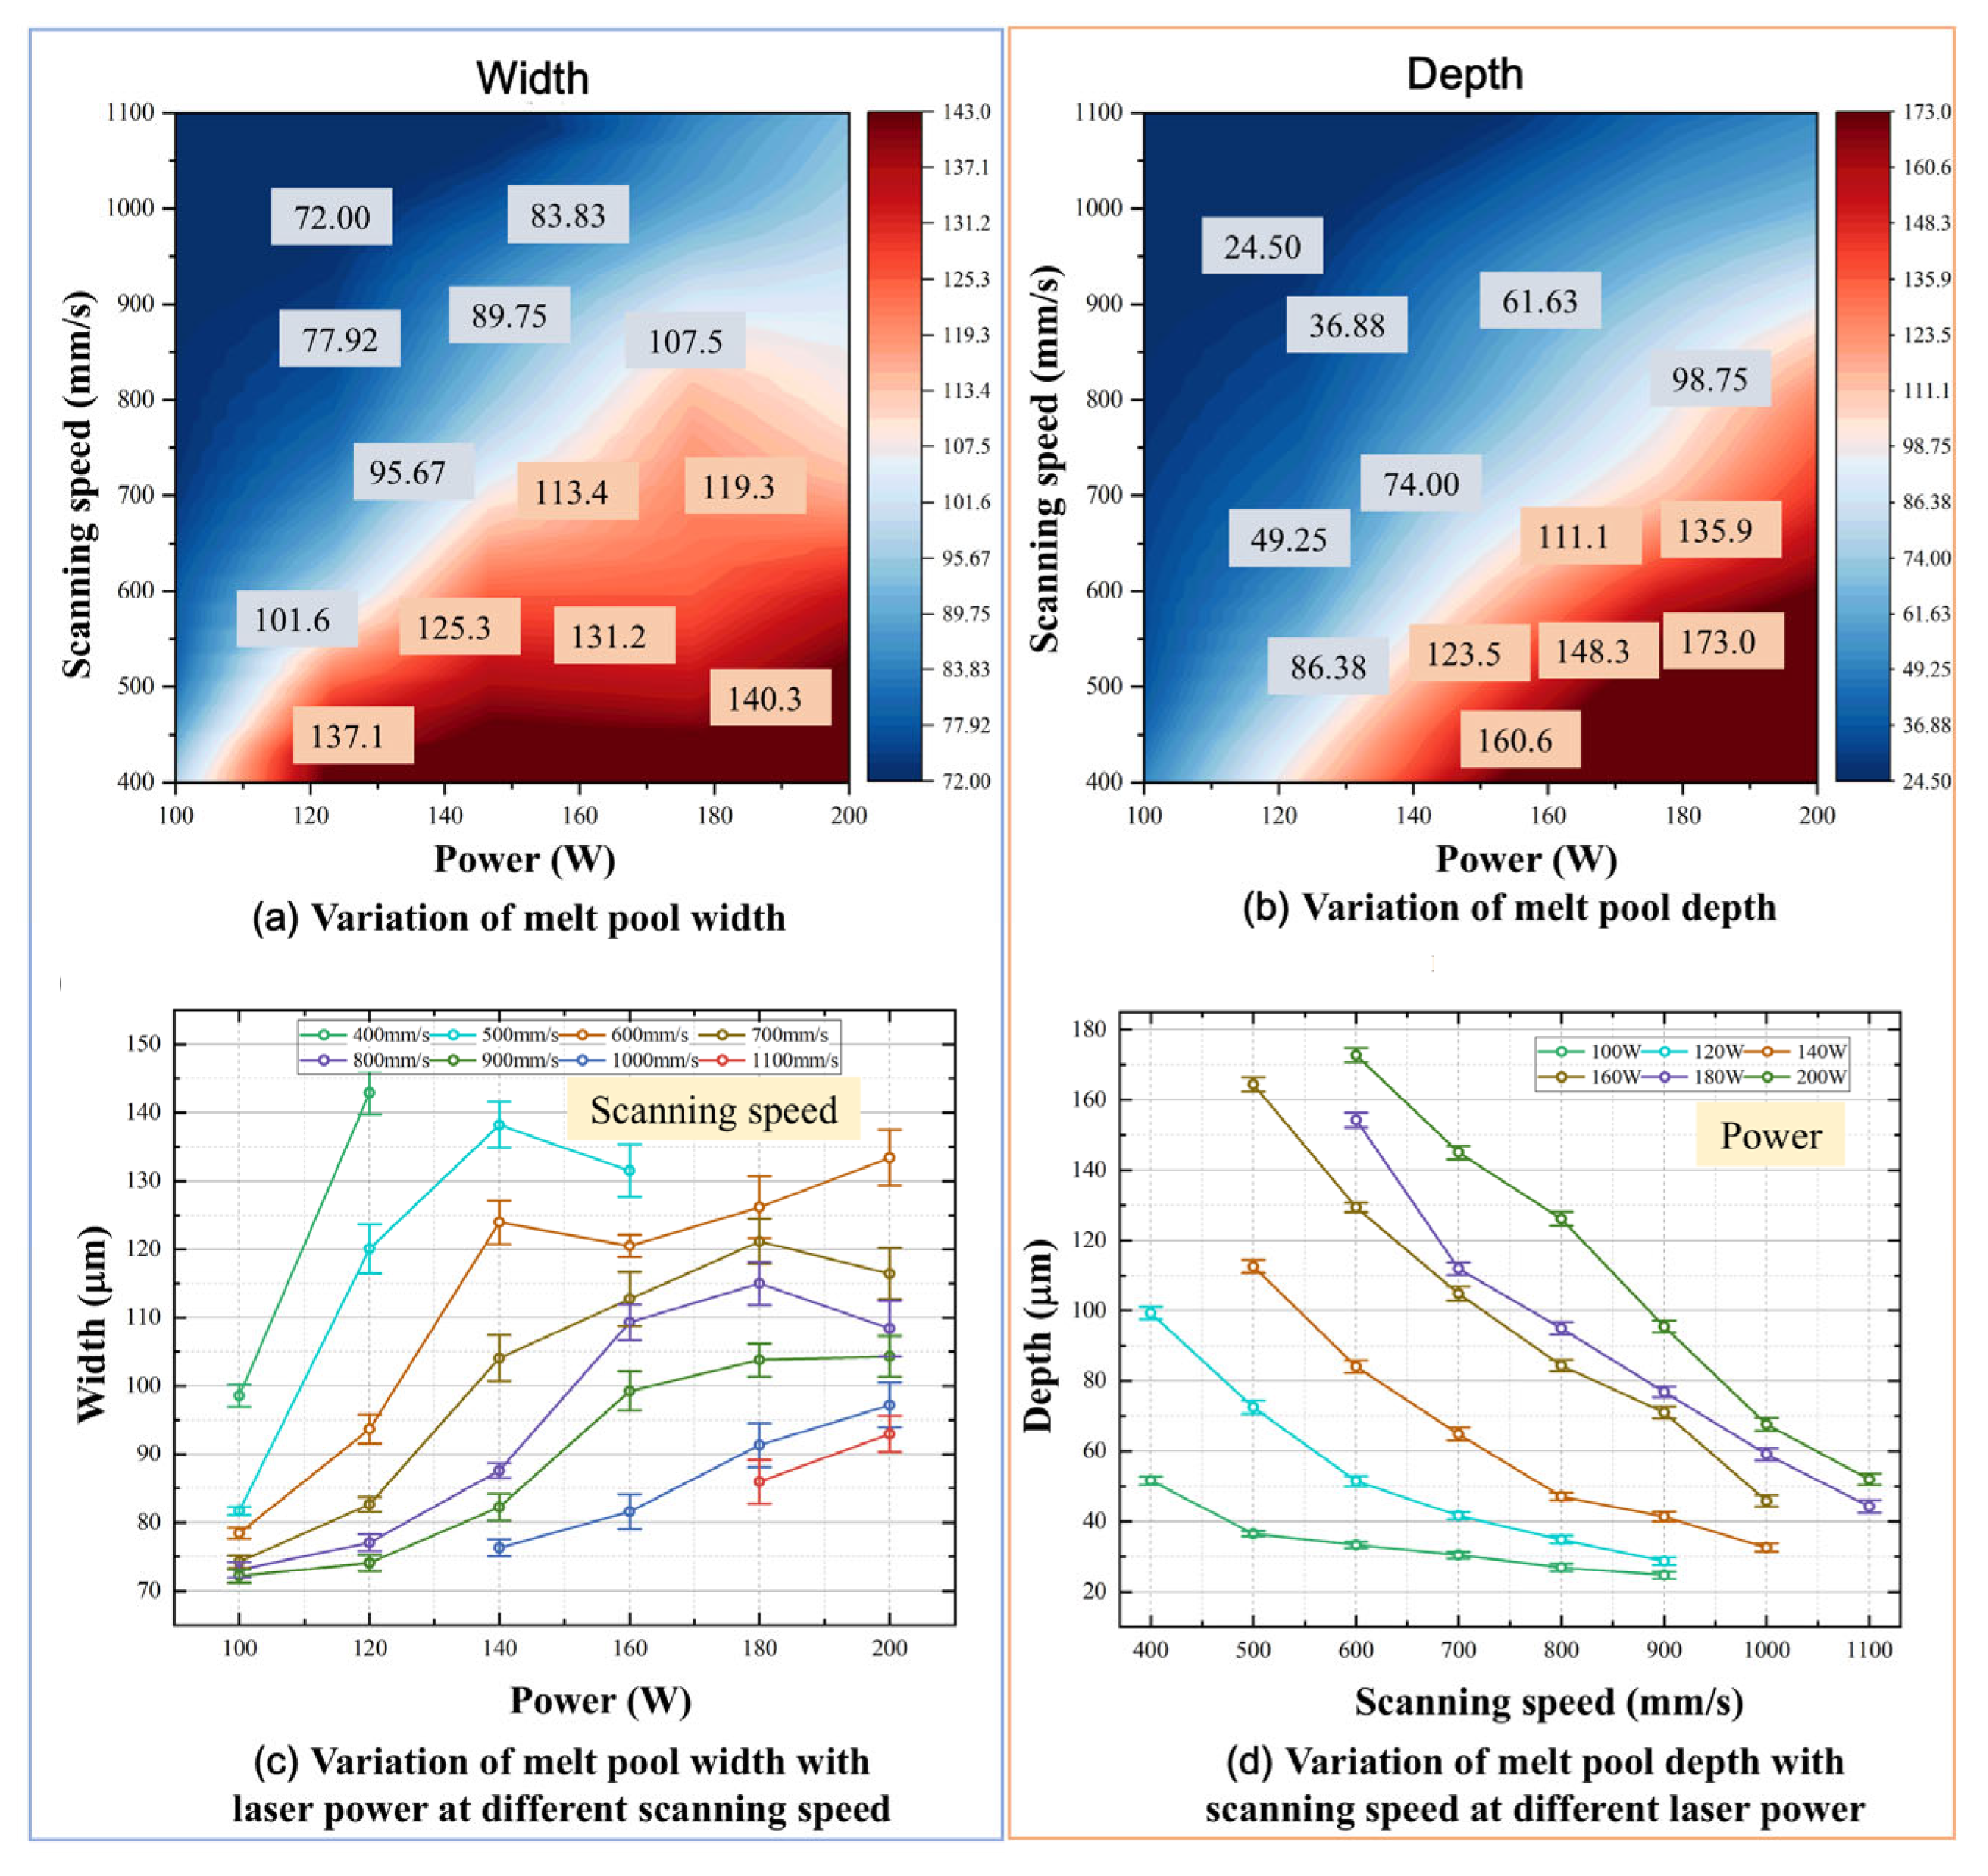
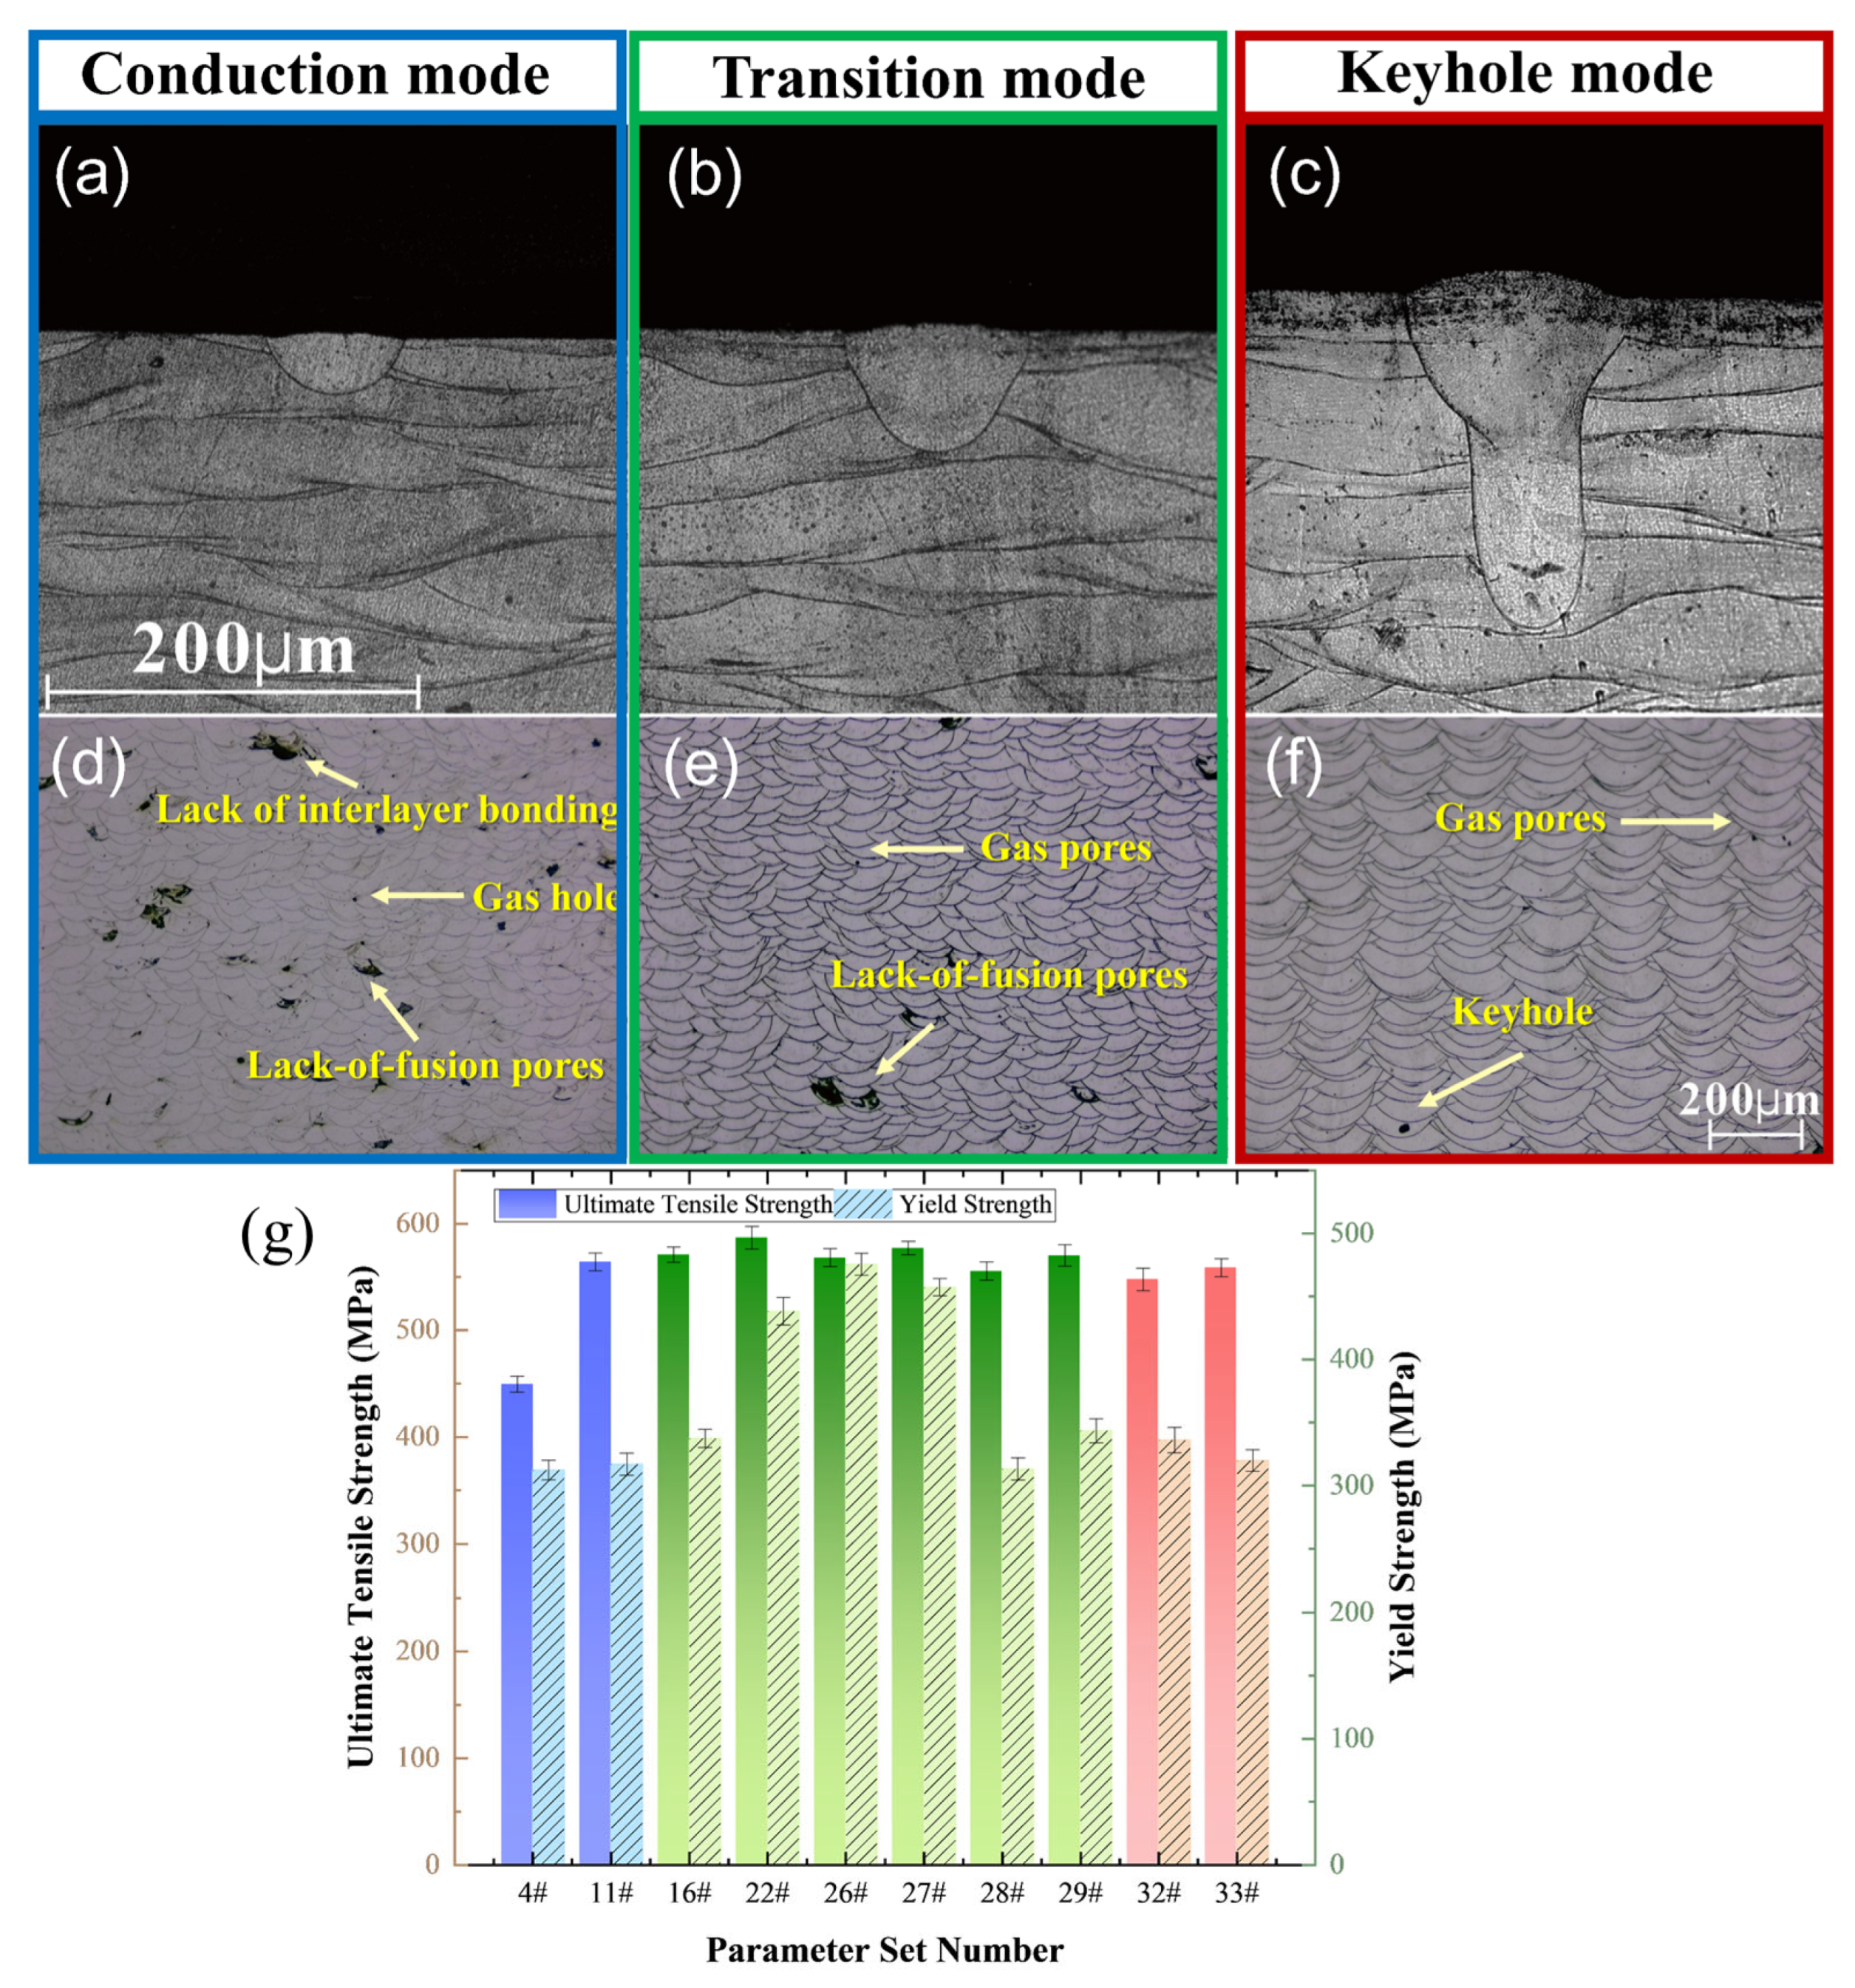
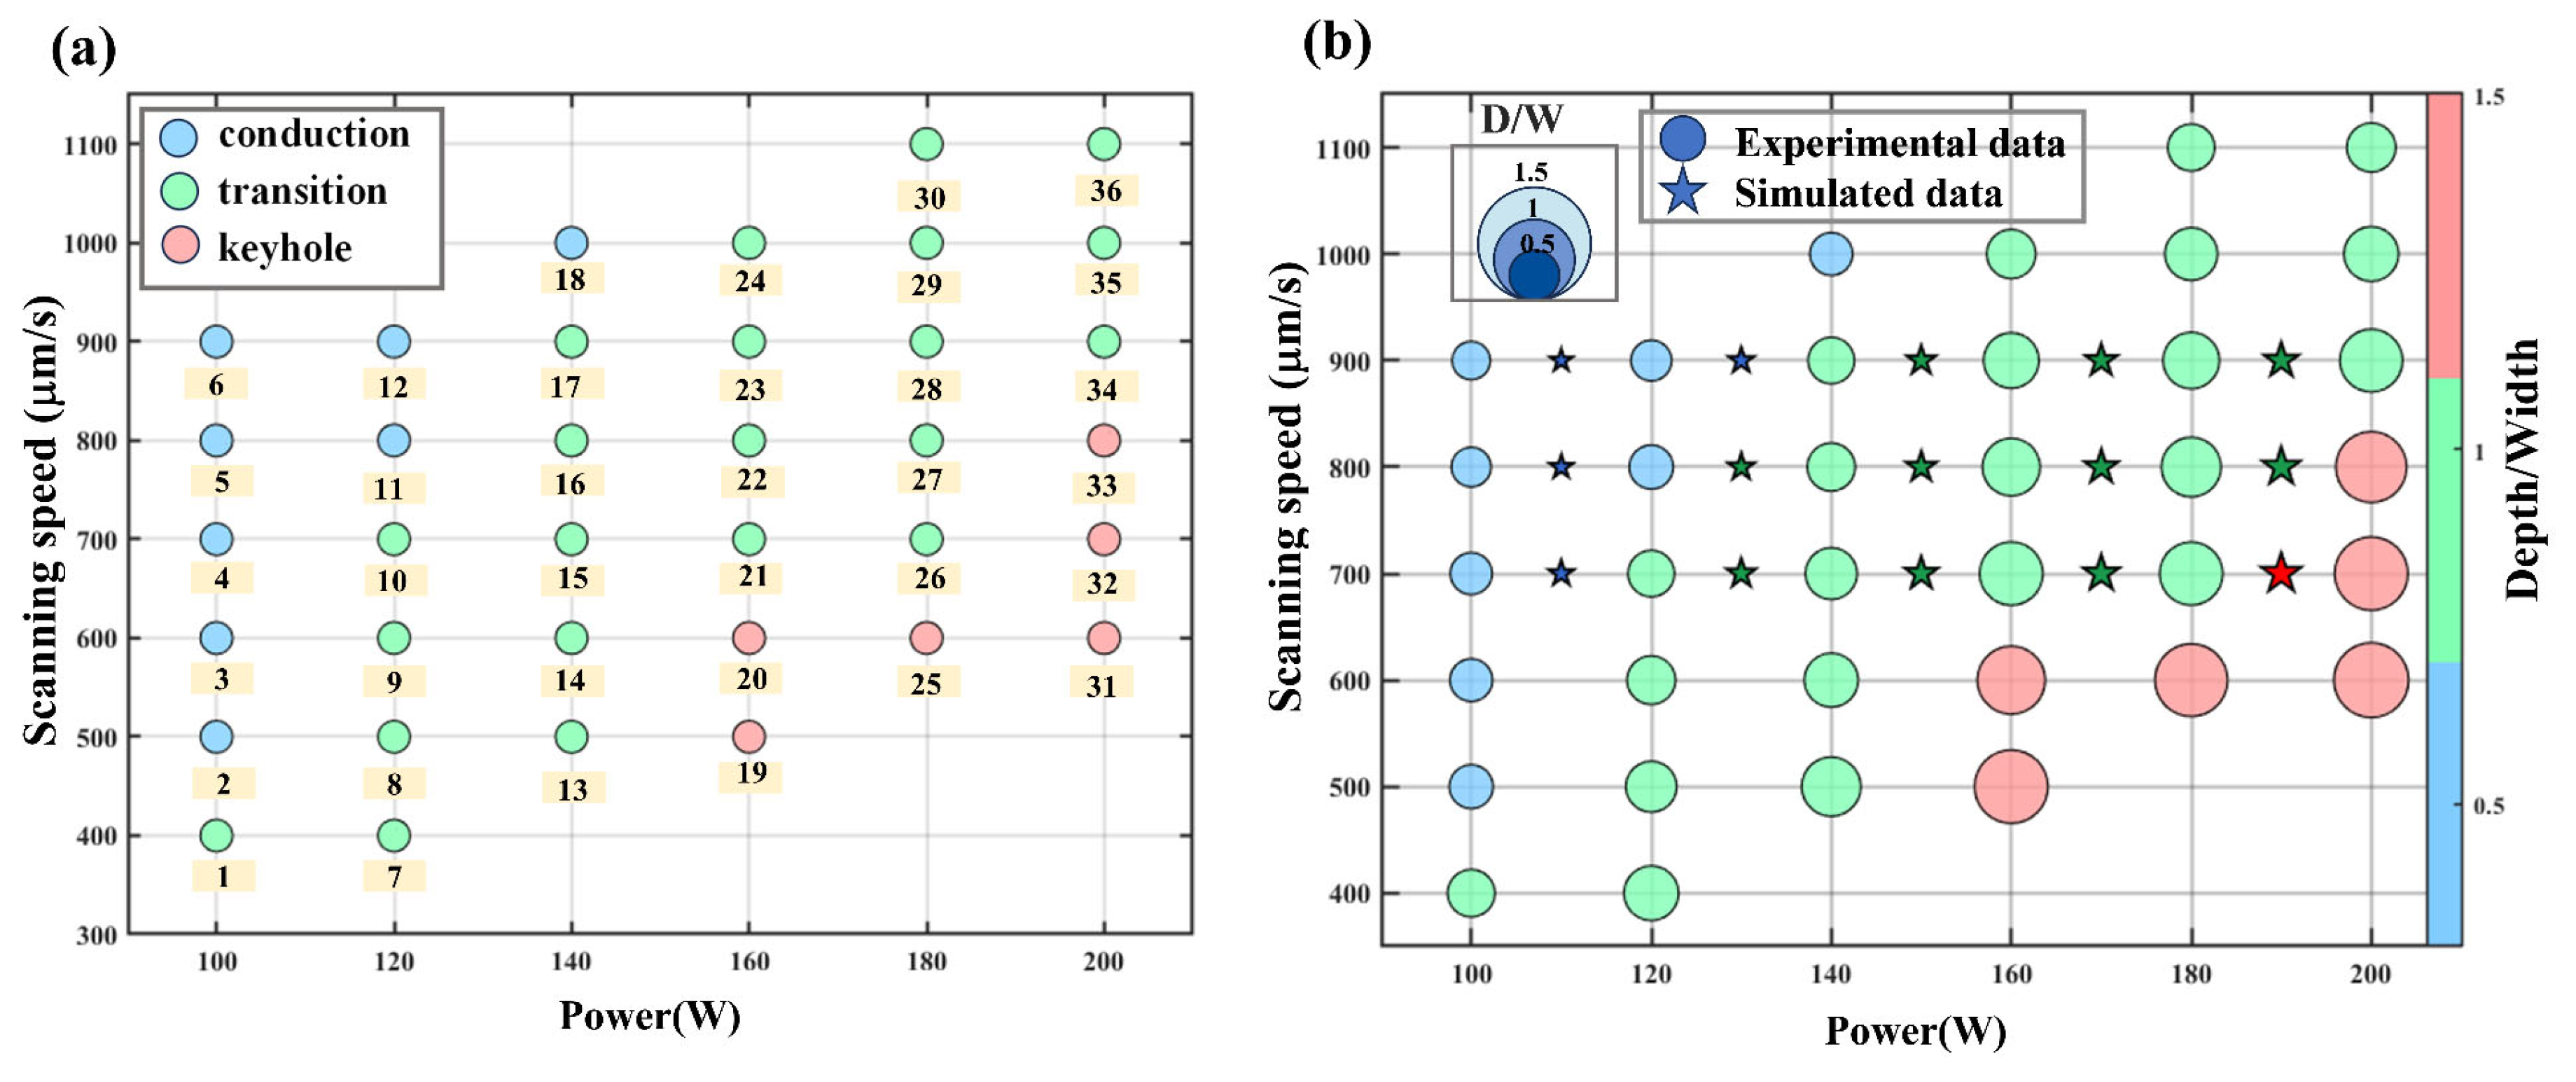
3.1. Analysis of Experimental Data

The melt pool depth-to-width ratio (D/W, denoted as N) serves as a critical dimensionless parameter for distinguishing melt pool modes. While prior studies have proposed conflicting threshold values for optimal N ranges—Guo et al. [41] suggested N > 0.5 indicates keyhole mode through numerical simulations, whereas Dilip et al. [42] experimentally determined N = 0.37–0.6 for effective substrate bonding—this study systematically captured a comprehensive dataset spanning N = 0.34–1.29, encompassing conduction, transition, and keyhole modes across the parameter matrix.
According to Figure 4, 36 sets of melt pool measurements were obtained experimentally. Figure 5a,b show their respective profiles under varying laser power at fixed scanning speeds, while Figure 5c,d illustrate the variation of melt pool width and depth as functions of laser power and scanning speed. It can be observed that both width and depth generally increase with rising laser power and decrease with increasing scan speed. Notably, the melt pool depth exhibits a larger dynamic range (24 μm to 173 μm) compared to width (72 μm to 143 μm), indicating its higher sensitivity to processing conditions. To account for experimental uncertainty, each data point in Figure 5c,d represents the mean value of 15 single-track measurements under identical processing conditions. The error bars denote one standard deviation (±1σ), calculated from these replicate measurements. These bars provide a quantitative indication of measurement repeatability and process stability. The increasing size of error bars at high laser power and low scan speeds suggests elevated thermal instability and inconsistent melt pool morphology in these regimes. Specifically, the melt pool width exhibits larger variability than depth under these conditions, implying greater susceptibility to fluctuation in lateral melt propagation.
To further validate the rationality of the melt pool modes classification and its relevance to build quality, representative cross-sectional morphologies, pore characteristics, and tensile test results were examined across conduction, transition, and keyhole conditions (Figure 6). The tensile tests were conducted at room temperature using a Shimadzu AG-IC 100 kN testing machine(Shimadzu Corporation; Kyoto, Japan). Specimens were prepared in accordance with ASTM E8/E8M-15 standards and tested at a strain rate of 3 mm/min [43]. Conduction-mode samples showed shallow melt pools with lack-of-fusion defects, while keyhole-mode cases exhibited deep, unstable geometries with gas-induced porosity. By contrast, the transition regime featured stable, cup-shaped melt pools with minimal porosity. This trend is reflected in tensile performance: transition-mode specimens achieved the highest UTS and YS values, while conduction and keyhole modes suffered strength degradation due to insufficient fusion and instability-induced defects, respectively. These observations provide supporting evidence that the D/W ratio correlates well with the process–structure–property relationship in L-PBF.

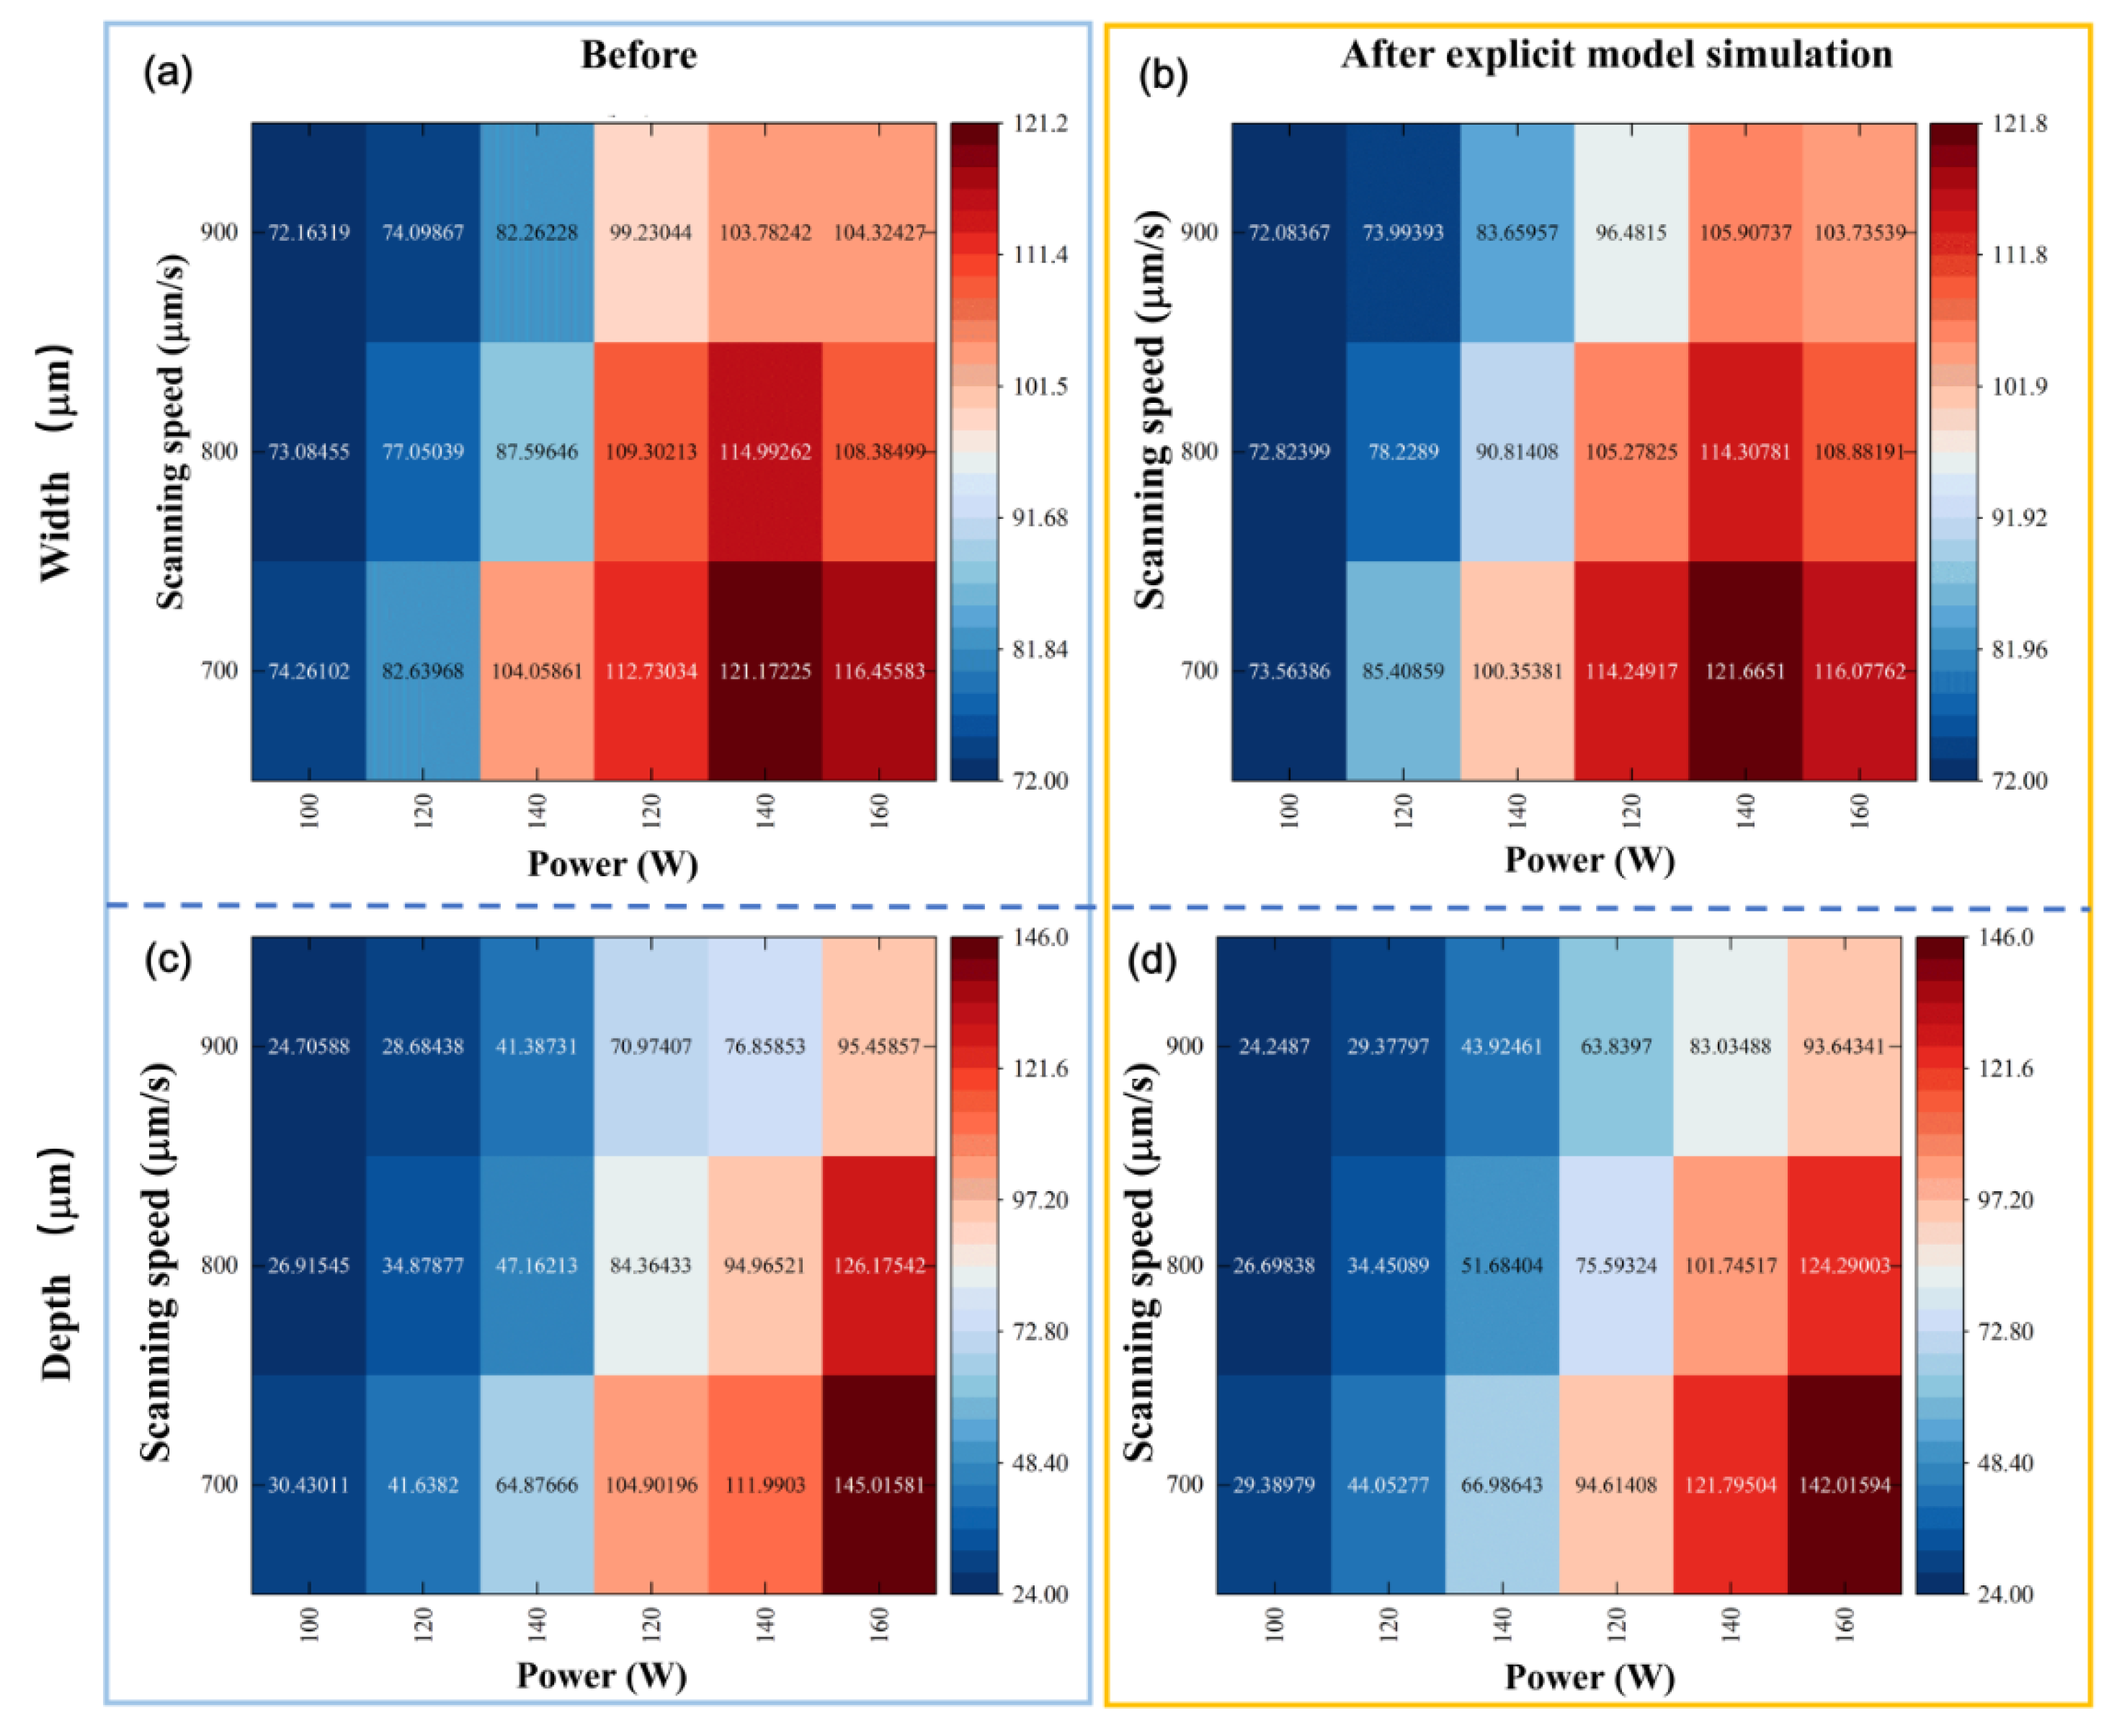
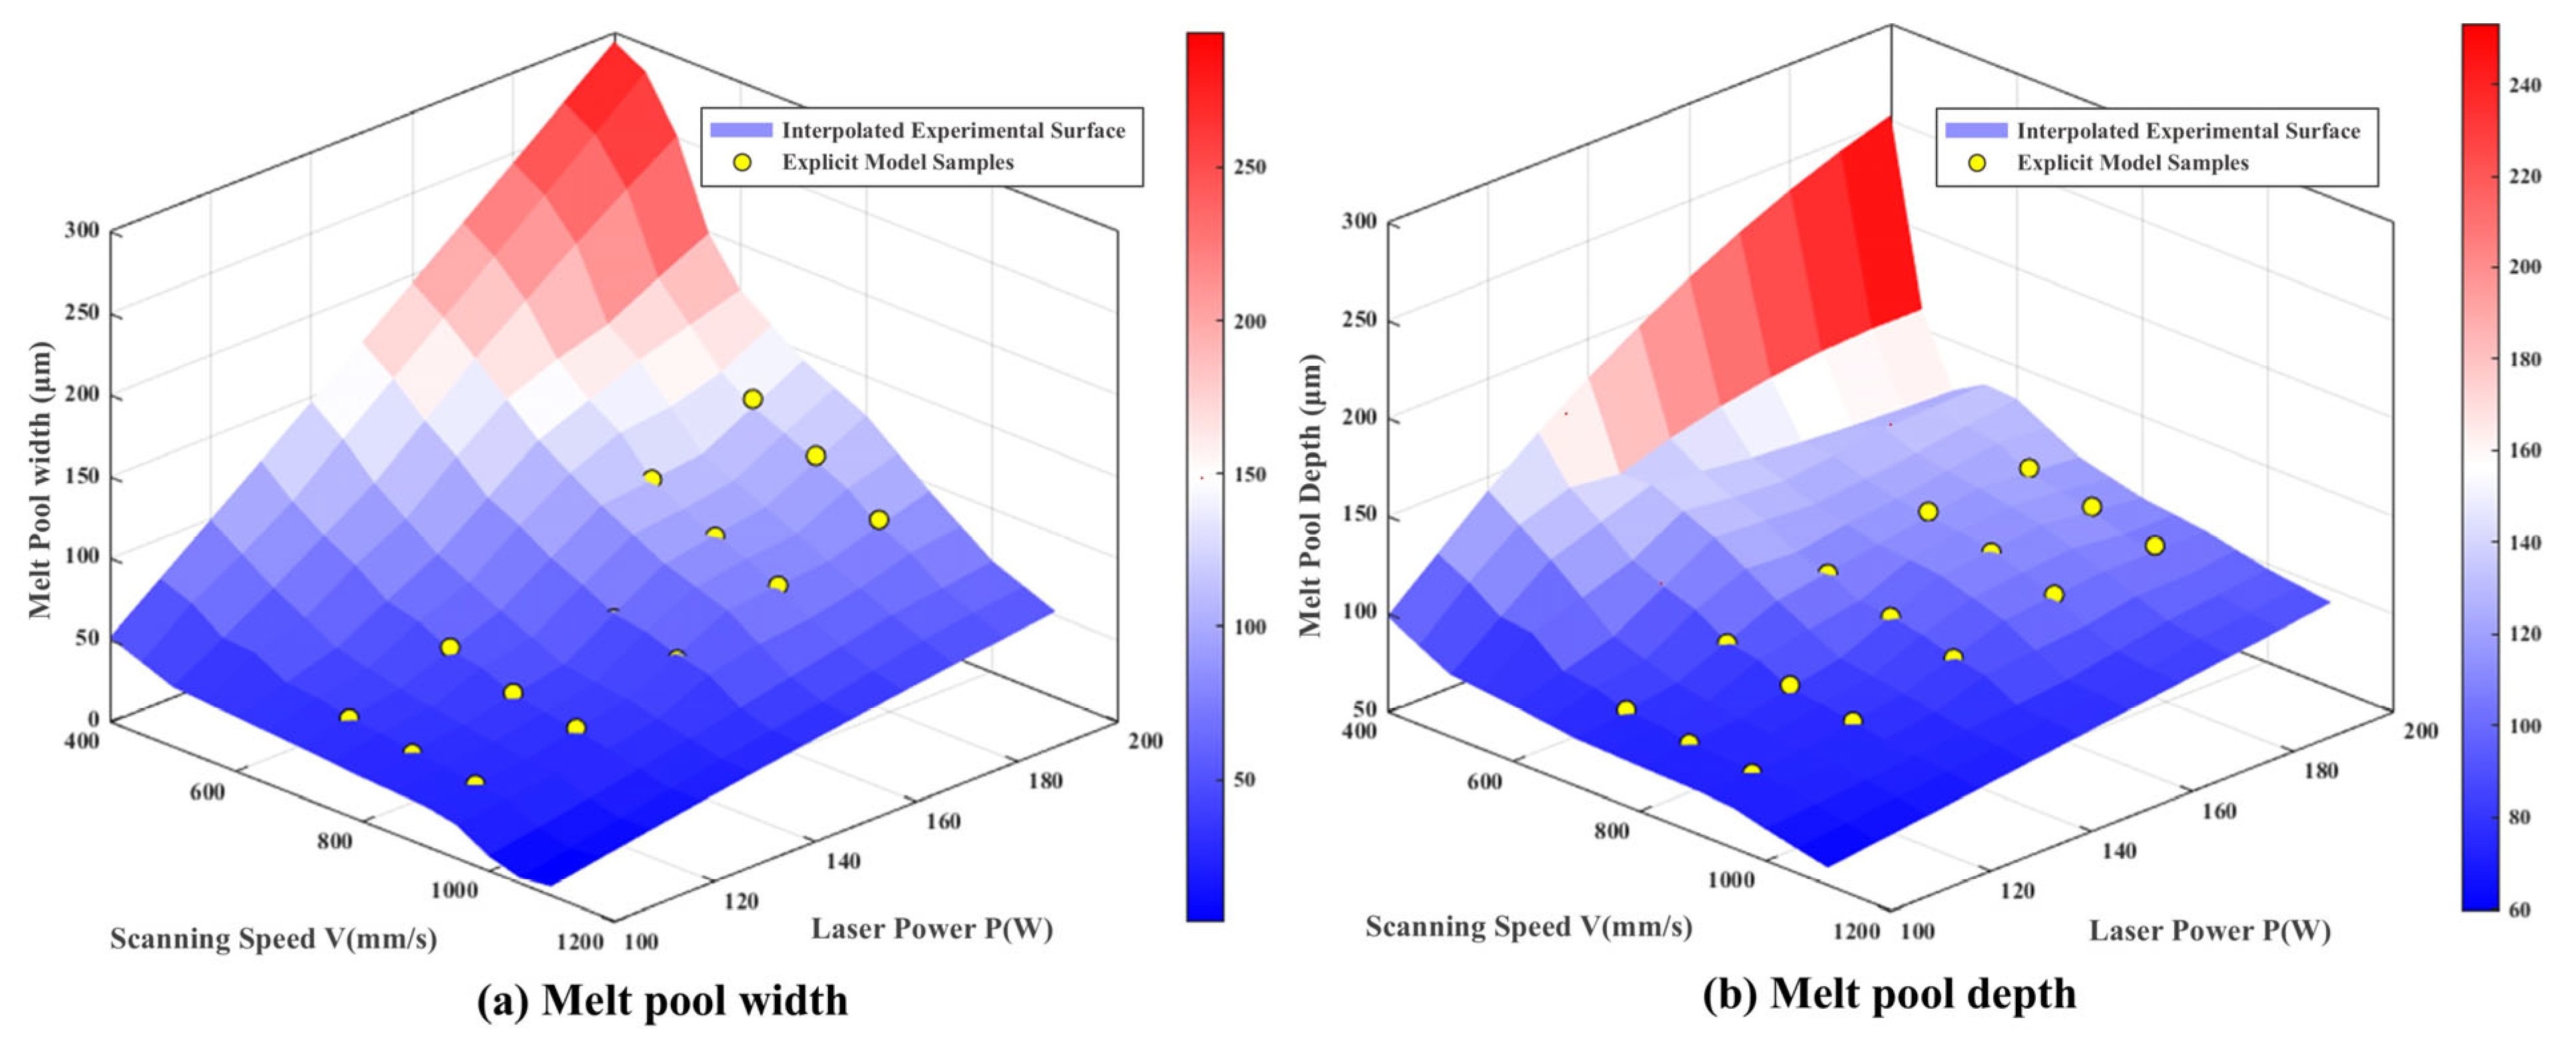
3.2. Calibration of the Explicit Model

This study enhances the original explicit model by replacing its fixed constant term with a calibratable variable coefficient. This dynamic coefficient is calibrated against experimental data to account for complex physical mechanisms, including dynamic laser penetration depth and absorption variations. Calibration was performed using 18 experimentally validated datasets covering laser powers of 100–200 W and scanning speeds of 700–900 mm/s—selected for their parametric completeness. For each constant scanning speed, linear regression analysis established relationships between laser power and melt pool dimensions (width/depth). After calibration, the explicit model achieved an average coefficient of determination ( R 2 ) of 0.925 for melt pool width and 0.965 for depth, with corresponding mean absolute errors of 1.53% and 5.23%, respectively. The predictive effectiveness of the improved explicit model is illustrated in Figure 7. Based on the calibrated regression equations, constant values were computed for laser powers of 110 W, 130 W, 150 W, 170 W, and 190 W under scanning speeds of 700, 800, and 900 mm/s. These values were then substituted into the equations listed in Table 3 to generate 15 synthetic melt pool samples.
Owing to its foundation on large-scale datasets across diverse metallic materials, the improved explicit model exhibits broad applicability and significantly enhanced predictive accuracy when calibrated against experimental measurements. The spatial distribution of both experimental and simulated data is presented in Figure 8. Notably, the synthetic data complement the experimental dataset by extending coverage into process regimes that are experimentally difficult to access—particularly at the transition-to-keyhole boundary (D/W ≈ 0.6–1.2), where melt pool behavior is highly nonlinear and sensitive to process instabilities. These regions exhibit essential nonlinearities poorly represented in physical measurements. By encoding mechanisms like power-dependent absorption, the model generates physically consistent data with enhanced nonlinear features, enabling ML algorithms to capture behavioral transitions and inflection points critical for defect prediction [44,45].
As shown in Figure 9, the explicit model-generated data (yellow points) effectively supplement regions of the parameter space where experimental coverage is sparse, particularly near the conduction-to-keyhole transition. In both width and depth surfaces, these samples enhance the representation of nonlinear zones with steep geometric gradients, which are critical for learning melt pool morphological shifts. By enriching the dataset in these regions, the augmented data improve the model’s ability to generalize and capture key transition behaviors.

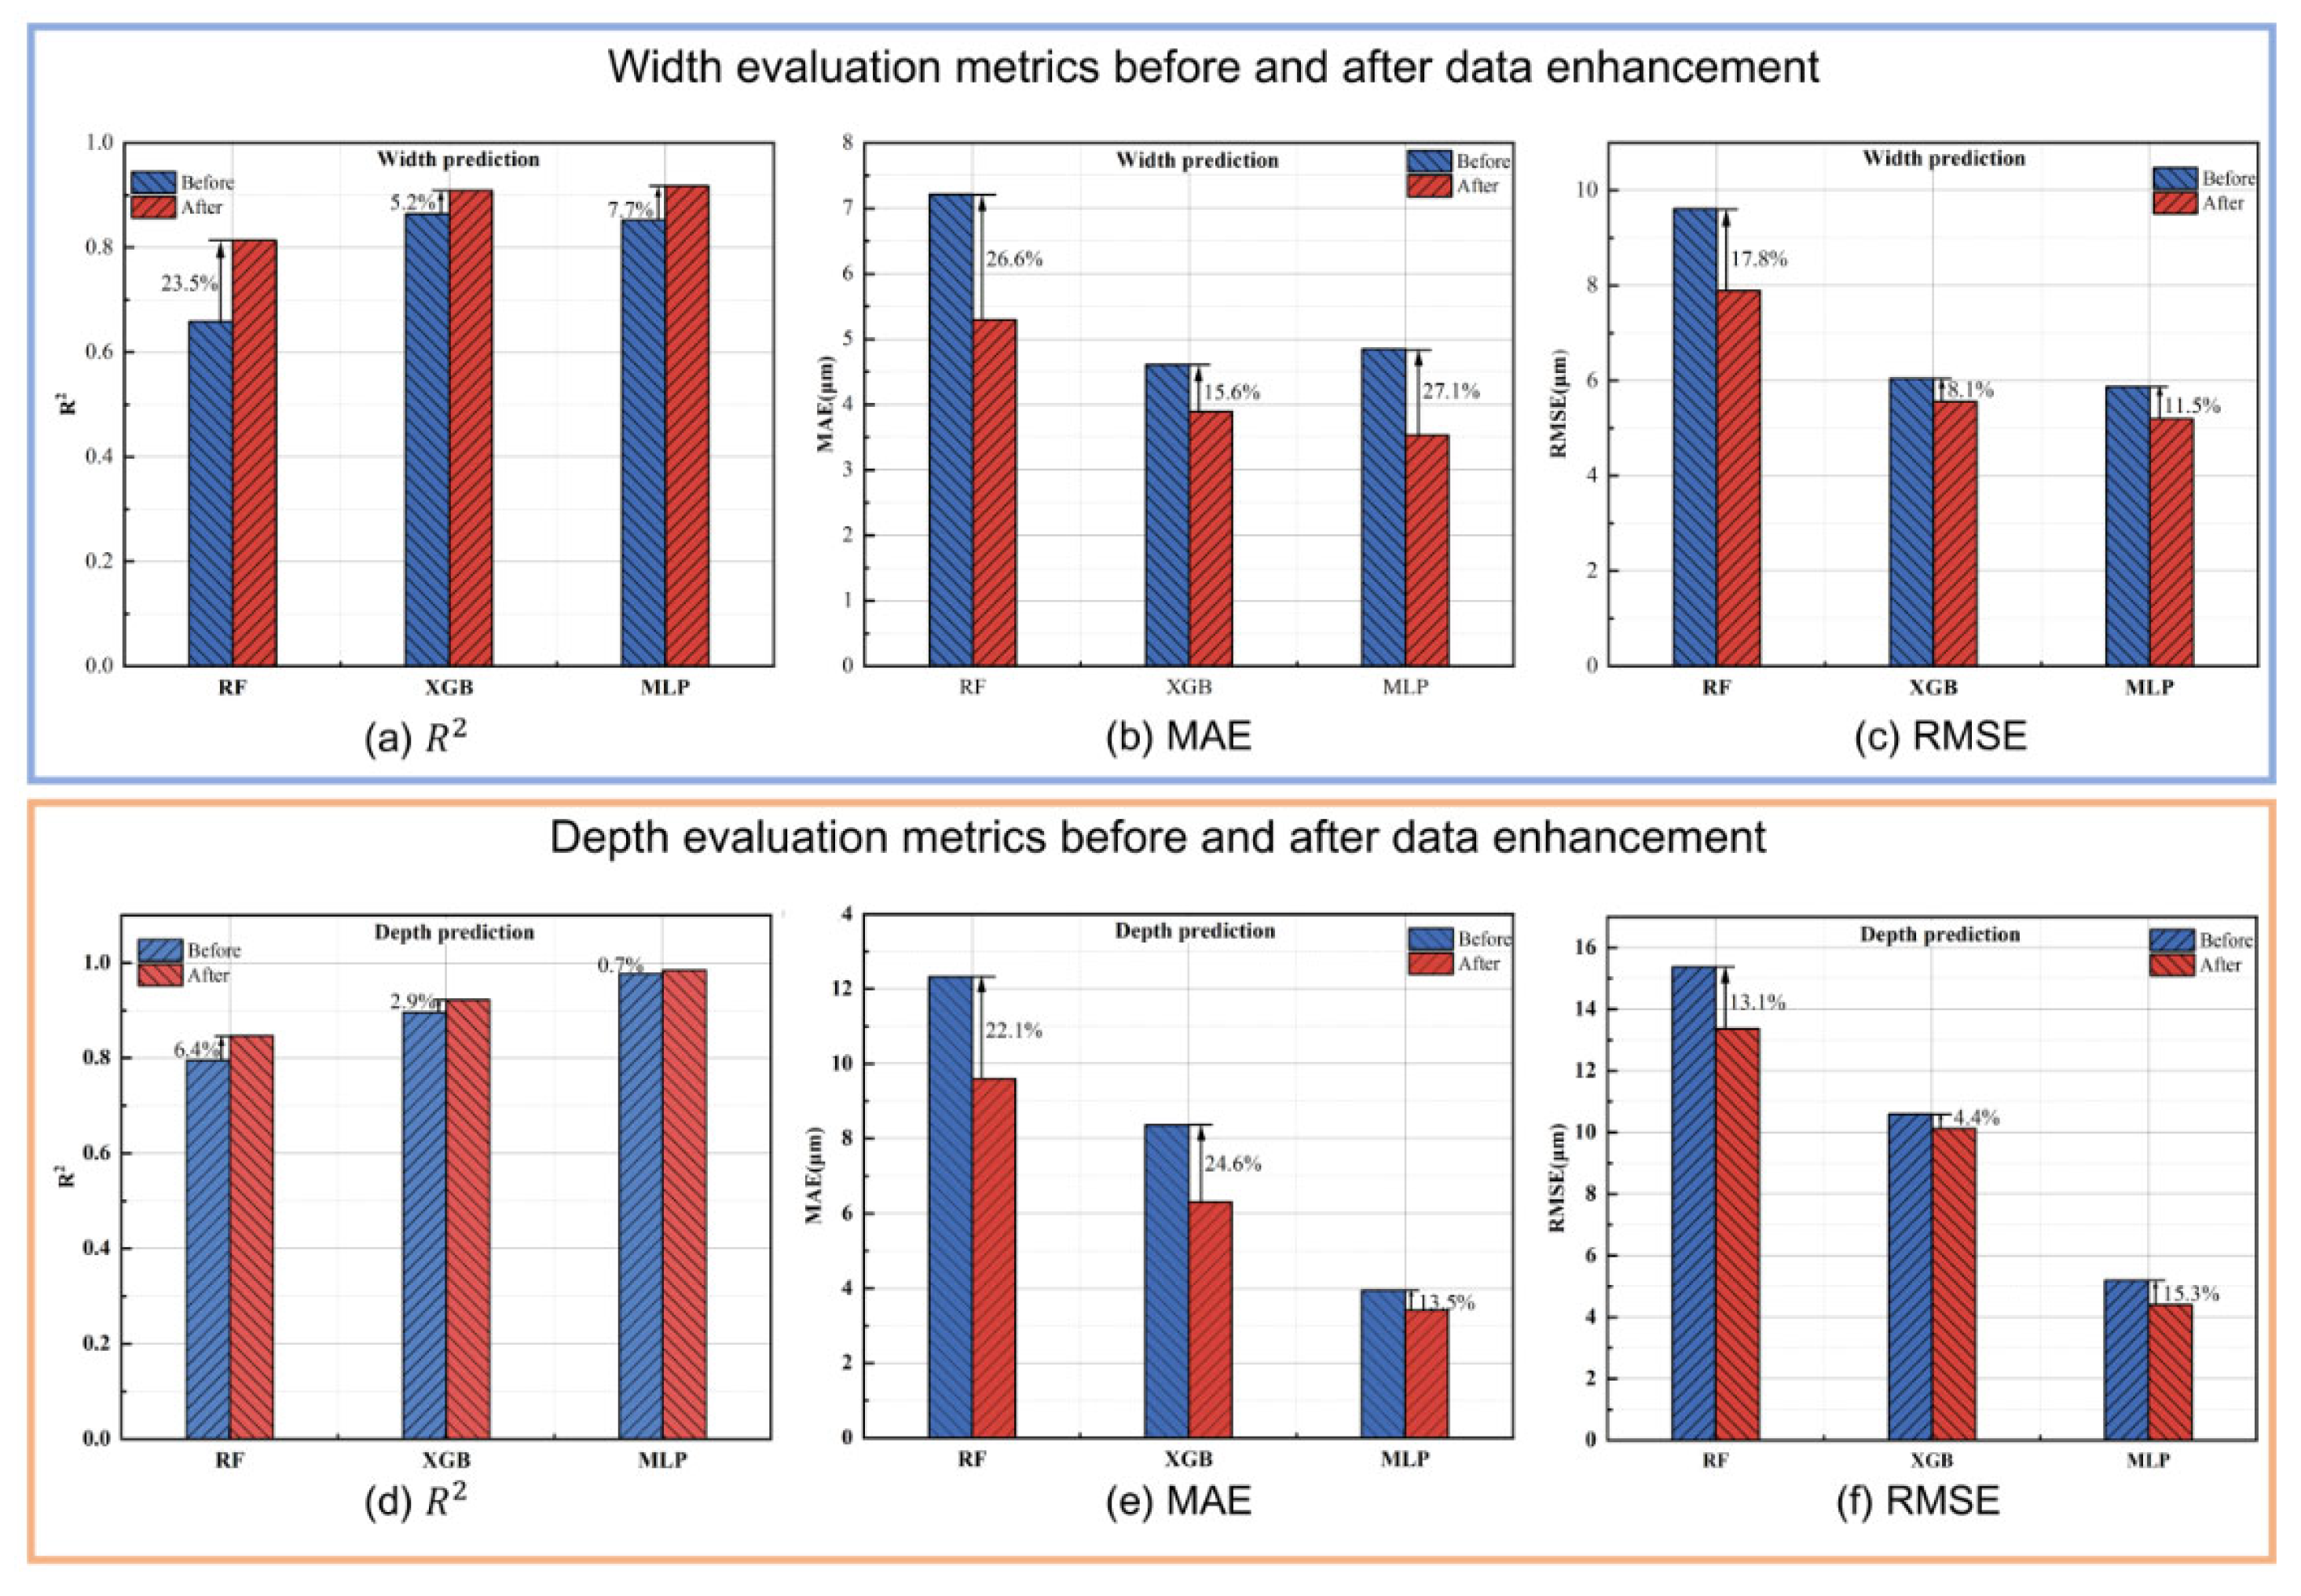
3.3. Model Training Results and Discussion

In this section, the predictive performance of the optimized machine learning (ML) models is assessed, with a focus on comparing melt pool width and depth predictions to evaluate the impact of data quality. The dataset simulated by the calibrated explicit model was integrated with the experimental data to form a hybrid training set. This augmented dataset was then used to retrain the ML models, and the results were benchmarked against models trained solely on experimental data. Details of the dataset composition are provided in Table 6. To ensure statistical consistency during fivefold cross-validation, the S0 dataset was excluded, resulting in a total of 50 samples with balanced partitions for training and testing.
When trained on the original 35 experimental data points, the XGBoost model achieved the highest R2 (0.864) for melt pool width prediction, while the MLP model yielded the lowest RMSE (5.877). For melt pool depth, the MLP model exhibited the best overall performance, attaining an R2 of 0.977, MAE of 3.939, and RMSE of 5.197—substantially outperforming the other two models. The Random Forest model consistently underperformed in both tasks.
The three machine learning models selected and optimized in this paper have different prediction performances due to different mathematical principles, but it can be observed that the changes in the three indicators—R2, MAE and RMSE—are broadly consistent. The MLP and XGBoost models show excellent prediction performance for melt pool width after data augmentation with the improved explicit model. Compared with the Random Forest model, which has an R2 value of only 0.814, the prediction accuracies of these two models are similar and above 0.9. The MLP model has the highest prediction accuracies, with an R2, MAE, and RMSE of 0.919, 3.535, and 5.202, respectively, and outperforms the other two models in all three scoring criteria. The difference in prediction performance among the three models is even more obvious in melt pool depth prediction: the R2 value of the MLP model is as high as 0.984, which is much higher than that of the remaining two algorithms, and its MAE and RMSE are close to each other, more than twice lower than those of the remaining algorithms. Meanwhile, the XGBoost model is also very effective in predicting the depth of the melt pool, with an R2, MAE, and RMSE of 0.922, 6.308, and 10.131, respectively. Overall, in terms of performance on the data-enhanced hybrid dataset, among the three models proposed in this paper, the MLP model has the best predictive results, followed by the XGBoost model, and the Random Forest model delivers a comparatively average performance.
Figure 10 and Figure 11 demonstrate that, despite the dataset expansion using the explicit model, prediction accuracy remained sensitive to data distribution. Across all models, melt pool depth was more accurately predicted than width, regardless of dataset type. This may be attributed to greater experimental variability in melt pool width. Elevated prediction errors were observed under extreme energy conditions (e.g., S9 and S17 for width; S27, S32, and S37 for depth), further highlighting the influence of data quality.
After data augmentation, all models showed marked improvement. The MLP model achieved the highest accuracy gains, with increases of up to 23.5% in R2, and reductions of 27.1% in MAE and 17.8% in RMSE. These results confirm the efficacy of the proposed augmentation strategy. By incorporating physically consistent synthetic data, the framework not only enhances predictive accuracy but also improves the physical interpretability of the model. A detailed comparison is presented in Figure 12.

4. Conclusions

This study establishes a hybrid prediction framework that couples an improved explicit model with machine learning to predict melt pool geometry in L-PBF with high accuracy and enhanced interpretability. The explicit model was calibrated using experimental data and effectively simulates melt pool width and depth by accounting for variable absorptivity and penetration depth under different processing conditions. When integrated into a machine learning pipeline, the augmented dataset enables accurate interpolation across conduction, transition, and keyhole regimes.
Model evaluation reveals that MLP outperforms other algorithms, especially in predicting melt pool depth. Data augmentation leads to a maximum R2 improvement of 23.5%, with reductions of up to 27.1% in MAE and 17.8% in RMSE. These results confirm that the predictive performance of ML models is highly dependent on dataset characteristics, particularly in high- or low-energy regimes where experimental data are scarce or unstable. Notably, the model demonstrates superior generalization in transition zones, where abrupt melt pool morphology changes typically elude experimental capture.
In summary, the explicit-model-augmented approach bridges the gap between physical interpretability and data-driven modeling. It enhances predictive robustness under small-sample constraints and offers a scalable strategy for real-time optimization in L-PBF. Despite its strong predictive performance, the model is subject to limitations related to dataset scope, lack of thermal field resolution, and material-specific calibration. These aspects can be addressed in future work by integrating physics-informed features and extending to multi-material datasets. This methodology provides a foundation for broader integration of hybrid modeling in metal additive manufacturing, supporting intelligent process control, in situ monitoring, and digital twin development.

Author Contributions

All authors contributed to the study conception and design. Material preparation, data collection, and analysis were carried out by S.L. R.L., C.D. and J.Z. revised the manuscript with respect to language, interpretations, and figures. J.Y. and Q.Z. supervised the research, critically reviewed the manuscript, and contributed to refining the interpretations and improving the overall quality of the paper. All authors have read and agreed to the published version of the manuscript.

Funding

This research was supported by the Open Fund of Hubei Key Laboratory of Mechanical Transmission and Manufacturing Engineering at Wuhan University of Science and Technology (MTMEOF2021B05).

Data Availability Statement

The original contributions presented in this study are included in the article. Further inquiries can be directed to the corresponding author.

Conflicts of Interest

The authors declare no conflicts of interest.

References

  1. ASTM52900-15; Standard Terminology for Additive Manufacturing—General Principles—Terminology. ASTM International: West Conshohocken, PA, USA, 2015.
  2. Guo, C.; Xu, Z.; Li, G.; Wang, J.; Hu, X.; Li, Y.; Lu, J. Printability, microstructures, and mechanical properties of a novel Co-based superalloy fabricated via laser powder bed fusion. J. Mater. Sci. Technol. 2024, 189, 96–109. [Google Scholar] [CrossRef]
  3. Araya, M.; Jaskari, M.; Rautio, T.; Guillén, T.; Järvenpää, A. Assessing the compressive and tensile properties of TPMS-Gyroid and stochastic Ti64 lattice structures: A study on laser powder bed fusion manufacturing for biomedical implants. J. Sci. Adv. Mater. Devices 2024, 9, 100663. [Google Scholar] [CrossRef]
  4. Rosenthal, S.; Bechler, N.; Hahn, M.; Tekkaya, A.E. Large sandwich sheets enabled by joining rolled sheets and additively manufactured core structures. Manuf. Lett. 2023, 35, 249–257. [Google Scholar] [CrossRef]
  5. Coldsnow, K.; Yan, D.; Paul, G.E.; Torbati-Sarraf, H.; Poorganji, B.; Ertorer, O.; Isgor, O.B. Electrochemical behavior of alloy 22 processed by L-PBF. Electrochim. Acta 2022, 421, 140519. [Google Scholar] [CrossRef]
  6. Lanzutti, A.; Sordetti, F.; Montanari, R.; Varone, A.; Marin, E.; Andreatta, F.; Fedrizzi, L. Effect of powder recycling on inclusion content in AISI 316L produced by L-PBF. J. Mater. Res. Technol. 2023, 23, 3638–3650. [Google Scholar] [CrossRef]
  7. Ramirez-Cedillo, E.; Uddin, M.J.; Sandoval-Robles, J.A.; Mirshams, R.A.; Ruiz-Huerta, L.; Rodriguez, C.A.; Siller, H.R. Process planning of L-PBF of AISI 316L for improving surface quality and relating part integrity with microstructural characteristics. Surf. Coat. Technol. 2020, 396, 125956. [Google Scholar] [CrossRef]
  8. Tusher, M.M.H.; Ince, A. Exploring VHCF response in L-PBF AlSi7Mg alloy: Influence of T6 heat treatment on microstructural characteristics and defect distribution. Int. J. Fatigue 2024, 185, 108471. [Google Scholar] [CrossRef]
  9. Wang, J.; Zhu, R.; Liu, Y.; Zhang, L. Understanding melt pool characteristics in laser powder bed fusion: An overview of single- and multi-track melt pools for process optimization. Adv. Powder Mater. 2023, 2, 100137. [Google Scholar] [CrossRef]
  10. Chouhan, A.; Aggarwal, A.; Kumar, A. Role of melt flow dynamics on track surface morphology in the L-PBF additive manufacturing process. Int. J. Heat Mass Transf. 2021, 178, 121602. [Google Scholar] [CrossRef]
  11. Cacace, S.; Semeraro, Q. On the lack of fusion porosity in L-PBF processes. Proc. CIRP 2022, 112, 352–357. [Google Scholar] [CrossRef]
  12. Galbusera, F.; Caprio, L.; Previtali, B.; Demir, A.G. The influence of novel beam shapes on melt pool shape and mechanical properties of L-PBF produced Al-alloy. J. Manuf. Process. 2023, 85, 1024–1036. [Google Scholar] [CrossRef]
  13. Kusuma, C.; Ahmed, S.H.; Mian, A.; Srinivasan, R. Effect of laser power and scan speed on melt pool characteristics of commercially pure titanium (CP-Ti). J. Mater. Eng. Perform. 2017, 26, 3560–3568. [Google Scholar] [CrossRef]
  14. Chen, Q.; Zhao, Y.; Strayer, S.; Zhao, Y.; Aoyagi, K.; Koizumi, Y.; To, A.C. Elucidating the effect of preheating temperature on melt pool morphology variation in Inconel 718 laser powder bed fusion via simulation and experiment. Addit. Manuf. 2021, 37, 101642. [Google Scholar] [CrossRef]
  15. Xu, Y.; Zhang, Y.; Li, X.; Zhong, Y.; Lin, K.; Liao, B.; Zhang, S. Single-track investigation of additively manufactured mold steel with larger layer thickness processing: Track morphology, melt pool characteristics and defects. Opt. Laser Technol. 2024, 171, 110378. [Google Scholar] [CrossRef]
  16. Qi, X.; Liang, X.; Wang, J.; Zhang, H.; Wang, X.; Liu, Z. Microstructure tailoring in laser powder bed fusion (L-PBF): Strategies, challenges, and future outlooks. J. Alloys Compd. 2024, 970, 172564. [Google Scholar] [CrossRef]
  17. Trageser, J.E.; Mitchell, J.A.; Johnson, K.L.; Rodgers, T.M. A Bézier curve fit to melt pool geometry for modeling additive manufacturing microstructures. Comput. Methods Appl. Mech. Eng. 2023, 415, 116208. [Google Scholar] [CrossRef]
  18. Kazemi, Z.; Soleimani, M.; Rokhgireh, H.; Nayebi, A. Melting pool simulation of 316L samples manufactured by selective laser melting method, comparison with experimental results. Int. J. Therm. Sci. 2022, 176, 107538. [Google Scholar] [CrossRef]
  19. Lüthi, C.; Afrasiabi, M.; Bambach, M. An adaptive smoothed particle hydrodynamics (SPH) scheme for efficient melt pool simulations in additive manufacturing. Comput. Math. Appl. 2023, 139, 7–27. [Google Scholar] [CrossRef]
  20. De Leon, E.; Riensche, A.; Bevans, B.D.; Billings, C. A review of modeling, simulation, and process qualification of additively manufactured metal components via the laser powder bed fusion method. J. Manuf. Mater. Process. 2025, 9, 22. [Google Scholar] [CrossRef]
  21. Wang, C.; Tan, X.P.; Tor, S.B.; Lim, C.S. Machine learning in additive manufacturing: State-of-the-art and perspectives. Addit. Manuf. 2020, 36, 101538. [Google Scholar] [CrossRef]
  22. Wu, C.; Luo, J.; Zhong, J.; Xu, Y.; Wan, B.; Huang, W.; Li, Q. Topology optimisation for design and additive manufacturing of functionally graded lattice structures using derivative-aware machine learning algorithms. Addit. Manuf. 2023, 78, 103833. [Google Scholar] [CrossRef]
  23. Guo, Y.; Zhang, Y.; Pan, Z.; Zhou, W. Recent progress of sensing and machine learning technologies for process monitoring and defects detection in wire arc additive manufacturing. J. Manuf. Process. 2024, 125, 489–511. [Google Scholar] [CrossRef]
  24. Maleki, E.; Shamsaei, N. A comprehensive study on the effects of surface post-processing on fatigue performance of additively manufactured AlSi10Mg: An augmented machine learning perspective on experimental observations. Addit. Manuf. 2024, 86, 104179. [Google Scholar] [CrossRef]
  25. Fan, F.; Jalui, S.; Shahed, K.; Mullany, B.; Manogharan, G. Mass finishing for additive manufacturing postprocessing: Tribological analysis, surface topology, image processing, predictive model, and processing recommendations. Tribol. Int. 2024, 204, 110486. [Google Scholar] [CrossRef]
  26. Karkaria, V.; Goeckner, A.; Zha, R.; Chen, J.; Zhang, J.; Zhu, Q.; Chen, W. Towards a digital twin framework in additive manufacturing: Machine learning and Bayesian optimization for time series process optimization. J. Manuf. Syst. 2024, 75, 322–332. [Google Scholar] [CrossRef]
  27. Roy, A.; Swope, A.; Devanathan, R.; Van Rooyen, I.J. Chemical composition based machine learning model to predict defect formation in additive manufacturing. Materialia 2024, 33, 102041. [Google Scholar] [CrossRef]
  28. Mohammed, A.S.; Almutahhar, M.; Sattar, K.; Alhajeri, A.; Nazir, A.; Ali, U. Deep learning based porosity prediction for additively manufactured laser powder-bed fusion parts. J. Mater. Res. Technol. 2023, 27, 7330–7335. [Google Scholar] [CrossRef]
  29. Akbari, P.; Ogoke, F.; Kao, N.Y.; Meidani, K.; Yeh, C.Y.; Lee, W.; Farimani, A.B. MeltpoolNet: Melt pool characteristic prediction in metal additive manufacturing using machine learning. Addit. Manuf. 2022, 55, 102817. [Google Scholar] [CrossRef]
  30. Voyant, C.; Notton, G.; Kalogirou, S.; Nivet, M.L.; Paoli, C.; Motte, F.; Fouilloy, A. Machine learning methods for solar radiation forecasting: A review. Renew. Energy 2017, 105, 569–582. [Google Scholar] [CrossRef]
  31. Le-Hong, T.; Lin, P.C.; Chen, J.Z.; Pham, T.D.Q.; Van Tran, X. Data-driven models for predictions of geometric characteristics of bead fabricated by selective laser melting. J. Intell. Manuf. 2023, 34, 1241–1257. [Google Scholar] [CrossRef]
  32. Inayathullah, S.; Buddala, R. Review of machine learning applications in additive manufacturing. Results Eng. 2024, 25, 103676. [Google Scholar] [CrossRef]
  33. Mundra, P.; Debnath, D.; Garg, A. A Supervised Machine Learning Model for Regression to Predict Melt Pool Formation and Morphology in Laser Powder Bed Fusion. Appl. Sci. 2023, 13, 3720. [Google Scholar] [CrossRef]
  34. Guo, S.; Agarwal, M.; Cooper, C.; Tian, Q.; Gao, R.X.; Grace, W.G.; Guo, Y.B. Machine learning for metal additive manufacturing: Towards a physics-informed data-driven paradigm. J. Manuf. Syst. 2022, 62, 145–163. [Google Scholar] [CrossRef]
  35. Mondal, S.; Gwynn, D.; Ray, A.; Basak, A. Investigation of Melt Pool Geometry Control in Additive Manufacturing Using Hybrid Modeling. Metals 2020, 10, 683. [Google Scholar] [CrossRef]
  36. Zhu, Q.; Liu, Z.; Yan, J. Machine learning for metal additive manufacturing: Predicting temperature and melt pool fluid dynamics using physics-informed neural networks. Comput. Mech. 2021, 68, 1061–1076. [Google Scholar] [CrossRef]
  37. Sharma, R.; Raissi, M.; Guo, Y. Physics-informed deep learning of gas flow–melt pool multi-physical dynamics during powder bed fusion. CIRP Ann. 2023, 72, 161–164. [Google Scholar] [CrossRef]
  38. Ritto, T.G.; Rochinha, F.A. Digital twin, physics-based model, and machine learning applied to damage detection in structures. Mech. Syst. Signal Process. 2021, 155, 107614. [Google Scholar] [CrossRef]
  39. Ren, K.; Chew, Y.; Zhang, Y.F.; Fuh, J.Y.H.; Bi, G.J. Thermal field prediction for laser scanning paths in laser aided additive manufacturing by physics-based machine learning. Comput. Methods Appl. Mech. Eng. 2020, 362, 112734. [Google Scholar] [CrossRef]
  40. Kim, J.; Lee, S.; Hong, J.K.; Kang, N.; Choi, Y.S. Calibration of laser penetration depth and absorptivity in finite element method based modeling of powder bed fusion melt pools. Met. Mater. Int. 2020, 26, 891–902. [Google Scholar] [CrossRef]
  41. Guo, M.; Gu, D.; Xi, L.; Du, L.; Zhang, H.; Zhang, J. Formation of scanning tracks during selective laser melting (SLM) of pure tungsten powder: Morphology, geometric features and forming mechanisms. Int. J. Refract. Met. Hard Mater. 2019, 79, 37–46. [Google Scholar] [CrossRef]
  42. Dilip, J.J.S.; Zhang, S.; Teng, C.; Zeng, K.; Robinson, C.; Pal, D.; Stucker, B. Influence of processing parameters on the evolution of melt pool, porosity, and microstructures in Ti-6Al-4V alloy parts fabricated by selective laser melting. Prog. Addit. Manuf. 2017, 2, 157–167. [Google Scholar] [CrossRef]
  43. ASTM E8/E8M-15; Standard Test Methods for Tension Testing of Metallic Materials. ASTM International: West Conshohocken, PA, USA, 2015.
  44. Huang, Y.; Fleming, T.G.; Clark, S.J.; Marussi, S.; Withers, P.J. Keyhole fluctuation and pore formation mechanisms during laser powder bed fusion additive manufacturing. Nat. Commun. 2022, 13, 1079. [Google Scholar] [CrossRef] [PubMed]
  45. Zhao, C.; Parab, N.D.; Li, X.; Fezzaa, K.; Tan, W.; Rollett, A.D. Critical instability at moving keyhole tip generates porosity in laser melting. Science 2020, 370, 1080–1086. [Google Scholar] [CrossRef] [PubMed]
Figure 1. (a) Cross-sectional morphology of a single-track melt pool formed during L-PBF processing of 316 L stainless steel; (b) example of surface morphology of a melt pool; (c) 36 sets of test sample appearance based on L-PBF and 15 single-track melt pools per cube surface.
Applsci 15 08587 g001
Figure 2. An explicit-model-augmented machine learning framework for melt pool geometry prediction.
Applsci 15 08587 g002
Figure 3. Schematic diagram of the algorithms: (a) MLP; (b) Random Forest.
Applsci 15 08587 g003
Figure 4. Cross-section of the melt pool under various process parameters.
Applsci 15 08587 g004
Figure 5. Trend of melt pool width and depth as a function of laser power and scanning speed. (a) Variation of melt pool width with laser power and scanning speed; (b) variation of melt pool depth with laser power and scanning speed; (c) variation of melt pool width with laser power at different scanning speeds and its error bars; (d) variation of melt pool depth with scanning speed at different laser powers and its error bars.
Applsci 15 08587 g005
Figure 6. Microstructural and mechanical characterization of specimens produced under conduction, transition, and keyhole melt pool regimes. (ac) Cross-sectional melt pool morphologies corresponding to (a) conduction (blue frame), (b) transition (green frame), (c) keyhole modes(red frame); (df) optical micrographs of etched metallographic cross-sections highlighting dominant defect types; (g) corresponding tensile properties of selected parameter sets across the three regimes.
Applsci 15 08587 g006
Figure 7. The effect of the improved explicit model simulation data. (a) Experimentally obtained melt pool width data; (b) melt pool width data obtained from improved explicit model simulations; (c) experimentally obtained melt pool depth data; (d) Melt pool depth data obtained from improved explicit model simulations.
Applsci 15 08587 g007
Figure 8. Classification of melt pool regimes based on depth-to-width (D/W) ratio. (a) Experimental design layout of 36 parameter combinations across laser power (100–200 W) and scanning speed (400–1100 mm/s), with melt pool modes labeled as conduction (blue), transition (green), and keyhole (red); (b) depth-to-width and mode distribution of melt pools under each parameter set. Bubble color indicates melt pool mode, while size represents the corresponding depth-to-width.
Applsci 15 08587 g008
Figure 9. Melt pool width and depth for process parameters and explicit model simulations. (a) Melt pool width; (b) melt pool depths. (The colored graphs represent experimental data, and the yellow dots represent simulated data).
Applsci 15 08587 g009
Figure 10. Prediction of melt pool width by MLP model after data enhancement.
Applsci 15 08587 g010
Figure 11. Prediction of melt pool depth by MLP model after data enhancement.
Applsci 15 08587 g011
Figure 12. (a) Predicted R 2 values of melt pool width before and after data enhancement; (b) predicted MAE values of melt pool width before and after data enhancement; (c) predicted RMSE values of melt pool width before and after data enhancement; (d) predicted R 2 values of melt pool depth before and after data enhancement; (e) predicted MAE values of melt pool depth before and after data enhancement; (f) predicted RMSE values of melt pool depth before and after data enhancement.
Applsci 15 08587 g012
Table 1. The chemical composition of the 316 L powder (wt%).
ElementsFeCCrNiMoMnSi
316 L67.980.008617.1111.012.420.810.66
Table 2. L-PBF experimental process parameters.
Process Parameters
(Symbol, Unit)
Values
Laser power (P, W)100, 120, 140, 160, 180, 200
Scan speed (V, mm/s)400, 500, 600, 700, 800, 900, 1000, 1100
Laser spot diameter ( d 0 , mm)0.06
Hatch spacing (d, mm)0.5
Layer thickness (H, mm)0.03
Table 3. Equations for modeling melt pool geometry.
Task (Label)Equation
Depth D = A × 10 6 × P 0.51 V 0.46 ρ 0.46 C p 0.46 k 0.06 ( T m T 0 ) 0.51
Width W = B × 10 6 × P 0.59 V 0.36 ρ 0.39 C p 0.39 k 0.21 ( T m T 0 ) 0.60
where D is the depth of the melt pool; W is the width of the melt pool; P is the laser power; V is the scanning speed of the beam; C p is the thermal conductivity of the alloy; k is the specific heat capacity of the alloy; ρ is the density of the alloy; T m is the temperature; T 0 is the temperature far away from the melt pool; and A and B are fitted constants calibrated using experimental data.
Table 4. MLP hidden layer parameters.
Model NumberThe Number of Neurons in the Hidden Layer
First LayerSecond LayerThird LayerForth LayerFifth Layer
Model 14832---
Model 2483216--
Model 364483216-
Model 4644832168
Table 5. Specific parameter selection of Random Forest and XGBoost models in Bayesian optimization.
ModelHyperparametersBefore Data EnhancementData Enhancement
RFn_estimators372148
max_depth6191
min_samples_split22
min_samples_leaf11
XGBoostn_estimators12131066
learning_rate0.10.3
max_depth43
min_child_weight11
Subsample0.80.8
Table 6. Correspondence between process parameters and sample numbers.
Scanning Speed
(mm/s)
Laser Power (W)
100110120130140150160170180190200
400S0-S9--------
500S1-S10-S18-S27----
600S2-S11-S19-S28-S36-S45
700S3S6 *S12S15 *S20S24 *S29S33 *S37S42 *S46
800S4S7 *S13S16 *S21S25 *S30S34 *S38S43 *S47
900S5S8 *S14S17 *S22S26 *S31S35 *S39S44 *S48
1000----S23-S32-S40-S49
1100--------S41-S50
Where bold is the deleted sample, those with symbols ‘*’ are simulated data, and the rest are experimental data.
Disclaimer/Publisher’s Note: The statements, opinions and data contained in all publications are solely those of the individual author(s) and contributor(s) and not of MDPI and/or the editor(s). MDPI and/or the editor(s) disclaim responsibility for any injury to people or property resulting from any ideas, methods, instructions or products referred to in the content.

