1. Introduction
Global energy demand continues to rise alongside population growth and economic expansion, while traditional fossil fuels face dual pressures of resource depletion and environmental pollution. Against this backdrop, the transition to clean energy is imperative. Among clean energy sources, nuclear fusion energy, characterized by its abundant fuel reserves, high energy output efficiency, and inherent safety features, is regarded as the most promising ultimate energy solution. Nuclear fusion releases energy through the fusion of hydrogen isotopes under extreme conditions. The primary technological approaches currently include magnetic confinement and inertial confinement.
The tokamak, as a representative device for magnetic confinement fusion, utilizes toroidal magnetic fields to confine plasma at temperatures exceeding tens of millions of degrees Celsius within a vacuum chamber. To achieve deuterium–tritium (D-T) fusion, the Lawson criterion—requiring specific conditions of temperature, density, and confinement time—must be satisfied. Achieving the critical plasma temperature of 100–200 million degrees Celsius is particularly essential.
Tokamaks initially rely on ohmic heating; however, their efficiency drastically diminishes once temperatures reach approximately 3 keV. To overcome this limitation, auxiliary heating technologies have been developed, including Electron Cyclotron Resonance Heating (ECRH), Ion Cyclotron Resonance Heating (ICRH), Lower Hybrid Current Drive (LHCD), and Neutral Beam Injection (NBI) [
1,
2]. The synergistic interaction of these multiple mechanisms enables the breakthrough of temperature barriers, thereby creating the essential conditions for achieving controlled nuclear fusion [
3,
4].
Negative Ion Source Neutral Beam Injection (NNBI) is a critical technology in magnetic confinement fusion for heating plasma and driving current, playing a vital role in achieving fusion reactor ignition and burn control [
5]. As fusion devices scale up, the energy requirements for neutral beams have increased from the range of tens of keV to the MeV level. Traditional positive ion sources suffer from reduced efficiency under high voltage. When beam energy exceeds 50 keV per atomic mass unit (keV/amu), NNBI systems based on negative ion sources become the preferred solution due to their high neutralization efficiency and cost-effectiveness. Among NNBI experiments, the single-shot experiment is particularly crucial. Given the extremely high energy involved in the experimental discharges, equipment malfunctions are unavoidable. Such failures directly compromise the integrity of experimental data, leading to inaccuracies and instability in the results. Consequently, regular maintenance of the experimental apparatus is imperative.
The reliability of the NNBI system is of great significance to the stable operation of magnetic confinement fusion devices. However, existing studies have limitations: most of them focus on qualitative inspection of low-energy NBI systems or rely on empirical maintenance; a quantitative reliability model for the megavolt-level Negative Ion Source Neutral Beam Injection (NBI) beam source system has not been established; in addition, there is a lack of analysis on the correlation mechanism of failure rates under extreme operating conditions, and the reliability improvement measures lack theoretical support.
Early fault analysis of the NNBI system was characterized by singularity and fragmentation: fault information arising during experiments was mostly limited to simple descriptions, and no systematic equipment reliability analysis framework was established. Although investigations into fault analysis systems for similar domestic and foreign equipment have been conducted [
6,
7,
8], no dedicated fault analysis system tailored to one’s own needs has yet been initiated.
This study takes the megavolt-level NNBI beam source system as the research object and, for the first time, constructs a quantitative reliability model by combining the fault tree analysis (FTA) with the AutoFTA 3.9 platform, identifies weak links, quantifies the failure contribution weights of key components, and deduces calculation methods such as failure rates and uncertainty boundaries, so as to provide a quantitative framework for its reliability evaluation.
2. NNBI Beam Source System
The NNBI beam source system primarily provides stable and reliable negative ion beams for NNBI, preparing them for subsequent injection into the beamline. The NNBI beam source system mainly consists of two major components: the plasma generator and the negative ion accelerator. Its structure is illustrated in
Figure 1. The plasma generator is primarily composed of an RF exciter and a large-area plasma expansion chamber. The alternating electric field generated by the RF coil excites the working gas to produce plasma [
9]. The plasma expansion chamber is used to generate large-area, uniform plasma while slowing down the velocity of electrons in the plasma, thereby reducing the loss of negative ions [
10]. The negative ion accelerator consists of an extraction system and an acceleration system, designed to extract negative ions from the RF-driven negative ion source and accelerate them to the required energy while controlling their trajectory to form a negative ion beam with specific optical properties. The accelerator includes four layers of electrodes: the plasma grid (PG), the extraction grid (EG), the acceleration grid (AG), and the ground grid (GG) [
3]. The extraction system comprises the plasma grid and the extraction grid, where an electric field is applied between the plasma grid and the extraction grid to extract negative ions. The acceleration system involves a two-stage acceleration process: the electric fields applied between the extraction grid-acceleration grid and the acceleration grid-ground grid accelerate the negative ions to the target energy [
11]. Additionally, the front section of the plasma grid is equipped with a bias plate featuring multiple “window-frame” apertures, which serves to reduce the number of electrons in the extraction region and improve plasma uniformity [
12].
The operational sequence of the beam source system during a single-shot experiment is as follows: Under the centralized control system’s coordinated scheduling, the power supply system delivers electrical energy meeting stringent technical specifications to the beam source apparatus according to predefined temporal parameters. Utilizing radio-frequency (RF) discharge principles, the beam source device excites and sustains source plasma. Through specially designed extraction structures, negative ions are efficiently extracted from the plasma and accelerated by multi-stage electric fields to form a high-energy negative ion beam. This beam propagates directionally through vacuum transmission ducts, sequentially traversing a neutralization conversion unit and an electromagnetic deflection system before ultimately impinging upon the power measurement target for energy deposition. Throughout this process, an integrated diagnostic system equipped with multiple sensors acquires beam characteristic parameters in real time, providing critical data for operational status monitoring. Concurrently, ancillary subsystems continuously supply precisely regulated coolants, instrumentation gases, and high-purity working gases to ensure optimal operating conditions are maintained during the entire beam generation and transmission process. Following discharge completion, the equipment undergoes a prescribed dwell period until the vacuum chamber reaches ideal conditions for subsequent discharge scheduling. All acquired data from each discharge cycle are systematically recorded in Excel spreadsheets for analysis [
11,
13,
14]. The specific process is shown in
Figure 2.
During discharge experiments, the NNBI system operates under extreme conditions characterized by exceptionally high injection energies and voltages (typically reaching hundreds of kilovolts to megavolts) [
15,
16], combined with the requirement for certain subsystems, such as the cesium injection system, to function at elevated temperatures [
17]. These demanding operational parameters frequently result in varying degrees of damage to critical components of the equipment. Through systematic analysis of experimental operational data and regular equipment inspections, the experimental team is able to pinpoint the root causes of equipment damage.
3. Fault Tree Analysis Methodology and AutoFTA 3.9 Software
Fault tree analysis (FTA) constitutes a systematic fault diagnostic methodology that initiates with the definition of a Top Event representing the most critical system failure scenario [
18]. The analysis progresses through a deductive reasoning approach, decomposing root causes in a top-down hierarchical manner. Beginning from the Top Event, the process iteratively identifies all immediate causal factors contributing to each superior event level, continuing downward until reaching fundamental Basic Events that require no further resolution. The fault tree structure interconnects Top Events, Intermediate Events, and Basic Events through standardized logical operators—primarily AND gates and OR gates—to create a visual representation of failure propagation logic and causal relationships. This methodology enables both qualitative identification of system vulnerabilities and critical failure paths, as well as quantitative computation of Top Event occurrence probabilities. Widely implemented across complex engineering systems for reliability assessment, risk prediction, and safety assurance, FTA distinguishes itself through logical rigor, graphical clarity and intuitive representation, and broad applicability across engineering disciplines [
19].
AutoFTA 3.9, developed by Beijing ANNSO Technologies Co., Ltd., represents a comprehensive safety assessment software platform accessible to the broader engineering community. This domestically engineered solution addresses China’s critical demand for rapid analytical computation capabilities targeting large-scale complex systems. As a premier integrated fault tree modeling and analysis platform, it finds extensive application across reliability-critical sectors including aerospace, nuclear power, and automotive electronics. AutoFTA 3.9 has established itself as an indispensable instrument for engineers conducting fault diagnosis and implementing risk management protocols.
4. Fault Tree Modeling
4.1. Steps for Drawing a Fault Tree
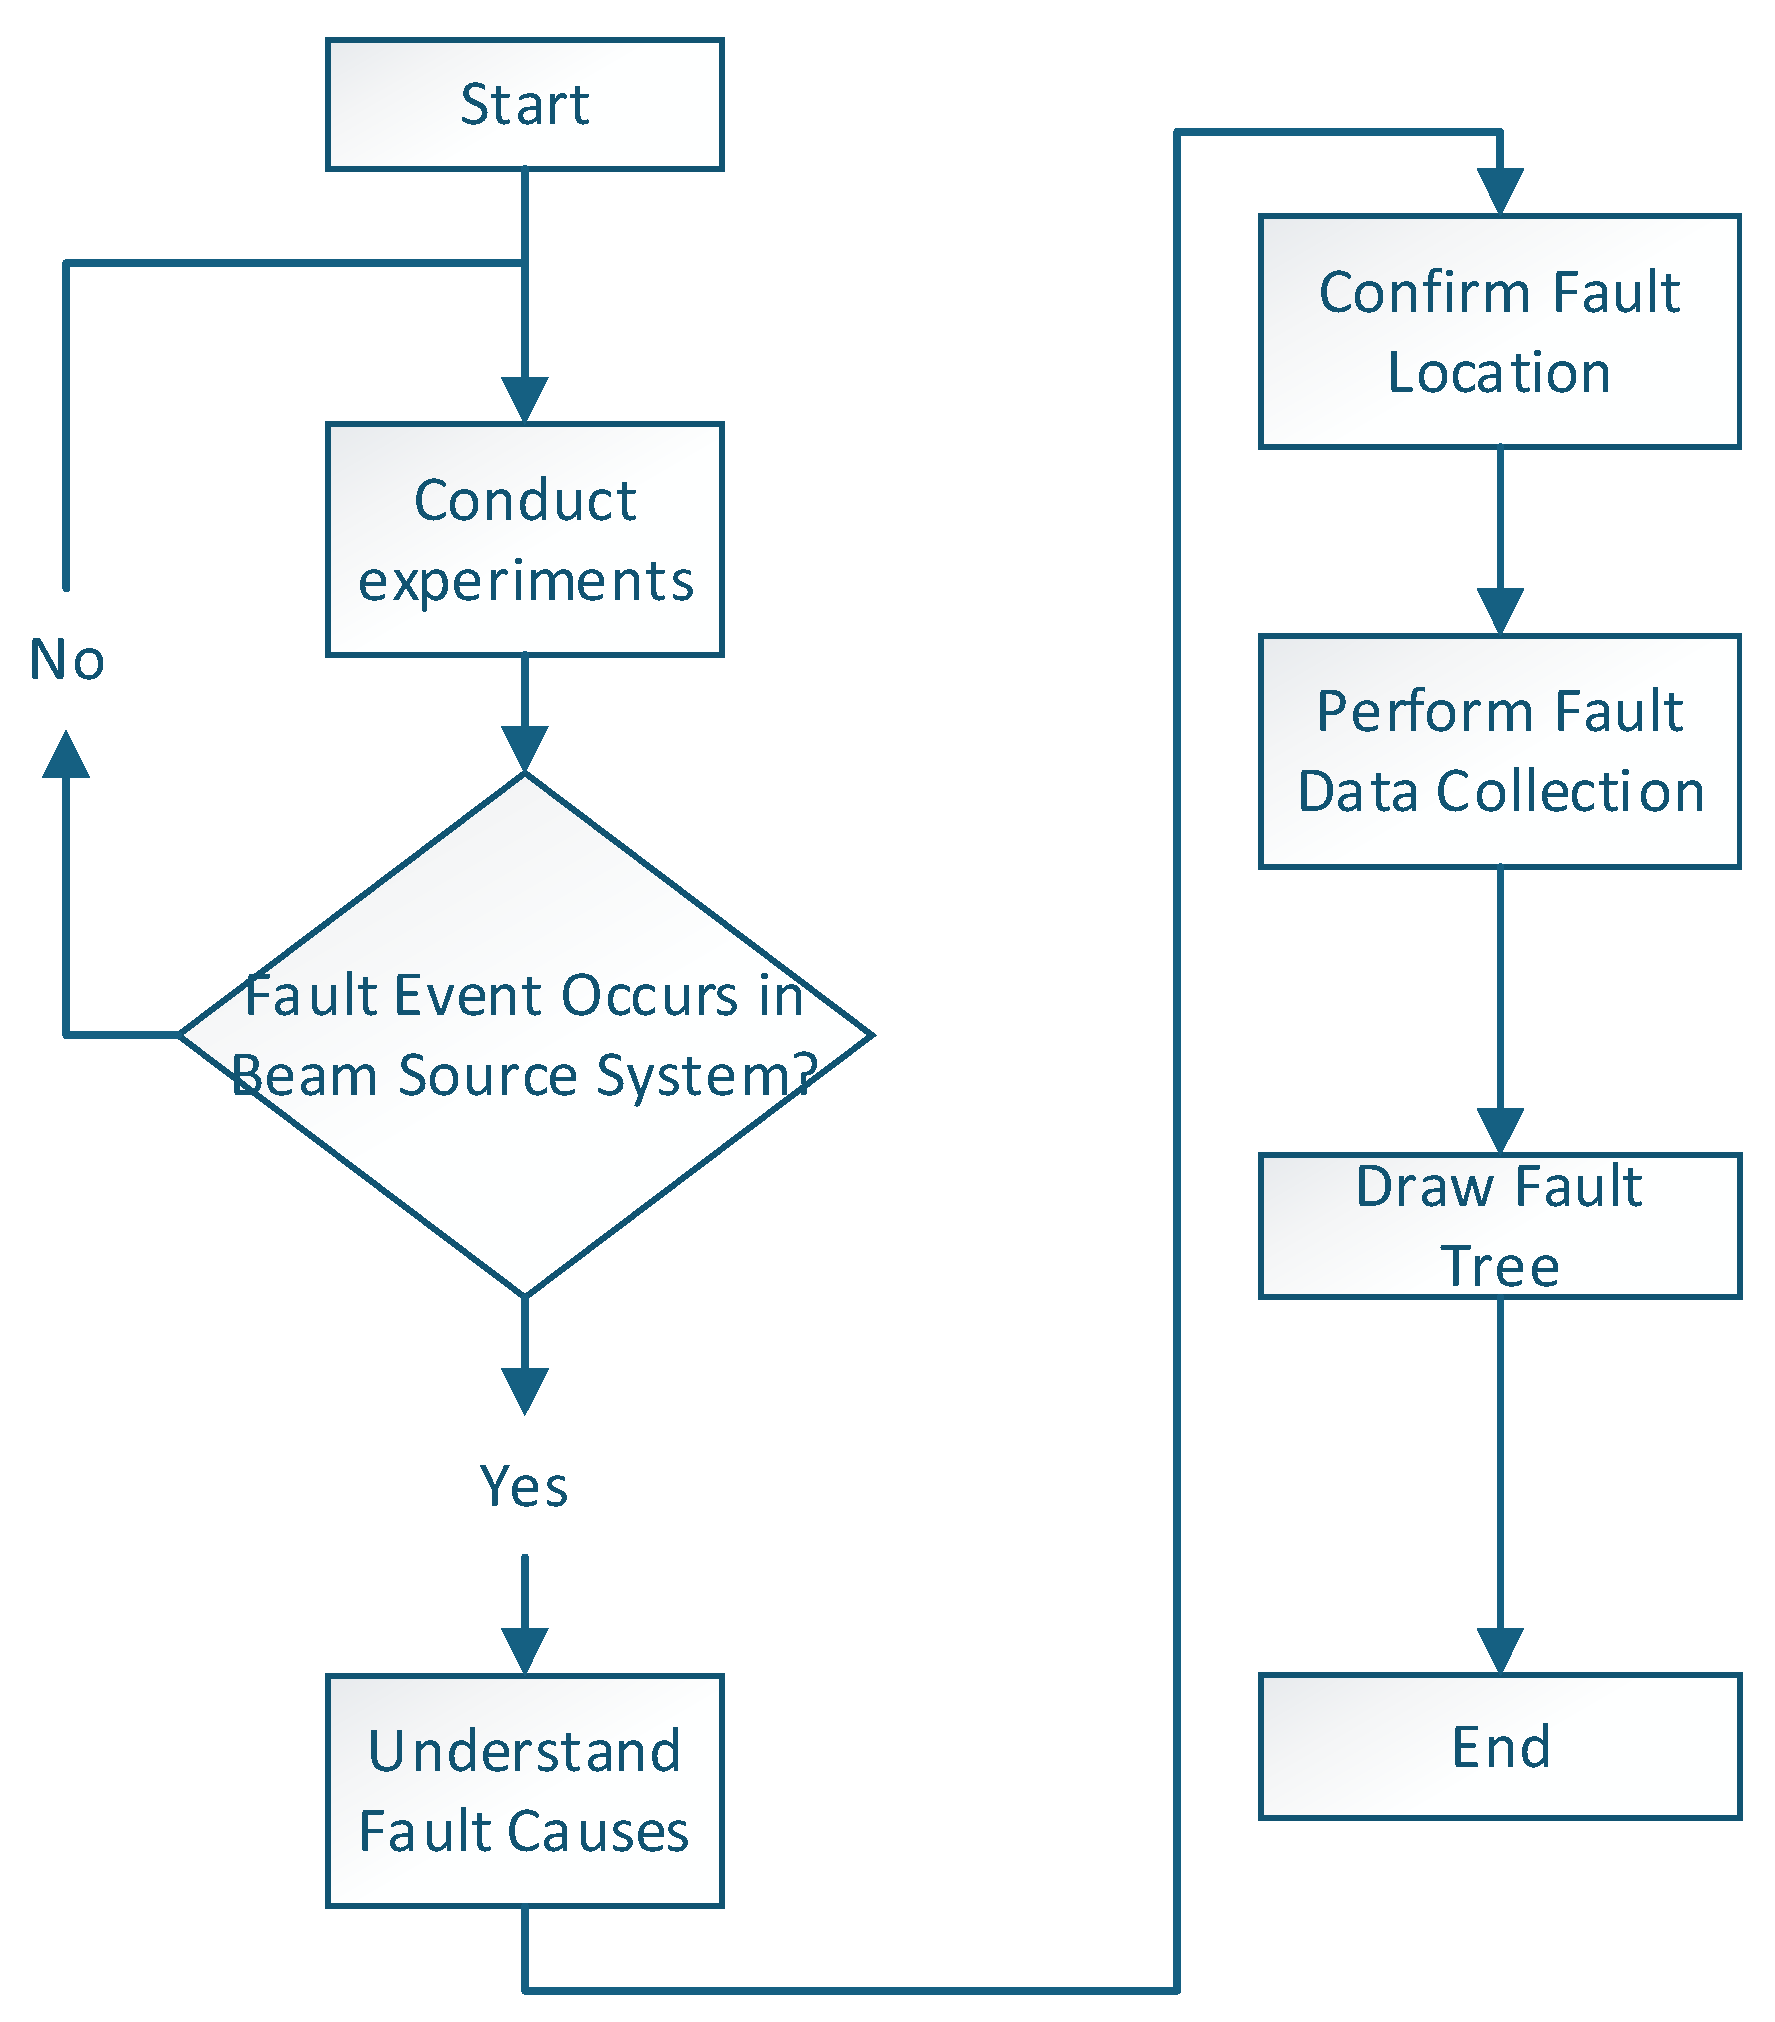
When analyzing beam source system faults using the fault tree analysis (FTA) method, it is first necessary to identify the causes of fault events occurring in the beam source system during the discharge experiments of the NNBI system. After confirming the fault location, the corresponding fault data collection work should be carried out. Finally, combined with the structural characteristics of the beam source system itself, the drawing of the fault tree diagram is completed. The specific operation flow chart is shown in
Figure 3.
4.2. Modeling of Fault Trees for Various Systems
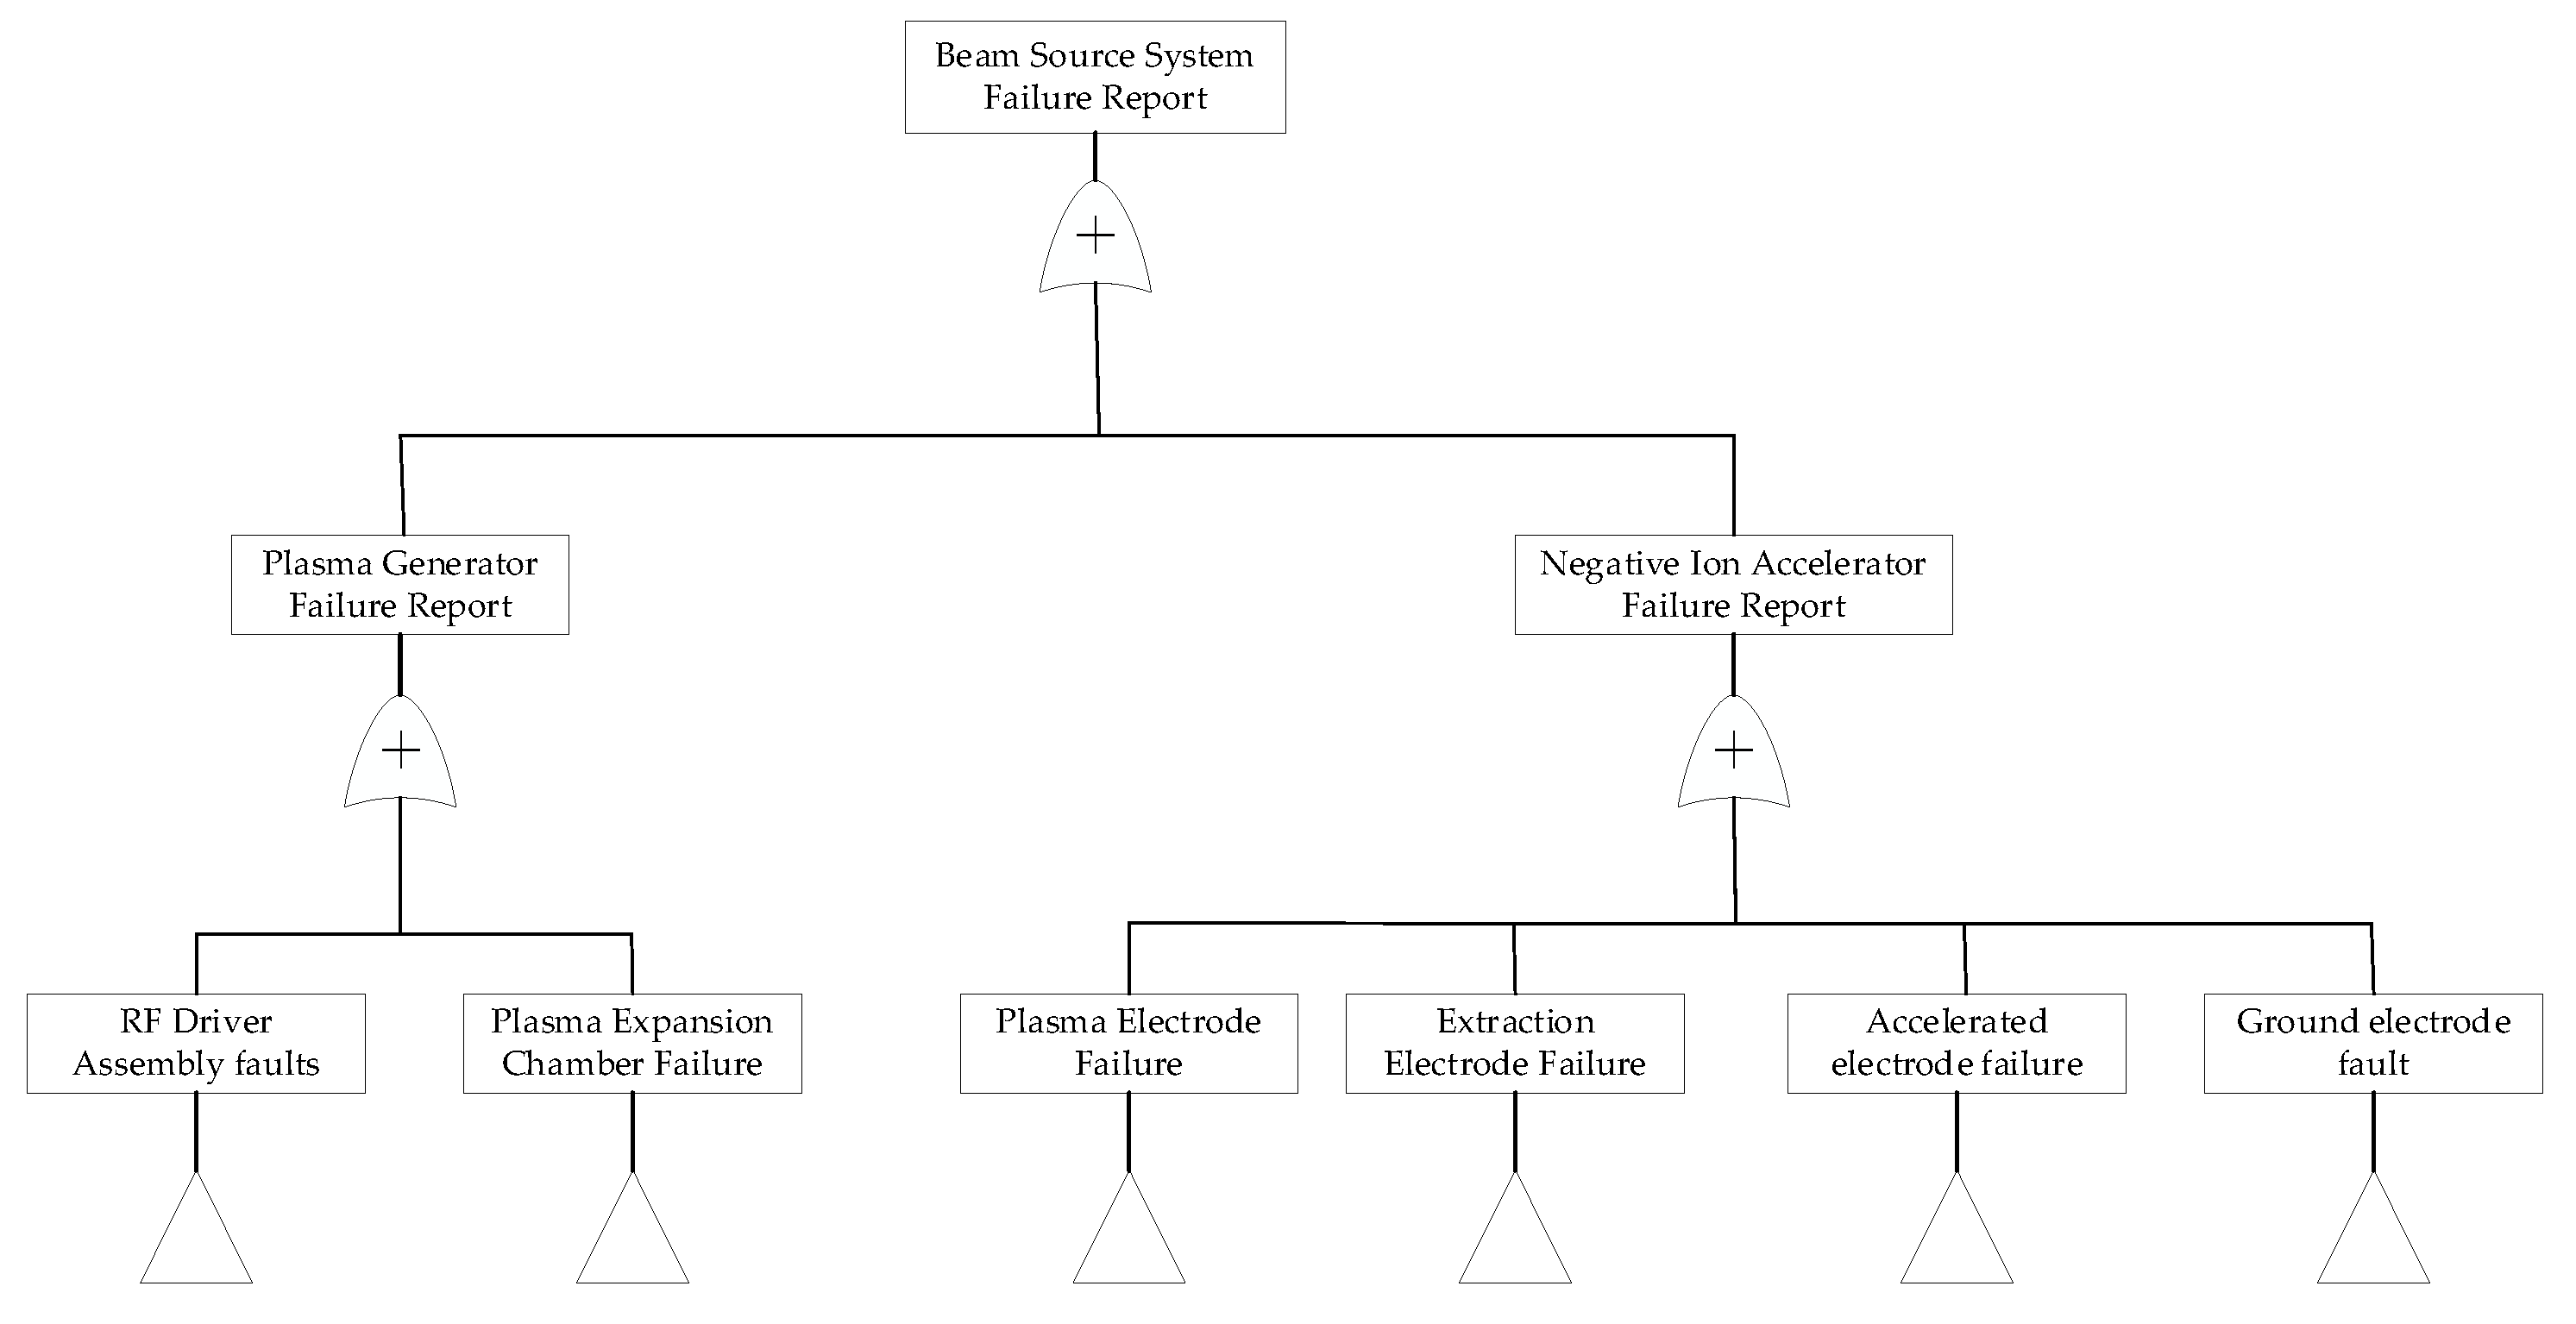
Based on the classification of system architecture and actual fault events, three primary fault domains can be identified: Negative Ion Accelerator malfunctions, Plasma Expansion Chamber failures, and RF Driver Assembly faults. Specifically, Negative Ion Accelerator failures encompass the Plasma Grid (PG) [
20], Extraction Grid (EG), Acceleration Grid (AG), and Ground Grid (GG) subsystem faults. RF Driver Assembly failures include gas injection system malfunctions, RF coil breakdowns, cooling pipeline leaks, filament cathode degradation, and excessive RF-induced impurity accumulation. Plasma Expansion Chamber failures involve cesium (Cs) injection system faults, magnetic filter malfunctions, and bias plate insulation defects.
Figure 4,
Figure 5,
Figure 6,
Figure 7,
Figure 8,
Figure 9 and
Figure 10 show the fault tree analysis (FTA) diagram for subsystem failures in the NNBI system [
21]. Among them, the following explanations are provided for the following fault tree analysis diagram.
Regarding the common cause basic event (a basic event that can simultaneously cause failures of multiple independent components or functions in a system)—the short-circuit event between PG and EG (the reason for this lies in the following: under conditions of high current density and high voltage, tiny protrusions may form on the surfaces of EG and PG, which in turn trigger point discharge and ultimately lead to the generation of short-circuit arcs), it will be clearly marked, respectively, in the sub-fault trees corresponding to EG electrode failure and PG electrode failure. However, in the subsequent reliability calculation process, the relevant data generated by this common cause event will be specified separately, so it will not have a substantial impact on the final data analysis results.
5. Fault Tree Analysis
5.1. Data Selection for Reliability Analysis
Since the initial plasma discharge achieved by NNBI (Neutral Beam Injection), over 40,000 discharge experiments have been conducted. The facility employs a periodic maintenance strategy, where systematic maintenance is performed after a certain period of operation. Among the datasets accumulated from multiple maintenance operations, the data records generated from the most recent maintenance work are the most complete and comprehensive. Meanwhile, benefiting from the continuous maturity and development of technology, the quality of this batch of data is also optimal. The results obtained from the analysis based on this data are more representative; therefore, this study has selected the data from the most recent maintenance work as the analysis object. The most recent maintenance cycle spanned from November 2024 to April 2025, with a continuous operation duration of 166 days. This study selects fault events occurring within this cycle for reliability analysis (fault tree bottom events without actual occurrences but with potential risks are retained but excluded from analysis).
During the experimental cycle, the system experienced 76 failures, specifically: 30 failures in the Negative Ion Accelerator, 27 in the Plasma Expansion Chamber, and 19 in the RF Exciter. Based on this, the following Formula (1) is applied [
19]:
where
λT = failure rate,
n = number of failures (unitless),
T = total operational time (hours). The failure rates of each component are calculated using Formula (1), representing the probability of system failure within a fixed time period. Below are the failure rates of each subsystem (due to system complexity, calculations are limited to Level 3 of the fault tree) [
22].
5.2. Failure Rate Analysis of Negative Ion Accelerators
Within the entire system, the Negative Ion Accelerator is the most complex component and exhibited the highest number of failures (30 incidents). The specific failure modes are as follows:
The plasma electrode experienced a total of 8 failures, including: 1 incident of surface flatness not up to standard, 1 occurrence of electrode endplate blockage Fault, 1 instance of impurity deposition on the Plasma Grid (PG), 3 coolant leaks in PG water lines, and 2 scheduled electrode polishing/cleaning operations. The overall failure rate of the plasma electrode is calculated as λT = 8/(166 × 24) ≈ 2.00 × 10⁻³.
The common cause basic event has occurred 2 failures, both of which are short circuits between the PG and EG circuit boards.
The extraction electrode experienced 12 failures, specifically 5 electrode cooling water system failures, 4 instances of excessive impurity deposition, 2 cases of support cover being insufficiently flat, and 1 EG replacing the power supply chip. The overall failure rate of the extraction electrode is: λT = 12/(166 × 24) ≈ 3.01 × 10⁻³.
The acceleration electrode experienced 4 failures: 1 water pipe leakage, 1 case of excessive impurity deposition, and 2 cases of thermal deposition grinding and cleaning. The overall failure rate of the acceleration electrode is calculated as λT = 4/(166 × 24) ≈ 1 × 10⁻³.
The ground electrode experienced 4 failures: 1 water pipe leaked, 1 instance of excessive impurity deposition, and 2 scheduled polishing/cleaning operations. The overall failure rate of the ground electrode is calculated as λT = 4/(166 × 24) ≈ 1 × 10⁻³.
The failure rates of each subcomponent within the Negative Ion Accelerator are listed in
Table 1.
5.3. Failure Rate Analysis of Plasma Expansion Chamber
During the entire test cycle, the plasma expansion chamber failed a total of 27 times, and the specific failures are as follows:
1. The Cs injection system has experienced a total of 17 failures, including 1 upper pipeline valve failure, 2 upper pipeline heating wire failures, 3 upper pipeline thermocouple failures, 2 lower pipeline heating wire failures, 1 lower pipeline valve failure, 3 lower pipeline thermocouple failures, 1 Cs Pressure regulation display screen malfunction, 2 Cs control cabinet failures, 1 Cs pipeline contamination incident, and 1 Cs nozzle failure. The total failure rate of the Cs injection system is λT = 17/(166 × 24) = 4.28 × 10⁻³.
2. The bias plate has experienced a total of 7 failures, including 5 power supply failures, 1 water cooling pipe (backplane water inlet pipe of the expansion chamber (ECBP2)) leakage incident, and 1 thermal deposition polishing/cleaning event. The overall failure rate of the bias plate is λT = 7/(166 × 24) = 1.76 × 10⁻³.
3. The magnetic filter in the filtering magnetic field has failed 3 times, resulting in a failure rate of λT = 3/(166 × 24) = 7.53 × 10⁻⁴.
The failure rates of each subsystem in the plasma expansion chamber are shown in
Table 2.
5.4. Failure Rate Analysis of RF Driver
During the entire test cycle, the RF Driver failed a total of 19 times, and the specific failures are as follows:
1. The gas injection system has experienced a total of 4 failures, including 1 hydrogen cylinder replacement, 1 gas inlet valve leak, 1 hydrogen flow meter leak, and 1 electronic valve leak, with an overall system failure rate of λT = 4/(166 × 24) = 1 × 10⁻³.
2. The water cooling system has experienced a total of 8 failures, including 4 instances of Water pipe FS (Faraday cup water inlet pipe) was punctured, 3 instances of Water pipe FSBP2 (Faraday cup backplane return water pipe) was punctured, and 1 instance of coil cooling pipe breakdown, with an overall failure rate of λT = 8/(166 × 24) = 2 × 10⁻³.
Additionally, independent base failure events were recorded: 4 filament cathode degradation incidents and 3 excessive impurity deposition incidents, with the radio frequency (RF) driver failure rates detailed in
Table 3.
5.5. Qualitative Analysis
The essence of qualitative fault tree analysis is to systematically identify all minimal cut sets that lead to the top event occurrence—namely, the most simplified combinations of fault events. These minimal cut sets expose the system’s potential failure mechanisms and critical design vulnerabilities, providing clear direction for reliability improvement. Analysis with AutoFTA 3.9 software reveals 54 minimal cut sets leading to NNBI beam source system failures, all being first-order cut sets, including 27 related to negative ion accelerator failures, 15 involving plasma expansion chamber failures, and 12 pertaining to RF driver failures [
23].
5.6. Quantitative Calculation
The quantitative calculation in fault tree analysis is a critical process for mathematically evaluating the probability of top event occurrence and system risk. Its essence lies in progressively computing the top event probability through the logical gate structure based on basic event probability data, which serves for reliability assessment of both systems and components [
24].
5.6.1. Probability of Top Event Occurrence
The probability of top event occurrence is one of the critical metrics for evaluating system reliability, directly reflecting the likelihood of system failure under specified operating conditions. In this study, the AutoFTA 3.9 software was employed to model and calculate the failure rates for each subsystem. Based on the collected data, statistical analysis shows that it follows a Poisson distribution (Formula (2)).
where ‘
is the probability that the event occurs exactly
k times within a specified interval, ‘
λ’ is the average number of occurrences of an event within a unit interval. ‘
e’ is the natural constant.
is the factorial of
k.
For the number of faults n that follows a Poisson distribution, the normal approximation method can be used for analysis, and its 95% confidence interval is [n − 1.96, n + 1.96] (1.96 is the critical value for the 95% confidence level of the normal distribution, and is the standard deviation of the Poisson distribution).
In summary, the 95% confidence intervals of each subsystem are as follows: the confidence interval for faults in the negative ion accelerator is [4.84 × 10−3,1.02 × 10−2]1/h, the confidence interval for faults in the plasma expansion chamber is [4.22 × 10−3,9.33 × 10−3]1/h, and the confidence interval for faults in the radio frequency system is [2.63 × 10−3,6.91 × 10−3]1/h. After calculation, the confidence interval for faults in the NNBI beam source system is [1.47 × 10−2,2.35 × 10−2]1/h.
The formula for deriving the mean time between failures (
MTBF) [
25,
26] from the failure rate is given as Formula (3) [
19,
26]:
where
, so:
.
In summary, the 95% confidence interval for the mean time between failures (
MTBF) of the beam source system is [42.6,68] h [
27].
5.6.2. Top Event Simulation Modeling
AutoFTA 3.9 enables dynamic simulation based on the occurrence probability of top events, serving as one of the essential standards for system analysis. Through extensive random sampling, it calculates the occurrence probability of top events and generates probability curves of system reliability. The software-calculated average failure rate for the entire system is λ
T = 1.91 × 10
−2 (1/h). This study conducted simulation modeling of these results, obtaining the variation in experimental failure rates after multiple simulations. The specific changes in the curve are shown in
Figure 11.
Analysis of the probability variation curve reveals that as the number of trials increases, the fluctuation amplitude of the top event occurrence probability gradually decreases and eventually converges to a stable value. This convergence characteristic aligns with the Law of Large Numbers in probability theory, thereby validating the statistical reliability of the simulation results [
19]. The findings fully demonstrate the scientific rigor of fault tree analysis methodology in reliability engineering and provide dependable data support for engineering decision-making.
5.6.3. Importance Analysis
Importance analysis provides a quantitative measurement of the influence degree of each basic event on the occurrence of the top event, serving as one of the core components in fault tree analysis methodology [
28,
29]. A higher importance value indicates that the component has a greater likelihood of causing the top event. However, there are multiple quantification methods for importance measures in fault tree analysis [
19]. Among them, the core characteristics of the F-V index are highly consistent with fault tree analysis (FTA). Specifically, this consistency is manifested as follows: the higher the frequency of a component appearing in the minimal cut sets and the greater the occurrence probability of the corresponding cut sets, the higher its F-V index. Meanwhile, this index is more targeted at “weak link identification”—it focuses more on “the ‘structural role’ of components in the system failure path” rather than simply relying on the failure probability of the components themselves. Based on the above characteristics, this study adopts the Fussell–Vesely component importance analysis method, expressed as Formula (4):
where
is the failure rate of the system,
is the probability of system failure associated with component
I. For the entire beam source system, the importance measures of each subsystem and component are as follows in
Table 4.
The bar chart generated from the aforementioned table is shown in
Figure 12, while
Figure 13 displays the F-V (Fussell–Vesely) importance measure bar chart for failures of the plasma grid (PG), extraction grid (EG), acceleration grid (AG), ground grid (GG), RF driver (RF), and expansion chamber (EC). (For the common cause basic event, its relevant data will be evenly allocated to the two fault groups: plasma electrode failure and extraction electrode failure.)
6. Conclusions
This study established a fault tree model for beam source system arcing events in NNBI and conducted both qualitative analysis and quantitative calculations using AutoFTA 3.9 software. The following conclusions can be drawn regarding this system:
1. Currently, the NNBI system’s overall performance parameters and design specifications are as follows: beam power of 2 MW, pulse duration ≥ 1000 s, and particle species (H
0 or H
− + H
0 + H
+) [
30]. Continuous beam source debugging is required to achieve these design goals. Currently, the fault-free operation time is only within the range of [42.6, 68] hours. To meet the operation requirements, the mean time between failures (MTBF) must be significantly improved [
26].
2. Analysis of the failure distribution in
Figure 12 reveals that the most frequent failure modes in the beam source system include the following: lower crucible pipeline valve malfunctions, insufficient surface flatness of the Plasma Grid (PG), clogging of PG apertures, and impurity accumulation on PG electrodes. Crucible valve failures are mostly caused by excessive valve temperature. Since this problem is induced by the necessary experimental environment, the impact on experimental stability can be minimized through high-frequency maintenance and stockpiling of replacement components. The frequent failures of plasma electrodes are mainly caused by the intrusion of impurities such as Cs in the expansion chamber due to the high temperature and high pressure of the experimental environment, and the installation of purification devices can be considered in the subsequent stage. Solving the above core problems can significantly improve the reliability of the entire system during the experiment.
3. As shown in
Figure 13, Plasma Grid (PG) failures and Plasma Expansion Chamber (EC) failures constitute the most prevalent failure modes in the beam source system. The main cause of failures lies in the high temperature and high pressure of the experimental environment. In response to this environmental characteristic, it is necessary to strengthen the inspection and renewal of experimental materials; optimizing these subsystems will significantly improve the overall stability of the beam source system.
4. The International Thermonuclear Experimental Reactor (ITER) has also conducted similar reliability analysis work.
In ITER’s reliability analysis, a more diverse set of technical approaches has been adopted: on the one hand, a comprehensive evaluation framework is built through the multi-dimensional integration of RAMI (Reliability, Availability, Maintainability, Inspectability) and PSA (Probabilistic Safety Assessment) [
6], while FTA is applied to the reliability analysis of multiple systems; on the other hand, the Cognitive Reliability and Error Analysis Method (CREAM) is introduced to conduct an in-depth exploration of potential risks from three dimensions: personnel operation, technical processes, and organizational management [
7]. Based on these methods, ITER has completed a number of practical engineering applications—for instance, it has formulated and implemented maintenance optimization schemes for rectifier cabinets and bypass thyristors [
8], which has effectively improved equipment performance; meanwhile, it has completed the risk assessment of the vacuum vessel pressure suppression system, providing a scientific basis for the safe operation of the system [
6].
From the above comparison, it can be seen that in the follow-up work of the NNBI system, it is necessary to draw on ITER’s idea of integrating multiple methods, integrate FTA with other reliability analysis technologies, and refer to the indicator systems and data accumulation models of relevant studies to establish an exclusive reliability and safety analysis database, ultimately achieving continuous improvement in equipment stability.
In conclusion, this study conducted a reliability analysis of NNBI beam source system failure data and proposed targeted improvement solutions. The systematic development of an indigenous component failure rate database holds significant strategic importance for enhancing the reliability and safety assessment capabilities of fusion experimental devices and future fusion reactors. This database will provide localized data support for failure mode analysis of critical components, quantitative reliability evaluation, and safety margin design in fusion devices, ultimately exerting profound impacts on advancing the commercialization of fusion energy.
Author Contributions
Methodology, Q.C.; Validation, Q.C.; Data curation, Q.C.; Supervision, L.L.; Project administration, Q.C. All authors have read and agreed to the published version of the manuscript.
Funding
This work was supported by the Comprehensive Research Facility for Fusion Technology Program of China under Contract No. 2018-000052-73-01-001228. The Natural Science Foundation of Anhui Province (Contract No. 2208085MA19). This work was financially supported by the Institute of Energy, Hefei Comprehensive National Science Center (Grant No. 21KZS202).
Institutional Review Board Statement
Not applicable.
Informed Consent Statement
Not applicable.
Data Availability Statement
The original contributions presented in the study are included in the article, further inquiries can be directed to the corresponding author.
Conflicts of Interest
The authors declare no conflict of interest.
References
- Wei, J.-L.; Liang, L.-Z.; Jiang, C.-C.; Xie, Y.-H.; Hu, C.-D.; Li, J.; Gu, Y.-M.; Chen, Y.-Q.; Li, J.-Y.; Wu, M.-S. Beam optics study of a negative ion source for neutral beam injection application at ASIPP. Fusion Eng. Des. 2017, 117, 93–99. [Google Scholar] [CrossRef]
- Speth, E.; Ciric, M.; Feist, J.; Frank, P.; Heinemann, B.; Kraus, W.; Probst, F.; Riedl, R.; Trainham, R.; Vollmer, O. Rf ion sources for fusion applications: Design, development and performance. Fusion Eng. Des. 1999, 46, 383–388. [Google Scholar] [CrossRef]
- Li, Y.; Ding, J.; Song, S.; Jiang, C.; Duan, L.; Liu, S.; Pan, J.; Chen, S. Design of The Power Supply and Distribution Monitoring System for NNBI. In Proceedings of the Journal of Physics: Conference Series; IOP Publishing: Hefei, China, 2023; p. 012054. [Google Scholar]
- Okumura, Y.; Fujiwara, Y.; Kashiwagi, M.; Kitagawa, T.; Miyamoto, K.; Morishita, T.; Hanada, M.; Takayanagi, T.; Taniguchi, M.; Watanabe, K. Negative hydrogen ion source for Tokamak neutral beam injector. Rev. Sci. Instrum. 2000, 71, 1219–1224. [Google Scholar] [CrossRef]
- Fantz, U.; Briefi, S.; Heiler, A.; Wimmer, C.; Wünderlich, D. Negative hydrogen ion sources for fusion: From plasma generation to beam properties. Front. Phys. 2021, 9, 709651. [Google Scholar] [CrossRef]
- Sun, M.; Yu, J.; Li, T.; Ge, D. An integrated safety assessment method based on PSA and RAMI for fusion reactors. Nucl. Mater. Energy 2023, 34, 101391. [Google Scholar] [CrossRef]
- Vladykina, S.; Thurner, T.W. Cognitive reliability error analysis method (CREAM) at the international thermonuclear experimental reactor (ITER). Qual. Reliab. Eng. Int. 2019, 35, 1621–1633. [Google Scholar] [CrossRef]
- Liu, D.; Du, S.W.; Jiang, L. Analysis of ITER poloidal field converter reliability. Nucl. Fusion Plasma Phys. 2013, 33, 348–353, (Chinese with English abstract). [Google Scholar]
- Xie, M.; Liu, D.; Wang, H.; Liu, L. Study on the Correlation between Magnetic Field Structure and Cold Electron Transport in Negative Hydrogen Ion Sources. Appl. Sci. 2022, 12, 4104. [Google Scholar] [CrossRef]
- Takeiri, Y. Negative ion source development for fusion application. Rev. Sci. Instrum. 2010, 81, 02B114. [Google Scholar] [CrossRef]
- Gu, Y.; Wei, J.; Chen, J.; Xu, Y.; Li, J.; Liang, L.; Jiang, C.; Xie, Y.; Hu, C.; Xie, Y. The engineering design of half-size RF negative ion source for CRAFT-NNBI. Fusion Eng. Des. 2023, 192, 113603. [Google Scholar] [CrossRef]
- Xie, Y.; Wei, J.; Gu, Y.; Xu, Y.; Liang, L.; Cui, Q.; Pan, J.; Yang, Y.; Xie, J.; Zhao, Y. The negative beam source with single driver for CRAFT NNBI: Design and conditioning results. J. Instrum. 2023, 18, C07017. [Google Scholar] [CrossRef]
- Li, Y. Research on Operation Parameter Analys Is and Performance Prediction for RF-Driven Negative Ion Source. 2024. (Chinese with English abstract). Available online: https://kns.cnki.net/kcms2/article/abstract?v=5q1osi_AJOS6il_H2b2gQX5E4h8-mCKUIaBXe6W5eyOKLHpkBSnt1M0Z99dNoLaXvUHp-qSKVM76Opvt7aytwOFVsrWjnZiSXk_xi2RNCK0fxZTmc_3-zgwOpCHPWydNLg-gvHs-PzEmYJSxsuNvIPqLt1rchV4oQjVoTSdHyZR2iIrglxn6zA==&uniplatform=NZKPT (accessed on 18 June 2025).
- Li, Y.; Hu, C.; Zhao, Y.; Song, S.; Xie, Y.; Gu, Y.; Wang, Z.; Ban, T.; Cui, Q. Auto-Recording System for Long-Pulse Negative Ion–Based Neutral Beam Injection Experimental Data. Fusion Sci. Technol. 2024, 80, 772–780. [Google Scholar] [CrossRef]
- Fröschle, M.; Leyer, S.; Franzen, P.; Martens, C.; Speth, E.; Heinemann, B.; Falter, H.; Fantz, U.; Kraus, W.; Riedl, R. Technical overview and first results of the half-size ITER NNBI source. Fusion Eng. Des. 2007, 82, 887–896. [Google Scholar] [CrossRef]
- Hanada, M.; Seki, T.; Takado, N.; Inoue, T.; Mizuno, T.; Hatayama, A.; Kashiwagi, M.; Sakamoto, K.; Taniguchi, M.; Watanabe, K. The origin of beam non-uniformity in a large Cs-seeded negative ion source. Nucl. Fusion 2006, 46, S318. [Google Scholar] [CrossRef]
- Wei, J.L.; Xie, Y.H.; Xie, Y.L.; Jiang, C.C.; Zhao, Y.Z.; Xu, Y.J.; Gu, Y.M.; Yi, W.; Liu, W.; Bu, L.Y.; et al. Comprehensive research facility for negative ion source neutral beam injection at CRAFT:design and first operation. Plasma Sci. Technol. 2025, 27, 6–16. [Google Scholar] [CrossRef]
- Markulik, S.; Šolc, M.; Petrík, J.; Balážiková, M.; Blaško, P.; Kliment, J.; Bezák, M. Application of FTA Analysis for Calculation of the Probability of the Failure of the Pressure Leaching Process. Appl. Sci. 2021, 11, 6731. [Google Scholar] [CrossRef]
- Huan, C.X.; Qin, H.L.; Zhou, L.Y.; Yu, W.U.; Le, L.; Can, W.Y. Fault tree analysis of EAST cryogenic system. Chin. J. Nucl. Sci. Eng. 2009, 29, 170–175, (Chinese with English abstract). [Google Scholar]
- Hanada, M.; Seki, T.; Takado, N.; Inoue, T.; Morishita, T.; Mizuno, T.; Hatayama, A.; Imai, T.; Kashiwagi, M.; Sakamoto, K. Experimental study on spatial uniformity of H− ion beam in a large negative ion source. Fusion Eng. Des. 2005, 74, 311–317. [Google Scholar] [CrossRef]
- Pang, M.; Zhang, Z.; Zhou, Z.; Li, Q. Risk Diagnosis Analysis of Ethane Storage Tank Leakage Based on Fault Tree and Fuzzy Bayesian Network. Appl. Sci. 2025, 15, 1754. [Google Scholar] [CrossRef]
- Finkelstein, M. Failure Rate Modelling for Reliability and Risk; Springer Science & Business Media: Berlin/Heidelberg, Germany, 2008. [Google Scholar]
- Lee, W.-S.; Grosh, D.L.; Tillman, F.A.; Lie, C.H. Fault tree analysis, methods, and applications ߝ a review. IEEE Trans. Reliab. 2009, 34, 194–203. [Google Scholar]
- Barlow, R.E.; Chatterjee, P. Introduction to fault tree analysis. In Reliability and Fault Tree Analysis; California University Berkeley Operations Research Center: Berkeley, CA, USA, 1975. [Google Scholar]
- Duer, S.; Woźniak, M.; Paś, J.; Zajkowski, K.; Bernatowicz, D.; Ostrowski, A.; Budniak, Z. Reliability testing of wind farm devices based on the mean time between failures (MTBF). Energies 2023, 16, 1659. [Google Scholar] [CrossRef]
- Anggraeni, N.D. Reliability Analysis to Determine Mean Time between Failures (MTBF) on Machinery. In Proceedings of the 1st Faculty of Industrial Technology International Congress, Bandung, Indonesia, 9–11 October 2017; pp. 253–257. [Google Scholar]
- Mondro, M.J. Approximation of mean time between failure when a system has periodic maintenance. IEEE Trans. Reliab. 2002, 51, 166–167. [Google Scholar] [CrossRef]
- Xiao, X.; Chen, P. A Hybrid Real-Time Framework for Efficient Fussell-Vesely Importance Evaluation Using Virtual Fault Trees and Graph Neural Networks. arXiv 2024, arXiv:2412.10484. [Google Scholar]
- Van der Borst, M.; Schoonakker, H. An overview of PSA importance measures. Reliab. Eng. Syst. Saf. 2001, 72, 241–245. [Google Scholar] [CrossRef]
- Wang, R.; Jiang, C.; Xu, Y.; Xie, Y.; Xie, Y.; Hu, C. Electrostatic analysis and preliminary design of transmission line for the CRAFT NNBI test platform. Fusion Eng. Des. 2021, 165, 112259. [Google Scholar] [CrossRef]
| Disclaimer/Publisher’s Note: The statements, opinions and data contained in all publications are solely those of the individual author(s) and contributor(s) and not of MDPI and/or the editor(s). MDPI and/or the editor(s) disclaim responsibility for any injury to people or property resulting from any ideas, methods, instructions or products referred to in the content. |
© 2025 by the authors. Licensee MDPI, Basel, Switzerland. This article is an open access article distributed under the terms and conditions of the Creative Commons Attribution (CC BY) license (https://creativecommons.org/licenses/by/4.0/).


