Article

Advancing Online Road Safety Education: A Gamified Approach for Secondary School Students in Belgium

The Transportation Research Institute (IMOB), Uhasselt, Martelarenlaan 42, 3500 Hasselt, Belgium
*
Author to whom correspondence should be addressed.
Appl. Sci. 2025, 15(15), 8557; https://doi.org/10.3390/app15158557
Submission received: 30 June 2025 / Revised: 29 July 2025 / Accepted: 30 July 2025 / Published: 1 August 2025
(This article belongs to the Special Issue Technology Enhanced and Mobile Learning: Innovations and Applications)

Abstract

Road traffic accidents are a leading cause of injury and death among adolescents, making road safety education crucial. This study assesses the performance of and users’ opinions on the Route 2 School (R2S) traffic safety education program, designed for secondary school students (13–17 years) in Belgium. The program incorporates gamified e-learning modules containing, among others, podcasts, interactive 360° visuals, and virtual reality (VR), to enhance traffic knowledge, situation awareness, risk detection, and risk management. This study was conducted across several cities and municipalities within Belgium. More than 600 students from school years 3 to 6 completed the platform and of these more than 200 students filled in a comprehensive questionnaire providing detailed feedback on platform usability, preferences, and behavioral risk assessments. The results revealed shortcomings in traffic knowledge and skills, particularly among older students. Gender-based analysis indicated no significant performance differences overall, though females performed better in risk management and males in risk detection. Furthermore, students from cities outperformed those from municipalities. Feedback on the R2S platform indicated high usability and engagement, with VR-based simulations receiving the most positive reception. In addition, it was highlighted that secondary school students are high-risk groups for distraction and red-light violations as cyclists and pedestrians. This study demonstrates the importance of gamified, technology-enhanced road safety education while underscoring the need for module-specific improvements and regional customization. The findings support the broader application of e-learning methodologies for sustainable, behavior-oriented traffic safety education targeting adolescents.

1. Introduction

Road traffic accidents are the leading causes of unintended injury and death among young people aged between 15 and 29 [1]. Around 220,000 children and adolescents aged 0–19 die annually in road traffic accidents [2]. In Western nations, road traffic accidents are responsible for 35–40% of the injury-related mortality of adolescents and young adults [3,4]. They are considered the ninth most common cause across all age groups globally and are expected to become the seventh leading cause by 2030 [1]. Thus, road safety is one of the most serious worldwide public health issues to date [5].
In the case of Belgium, the number of fatalities has decreased by 24% over the last ten years, which resembles the EU trend [6]. In 2019, 646 people were killed in reported traffic accidents in Belgium, and the frequency of fatalities has decreased for all transport modes except for cycling, which increased by 13% over the last ten years [6]. Cycling is a major mode of transport in Belgium, and cyclists are considered vulnerable road users [7,8,9], and children mainly use bicycles as a mode of transport to go to school. From 2010 to 2012, the home–school commute for children was recognized as an area where nearly 3/4 of injuries or deaths involving children occurred in Belgium [10]. It is mainly because children and adolescents aged 5–18 years are enrolled in school and are more exposed to the traffic environment while commuting to school. Moreover, about 1/3 of the number of victims are currently vulnerable road users, of which the majority (about 25%) are cyclists [10].
In Belgium, primary education covers children from approximately 6 to 12 years old (school year 1–6), followed by secondary education from around 12 to 18 years old (school year 1–6) [11,12]. The present study focuses on students in school years 3 to 6 of secondary education, typically aged 13–17 years, who are in the later stages of secondary school. Understanding this educational structure is important, as road safety knowledge and behaviors may differ depending on prior educational exposure, mobility habits, and developmental stage.
Because of the high accident rates among children, many parents take their children to school by car instead of letting them go by bike or on foot [13]. Although cycling holds cultural significance in Belgium, actual commuting choices are increasingly shaped by safety concerns and practical considerations. Studies have shown that walking and car travel are becoming more prevalent among school-aged children, particularly in urban settings where traffic density and parental safety concerns influence transport decisions [14,15]. Also, this has adverse consequences for the development of their children as self-employed road users, limits their knowledge of the environment, and damages their growing independence [16,17,18]. Research shows that experience and active exposure to traffic are essential links in developing general skills and specific skills needed in traffic [19]. Given this important share, a great deal of progress can therefore be made here to improve road safety among children. Recent advances in reliability and risk-informed methodologies have highlighted the value of integrating data-driven and simulation-based approaches to improve safety-related decision-making [20]. Building on these trends, this study evaluates the Route2School (R2S) platform, which leverages gamified content, virtual reality (VR) modules, and scenario-based training to enhance students’ road safety knowledge and decision-making skills.

1.1. Traffic Safety Education

As outlined by Vermont’s Safe Routes to School framework [21], road safety education is one of the five core components, commonly known as the ‘5 E’s, that collectively contribute to improving traffic safety. Education, in particular, plays a foundational role in reducing road traffic accidents by increasing awareness, building skills, and shaping attitudes. According to Rose et al. [22], effective road safety education rests on three pillars: raising awareness of traffic regulations, improving practical skills, and promoting a positive attitude toward safety. These interconnected elements highlight education’s unique position within traffic safety strategy [23].
Education has been identified as a critical approach for reducing traffic accidents [24,25,26]. Studies conducted on crash investigation showed that human variables contribute more towards road accidents and dominate environmental and vehicle factors [27,28]. The type of vehicle, the road environment, and human mistakes all impact the severity and frequency of traffic accidents. Almost 95.4% of traffic accidents are caused by human mistakes, overshadowing environmental and vehicle causes [29]. Many interacting factors contribute to human mistakes, including practical inexperience with driving itself [30,31], but also norm-breaking behaviors such as speeding, distracted driving, and sensation-seeking [32,33]. In addition to their lack of experience and norm-breaking actions, their awareness of traffic conditions and perception of road safety cause them to engage in a variety of risky driving behavior [33]. Therefore, the emphasis should be on the human aspects and developing techniques to limit human error.
Past research revealed that school-based traffic safety education initiatives successfully raise participants’ awareness and encourage safer conduct worldwide [29]. Initiatives aimed at vulnerable road users, such as programs focused on cyclist safety [34,35], have proven effective in imparting knowledge to individuals using the road, whether it is about cycling safely or enhancing adherence to helmet usage for motorcyclists [36]. Also, the traffic safety education programs at the school level help students or novice drivers expand their knowledge and skills while in different traffic situations. Road safety education initiatives targeting learner drivers, using seminars and workshops that emphasize reducing risk-taking behaviors, have significantly decreased participants’ relative crash risk by 44% [37].
The capability of e-learning to effectively train and educate individuals has gained considerable recognition across various disciplines. However, its application in the realm of traffic safety remains relatively unexplored. While e-learning platforms and digital educational tools have predominantly found utility in traditional academic settings, they have also demonstrated their value in assisting non-traditional learners, such as out-of-school children [38], and promoting positive behaviors like fostering healthy eating habits [39].
The purpose of traffic education is to develop safe movement and orientation in traffic, to transfer survival tactics in the short term, and to promote safe and responsible behaviour in the long term [40]. Traffic education must be age-appropriate as road safety is the primary concern between 10–12-year-old children and their parents [41]. Consequently, it is essential to craft traffic education while considering the child’s developmental phase. This approach aids in the comprehension of traffic regulations among young individuals and cultivates a positive stance towards road safety. Research has shown that initiating such education at an early age reaps significant benefits [42]
Many people perceived conventional learning methods in school as ineffective and boring, decreasing the students’ motivation and engagement [43]. With technological advancement, traditional training methods have been replaced by gamified methods, increasing the students’ engagement and helping them see real-life experiences via VR. Computer-based training has been utilized successfully in road safety interventions for driver education and training [44,45,46]. However, this study caters to students who have obtained provisional licenses and will be driving soon.

1.2. Route 2 School (R2S) Education: An Online Road Safety Education Program

R2S, a gamified e-learning road safety education platform, was developed in 2017–2018 by the Transportation Research Institute (IMOB) in Belgium for pupils of primary schools with a focus on safe cycling. Moreover, it is an online training of traffic knowledge and skills that uses footage (i.e., pictures and videos) from Belgium and gamification elements for students.
R2S Education aims to improve traffic knowledge and skills among pupils. Initially, it was implemented in Belgium [40] among 2nd- and 3rd-grade primary education students via an online platform. Later, it was implemented in Indonesia [47], Vietnam [48], Palestine [49], and Pakistan [50]. The major concerns of all these studies were to increase awareness among school students about traffic safety and to deal with different situations while on the road. Lessons learned from prior R2S implementations in Indonesia, Vietnam, Palestine, and Pakistan highlighted the importance of cultural and contextual adaptation. For example, in Indonesia and Pakistan, modules emphasized motorcycle safety due to the prevalence of two-wheeled transport, while in Vietnam, local traffic patterns and helmet use were prioritized. These international experiences informed the Belgian version by ensuring local relevance, focusing on cycling and novice driving, and leveraging Belgium’s strong digital infrastructure for VR integration and 360° imagery. Such adaptations were essential to maintain user engagement and educational effectiveness across diverse contexts.
The motivational aspect of teaching is usually addressed in gamified learning using a challenge-based approach, where students are challenged to do better [51]. Still, the self-paced and different tasks in the module layout offer the learners a certain level of challenge, a key motivation factor among students. This aligns with mastery-based learning, where students are driven to achieve personal improvement and complete tasks without external pressure [52].
The R2S platform utilizes modules that increase in difficulty as students advance. This structured progression, where each level presents new challenges, reflects the concept of incremental learning, gradually promoting traffic knowledge and skills development [53]. This type of progression is central to increasing student engagement, as it mirrors video game mechanics that motivate learners by offering increasingly complex tasks [54].
The R2S education platform offered a question comprising multiple game rounds that increase difficulty so that a structured learning process can be offered. This allowed students to carry out the game rounds at home (e.g., spread over several weeks) with a limited time investment (per week). Throughout the game rounds, the difficulty level increases and students develop better insights into traffic situations in which knowledge and skills such as situational awareness, risk detection and management are central.
Gamification employed in the R2S platform supplements the comprehension of the material and improves knowledge recall and practical application of such skills. Since secondary school students are more used to the digital environment, the game elements ensure that the program is in harmony with students’ learning, hence the encouragement that makes the content relevant and appealing [55].
Students can get immediate feedback after finishing each task or answering the question. It involves an explanation of the right answers and points for improvement. Score points and progression through levels are examples of reward systems, which are the key components of gamification and positively influence learners’ engagement and knowledge retention [56]. Research indicates constructive feedback is critical in helping learners stay motivated by correcting errors on time [57].
Students learned the traffic rules (knowledge) [58,59], to pay more attention to all elements in traffic (situational awareness) [60], to detect risks (risk detection) [61] and to deal with these risks (risk management) [62]. However, R2S Education was recently developed for secondary school students, focusing on safe driving.

1.3. Aim of the Study

This study’s main aim was to assess the new gamified e-learning traffic safety education platform for secondary school students in different municipalities and cities in Belgium. The following research questions were formulated:
  • How do students overall perform on the gamified e-learning platform? How do student scores vary across school years, gender, and region (city/municipality)?
  • Which module presents the most significant challenge for students regarding performance and comprehension?
  • What are the students’ opinions about the R2S platform?
  • How often do pupils perform risky traffic behavior and assess their knowledge and skills?

2. Materials and Methods

2.1. R2S Education for Secondary School Students

R2S Education for secondary schools students is comparable with the version for primary school students (e.g., gamified e-learning tool with a focus on feedback), with some differences: (1) the target group is older: students from schoolyear 3rd to 6th of secondary schools (13–17 years old), (2) the focus is not only on cycling but also on driving, as in Belgium, a driver’s license can be obtained at 18 years old and provisional at 17 years old. Also, some participants have already received their provisional or definitive licenses or are novice drivers. (3) In addition to traffic knowledge and skills (i.e., situation awareness, risk detection and risk management), the platform now also focuses on (virtual) traffic behavior. Since traffic education must fit into the world of young people, Virtual reality was used in the platform to simulate (cycling and driving) traffic behavior of participants as VR enables the students to gain experience that is impossible to acquire in real life [63]. Therefore, it is a significant advancement in an online educational environment. Participants experience realistic traffic scenarios in this virtual world, including intersections with right-turn priority. They received feedback on their virtual behavior and had to re-ride until they completed the journey without any mistakes.
Last but not least (4), along with the photos and videos from the cyclist’s point of view, the platform also incorporated camera images along the road and drone images at heights where certain traffic situations are visible. They also incorporated 360° images where the participants could turn 360° and look in any direction to understand the traffic situation. Lastly, the podcast was also added to the platform, which included the interview of a traffic safety expert, and later, certain questions were asked of the participants. Overall, the secondary school platform consists of six modules. Since it is an online platform, the participants have the liberty to fill it out either at school or at home to minimize their school workload. This study was performed in the upper region of Belgium (i.e., Flanders). Around 14 schools showed interest in the R2S education program.

2.1.1. Development of R2S Platform for Secondary Education

The main concept of developing an online platform for secondary school students was the same as the platform for elementary school. It mainly has four modules for primary school students: traffic knowledge, situation awareness, risk detection, and risk management. However, new teaching methods and materials were inserted, i.e., a podcast, 360° footage, and VR technology to improve students’ knowledge, skills, and behavior on the road.
Traffic Knowledge Module
This module was developed to test users’ knowledge about traffic safety. It consists of two submodules. The first module tests students’ knowledge regarding traffic rules, i.e., traffic signs, symbols etc. The main aim is to test the participants’ traffic knowledge based on ten questions. Also, feedback is provided immediately after participants answer the question, where additional explanation is given about the correct answer.
Similarly, the second submodule consists of two parts. Firstly, the participants were presented with a podcast on hand-free calling, in which a traffic safety expert is being interviewed. After the podcast was finished, ten questions were asked about the podcast. Therefore, the participants must listen to the podcast carefully to answer those questions.
Situation Awareness Module
This module was a new addition to the online platform as it was made based on 360° images. It consists of a module with ten questions about different traffic scenarios. Thanks to 360° images, the participants had the liberty to rotate the image left and right to view the entire environment. The feedback after each question was also displayed with an additional explanation of the answer. The feedback improved the participants’ understanding of different traffic situations.
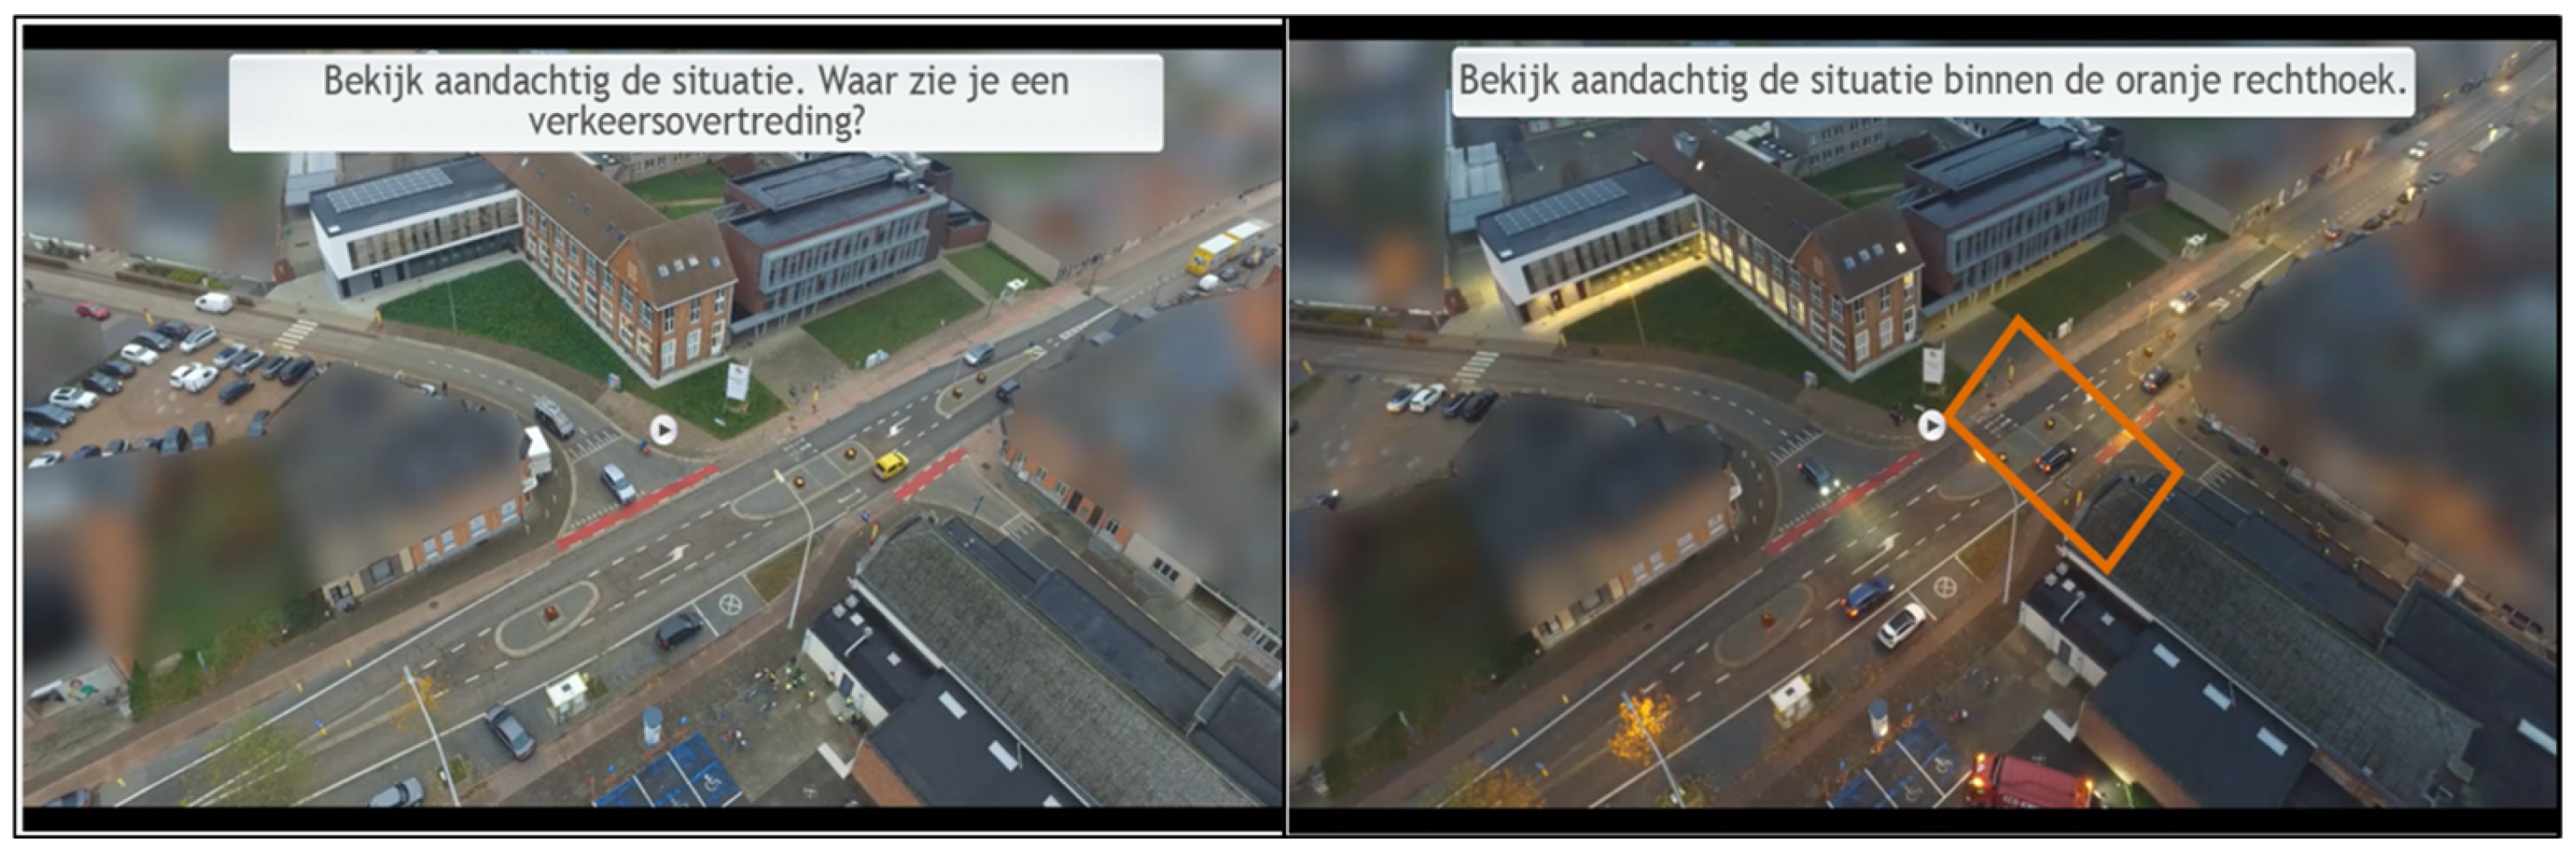
Risk Detection Module
This module was developed to check the skills of risk detection among the participants. It also consists of three sub-modules. The first submodule, entitled “Find the danger”, aims to test the risk detection of participants. The participants were shown ten images to ask where they should pay attention first. After each question, the feedback was provided with a detailed explanation of the risk in the given image. Similarly, the second submodule, entitled “Traffic in Everyday Life,” aimed to search for traffic violations in different video clips. Feedback was also provided after each question to make the participants understand the traffic violations.
Moreover, the third sub-module was a new addition to the platform as the drone was added. This module’s main aim was to assess participants’ ability to detect risk behaviors or irregularities of other road users. It has two types of questions. Firstly, the video clip was shown to the participants, and they had to identify where the traffic violation took place. The drone was placed at a certain height where the participants could overview the entire traffic situation. A specific box was added in the video for the second type of question. The participants intended to look at the situation within the box and answer the question after the finished video. As mentioned above, feedback was provided after every question to provide a better understanding of the situation. Figure 1 illustrates examples of the risk detection questions, showing both the general traffic scene and the version with a highlighted focus box. These visual aids supported participants in identifying traffic violations or risks with greater precision.
Risk Management Module
This module was similar to risk management, where different traffic safety scenarios were shown in the images, and participants had to answer them correctly. This module is intended for the participants to indicate the best possible behavior to exhibit. The ten multiple-choice questions were asked with an image to visualize the situation. After each question, detailed feedback was provided so the participants knew about different traffic risk situations and acted accordingly.
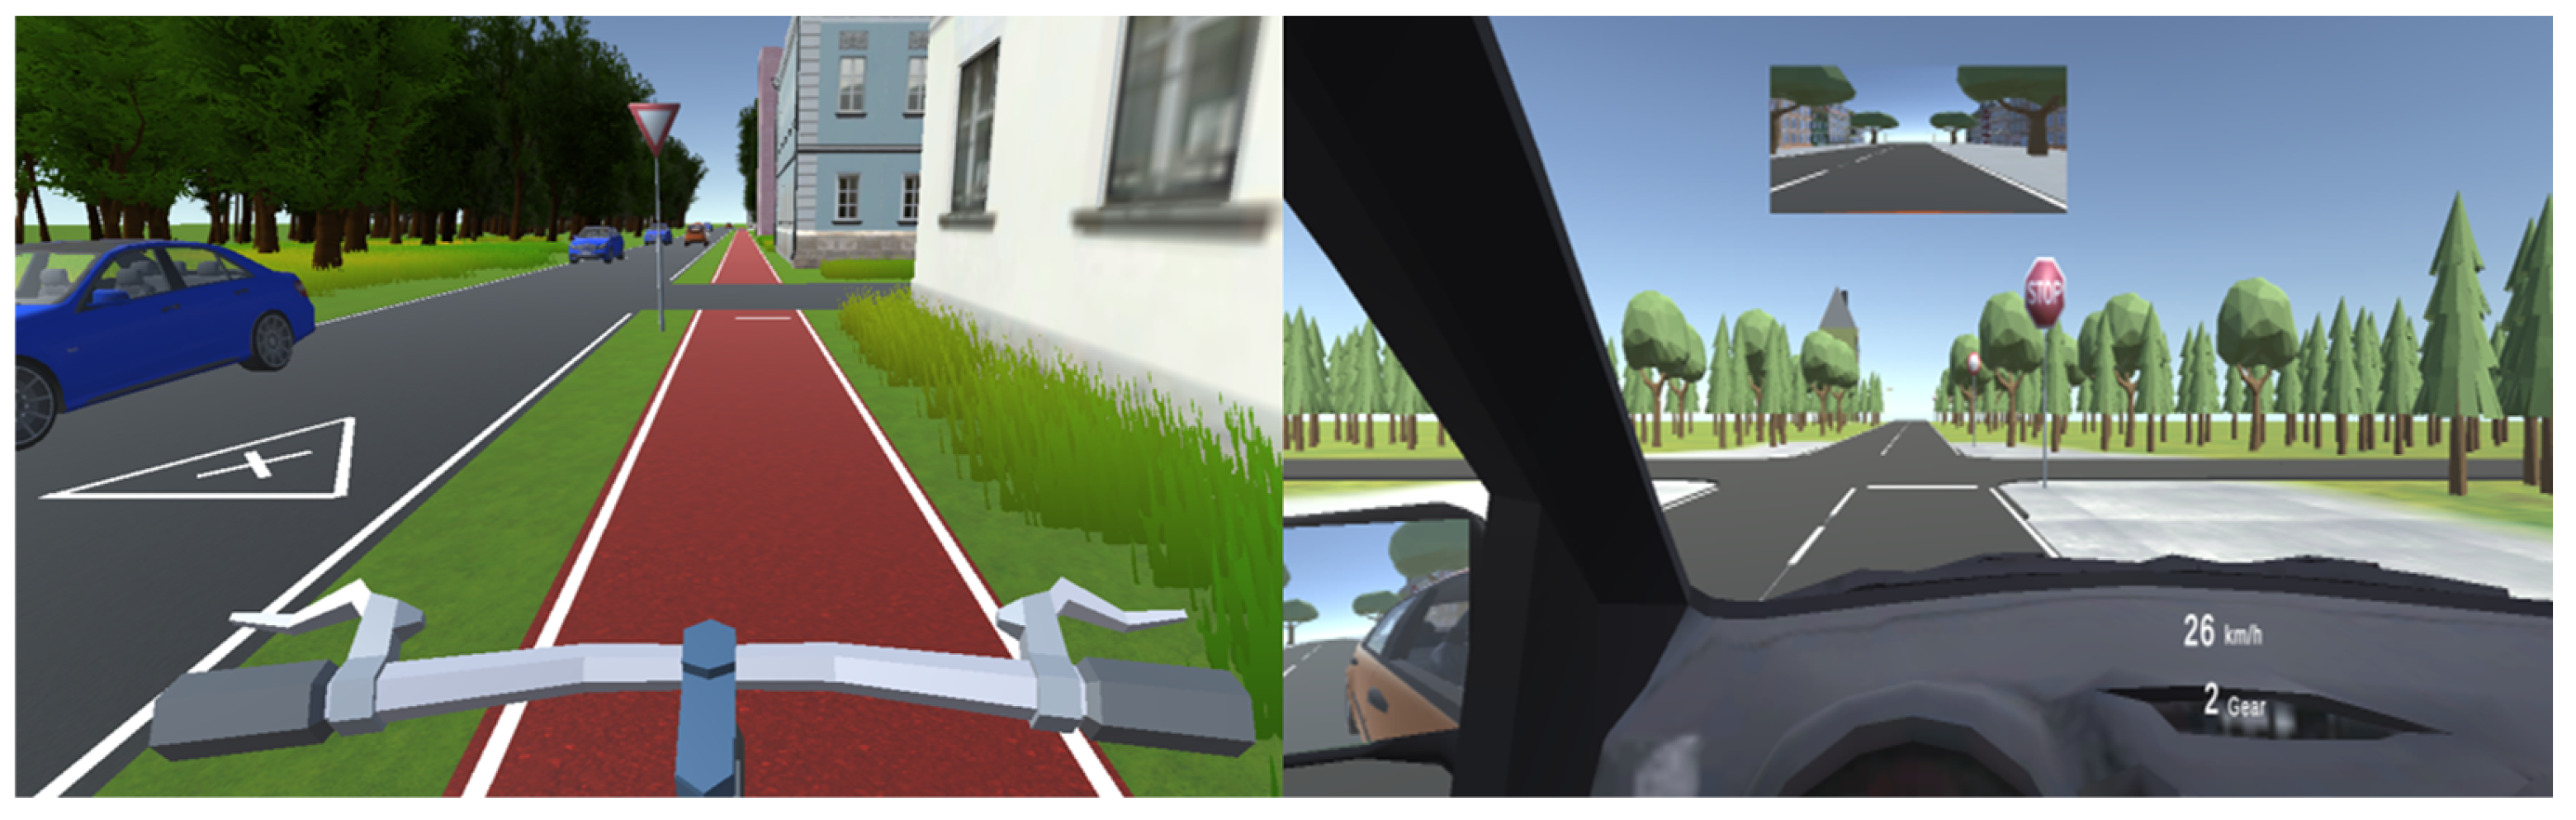
Virtual Behavior Module
This module was innovative compared to other traffic education initiatives because the VR technology was used. No joystick or VR glasses were used to make it friendlier and more economical. The participants can navigate and look right and left using the arrows on the keyboard. The module examined how participants behaved in a virtual world if they encountered different traffic situations (i.e., an intersection with priority from the right, an intersection with a stop sign, a pedestrian who wants to cross at a zebra crossing, a pedestrian who wants to cross without using a zebra crossing). In addition to this, the module also measured whether participants showed the right viewing behavior (i.e., looked at least 1x left and right when crossing the street) and whether they followed the speed limit when driving. Participants had to go through the process again until they got it perfectly. Figure 2 displays the virtual interface used in the ‘Take a Bike Ride’ and ‘Take a Car Ride’ modules. These images show the navigation layout and user interaction elements, allowing participants to engage with realistic traffic scenarios without specialized hardware.

2.1.2. Gamification Elements Used in the Platform

Interactive Simulations and VR
The platform uses distinct VR elements where students drive or cycle through a simulated road environment. This approach provides an excellent opportunity for students to engage in simulated traffic decisions, which can be regarded as applying theoretical knowledge in practical activities [64]. The effects of using VR education aid are that it enhances spatial intelligence and problem-solving, making it an essential component in educational road safety [65].
Engaging Visual and Audio Elements
Incorporating 360° visuals, drone footage, and podcasts in the platform supports the gamification strategy by providing diverse sensory inputs that enhance learner engagement. Studies show that students prefer viewing videos and listening to podcasts, which helps them better understand concepts because knowledge is delivered in different formats [66].

2.2. Questionnaire

This study also utilized a comprehensive structured-based questionnaire to gather data on participants. This questionnaire explored demographic details, transportation habits, self-reported traffic knowledge and skills, and behavioral tendencies, such as distraction and red-light violations. Moreover, participants gave feedback on the platform. Likert scale and frequency-type questions were used. Participants could fill this in voluntarily.
It began with consent-based participation, which is necessary for proceeding, and demographic questions such as gender, age, and education level. Participants were then asked about their experiences with online traffic education and preferences regarding the specific R2S educational modules like quizzes, podcasts, and interactive features such as 360° images and virtual rides.
The questionnaire extensively employed Likert scale questions to measure participants’ levels of agreement or satisfaction with various aspects of the online traffic education platform, such as its clarity, informativeness, and ease of use. Open-ended questions allowed participants to suggest improvements to traffic education and share additional thoughts.
Additionally, Likert scales were used to assess self-reported behaviors and perceptions of traffic safety, such as adherence to traffic rules, attention levels, and the perceived danger of risky behaviors like using a phone while cycling or crossing streets without looking. Questions also addressed participants’ transportation habits, involvement in traffic accidents, and experiences with traffic violations.
Behavioral tendencies were explored through frequency-based questions, asking participants how often they engaged in specific actions such as crossing streets unsafely, running red lights, or using phones while navigating traffic.
The questionnaire further examined participants’ self-assessed traffic knowledge and skills across different modes of transportation (e.g., pedestrians, cyclists, or drivers).
This questionnaire was administered to participants who had started the R2S platform. By filling out the questionnaire after using the platform, participants could provide feedback specifically to assess the platform’s content, design, and impact on their traffic-related knowledge and behaviors.

2.3. Participants

This study was conducted among the different schools in Belgium. Around nine cities and four municipalities were involved in this project. The students subscribed to this platform were from schoolyear 3rd to 6th and were around 13–17 years old. Participation in this platform was voluntary. Almost 1264 participants subscribed to this platform; the maximum number of participants was from cities (835 participants) compared to municipalities (429 participants). In this study, we refer to ‘cities’ as larger urban centers with higher population density and more extensive transportation infrastructure, while ‘municipalities’ refer to smaller, often semi-rural or rural administrative units with their own local governance but typically fewer resources and lower population density [67]. Male, Female and X (do not want to recognize) participated in this study. For analysis, the X data were omitted as it was only 3% of the data, and it may affect data analysis since gender differences were investigated. Of these 1264 participants, 1199 started with the modules, and of the 1199 participants, 602 completed the whole platform, meaning a dropout rate of 50.2%. The data were collected at the end of the academic year (April–May 2023).
Among the 1264 participants who subscribed to the platform, a questionnaire was offered to participants from two schools. Of these, 272 gave consent and started filling in the survey; however, 30 were deleted since they did not follow the platform completely, and another 30 were deleted since they did not complete the survey. Hence, data analysis was conducted on 212 participants.

2.4. Analysis

This study processed the statistical analyses using SPSS (IBM Statistics 29.0.1.1) and Python (version 3.9). To examine the results on the platform, descriptive statistics were used to examine the performance of secondary school students in Belgium across different demographic groups and educational modules. To find the effect of gender and school year, one-way analysis of variance (ANOVA) and t-test were performed. These were mainly performed to compare the score distribution among different school years. The post hoc Tuckey (HSD) test with Bonferroni correction was used for pairwise comparisons to identify specific group differences. These analyses were conducted to explore variations in performance by gender, school year, and region, providing an understanding of educational outcomes and improvement areas. Only the corrected F and probability values are reported. A confidence level of 0.05 was maintained for all statistical tests. Descriptive analyses were conducted to examine the questionnaire results and explore the demographics, participants’ feedback about the platform, the strengths and challenges of the platform, and the participants’ perception of traffic safety.

3. Results

3.1. R2S Platform

3.1.1. Demographic Analysis

This study examines the demographic characteristics of 1264 participants in secondary school in Belgium, as shown in Table 1. The sample showed more female respondents (56%) than males (44%). Regarding education level, most participants were in the middle of the school year, with 3rd- and 4th-year students collectively representing 66% of the sample. The 5th- and 6th-year school students accounted for one-third of the participants.

3.1.2. Students’ Performance Across Modules

This study comprises five main modules and nine sub-modules in total. Each module addresses the unique aspects of traffic safety and transportation. Participants varied across modules, ranging from 602 to 1199 students. Among all the modules, the “Take a bike ride” module was the most successful, with the highest mean score of 96.69 (see Table 2) and the lowest standard deviation of 5.85. This suggests that the students performed consistently better in this module, with scores ranging from 60 to 100.
On the other hand, the submodule ‘Take a look through the eyes of a drone’ of the “Risk detection” module had the lowest mean score of 58.59 and a maximum standard deviation of 24.13. This indicates that the students found this more challenging, and there was a wide range of performance levels, with scores spanning from 0 to 100. Moreover, the “Traffic Knowledge” module had the highest number of participants (1199) but a relatively low mean score (72.80). In addition, most of the modules had a minimum score of 0 and a maximum score of 100, indicating a wide range of student performance levels. The score distribution across different modules for students can be seen in Table 2.

3.1.3. Gender-Based Analysis of Module Performance: Mean Scores and Variability

Table 3 indicates distinct performance patterns across different gender groups and educational modules. There was no significant difference between the mean scores for males (73.24) and females (74.24) (F: 0.536, p-value: 0.464). However, both groups showed high proficiency in the VR module, particularly in “Take a bike ride” (Male: 97.12, Female: 96.23), as children in Belgium started riding bikes at the age of five [68]. On the other hand, the lower score observed in the Risk Detection module (Male: 67.87, Female: 65.77) suggested that this module presents more challenges to the participants. Some differences were revealed in particular sub-modules: i.e., female respondents scored higher in the specified Risk Management module: ‘Be careful with the risks in traffic’ (Male: 77, Female: 83.02). Equally, both male and female mean scores are relatively low in the Risk Detection sub-module ‘Find the danger’ (Male: 59.77, Female: 62.15).

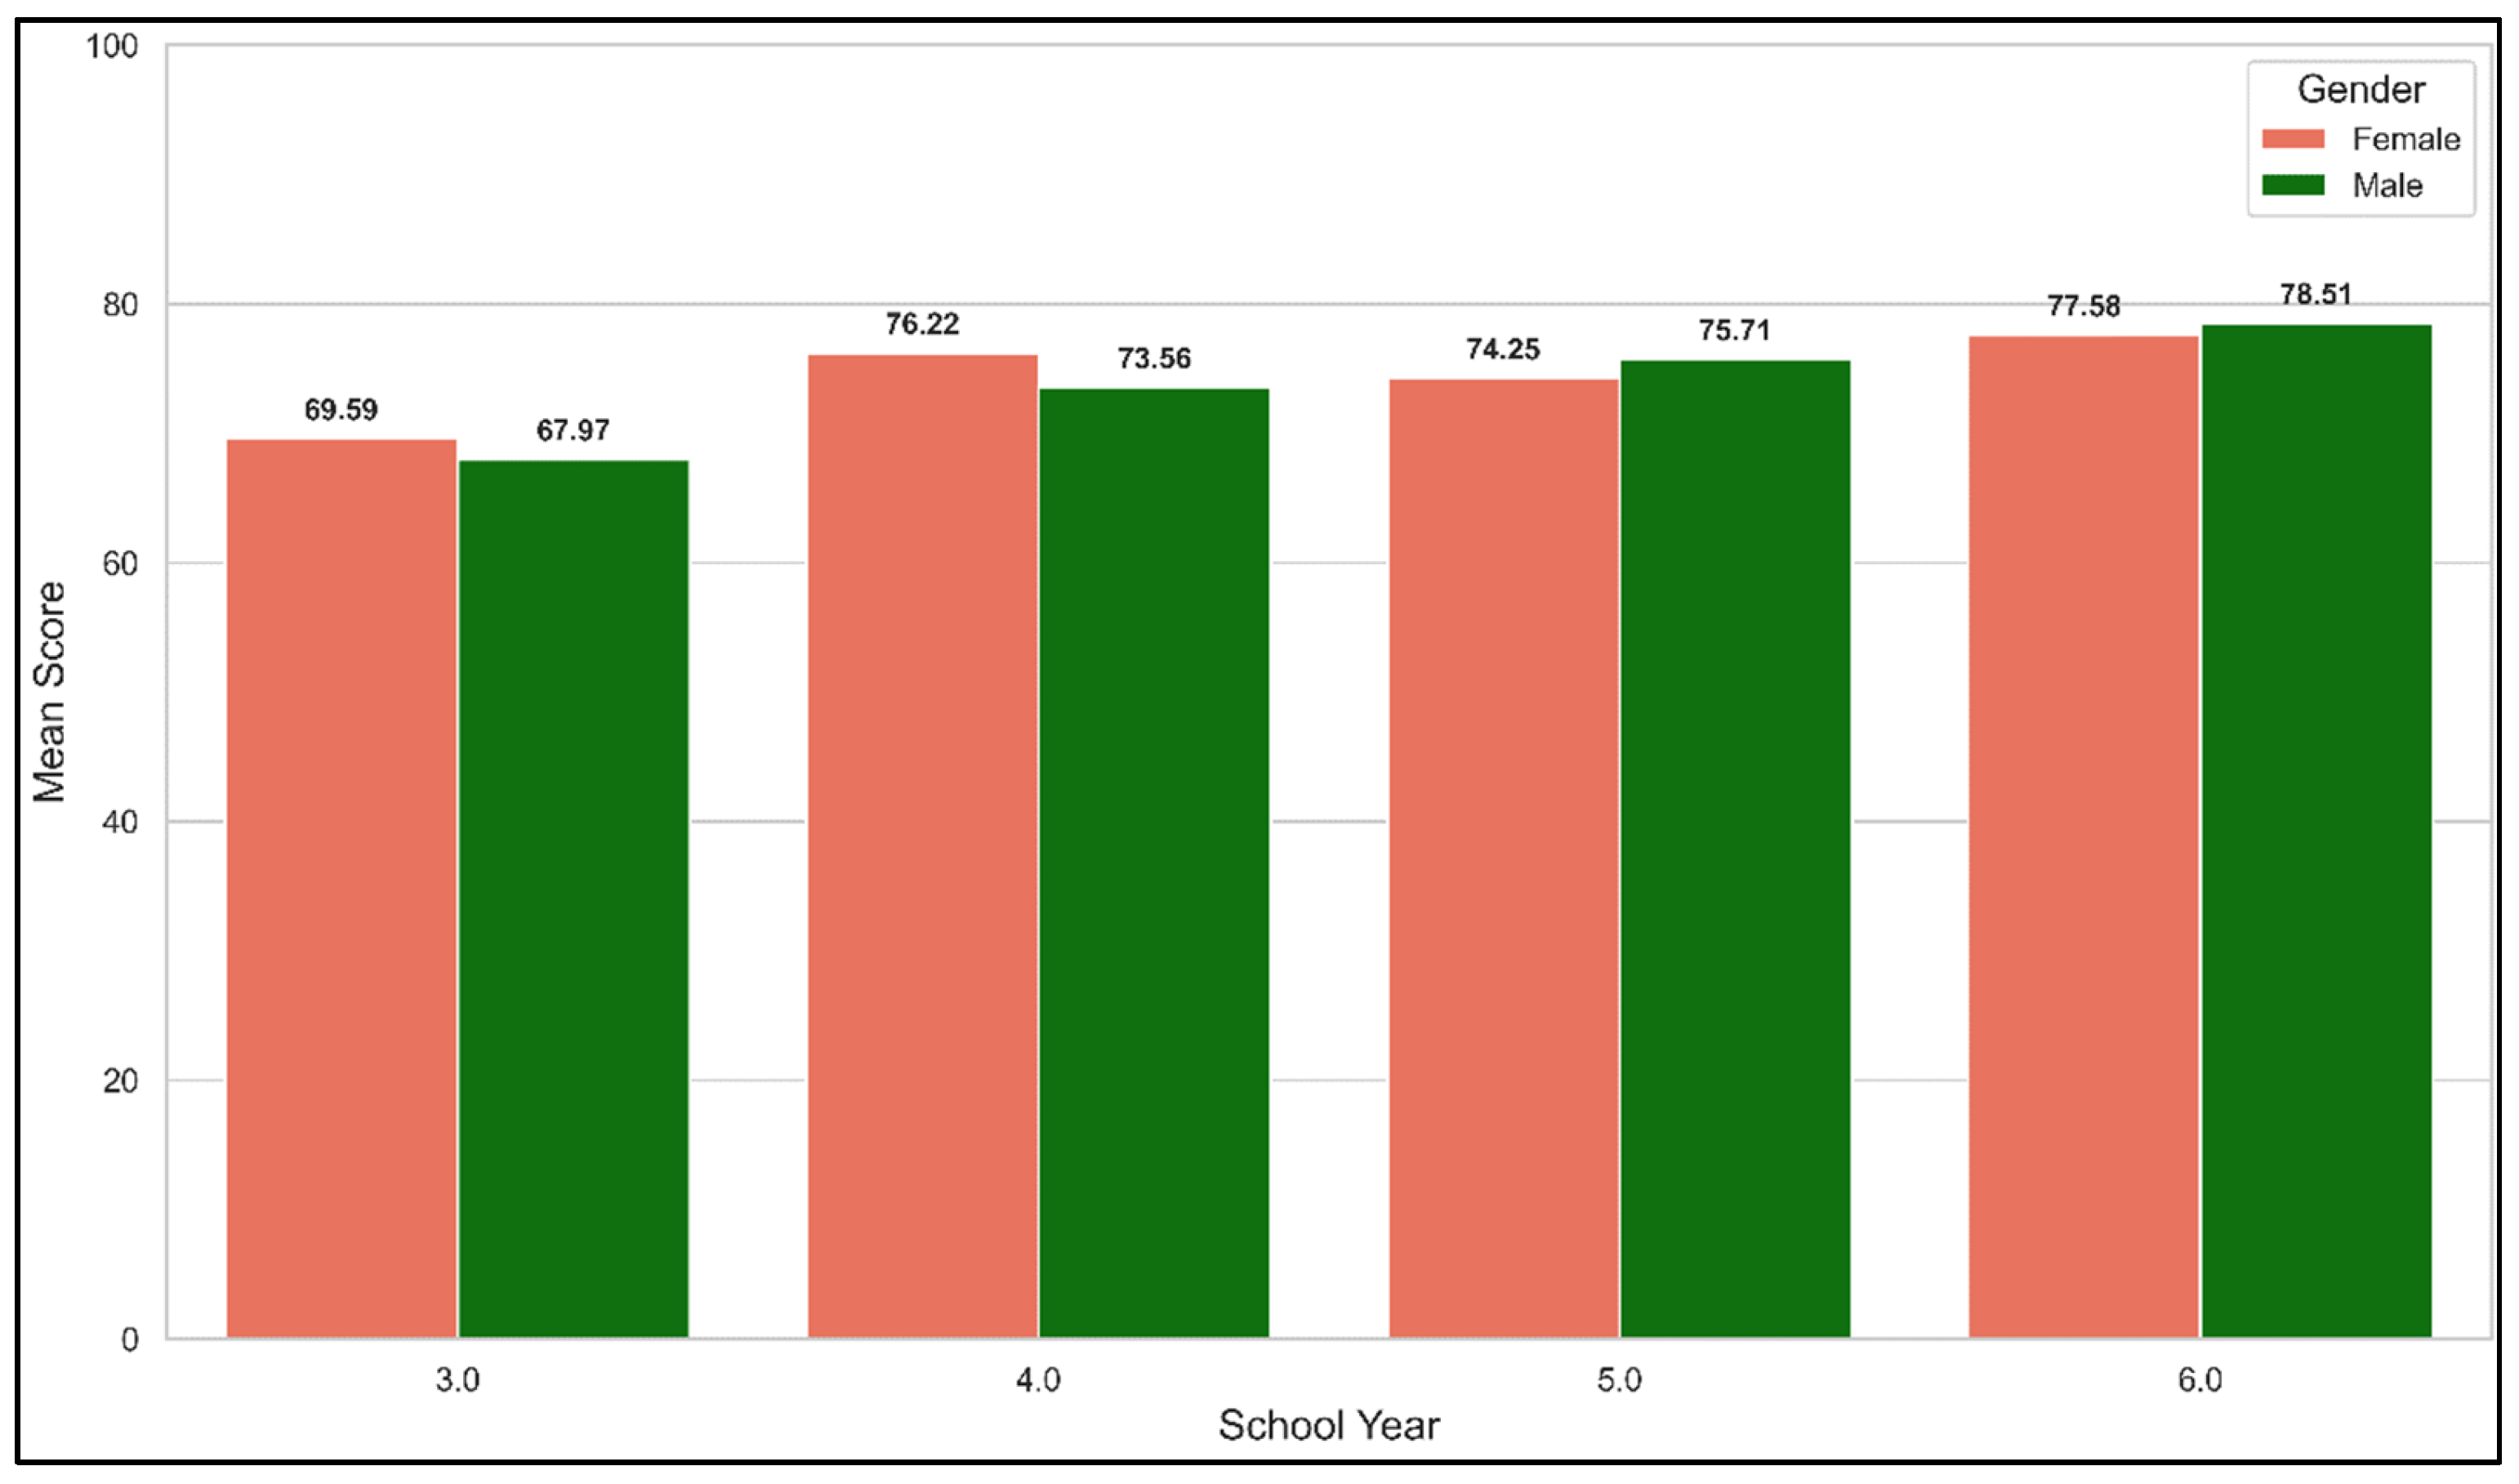
3.1.4. Gender-Based Performance Trends Across School Years

Figure 3 represents the mean score value across different school years for gender groups: Male and Female. Overall, the data showed an upward trend in mean scores increases as students’ progress through their school years, indicating academic improvement over time. However, this trend is not significant. Although there is a minor fluctuation among genders performing better in specific years, the overall difference remains small. By the final year, similar academic results were shown by both males and females, indicating a general balance in performance over time.

3.1.5. Performance Comparison Across Municipalities and Cities

Students from cities scored higher on average (Mean = 75.26) than those from municipalities (Mean = 69.95), with a mean difference of 5.30 points, indicating a performance advantage for city students. An independent samples t-test confirmed this difference is statistically significant (t = 4.117, p < 0.001) even when accounting for unequal variances. The 95% confidence interval for the mean difference (2.78 to 7.83) supports that city students significantly outperformed municipality students, suggesting a meaningful gap in traffic safety knowledge favoring those from urban areas. Table 4 shows the regional performances across different RSE modules.

3.1.6. School Year Distribution Analysis

Similarly, one-way ANOVA was applied during the school year to determine the significant difference in the distribution among the groups, as seen in Table 5. The result showed a significant difference (F:11.019, p-value < 0.001) during the school year. The post hoc test (Tukey HSD) was performed to assess further which school years show significant differences, as seen in Table 5. The result shows a significant difference in score distribution between certain school years. Specifically, in school year 3, students consistently performed worse than in other school years 4, 5, and 6 with statistical differences (all p < 0.01) and lower mean differences. In contrast, no significant differences were found between school years 4, 5, and 6, indicating similar performance levels among these groups.

3.2. Questionnaire Results

3.2.1. Demographic Statistics

The demographic data in Table 6 provide an overview of the gender and education levels of the 212 students who participated in the online questionnaire. Among the respondents, 62 (29%) identified as male and 143 (68%) as female. Regarding their education levels, the participants were distributed across various academic years. A total of 31 students (15%) were in their 3rd year, 68 (32%) in their 4th year, 57 (27%) in their 5th year, and 56 (26%) in their 6th year of study. This distribution reflects a diverse representation of both genders and academic stages, offering an understanding of the demographic profile of the respondents.
Moreover, the mode of transport data, which allowed for multiple responses, indicate that pedestrian travel was the most common choice, with 185 participants using this mode. Car passengers (n = 166) and cyclists (n = 120) followed this. Fewer participants reported being car drivers (n = 32), moped passengers (n = 10), or moped drivers (n = 7).

3.2.2. Participant Feedback on the R2S Education Platform

This section provides an overview of participant feedback on the R2S education platform, focusing on key modules, strengths, challenges, and areas for improvement, as highlighted by qualitative responses.
Feedback on Key Modules
This provides an overview of participant feedback on three key modules of the R2S education platform: podcasts, 360° images, and take a bike/car ride. When it comes to the podcast, most of them found that their experience with it is informative and precise. The numbers are as follows: they totally agree with 15.1% and rather agree with 24.5% for the informativeness item. However, 53.8% of the respondents were neutral about the statement. Approximately one-third of the questions on the podcast were considered clear by 33.5%.” rather agreed,” and another largest percentage (46.2%) of the participants remained “neutral.”
From the respondents’ feedback for the 360° images module, 24.5% strongly agreed, 36.3% rather agreed that the feedback given was informative, and 33.5% were relatively neutral. Likewise, 36.8% “rather agree” that the number of questions was enough, 31.1% remain “neutral.” Regarding the statement that turning in the images has been seen as easy, 32.1% of respondents said “rather agree”, 18.9% replied “totally agree”, and 30.2% remained neutral.
The simulated bike/car rides generally received well in the provided feedback. Regarding the ‘moving with the arrows’ participants, 32.1% ‘totally agree’ and 29.7% ‘rather agree’ the ‘enjoying moving through this environment’, and 37.7% ‘totally agree’. Moreover, traffic signals were found fairly easy to understand, with 38.7% of participants ‘rather agreeing’ and 32.5% ‘totally agreeing’. Overall satisfaction with car rides was slightly higher than bike riding, as 35.4% agreed on car riding, whereas 26.4% agreed only on a bike ride.
Strengths and Challenges of the Platform
Figure 4 summarizes students’ opinions on the R2S Education Platform, highlighting strengths and areas for improvement. The platform excels in ease of account creation (51.2% “Totally Agree”) and clarity of questions (71.1% “Agree”), reflecting strong usability. Feedback is primarily seen as instructive (58.3% “Agree”), while the adequacy of questions and time investment received mixed responses, with 43.4% and 29.3% neutral, respectively. The difficulty of online traffic education is not a significant concern, with 33.5% “Rather Disagree.” However, the lack of badges as incentives leaves 49.6% neutral, pointing to potential improvements in engagement and motivation. While clarity and usability are key strengths, enhancements in engagement and incentives could further improve user satisfaction.
Qualitative Feedback for Improvement
The following areas for improvement of online traffic education were produced from the analysis of the open-ended responses to the question, “In what ways do you think online traffic education can be Improved?” As such, the participants frequently mentioned technical difficulties such as slow loading of the webpage, unresponsiveness of features like the 360 image, car/bike ride and compatibility with school computers. To address this issue, it was suggested that the platform speed, the quality of the simulation, and the usability of the platform on different devices be improved. Also, participants stressed that content should be more comprehensible and activities more engaging; some participants suggested including more practical tasks, like test drives and better demonstrations. Some stated they would like traffic education to be introduced at an earlier year in school and that the visuals used should be more appealing and more ‘gaming’ features. These studies underscore that usability issues should be solved and interactivity improved to optimize the effectiveness of innovative online traffic education R2S. It is recommended that subsequent versions of the platform consider the areas highlighted by the students as essential to meet the expectations and learning outcomes.

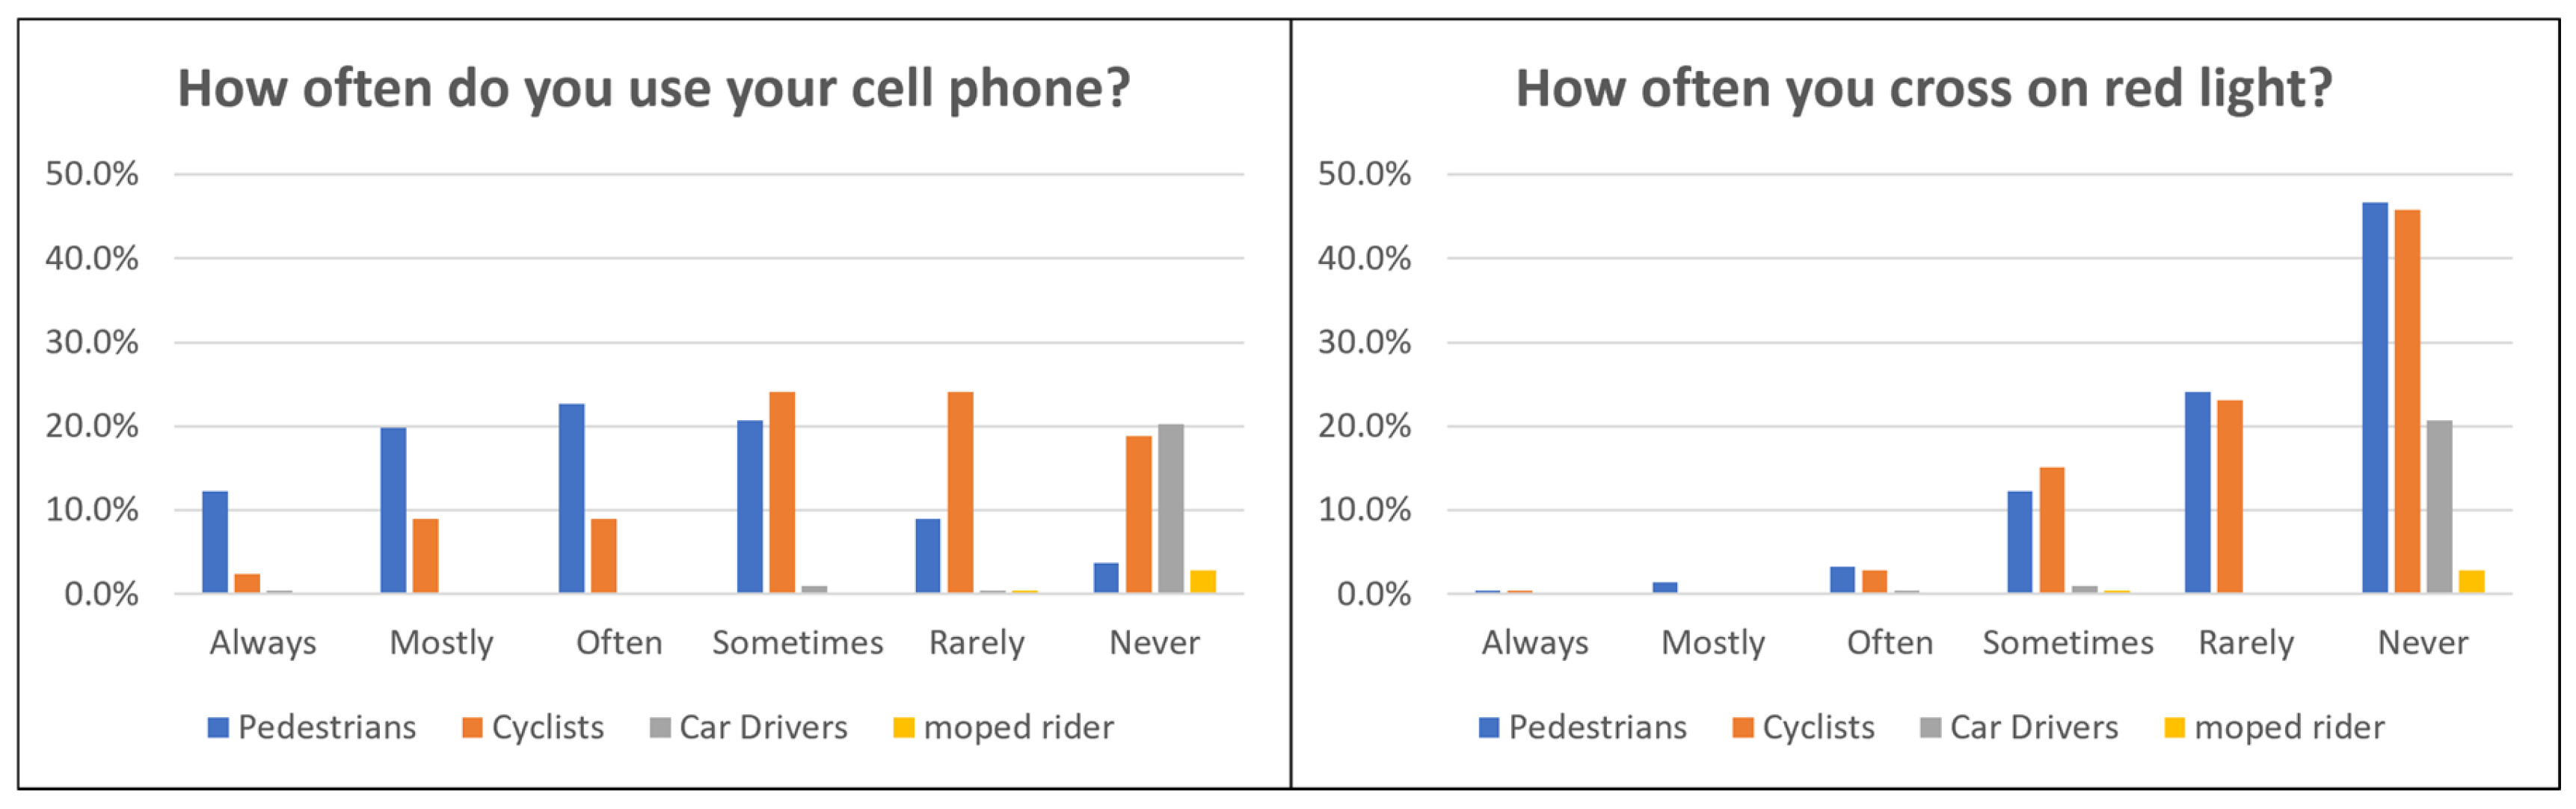
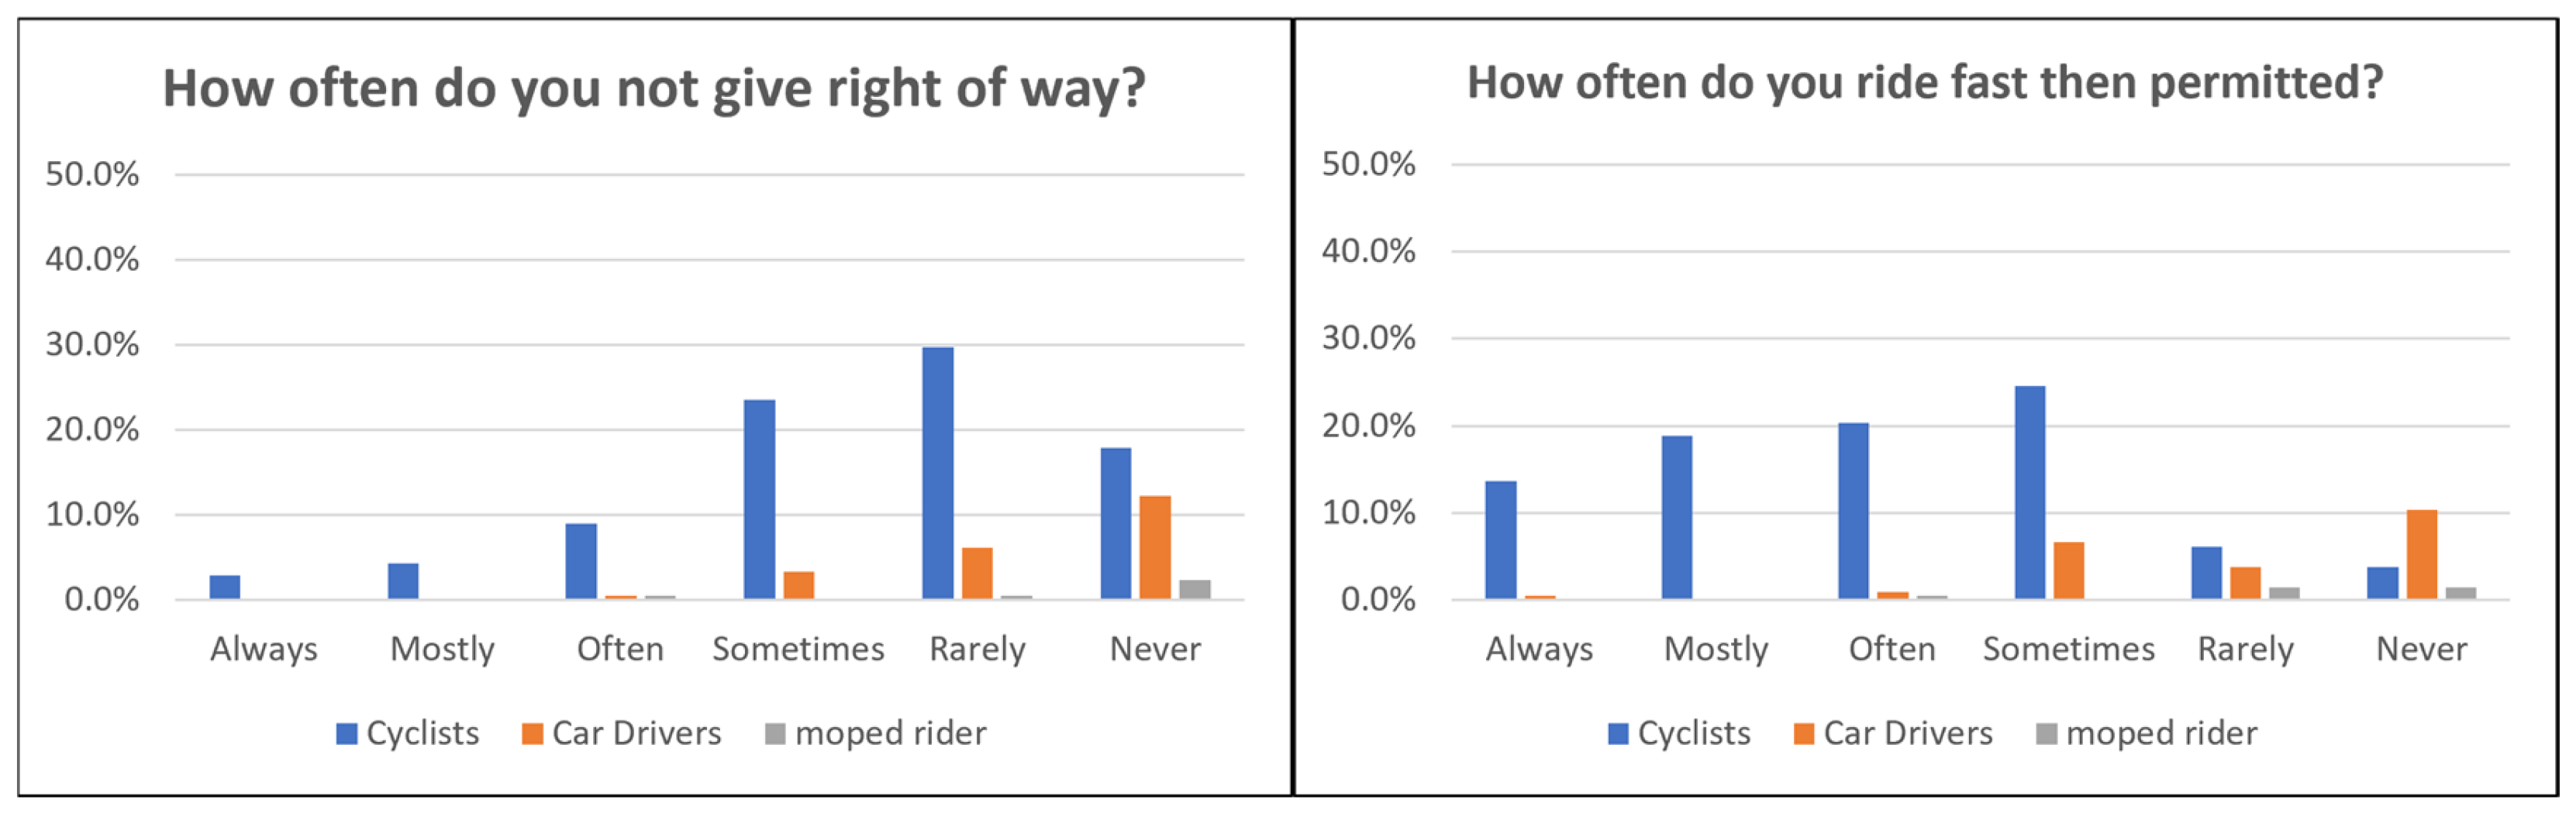
3.2.3. Behavioral Risk Assessment Among Secondary School Students

Figure 5 analyzes the risk behaviors among pedestrians, cyclists, car drivers, and moped riders. Cyclists declare the use of cell phones—sometimes (24.1%) and rarely (24.1%), while pedestrians pointed out that they use cell phones often (22.6%) and sometimes (20.8%). On the other hand, car drivers and moped riders mostly respond to “never” most of the time, which shows that they possess safer behaviors (20.3% and 2.8, respectively). Similarly, cyclists (24.1% “sometimes” and 24.1% “rarely”) and pedestrians (22.6% “often” and 20.8% “sometimes”) display higher incidences of unsafe behaviors like red-light violations. In contrast, car drivers and moped riders show higher conformity; 20.3% of car drivers record ‘never’, and all moped riders display low risky behavior by all standards.
Similarly, Figure 6 concerns non-compliance with the rules of giving way to other road users and speeding among cyclists, car drivers, and riders of mopeds. Cyclists violate both behaviors to the greatest extent. In terms of frequency for not giving the right of way, the majority indicate ‘sometimes’ (23.6%), followed by ‘rarely’ (29.7%), with only a fraction giving the response ‘never’ (17.9%). On the other hand, car drivers have comparatively better compliance, where the highest percentage fell under the ‘never’ category, 12.3% and the ‘rarely’ category, 6.1% followed by moped riders. Under the ‘never’ category, there is only 2.4%, and the rest brought only minimal violations to the researcher’s attention. Cyclists are the most non-compliant once more concerning speed limit violations; the majority said ‘sometimes’ (24.5%), ‘often’ (20.3%), and ‘mostly’ (18.9%). Car drivers provided “never” 10.4%, “rarely” 3.8% and moped riders gave their report as “never” 1.4%, “rarely” 1.4%.

3.2.4. Perception of Road Safety Hazards

Most pedestrians feel comfortable about their activities but express moderate worries about looking at phones and crossing streets against traffic signals. Interestingly, walking through a red light is the most alarming behavior, with nearly 71% of pedestrians perceiving it as rather or very dangerous.
Cyclists tend to identify detailed risks in transportation situations. Most cyclists (66.5%) regard cell phone use on their ride as rather or very dangerous. Participants who ride bikes through red lights and unauthorized areas are deeply concerned about their safety because they understand better the dangers of two-wheeled transport.
Car and moped riders care more about safety risks than other drivers. Car drivers worry about safety risks in multiple activities equally because 17% of them name cell phone use and running a red light, along with other behaviors, as very dangerous. Only 2.4% of moped drivers view these behaviors as threatening their safety.

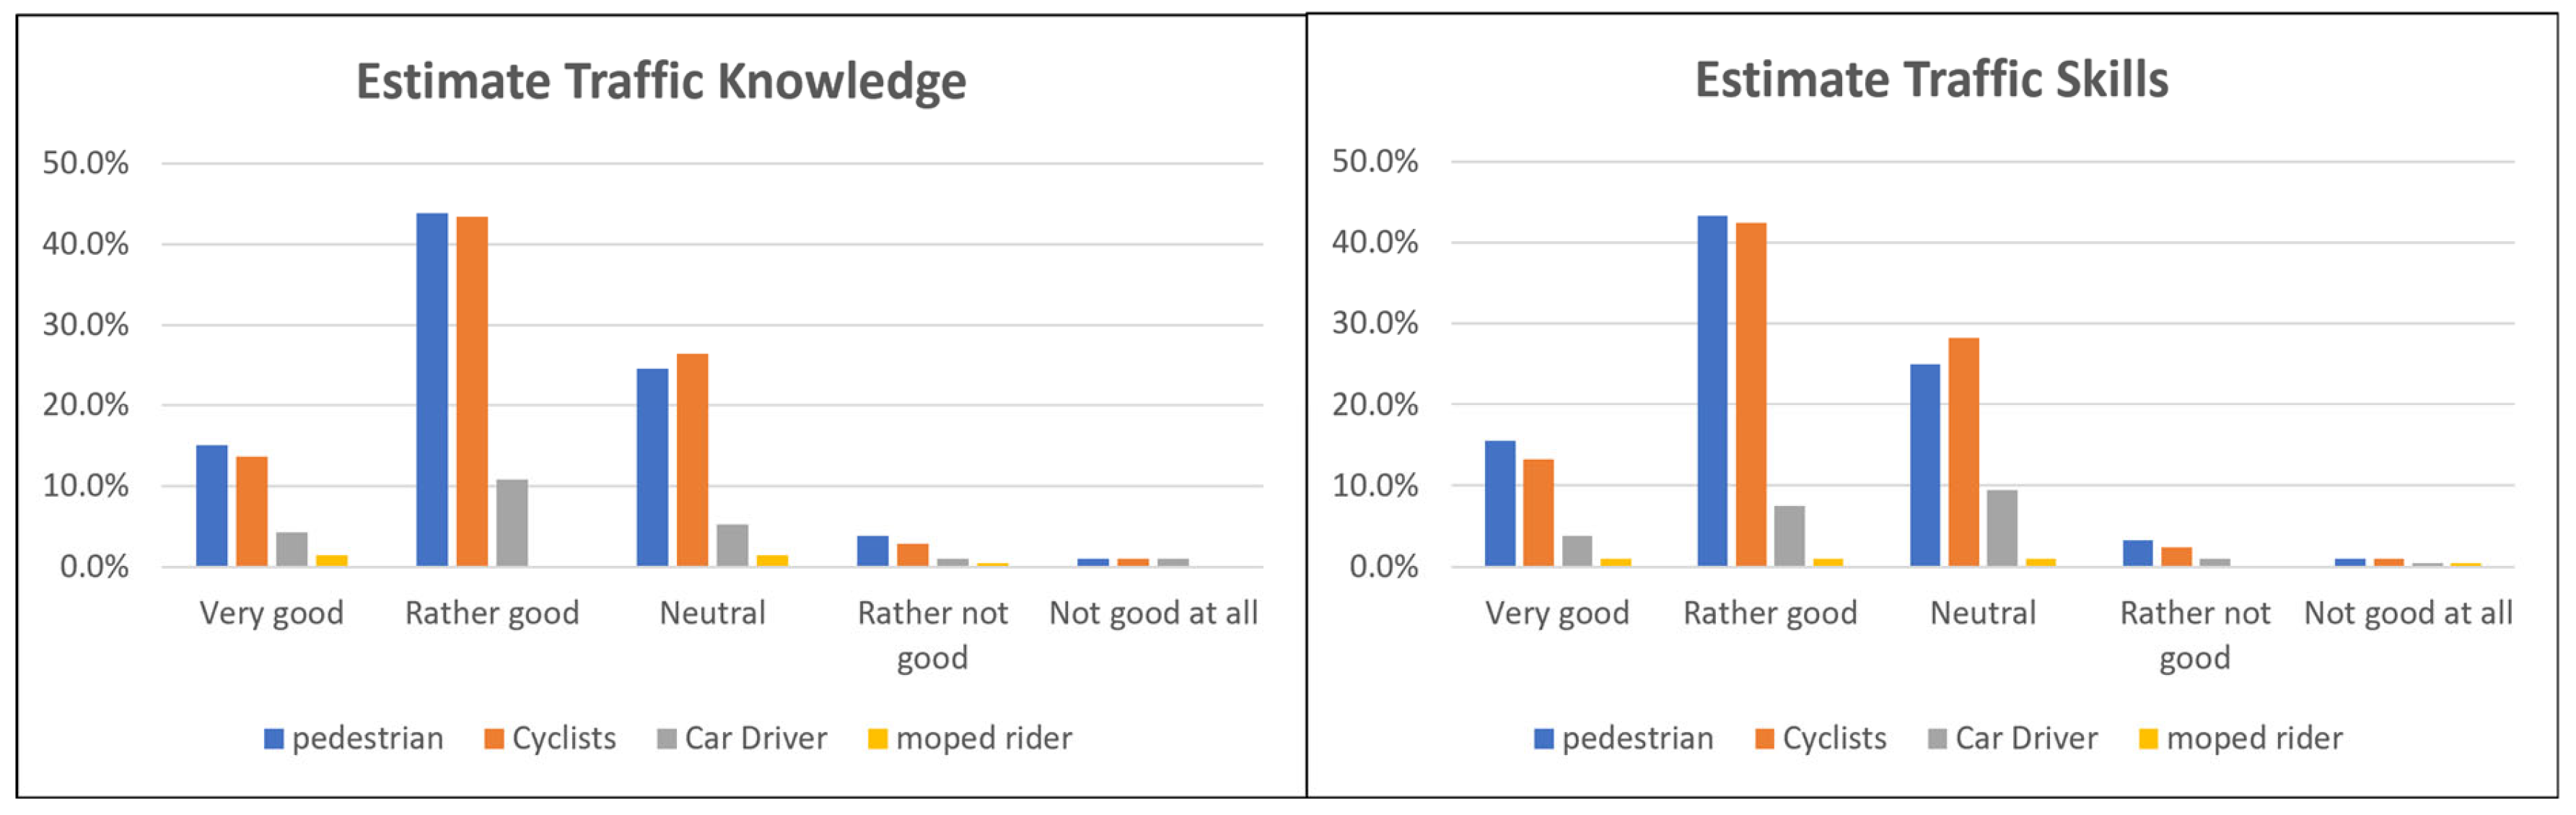
3.2.5. Self-Assessment of Traffic Knowledge and Skills

The graphs shown in Figure 7 present a self-assessment of traffic knowledge and skills among four road user groups: pedestrians, cyclists, car drivers, and moped riders. Pedestrians and cyclists reported the highest confidence in their traffic knowledge and skills compared to car drivers and moped riders. Among pedestrians, 15.1% rated their knowledge as “very good” and 43.9% as “rather good,” while cyclists followed closely with 13.7% “very good” and 43.4% “rather good.” Similarly, for traffic skills, 15.6% of pedestrians rated themselves as “very good” and 43.4% as “rather good,” with cyclists reporting 13.2% as “very good” and 42.5% as “rather good.” In contrast, both car drivers and moped riders displayed lower confidence. For traffic knowledge, car drivers reported only 4.2% “very good” and 10.8% “rather good,” while moped riders had 1.4% “very good” and no responses in the “rather good” category. Similarly, for traffic skills, car drivers reported 3.8% “very good” and 7.5% “rather good,” while moped riders had only 0.9% “very good” and 0.9% “rather good.”

4. Discussion

This study explored the implementation of the R2S platform among secondary school students in Belgium. The platform focuses on road safety knowledge, behaviour, and skills. The findings shed light on the efficiency of this e-learning platform and its potential to improve road safety education for adolescents.

4.1. Student Performance and Educational Impact

Students’ performance using the R2S platform was analyzed across various dimensions, including general performance, gender-based differences, school year progression, and regional variations. The results provide an understanding of adolescent road safety knowledge and skills.

4.1.1. General Performance and Gender Differences

Considering the results, there was no gender difference in the overall performance of the R2S modules. This finding supports earlier studies showing that gender differences in traffic safety knowledge and performance are negligible among adolescents [26,69]. However, regarding student performance, it can be stated that the results were comparable but differed slightly depending on the specific modules taken. For example, females provided slightly better results in the risk management module, while males scored better in the drone module. These variations may reflect underlying differences in risk perception, spatial awareness, or learning preferences, as suggested by Twisk et al. (2014) [26], who highlighted the influence of individual characteristics on safety-related education outcomes [70].
These findings showed the need to build online learning tools that meet all learning styles and help participants deal with their unique learning challenges. Future platform updates should include specific features that match each gender group to make learning better.

4.1.2. Progression Across School Years

This study also showed higher performance as the students progressed through school years, especially between the third and subsequent years. This trend confirms that the R2S platform constructs students’ knowledge and experience. Thus, it is agreed that traffic safety education and awareness should be a progressive process during adolescence [24]. No significant variations between the 4th, 5th, and 6th years suggest that platform materials remain relevant and challenging for older students, which is important for continuous learning progress.
To make the platform more effective for older students, including more complex and/or culturally relevant modules will be helpful. This could include situations where students are depicted as more autonomous and mobile and have more complicated travel behaviour as they get close to the legal driving age. However, as students approach the legal driving age, introducing more advanced and contextually relevant modules, such as simulations of complex traffic scenarios or risk assessment for novice drivers, could enhance learning outcomes. For instance, integrating modules based on real-world driving challenges has improved adolescent risk detection and decision-making skills [37].

4.1.3. Regional Variations Between Cities and Municipalities

Performance differences between students from urban and municipal regions were notable, with city students outperforming their counterparts. Contextual factors may influence this difference, such as better exposure to diverse traffic environments [71] or additional safety campaigns in urban areas. Research by Obregón-Biosca et al. (2018) highlights how localized traffic safety initiatives can significantly impact educational outcomes [25]. However, other unmeasured factors, such as differences in school-level resources, socioeconomic backgrounds, or prior exposure to traffic safety platform, may also have contributed to this performance gap. These variables were not collected in this study, which limits a deeper understanding of the underlying causes.
The observed differences in scores between different cities and municipalities imply that context-specific factors should not be excluded when it comes to road safety education [72]. The higher achievement of students in specific areas suggests that the R2S platform might be complemented by some local factors, like the actions made by local authorities and public organisations in improving road safety or community involvement in the campaign [73].
Conversely, the lower scores observed in other areas indicate that more work may be needed or that specialized assistance and techniques are required. Localized content incorporating specific traffic challenges students face in rural or suburban areas could make the platform more relatable and effective. For example, studies have shown that integrating local scenarios and culturally relevant content enhances the applicability and engagement of road safety education [34,74].
These findings further support the need for a localized approach to road safety education [75]. In future implementations of the R2S platform, the content should include local traffic scenarios and challenges. These changes will make the content more appealing to students from different regions.

4.2. Perception of the R2S Platform

Student feedback on the R2S platform was positive, with high usability, clarity, and engagement ratings. Incorporating gamification elements, such as immediate feedback, progressive difficulty, and VR simulations, was instrumental in maintaining participant motivation and enhancing knowledge retention. These findings are consistent with prior studies highlighting the effectiveness of gamified approaches in education [54]. However, participants also noted areas for improvement, such as technical challenges (e.g., slow performance, unresponsive 360° images) and the need for more evident questions in some modules, like drone footage. This module was a big step forward in traffic education because the virtual behavior can also be measured along with reported behaviour. Recommendations included adding practical exercises, refining usability, and introducing incentive mechanisms like badges or leaderboards to boost engagement further and foster a sense of accomplishment [76,77].

4.3. Behavioral Risk Patterns

The questionnaire data highlighted behavioral non-compliance among cyclists and pedestrians, particularly in using mobile phones and violations of red-light rules. These findings highlight cyclists and pedestrians as higher-risk groups for unsafe transit behaviors. These findings align with studies identifying cyclists and pedestrians as vulnerable road users [69,78], with distractions and violations significantly increasing their risk of accidents. The survey shows how different people understand road hazards based on their specific travel methods. Most people walking feel safe, but 71% believe crossing the street against traffic is extremely risky. Most cyclists understand transportation risks, with 66.5% seeing cell phone use as dangerous while riding. Despite their proficiency in theoretical knowledge, students displayed inconsistencies in translating this knowledge into safe practices. These behavioural trends are also reflected in the transport choices reported by participants, where pedestrian travel and car passenger modes were more prevalent than cycling. This aligns with broader patterns observed in Belgium, where safety concerns often lead parents to discourage cycling as a school transport mode, despite its cultural importance. Interestingly, the data revealed that car drivers overestimated their traffic knowledge while simultaneously underestimating their traffic skills. Notably, car and moped riders exhibited varying risk perceptions: 17% of car drivers considered multiple risky behaviors very dangerous, in contrast to only 2.4% of moped drivers perceiving similar activities as safety threats. These differences may reflect not only confidence biases but also the influence of daily commuting habits on students’ risk perceptions and learning engagement. For instance, students who walk or cycle regularly may engage more deeply with pedestrian and cyclist content, while those who are primarily car passengers may overlook certain vulnerabilities. This highlights the potential benefit of tailoring road safety education to students’ actual travel routines. Such findings support our proposition that skill-enhancement exercises like VR training should be incorporated to increase usability readiness. This gap underscores the importance of integrating behavior-focused interventions, such as immersive VR simulations, to reinforce practical applications of learned concepts [74,79].
Comparing the Belgian R2S implementation with its international counterparts reveals both shared challenges and contextual differences. While gamified approaches proved effective across settings, Belgium’s higher baseline of road safety knowledge and widespread cycling culture required tailored content to sustain engagement. Additionally, the integration of (VR) and 360° visuals capitalized on Belgium’s digital readiness, offering an advancement over prior implementations in lower-resource contexts such as Palestine [49] and Pakistan [50]. These observations suggest that although the core gamification elements are adaptable, local infrastructure, transport patterns, and cultural factors play a crucial role in shaping the program’s design and outcomes. Incorporating such contextual reflections strengthens the international relevance of this study and highlights potential pathways for future cross-country applications.

4.4. Limitations and Further Research

This study suggests that the R2S education platform has great benefits among secondary school students in Belgium. Although this study has some strengths, the following limitations should be considered when analyzing the findings and designing subsequent research. First, the cross-sectional design restrains the authors from establishing causality and identifying long-term changes in reaction to the platform, which is why a longitudinal setup is needed. Future research should employ longitudinal designs to track students’ progress over time, allowing for a better understanding of the platform sustained impact on knowledge retention and behavioural changes. Additionally, the fact that the students were volunteers may mean that their outcome differs from the rest of the cohort due to self-selection bias, and the results may portray the platform as more effective than it is. Future studies should consider using randomized controlled trials or sampling methods that mitigate self-selection bias to obtain results more representative of the general student population.
A potential limitation of the R2S platform is that it does not show actual behavior in traffic situations. While it effectively measures virtual and reported behavior, the absence of real-world behavior analysis limits its applicability to real traffic scenarios. Future research should incorporate observational studies or real-life simulations to measure students’ actual behavior in traffic settings and assess how the platform translates into practical safety skills. This would help bridge the gap between theoretical learning and real-world application.
A potential limitation of the survey is the risk of socially desirable answering, particularly in questions related to self-reported risk behaviors. Although anonymous reporting was applied to the task to reduce these concerns, it remains probable that participants may have described behaviors in a manner they deemed less objectionable. It is recommended that future studies use additional procedures, including but not limited to mixed-methods analysis or observational data, to reduce this bias to a further extent. The R2S platform does not integrate a level of competition with the participants. Future research could explore incorporating competitive elements, such as leaderboards or team challenges, to enhance engagement and motivation while assessing their effectiveness in improving learning outcomes.
The study area coverage was focused on the Flemish area, which may limit the generalization of results to other places with different traffic practices or teaching methodologies. Future research should explore the platform effects in diverse geographic and cultural contexts to enhance generalizability, assessing its adaptability to various traffic safety norms and educational environments. This study also focused on performance within the R2S platform without directly assessing the real-world application of the acquired knowledge and skills. Future studies could incorporate follow-up assessments or observational methods to assess how students apply the skills learned through the R2S platform in real-life traffic situations.
The absence of qualitative data (e.g., interviews and focus groups) may have missed valuable insights into students’ experiences. Incorporating qualitative data would provide deeper insights into the participants’ perceptions, engagement levels, and attitudes towards the R2S education platform. This study also collected limited demographic information, considering only gender and school year, without examining potentially relevant factors like socioeconomic status, prior traffic education, or personal experiences with road accidents. Future research should include a broader range of demographic variables, such as socioeconomic background and previous exposure to traffic safety education, to identify potential moderating factors that could influence platform effectiveness.
Another limitation is that the number of participants was gradually reduced as they moved through the modules. This study initially recruited 1264 participants, and enrolment was reduced across the various modules. This decrease could be caused by several factors, including the progression of the difficulty level, reduced motivation, or any other factors within or outside the class that cut down the time that a student has to undertake the modules. Such degradation could negatively affect the performance data and impact the representativeness of the results for other modules and the overall population of participants. Future studies should investigate the reasons for participant reduction and consider strategies to improve retention, such as enhancing engagement or providing incentives to encourage continued participation. Although overall dropout rates were documented, no systematic module-wise analysis of attrition was performed. Therefore, it is unclear whether dropout was driven by technical issues (e.g., VR usability), content complexity, or external factors such as time constraints. Informal feedback suggests that time limitations and declining motivation over time played a role, but this remains speculative. Future studies should incorporate module-specific analytics and user experience metrics to identify and address the root causes of attrition.
Another limitation concerns the reliance on self-reported behavioral risk data, which may be influenced by recall errors or social desirability bias. No external validation, such as observational data or traffic records, was conducted due to the large-scale and anonymous nature of this study. To minimize bias, students were assured anonymity and were instructed that there were no correct or incorrect responses, encouraging honest reporting. Future studies should consider triangulating self-reported data with observational or mixed-method approaches to improve reliability.
Additionally, this study did not collect data on contextual variables such as socioeconomic background, prior exposure to traffic safety education, or school-level resources. These unmeasured factors may have contributed to the observed performance differences between city and municipality students, limiting our ability to fully interpret these disparities. Future research should include these covariates to better understand the role of local contexts. Lastly, a methodological and ethical limitation of this study is the exclusion of non-disclosed gender participants due to the low percentage compared to males and females, which may inadvertently contribute to the invisibility of non-binary individuals in educational research. Future studies should aim to include and explore patterns among this group to enhance inclusivity and representation.
These limitations present opportunities for future research to expand on this study’s findings and further enhance our understanding of effective road safety education for secondary school students. Despite these constraints, this study offers valuable insights into the potential of e-learning platforms like R2S in promoting traffic safety among adolescents.

Challenging Modules and Implications for Platform Improvement

The data indicated that ‘Drones’ was the module the students understood the least, as shown by the lowest mean and the highest standard deviation. This finding suggests that interpreting traffic situations from an aerial perspective can be challenging for numerous students. Despite this, the current module presents a good chance for developing situational awareness and risk perception from the perspective that might benefit future drivers [60].
Conversely, the high performance in the “Take a Bike Ride” module reflects the strong cycling culture in Belgium and children’s early exposure to cycling [68]. This success could be leveraged to introduce more advanced cycling scenarios or to draw parallels with safe driving behaviors as students approach driving age.
The variable performance across modules indicates areas for potential improvement in the R2S platform. For instance, despite high participation, the relatively lower scores in the knowledge module suggest a need to review and potentially revise the content delivery method for traffic rules and regulations.

4.5. Policy Recommendation

Several recommendations can be made for the future development and implementation of the R2S platform. First, tailored content progression is necessary, particularly for older students in their 5th and 6th years, to maintain the challenge and relevance of the material as they approach driving age. This could include more complex traffic scenarios and decision-making exercises for novice drivers. Additionally, integrating local traffic conditions, rules, and challenges specific to various municipalities could increase the platform relevance and engagement for students in diverse areas.
Enhancing support for challenging modules, such as drones, is also crucial. Providing preparatory activities or Supplementary Materials may help students build the foundational skills they need to succeed in these areas. A longitudinal study design should also be implemented to assess the platform long-term effects on students’ road safety knowledge, attitudes, and behaviors, particularly as they transition to becoming licensed drivers. Furthermore, methods could be developed to evaluate how well students apply their knowledge and skills in real-world traffic situations, possibly in collaboration with local driving schools or through supervised traffic observation exercises. Lastly, while the platform appears equally effective for both genders, it is essential to continue monitoring and ensuring its inclusivity, ensuring it remains engaging for students with different learning styles or special educational needs.

5. Conclusions

The R2S education platform demonstrates significant potential as an innovative approach to road safety education for secondary school students in Belgium. This study’s findings provide valuable insights into the performance and satisfaction with the platform and highlight areas for improvement. Overall, the R2S platform engages students across different secondary school years, with performance generally improving as students’ progress through school years.
However, performance variability across different modules reveals the strengths and areas needing refinement within the platform. For example, challenges in the drone module suggest that students may require additional support in certain areas like situational awareness. Incorporating innovative technologies like virtual reality and drone footage aligns with modern pedagogical practices and enhances student engagement. Moreover, variations in performance across different municipalities and cities highlight the importance of local context in road safety education, suggesting that a one-size-fits-all approach may not be sufficient. Although there is room for improvement of the platform, the survey findings confirm that students are satisfied with the platform’s usability and engaging features, reinforcing the platform’s relevance and potential for broader implementation.

Author Contributions

Conceptualization, I.N., A.C., G.W. and D.J.; methodology, I.N., A.C. and D.J.; software, I.N. and R.P.; validation, A.C., G.W. and D.J.; formal analysis, I.N. and A.C.; investigation, I.N.; resources, A.C., G.W. and D.J.; data curation, I.N., A.C. and R.P.; writing—original draft preparation, I.N.; writing—review and editing, I.N., A.C., D.J. and G.W.; visualisation, I.N., A.C. and R.P.; supervision, D.J., A.C. and G.W.; project administration, A.C., D.J. and G.W.; funding acquisition, A.C., D.J. and G.W. All authors have read and agreed to the published version of the manuscript.

Funding

This research received no external funding.

Institutional Review Board Statement

Not applicable.

Informed Consent Statement

Informed consent was obtained from all subjects involved in this study.

Data Availability Statement

The datasets are available from the corresponding author upon request.

Acknowledgments

We would like to thank Raph Snijders for helping with data collection. We appreciate the participating schools’ cooperation while collecting data.

Conflicts of Interest

The authors declare no conflicts of interest.

References

  1. WHO. Global Status Report on Road Safety; WHO: Geneva, Switzerland, 2015; pp. 1–16. [Google Scholar]
  2. UNICEF. Technical Guidance for Child and Adolescent Road Safety; United Nations Children’s Fund: New York, NY, USA, 2022; pp. 1–92. [Google Scholar]
  3. National Center for Injury Prevention and Control WISQARS (Web-Based Injury Statistics Query and Reporting System)|Injury Center|CDC. Available online: https://www.cdc.gov/injury/wisqars/index.html (accessed on 31 July 2023).
  4. OECD. Ambitious Road Safety Targets and the Safe System Approach; OECD: Paris, France, 2008. [Google Scholar]
  5. Björnberg, K.E.; Hansson, S.O.; Belin, M.-Å.; Tingvall, C. The Vision Zero Handbook: Theory, Technology and Management for a Zero Casualty Policy; Springer Nature: Cham, Switzerland, 2022; ISBN 978-3-030-76505-7. [Google Scholar]
  6. European Commission. National Road Safety Profile—Belgium; European Commission, Directorate General for Transport: Brussels, Belgium, 2021; p. 26. [Google Scholar]
  7. Eustace, D.; Indupuru, V.K.; Hovey, P. Identification of Risk Factors Associated with Motorcycle-Related Fatalities in Ohio. J. Transp. Eng. 2011, 137, 474–480. [Google Scholar] [CrossRef]
  8. Haworth, N. Powered Two Wheelers in a Changing World—Challenges and Opportunities. Accid. Anal. Prev. 2012, 44, 12–18. [Google Scholar] [CrossRef]
  9. Ahmed, T.; Moeinaddini, M.; Almoshaogeh, M.; Jamal, A.; Nawaz, I.; Alharbi, F. A New Pedestrian Crossing Level of Service (Pclos) Method for Promoting Safe Pedestrian Crossing in Urban Areas. Int. J. Environ. Res. Public Health 2021, 18, 8813. [Google Scholar] [CrossRef] [PubMed]
  10. Roynard, M.; Schoeters, A.; Wénin, M. Analysis of Road Accidents Involving Children Near Primary Schools and Kindergardens; Belgian Road Safety Institute—Knowledge Center Road Safety: Brussels, Belgium, 2015; pp. 1–6. [Google Scholar]
  11. LFIA School System Equivalences; LFI Anvers: Antwerpen, Belgium, 2025.
  12. Eurydice Organisation of the Education System and of Its Structure. Available online: https://eurydice.eacea.ec.europa.eu/eurypedia/belgium-flemish-community/organisation-education-system-and-its-structure?utm_source=chatgpt.com (accessed on 21 July 2025).
  13. Kearns, R.A.; Collins, D.C.A.; Neuwelt, P.M. The Walking School Bus: Extending Children’s Geographies? Area 2003, 35, 285–292. [Google Scholar] [CrossRef]
  14. Westman, J.; Friman, M.; Olsson, L. What Drives Them to Drive?—Parents’ Reasons for Choosing the Car to Take Their Children to School. Front. Psychol. 2017, 8, 1970. [Google Scholar] [CrossRef] [PubMed]
  15. Wen, L.M.; Fry, D.; Rissel, C.; Dirkis, H.; Balafas, A.; Merom, D. Factors Associated with Children Being Driven to School: Implications for Walk to School Programs. Health Educ. Res. 2008, 23, 325–334. [Google Scholar] [CrossRef]
  16. Hillman, M. Children, Transport, and the Quality of Life. Chapter 3. One False Move…An Overview of the Findings and Issues They Raise; Policy Studies Institute: Addis Ababa, Ethiopia, 1993; ISBN 9780853745723. [Google Scholar]
  17. Hillman, M.; Adams, J.; Whitelegg, J. One False Move … A Study of Children’s Independent Mobility; Policy Studies Institute: Addis Ababa, Ethiopia, 1990. [Google Scholar]
  18. Joshi, M.S.; Maclean, M.; Carter, W. Children’s Journey to School: Spatial Skills, Knowledge and Perceptions of the Environment. Br. J. Dev. Psychol. 1999, 17, 125–139. [Google Scholar] [CrossRef]
  19. Shaffer, D.; Kipp, K. Development Psychology: Childhood and Adolescence; CENGAGE Learning Custom Publishing: Boston, MA, USA, 2009; ISBN 978-0-495-60171-5. [Google Scholar]
  20. Ji, Y.; Huang, Y.; Yang, M.; Leng, H.; Ren, L.; Liu, H.; Chen, Y. Physics-Informed Deep Learning for Virtual Rail Train Trajectory Following Control. Reliab. Eng. Syst. Saf. 2025, 261, 111092. [Google Scholar] [CrossRef]
  21. Vermont the 5 E’s—Education, Encouragement, Enforcement, Evaluation, and Engineering|Safe Routes to School. Available online: https://saferoutes.vermont.gov/your-school/5es (accessed on 18 September 2024).
  22. Rose 25 Booklet Good Practice Guide on Road Safety Education; Kuratorium fur Verkerssicherheit: Wien, Austria, 2005.
  23. Shell, D.F.; Newman, I.M.; Córdova-Cazar, A.L.; Heese, J.M. Driver Education and Teen Crashes and Traffic Violations in the First Two Years of Driving in a Graduated Licensing System. Accid. Anal. Prev. 2015, 82, 45–52. [Google Scholar] [CrossRef]
  24. Assailly, J.P. Road Safety Education: What Works? Patient Educ. Couns. 2017, 100, S24–S29. [Google Scholar] [CrossRef]
  25. Obregón-Biosca, S.A.; Betanzo-Quezada, E.; Romero-Navarrete, J.A.; Ríos-Nuñez, M. Rating Road Traffic Education. Transp. Res. Part F Traffic Psychol. Behav. 2018, 56, 33–45. [Google Scholar] [CrossRef]
  26. Twisk, D.A.M.; Vlakveld, W.P.; Commandeur, J.J.F.; Shope, J.T.; Kok, G. Five Road Safety Education Programmes for Young Adolescent Pedestrians and Cyclists: A Multi-Programme Evaluation in a Field Setting. Accid. Anal. Prev. 2014, 66, 55–61. [Google Scholar] [CrossRef]
  27. Thomas, P.; Morris, A.; Talbot, R.; Fagerlind, H. Identifying the Causes of Road Crashes in Europe. Ann. Adv. Automot. Med. 2013, 57, 13–22. [Google Scholar] [PubMed]
  28. Treat, J.R.; Tumbas, N.S.; McDonald, S.T.; Shinar, D.; Hume, R.D.; Mayer, R.E.; Stansifer, R.L.; Castellan, N.J. Tri-Level Study of the Causes of Traffic Accidents: Final Report. Executive Summary; Indiana University, Bloomington, Institute for Research in Public Safety: Bloomington, Indiana, 1979. [Google Scholar]
  29. Riaz, M.S.; Cuenen, A.; Dhondt, S.; Craps, H.; Janssens, D. Evaluation of a Road Safety Education Program Based on Driving Under Influence and Traffic Risks for Higher Secondary School Students in Belgium. Safety 2019, 5, 34. [Google Scholar] [CrossRef]
  30. Curry, A.E.; Hafetz, J.; Kallan, M.J.; Winston, F.K.; Durbin, D.R. Prevalence of Teen Driver Errors Leading to Serious Motor Vehicle Crashes. Accid. Anal. Prev. 2011, 43, 1285–1290. [Google Scholar] [CrossRef]
  31. McCartt, A.T.; Mayhew, D.R.; Braitman, K.A.; Ferguson, S.A.; Simpson, H.M. Effects of Age and Experience on Young Driver Crashes: Review of Recent Literature. Traffic Inj. Prev. 2009, 10, 209–219. [Google Scholar] [CrossRef]
  32. Olsen, E.O.; Shults, R.A.; Eaton, D.K. Texting While Driving and Other Risky Motor Vehicle Behaviors Among US High School Students. Pediatrics 2013, 131, e1708–e1715. [Google Scholar] [CrossRef]
  33. Rowe, R.; Andrews, E.; Harris, P.R.; Armitage, C.J.; McKenna, F.P.; Norman, P. Identifying Beliefs Underlying Pre-Drivers’ Intentions to Take Risks: An Application of the Theory of Planned Behaviour. Accid. Anal. Prev. 2016, 89, 49–56. [Google Scholar] [CrossRef]
  34. Ellis, J. Bicycle Safety Education for Children from a Developmental and Learning Perspective; National Highway Traffic Safety Administration: Washington, DC, USA, 2014; p. 60. [Google Scholar]
  35. Hooshmand, J.; Hotz, G.; Neilson, V.; Chandler, L. BikeSafe: Evaluating a Bicycle Safety Program for Middle School Aged Children. Accid. Anal. Prev. 2014, 66, 182–186. [Google Scholar] [CrossRef]
  36. Brondum, L.; Truong, T.; Dinh, K. Helmets for Kids Programme Increases Helmet Use among Students. Inj. Prev. 2012, 18, A112. [Google Scholar] [CrossRef]
  37. Senserrick, T.; Ivers, R.; Boufous, S.; Chen, H.-Y.; Norton, R.; Stevenson, M.; van Beurden, E.; Zask, A. Young Driver Education Programs That Build Resilience Have Potential to Reduce Road Crashes. Pediatrics 2009, 124, 1287–1292. [Google Scholar] [CrossRef] [PubMed]
  38. Stubbé, H.; Badri, A.; Telford, R.; van der Hulst, A.; van Joolingen, W. E-Learning Sudan, Formal Learning for Out-of-School Children. Electron. J. e-Learn. 2016, 14, 136–149. [Google Scholar]
  39. Henderson, J.; Alexander, S. E-Learning—The Future of Child and Adolescent Obesity! Obes. Res. Clin. Pract. 2012, 6, 75. [Google Scholar] [CrossRef]
  40. Riaz, M.S.; Cuenen, A.; Janssens, D.; Brijs, K.; Wets, G. Evaluation of a Gamified E-Learning Platform to Improve Traffic Safety among Elementary School Pupils in Belgium. Pers. Ubiquitous Comput. 2019, 23, 931–941. [Google Scholar] [CrossRef]
  41. Ghekiere, A.; Van Cauwenberg, J.; De Geus, B.; Clarys, P.; Cardon, G.; Salmon, J.; De Bourdeaudhuij, I.; Deforche, B. Critical Environmental Factors for Transportation Cycling in Children: A Qualitative Study Using Bike-Along Interviews. PLoS ONE 2014, 9, e106696. [Google Scholar] [CrossRef]
  42. Trifunović, A.; Pešić, D.; Čičević, S.; Antić, B. The Importance of Spatial Orientation and Knowledge of Traffic Signs for Children’s Traffic Safety. Accid. Anal. Prev. 2017, 102, 81–92. [Google Scholar] [CrossRef]
  43. Lee, J.J.; Hammer, J. Gamification in Education: What, How, Why Bother? Acad. Exch. Q. 2011, 15, 146. [Google Scholar]
  44. Petzoldt, T.; Weiß, T.; Franke, T.; Krems, J.F.; Bannert, M. Can Driver Education Be Improved by Computer Based Training of Cognitive Skills? Accid. Anal. Prev. 2013, 50, 1185–1192. [Google Scholar] [CrossRef]
  45. Weiss, T.; Petzoldt, T.; Bannert, M.; Krems, J. Calibration as Side Effect? Computer-Based Learning in Driver Education and the Adequacy of Driving-Task-Related Self-Assessments. Transp. Res. Part F Traffic Psychol. Behav. 2013, 17, 63–74. [Google Scholar] [CrossRef]
  46. Isler, R.B.; Starkey, N.J.; Williamson, A.R. Video-Based Road Commentary Training Improves Hazard Perception of Young Drivers in a Dual Task. Accid. Anal. Prev. 2009, 41, 445–452. [Google Scholar] [CrossRef]
  47. Putri, Z.H. An Application of the Gamified E-Learning Platform to Improve Road Safety Education in Indonesia: Case Study Jakarta. Master’s Thesis, Hasselt University, Hasselt, Belgium, 2020. [Google Scholar]
  48. Pham, N.H. An Application of the Gamified E-Learning Platform to Improve Road Safety Education in Vietnam. Master’s Thesis, Hasselt University, Hasselt, Belgium, 2019. [Google Scholar]
  49. Mayaleh, O.K. Study the R2S Education Platform in Case of Palestine Omar. Master’s Thesis, Hasselt University, Hasselt, Belgium, 2021. [Google Scholar]
  50. Nawaz, I.; Cuenen, A.; Wets, G.; Paul, R.; Ahmed, T.; Janssens, D. Evaluating the Effectiveness of an Online Gamified Traffic Safety Education Platform for Adolescent Motorcyclists in Pakistan. Appl. Sci. 2024, 14, 8590. [Google Scholar] [CrossRef]
  51. Nah, F.F.-H.; Zeng, Q.; Telaprolu, V.R.; Ayyappa, A.P.; Eschenbrenner, B. Gamification of Education: A Review of Literature. In Proceedings of the HCI in Business; Nah, F.F.-H., Ed.; Springer International Publishing: Cham, Switzerland, 2014; pp. 401–409. [Google Scholar]
  52. Koivisto, J.; Hamari, J. The Rise of Motivational Information Systems: A Review of Gamification Research. Int. J. Inf. Manag. 2019, 45, 191–210. [Google Scholar] [CrossRef]
  53. Gee, J.P. What Video Games Have to Teach Us about Learning and Literacy. Comput. Entertain. 2003, 1, 20. [Google Scholar] [CrossRef]
  54. Hamari, J.; Koivisto, J.; Sarsa, H. Does Gamification Work?—A Literature Review of Empirical Studies on Gamification. In Proceedings of the 2014 47th Hawaii International Conference on System Sciences, Waikoloa, HI, USA, 6–9 January 2014; IEEE: Waikoloa, HI, USA, 2014; pp. 3025–3034. [Google Scholar]
  55. Sailer, M.; Hense, J.U.; Mayr, S.K.; Mandl, H. How Gamification Motivates: An Experimental Study of the Effects of Specific Game Design Elements on Psychological Need Satisfaction. Comput. Hum. Behav. 2017, 69, 371–380. [Google Scholar] [CrossRef]
  56. Domínguez, A.; Saenz-de-Navarrete, J.; de-Marcos, L.; Fernández-Sanz, L.; Pagés, C.; Martínez-Herráiz, J.-J. Gamifying Learning Experiences: Practical Implications and Outcomes. Comput. Educ. 2013, 63, 380–392. [Google Scholar] [CrossRef]
  57. Clark, R.C.; Mayer, R.E. e-Learning and the Science of Instruction: Proven Guidelines for Consumers and Designers of Multimedia Learning, 1st ed.; Wiley: Hoboken, NJ, USA, 2016; ISBN 978-1-119-15866-0. [Google Scholar]
  58. Rosenbloom, T.; Haviv, M.; Peleg, A.; Nemrodov, D. The Effectiveness of Road-Safety Crossing Guards: Knowledge and Behavioral Intentions. Saf. Sci. 2008, 46, 1450–1458. [Google Scholar] [CrossRef]
  59. Thenmozhi, P. Assess the Knowledge and Practice on Road Safety Regulations among Primary School Children in Rural Community. Int. J. Med. Sci. 2016, 3, 1–4. [Google Scholar] [CrossRef]
  60. Lehtonen, E.; Airaksinen, J.; Kanerva, K.; Rissanen, A.; Ränninranta, R.; Åberg, V. Game-Based Situation Awareness Training for Child and Adult Cyclists. R. Soc. Open Sci. 2017, 4, 160823. [Google Scholar] [CrossRef]
  61. Mirza, K.A.; Bhadrinath, B.R.; Goodyer, I.M.; Gilmour, C. Post-Traumatic Stress Disorder in Children and Adolescents Following Road Traffic Accidents. Br. J. Psychiatry 1998, 172, 443–447. [Google Scholar] [CrossRef]
  62. Preiss, R.; Williams, D. Childhood, Education and the Stage in Early Modern England; Cambridge University Press: Cambridge, UK, 2017; ISBN 978-1-108-16165-7. [Google Scholar]
  63. Serin, H. Virtual Reality in Education from the Perspective of Teachers. Amazon. Investig. 2020, 9, 291–303. [Google Scholar] [CrossRef]
  64. Mikropoulos, T.A.; Natsis, A. Educational Virtual Environments: A Ten-Year Review of Empirical Research (1999–2009). Comput. Educ. 2011, 56, 769–780. [Google Scholar] [CrossRef]
  65. Merchant, Z.; Goetz, E.T.; Cifuentes, L.; Keeney-Kennicutt, W.; Davis, T.J. Effectiveness of Virtual Reality-Based Instruction on Students’ Learning Outcomes in K-12 and Higher Education: A Meta-Analysis. Comput. Educ. 2014, 70, 29–40. [Google Scholar] [CrossRef]
  66. Mayer, R.E. Multimedia Learning, 2nd ed.; Cambridge University Press: Cambridge, UK, 2009; ISBN 978-0-521-51412-5. [Google Scholar]
  67. Belgian Federal Government the Communes|Belgium.Be. Available online: https://www.belgium.be/en/about_belgium/government/Communes (accessed on 21 July 2025).
  68. Zeuwts, L.; Vansteenkiste, P.; Cardon, G.; Lenoir, M. Development of Cycling Skills in 7- to 12-Year-Old Children. Traffic Inj. Prev. 2016, 17, 736–742. [Google Scholar] [CrossRef]
  69. Yannis, G.; Nikolaou, D.; Laiou, A.; Stürmer, Y.A.; Buttler, I.; Jankowska-Karpa, D. Vulnerable Road Users: Cross-Cultural Perspectives on Performance and Attitudes. IATSS Res. 2020, 44, 220–229. [Google Scholar] [CrossRef]
  70. Ye, Z. Natural Characteristics of the Safety Behavior of College Students. Liaoning High. Vocat. Tech. Inst. J. 2011. Available online: https://www.semanticscholar.org/paper/Natural-Characteristics-of-the-Safety-Behavior-of-Ye/b182902ca59624e6325c4050b05ebc7e6d7fe7ee (accessed on 29 June 2025).
  71. Dai, B.; Dadashova, B. Review of Contextual Elements Affecting Bicyclist Safety. J. Transp. Health 2021, 20, 101013. [Google Scholar] [CrossRef]
  72. Edwards, J.R.D.; Davey, J.; Armstrong, K.A. Profiling Contextual Factors Which Influence Safety in Heavy Vehicle Industries. Accid. Anal. Prev. 2014, 73, 340–350. [Google Scholar] [CrossRef] [PubMed]
  73. Eksler, V. Measuring and Understanding Road Safety Performance at Local Territorial Level. Saf. Sci. 2010, 48, 1197–1202. [Google Scholar] [CrossRef]
  74. Cheng, Y.-Q.; Mansor, S.; Chin, J.-J.; Karim, H.A. Driving Simulator for Drivers Education with Artificial Intelligence Traffic and Virtual Reality: A Review. In Proceedings of the 8th International Conference on Computational Science and Technology, Labuan, Malaysia, 28–29 August 2021; Alfred, R., Lim, Y., Eds.; Springer: Singapore, 2022; pp. 483–494. [Google Scholar]
  75. Obregón-Biosca, S.A.; Romero-Navarrete, J.A.; Mendoza-Sanchez, J.F.; Betanzo-Quezada, E. Impact of Mobility Induced by Urban Sprawl: Case Study of the Querétaro Metropolitan Area. J. Urban Plan. Dev. 2016, 142, 05015005. [Google Scholar] [CrossRef]
  76. Halim, E.; Joshua; Mailangkay, A.; Nely; Sandi, R.T.; Poba-Nzaou, P. The Impact of Gamification on Customer Engagement in Small and Medium Enterprises. In Proceedings of the 2024 3rd International Conference on Creative Communication and Innovative Technology (ICCIT), Tangerang, Indonesia, 7 August 2024; IEEE: Tangerang, Indonesia, 2024; pp. 1–8. [Google Scholar]
  77. Rigole, N.; Hollingsworth, L.; Ray, J. Badges and Gamification In eLearning: Effects on Achievement and Engagement. In Proceedings of the SAIS 2017 Proceedings, Karlskrona, Sweden, 15–16 May 2017. [Google Scholar]
  78. Reyes-Muñoz, A.; Guerrero-Ibáñez, J. Vulnerable Road Users and Connected Autonomous Vehicles Interaction: A Survey. Sensors 2022, 22, 4614. [Google Scholar] [CrossRef]
  79. Zeuwts, L.H.R.H.; Vanhuele, R.; Vansteenkiste, P.; Deconinck, F.J.A.; Lenoir, M. Using an Immersive Virtual Reality Bicycle Simulator to Evaluate Hazard Detection and Anticipation of Overt and Covert Traffic Situations in Young Bicyclists. Virtual Real. 2023, 27, 1507–1527. [Google Scholar] [CrossRef]
Figure 1. Aerial traffic scenario from the R2S platform. Left: “Where do you see a traffic violation?” Right: Focused view within the orange rectangle.
Applsci 15 08557 g001
Figure 2. Take a Bike Ride (Left), Take a Car Ride (Right).
Applsci 15 08557 g002
Figure 3. Mean scores across Gender and school years.
Applsci 15 08557 g003
Figure 4. Student satisfaction with the R2S education platform.
Applsci 15 08557 g004
Figure 5. Behavioral non-compliance trends: distraction and red-light infractions.
Applsci 15 08557 g005
Figure 6. Compliance and speeding behavior among students.
Applsci 15 08557 g006
Figure 7. Self-assessment of traffic knowledge and skills.
Applsci 15 08557 g007
Table 1. Demographic statistics of secondary school students.
Demographic Data(N = 1264)
GenderNumber (%)
Male550 (44)
Female714 (56)
School YearNumber (%)
3rd year418 (33)
4th year420 (33)
5th year207 (16)
6th year219 (18)
Table 2. Score distribution across different modules for students.
ModulesSub ModulesNumberMean/SubmoduleStd DevMin ScoresMax Scores
Traffic KnowledgeTest your knowledge about the traffic rules 119970.3517.350100
Learn from an expert!62875.2516.130100
Mean Score of Module72.80
Situation AwarenessLook carefully around you in traffic!78177.9116.9550100
Mean Score of Module77.91
Risk DetectionLook for the danger!81062.1517.330100
Traffic in everyday life!61877.6224.740100
Take a look through the eyes of a drone!69558.5924.130100
Mean Score of Module66.12
Risk ManagementBe careful with the risks in traffic74281.8915.3410100
Mean Score of Module81.89
Virtual BehaviorTake a car ride!60281.2820.270100
Take a bike ride!69796.695.8560100
Mean Score of Module88.99
Table 3. Summary of mean scores and variability in each module by gender.
GenderModuleSub-ModulesMean/
Module
Mean/
Submodule
Std Dev
MaleTraffic Knowledge Test your knowledge about the traffic rules 69.1067.3619.33
Learn from an expert!70.8516.53
Situation Awareness Look carefully around you in traffic!75.5875.5815.58
Risk Detection Find the danger67.8759.7722.15
Traffic in everyday life!79.7622.84
Take a look through the eyes of a drone!64.1027.60
Risk Management Be careful with the risks in traffic77.0077.0020.53
Virtual Behavior Take a car ride!86.7676.4019.98
Take a bike ride!97.126.96
Overall Mean 75.26
FemaleTraffic KnowledgeTest your knowledge about the traffic rules71.9669.1217.08
Learn from an expert!74.8015.45
Situation AwarenessLook carefully around you in traffic!79.6579.6516.58
Risk DetectionFind the danger65.7762.1518.99
Traffic in everyday life!76.4727.72
Take a look through the eyes of a drone!58.6924.46
Risk ManagementBe careful with the risks in traffic83.0283.0212.91
Virtual behaviorTake a car ride!89.3982.5620.25
Take a bike ride!96.235.53
Overall Mean 77.96
Table 4. Performance of municipalities and cities across different RSE modules.
City/MunicipalityNMeanMean DifferenceStd. DeviationStd. Error Mean
ScoresCity83575.265.3019.890.69
Municipality42969.9522.551.09
Table 5. Pairwise comparison among the school year using the Tukey method.
Multiple Comparisons
Tukey HSD
(I) School Year(J) School YearMean Difference (I-J)Std. ErrorSig.95% Confidence Interval
Lower BoundUpper Bound
34−6.19 *1.43<0.001 *−9.87−2.51
5−5.95 *1.760.004 *−10.47−1.42
6−9.13 *1.72<0.001 *−13.57−4.67
436.19 *1.43<0.001 *2.519.87
50.241.760.999−4.284.76
6−2.941.720.323−7.381.50
535.95 *1.760.004 *1.4210.47
4−0.241.760.999−4.764.28
6−3.182.010.388−8.341.98
639.13 *1.73<0.001 *4.6713.57
42.941.730.323−1.507.38
53.182.010.388−1.988.34
* The mean difference is significant at the 0.05 level.
Table 6. Demographic statistics of students who participated in a questionnaire.
Demographic Data(N = 212)
GenderNumber (%)
Male62 (29)
Female143 (68)
School YearsNumber (%)
3rd year31 (15)
4th year68 (32)
5th year57 (27)
6th year56 (26)
Mode of Transport (Multiple choice)Number
Pedestrian185
Cyclist120
CarPassenger166
Driver32
MopedPassenger10
Driver7
Disclaimer/Publisher’s Note: The statements, opinions and data contained in all publications are solely those of the individual author(s) and contributor(s) and not of MDPI and/or the editor(s). MDPI and/or the editor(s) disclaim responsibility for any injury to people or property resulting from any ideas, methods, instructions or products referred to in the content.

