
HybridFilm: A Mixed-Reality History Tool Enabling Interoperability Between Screen Space and Immersive Environments

Abstract
1. Introduction
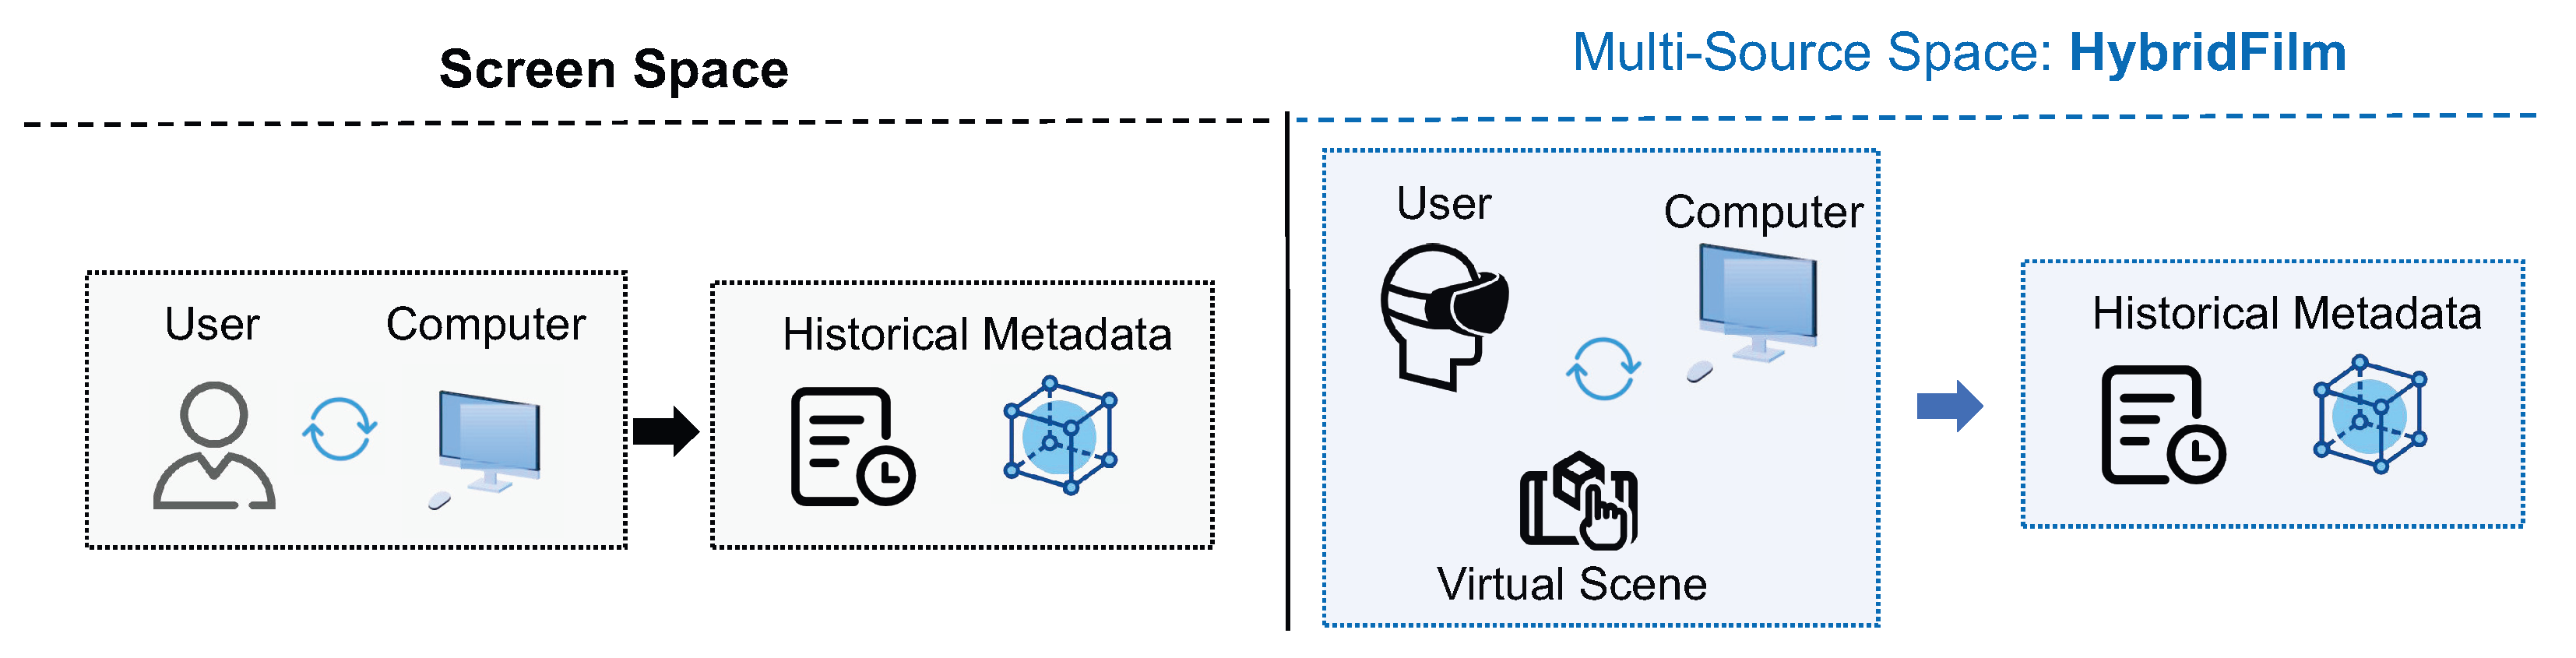
- Establishment of a Multi-Source Spatial Fusion Framework: This framework enhances desktop operations by minimizing the interference of immersive reality components, thus preventing disruptions to user workflows while interacting with desktop applications.
- Design of a Multi-Source Spatial Historical Data Visualization and Interaction Scheme: Based on the “focus + context” model, this design utilizes spatial cognition to facilitate a deeper understanding of historical states and their temporal relationships.
- Usability and Effectiveness Verification: Building upon the historical tools used in molecular 3D model analysis software, the usability and effectiveness of HybridFilm are validated through practical assessment.
2. Related Work
2.1. Graphical History Visualization
2.2. Combination of MR and Screen Space
2.3. Immersive Visualization and Interaction
3. HybridFilm
3.1. Multi-Source Spatial Fusion Framework Design
3.1.1. Date of Communication
3.1.2. Communication
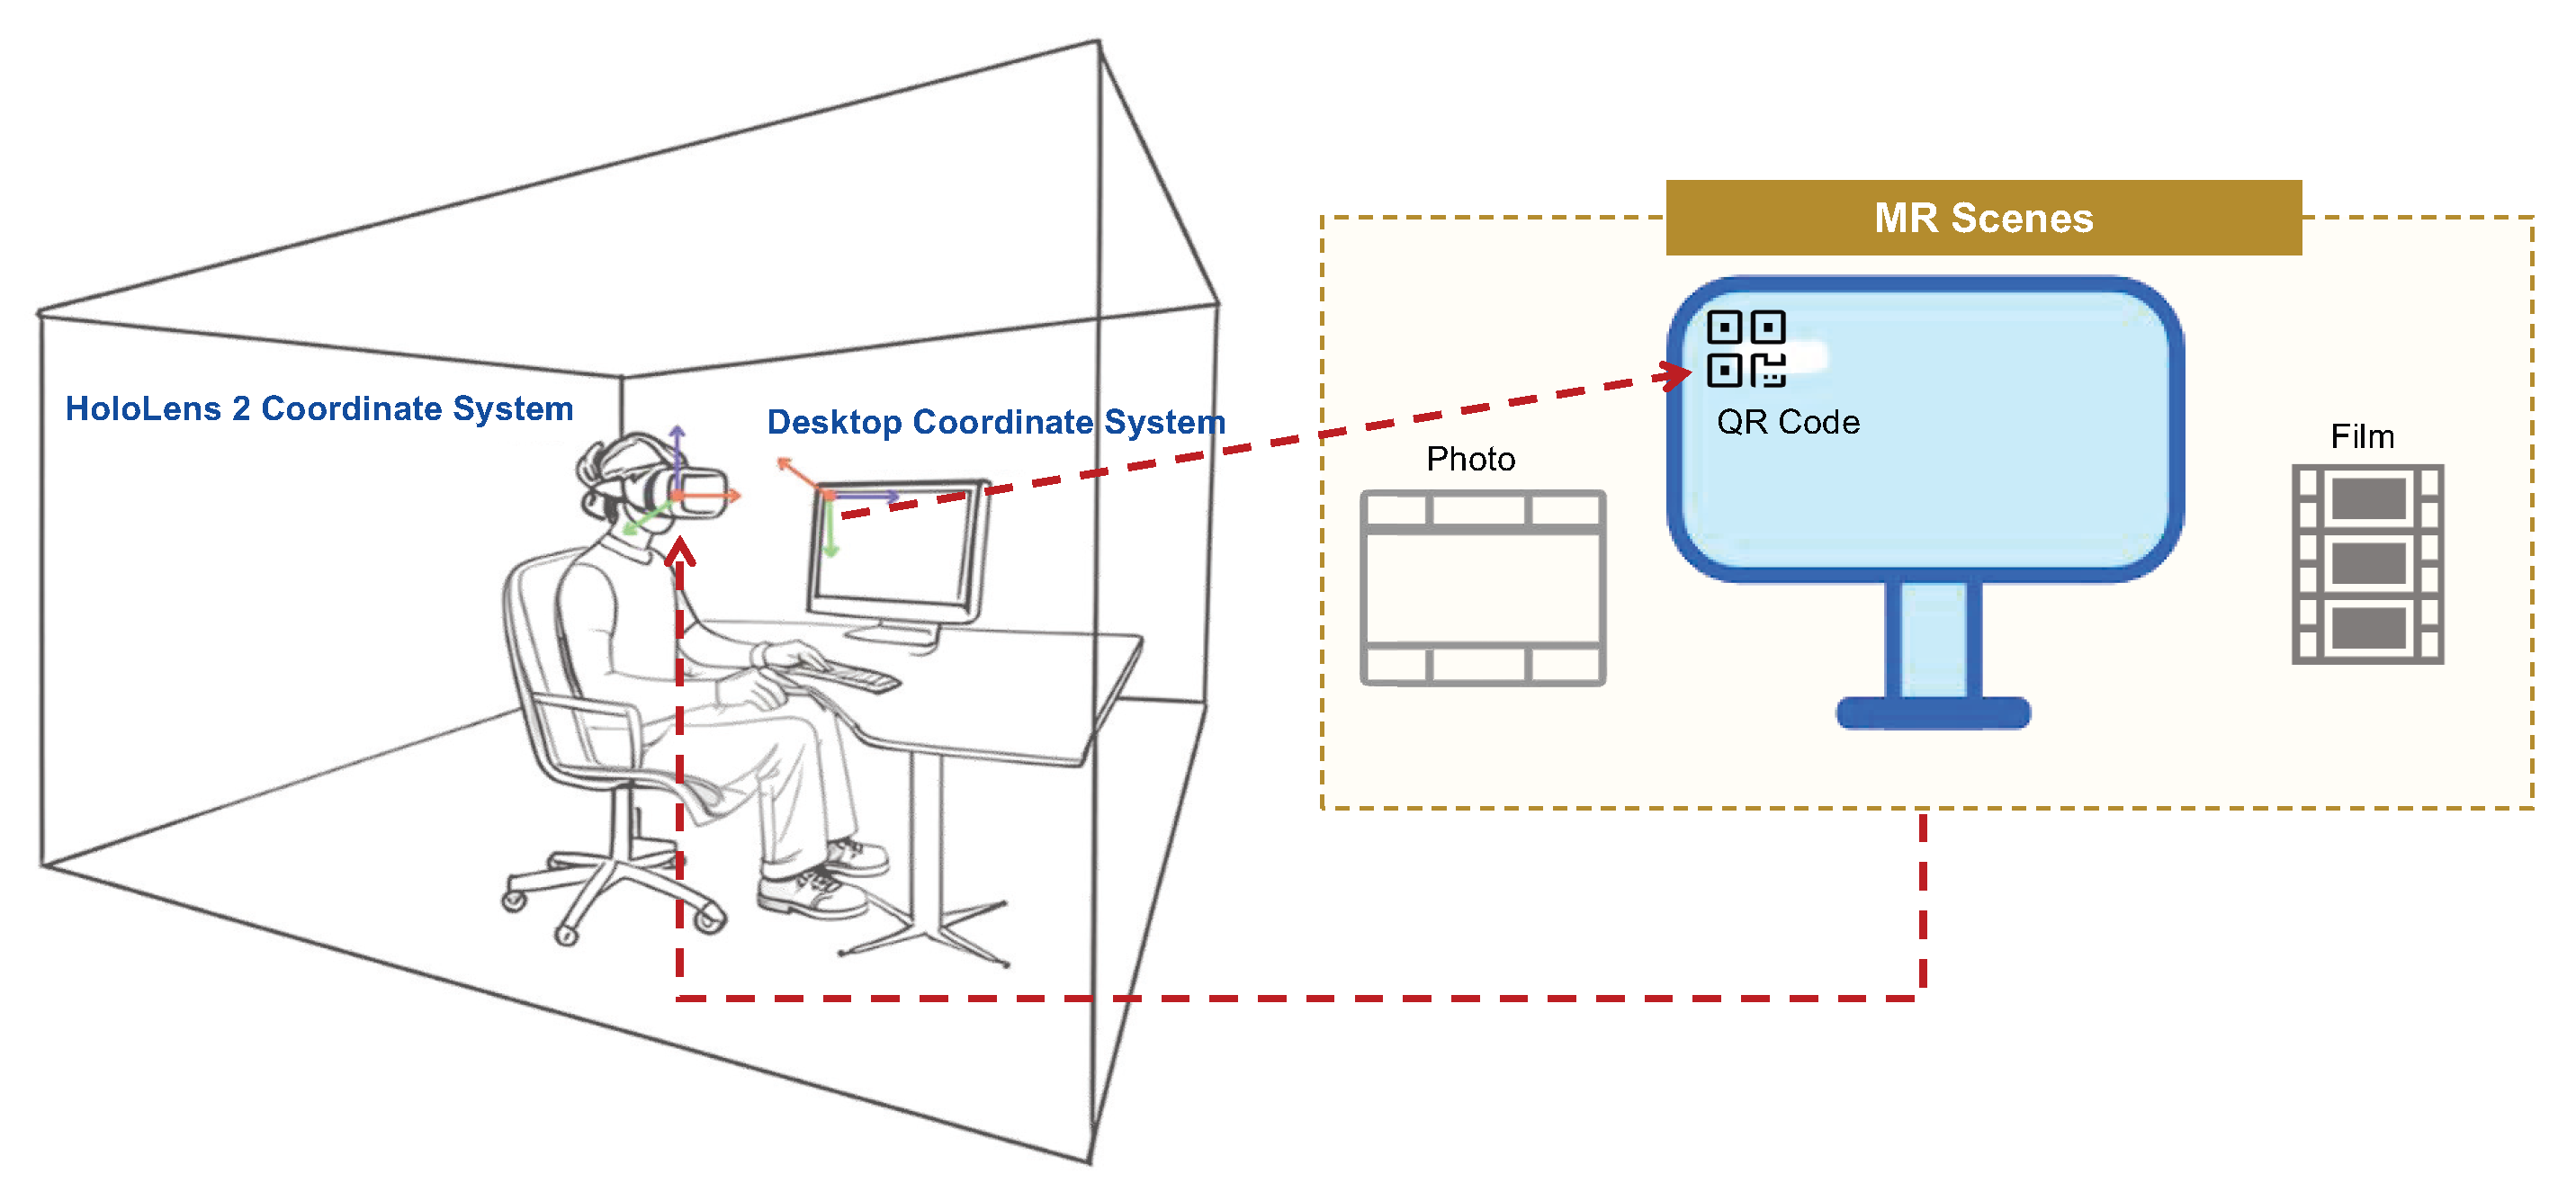
3.1.3. Spatial Positioning
3.1.4. Historical Mechanism Design
3.2. Visualization Design
3.3. Interaction Design
3.3.1. Conversion
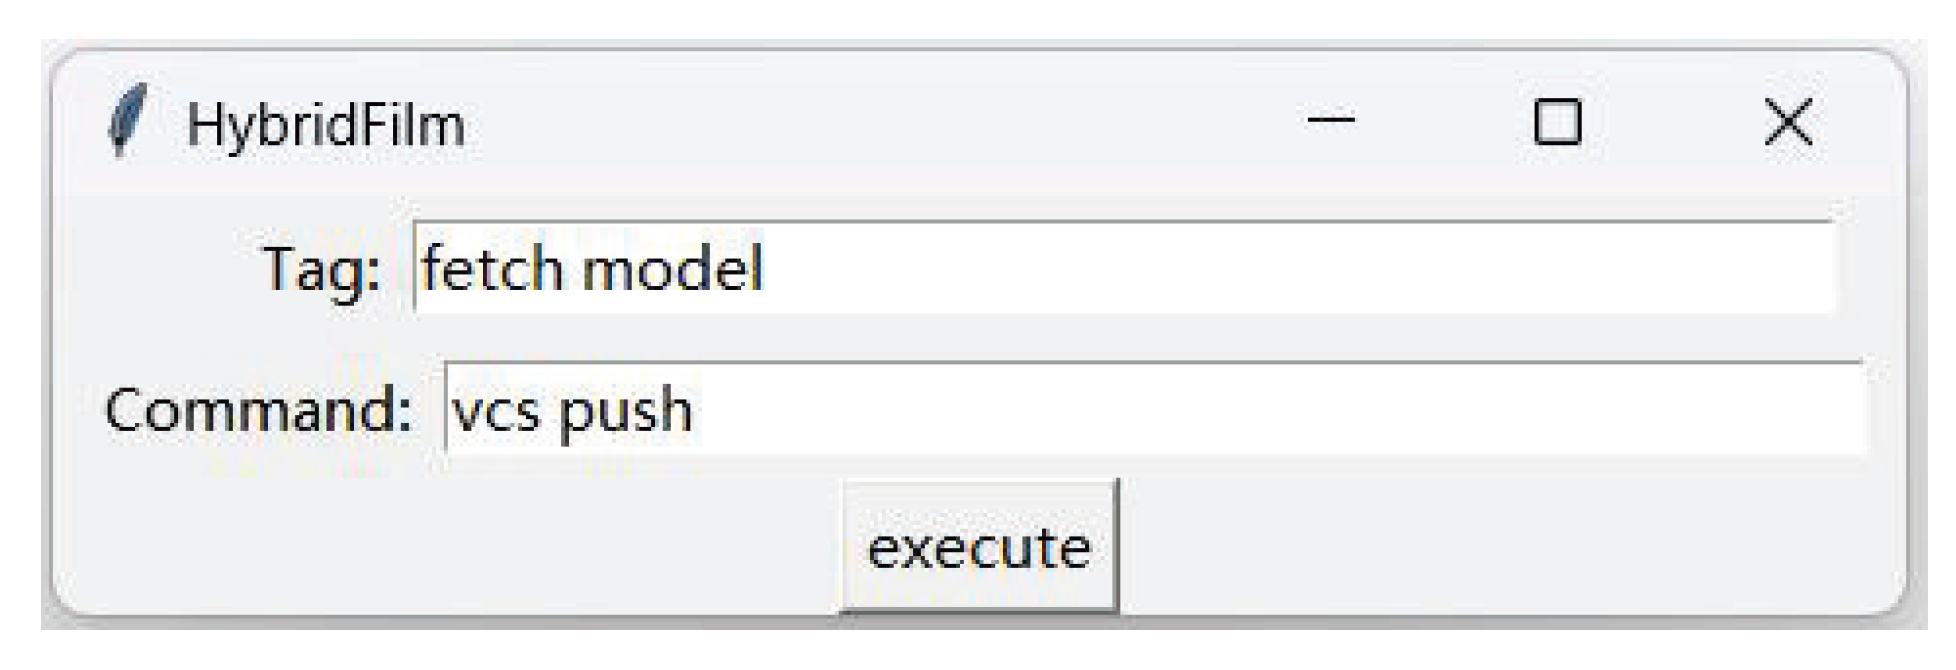
- Submitting: Interactions requiring detailed operations or text input have been shown to be more easily accomplished on the desktop [48]. To maintain operational consistency, we designed the submission interaction through the graphical interface on the desktop (Figure 7). First, the user fills in the Tag box with a textual prompt, then enters the command in the Command box to submit the scenario. The system then performs an automatic operation to generate a new node, which is appended to the DAG, switches the current node, and finally refreshes the visualization of the “film” in the immersive space. Additionally, the Command box supports the entry of other commands that are recognized by the system.
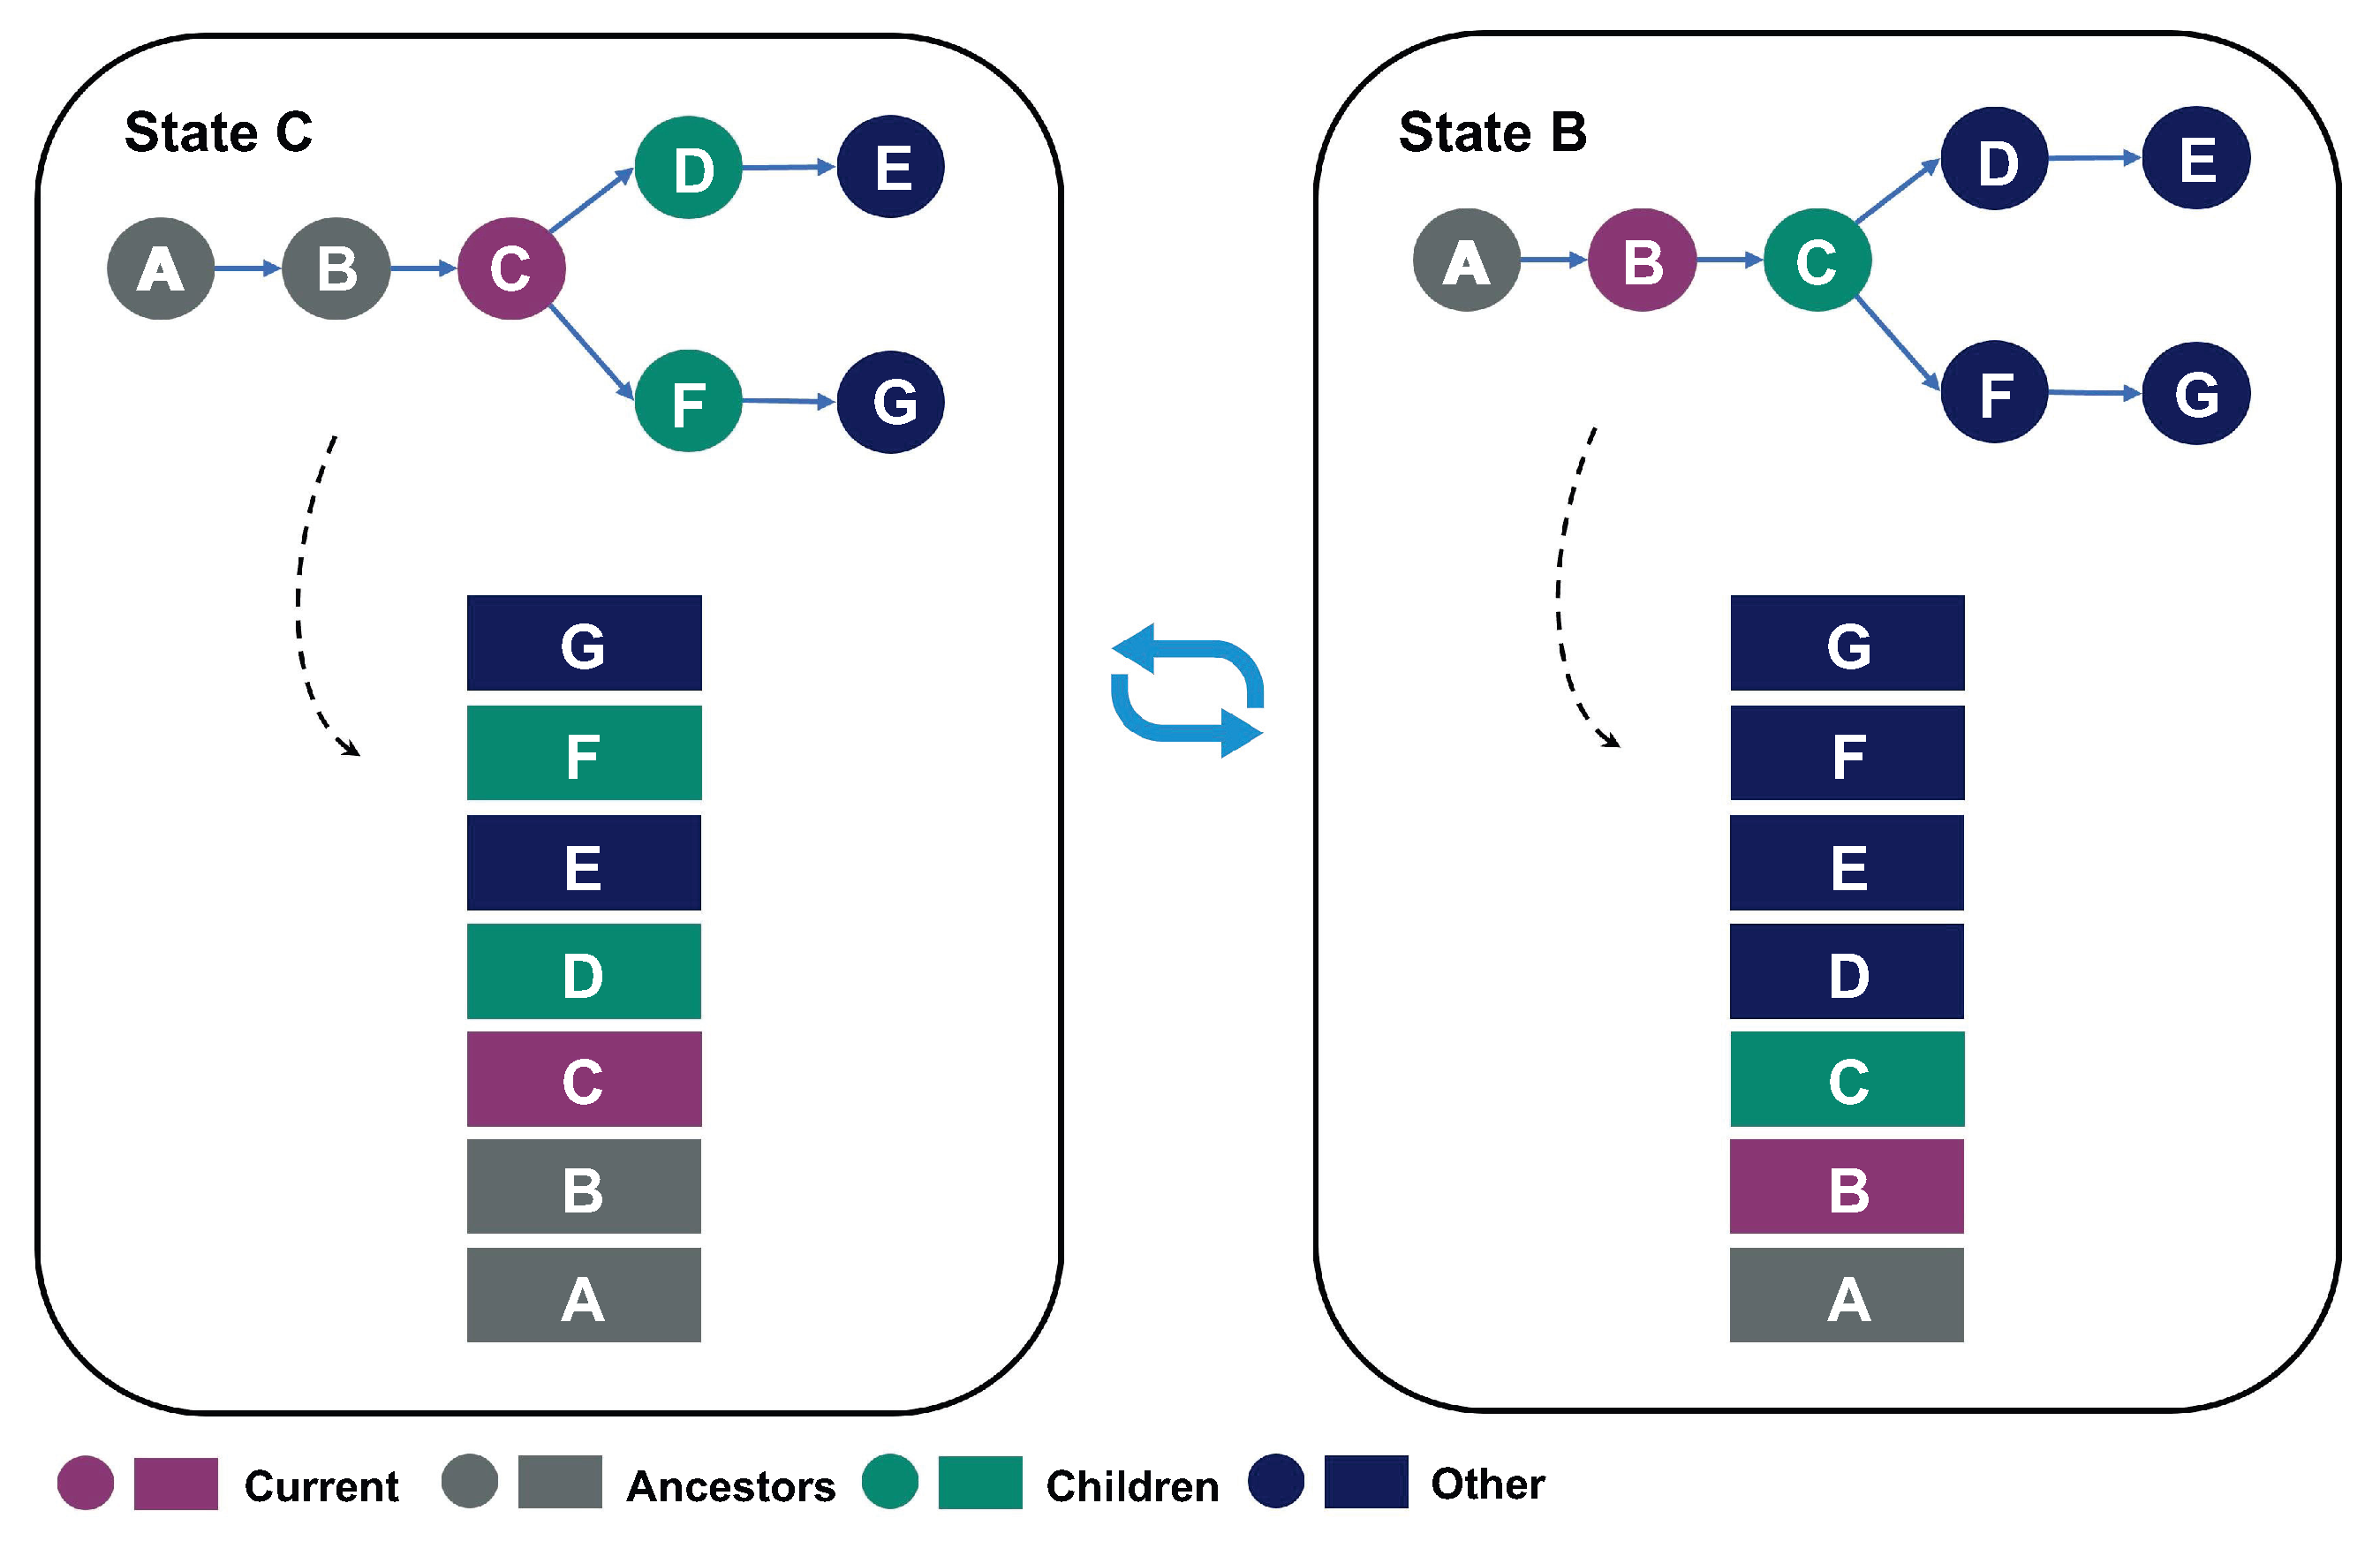
- Switching: The user selects an item from the history list, then chooses the generated “photo” or model, drags it to the screen, and touches it (Figure 8). The system then performs a series of automatic operations: it first switches the current node, then switches the application scene, and finally refreshes the visualization of the “roll of film” in the immersive space. This interaction strategy is similar to the approaches proposed by Mohammad et al. [17] and Wu et al. [44]. It leverages the existing physical support and space of real-world objects for intuitive interaction, blending the digital and physical boundaries while utilizing metaphors in augmented reality to embody the abstraction process.
3.3.2. Selection
- Opening: when and , , .
- Closing: when and , , .
3.3.3. Adjustment
- Scrolling up: when and and .
- Scrolling down: when and and .
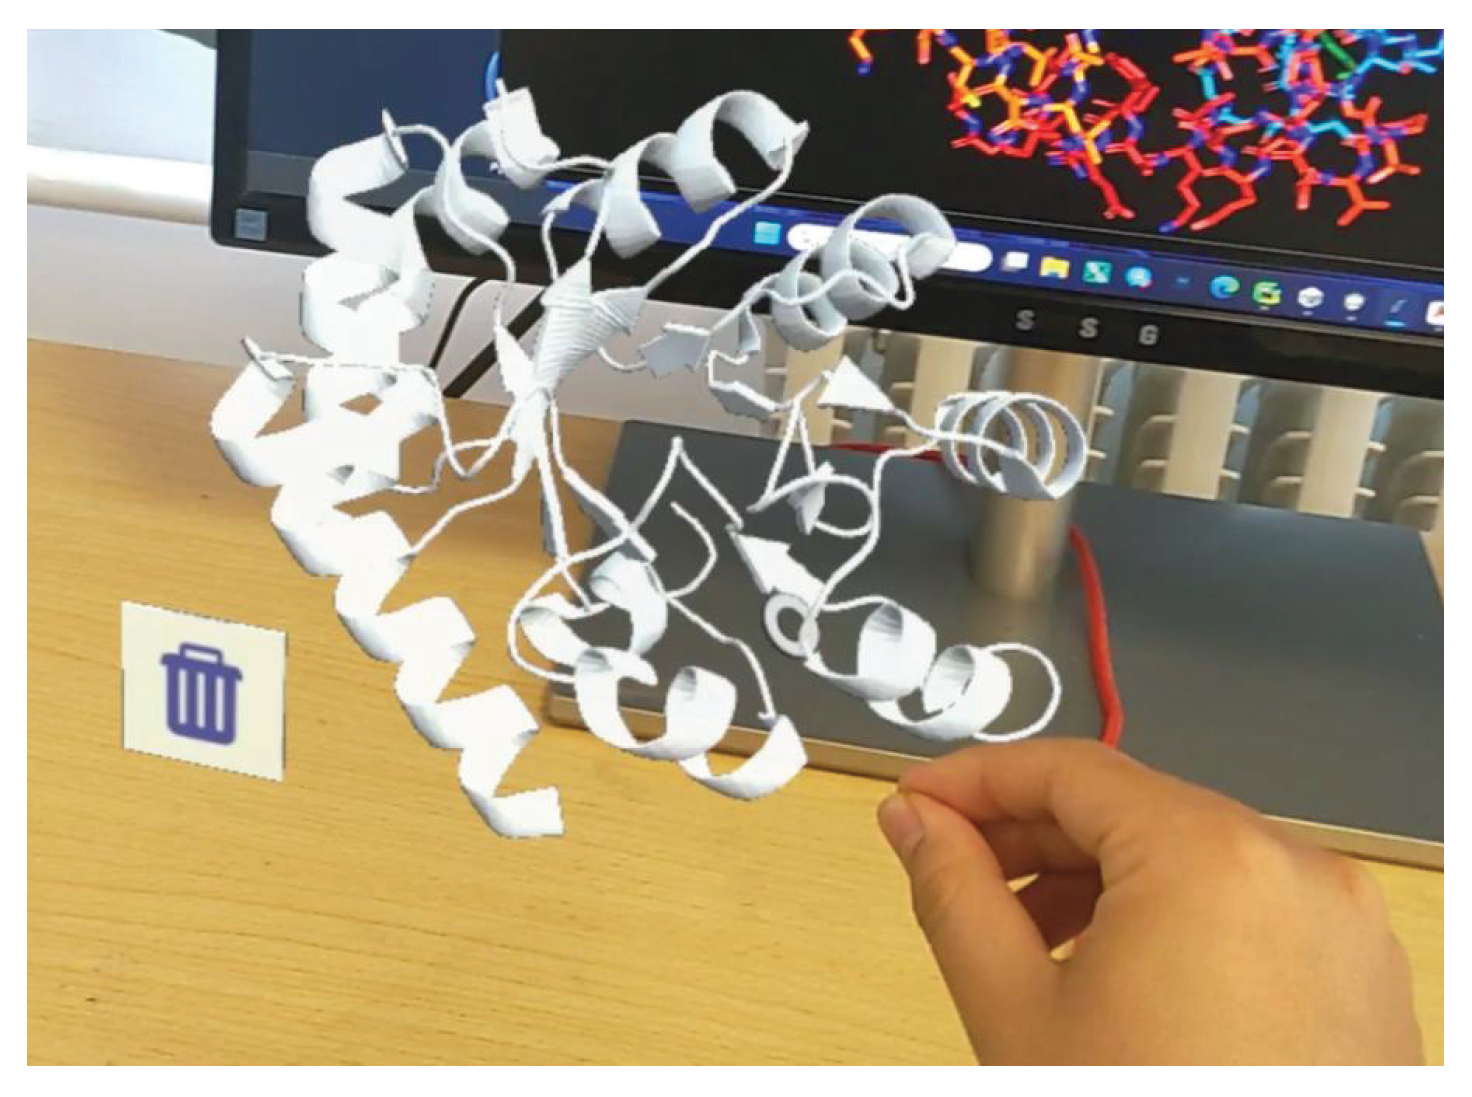
3.3.4. Removal
4. Experiments and Results
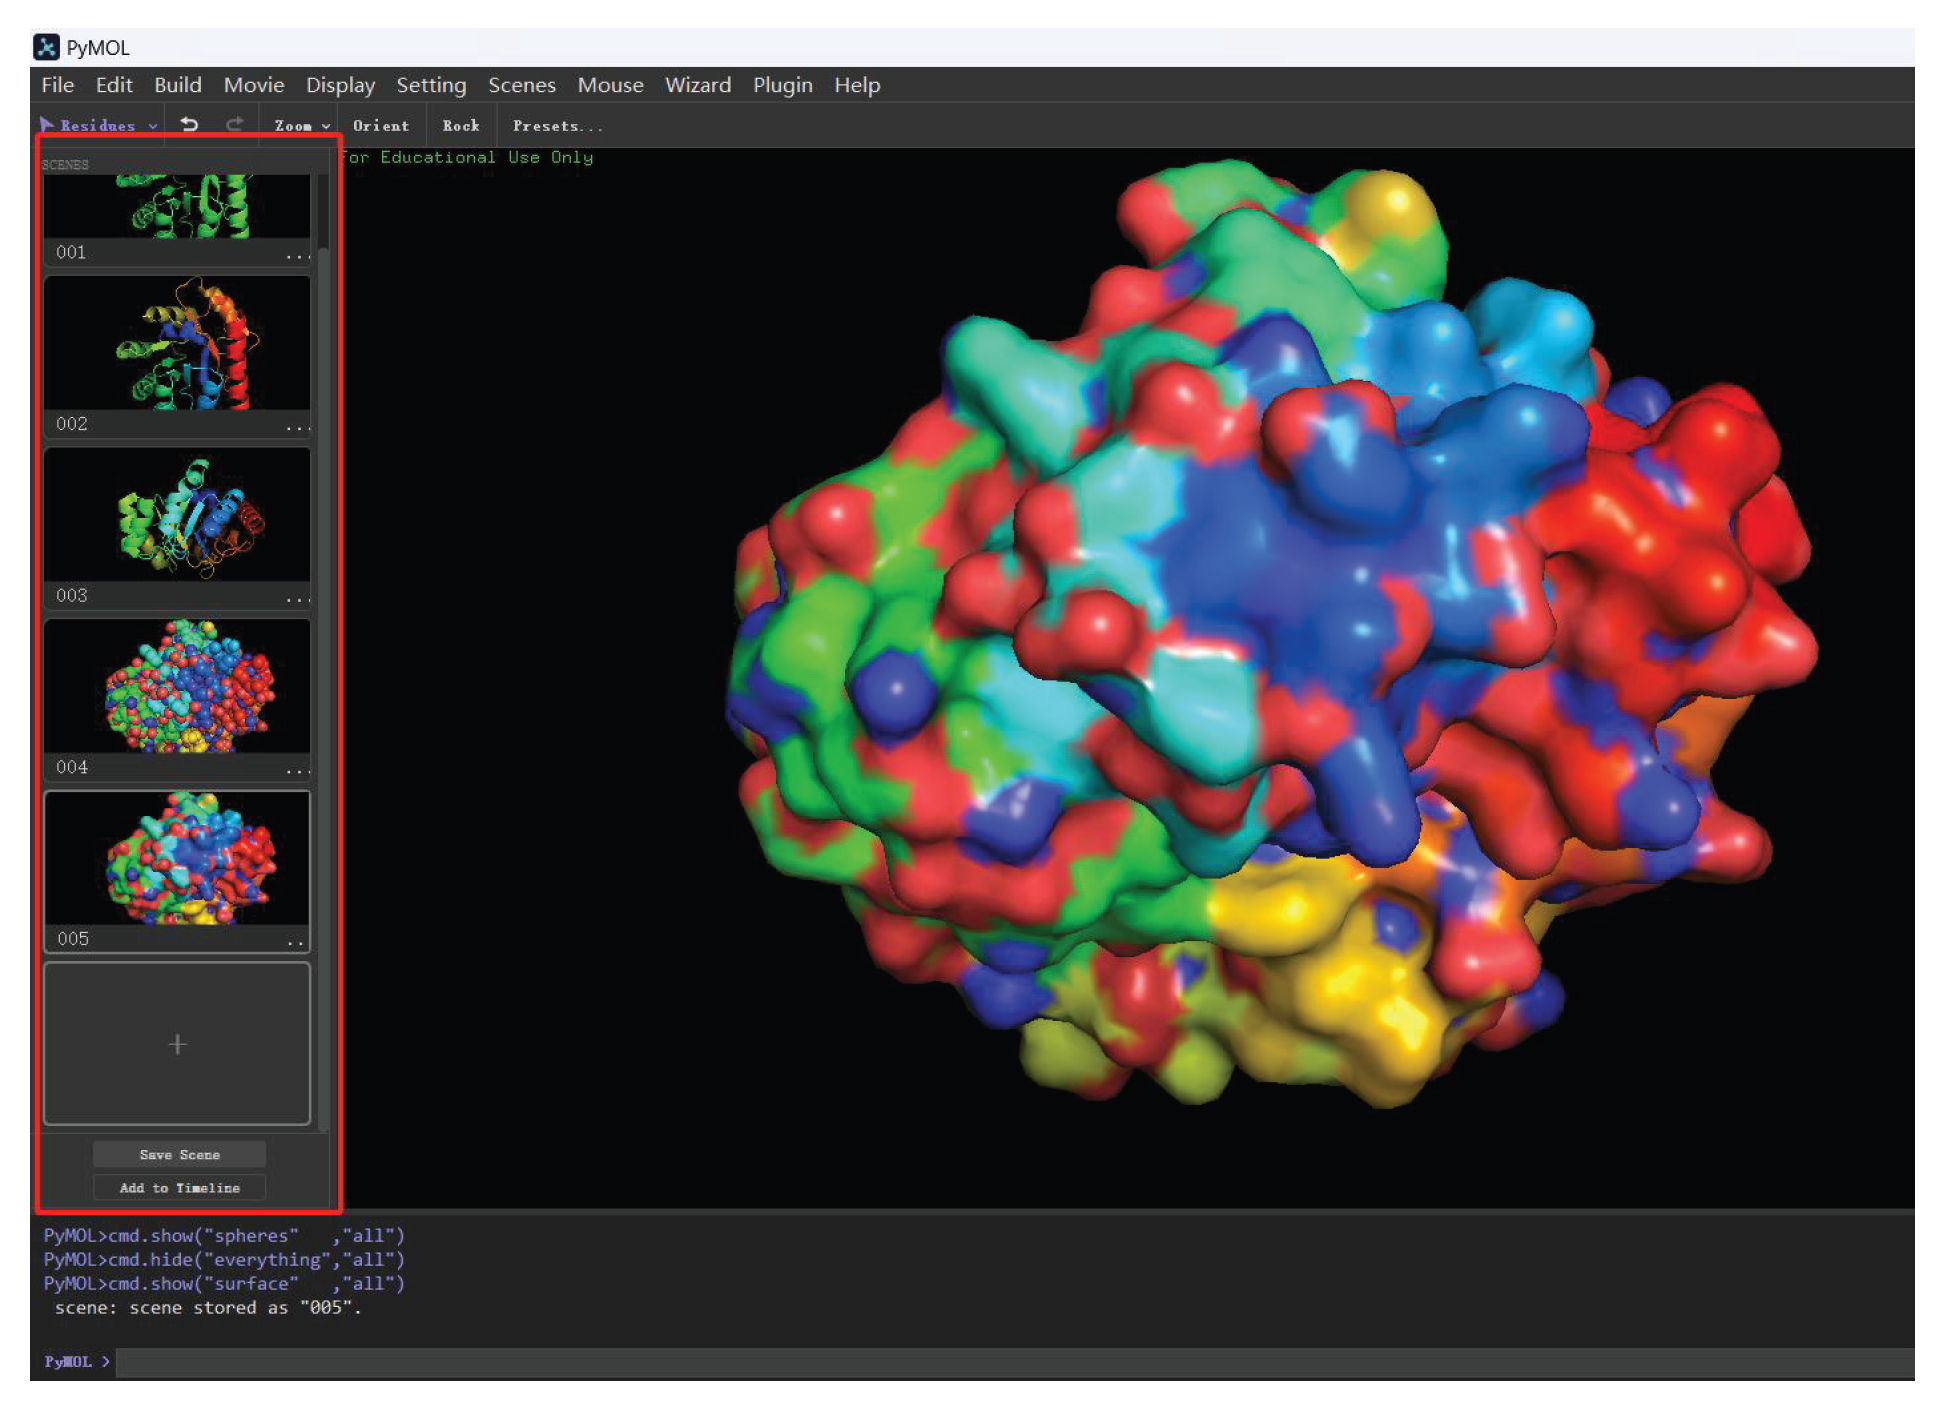
4.1. Desktop Application for Experiment
- It supports both 2D and 3D content.
- It offers an API that allows users to write scripts, making it highly extensible and compatible with our program architecture.
- It includes the traditional desktop history tool, PyMOL Scenes, which facilitates comparability.
4.2. Experimental Setup and Participants
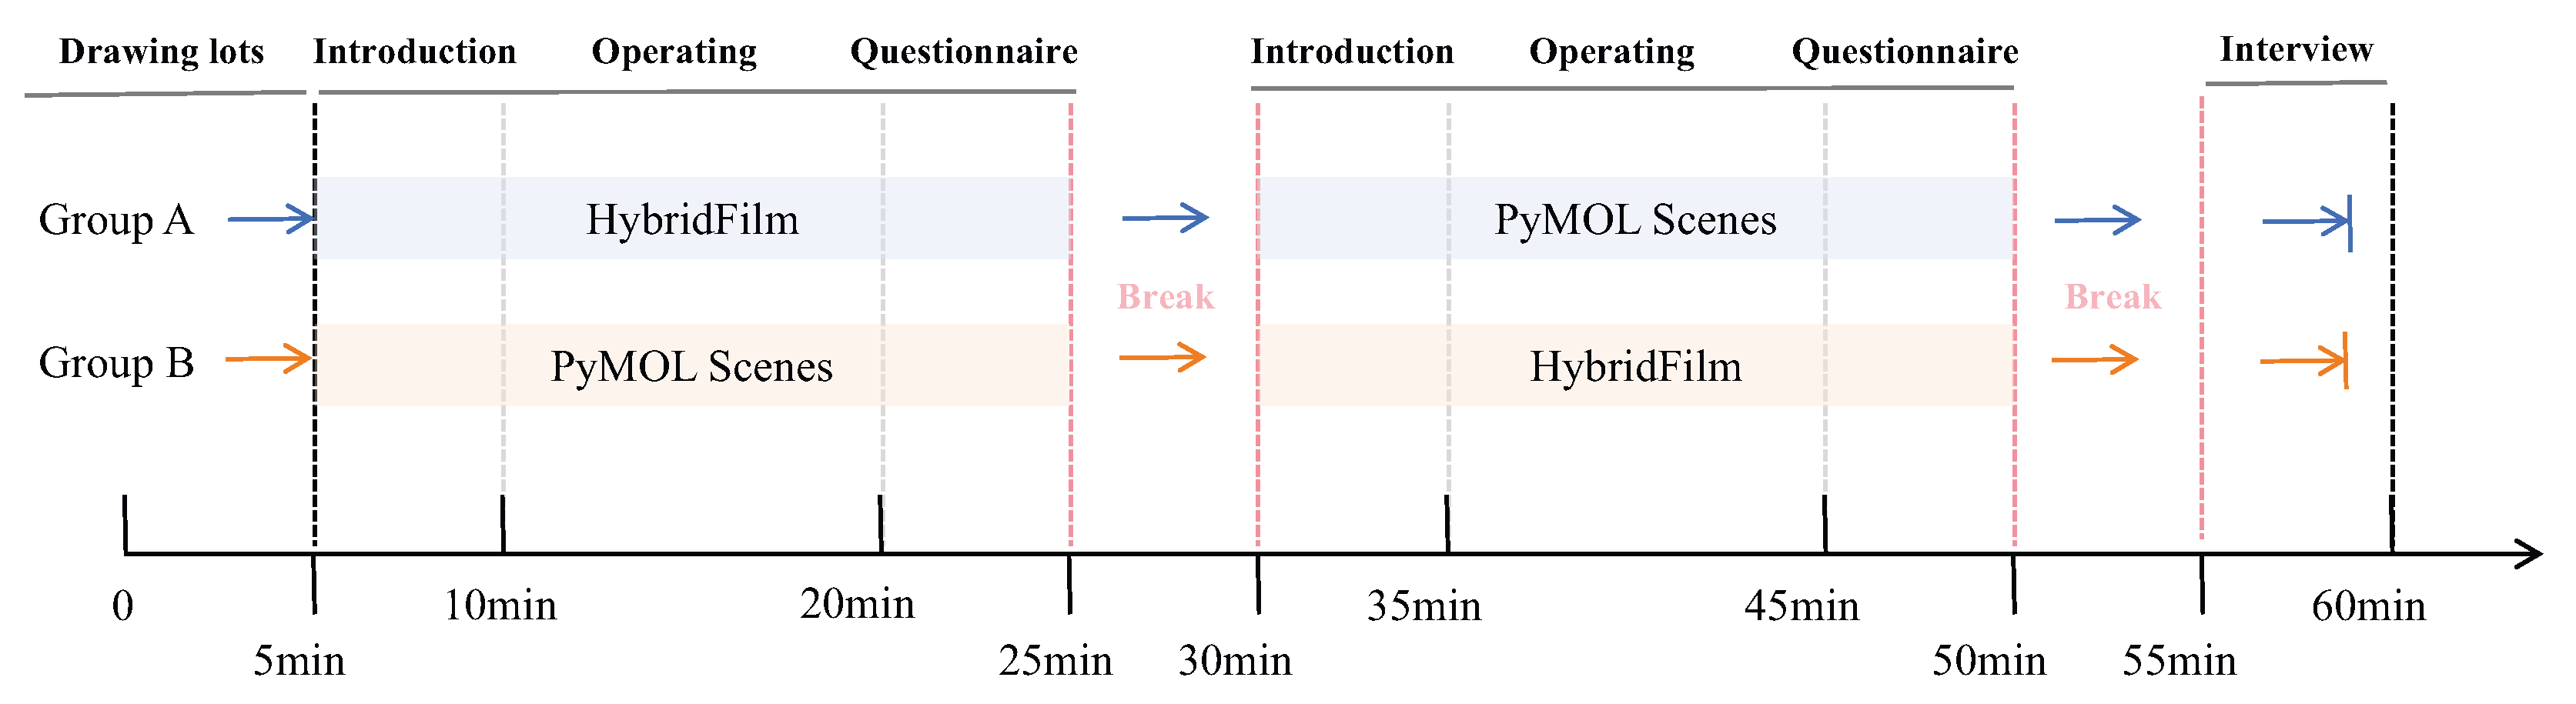
4.3. Experimental Procedure
4.4. Experimental Results
4.4.1. Usability and Utility of HybridFilm
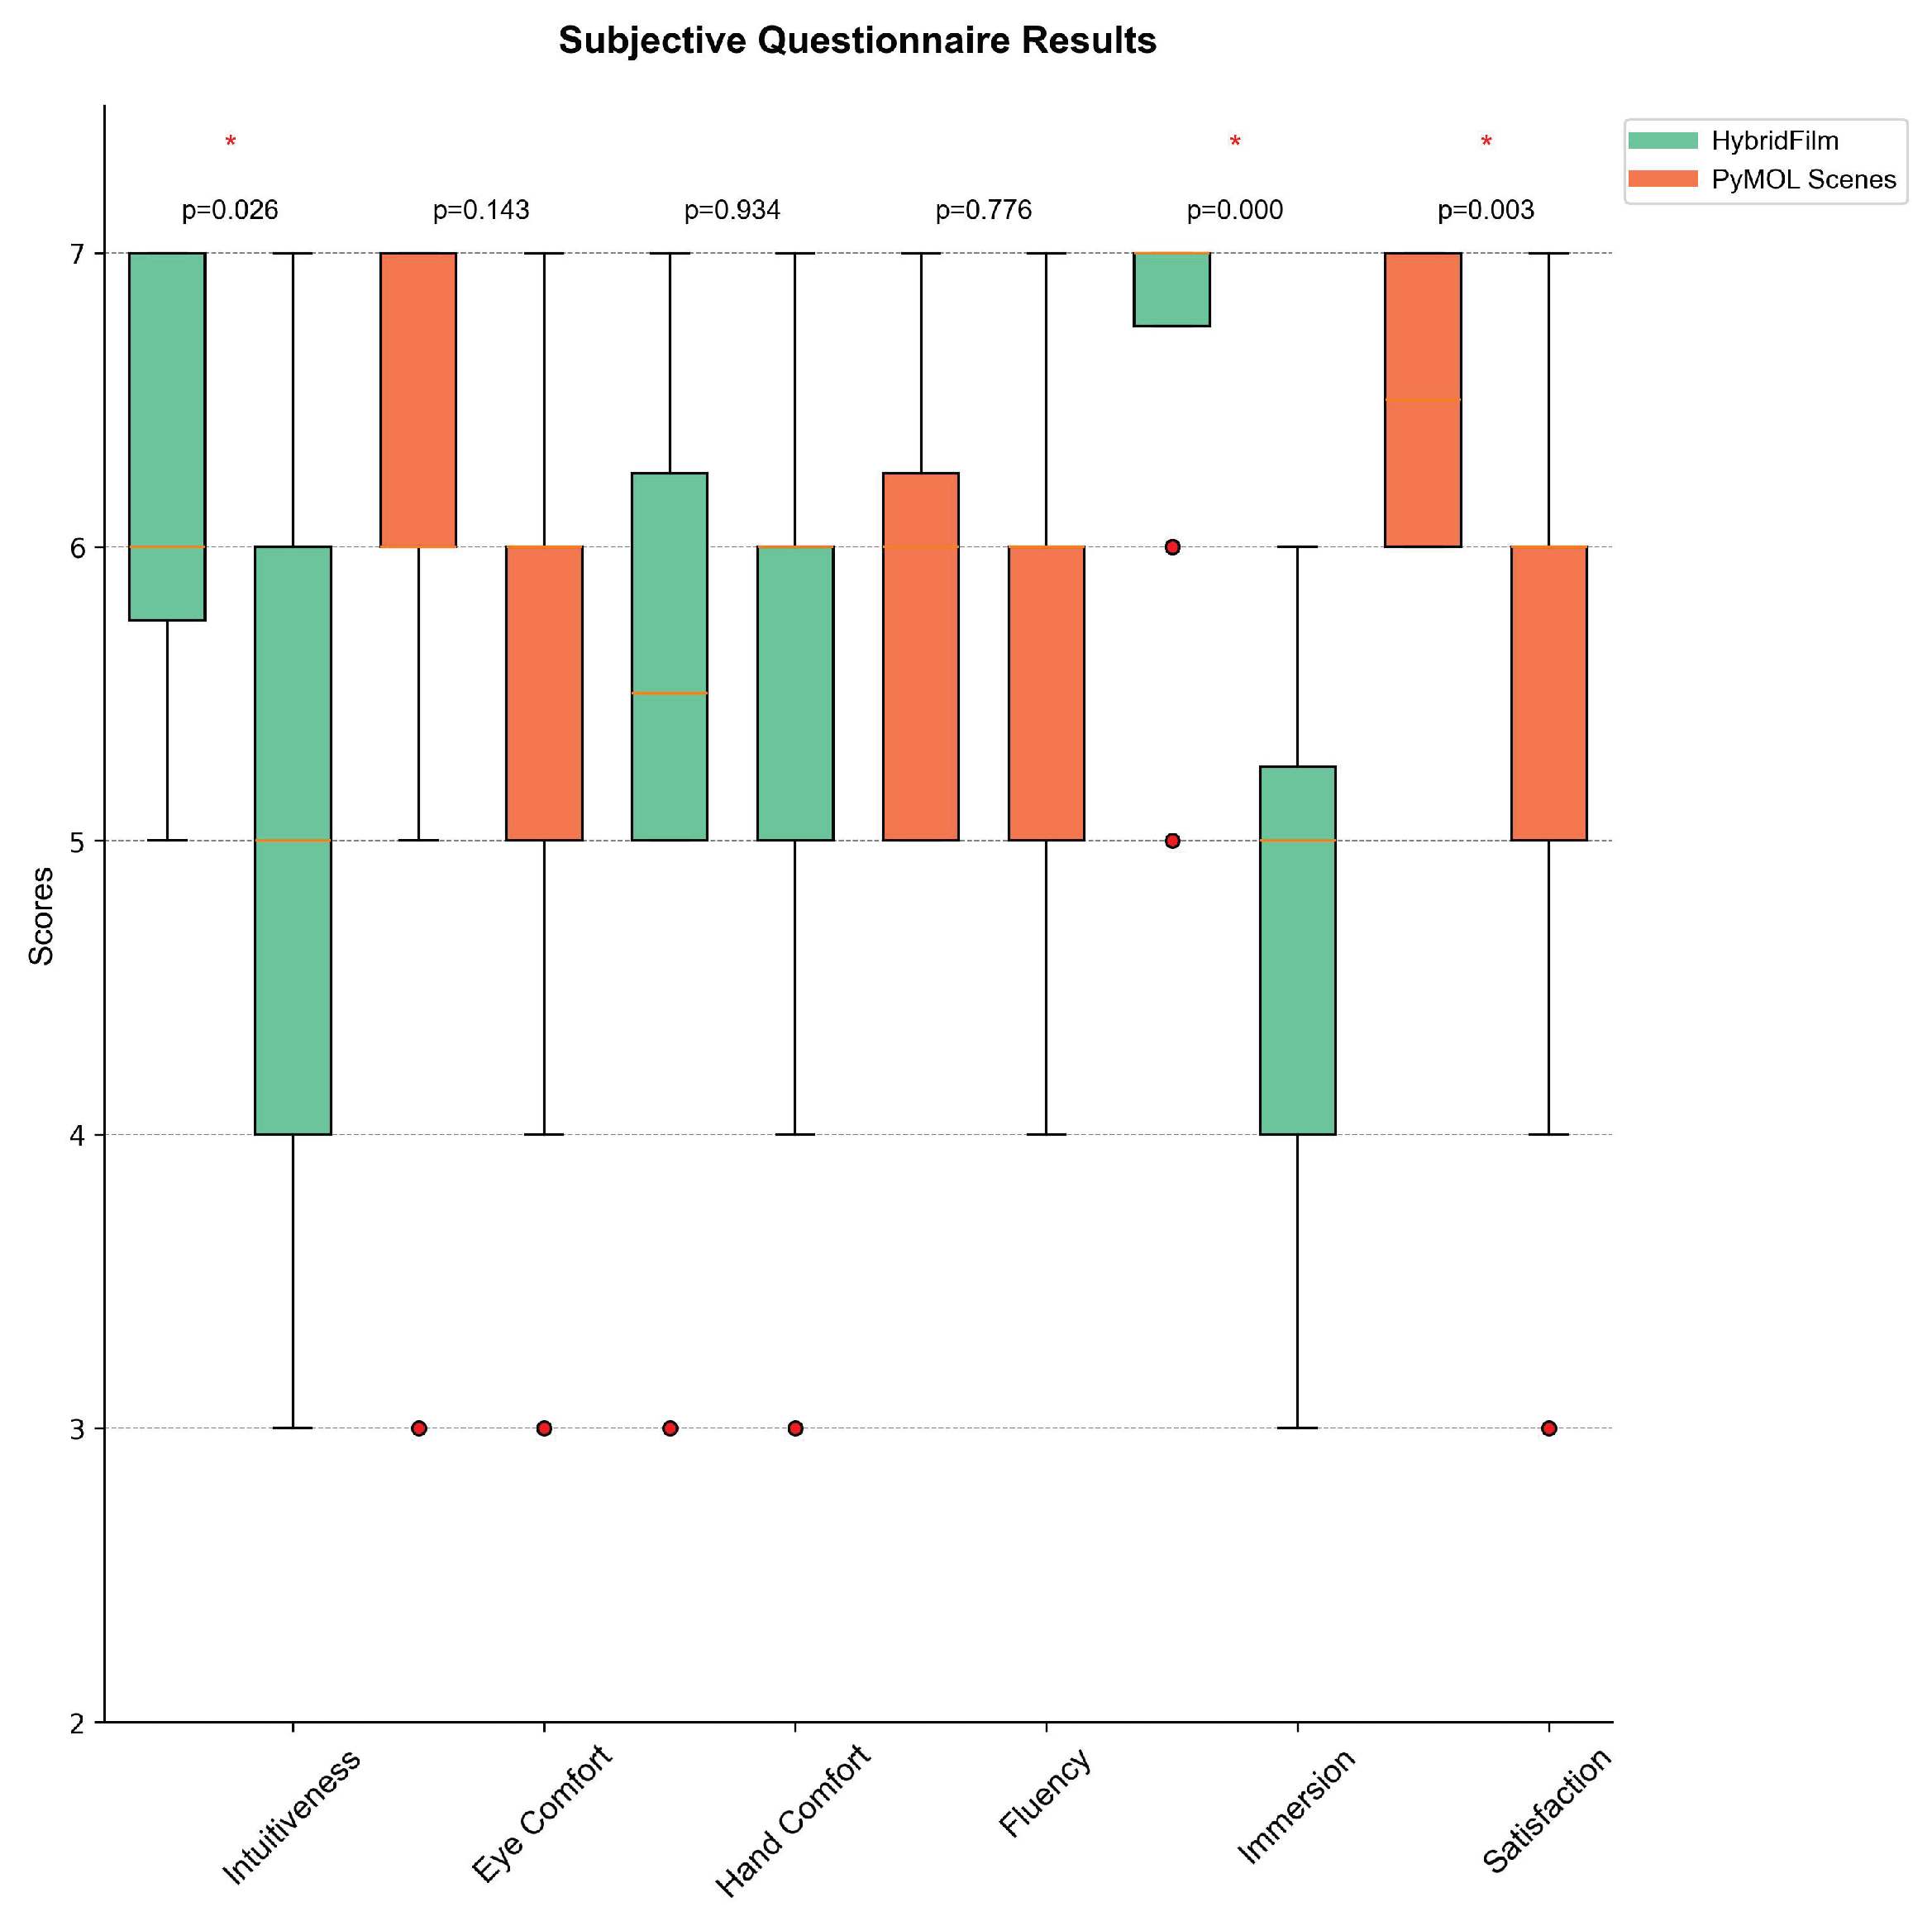
4.4.2. Comparative Evaluation
5. Discussion and Future Work
5.1. Discussion
5.2. Limitations and Future Work
6. Conclusions
Author Contributions
Funding
Institutional Review Board Statement
Informed Consent Statement
Data Availability Statement
Conflicts of Interest
References
- Rupp, D.; Kuhlen, T.; Weissker, T. TENETvr: Comprehensible Temporal Teleportation in Time-Varying Virtual Environments. In Proceedings of the 2023 IEEE International Symposium on Mixed and Augmented Reality (ISMAR), Sydney, Australia, 16–20 October 2023; pp. 922–929. [Google Scholar]
- Battut, A.; Ratovo, K.; Beaudouin-Lafon, M. OneTrace: Improving Event Recall and Coordination with Cross-Application Interaction Histories. Int. J. Human–Comput. Interact. 2025, 41, 3241–3258. [Google Scholar] [CrossRef]
- Git. Git-Scm.com. 2024. Available online: https://git-scm.com/ (accessed on 18 June 2025).
- Chen, H.T.; Wei, L.Y.; Chang, C.F. Nonlinear revision control for images. ACM Trans. Graph. (TOG) 2011, 30, 105. [Google Scholar] [CrossRef]
- Zhang, L.; Agrawal, A.; Oney, S.; Guo, A. Vrgit: A version control system for collaborative content creation in virtual reality. In Proceedings of the 2023 CHI Conference on Human Factors in Computing Systems, Hamburg, Germany, 23–28 April 2023; pp. 1–14. [Google Scholar]
- Sauermann, L.; Bernardi, A.; Dengel, A. Overview and Outlook on the Semantic Desktop. In Proceedings of the Semantic Desktop Workshop, Galway, Irelan, 6 November 2005; Volume 175, pp. 1–18. [Google Scholar]
- Heer, J.; Mackinlay, J.; Stolte, C.; Agrawala, M. Graphical histories for visualization: Supporting analysis, communication, and evaluation. IEEE Trans. Vis. Comput. Graph. 2008, 14, 1189–1196. [Google Scholar] [CrossRef]
- Hoff, A.; Seidl, C.; Lanza, M. Immersive Software Archaeology: Exploring Software Architecture and Design in Virtual Reality. In Proceedings of the 2024 IEEE International Conference on Software Analysis, Evolution and Reengineering (SANER) IEEE, Rovaniemi, Finland, 12–15 March 2024; pp. 47–51. [Google Scholar]
- Mehra, R.; Sharma, V.S.; Vikrant Kaulgud Sanjay Podder Burden, A.P. Towards immersive comprehension of software systems using augmented reality. In Proceedings of the 35th IEEE/ACM International Conference on Automated Software Engineering, Melbourne, Australia, 21–25 December 2020; pp. 1267–1269. [Google Scholar]
- Kreber, L.; Diehl, S.; Weil, P. Idevelopar: A programming interface to enhance code understanding in augmented reality. In Proceedings of the 2022 Working Conference on Software Visualization (VISSOFT), Limassol, Cyprus, 3–4 October 2022; pp. 87–95. [Google Scholar]
- Merino, L.; Hess, M.; Bergel, A.; Nierstrasz, O.; Weiskopf, D. Perfvis: Pervasive Visualization in Immersive Augmented Reality for Performance Awareness. arXiv 2019, arXiv:1904.06399. [Google Scholar]
- Waller, J.; Wulf, C.; Fittkau, F.; Döhring, P.; Hasselbring, W. Synchrovis: 3d visualization of monitoring traces in the city metaphor for analyzing concurrency. In Proceedings of the 2013 First IEEE Working Conference on Software Visualization (VISSOFT), Eindhoven, The Netherlands, 27–28 September 2013; pp. 1–4. [Google Scholar]
- Sharma, V.S.; Mehra, R.; Kaulgud, V.; Podder, S. An extended reality approach for creating immersive software project workspaces. In Proceedings of the 2019 IEEE/ACM 12th International Workshop on Cooperative and Human Aspects of Software Engineering (CHASE), Montreal, QC, Canada, 27 May 2019; pp. 27–30. [Google Scholar]
- Lee, B.; Cordeil, M.; Prouzeau, A.; Jenny, B.; Dwyer, T. A design space for data visualisation transformations between 2d and 3d in mixed-reality environments. In Proceedings of the 2022 CHI Conference on Human Factors in Computing Systems, New Orleans, LA, USA, 29 April–5 May 2022; pp. 1–14. [Google Scholar]
- Cavallo, M.; Dolakia, M.; Havlena, M.; Ocheltree, K.; Podlaseck, M. Immersive insights: A hybrid analytics system forcollaborative exploratory data analysis. In Proceedings of the 25th ACM Symposium on Virtual Reality Software and Technology, Parramatta, NSW, Australia, 12–15 November 2019; pp. 1–12. [Google Scholar]
- Myers, B.A. Interaction Techniques–History, Design and Evaluation. In Proceedings of the Extended Abstracts of the CHI Conference on Human Factors in Computing Systems, Honolulu, HI, USA, 11–16 May 2024; pp. 1–3. [Google Scholar]
- Seraji, M.R.; Stuerzlinger, W. Hybridaxes: An immersive analytics tool with interoperability between 2d and immersive reality modes. In Proceedings of the 2022 IEEE International Symposium on Mixed and Augmented Reality Adjunct (ISMAR-Adjunct), Singapore, 17–21 October 2022; pp. 155–160. [Google Scholar]
- Chen, H.T.; Wei, L.Y.; Hartmann, B.; Agrawala, M. Data-driven adaptive history for image editing. In Proceedings of the 20th ACM SIGGRAPH Symposium on Interactive 3D Graphics and Games, Redmond, WA, USA, 26–28 February 2016; pp. 103–111. [Google Scholar]
- Doboš, J.; Steed, A. 3D revision control framework. In Proceedings of the 17th International Conference on 3D Web Technology, New York, NY, USA, 4 August 2012; pp. 121–129. [Google Scholar]
- Lilija, K.; Pohl, H.; Hornbæk, K. Who put that there? temporal navigation of spatial recordings by direct manipulation. In Proceedings of the 2020 CHI Conference on Human Factors in Computing Systems, Honolulu, HI, USA, 25–30 April 2020; pp. 1–11. [Google Scholar]
- Myers, B.A.; Lai, A.; Le, T.M.; Yoon, Y.; Faulring, A.; Brandt, J. Selective undo support for painting applications. In Proceedings of the 33rd Annual ACM Conference on Human Factors in Computing Systems, Seoul, Republic of Korea, 18–23 April 2015; pp. 4227–4236. [Google Scholar]
- Zong, J.; Barnwal, D.; Neogy, R.; Satyanarayan, A. Lyra 2: Designing interactive visualizations by demonstration. IEEE Trans. Vis. Comput. Graph. 2020, 27, 304–314. [Google Scholar] [CrossRef] [PubMed]
- Salvati, G.; Santoni, C.; Tibaldo, V.; Pellacini, F. Meshhisto: Collaborative modeling by sharing and retargeting editing histories. ACM Trans. Graph. (TOG) 2015, 34, 205. [Google Scholar] [CrossRef]
- Liu, Y.; Liao, S.; Jin, Y.; Ma, M.; Tang, W. Embodied Cognition and MR-Based Interactive Narrative Design: The Case of ‘Encountering Sanmao’ at the Former Residence of Zhang Leping. In Proceedings of the 2024 10th International Conference on Virtual Reality (ICVR), Bournemouth, UK, 24–26 July 2024; pp. 153–160. [Google Scholar]
- Jin, Y.; Ma, M.; Liu, Y. Comparative study of HMD-based virtual and augmented realities for immersive museums: User acceptance, medium, and learning. ACM J. Comput. Cult. Herit. 2024, 17, 13. [Google Scholar] [CrossRef]
- Wang, X.; Besançon, L.; Rousseau, D.; Sereno, M.; Ammi, M.; Isenberg, T. Towards an understanding of augmented reality extensions for existing 3D data analysis tools. In Proceedings of the 2020 CHI Conference on Human Factors in Computing Systems, Honolulu, HI, USA, 25–30 April 2020; pp. 1–13. [Google Scholar]
- Mandalika, V.B.H.; Chernoglazov, A.I.; Billinghurst, M.; Bartneck, C.; Hurrell, M.A.; Ruiter, N.D.; Butler, A.P.H.; Butler, P.H. A hybrid 2D/3D user interface for radiological diagnosis. J. Digit. Imaging 2018, 31, 56–73. [Google Scholar] [CrossRef] [PubMed]
- Zhu-Tian, C.; Tong, W.; Wang, Q.; Bach, B.; Qu, H. Augmenting static visualizations with paparvis designer. In Proceedings of the 2020 CHI Conference on Human Factors in Computing Systems, Honolulu, HI, USA, 25–30 April 2020; pp. 1–12. [Google Scholar]
- Fröhler, B.; Anthes, C.; Pointecker, F.; Friedl, J.; Schwajda, D.; Riegler, A.; Tripathi, S.; Holzmann, C.; Brunner, M.; Jodlbauer, H.; et al. A Survey on Cross-Virtuality Analytics. In Proceedings of the Computer Graphics Forum Hoboken, New Jersey, USA, 08 February 2022; Volume 41, pp. 465–494. [Google Scholar]
- Zhu, F.; Grossman, T. Bishare: Exploring bidirectional interactions between smartphones and head-mounted augmented reality. In Proceedings of the 2020 CHI Conference on Human Factors in Computing Systems, Honolulu, HI, USA, 25–30 April 2020; pp. 1–14. [Google Scholar]
- Langner, R.; Satkowski, M.; Büschel, W.; Dachselt, R. Marvis: Combining mobile devices and augmented reality for visual data analysis. In Proceedings of the 2021 CHI Conference on Human Factors in Computing Systems, Online, 8–13 May 2021; pp. 1–17. [Google Scholar]
- Reipschlager, P.; Flemisch, T.; Dachselt, R. Personal augmented reality for information visualization on large interactive displays. IEEE Trans. Vis. Comput. Graph. 2020, 27, 1182–1192. [Google Scholar] [CrossRef] [PubMed]
- Lee, Y.J.; Ji, Y.G. Effects of visual realism on avatar perception in immersive and non-immersive virtual environments. Int. J. Human–Comput. Interact. 2025, 41, 4362–4375. [Google Scholar] [CrossRef]
- JBem, M.; Chabot, S.R.; Brooks, V.; Braasch, J. Enhancing museum experiences: Using immersive environments to evaluate soundscape preferences. J. Acoust. Soc. Am. 2025, 157, 1097–1108. [Google Scholar] [CrossRef] [PubMed]
- Bowman, D.A.; Wingrave, C.A. Design and evaluation of menu systems for immersive virtual environments. In Proceedings of the IEEE Virtual Reality 2001 IEEE, Yokohama, Japan, 13–17 March 2001; pp. 149–156. [Google Scholar]
- Reiter, K.; Pfeuffer, K.; Esteves, A.; Mittermeier, T.; Alt, F. Look & turn: One-handed and expressive menu interaction by gaze and arm turns in vr. In Proceedings of the 2022 Symposium on Eye Tracking Research and Applications, Seattle, WA, USA, 8–11 June 2022; pp. 1–7. [Google Scholar]
- Chen, X.; Guo, D.; Feng, L.; Chen, B.; Liu, W. Compass+ Ring: A Multimodal Menu to Improve Interaction Performance and Comfortability in One-handed Scenarios. In Proceedings of the 2023 IEEE International Symposium on Mixed and Augmented Reality (ISMAR), Sydney, Australia, 16–20 October 2023; pp. 473–482. [Google Scholar]
- Lindlbauer, D.; Feit, A.M.; Hilliges, O. Context-aware online adaptation of mixed reality interfaces. In Proceedings of the 32nd Annual ACM Symposium on User Interface Software and Technology, New Orleans, LA, USA, 20–23 October 2019; pp. 147–160. [Google Scholar]
- Cheng, Y.F.; Luong, T.; Fender, A.R.; Streli, P.; Holz, C. ComforTable user interfaces: Surfaces reduce input error, time, and exertion for tabletop and mid-air user interfaces. In Proceedings of the 2022 IEEE International Symposium on Mixed and Augmented Reality (ISMAR), Singapore, 17–21 October 2022; pp. 150–159. [Google Scholar]
- Satriadi, K.A.; Ens, B.; Cordeil, M.; Jenny, B.; Czauderna, T.; Willett, W. Augmented reality map navigation with freehand gestures. In Proceedings of the 2019 IEEE Conference on Virtual Reality and 3D User Interfaces (VR), Osaka, Japan, 23–27 March 2019; pp. 593–603. [Google Scholar]
- Wentzel, J.; Lakier, M.; Hartmann, J.; Falah Shazib Géry Casiez Vogel, D. A Comparison of Virtual Reality Menu Archetypes: Raycasting, Direct Input, and Marking Menus. IEEE Trans. Vis. Comput. Graph. 2024, 1–15. [Google Scholar] [CrossRef] [PubMed]
- Li, Y.; Fischer, F.; Dwyer, T.; Ens, B.; Crowther, R.; Kristensson, P.O.; Tag, B. Alphapig: The nicest way to prolong interactive gestures in extended reality. In Proceedings of the 2025 CHI Conference on Human Factors in Computing Systems, Yokohama Japan, 26 April–1 May 2025; pp. 1–14. [Google Scholar]
- Huang, Y.J.; Liu, K.Y.; Lee, S.S.; Yeh, I.C. Evaluation of a hybrid of hand gesture and controller inputs in virtual reality. Int. J. Human–Comput. Interact. 2021, 37, 169–180. [Google Scholar] [CrossRef]
- Wu, S.; Byrne, D.; Steenson, M.W. “Megereality”: Leveraging Physical Affordances for Multi-Device Gestural Interaction in Augmented Reality. In Proceedings of the Extended Abstracts of the 2020 CHI Conference on Human Factors in Computing Systems, Honolulu, HI, USA, 25–30 April 2020; pp. 1–4. [Google Scholar]
- Mixed Reality Toolkit (MRTK) 2.8.0. 2023. Microsoft. Available online: https://github.com/microsoft/MixedRealityToolkit-Unity/releases/tag/v2.8.0 (accessed on 18 June 2025).
- Unity 2022.3.15. Unity Technologies. 2023. Available online: https://unity.com/releases/editor/whats-new/2022.3.15 (accessed on 13 July 2024).
- Robinson, A.C.; Weaver, C. Re-visualization: Interactive visualization of the process of visual analysis. In Proceedings of the Workshop on Visualization, Analytics & Spatial Decision Support at the GIScience Conference, Muenster, Germany, 20 September 2006; pp. 1–21. [Google Scholar]
- Dube, T.J.; Arif, A.S. Text entry in virtual reality: A comprehensive review of the literature. In Proceedings of the Human-Computer Interaction. Recognition and Interaction Technologies: Thematic Area, HCI 2019, Held as Part of the 21st HCI International Conference, HCII 2019, Orlando, FL, USA, 26–31 July 2019; Proceedings, Part II 21. Springer International Publishing: Cham, Switzerland, 2019; pp. 419–437. [Google Scholar]
- He, Y.; Hu, Y.; Feng, H.; Li, C.; Shen, X. Comparative Analysis of 3D Interactive Modes in Different Object Layouts in Mixed Reality. In Proceedings of the Ninth International Symposium of Chinese CHI, Online, 16–17 October 2021; pp. 120–126. [Google Scholar]
- Joshi, A.; Kale, S.; Chandel, S.; Pal, D.K. Likert Scale: Explored and Explained. Br. J. Appl. Sci. Technol. 2015, 7, 396–403. [Google Scholar] [CrossRef]


| History Tools | Features | |||||
|---|---|---|---|---|---|---|
| Submit | Switch | Preview | Zoom | Move Freely | Interaction | |
| HybridFilm | ✓ | ✓ | ✓ | ✓ | ✓ | ✓ |
| PyMOL Scenes | ✓ | ✓ | ✓ | |||
| Category | Subject | Rating Description | ||||||
|---|---|---|---|---|---|---|---|---|
| Strongly Disagree | Disagree | Somewhat Disagree | Neutral | Somewhat Agree | Agree | Strongly Agree | ||
| Usability | Submit | 1 | 2 | 3 | 4 | 5 | 6 | 7 |
| Switch | 1 | 2 | 3 | 4 | 5 | 6 | 7 | |
| Preview | 1 | 2 | 3 | 4 | 5 | 6 | 7 | |
| Utility | Submit | 1 | 2 | 3 | 4 | 5 | 6 | 7 |
| Switch | 1 | 2 | 3 | 4 | 5 | 6 | 7 | |
| Preview | 1 | 2 | 3 | 4 | 5 | 6 | 7 | |
| Change | 1 | 2 | 3 | 4 | 5 | 6 | 7 | |
| Evolution | 1 | 2 | 3 | 4 | 5 | 6 | 7 | |
| Sequential | 1 | 2 | 3 | 4 | 5 | 6 | 7 | |
Disclaimer/Publisher’s Note: The statements, opinions and data contained in all publications are solely those of the individual author(s) and contributor(s) and not of MDPI and/or the editor(s). MDPI and/or the editor(s) disclaim responsibility for any injury to people or property resulting from any ideas, methods, instructions or products referred to in the content. |
© 2025 by the authors. Licensee MDPI, Basel, Switzerland. This article is an open access article distributed under the terms and conditions of the Creative Commons Attribution (CC BY) license (https://creativecommons.org/licenses/by/4.0/).
Share and Cite
Zhou, L.; Zhang, M.; Liu, Y.; Guo, D. HybridFilm: A Mixed-Reality History Tool Enabling Interoperability Between Screen Space and Immersive Environments. Appl. Sci. 2025, 15, 8489. https://doi.org/10.3390/app15158489
Zhou L, Zhang M, Liu Y, Guo D. HybridFilm: A Mixed-Reality History Tool Enabling Interoperability Between Screen Space and Immersive Environments. Applied Sciences. 2025; 15(15):8489. https://doi.org/10.3390/app15158489
Chicago/Turabian StyleZhou, Lisha, Meng Zhang, Yapeng Liu, and Dongliang Guo. 2025. "HybridFilm: A Mixed-Reality History Tool Enabling Interoperability Between Screen Space and Immersive Environments" Applied Sciences 15, no. 15: 8489. https://doi.org/10.3390/app15158489
APA StyleZhou, L., Zhang, M., Liu, Y., & Guo, D. (2025). HybridFilm: A Mixed-Reality History Tool Enabling Interoperability Between Screen Space and Immersive Environments. Applied Sciences, 15(15), 8489. https://doi.org/10.3390/app15158489