1. Introduction
Attack attribution in networks is a critical challenge in cybersecurity, especially when dealing with multi-step and multi-stage attacks [
1], such as those carried out by Advanced Persistent Threat (APT) groups [
2]. These attacks differ from isolated attacks due to their complexity and duration. According to the MITRE ATT&CK framework [
3], attackers involved in such operations use a wide range of tactics, from initial reconnaissance to advanced techniques in later stages, posing significant risks to the information security triad (confidentiality, integrity and availability). In real-world environments, these attacks often occur concurrently, further complicating their attribution. Their objectives typically include data theft, sabotage, or espionage, and they tend to follow recurring strategies and patterns often proven effective in past incidents. Therefore, accurate attack attribution becomes crucial for identifying consistent attacker behaviors and patterns, thereby improving threat response and mitigation in complex environments.
The recent literature has explored various approaches to attack attribution. For example, Xiang et al. [
4] introduced a model that integrates threat intelligence with network behavior data, achieving 88.89% accuracy in identifying attacker communities. However, this clustering-based approach does not address scenarios involving multiple adversaries, where each attack must be attributed to its specific attacker. Similarly, Li et al. [
5] employed behavioral patterns and rough set theory to analyze correlations between APT groups, achieving 90.90% accuracy. Their analysis operated at the group level rather than the individual instance level. Kim et al. [
6] proposed an automated attribution technique that vectorizes the MITRE ATT&CK matrix and matches Indicators of Compromise (IoCs), achieving 91.48% accuracy. Nonetheless, their approach was limited to mobile malware and did not tackle attribution in multi-adversary environments or within sequences of network alerts. In summary, although significant advances have been made in attacker attribution and group-level correlation, a significant gap remains in the literature regarding precise attribution in complex, multi-adversary network scenarios, particularly in identifying the responsible actor behind each sequence of network alerts. In addition, new approaches have emerged that apply hierarchical frameworks enhanced with large language models to extract structured attribution knowledge from cybersecurity reports. While these frameworks enrich the qualitative understanding of attack attribution, they focus primarily on post-event analysis and macro-level insights, lacking direct application in real-time or sequence-based adversary identification tasks [
7]. Furthermore, efforts to support cyberattack attribution through NLP and NER techniques have gained momentum, especially with the release of specialized datasets [
8]. These resources, designed to extract attacker information from textual cybersecurity reports, reveal the growing interest in augmenting manual attribution workflows using large language models. However, such approaches are inherently limited by their reliance on textual data and lack of integration with sequential alert data or network behavior patterns.
Transformers [
9], particularly their attention mechanisms such as multi-head attention, have demonstrated outstanding capabilities in modeling long-term dependencies and capturing complex relationships within extensive sequences. These abilities enable the detection of relevant patterns and the effective management of multiple concurrent information flows. Motivated by these properties, this work formally investigates the impact of attention-based architectures, particularly multi-head attention, in the context of attack attribution within multi-adversary MSNA scenarios. Unlike traditional models that struggle with the concurrency and complexity of diverse data streams, Transformers excel by utilizing self-attention mechanisms and parallel processing capabilities. These features enable them to efficiently manage intricate patterns and simultaneous processes, making them particularly suitable for handling complex scenarios. As a result, Transformers have seen increasing adoption in cybersecurity applications, particularly in the detection of sophisticated APT activities [
10], and have shown promising results in intrusion detection tasks due to their ability to learn temporal dependencies and outperform recurrent models in terms of convergence and efficiency [
11]. For instance, RAPID [
10] introduced self-supervised sequential learning with iterative embeddings to adapt to dynamic system behaviors. TBDetector [
12], using a Transformer-based framework, has proven effective at extracting contextual features from provenance graphs. LogShield [
13], another Transformer-based detection system, applied training techniques based on RoBERTa, achieving high F1 scores across multiple datasets. Additionally, hybrid models have also been explored, combining Transformers with architectures like Temporal Convolutional Networks (TCNs) to enhance robustness and predictive performance [
14]. Recently, the work of Manocchio et al. [
15] introduced FlowTransformer, a flexible and efficient framework for the systematic implementation and evaluation of Transformer-based models in network intrusion detection systems (NIDS). FlowTransformer demonstrated that well-designed Transformer architectures can achieve high levels of accuracy (e.g., F1-score of up to 98% on NSL-KDD) while maintaining computational efficiency, outperforming previous models in network traffic classification tasks. Furthermore, the study highlights the importance of component selection, such as input encoding type and classification head, showing that shallow models can be as effective as larger architectures but with lower computational cost.
In this work, we present a novel approach to attacker attribution in complex MSNA environments by leveraging Transformer-based models to move beyond traditional detection and address the multi-adversary challenge. Our hypothesis is that Transformers, due to their capacity to manage multiple information flows and capture complex relationships, can surpass and outperform other architectures in classifying the responsible attacker, even when learning from multiple adversaries simultaneously.
The main contribution of this work to the state of the art lies in the introduction of a Transformer-based model tailored for attacker attribution in complex MSNA scenarios. Unlike prior approaches that focus primarily on detection or classification by attack type, our model is designed to pinpoint the specific attacker among multiple candidates, which is essential for real-world response and mitigation strategies. This approach not only improves attribution accuracy but also opens new avenues for research in complex, adversary-aware attribution systems. Our work aims to bridge a critical gap in the current literature by providing an innovative approach validated in real MSNA scenarios, promising to improve accuracy and effectiveness in identifying attackers in complex environments. Our study employs a dataset that includes multiple attacker entities, enabling us to assess the model’s effectiveness in distinguishing between different adversaries, a challenge that remains not fully addressed in previous work. To the best of our knowledge, this is the first work to achieve supervised, fine-grained attribution of individual attackers using sequential alert data in multi-adversary network environments, establishing a new benchmark for attacker attribution in complex cybersecurity scenarios.
Section 2 reviews the most relevant literature, emphasizing the limitations of existing approaches to attacker attribution.
Section 3 outlines the materials and methodology used, including dataset description, preprocessing techniques, model architecture, and training–validation procedures.
Section 4 presents the results, featuring exploratory data analysis, model performance metrics, class imbalance evaluation, and interpretability and robustness assessments. Finally,
Section 5 discusses the implications of the findings and future research directions, while
Section 6 concludes this study and outlines suggestions for future work.
2. Related Work
Attack attribution and adversary identification have been the subject of significant research in recent years, with approaches ranging from behavioral correlation and threat intelligence analysis to, more recently, the use of language models (LLMs) and natural language processing (NLP) techniques. Much of the literature has focused on APTs and malware analysis, where attribution is often performed at the group or campaign level, leveraging static features, code artifacts, or threat intelligence extracted from textual reports [
5,
6,
8,
16,
17]. For example, Li et al. [
5] analyzed correlations among APT groups using behavioral patterns and rough set theory, but their approach operated at the group level and did not address individual attack instances or sequential modeling. Kim et al. [
6] proposed an automated attribution method for mobile malware based on MITRE ATT&CK matrix vectorization and indicator similarity, yet their work was limited to the mobile domain and did not consider network traffic or alert sequences.
Recent advances in NLP and LLMs have enabled the extraction of tactics, techniques, and procedures (TTPs) from threat reports and the mapping of these to known actors using semantic embeddings [
8,
16]. While these approaches demonstrate the potential of semantic enrichment for attribution, they operate primarily on unstructured textual data and do not address the challenges of network-based, sequential attack attribution. Additionally, the problem of attribution evasion was highlighted by Skopik and Pahi [
18], who showed how attackers can manipulate technical artifacts to mislead attribution systems, underscoring the need for robust and resilient models.
A comprehensive survey by Rani et al. [
17] categorized existing APT attribution methods, including clustering, behavioral correlation, threat intelligence enrichment, and machine learning-based techniques. The survey identified key challenges such as the scarcity of labeled datasets, the difficulty of modeling adversarial behavior over time, and the lack of generalizable, fine-grained attribution models. However, most of these works focus on persistent, long-term campaigns and do not address the attribution of individual attackers in dynamic, multi-adversary network environments.
Closer to the context of this work, Xiang et al. [
4] introduced IPAttributor, a model that combines threat intelligence with network behavior data to cluster malicious IP addresses using similarity matrices and dynamic clustering. Although IPAttributor achieves an attribution accuracy of 88.89%, its approach is unsupervised and limited to IP-level grouping, without leveraging deep learning architectures or Transformers and without addressing individualized attribution in multi-adversary scenarios. Importantly, IPAttributor does not model multi-step network attacks or long sequences of events; its analysis is based on individual events and does not consider the temporal dynamics or complexity of attacks composed of multiple steps. Furthermore, its validation is restricted to a single dataset, without hyperparameter exploration or cross-validation.
In summary, most previous approaches focus on group-level attribution, malware analysis, or semantic enrichment from text and do not directly address supervised, fine-grained attribution of individual attackers in network alert sequences within multi-adversary environments. This work situates itself at the intersection of behavioral modeling and deep learning-based attribution, addressing several of the limitations identified in the literature. Specifically, we propose a Transformer-based model for supervised attribution of individual attackers in multi-adversary environments, using temporally ordered sequences of network alerts. Unlike prior work focused on group-level attribution or static features, our approach captures dynamic, sequential behavior and enables fine-grained attribution even in highly imbalanced and realistic scenarios.
3. Materials and Methods
3.1. Dataset Description and Characterization
The dataset employed in this study originated from the DEFCON Capture The Flag 22 event [
19], recognized as one of the most prestigious and technically demanding cybersecurity competitions worldwide. Held in Las Vegas from 8 August to 10 August 2014, the event featured 20 finalist teams from countries such as the United States, Taiwan, South Korea, China, Russia, Australia, Germany, Japan, France, Denmark, and Poland, participating in a traditional attack–defense format. This competitive and high-pressure environment enabled the collection of full network traffic, later released in PCAC (packet capture) format, facilitating in-depth forensic analysis. Each team was assigned a distinct CIDR subnet and tasked with defending a designated .2 server IP address within their range. The vulnerable services deployed in the competition included
eliza: a text-based apce economy simulation game;
wdub: a web service;
justify: a constraint solver;
imap: an email server based on the IMAP protocol.
The CTF infrastructure was carefully designed to test both offensive and defensive capabilities, requiring teams to secure their own services while simultaneously attempting to exploit vulnerabilities in their opponents’ infrastructure.
The dataset was composed of 272 game rounds, each lasting 5 min, capturing bidirectional traffic in libpcap format, including both packet headers and full payloads. Unlike typical network environments where benign traffic predominates, this dataset was uniquely characterized by a high proportion of malicious traffic, given the adversarial nature of the CTF scenario. Additionally, embedded within the traffic were 26-character validation tokens—comprising letters and digits—which teams were required to extract in order to score points.
Table 1 provides an overview of the participating teams, detailing their assigned subnets, defended servers, and the total number of alerts generated during the competition.
According to Yam et al. [
20] a detailed analysis of network traffic and team behaviors during the DEFCON CTF revealed key insights into the strategies that contributed to varying levels of team performance. In terms of offensive tactics, the most successful teams, such as PPP, HITCON, and Blue-Lotus, implemented automated systems to launch exploits at regular intervals. This approach likely enabled a consistent pace of attacks while allowing human team members to focus on tasks requiring adaptive decision-making. Furthermore, high-performing teams exhibited superior situational awareness by dynamically modifying their exploits during the competition in response to evolving defensive strategies. Exploitation rates among teams varied widely, ranging from fewer than 30 to over 400 exploits per round. However, this variation did not show a direct correlation with final rankings. Defensive strategies also played a critical role. Teams that ranked in the top five managed to patch their services before round 224, whereas four of the bottom five teams only completed patching after round 265. A strong correlation was observed between service uptime and final ranking; the top-ranked teams kept their services operational over 90% of the time throughout the competition. Token exfiltration methods—whether via reusing open connections, targeting specific service ports (e.g., 143, 4444, 6969, 8888), or establishing new callback channels—did not show a significant correlation with final success. Notably, most tokens were extracted from traffic without sophisticated obfuscation, suggesting that stealth in exfiltration was not a decisive factor. Additional strategic patterns emerged from the analysis. Early offensive action was critical: teams that took less time to develop and deploy initial exploits generally achieved higher rankings, revealing a strong negative correlation between time-to-exploit and performance. Moreover, offensive dominance appeared more consequential than balanced strategies, as final rankings were more strongly associated with the number of tokens captured than with tokens lost. The widespread reuse of exploits among teams further indicated that the protection of offensive tools was less effective than the timely development of new attack vectors. Overall, the most successful teams displayed greater strategic flexibility and responsiveness to the evolving dynamics of the competition.
To convert raw traffic data into a structured format suitable for analysis, the PCAP files were processed using the IDS Snort intrusion detection system [
21], following the methodology outlined by Cano and Torres [
22]. This process applies a predefined set of detection rules to network packets, generating alerts whenever a rule associated with suspicious or malicious behavior is triggered. Each alert includes essential metadata such as timestamps, source and destination IP addresses, and, most importantly, a unique alert_id corresponding to the specific rule match.
Table 2 summarizes the alert identifiers (alert_id) obtained through this methodology, along with their respective frequencies and brief descriptions. In total, 5,537,232 alerts were generated, covering 30 distinct event types. These alerts formed the basis for reconstructing attack sequences and conducting higher-level analyses such as pattern extraction and attacker attribution, effectively transforming raw network traffic into structured, actionable intelligence for cybersecurity research. Building on this foundation, the alert sequences generated by each attacking team against a specific victim team were grouped by competition round. For each round, we defined an MSNA as an ordered sequence of alerts issued by an attacker targeting a victim.
Many of the alert types listed in
Table 2 correspond to well-known adversarial tactics observed in real-world cybersecurity incidents. For example, alert_id 2 (“Unknown IMAP Command”) was indicative of reconnaissance or probing of mail services, while alert_id 13 (“Invalid HTTP content”) and alert_id 14 (“consecutive small TCP segments”) reflected evasion techniques and fragmentation attacks targeting web services. Alerts such as 0, 5, and 21 represented classic port scanning behavior, commonly used during the initial stages of an attack to identify open services. These patterns aligned with tactics described in the MITRE ATT&CK [
3] framework and reinforced the realism of the dataset for studying attacker attribution.
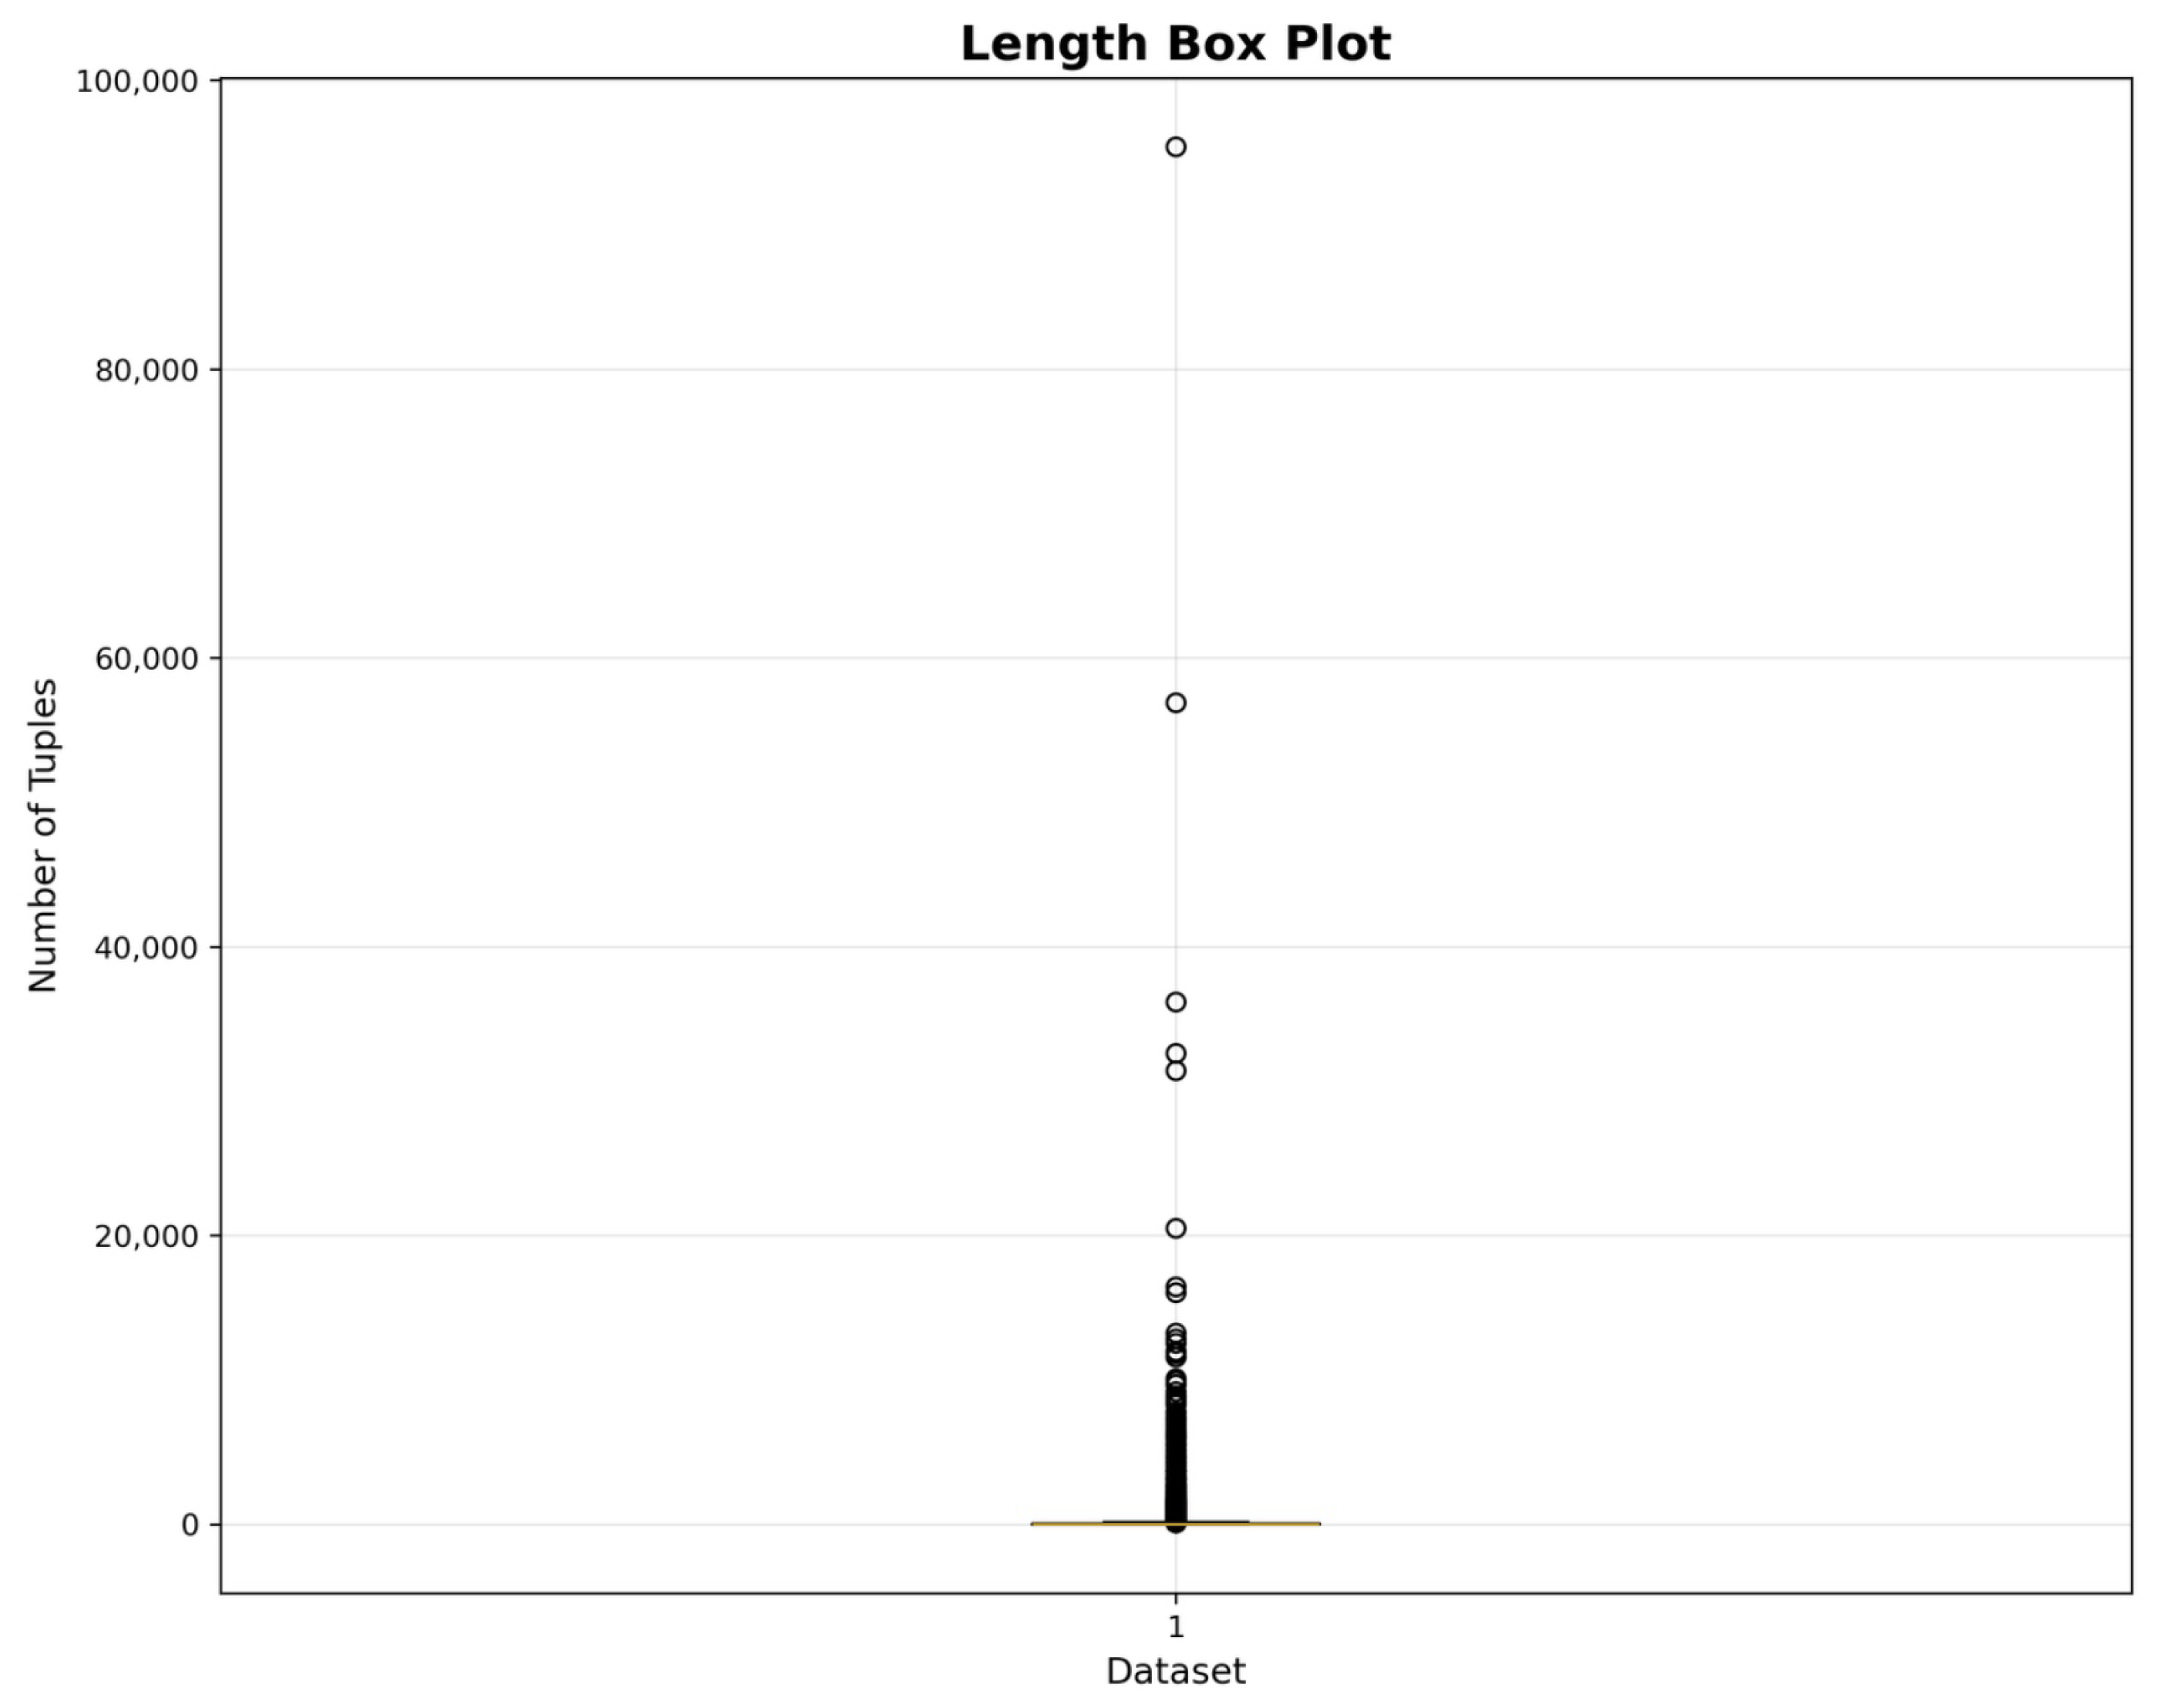
As illustrated in
Figure 1, the box plot displays the distribution of alert sequence lengths across the dataset. In this graph, the Y-axis corresponds to the number of alerts (i.e., the length of each sequence), while the X-axis represents a single position (labeled “1”), given that only one variable was being analyzed. The box represents the interquartile range (IQR), capturing the middle 50% of the data, with the horizontal line inside the box indicating the median. The whiskers extend to the smallest and largest values not classified as outliers, and individual points beyond the whiskers denote extreme values. An analysis of the figure reveals that the majority of sequences were relatively short, as evidenced by the position of the box near the lower end of the scale. Nevertheless, several extreme outliers were observed, with the longest sequences reaching up to nearly 100,000 alerts. The most prominent outliers appeared at around 90,000 and 60,000 and between 20,000 and 40,000 alerts. This distribution was markedly skewed, indicating that while most attack sequences were brief, there existed a minority of extraordinarily long sequences that significantly deviated from the norm. Statistical summary metrics supported these observations. The dataset comprised a total of 82,092 sequences, with an average length of 67.28 alerts and a median of 18.00. The shortest sequence contained a single alert, while the longest reached 95,427. The standard deviation, at 532.83, further reflected the high dispersion in sequence lengths. Percentile analysis showed that 95% of sequences were shorter than 185 alerts and 97% were under 298 alerts. This reinforced the notion that extremely long sequences were statistical anomalies and not representative of typical behavior. To conduct more focused and interpretable analyses, this study restricted attention to sequences with lengths between 9 and 243 alerts. This range was selected to retain the diversity of attack patterns while excluding trivial or excessively long outliers. Applying this filter resulted in a refined subset of 53,830 sequences, which balanced representativeness and tractability. This selection enabled a more targeted investigation of attacker behavior, which was critical for the development of effective and explainable attribution models.
3.1.1. Complexity and Behavioral Diversity in the CTF Dataset
For the attacker attribution experiments conducted in this study, the aforementioned filtered subset—comprising sequences between 9 and 243 alerts in length—served as the core dataset. This criterion ensured that the sequences included were sufficiently complex to capture meaningful behavioral patterns, while simultaneously removing noise introduced by overly short or anomalously long sequences.
Table 3 presents a statistical summary of this final dataset, which formed the empirical basis for all subsequent analyses and modeling efforts.
This refined subset retained much of the complexity and imbalance present in the original dataset. It exhibited a high proportion of unique sequences and recurring patterns, and an uneven distribution of activity among attacking teams. Furthermore, the low silhouette index values observed during clustering analysis indicated that the attacker attribution task remained highly challenging as the classes were not easily distinguishable in the feature space.
The diversity of attack patterns within the dataset was closely linked to the nature of the vulnerable services and the competitive dynamics inherent to the CTF event. Many of the Snort rules observed in the sequences—such as those related to HTTP, IMAP, and TCP fragmentation—were directly associated with these services, and their frequency highlighted the strategic focus on exploiting them.
The analysis of alert sequences not only revealed behavioral signatures of the attacking teams but also enabled inferences about their tactics and the specific vulnerabilities they targeted during the competition. For instance, the “Unknown IMAP4 command” alert (alert_id 2) was typically associated with reconnaissance or exploitation attempts on the IMAP service, while alerts like “HTTP invalid content-length or chunk size” (alert_id 13) and “Consecutive TCP small segments” (alert_id 14) often indicated attacks targeting web services such as wdub. Recurrent sequences of specific alerts suggested the use of automated tools to exploit known vulnerabilities, whereas more complex sequences—those combining alerts across multiple protocols—reflected evasion techniques, reconnaissance phases, or multi-stage exploitation strategies. These are hallmarks of the adversarial behavior commonly observed in CTF environments, where teams continuously adapt to exploit any available weakness to obtain tokens.
Table 4 summarizes representative alert sequences and their possible interpretations in the context of the CTF competition.
This analysis shows that the dataset contained not only trivial patterns but also complex and realistic behaviors, aligned with attack scenarios observed in competitive and real environments. The presence of both trivial and sophisticated patterns in the sequences was consistent with the dynamics of a CTF, where automated scripts and manual or adaptive attacks coexist. Thus, the richness of patterns, aligned with the malicious and strategic nature of traffic in the CTF, reinforced the relevance of the dataset as a realistic benchmark for attack attribution.
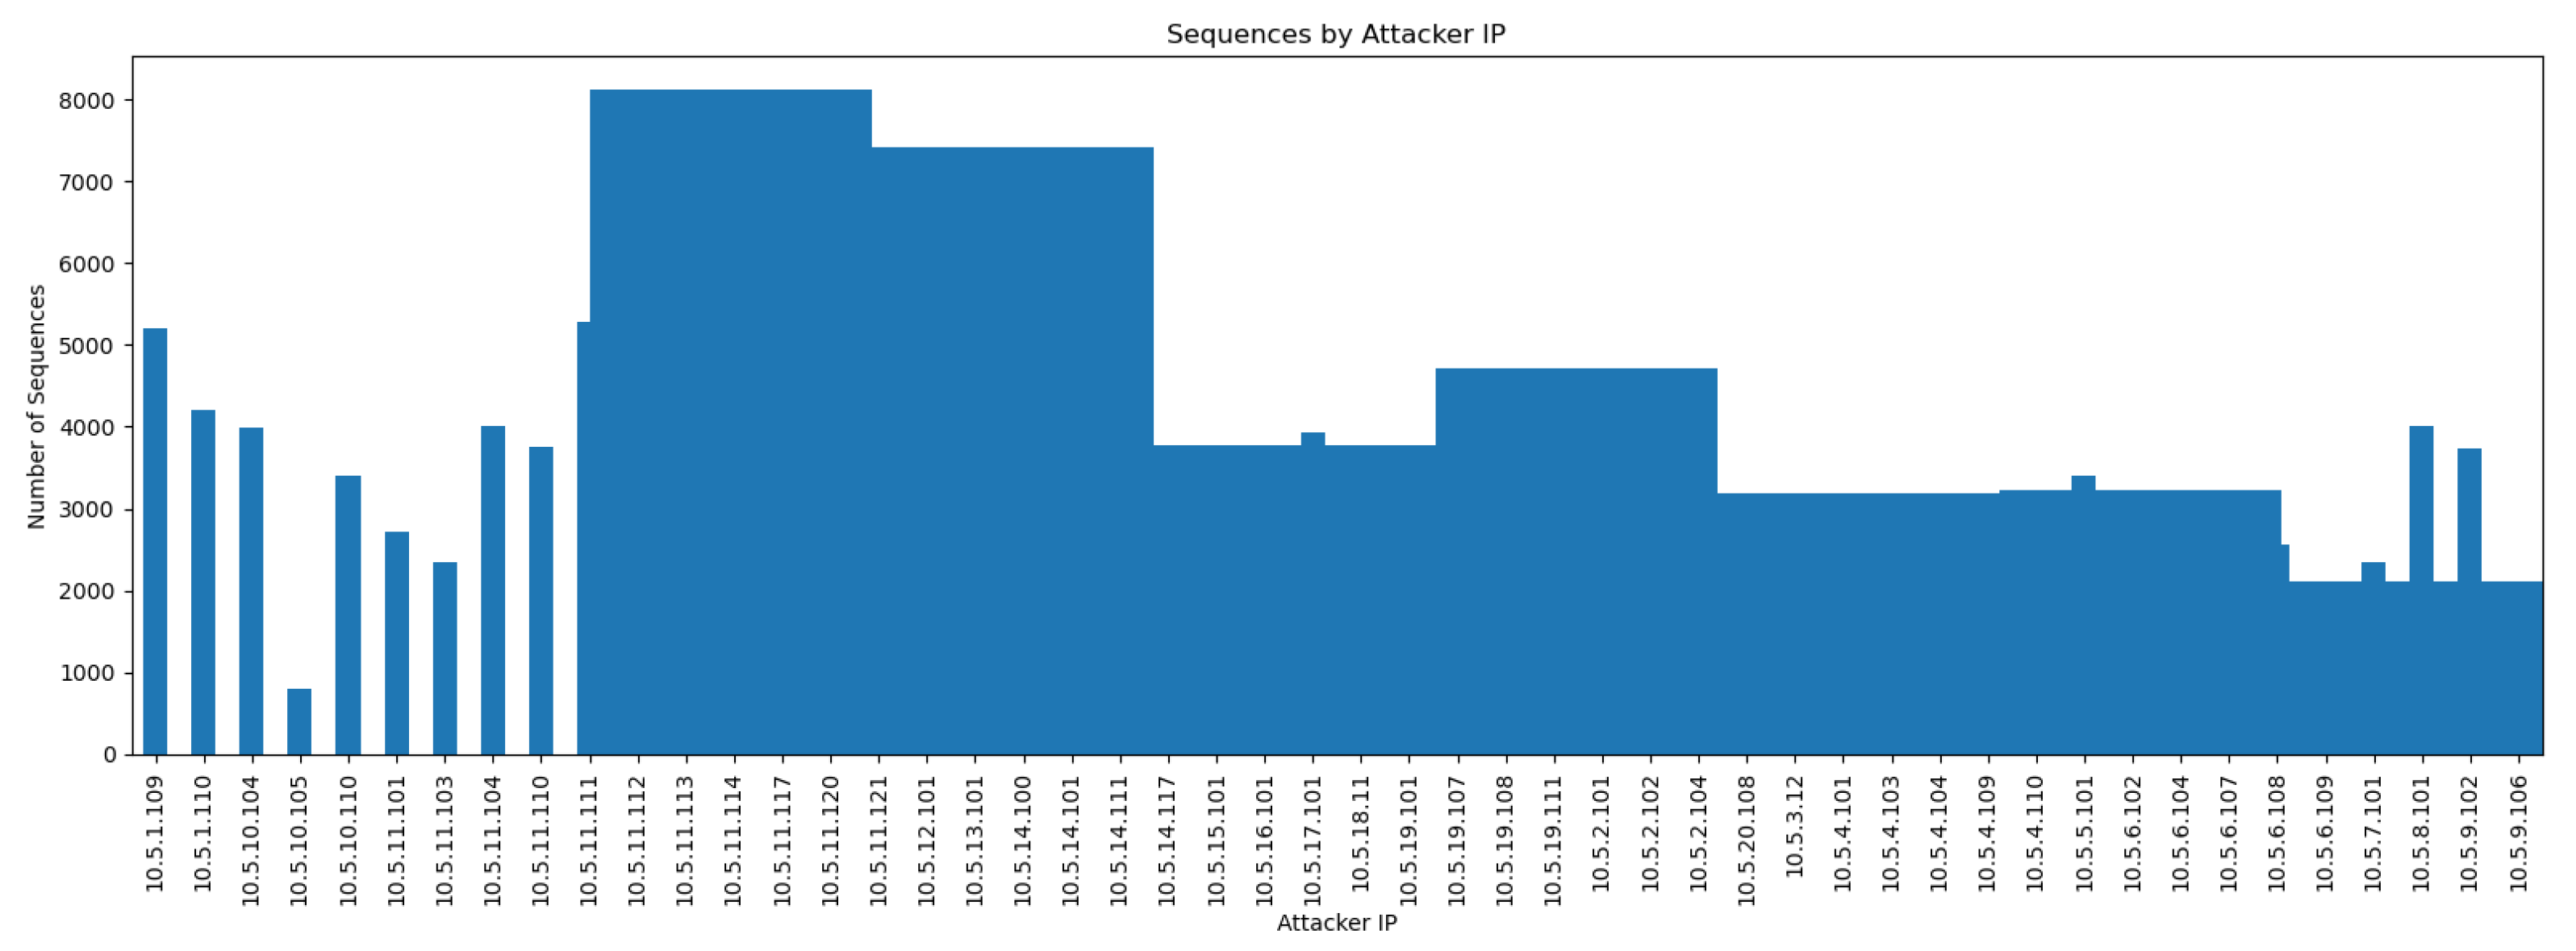
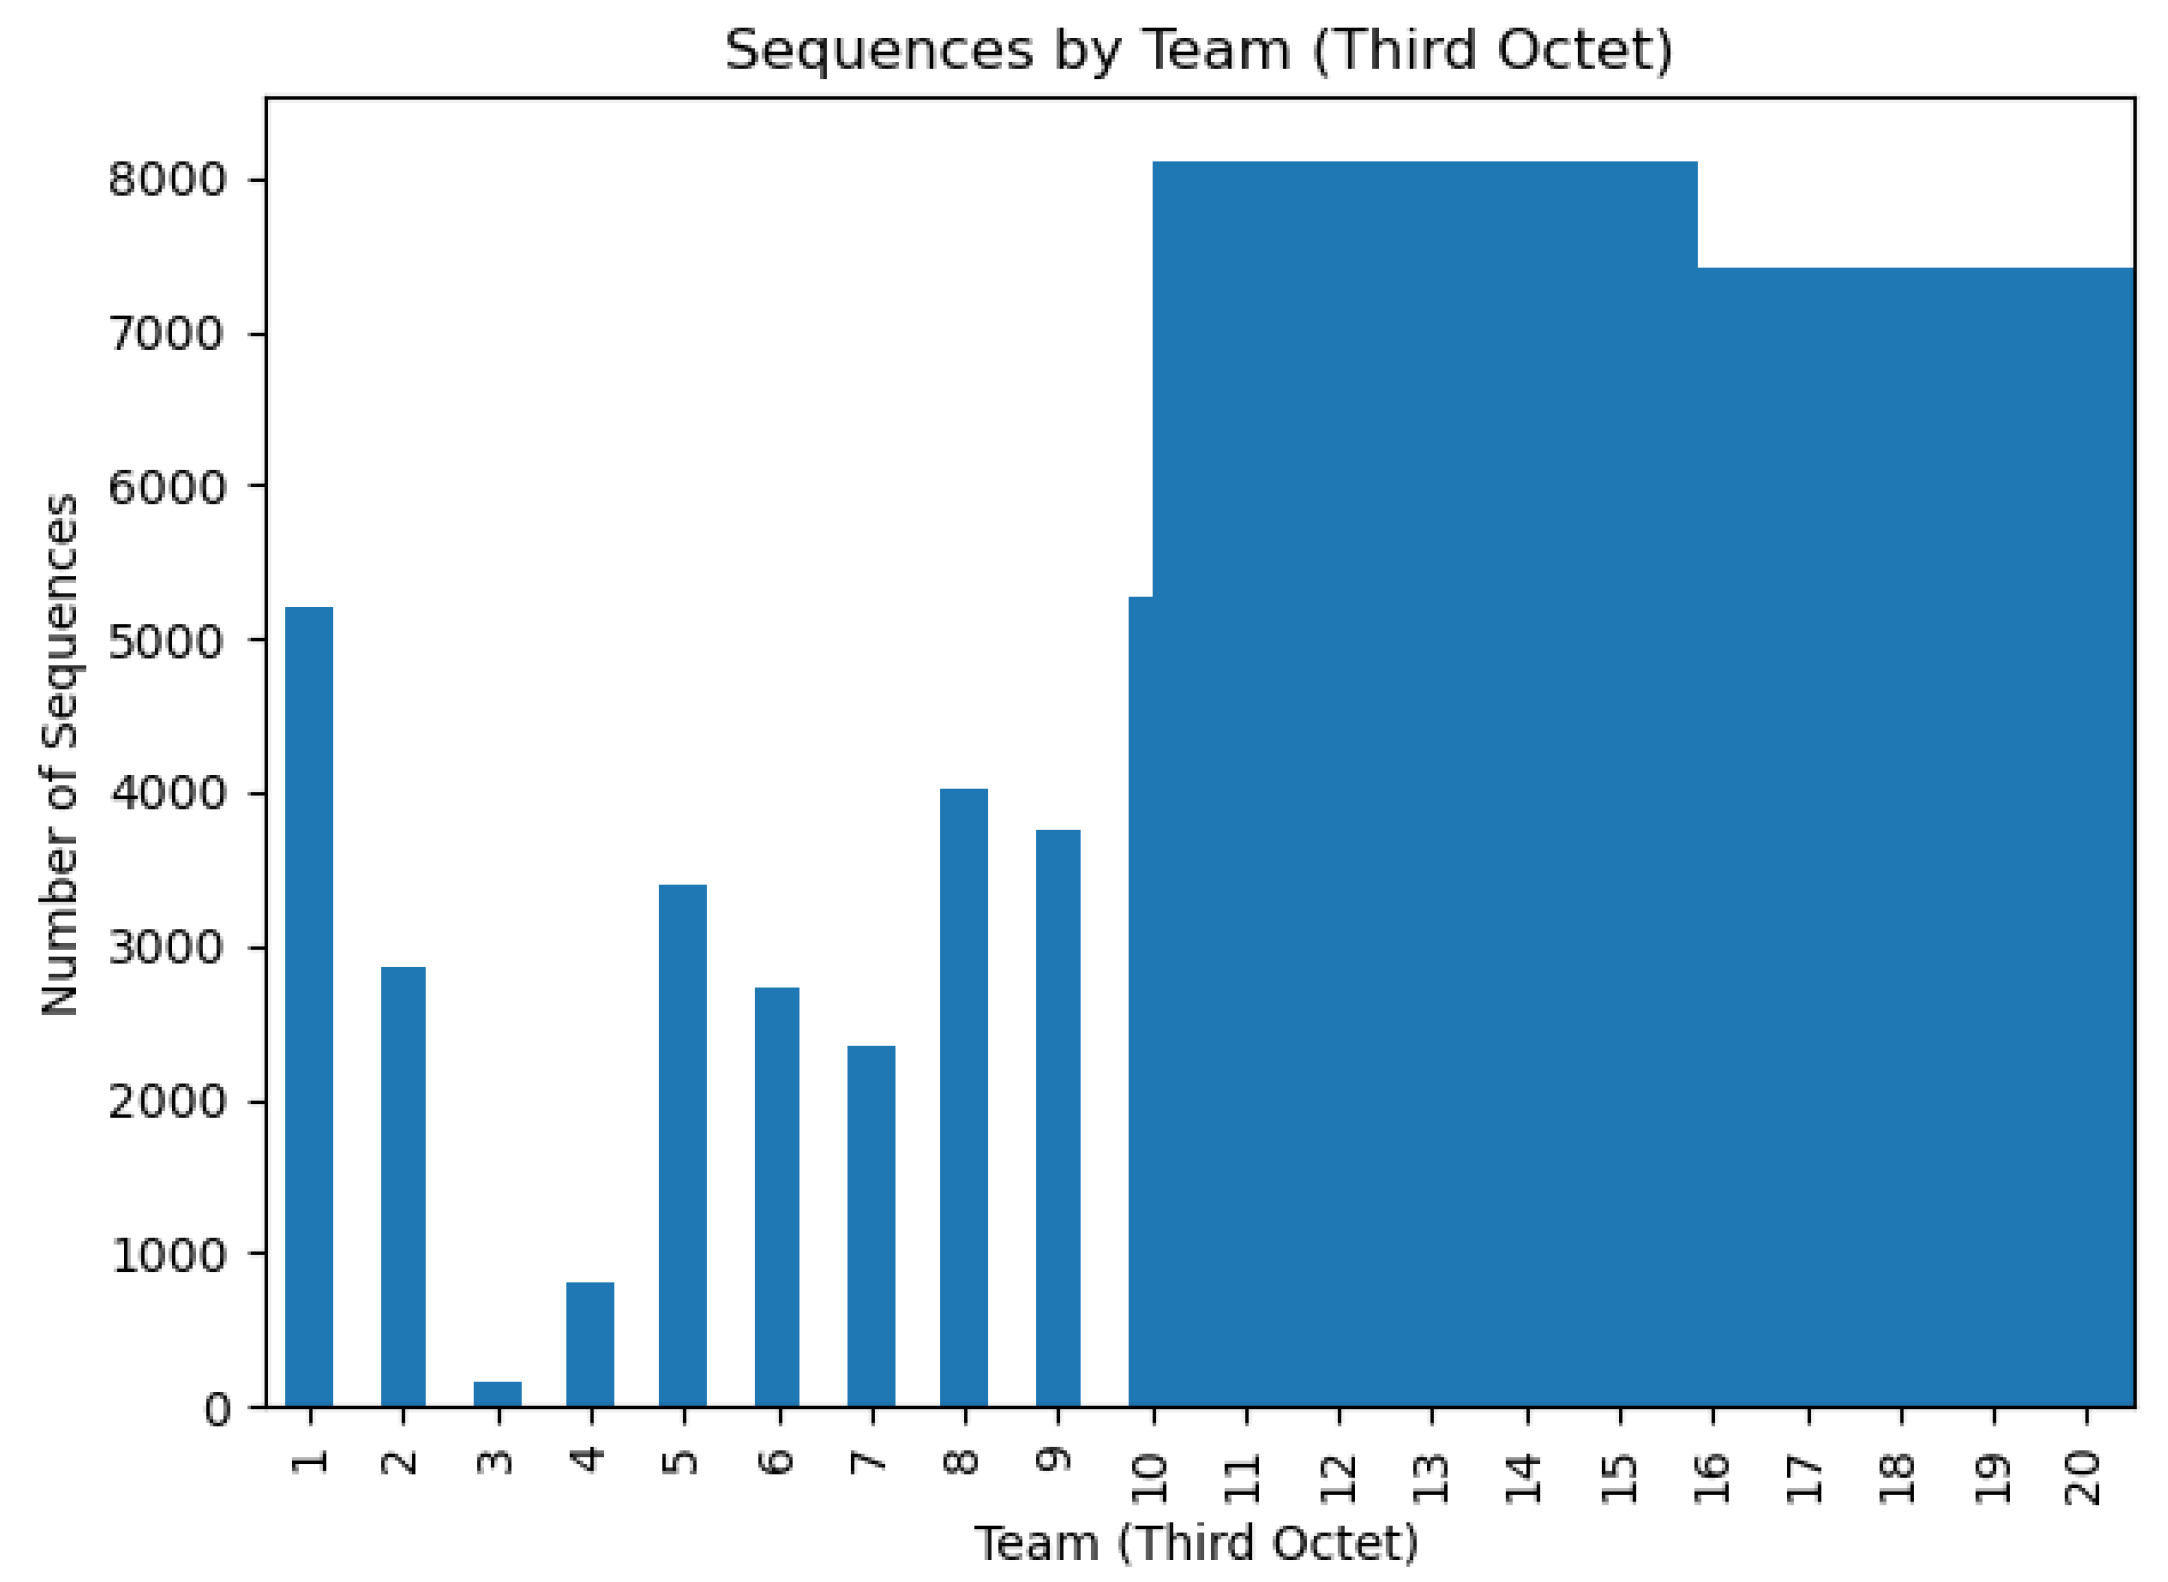
The distribution of sequences by attacker IP and by team, illustrated in
Figure 2 and
Figure 3, showed a significant imbalance in the number of sequences generated by each entity. This imbalance introduced an additional challenge, as attribution models must avoid overfitting to majority classes and maintain robust performance against minority classes. Regarding the complexity of the sequences,
Figure 4 shows the distribution of their lengths. While most sequences were relatively short, there were notable outliers with significantly greater lengths. The distribution revealed a median length of 38, but the upper percentiles (95th through 100th) converged at 243, highlighting the presence of a long tail composed of particularly extensive and complex sequences.
Figure 4 visually illustrates this distribution, highlighting the variability in sequence lengths.
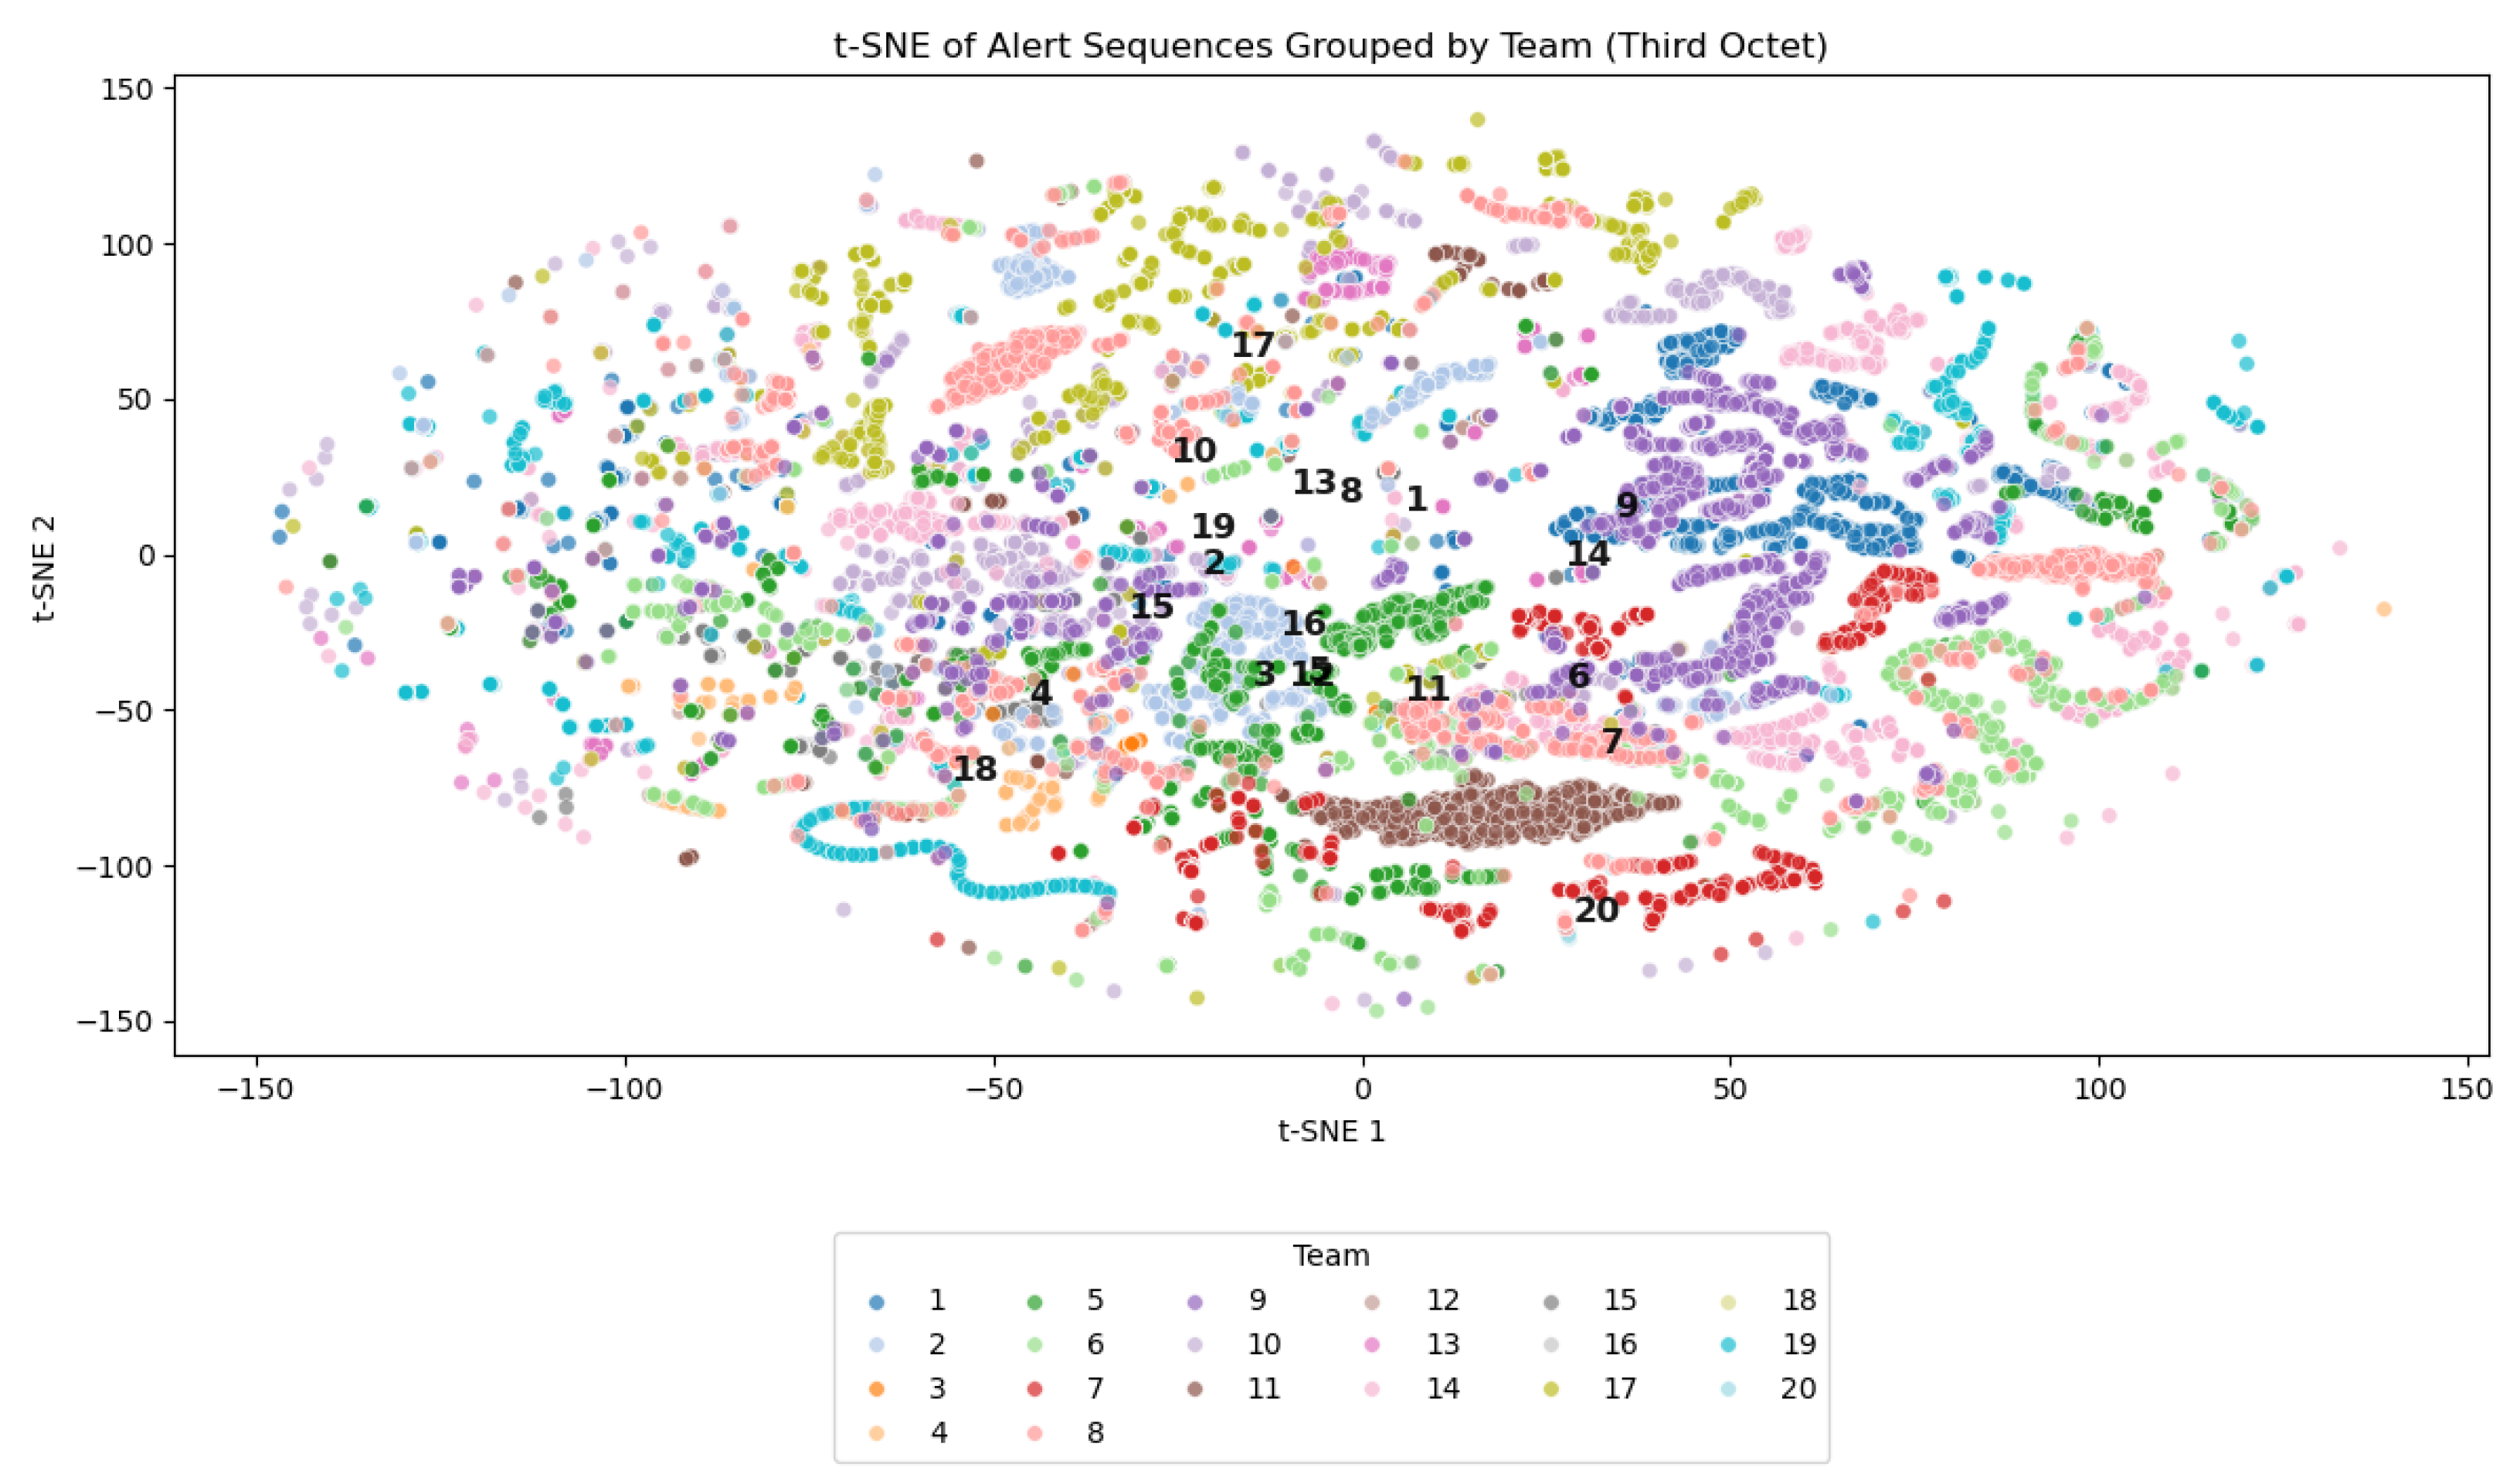
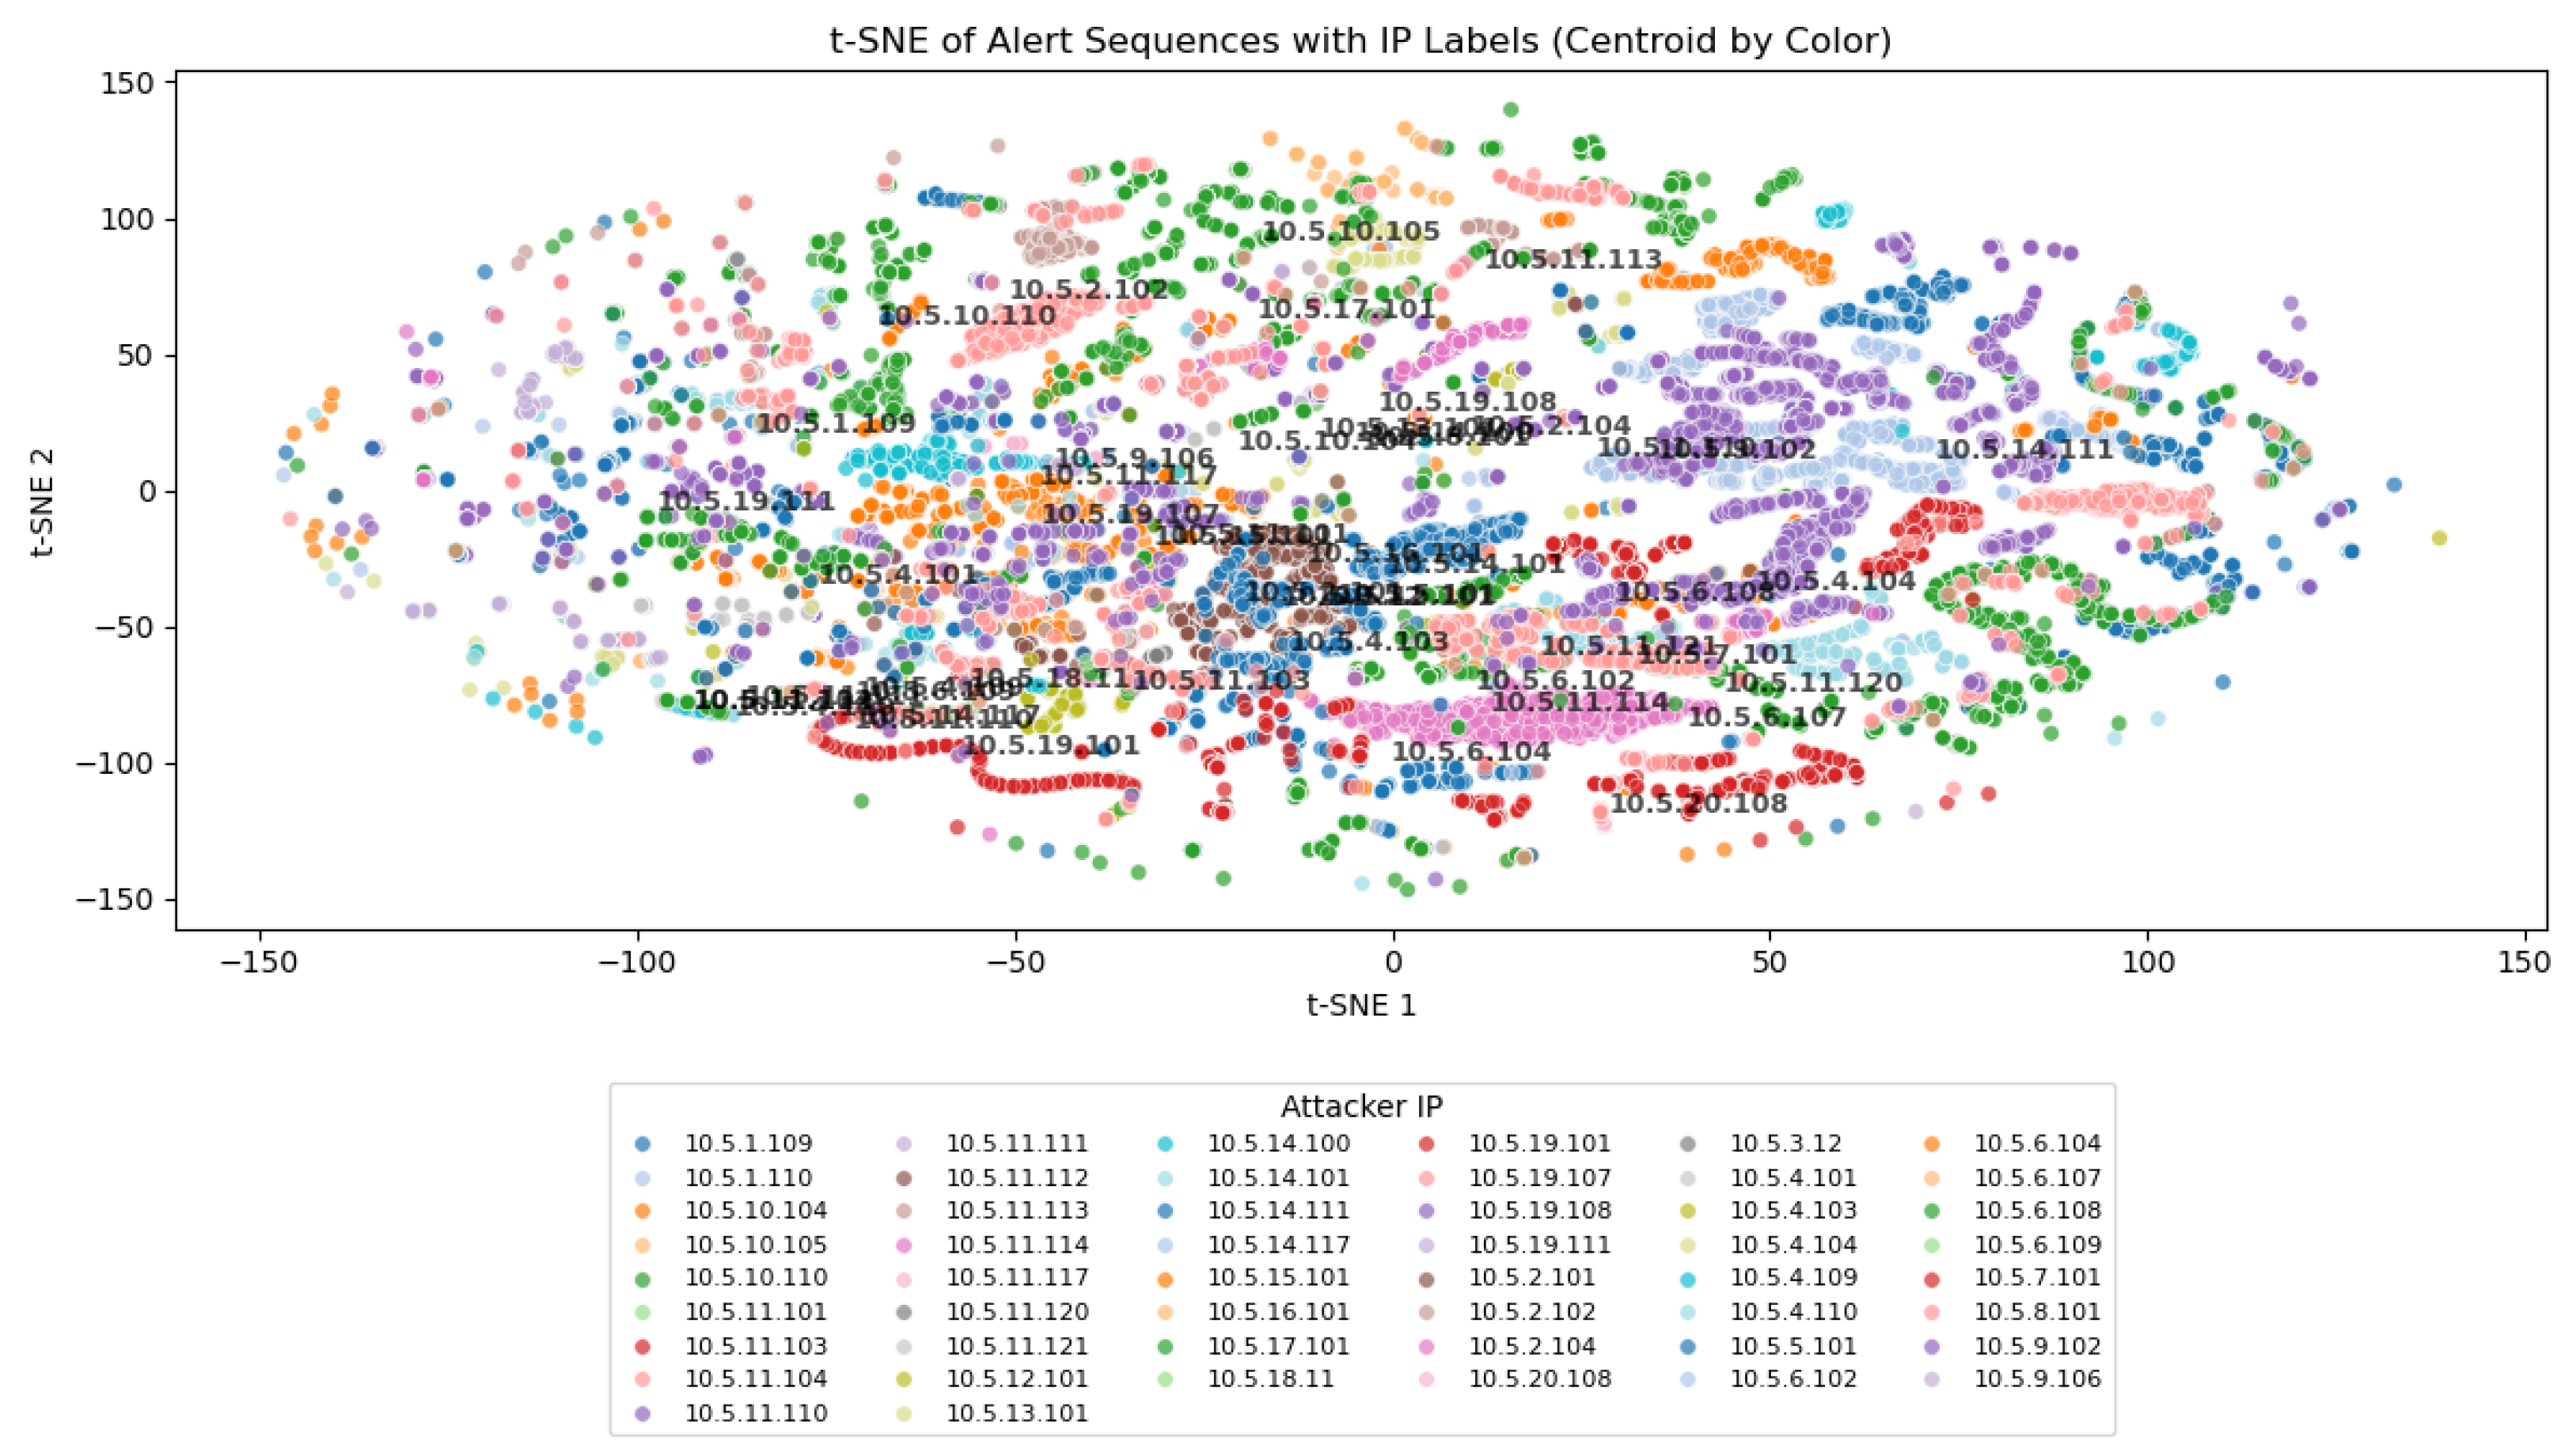
The separability of classes and the inherent difficulty of the attribution task were evaluated using t-SNE visualizations, shown in
Figure 5 and
Figure 6. These visual tools were crucial for understanding the underlying complexity of the attack attribution problem.
In
Figure 5, each point corresponds to an alert sequence generated by a specific team, with colors indicating the team of origin. The absence of well-defined clusters suggested a high degree of overlap between sequences from different teams. In several regions of the plot, sequences from multiple teams appeared intermingled, making it clear that there was no simple separation in the feature space. This overlapping distribution highlights the intrinsic challenge of distinguishing attackers based solely on the characteristics of their alert sequences.
On the other hand,
Figure 6 presents the centroids of the alert sequences, offering a more abstract and aggregated perspective of how the sequences were distributed in the feature space. Each point in this figure corresponds to the centroid of a group of sequences attributed to a specific team. The observed dispersion and overlap among these centroids underscored the difficulty of achieving clear class separation. This observation aligns with the silhouette index values reported earlier, which were negative for both attacker IP and team labels. Such negative values confirmed that the clusters were poorly defined and that the sequences did not naturally group according to their true labels. These results emphasize the complexity of the attribution task in this setting and highlight the necessity of employing more sophisticated models capable of capturing subtle distinctions in attacker behavior.
While the CTF dataset provides a rich and realistic foundation for studying multi-adversary attack attribution, it is essential to acknowledge its inherent limitations and contextualize its characteristics relative to other datasets commonly used in cybersecurity research. First, the dataset spans only 2.17 days across 272 structured rounds, which contrasts with the continuous and long-term monitoring typical of production environments. This temporal constraint may limit the observation of persistent attack behaviors or seasonal variations. Additionally, the controlled nature of the competition—with known participants and predefined objectives—differs significantly from real-world scenarios, where attackers operate with diverse motivations, resources, and levels of sophistication. The attack diversity is also constrained to services specific to the CTF setting, potentially excluding other vectors such as zero-day exploits or social engineering. Moreover, the artificial segmentation of traffic into 5 min rounds introduces boundaries that do not exist in real networks, potentially affecting the model’s ability to generalize to asynchronous or irregular attack patterns. In comparison with other datasets, such as UNSW-NB15, the CTF dataset offers unique advantages and challenges. While UNSW-NB15 includes a mix of benign and malicious traffic, the CTF dataset consists entirely of malicious alerts, making it particularly suitable for attribution tasks. Furthermore, UNSW-NB15 operates in a mono-adversary context, whereas the CTF dataset captures simultaneous multi-adversary interactions, providing a more complex and realistic setting for attribution modeling. The temporal structure also differs, with CTF offering a longer duration and more granular segmentation. Compared to production datasets, the CTF data lacks the unpredictability of unknown attackers, dynamic topologies, and advanced evasion techniques, but it compensates with a high density of strategic and adversarial behavior. These distinctions underscore the relevance of the CTF dataset for studying attribution in competitive environments, while also highlighting the need for methodological adaptations when extending the approach to broader operational contexts.
3.1.2. Justification of Dataset Selection and Comparative Analysis
In this work, we focused on the attacker attribution of MSNAs using a dataset derived from a real CTF competition. After preprocessing, our CTF dataset contained 53,830 MSNA sequences, each representing a temporally ordered series of malicious alerts generated by 50 unique attacker IPs (corresponding to 20 teams) against 20 victim teams, across 272 competitive rounds. This structure provided a rich, realistic, and highly diverse environment for evaluating attribution models in genuine multi-adversary scenarios. To illustrate the uniqueness and suitability of the CTF dataset for this task, we applied the same preprocessing methodology to UNSW-NB15 [
23], one of the most widely used benchmark datasets in the cybersecurity literature. UNSW-NB15 is a synthetic dataset designed primarily for intrusion detection and attack classification, not for attribution. When extracting MSNA-type sequences from UNSW-NB15, we found that it contained a maximum of 40 attack sequences (MSNA) originating from only 4 unique source IPs (the “attackers”), targeting 10 different destination IPs (the “victims”). The vast majority of the dataset consisted of benign or non-attributable traffic, and the adversarial interactions were extremely limited in both scale and diversity. Importantly, UNSW-NB15 was never intended or declared as a multi-adversary benchmark; its design and labeling do not reflect the complexity or concurrency of real-world adversarial scenarios. In contrast, the CTF dataset is inherently multi-adversary by nature as it captures simultaneous, competitive interactions among multiple attackers and defenders in a dynamic environment. This stark contrast demonstrates that while UNSW-NB15 and similar datasets are valuable for detection and classification tasks, they are not suitable for studying multi-adversary attribution. Their synthetic nature, lack of temporal structure, and minimal number of attackers and victims make them fundamentally different from the complex, dynamic, and adversarial environment captured in the CTF dataset.
3.2. Method
Multi-stage attack attribution presents distinctive challenges due to the sequential and temporal characteristics of IDS alerts. The architecture proposed in this work addresses these challenges through a tailored adaptation of the Transformer model, specifically designed to capture intricate temporal patterns and long-range dependencies within alert sequences. In contrast to the original Transformer, which is geared toward sequence-to-sequence tasks, our model excludes the decoder component and concentrates on extracting temporal features for classification purposes.
The attack attribution problem was mathematically formulated as a function , where the input space consists of triplets . Here, and denote the victim and attacker IP addresses, respectively, and is a sequence of n alerts, with each representing a discrete alert type. The output space corresponds to the probability distribution over the set of possible attackers . This formulation allows for the capturing of both the sequential nature of attacks and the contextual information provided by the involved IPs.
To process this input, we propose a model architecture capable of simultaneously capturing local features at the alert level and global dependencies throughout the sequence. The model’s capacity to handle sequences of varying lengths and learn context-sensitive representations makes it particularly suitable for attribution in MSNA environments.
Discrete entities (IPs and alerts) are mapped to continuous vector representations via embedding layers:
where
and
denote the embedding dimensions for IP addresses and alerts, respectively.
The resulting embeddings are
where
are the victim and attacker IP embeddings and
is the matrix of alert embeddings.
To encode temporal information, we add a sinusoidal positional encoding to the alert embeddings:
where
is the model (embedding) dimension used in the Transformer encoder and
and
i are the position and dimension indices, respectively.
The encoded sequence is , with .
The core of the model is a multi-head self-attention mechanism, defined for each head as
where
are the query, key, and value matrices, obtained via learned linear projections of the input, and
is the dimension of each head.
The multi-head output is
where
h is the number of attention heads,
is a learned output projection matrix, and
denotes concatenation along the feature dimension.
The encoded sequence is processed by the Transformer encoder, yielding a contextual representation .
To aggregate the sequence, we apply mean pooling:
where
is the
i-th row of
and
.
The final representation is formed by concatenating the pooled sequence and the IP embeddings:
where
denotes vector concatenation.
The output is computed as
where
and
are the weights and bias of the final linear layer and
is the number of attacker classes.
Notation: Bold symbols (e.g., , , ) denote vectors or matrices; normal font denotes scalars or indices. The operator indicates vector concatenation. All dimensions are explicitly defined at first use.
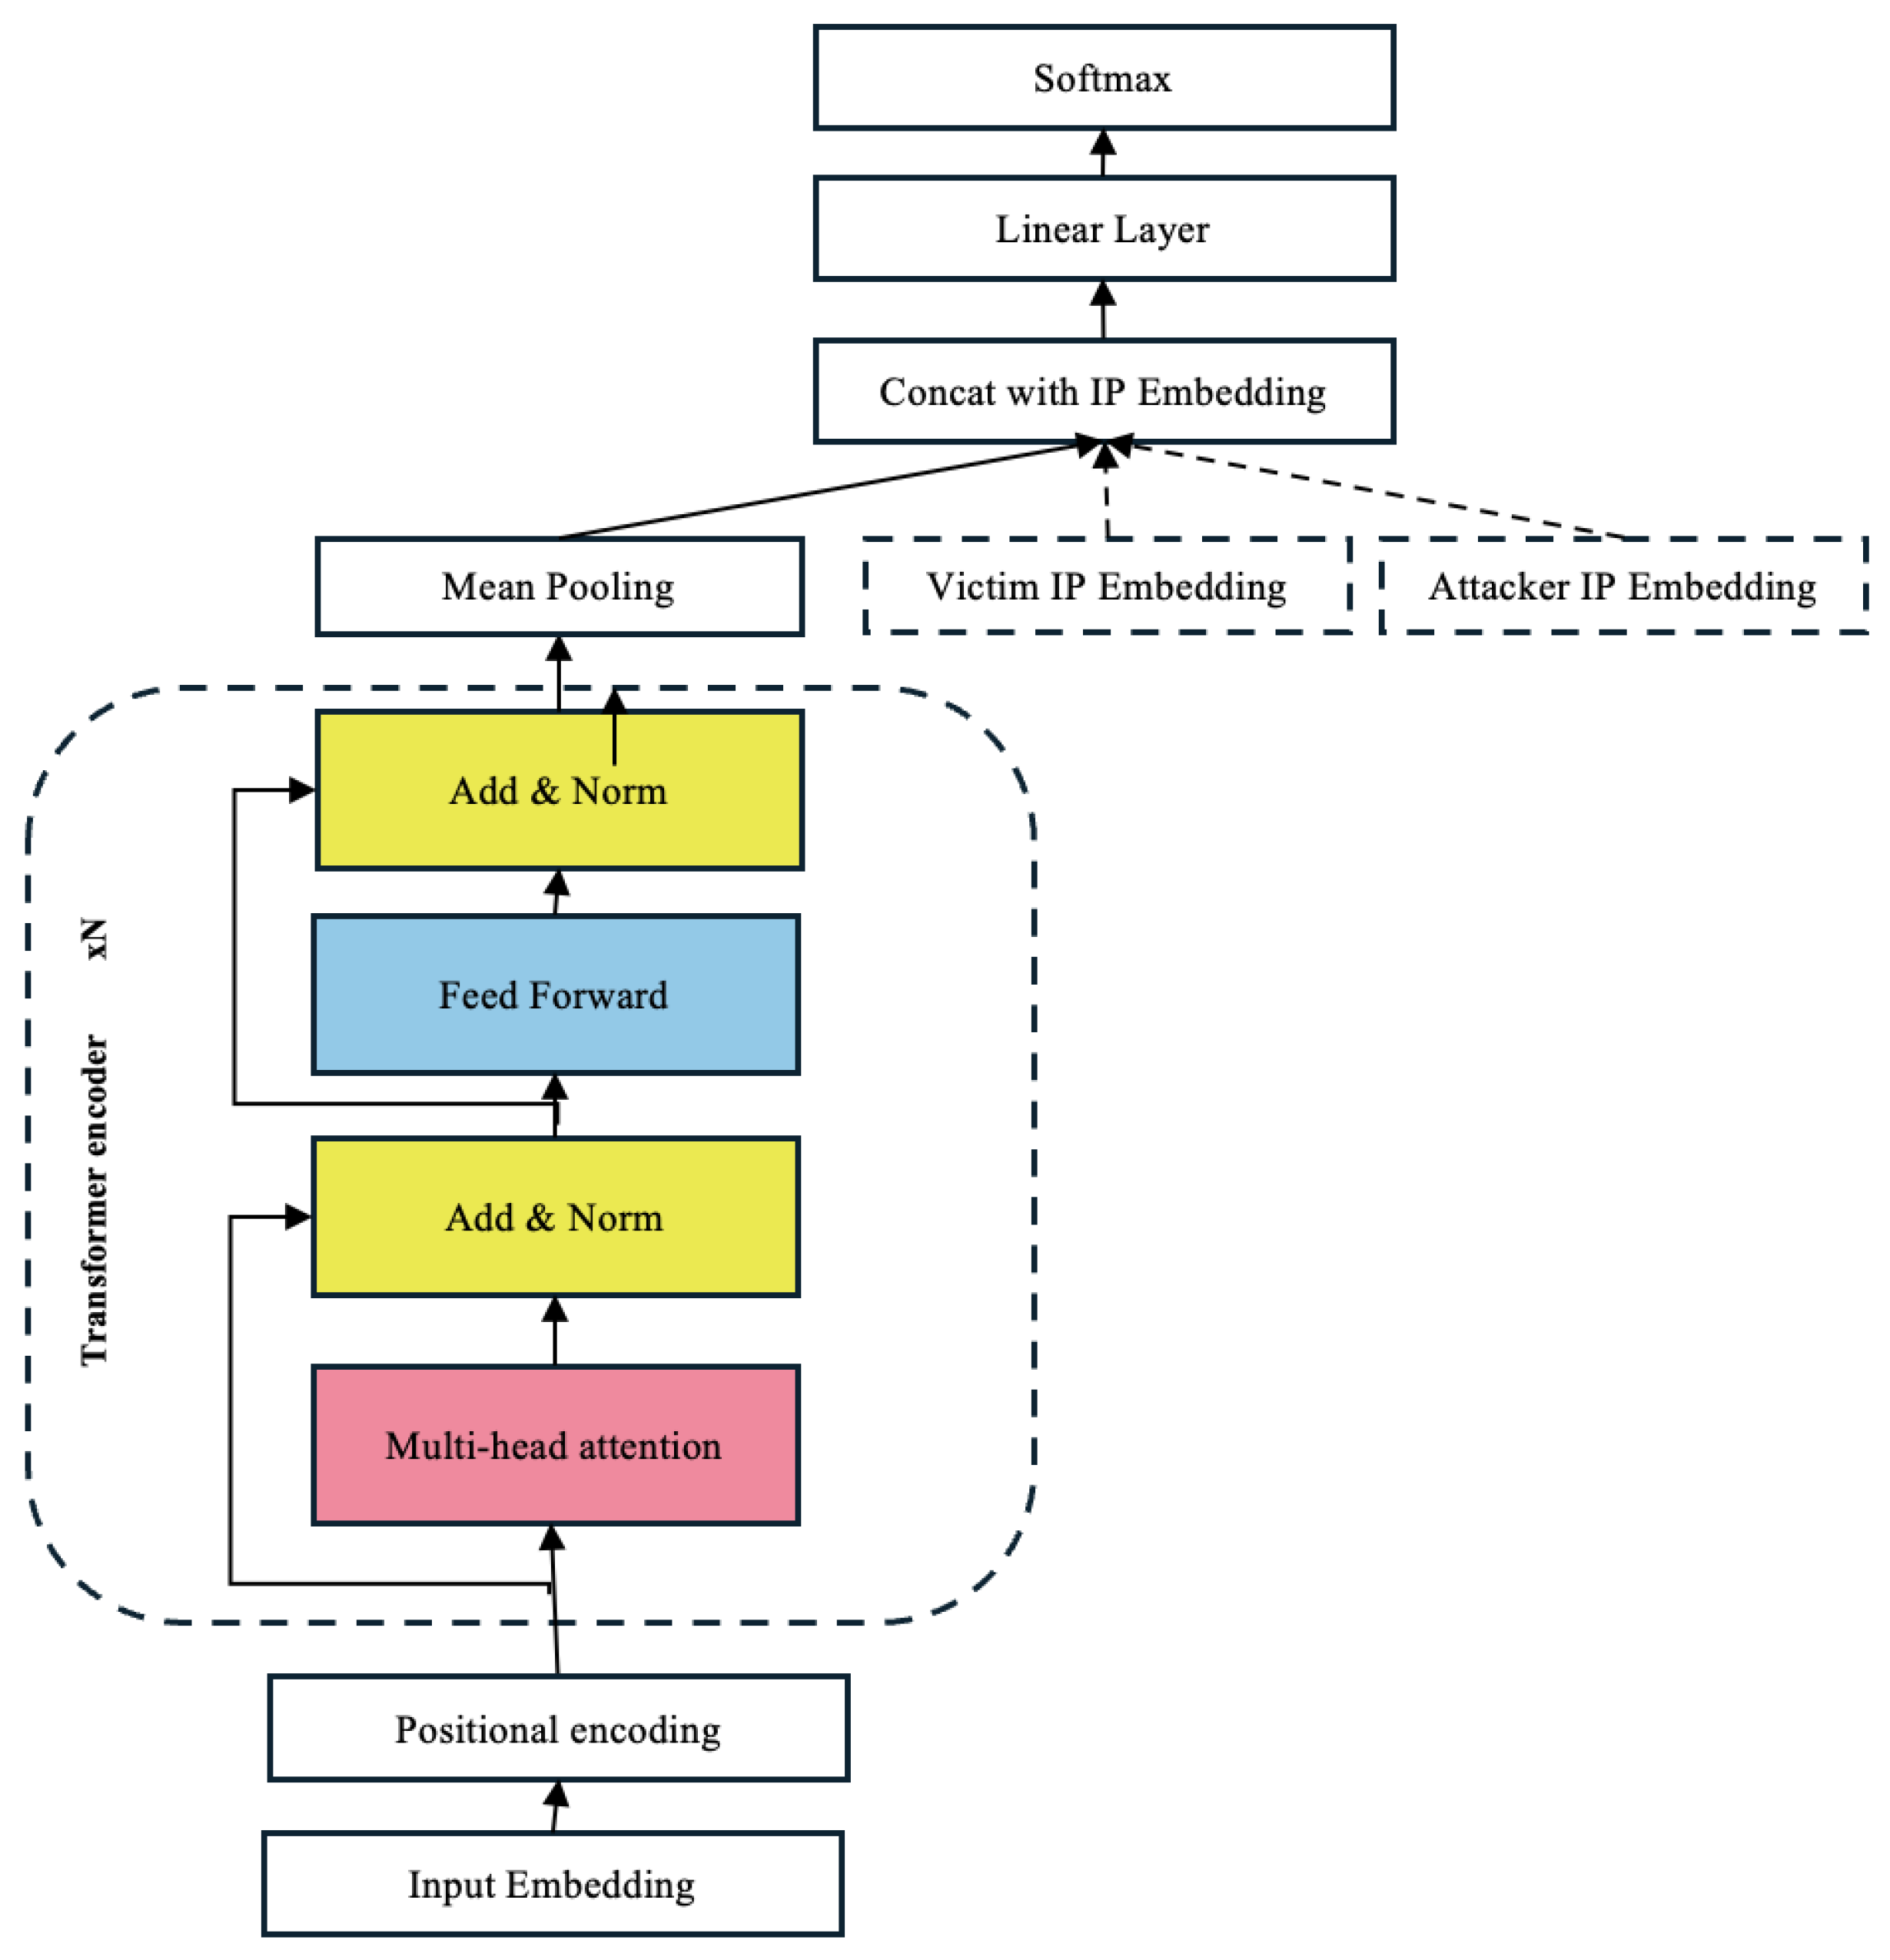
The overall architecture and the interaction between its main components are illustrated in
Figure 7, which visually summarizes the flow from input embeddings and positional encoding, through the Transformer encoder, to the final classification layer for attacker attribution. This architecture efficiently captures both the local features of each alert and the global dependencies within the sequence. The proposed model integrates the following fundamental components to achieve effective attack attribution:
IP and Alert Embeddings: Dense, learnable vector representations (, , ) enable the model to capture semantic relationships between IPs and alert types, facilitating the generalization of attacker behavior patterns across diverse scenarios.
Positional Encoding: Sinusoidal positional encoding () is added to the alert embeddings to preserve the temporal order of alerts, a critical aspect for modeling the evolution and characteristic patterns of multi-stage attacks.
Transformer Encoder: The core of the architecture, composed of multi-head self-attention and feed-forward layers, models long-range dependencies and complex relationships between alerts, regardless of their temporal distance in the sequence.
Aggregation and Concatenation: Temporal aggregation (mean pooling, ) condenses the sequence into a global representation, which is then concatenated with the contextual information of the involved IPs (), allowing the model to jointly consider temporal patterns and attack context.
Classification Layer: A final linear layer transforms the aggregated features into a probability distribution over the possible attackers, enabling robust attribution in multi-adversary settings.
This design adheres to the core principles of the Transformer model while specializing in attack attribution. Its modular structure and clear separation between embedding, encoding, and classification stages facilitate efficient adaptation to a wide range of attribution scenarios, while preserving the model’s ability to learn intricate patterns across variable-length alert sequences.
4. Experimental Results
In this section, we revisit the central problem addressed in this work: the accurate attribution of attacks in multi-adversary environments, where each alert sequence must be correctly associated with the responsible attacker. As highlighted by the exploratory t-SNE analysis presented in
Section 3, the sequence representations exhibited significant overlap and complexity, suggesting that the decision boundaries between attackers were non-trivial. This challenge was further exacerbated by severe class imbalance and the presence of multiple attackers with partially overlapping behavioral patterns.
Our hypothesis was that Transformer-based models, due to their ability to model temporal dependencies and capture complex interactions between entities (such as IPs and alert types), are better suited to this task than traditional architectures like MLPs. We posited that their capacity to manage multiple information flows and learn contextual relationships enables them to generalize more effectively, particularly in the presence of minority classes and contaminated data subsets.
To evaluate this, we first implemented a baseline MLP model to establish a performance reference and then assessed a Transformer-based model using standard multiclass classification metrics (accuracy, macro and weighted F1-score), per-class analysis, training dynamics, and robustness tests. This comparative analysis allowed us to validate whether the modeling advantages of Transformers translate into tangible improvements in attacker attribution performance.
4.1. MLP Model Performance (Baseline)
To establish a clear and quantifiable reference for the task of attack attribution in multi-adversary environments, we implemented an MLP classifier as a baseline. This subsection aims to demonstrate the limitations of traditional approaches and justify the need for more advanced models, such as the Transformer, in scenarios characterized by high complexity and class imbalance.
The MLP was designed to process alert sequences represented as integer vectors, where each alert is transformed into a learned embedding. The entire sequence was flattened and fed into a deep neural network with several hidden layers. The specific configuration of the model was as follows:
Embedding layer: 64-dimensional embedding for each alert.
Network structure: three hidden layers with 1024, 512, and 256 neurons, respectively, each followed by ReLU activation, batch normalization, and dropout (0.2).
Input: sequences of lengths between 9 and 243 alerts, padded to the maximum length.
Loss function: cross-entropy with class weights inversely proportional to class frequency to mitigate imbalance.
Optimizer: Adam, initial learning rate 0.001.
Training: early stopping with patience of 20 epochs; batch size 128; data split into 60% training, 20% validation, and 20% test.
This architecture allowed for a fair and reproducible comparison against more sophisticated models and helped to gauge the challenge posed by attribution in this context.
Figure 8 shows the evolution of the F1-score for the five best classified IPs by the model throughout the training epochs. The MLP quickly learned to identify majority classes, achieving high precision, recall, and F1-score within a few epochs and maintaining them close to 1.0. These IPs—
10.5.11.110,
10.5.7.101,
10.5.11.114,
10.5.2.101, and
10.5.19.111—achieved consistently high performance, with F1-scores converging toward 1.0 as training progressed. This highlights the model’s ability to generalize well for frequent or well-represented attacker classes.
The results obtained by the MLP on the test set reflect the limitations of this approach. The macro F1-score was considerably lower than the weighted F1-score, indicating that the model tended to favor majority classes and struggled to generalize to minority ones. The main metrics were
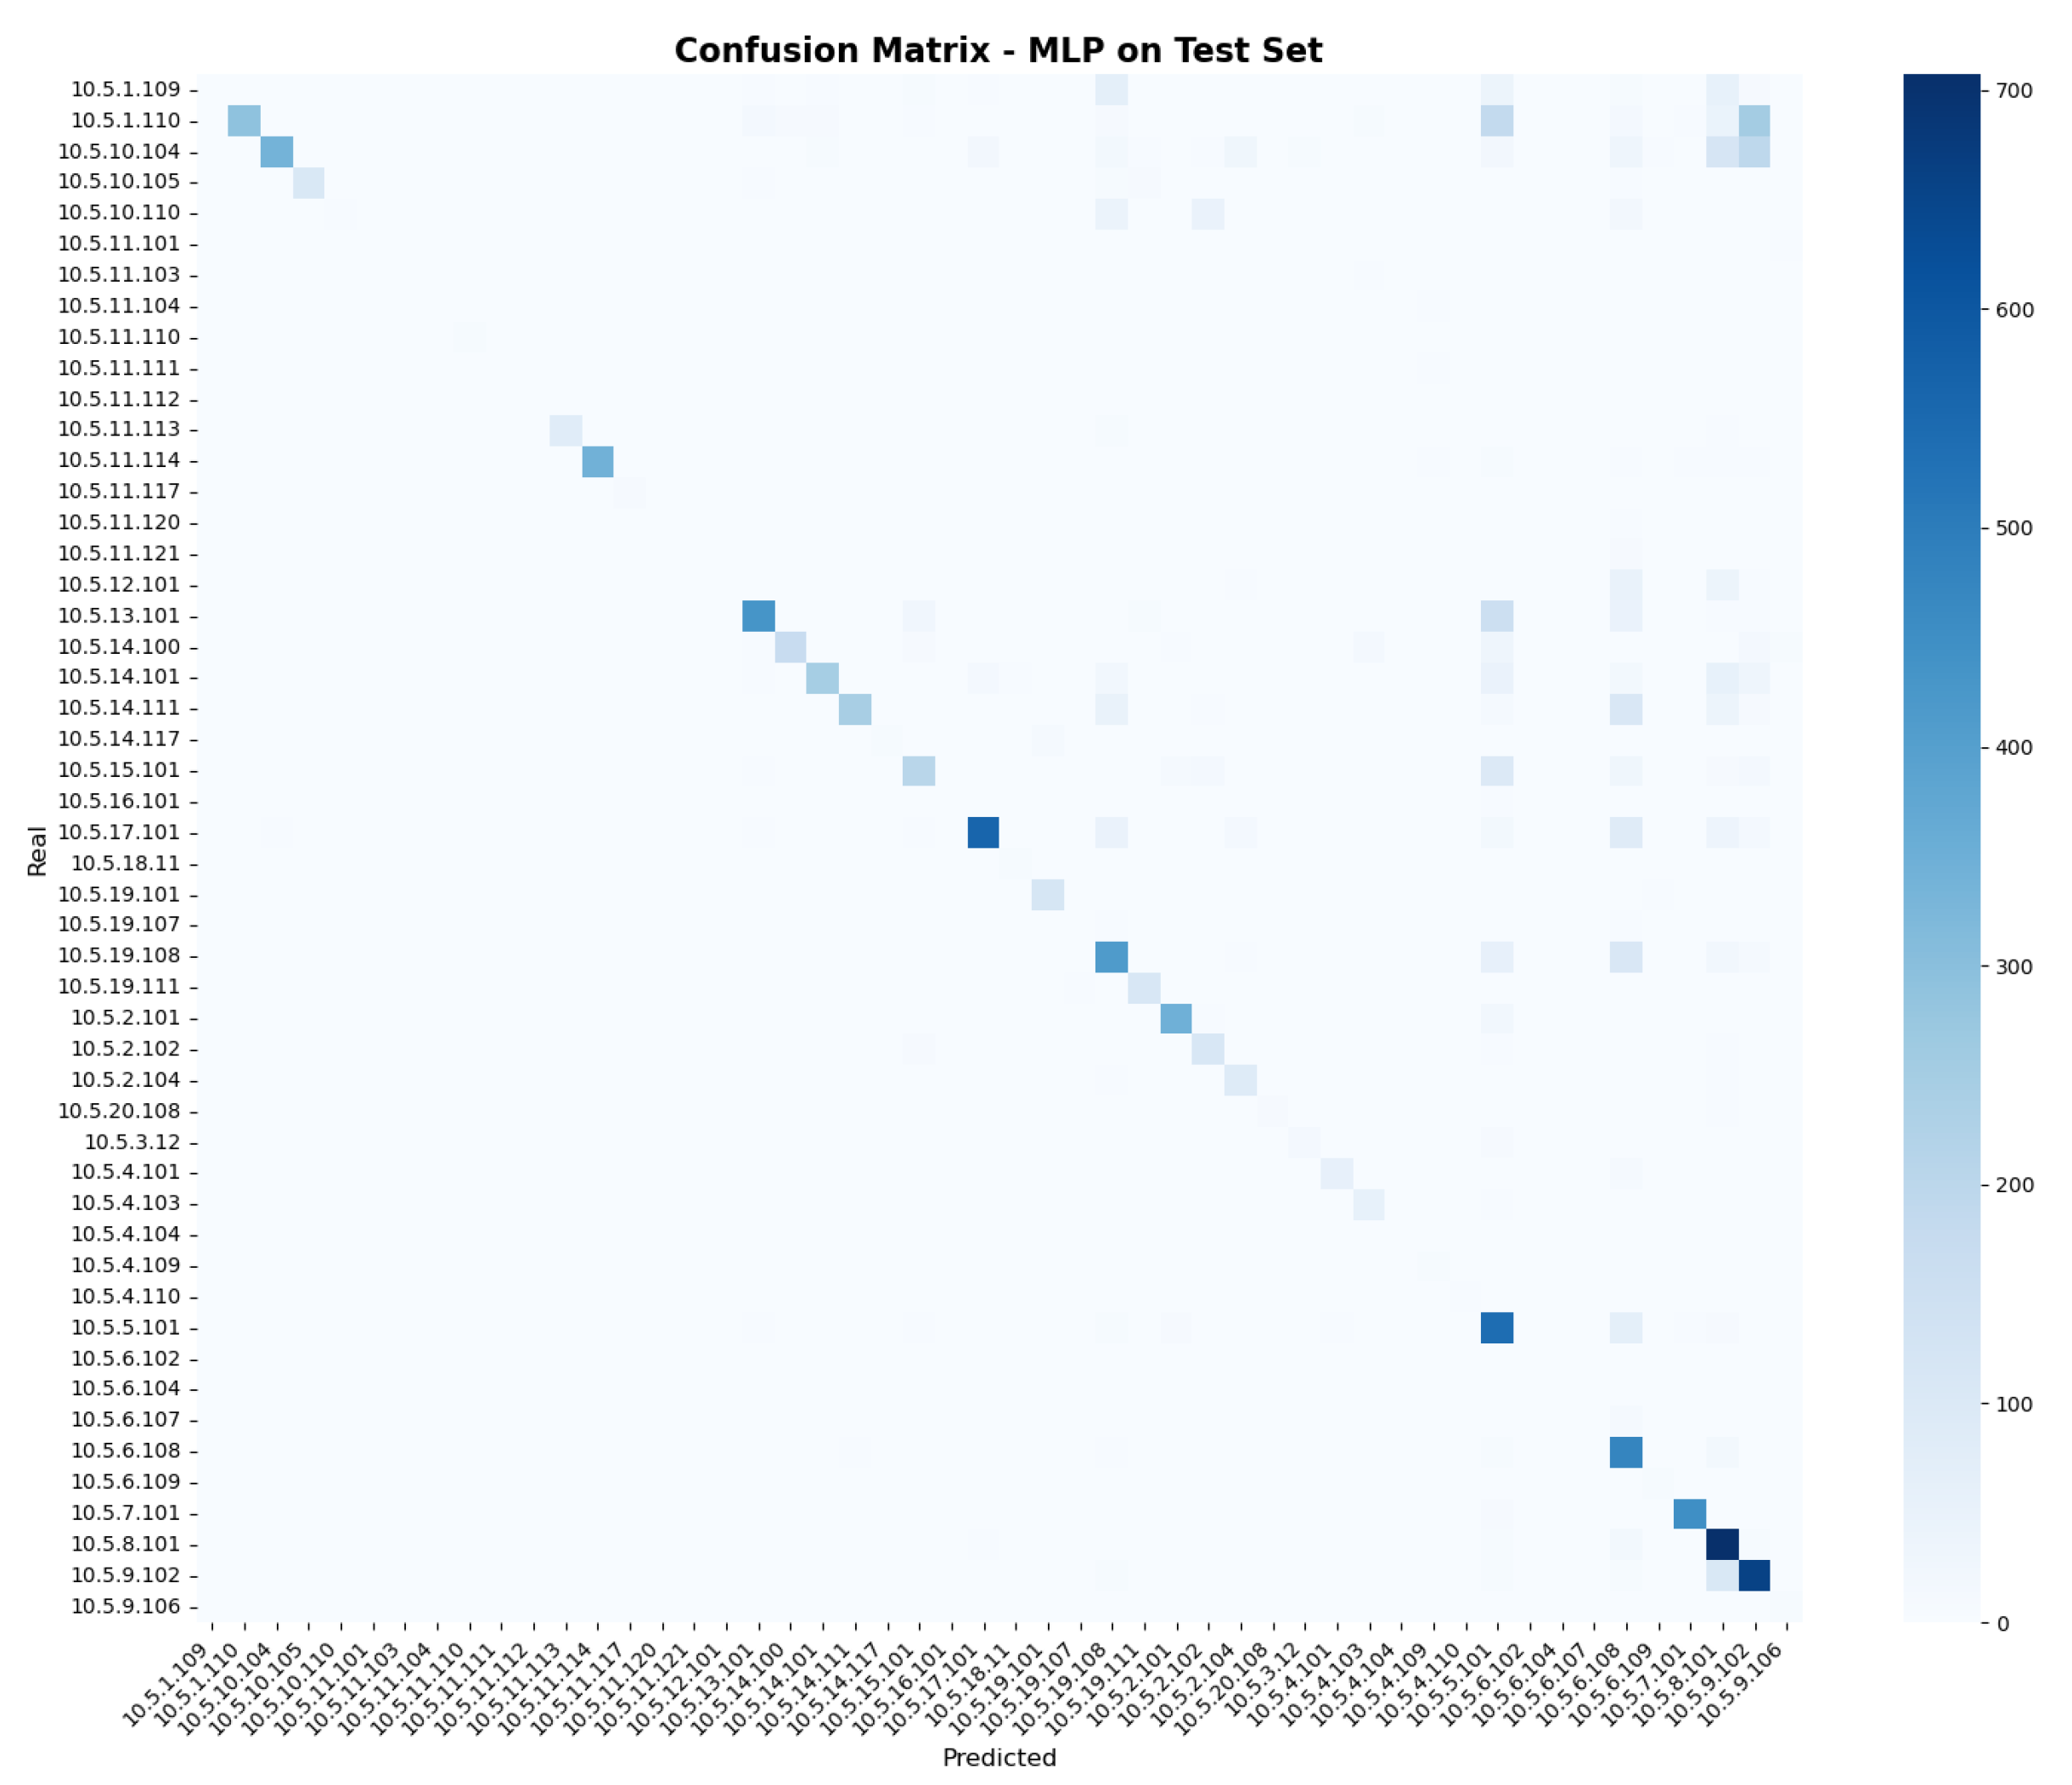
The confusion matrix shown in
Figure 9 reinforces this diagnosis. The model correctly identified several of the IPs with the largest number of samples, such as
10.5.1.110,
10.5.8.101,
10.5.10.104,
10.5.17.101, and
10.5.9.102, which showed high values on the diagonal. However, performance dropped significantly for certain classes, such as
10.5.8.101 misclassified as
10.5.9.102,
10.5.17.101 as
10.5.16.101, and
10.5.6.107 as
10.5.6.108, where the model frequently confused similar patterns. In these cases, most examples were assigned to neighboring or semantically related classes, rather than being rarely classified correctly. This reflects a systematic bias and the MLP’s difficulty in learning distinctive patterns in overlapping or imbalanced scenarios. This error pattern was not random but concentrated in specific classes (attackers), indicating a bias toward classes with greater support. This phenomenon was consistent with the low macro F1-score, which penalized the inability to generalize to minority classes. Overall, these results show that while the MLP can be effective at identifying frequent attackers, its ability to discriminate among multiple adversaries in imbalanced scenarios is moderate, and it tends to systematically confuse closely related attackers.
4.2. Transformer Model Performance
To address the complexity of attack attribution in multi-adversary environments, we implemented a model based on the Transformer architecture, adapted to process alert sequences and capture long-range contextual dependencies. This subsection describes the specific configuration of the model and justifies its selection over traditional approaches. The Transformer model was designed to represent both IP addresses (victim and attacker) and alert identifiers using learned embeddings. The alert sequence was transformed into an embedding matrix, to which positional encoding was added to preserve temporal order. The core of the model was a multi-layer Transformer encoder, whose output was combined with the IP embeddings and fed into a dense layer for final classification. The specific configuration was as follows:
Alert embedding layer: 16 dimensions.
IP embedding layer: 16 dimensions for each IP (victim and attacker).
Positional encoding: applied to the alert sequence.
Transformer encoder: one or two layers, four attention heads, model dimension 16, dropout 0.1.
Input: sequences of lengths between 9 and 243 alerts, padded to the maximum length.
Loss function: cross-entropy with class weights inversely proportional to class frequency.
Optimizer: Adam, initial learning rate 0.001.
Training: early stopping, batch size 128, stratified cross-validation. Data split into 60% training, 20% validation, and 20% test. However, to ensure a more robust and unbiased evaluation, the experiments with the Transformer model employed a 5-fold stratified cross-validation scheme. In this setup, for each fold, 80% of the data was used for training, 10% for validation, and the remaining 10% for testing, ensuring that all samples were used for testing exactly once across the folds.
Training and validation of the Transformer model required approximately 41 min per fold. Considering 5-fold cross-validation, the total time invested was about 206 min (around 3 h and 26 min) to complete the entire experimental process. This contrasted with the 25 min required by the MLP, reflecting the higher computational cost associated with more complex and robust models.
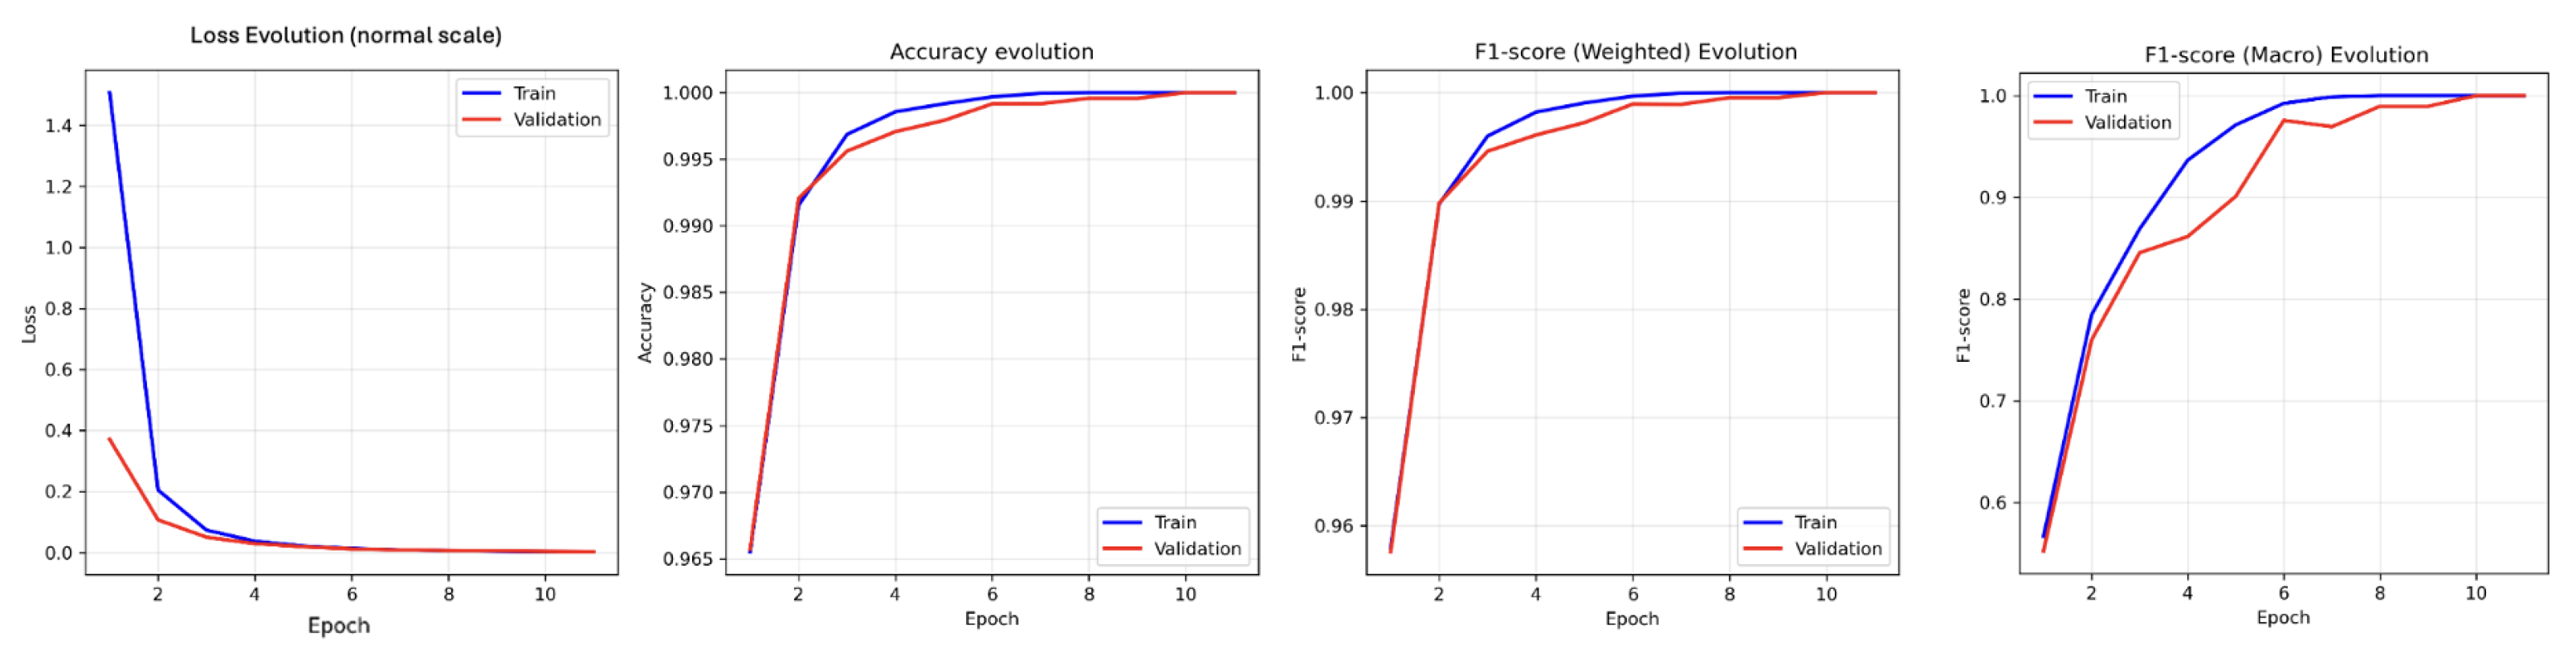
Before analyzing the final performance on the test set, it was essential to observe how the Transformer model’s ability to correctly attribute IPs evolved throughout the training and validation epochs.
Figure 10 below presents the evolution of the main global metrics of the Transformer model during training and validation: loss, accuracy, weighted F1-score, and macro F1-score. Both the loss and performance metrics improved rapidly in the first epochs, stabilizing near their optimal values from epoch 6 onwards. The gap between the training and validation curves was minimal, indicating that the model did not exhibit significant overfitting and generalized well to unseen data. These curves reflect efficient and stable learning, with outstanding performance in both training and validation.
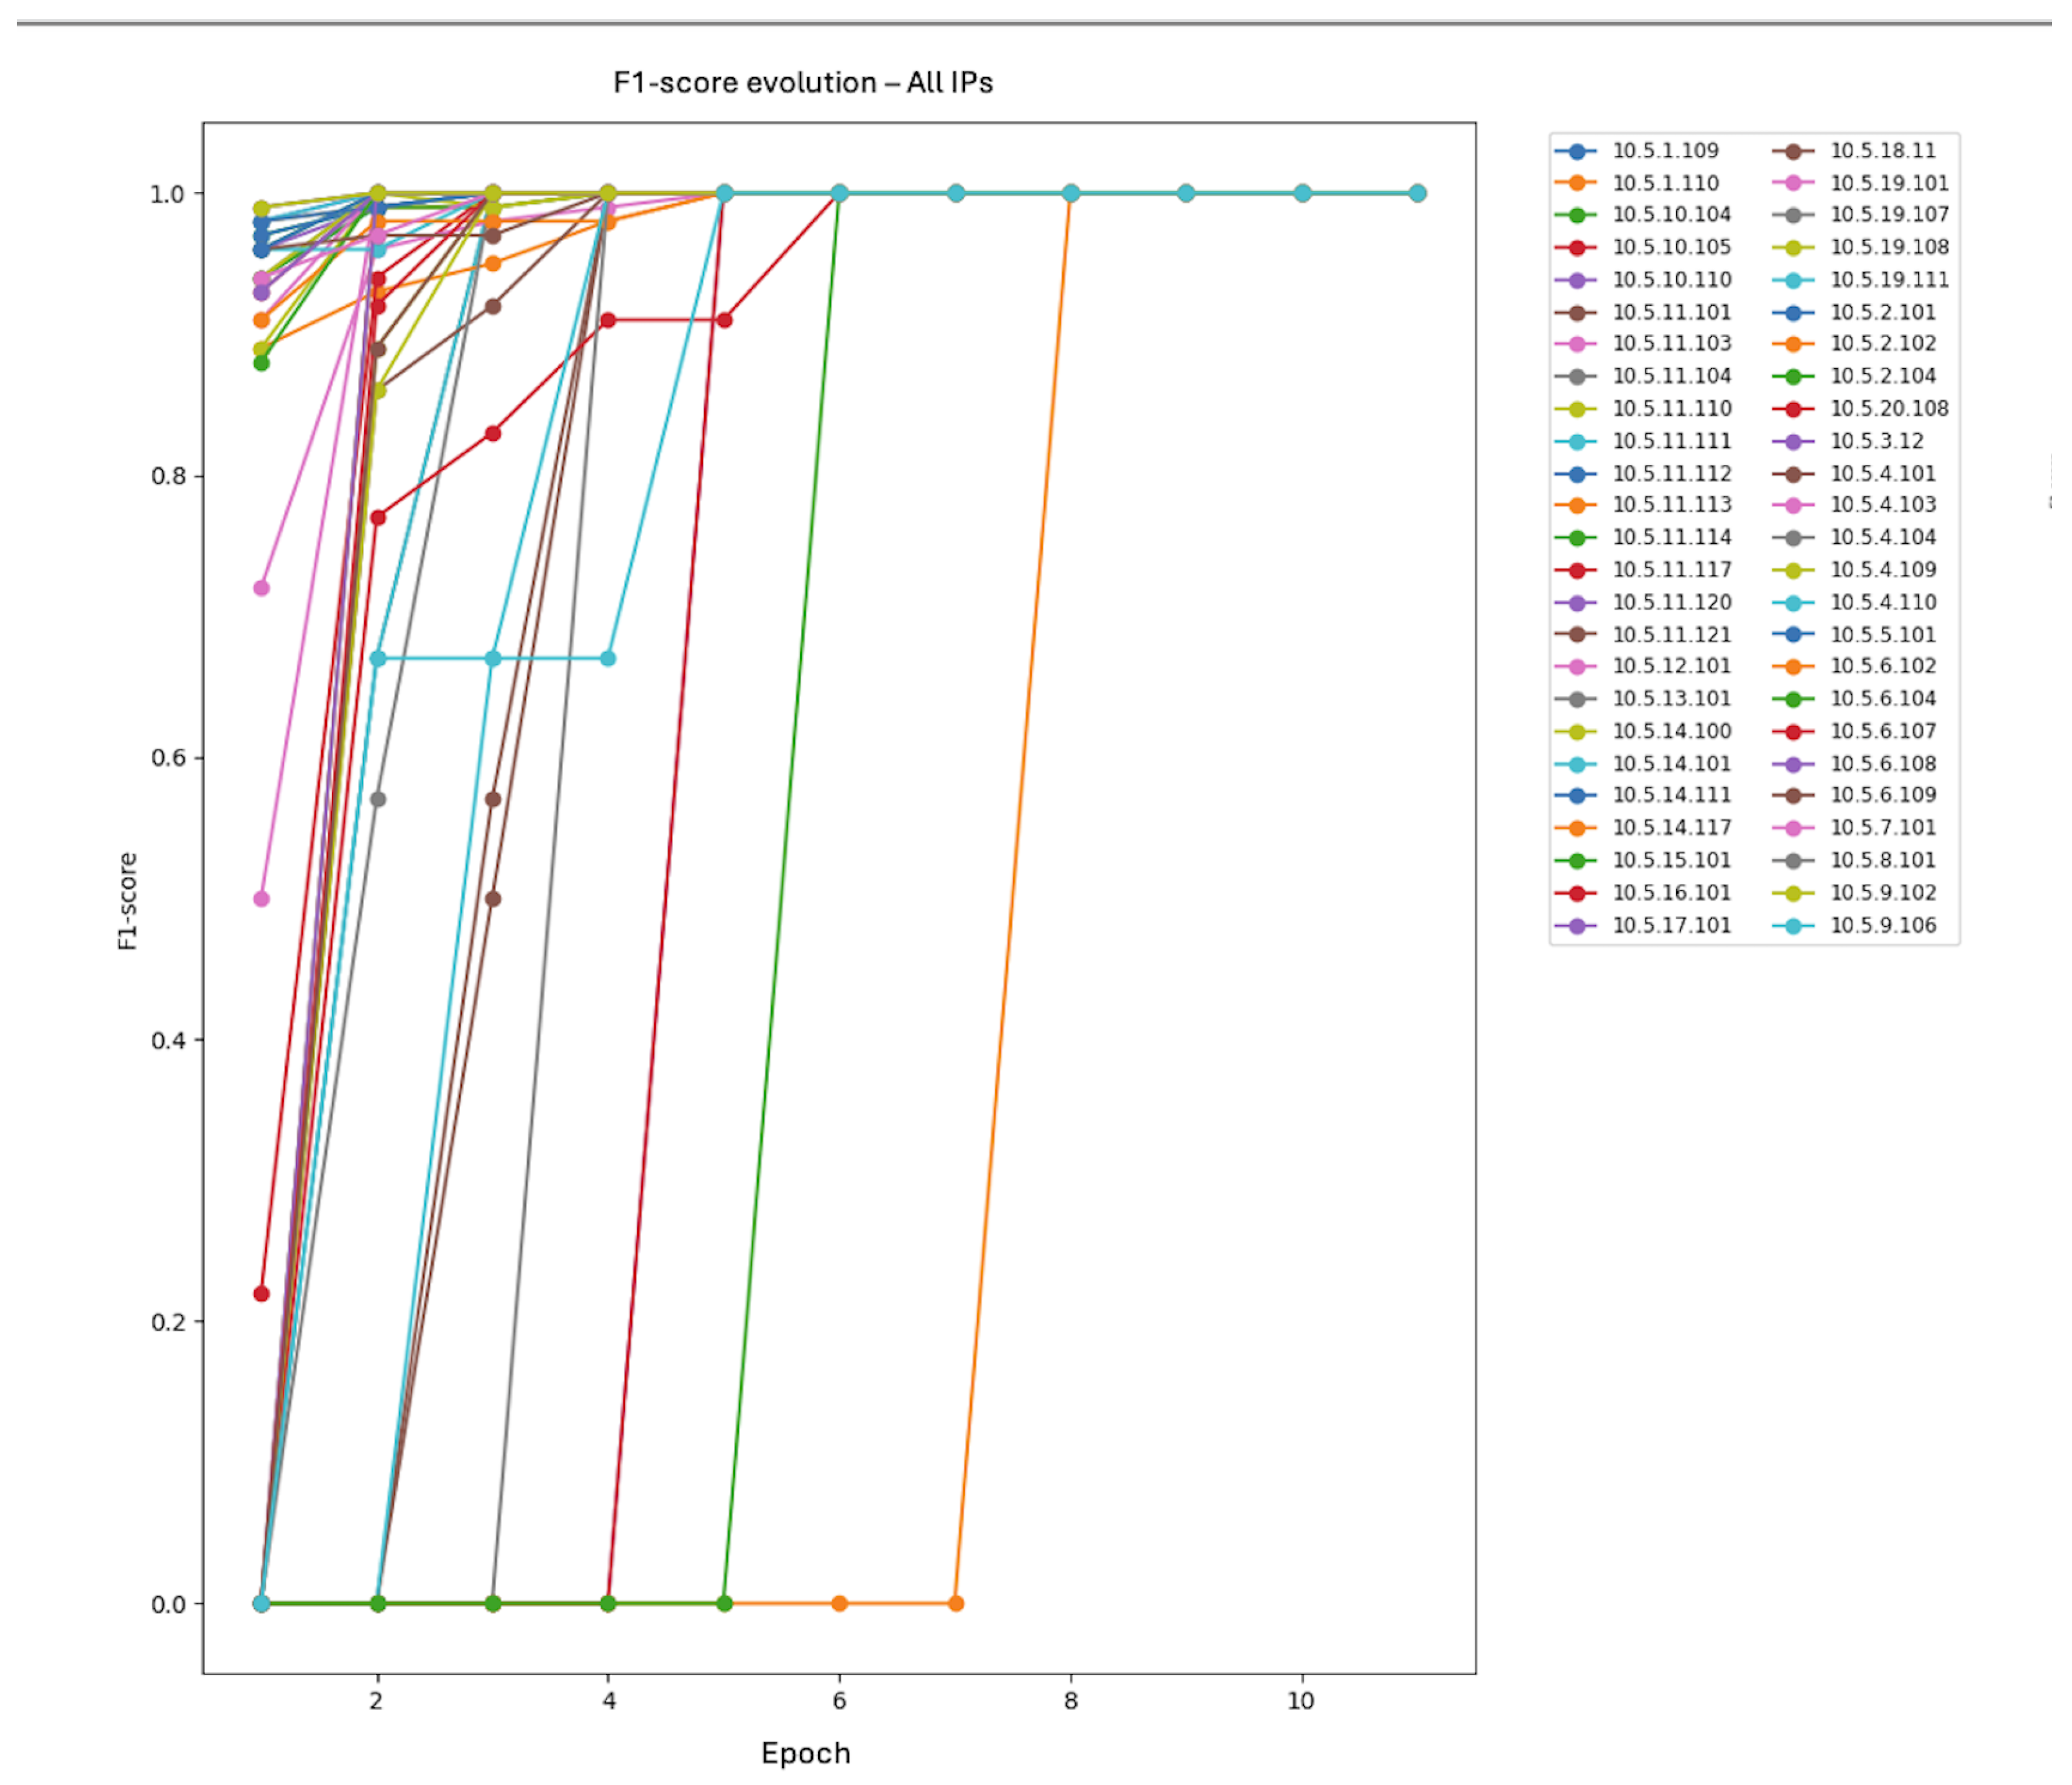
Figure 11 shows the evolution of the F1-score for each IP. Most IPs achieved a perfect F1-score within a few epochs, indicating the model’s rapid learning capacity for most classes. However, there was variability: some IPs required more epochs to reach optimal performance, as seen in the bottom right graph. This analysis helped identify possible difficult cases or minority classes that could require special attention or adjustments in the training strategy. This detailed analysis of per-IP evolution complemented the final test evaluation, providing a more granular view of the learning dynamics and the model’s robustness to attacker diversity.
The Transformer model achieved significantly superior metrics on the test set (average over the 5 cross-validation folds):
Accuracy (test): 0.9998 ± 0.0001
F1-score (macro, test): 0.9944 ± 0.0032
F1-score (weighted, test): 0.9998 ± 0.0001
The confusion matrix shown in
Figure 12 demonstrates the excellent performance of the Transformer model on the test set. Unlike the MLP, the Transformer achieved almost perfect classification for all IPs, with high values on the diagonal and no systematic errors outside it. All classes, including those with fewer samples, were correctly identified, as reflected in the absence of significant values outside the main diagonal. This result indicates that the model is not only capable of learning distinctive patterns for the most frequent attackers but also generalizes well to minority classes, overcoming the bias observed in the MLP. The homogeneity along the diagonal of the matrix and the absence of relevant confusions demonstrate the robustness and discriminative capacity of the Transformer in multi-adversary and imbalanced scenarios. Together, these results explain the high macro and weighted F1-scores obtained on the test set and confirm that the Transformer can correctly attribute attacks to each IP, regardless of the attacker’s frequency.
Despite the Transformer model’s exceptional performance (99.97% accuracy on the test set), a detailed analysis of the few misclassified sequences provides valuable insights into the model’s behavior and the complexity of the attribution task. Out of 10,766 test sequences across the 5-fold cross-validation, only 3 sequences were incorrectly classified. It is important to note that the confusion matrix shown in
Figure 12 corresponds to a single fold of the 5-fold cross-validation. In that particular fold, only one misclassification occurred. The total of three misclassifications refers to the aggregate across all five folds.
Analysis of Misattributed Sequences
Table 5 presents a detailed analysis of these three misattributed sequences, including their characteristics, the actual and predicted attacker IPs, and potential explanations for the classification errors.
The analysis reveals several important patterns in the misattributed sequences. First, all three errors involved sequences with highly repetitive patterns, suggesting that the model may struggle with sequences that lack sufficient diversity to distinguish between similar attackers. Second, two of the three errors involved IPs from the same subnet (10.5.11.x), indicating potential confusion between attackers from the same team. Third, the misclassified sequences were relatively short (9–20 alerts) and may not have provided enough temporal context for accurate attribution.
These findings highlight the importance of sequence diversity and length in attack attribution, as well as the challenge of distinguishing between attackers from the same team or with similar behavioral patterns. The extremely low error rate (0.028%) suggests that the Transformer successfully captures the majority of distinguishing features, but these edge cases provide valuable insights for future improvements in model design and training strategies.
5. Discussion
The experimental results presented in this work provide clear quantitative and qualitative evidence of the superiority of our Transformer-based model not only over the traditional MLP baseline but also in comparison with existing approaches in the literature.
Quantitatively, the Transformer achieved near-perfect performance across all standard metrics. Specifically, the Transformer attained an average accuracy of 0.99, macro F1-score of 0.99, and weighted F1-score of 0.99 on the test set. In contrast, the MLP baseline only reached an accuracy of 0.8062, macro F1-score of 0.6505, and weighted F1-score of 0.8048. This substantial gap was particularly pronounced in the macro F1-score, which reflected the model’s ability to generalize across all classes, including those with few samples. The low macro F1-score of the MLP indicates a strong bias toward majority classes and a limited capacity to correctly classify minority attackers.
Qualitatively, the confusion matrix for the Transformer (see
Figure 12) revealed a dominant diagonal and an absence of systematic misclassifications, even for classes with low support. In contrast, the MLP confusion matrix showed that while several frequent classes were correctly identified, many errors were concentrated in semantically similar or overlapping classes, particularly among minority attackers. The per-IP F1-score evolution further demonstrated that the Transformer rapidly learned to distinguish all attacker classes, stabilizing its performance within a few epochs, while the MLP achieved high performance for frequent classes but continued to struggle with minority or ambiguous classes throughout training.
These improvements were attributed to the Transformer’s ability to model long-range contextual dependencies and handle variable-length sequences, as well as the use of learned embeddings for both IPs and alerts and stratified cross-validation. The MLP, lacking these capabilities, was unable to exploit the temporal and structural information present in the alert sequences.
From a practical perspective, the adoption of the Transformer enables robust and fair attribution of attacks, ensuring high accuracy not only for frequent attackers but also for those that are rarely observed. This is critical in real-world cybersecurity scenarios, where the identification of low-frequency adversaries is essential for effective response and mitigation.
While the Transformer incurs a higher computational cost (206 min of training versus 25 min for the MLP), the significant gains in accuracy, generalization, and robustness justify this investment, especially in high-stakes security applications.
An important methodological aspect of this work is the evolution of the data partitioning strategy. Initially, for the MLP baseline, we adopted a conventional split of 60% for training, 20% for validation, and 20% for testing. However, to ensure a more robust and unbiased evaluation, the experiments with the Transformer model employed a 5-fold stratified cross-validation scheme. In this setup, for each fold, 80% of the data was used for training, 10% for validation, and the remaining 10% for testing, ensuring that all samples were used for testing exactly once across the folds.
This cross-validation approach not only provides a more reliable estimate of the model’s generalization performance but also mitigates the risk of overfitting to a particular data split. The reported test metrics for the Transformer (accuracy, macro F1-score, and weighted F1-score) corresponded to the average and standard deviation across the five test folds, offering a comprehensive and statistically sound assessment of the model’s effectiveness.
It is important to note that while the MLP results were based on a single train/validation/test split, the Transformer results benefited from the increased robustness and representativeness provided by cross-validation. This methodological improvement further highlights the reliability of the conclusions drawn regarding the superiority of the Transformer architecture for attack attribution in multi-adversary scenarios.
Comparative Analysis with Related Work
To contextualize our results and demonstrate the advantages of our approach, we compared our method with several Transformer-based or deep learning-based models for attack detection or attribution. As shown in
Table 6, many recent approaches employed deep learning or Transformer-based models for threat detection tasks, such as identifying anomalous or malicious behavior. For instance, Afnan et al. [
13] adopted a Transformer-based approach and evaluated its performance on two large-scale DARPA datasets comprising over 17 billion system events. Although its detection metrics are strong, the model did not address attacker attribution, and its evaluation primarily focused on binary classification of malicious behavior within imbalanced log data.
Zhang et al. [
24] utilized the CIC-IDS2017 dataset, which includes over 2.8 million network traffic records: 2,273,097 normal and 557,646 attack instances, captured in a realistic network environment. However, their method focused on detecting types of malicious activity rather than attributing responsibility to specific actors. While the dataset size allowed for extensive training, the model evaluation was limited to standard classification performance without deeper analyses of attack attribution or the interpretability of the results. Amaru et al. [
10] evaluated their RAPID method on three real-world system audit datasets totaling over 160 million events. Their method excelled in detecting APT activity based on provenance analysis but did not address the attribution problem, nor did it infer adversary identities from the data itself.
In contrast, Xiang et al. [
4] focused explicitly on attribution using enriched logs tagged with external threat intelligence. Although they achieved promising results (F1 = 0.90), their reliance on threat intelligence sources limited applicability in environments where such enrichment is unavailable. Moreover, their dataset remained relatively small, with about 25,000 sequences annotated for five actors.
Our approach differs fundamentally in both design and scope. We tackled attribution directly by modeling temporal and structural correlations in raw alert sequences, using no external enrichment or prior knowledge. Our dataset consisted of approximately 53,830 alert sequences, extracted from CTF environments with fifty distinct adversaries. Despite this class imbalance, our model achieved a macro F1-score of 0.99, surpassing prior methods in both detection and attribution.
The strength of our method lies not only in its performance but also in its capacity to generalize across underrepresented actors through learned attention-based representations. This enables precise, interpretable attribution even in imbalanced, noisy, or data-sparse contexts, a key requirement for real-world deployment in operational security environments.
In summary, while prior works excel in APT detection under ideal or enriched conditions, our approach uniquely combines accuracy, scalability, and independence from external intelligence to offer a robust solution for multi-actor attribution from native alert streams.
6. Conclusions and Future Work
This work demonstrated the effectiveness of Transformer-based models for attack attribution in multi-adversary network environments. Unlike traditional detection tasks, attribution requires identifying the specific source of an attack, a challenge compounded by class imbalance and adversarial diversity. Our approach addresses this gap in the literature and establishes a new benchmark for robust and accurate attribution under these conditions.
Experimental results show that the Transformer architecture significantly outperforms conventional models such as the MLP, achieving near-perfect accuracy and F1-scores across all classes, including those with limited representation. This performance is largely due to the Transformer’s ability to model long-range dependencies and leverage contextual information, enabling effective generalization in highly imbalanced scenarios.
Despite these promising results, this study has limitations. It relied on a single dataset derived from a CTF competition, which, while offering authentic adversarial behavior, may not have fully captured the complexity and obfuscation techniques present in real-world attacks.
In particular, the dataset’s temporal scope was limited to 2.17 days and segmented into 272 rounds, which may not have reflected long-term or persistent attack behaviors. Additionally, the controlled nature of the competition—where all participants were known and the attack surface was predefined—differed from open-world environments with unknown adversaries and more diverse threat vectors. The artificial segmentation into 5 min rounds may also have affected the model’s ability to generalize to asynchronous or irregular attack patterns. Furthermore, the dataset contained only malicious alerts, precluding the evaluation of false positives or the model’s ability to distinguish between benign and malicious behavior.
Future work should validate the model using more diverse data sources, such as enterprise network logs or public threat intelligence feeds, and explore its robustness through sensitivity analyses involving synthetic noise or alternative datasets.
We also plan to integrate benign traffic into the input sequences to better reflect real-world conditions and assess the model’s performance in mixed-traffic environments.
Another important limitation is the model’s limited interpretability. In cybersecurity, where misattribution can have serious consequences, understanding the rationale behind each decision is critical. To address this, we plan to incorporate techniques for visualizing attention weights, identifying key alerts that influence attribution, and analyzing misclassifications to improve transparency and trust.
Additionally, we aim to evaluate the model’s resilience against evasion tactics, such as the injection of decoy alerts or the perturbation of alert sequences. Understanding how such manipulations affect attribution performance is essential for real-world deployment and will inform the development of more robust attribution mechanisms.
We also recognize that our current sequences included only alerts associated with malicious activity. However, benign traffic may also form part of an attacker’s behavioral footprint, especially in stealthy or long-term campaigns. Future work will explore the integration of non-malicious events into the input sequences to provide a more complete representation of adversarial behavior. In parallel, we plan to benchmark the model under different hardware configurations and deployment scenarios (e.g., batch vs. streaming inference) to assess its suitability for real-time operation. We also intend to explore lightweight architectural variants, such as distilled Transformers or sparse attention mechanisms, to reduce inference latency without compromising attribution performance.
Finally, we acknowledge that the use of sinusoidal positional encodings may oversimplify the temporal dynamics of multi-step attacks, particularly in asynchronous environments where the timing between steps is irregular. Future iterations of this work will investigate learned or time-aware positional encodings to better capture these temporal patterns and further enhance the model’s ability to reason over complex, temporally variable attack sequences.
Ultimately, we envision integrating the proposed model into a comprehensive intrusion detection and response pipeline, where it would serve as an attribution layer following initial alert generation. This integration would enable security teams not only to detect threats but also to rapidly identify likely adversaries, enhancing situational awareness and enabling more targeted, effective responses. The flexibility of the Transformer architecture to process multiple streams of information and capture complex relationships suggests its potential for broader applications in cybersecurity, including real-time attribution, adaptive defense strategies, and integration with other detection and response systems.


