Abstract
Estrogen receptor alpha (ERα) plays a vital role in the development and progression of breast cancer by regulating the expression of genes associated with cell proliferation in breast tissue. ERα inhibition is a key strategy in the prevention and treatment of breast cancer. Previous research modified chalcone compounds into pyrazoline benzenesulfonamide derivatives (Modifina) which show activity as an ERα inhibitor. This study aimed to design novel pyrazoline benzenesulfonamide derivatives (PBDs) as ERα antagonists using in silico approaches. Structure-based and ligand-based drug design approaches were used to create drug target molecules. A total of forty-five target molecules were initially designed and screened for drug likeness (Lipinski’s rule of five), cytotoxicity, pharmacokinetics and toxicity using a web-based prediction tools. Promising candidates were subjected to molecular docking using AutoDock 4.2.6 to evaluate their binding interaction with ERα, followed by molecular dynamics simulations using AMBER20 to assess complex stability. A pharmacophore model was also generated using LigandScout 4.4.3 Advanced. The molecular docking results identified PBD-17 and PBD-20 as the most promising compounds, with binding free energies (ΔG) of −11.21 kcal/mol and −11.15 kcal/mol, respectively. Both formed hydrogen bonds with key ERα residues ARG394, GLU353, and LEU387. MM-PBSA further supported these findings, with binding energies of −58.23 kJ/mol for PDB-17 and −139.46 kJ/mol for PDB-20, compared to −145.31 kJ/mol, for the reference compound, 4-OHT. Although slightly less favorable than 4-OHT, PBD-20 demonstrated a more stable interaction with ERα than PBD-17. Furthermore, pharmacophore screening showed that both PBD-17 and PBD-20 aligned well with the generated model, each achieving a match score of 45.20. These findings suggest that PBD-17 and PBD-20 are promising lead compounds for the development of a potent ERα inhibitor in breast cancer therapy.
1. Introduction
Breast cancer is the second most common cancer worldwide, with 11.6% of all cancer cases (or 2.3 million new cases) in 2022, and the fourth leading cause of cancer-related mortality, with 6.9% of all cancer deaths (666,000 deaths). By 2040, breast cancer is projected to increase by over 40% [1,2,3]. One treatment option for breast cancer involves chemotherapy that specifically targets estrogen receptor alpha (ERα). ERα is a nuclear hormone receptor that acts as a ligand-dependent transcription factor. ERα mediates the effects of estrogen by regulating gene transcription involved in cell proliferation and survival, making it a central target for endocrine therapy in breast cancer [4,5,6]. Overexpression or aberrant activation of ERα is closely associated with tumor progression and poor prognosis in breast cancer patients [7,8,9].
Structurally, the ligand-binding domain (LBD) of ERα is composed of 12 α-helices that form a large, flexible hydrophobic pocket accommodating a variety of ligands [10]. Key residues within the binding pocket play crucial roles in ligand recognition and binding affinity. The most critical residues identified include Glu353 (helix 3), Arg394 (helix 5), and His524 (helix 11), which form hydrogen bonds with the hydroxyl groups of ligands [11]. An example of an ERα competitive inhibitor is 4-hydroxytamoxifen (4-OHT). In this compound, the phenolic hydroxyl group interacts with Glu353 and Arg394, while the side chain containing dimethylaminoethoxy lies close to Asp351 and forms a direct hydrogen bond. The large side chain extends from the binding pocket between helices 3 and 11, preventing the hydrophobic interactions between helices 12 and 3/11, thereby helix 12 attains an inactive or open conformation positioned directly opposite helices 3 and 5, occupying the co-regulator binding site [12].
Several selective estrogen receptor modulators (SERMs) have been developed to target ERα, including tamoxifen (and its metabolite 4-OHT), raloxifene, and lasofoxifene (Figure 1) [13]. Tamoxifen is the first-generation SERM widely used for the treatment and prevention of ERα-positive breast cancer. It acts as an estrogen antagonist in breast tissue, blocking estrogen receptor activation and inhibiting cancer cell growth. Its primary active metabolite, 4-hydroxytamoxifen, binds to ERα with much higher affinity than tamoxifen and exerts stronger antiestrogenic effects, further preventing estrogen-driven tumor progression [14,15,16]. Raloxifene is a second-generation SERM that binds to estrogen receptors, acting as an antagonist in breast and uterine tissues and as an agonist in bone. It is used to reduce the risk of breast cancer in postmenopausal women and to treat osteoporosis. Compared to tamoxifen, raloxifene has less estrogen-like effects on the uterus, resulting in a lower risk of endometrial cancer [17]. Lasofoxifene is a newer SERM that functions similarly by antagonizing ERα in breast tissue. It is effective in inhibiting tumor growth, including in models resistant to other endocrine therapies, and demonstrates tissue selectivity with beneficial effects on bone and vaginal tissues while having minimal impact on the uterus [18]. However, prolonged use of tamoxifen, raloxifene, and lasofoxifene can cause serious side effects. Tamoxifen increases the risk of endometrial cancer, blood clots, stroke, liver toxicity, and cataracts, as well as persistent hot flashes, menstrual issues, and vaginal discharge. Raloxifene and lasofoxifene also raise the risk of blood clots, with raloxifene potentially increasing stroke risk, especially in women with heart disease. Lasofoxifene may cause benign endometrial changes but does not significantly raise endometrial cancer risk [19,20,21,22].
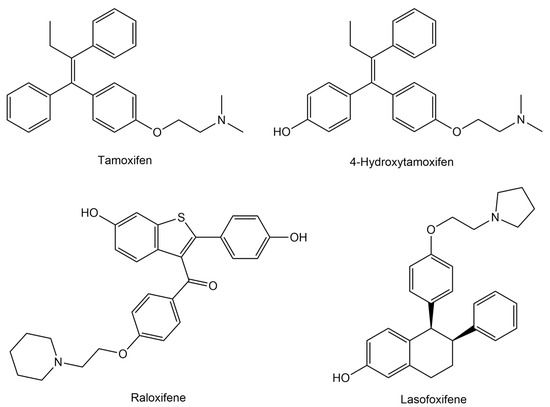
Figure 1.
Chemical structures of estrogen receptor alpha (ERα) inhibitors.
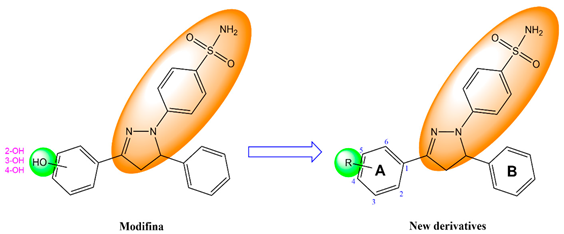
A promising alternative is a compound derived from a natural product, like 2′,4′-dihydroxy-6-methoxy-3,5-dimethylchalcone (chalcone) isolated from Eugenia aquea leaves, demonstrating anticancer activity. This chalcone compound can reduce cell proliferation against MCF-7 human breast cancer with an IC50 of 74.5 μg/mL (250 μM) and induce apoptosis via the activation of the poly(adenosine diphosphate-ribose) polymerase (PARP) [23]. Further, it has shown activity against T47D human breast cancer cell lines, with an IC50 of 42.49 μg/mL (142.58 μM) [24]. Efforts to increase the activity of this chalcone compound by modifying it into pyrazoline benzenesulfonamide derivative (Modifina) have been carried out, and it has activity as an ERα inhibitor [25]. However, Modifina has poor gastrointestinal absorption, necessitating structural modifications to improve its pharmacokinetic properties.
In recent years, computational approaches have become invaluable tools in drug discovery, mainly for in silico studies aimed at predicting ligand–receptor interactions, structure–activity relationships, and molecular mechanisms at the atomic level. When integrated with experimental (wet labs) studies, these methods can significantly reduce both the time and cost associated with drug development [26]. Among the commonly employed computational techniques are molecular docking, molecular dynamics simulations, and pharmacophore modeling. These methods are often used in combination to provide a more comprehensive understanding of molecular interactions and potential drug activity. Pharmacophore modeling is typically used in the early stages to identify compounds that have the potential to interact with target receptors [27]. Then, molecular docking helps predict the binding mode and affinity of these compounds to the receptor [28]. Finally, molecular dynamics simulations serve to validate the docking results by offering insights into the stability and behavior of the ligand–receptor complex over time [29].
In this study, we evaluated the anti-breast cancer activities of novel pyrazoline benzenesulfonamide derivatives (PBD) targeting ERα using in silico approaches. The PDB compounds were design by structurally modifying Modifina to generate new derivatives with potential anticancer activity. We first assessed the drug-likeness of the designed compounds using Lipinski’s rule of five followed by cytotoxicity predictions against human cell lines. Pharmacokinetics and toxicity profile were then evaluated using in silico ADMET (absorption, distribution, metabolism, excretion, and toxicity) analysis. Molecular docking was performed to evaluate the anti-breast cancer activities of PDB compounds, followed by molecular dynamics simulations to better understand the inhibition of PBD compounds against ERα. Finally, pharmacophore modelling was performed to identify the chemical features (electronic and steric) in the PBD that contribute to their binding with ERα.
2. Materials and Methods
2.1. Tools and Materials
The hardware used for molecular docking comprised a personal laptop with an Intel® CoreTM i7-4600U processor, CPU @ 2.10 GHz 2.70 GHz, 8.00 GB of RAM, and a Windows 10 Pro version 22H2 64-bit operating system (Intel, Santa Clara, CA, USA). A computer with a Core Processor Intel® Xeon®CPU E5-2678 v3 @ 2.50 GHz, RAM 64 GB, a Graphic Card NVIDIA GeForce GTX 1070 Ti Core GPU, and a LINUX Ubuntu version 20.04 LTS operating system was used for molecular dynamics simulation. The software used is available free of charge for academic users the following: ChemDraw Professional 15.0 (PerkinElmer Informatics, Waltham, MA, USA) was used to draw the 2D structures of the ligand compounds, and Chem3D 15.0 (PerkinElmer Informatics, Waltham, MA, USA) was used to convert the 2D structure ligand into a 3D shape and optimize the energy. Autodock 4.2.6 and AutodockTools 1.5.6 (The Scripps Research Institute, San Diego, CA, USA), Command Prompt, and Notepad-11.2307.27.0 were used for ligand and receptor preparation and validation, as well as molecular docking simulations. BIOVIA Discovery Studio 2021 Client (Dassault Systèmes, Waltham, MA, USA) was used for the preparation of receptors with native ligands to visualize the results of complex molecular docking, bonding between ligands and receptors, geometrical optimization, and overlays in the validation process. AMBER20 (Amber, San Francisco, CA, USA) was used to perform molecular dynamics (MD) simulations. VMD was used to visualize the protein–ligand complex and analyze the trajectory of the MD simulations. LigandScout 4.4.3 Advanced was used for pharmacophore modeling and screening. The web application used the following: SwissADME (http://www.swissadme.ch/, accessed on 15 December 2024) was used for the prediction of Lipinski’s rule of five, CLC-Pred 2.0 (https://www.way2drug.com/CLC-pred/, accessed on 20 December 2024) was used for the prediction of cell line cytotoxicity, PreADMET (https://preadmet.webservice.bmdrc.org/, accessed on 25 December 2024) was used for the prediction of pharmacokinetic and toxicity profiles, and Protox-3.0 (https://tox.charite.de/protox3/, accessed on 10 January 2025) was used for the prediction of toxicity profiles. The materials used in this study included the 3D structure of the target receptor resulting from an X-ray crystallographic depiction of the human estrogen receptor alpha (hERα) downloaded from the RCSB Protein Data Bank (https://www.rcsb.org/, accessed on 20 January 2025) with PDB ID: 3ERT. The ligand used as a reference drug was the structure of 4-OHT, raloxifene, and lasofoxifene. Further, the test ligands used were structures of the forty-five pyrazoline benzenesulfonamide derivatives.
2.2. Ligand Design
The design of novel pyrazoline benzenesulfonamide derivatives (PBD) was based on structural modification of the Modifina molecule. Specifically, the hydroxy group on the benzene ring was substituted with various functional groups. This approach aimed to generate structural diversity among the derivatives. A total of forty-five PBD compounds were designed through this method. Their chemical structures were sketched using ChemDraw Professional 15.0 software [30].
2.3. Prediction of Lipinski’s Rule of Five
Lipinski’s rule of five prediction of PBD compounds was performed using the SwissADME web application (http://www.swissadme.ch/, accessed on 15 December 2024) [31]. The PBD compounds were drawn using a drawing tool to perform the prediction; the structure drawing was transferred to the input list of SMILES, and the program was run. Lipinski’s rule of five is the ultimate guideline for assessing drug-likeness [32].
2.4. Prediction of Cell Line Cytotoxicity
CLC-Pred (Cell Line Cytotoxicity Predictor) 2.0 is a web-based application designed to predict the cytotoxicity of chemical compounds on non-transformed and cancer cell lines based on their structural formula [33]. Cytotoxicity prediction for PBD compounds was made through the CLC-Pred 2.0 web application (https://www.way2drug.com/CLC-pred/, accessed on 20 December 2024). The predicted output activity was represented in the probability active (Pa) scores and probability inactive (Pi) scores. The scoring system was categorized into three portions according to activity: Pa > 0.5 was considered high activity, Pa > 0.3 was considered moderate activity, and Pa < 0.3 was considered the lowest activity [34].
2.5. Prediction of Pharmacokinetic and Toxicity Profiles
Pharmacokinetic and toxicity (ADMET) assessment is an important measurement tool for any compound before it is selected as a drug candidate. The pharmacokinetic properties of the compound were examined using absorption, distribution, metabolism, and excretion (ADME) analysis. The ADME profiles for PBD compounds were predicted using the PreADMET web application (https://preadmet.webservice.bmdrc.org/, accessed on 25 December 2024) [35]. The toxicity profiles for the PBD compounds were predicted using the PreADMET [35] and Protox-3.0 (https://tox.charite.de/protox3/, accessed on 10 January 2025) web application [36,37].
2.6. Molecular Docking Simulations
2.6.1. Separation of Native Ligands and Receptors
The human estrogen receptor alpha (hERα) as receptors were downloaded in the PDB format from the Protein Data Bank database (https://www.rcsb.org/, accessed on 20 January 2025) [38], with PDB ID: 3ERT. The crystal structures with 3ERT code are human estrogen receptor alpha (hERα) protein bound to the 4-hydroxytamoxifen (4-OHT) [39]. The structures of ERα and native ligand were separated using BIOVIA Discovery Studio 2021 Client [40]. Receptors are macromolecules separated from other molecules, such as water molecules and their native ligands. The native ligands on a protein are separated from other molecules, such as water molecules and the receptor. ERα and native ligand structures that have been separated and then saved in the PDB format.
2.6.2. Preparation of Ligand and Receptor
The ligand structure was designed by opening ChemDraw Professional 15.0 soft-ware to form 2D structures of forty-five PBD compounds. Furthermore, 2D structures of PBD compounds as test ligands were converted to 3D structures, followed by the minimization of energy by MM2 force field using Chem3D 15.0 software to obtain a more stable structure [41], and then saved in the Protein Data Bank format (*.pdb). The ligand structure in the PDB format was opened in AutoDockTools 1.5.6 software, followed by adding hydrogen atoms, selecting ‘Merge Non-Polar’, computing Gasteiger charges, and adding torsion. The files were saved in PDBQT format [42]. The receptor in the PDB format was opened in AutoDockTools 1.5.6 software, followed by adding hydrogen and then selecting ‘Polar Only’ and Kollman charges. The files were saved in the PDBQT format [43].
2.6.3. Grid Parameters
To determine the binding site ligand in the receptor, the grid parameter was determined using Autodock Tools 1.5.6. The receptors were selected as macromolecules, and the ‘map type’ was set by selecting ligands. The search for active site receptors was carried out by clicking ‘Center on Ligand’ to obtain the size of the Center Grid Box. A grid box of 40 × 40 × 40 points spaced by 0.375 Å was centered on the ERα active site (x = 30.282, y = −1.913, and z = 24.207). This size must be used to adjust the interaction between the active side of the receptor and other ligands. The files were saved in the Grid Parameter File (GPF) format.
2.6.4. Molecular Docking Process
AutoDock 4.2.6 was utilized for the molecular docking simulation. Docking was performed using Lamarckian Genetic Algorithm (LGA) with parameters set for 100 runs, a population size of 150, an energy evaluation limit of 2,500,000, a mutation rate of 0.02, and a crossover rate of 0.8, and the files were then saved in the Docking Parameter File (DPF) format [44]. Furthermore, the molecular docking process was carried out using the Command Prompt feature. The conformation of the ligand was determined by selecting the docking result with the lowest binding energy [45]. Values for the free energy of binding, inhibition constant (Ki), and RMSD were obtained from the histogram found in the DLG format docking file using Notepad. These selected conformations were converted into complex files via Autodock Tools 1.5.6 and saved in the PDB format. These complexes were visualized using BIOVIA Discovery Studio 2021 Client. This enabled the observation of the overlay of re-docking results and the analysis of ligand–receptor interactions in 2D and 3D diagrams.
The efficacy of interactions was evaluated based on the changes observed in the free energy of binding (ΔG), hydrogen bonds formed with the active site residues of ERα, and the inhibition constant (Ki) value. The ΔG values can be calculated according to the following equation:
where ΔGbind is the estimated free energy of binding, the ΔGvdw+hbond+desolv denotes the sum of the energies of dispersion and repulsion (ΔGvdw), hydrogen bond (ΔGhbond), and desolvation (ΔGdesolv). The ΔGtotal represents the final total internal energy, the ΔGtor is torsional free energy, ΔGunb is the unbound system’s energy, and ΔGElec is electrostatic energy. Meanwhile, the Ki value is obtained from the ΔG value, which was calculated using the following formula: Ki = exp(ΔG/RT), where R is the ideal gas constant (1.987 cal/mol K), and T is the temperature (298.15 K) [46].
2.7. Molecular Dynamics (MD) Simulations
Molecular dynamics simulations were performed using the AMBER20 program for 200 ns. Partial charges in the PDB and 4-OHT structures were prepared using the Austin Model 1—Bond Charge Corrections (AM1-BCC) method in the antechamber program within AmberTools21 [47]. The ERα structure was prepared using the pdb4amber program to adjust the protonation of histidine residues to suit their environment. The complex model was then entered into the tleap program for parameterization. The force fields used were ff14SB for proteins and the General Amber Force Field (GAFF) for ligands. The TIP3P explicit water model was used as the solvent in the ERα-ligand complex system, with a box size of 10 Å from the outermost atom of the system. In addition, Na+ and Cl− ions were also added to the system as physiological salts. The minimization of the system was conducted utilizing the Particle-Mesh Ewald Molecular Dynamics (PMEMD) module from the AMBER20 software package. The minimization process carried out for a total of 800 ps was divided into three stages, namely minimization of water molecules with proteins and ligands held for 1000 steps using steepest descent, minimization of side chains with the main chain of proteins held for 1000 steps using steepest descent and the following 1000 steps using conjugate gradient, and minimization of the entire system for 5000 steps using steepest descent. Then, the system was heated gradually (0 to 100 K, 100 to 200 K, and 200 to 310 K) for 60 ps until it reached stability at physiological temperature, around 37 °C (310 K) under NVT conditions. Then, equilibration was carried out under NPT conditions for 600 ps by gradually decreasing the resistance to achieve system equilibrium. The production stage was performed for 200 ns with a time step of 2 fs.
The CPPTRAJ program within AmberTools21 was used to perform molecular dynamics trajectory analyses, including root mean square deviation (RMSD), root mean square fluctuation (RMSF), radius of gyration (Rg), solvent accessible surface area (SASA), and hydrogen bond interactions between the ligand and the receptor. Molecular dynamics simulation trajectories were assessed using the VMD program. Further, the ante-MMPBSA.py within AmberTools21 was used to calculate binding energy by the Molecular Mechanics Poisson–Boltzmann Surface Area (MM-PBSA) method and energy decomposition analysis of the protein–ligand complex [48,49]. The ggplot2 and matplotlib programs on JupyterLab 4.4.4 were used to visualize data.
2.8. Pharmacophore Modeling
Pharmacophore modeling was performed using ligand-based drug design (LBDD) approaches by LigandScout 4.4.3 Advanced (InteLigand, Vienna, Austria) [50]. The material needed for the prepared test included three databases: actives, decoys, and test compounds. The database files of actives and decoys were downloaded from the Database of Useful Decoys-Enhanced (DUD-E) via the website https://dude.docking.org/, (accessed on 25 January 2025) [51], with target ESR1 (estrogen receptor alpha) in the SDF format. The active and decoy databases were prepared with 200 and 4000 compounds, respectively. Test compounds already in the 3D structure were prepared using BIOVIA Discovery Studio 2021 Client and saved in the SDF format. The databases were created by opening the LigandScout program and selecting the ‘Ligand Based’ option. The compound files of active and decoy were opened to establish the actives and decoys databases, while the database file of test compounds was opened to be tested and optimized in 3D form. In the ‘Type’ section, all active and decoy compounds in databases were in the ‘training’ form, while the database of test compounds was in the ‘Test’ form. All compound files were saved in the LDB format. In the ‘Ligand Based’ section of the actives database previously opened, all compounds were created cluster, and then the sequence of compounds was ‘sorted by cluster’ by clicking the ‘Cluster ID’ column. After that, one compound of the ‘training’ file type was selected from each cluster, and the rest was created as ‘ignored’. Once everything is ready, click the ‘Create Pharmacophore’ button, and 10 pharmacophore models will be obtained and saved in the PMZ format.
The pharmacophore model obtained was tested for validity by moving every model to the ‘Screening’ column by clicking ‘Copy to Other Perspective’ and then clicking ‘Screening Perspective’. In the ‘Screening’ column, click ‘Load Screening Database’ and select the active and decoy databases with the LDB format that were previously created. The database entered was marked with green for active and red for decoy. After that, click ‘Perform Screening’, and LigandScout will carry out the screening process. To visualize the validity, click ‘Plot ROC Curve’, the AUC value was observed, and then the best ROC and EF from the 10 models were selected. The screening of all test compounds was performed by clicking ‘Load Screening Database’ on the ‘Screening’ column to select the database of the test compound previously created. The database of test compounds was marked green, and the color from the other databases was removed. In the ‘Ligand Based’ section, the best model was moved to the ‘Screening’ column, and then the ‘Perform Screening’ button was clicked to obtain a hit compound.
3. Results and Discussion
3.1. Ligand Modeling
Drugs, through structural modification of a parent compound, aim to develop new derivatives with better activity and reduced side effects. Two primary strategies are commonly used in drug discovery: ligand-based drug design (LBDD) and structure-based drug design (SBDD) [52]. LBDD uses information from known active small molecules by analyzing their molecular structure and biological activity data [53,54]. In contrast, SBDD focuses on the three-dimensional structure of the target protein, using techniques such as X-ray crystallography or homology-based molecular modeling to identify active binding sites and guide the design of molecules that can interact specifically with the target [55,56].
In this study, novel pyrazoline benzenesulfonamide derivatives (PBD) were designed by substituting the hydroxy group at the benzene ring A of the Modifina structure with various substituents. These included tertiary aliphatic amine (N,N-dimethylethanamine and triethylamine), aliphatic heterocyclic (piperidine, piperazine, pyrrolidine, tetrahydrofuran, and 1,3-dioxolane), aromatic heterocyclic (pyridine, pyrrole, furan, thiophene, and imidazole), and benzene. The substituents were added at positions 2, 3, or 4. The goal of these substitution was to increase the lipophilicity of the PBD compounds, thereby improving gastrointestinal absorption and anticancer activity. Based on this modification, a total of forty-five PBD compounds were selected for virtual screening against ERα (Table 1).

Table 1.
Structure of designed novel pyrazoline benzenesulfonamide derivatives.
3.2. Lipinski’s Rule of Five Evaluation
Lipinski’s rule of five was applied to evaluate the similarity of test compounds to orally active drugs in humans. This rule serves as a predictive guideline for assessing drug permeability. According to Lipinski’s criteria, an oral drug candidate should meet the following conditions: molecular weight ≤ 500 g/mol, lipophilicity (MLogP) ≤ 4.15, H-bond donors (NH or OH) ≤ 5, and H-bond acceptors (N or O) ≤ 10 [32]. A molecular weight above 500 g/mol can reduce compound concentration at the intestinal epithelium surface, limiting absorption in the gastrointestinal tract and the central nervous system (CNS) [57]. Similarly, a partition coefficient (MLogP) value of more than 4.15 indicates excessive lipophilicity, which can hinder recognition by target enzymes and increase toxicity. However, a very low partition coefficient value can also be problematic, as it may reduce membrane permeability [58,59]. Further, hydrogen-bond donors (≤5) and acceptors (≤10) are crucial for passive diffusion. An excessive number of hydrogen bonds can hinder the transition of molecules from the water-soluble phase into the lipid bilayer, reducing membrane permeability [60,61]. Drug-likeness results can be determined based on how many of Lipinski’s parameters are violated. A compound that violates one criterion may still be considered drug-like, but violations of two or more indicate it is unlikely to be an orally active drug candidate [62,63,64].
The prediction results (Table 2) show that all PBD compounds met the criteria of Lipinski’s rule of five, with the exception of PBD-16 to PBD-21, which exhibit molecular weights (MW) exceeding 500 g/mol. This increase in molecular weight is attributed to the addition of carbon atoms in PBD-16, PBD-17, and PBD-18 and nitrogen atoms in PBD-19, PBD-20, and PBD-21. Although a molecular weight below 500 g/mol is traditionally preferred, this threshold is not an absolute requirement in modern drug development [65]. Given that this is the only violation observed, all PBD compound are still considered to meet the drug-likeness criteria.

Table 2.
Lipinski’s rule of five assessment results for PBD compounds and the reference ligands. MW: molecular weight, MlogP: Moriguchi octanol–water partition coefficient, HBD: hydrogen-bond donor, and HBA: hydrogen-bond acceptor.
3.3. Assessment of Cell Line Cytotoxic Potential
Cytotoxicity activity prediction of the PBD compounds against cancer cell lines was performed using the CLC-Pred (Cell Line Cytotoxicity Predictor) 2.0 web application. This tool utilizes the PASS (prediction of activity spectra for substances) training set to estimate cytotoxic activity based on known relationship with various cancer cell lines achieving up to 96% accuracy compared to the in vivo results. CLC-Pred results are expressed as Pa (Probability active) and Pi (Probability inactive) values [33,66].
The prediction results (Figure 2) show that all PBD compounds exhibit cytotoxic potential against several cancer cells types, including MCF7 (breast carcinoma), HOP-92 (non-small-cell lung carcinoma), RPMI-8226 (multiple myeloma), NCI-H522, (non-small-cell lung carcinoma), SR (adult immunoblastic lymphoma), BT-549 (breast ductal carcinoma), IGROV-1 (ovarian adenocarcinoma), OVCAR-4 (ovarian adenocarcinoma), NCI-H226 (non-small-cell lung carcinoma), OVCAR-5 (ovarian adenocarcinoma), SF-539 (glioblastoma), and UACC-62 (melanoma). Among these, breast carcinoma (MCF7) exhibited the highest probability of inhibition to all PBD compounds. Compounds with Pa > 0.5 are considered to have high cytotoxic potential and are likely to demonstrate similar activity in laboratory testing; those with 0.3 < Pa < 0.5 indicate moderate potential, while Pa < 0.3 suggests a low likelihood of cytotoxic. Notably, all PBD compounds demonstrate Pa > 0.5, against MCF7 cells, suggesting strong potential as anti-breast cancer agents.
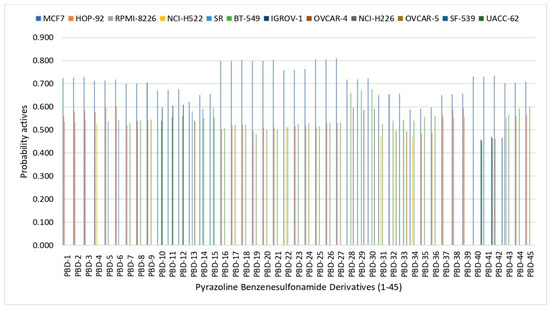
Figure 2.
In silico prediction of cell line cytotoxicity for PBD compounds by CLC-Pred 2.0.
3.4. Pharmacokinetic and Toxicity Profiles Prediction
The pharmacokinetic profile of the PBD compounds were evaluated using ADME (absorption, distribution, metabolism, and excretion) prediction. The key parameters analyzed included human intestinal absorption (HIA), Caco-2 cell permeability, and protein plasma binding (PPB). HIA indicate the extend of which compounds are absorbed in the human intestinal tract with value classified as poorly absorbed (0–20%), moderately absorbed (20–70%), and well absorbed (70–100%). Caco-2 cell permeability reflects a compound’s ability to penetrate human intestinal epithelial cells, classified as high permeability (PCaco-2 = more than 70 nm/s), middle permeability (PCaco-2 = 4~70 nm/s), and low permeability (PCaco-2 = less than 4 nm/s) [67]. Plasma protein binding (PPB) estimates the fraction of a drug that binds to plasma proteins, particularly albumin serum, α-1-glycoprotein acid, and lipoproteins, influencing drug distribution and bioavailability [68]. Compound with >90% PBB are considered strongly bound, while those with <90% are weakly bound [69]. Drugs that are strongly and irreversibly bound, such as those forming covalent bonds, may pose long-term drug toxicity risks. In contrast, drugs that exhibit weak binding through hydrogen bonds or van der Waals forces demonstrate better distribution and reduced toxicity risks [70]. Toxicity was also predicted using parameters including carcinogenicity in mouse and rats, hepatotoxicity, immunotoxicity, mutagenicity, cytotoxicity, and toxicity classification [71]. These toxicity assessment are crucial in identifying safe compounds early in the drug development pipeline, helping to minimize late-stage failures [72,73].
The pharmacokinetic screening results (Table 3) showed that all PBD compounds and the positive control (4-OHT, raloxifene, and lasofoxifene) were classified as well absorbed based on the %HIA. Based on Caco-2 permeability, the positive control and twenty-four PBD compounds were classified as moderate permeability, while twenty-one PBD compounds showed low permeability. In terms of PBB, the positive control and twenty-two PBD compounds were classified as strongly bound, and twenty-three PBD compounds were classified as weakly bound. Compounds with weak PPB (>90%) are expected to distribute more efficiently throughout the body compared to those with high PPB, which remain largely bound to plasma proteins and may have limited bioavailability [74,75].

Table 3.
Absorption, distribution, and toxicity assessment results on PBD compounds and positive control by PreADMET and Protox-3.0.
The toxicity screening results (Table 3) show that the PBD compounds are generally less toxic than the positive control. The positive control has a moderate toxicity classification and a higher risk of immunotoxicity, hepatotoxicity (4-OHT), and cytotoxicity (lasofoxifene), which can pose a high risk of adverse effects. Meanwhile, all PBD compounds exhibit a lower toxicity classification, with no dangers of carcinogenicity, hepatotoxicity, immunotoxicity, mutagenicity, and cytotoxicity. However, a mild immunotoxicity concern was observed in compounds PBD-1 to PBD-6. These findings suggest that the PBD compounds, with their favorable toxicity profiles, may serve as safer alternatives in drug development.
3.5. Docking-Based Interaction Simulations
Before performing molecular docking on test compounds, it is essential to conduct a validation process to ensure the reliability and accuracy of the docking protocol. Validation involves redocking a known ligand into the active site of the target protein and comparing the predicted binding pose. The parameter used was the root mean square deviation (RMSD), where a method is considered valid if the RMSD value is less than 2 Å [76]. The RMSD value measures the similarity of docking poses, with a higher RMSD value indicating less accurate pose predictions [77]. In this study, molecular docking was validated by redocking the native ligand (4-OHT) into the target protein 3ERT (ERα), to confirm and precisely determine the binding site on the protein. From this process, an RMSD value of 1.17 Å was obtained, indicating that the molecular docking method met the qualifications and showed good quality of bond pose reproduction because the RMSD value was less than 2 Å (Figure 3) with free energy of binding (∆G) value of −11.42 kcal/mol with an inhibition constant (Ki) value of 4.26 µM. Further, re-docking 4-OHT produced hydrogen bond interactions with the residues amino acid ARG394, GLU353, and LEU387.
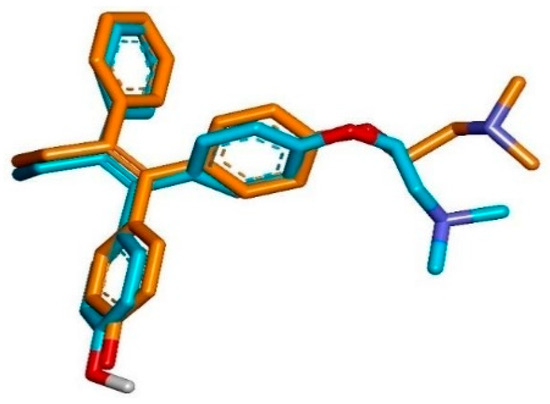
Figure 3.
Superimposition of the co-crystallized pose (orange) and the re-docking pose (blue) of 4-OHT in the active site of the ERα (RMSD = 1.17 Å).
Molecular docking was carried out to determine the possible interactions between the test compounds and important amino acid residues of the target protein (ERα), compared to the native ligand and reference ligands. The molecular docking uses the grid box arrangement obtained in the validation process to center the test ligands with the active sites on the native ligands. Among the 100× dockings performed, the conformation of the best cluster and the lowest bind energy was selected. Molecular docking results showed that all PBD compounds can interact with the ERα receptor. The binding energy (ΔG) values obtained range from −11.21 to −8.67 kcal/mol, and inhibition constant (Ki) values range from 6.08 to 440.16 nM (Table 4). The binding energy indicates the stability of the ligand binding to the receptor. The more minus (more negative) the binding energy, the more stable the resulting bond in the protein–ligand complex. The inhibition constant can indicate the inhibition between the ligand and the target protein. The smaller the inhibition constant value, the smaller the inhibition in the ligand–receptor bond [78]. The amino acid residues and interaction of the ligands with ERα are shown in Table 5.

Table 4.
The inhibition constant and different energy values of PBD compounds and reference ligands to ERα were generated from molecular docking using AutoDock4.

Table 5.
Amino acid residues and molecular interaction between ligands and ERα based on molecular docking results.
All PBD compounds have higher ΔG and Ki values compared to the comparative compounds available on the market, namely 4-OHT, raloxifene, and lasofoxifene. The PBD compounds with the smallest ΔG values are PBD-17 (−11.21 kcal/mol) and PBD-20 (−11.15 kcal/mol). These ΔG values are nearly identical to those of 4-OHT, suggesting that PBD-17 and PBD-20 may exhibit similar interactions to 4-OHT and have potential as anti-breast cancer agents. The PBD-17 and PBD-20 compounds formed hydrogen bonds with the same amino acids as the native ligand (4-OHT), namely ARG-394, GLU-353, and LEU-387. Additioally, both also interacted with GLU-353, a residue commonly involved in binding with the comparator ligands raloxifene and lasofoxifene, (Figure 4). Hydrogen bonding between the test ligand and the same amino acid residue on the natural ligand or the comparator ligand suggests similarity in interaction type, illustrating the similarity of activity [79]. These data demonstrated that PBD-17 and PBD-20 have the potential for stability and favorable binding affinity within the target receptor active region. On the other hand, a compound is deemed antagonistic to the ERα receptor when it does not interact with certain amino acid residues, especially His524 [80]. The hydrogen bond between the ligand and the HIS-524 amino acid residue is essential because it determines whether a ligand acts as an agonist or antagonist. ERα has a ligand binding domain (LBD) dominated by hydrophobic region and composed of helices 3, 6, 7, 8, 11, and 12. If a ligand forms a hydrogen bond with the HIS-524 residue and helix 12, it results in antagonist activity [81]. To further validate the interaction profiles and assess the dynamic behavior of the ligand–receptor complexes, molecular dynamics simulations were subsequently performed for both PBD-17 and PBD-20 compounds.
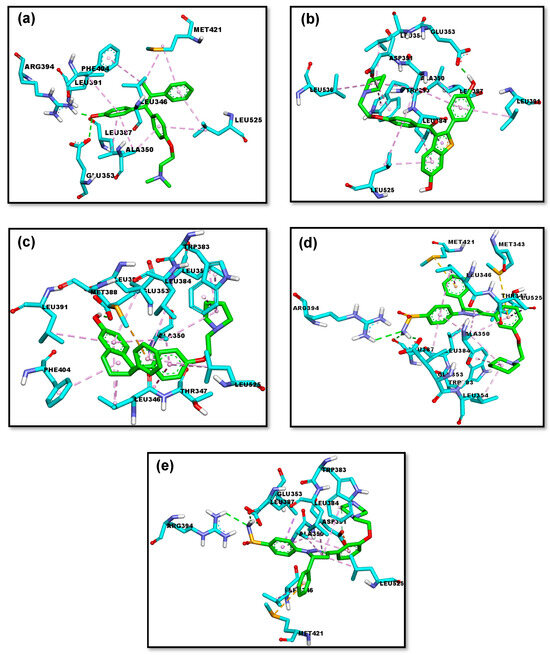
Figure 4.
The 3D representations of the molecular interactions between ERα and five ligands: (a) 4-OHT, (b) raloxifene, (c) lasofoxifene, (d) PBD-17, and (e) PBD-20. The interactions of hydrogen bonds, alkyl & pi-alkyl, amide-pi stacked, and pi-sigma are represented as green, pink, magenta, and purple dashed lines, respectively.
3.6. Molecular Flexibility Simulations
The best-performing compounds from molecular docking, PBD-17 and PBD-20, were subjected to 200 ns molecular dynamics (MD) simulations to further evaluate the stability of their complex with ERα. The RMSD parameter was calculated to assess the structural fluctuation of each protein–ligand complex relative to its initial conformation over time. As shown in Figure 5, the RMSD trajectories for all ligands were compared against the reference ligand, 4-OHT. In the PBD-17 system, lasofoxifene exhibited the highest fluctuations during the first 25 ns, stabilizing only later at 0.35 nm. In contrast, 4-OHT and raloxifene maintained lower and more consistent RMSD values between 0.25 and 0.30 nm, throughout the simulation, indicating better structural stability. The PBD-17–raloxifene complex reached equilibrium earlier and maintained a more uniform conformation over time. While the PBD-17- ERα complex initially showed greater fluctuations, it eventually stabilized, albeit more slowly than the other ligands. These observations suggest that the PBD-17 context, 4-OHT and raloxifene form more stable and conformationally consistent complexes with ERα than lasofoxifene. A stable RMSD profile general reflects minimal conformational changes, indicating stronger binding accommodation and reduced energetic strain.
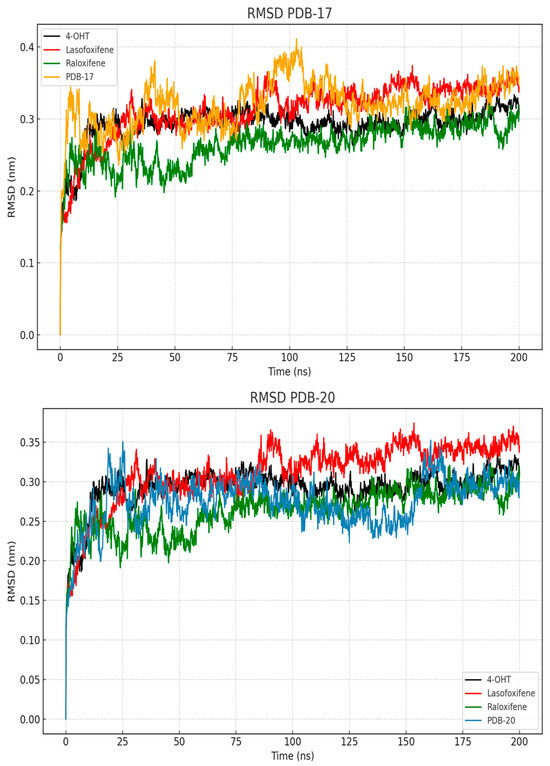
Figure 5.
RMSD values of the protein and ligands during 200 ns of MD simulation.
In contrast, the PBD-20 system shows distinct and more favorable stabilization patterns across all ligands. The 4-OHT- ERα complex achieved equilibrium rapidly, within the first 10 ns, and remained stable at around 0.27 nm. Complexes of PBD-20 with raloxifene and lasofoxifene also displays consistent RMSD trajectories, although lasofoxifene exhibits a slightly higher plateau near to 0.34 nm. Interestingly, the PBD-20- ERα complex exhibited only moderate early fluctuation, stabilizing after approximately 27 ns and ultimately displayed lower RMSD values compared to PBD-17. This may reflect greater plasticity of the binding site, allowing ERα to accommodate PBD-20 more efficiently. The lower RMSD deviation suggest that the PBD-20 system forms a more rigid and well-fitting complex with ERα, compared to the PBD-17 system. These results suggest that ERα exhibits more favorable binding characteristics in the present of PBD-20, likely due to enhanced conformational adaptability of the receptor. These flexibility may facilitate stronger and more stable interactions, contributing to the overall stability of the complex. Therefore, PBD-20 appears to better stabilize the ERα conformation during long-term molecular dynamics simulations compared to PBD-17.
The structural alignment of ERα bound to each ligand was evaluated using average conformations extracted from the 200 ns molecular dynamics simulations. As shown in Figure 6, the 4-OHT complex (a) served as the reference for comparison with lasofoxifene (b), raloxifene (c), PBD-17 (d), and PBD-20 (e). Among all tested complexes, PBD-20 displays the closest structural resemblance to the 4-OHT-bound ERα, with minimal deviations across the ligand-binding domain. In contrast, raloxifene induces visible shifts in loop regions near the C-terminal, particularly around residues 530–550. Lasofoxifene also causes mild conformational changes near the helical region, although the overall fold remains preserved. The PBD-17 complexes, however, displayed more pronounced deviation, especially in the flexible peripheral regions, suggesting a less stable binding conformation. These differences highlight the variable impact of each ligand on receptor structure, depending on binding strength and molecular fit. The preserved structural integrity in PBD-20 suggests stronger accommodation within the binding pocket. Ligands that maintain a conformation closer to the native antagonist structure are more favorable for suppressing ERα activity. Therefore, the alignment results emphasize that 4-OHT and PBD-20 induce the most stable and structurally consistent binding to ERα.
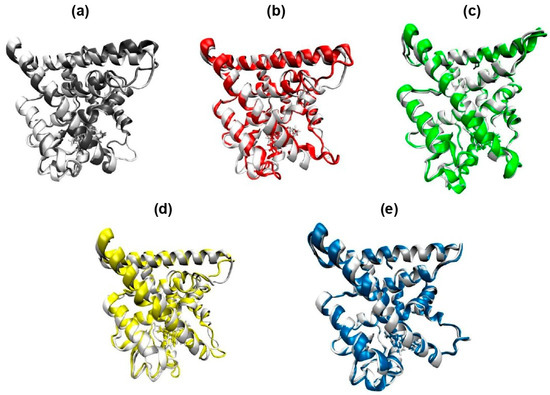
Figure 6.
Conformational overlap of the 3D structure of the ERα complex with each of its inhibitor ligands against the ERα-4OHT complex used as a positive control. The 3D structure is based on the average conformation that occurs throughout 200 ns of molecular dynamics simulation. (a) 4-OHT, (b) lasofoxifene, (c) raloxifene, (d) PBD-17, and (e) PBD-20.
The root mean square fluctuation (RMSF) analysis was conducted to assess the flexibility of individual residue within the ERα protein during the 200 ns MD simulation. As shown in Figure 7, fluctuations were primarily observed in the terminal and loop regions, particularly between residues 530 and 550. In the PDB-17 system, both lasofoxifene and PBD-17 exhibit slightly higher residue fluctuations, although overall RMSF values remained below 0.4 nm across all ligand. The highest flexibility was observed in the C-terminal region, which is commonly associated with structural arrangements during ligand binding. In comparison, the PBD-20 system shows more pronounced variability. Lasofoxifene and raloxifene induced higher RMSF values exceeding 0.5 nm in certain regions. Meanwhile, the 4-OHT complex maintained the most stable fluctuation profile, with the lowest RMSF across nearly all residues. The bar plots of residues with RMSF > 0.2 nm clearly demonstrate that PBD-20 has more flexible residues than PBD-17, suggesting looser stabilization in some regions. High flexibility in the binding site may lead to reduced binding affinity or receptor destabilization, particularly in antagonistic contexts. Ligands that induce minimal flexibility are generally associated with tighter, more stable interactions. These findings reinforce that 4-OHT yields the most stable residue dynamics, while PBD-20, despite some flexibility, still maintains favorable fluctuation behavior.
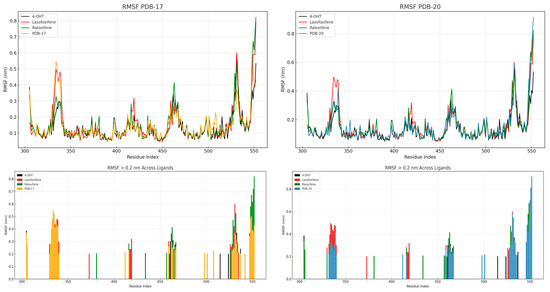
Figure 7.
RMSF on 4-OHT, lasofoxifene, raloxifene, PBD-17 and PBD-20 against ERα.
To further evaluate the structural integrity of the complexes, the radius of gyration (Rg) and solvent accessible surface area (SASA) were analyzed to assess the compactness and solvent exposure of the ERα–ligand complexes throughout the 200 ns simulation. As depicted in Figure 8, all systems maintain stable Rg values within the range of 1.86–1.92 nm, indicating no major unfolding events. The 4-OHT complex consistently shows the lowest Rg values in both PBD-17 and PBD-20 systems, reflecting a tightly packed and stable conformation. Raloxifene and lasofoxifene exhibit slightly higher Rg values, especially in the PBD-17 structure, suggesting more relaxed protein packing. SASA profiles further demonstrate that the 4-OHT complex has the lowest solvent exposure over time, reinforcing its stable and compact binding. Lasofoxifene shows greater SASA fluctuation in both systems, with a notable increase in the first 50 ns, indicating transient exposure of hydrophobic regions. The PBD-20 system generally exhibits lower SASA values than PBD-17, suggesting that ligands were better shielded from the solvent in this conformation. Compact structures with reduced solvent exposure typically correlate with favorable binding and energetic stability. The consistent behavior of 4-OHT in both Rg and SASA analysis supports its role as a structurally stable ERα antagonist. These results suggest that PBD-20, particularly in complex with 4-OHT, promotes a more compact and less solvent-exposed conformation of ERα.
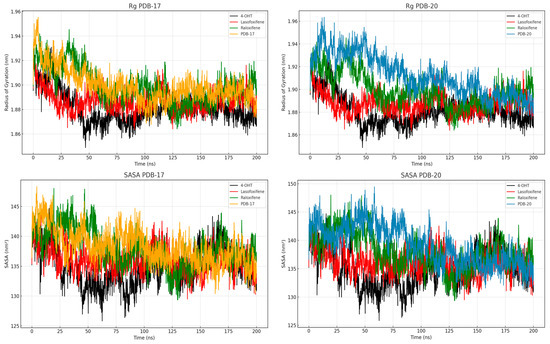
Figure 8.
Rg and SASA values of the protein and ligands during 200 ns of MD simulation.
Hydrogen bond analysis was performed to evaluate the stability and persistence of key interactions between ERα and each ligand during the 200 ns simulation. As shown in Table 6, 4-OHT exhibits the strongest hydrogen bonding profile, with GLU353 forming a stable hydrogen bond for 69.08% of the simulation time. Lasofoxifene also forms a frequent hydrogen bond with GLU353 (58.14%), indicating a conserved interaction site within the binding pocket. Raloxifene shows multiple hydrogen bonds, particularly with GLU353 (67.58%) and GLY521 (48.05%), suggesting broader contact regions that may enhance anchoring within ERα. PBD-17 and PBD-20 exhibit lower hydrogen bond occupancy, although specific interactions such as ARG394–S20553 (20.68%) in the PBD-20 system provide additional binding support. The presence of consistent hydrogen bonding, especially with GLU353, is a hallmark of effective ERα antagonists. Raloxifene’s dual-site hydrogen bonding may compensate for its higher RMSF by stabilizing critical binding residues. The lower hydrogen bond frequency in PBD-17 implies weaker or less sustained interactions. In contrast, PBD-20 achieves modest but focused hydrogen bonding that complements its favorable energy profile. These patterns indicate that 4-OHT and raloxifene maintain the most stable hydrogen bond interactions with ERα during the simulation.

Table 6.
Hydrogen bond analysis from 200 ns MD trajectories of all systems.
The binding free energy of each ERα–ligand complex was calculated using the MM-PBSA method and is summarized in Table 7. Among all complexes, lasofoxifene exhibits the most favorable total binding energy (−157.886 kJ/mol), primarily driven by strong van der Waals interactions (−278.701 kJ/mol). However, this is offset by its high polar solvation energy (+102.413 kJ/mol), which reduces the net binding strength. The 4-OHT complex shows a balanced energy profile, with a total binding energy of −145.307 kJ/mol supported by moderate van der Waals (−241.168 kJ/mol) and electrostatic (−46.459 kJ/mol) contributions. PBD-20 also demonstrates a favorable total binding energy (−139.462 kJ/mol), indicating that its interaction with ERα is energetically stable. Raloxifene’s total binding energy (−121.156 kJ/mol) was lower, but still significant, with decent van der Waals and electrostatic components. In contrast, PBD-17 has the weakest binding energy (−58.229 kJ/mol), reflecting less favorable interaction and dynamic behavior during the simulation. The consistent SASA and non-polar contributions across all systems suggest similar solvent exposure profiles. Ligands with lower polar solvation penalties and stronger non-covalent interactions exhibit better binding affinity. These results confirm that lasofoxifene, 4-OHT, and PBD-20 possess the most energetically stable interactions with ERα among the tested compounds.

Table 7.
The decomposition of calculated binding energies using MM-PBSA.
3.7. Pharmacophore-Based Design
Pharmacophore modeling of the PBD compounds was performed to predict functional geometric features important for ERα bioactivity. Pharmacophore modeling is an in silico method used to indicate the activity of compounds based on their pharmacophore features. Pharmacophore features encompass a drug compound’s functional groups or chemical features responsible for its biological activity [27]. The approach employed in pharmacophore modeling is to identify chemical feature similarities among the compounds being tested and compounds known to be active against the receptor [82]. Compounds with the same pharmacophore features are predicted to possess comparable biological activity, as they are likely to occupy the same binding region on the target receptor [83]. Pharmacophore modeling of ligand-based was carried out using 200 active sets (active compounds) and 4000 decoy sets (inactive compounds) against ERα. This resulted in ten pharmacophore models with scores ranging from 0.7400 to 0.8295 with four pharmacophore features, including hydrogen-bond donors, hydrogen bond acceptors, hydrophobic interaction, and aromatic ring (Figure 9).
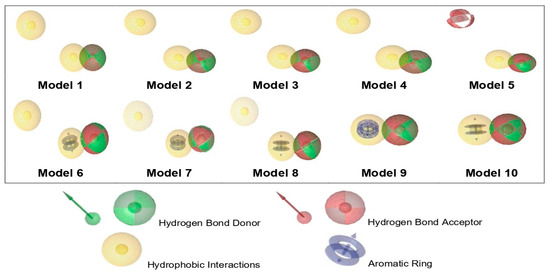
Figure 9.
Visualization of the essential features of a ligand-based pharmacophore.
Before being used as a reference in virtual screening, a pharmacophore model must undergo validation to ensure its ability to accurately distinguish between active and inactive compounds. In this study, ten pharmacophore models were validated, and their performance was assessed using Receiver Operating Characteristic (ROC) curve. The ROC curve describes the relationship between the X-axis as false positive (1-specificity) and the Y-axis as true positive (sensitivity) (Figure 10). The Area Under the Curve (AUC) in the ROC curve represents a quantitative measure of model performance with a value ranging from 0 to 1 (or 0% to 100%). A model with an AUC value close to 1 shows that the pharmacophore model can effectively differentiate between active and inactive compounds with high accuracy and precision [84].
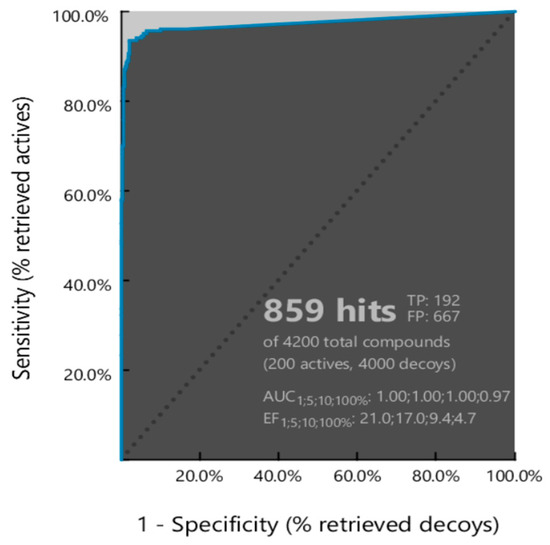
Figure 10.
ROC curve of Model 2 from pharmacophore modeling validation.
Among the ten models, Model 2 demonstrated the best performance, identifying 859 hit compounds with an AUC value of 0.97, an enrichment factor (EF) of 4.7, sensitivity of 96%, specificity of 84%, and overall accuracy of 85%. Based on these results, Model 2 was selected for subsequent pharmacophore-based virtual screening.
Virtual screening, conducted using the validated Model 2 via LigandScout, revealed that all PBD compounds were identified as hit compounds, indicating strong pharmacophore feature alignment (Table 8). Notably, PBD-17 and PBD-20 exhibited the highest pharmacophore fit scores (45.20), suggesting a strong match with the pharmacophore model. These two compounds demonstrated key interactions involving one hydrogen-bond donor (HBD), one hydrogen bond acceptor (HBA), and two hydrophobic interactions (HI), as illustrated in Figure 11. This strong fit further supports their potential as effective ERα antagonists.

Table 8.
The pharmacophore fit score values of PBD compounds and reference ligands.
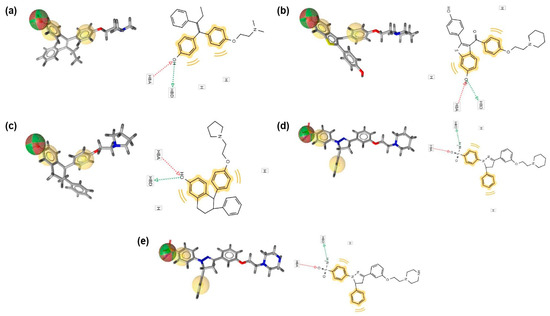
Figure 11.
Matching characteristics of PBD compounds and reference ligands in the best pharmacophore model. (a) 4-OHT, (b) raloxifene, (c) lasofoxifene, (d) PBD-17, and (e) PBD-20. Hydrogen bond donor (green sphere), hydrogen bond acceptor (red sphere), and hydrophobic area (yellow spheres) are the properties of the model.
4. Conclusions
The essential interactions of pyrazoline benzenesulfonamide derivatives (PBDs) with estrogen receptor alpha (ERα) involve both hydrogen bonding and hydrophobic interactions. Among the 45 designed candidates, PBD-17 and PBD-20 emerged as the most promising compounds based on a comprehensive in silico evaluation involving molecular docking, molecular dynamics simulations, and pharmacophore modeling. These compounds feature modifications at position 3 of the parent structure, replacing the hydroxy group with piperidine (PBD-17) and piperazine (PBD-20), respectively. Both PBD-17 and PBD-20 complied with Lipinski’s Rule of Five, showed high predicted cytotoxicity against breast carcinoma (MCF-7), and exhibited favorable ADMET profiles. Molecular docking revealed binding free energy (ΔG) of 11.21 kcal/mol for PBD-17 and −11.15 kcal/mol for PBD-20, indicating strong receptor affinity. Molecular dynamics simulation demonstrated that the ERα–PBD-20 complex was more conformational stable, with lower average RMSD of 0.26 nm (2.6 Å) compared to the ERα–PBD-17 complex, which stabilized around 0.32 nm (3.2 Å). PBD-20 achieved equilibrium after 27 ns and maintained a stable conformation throughout the 200 ns simulation, while PBD-17 took longer to stabilize and showed greater early-phase deviations. Structural alignment analysis showed that PBD-20 preserved the ERα backbone architecture with minimal displacement, closely resembling the reference 4-OHT complex. The residue fluctuation profile (RMSF) indicated that 4-OHT generated the least flexibility, while PBD-20 and lasofoxifene showed higher fluctuations at several loop regions. In terms of compactness, the radius of gyration (Rg) for ERα–PBD-20 remained consistently around 1.88 nm, suggesting stable packing, whereas solvent-accessible surface area (SASA) values decreased gradually to around 125 nm2, reflecting reduced solvent exposure. Hydrogen bonding analysis showed that the ERα–PBD-20 complex maintained interactions such as ARG394–S20553 with an occupancy of 20.68%, while the reference 4-OHT–GLU353 interaction was sustained for 69.08% of the time. The MM-PBSA binding free energy (ΔGTotal) values derived from the decomposition analysis revealed that PDB-17 and PDB-20 exhibited significantly more favorable binding affinities compared to the reference ligand 4-OHT. Specifically, PDB-20 showed a binding energy of −139.462 kJ/mol, while PDB-17 had −58.229 kJ/mol. In contrast, the 4-OHT complex exhibited a binding energy of −145.307 kJ/mol, slightly more negative than PDB-20 but with greater variation and less favorable supporting energy components. Notably, the van der Waals energy was the most substantial contributor to the binding in PDB-20 (−269.768 kJ/mol), followed by 4-OHT (−210.692 kJ/mol), indicating strong non-covalent interactions in these complexes. Electrostatic contributions also favored binding in PDB-20 (−37.782 kJ/mol) compared to 4-OHT (−46.459 kJ/mol). Despite incurring higher polar solvation energy (194.421 kJ/mol), PDB-20 maintained favorable total energy due to compensating van der Waals and SASA energy contributions (−26.333 kJ/mol). These findings suggest that PBD-20 demonstrates a favorable structural and energetic profile when interacting with ERα, as reflected across all dynamic parameters. Based on pharmacophore modeling, PBD-17 and PBD-20 have features that include one hydrogen-bond donor (HBD), one hydrogen bond acceptor (HBA), and two hydrophobic interactions (HI) with a pharmacophore fit score of 45.20%. These findings position PBD-17 and PBD-20 as rationally designed lead compound with strong potential as ERα inhibitors. They are suitable candidates for further biological validation and optimization, offering promise as anti-breast cancer agents with potentially improved safety profiles compared to 4-OHT.
Author Contributions
Conceptualization, M.M., I.M. and R.H.; methodology, M.M. and D.M.H.; software, M.M., I.M. and T.M.F.; validation, M.M., I.M., R.H., N.K.K.I. and T.M.F.; formal analysis, D.M.H., M.M. and N.K.K.I.; performed the conceptualization, D.M.H.; investigation, D.M.H. and M.M.; resources, M.M.; data curation, D.M.H., I.M. and M.M.; writing—original draft preparation, D.M.H., M.M. and N.K.K.I.; writing—review and editing, D.M.H., I.M., R.H., N.K.K.I. and M.M.; visualization, D.M.H., T.M.F. and M.M.; supervision, M.M., I.M. and R.H.; project administration, M.M.; funding acquisition, D.M.H. and M.M. All authors have read and agreed to the published version of the manuscript.
Funding
This study did not receive any form of funding.
Institutional Review Board Statement
Not applicable.
Informed Consent Statement
Not applicable.
Data Availability Statement
The original contributions presented in this study are included in this article. Further inquiries can be directed to the corresponding author.
Acknowledgments
The authors gratefully acknowledge Rector Universitas Padjadjaran, Indonesia, for use of their facilities for this study. The authors also thank the 6th ISPST and 15th Annual ISCC 2024 Committee of Universitas Padjadjaran, who have facilitated the preparation of this manuscript, including helping with English proofreading.
Conflicts of Interest
The authors declare no conflicts of interest.
Abbreviations
| EF | Enrichment Factor |
| HBA | Hydrogen Bond Acceptor |
| HBD | Hydrogen-Bond Donor |
| HI | Hydrophobic Interactions |
| HIA | Human Intestinal Absorption |
| LBDD | Ligand-Based Drug Design |
| MW | Molecular Weight |
| MlogP | Moriguchi Octanol–Water Partition Coefficient |
| MM-PBSA | Molecular Mechanics Poisson–Boltzmann Surface Area |
| PPB | Plasma Protein Binding |
| RMSD | Root Mean Square Deviation |
| RMSF | Root Mean Square Fluctuation |
| ROC | Receiver Operating Characteristic |
| SBDD | Structure-Based Drug Design |
References
- Arnold, M.; Morgan, E.; Rumgay, H.; Mafra, A.; Singh, D.; Laversanne, M.; Vignat, J.; Gralow, J.R.; Cardoso, F.; Siesling, S.; et al. Current and Future Burden of Breast Cancer: Global Statistics for 2020 and 2040. Breast 2022, 66, 15–23. [Google Scholar] [CrossRef] [PubMed]
- Bray, F.; Laversanne, M.; Sung, H.; Ferlay, J.; Siegel, R.L.; Soerjomataram, I.; Jemal, A. Global Cancer Statistics 2022: GLOBOCAN Estimates of Incidence and Mortality Worldwide for 36 Cancers in 185 Countries. CA Cancer J. Clin. 2024, 74, 229–263. [Google Scholar] [CrossRef] [PubMed]
- Cao, W.; Qin, K.; Li, F.; Chen, W. Comparative Study of Cancer Profiles between 2020 and 2022 Using Global Cancer Statistics (GLOBOCAN). J. Natl. Cancer Cent. 2024, 4, 128–134. [Google Scholar] [CrossRef] [PubMed]
- Ashtekar, S.S.; Bhatia, N.M.; Bhatia, M.S. Development of Leads Targeting ER-α in Breast Cancer: An in Silico Exploration from Natural Domain. Steroids 2018, 131, 14–22. [Google Scholar] [CrossRef] [PubMed]
- Chimento, A.; De Luca, A.; Avena, P.; De Amicis, F.; Casaburi, I.; Sirianni, R.; Pezzi, V. Estrogen Receptors-Mediated Apoptosis in Hormone-Dependent Cancers. Int. J. Mol. Sci. 2022, 23, 1242. [Google Scholar] [CrossRef] [PubMed]
- Ariazi, E.A.; Ariazi, J.L.; Cordera, F.; Jordan, V.C. Estrogen Receptors as Therapeutic Targets in Breast Cancer. Curr. Top. Med. Chem. 2006, 6, 181–202. [Google Scholar] [CrossRef] [PubMed]
- Chen, P.; Li, B.; Ou-Yang, L. Role of Estrogen Receptors in Health and Disease. Front. Endocrinol. 2022, 13, 839005. [Google Scholar] [CrossRef] [PubMed]
- Liu, Y.; Ma, H.; Yao, J. ERα, a Key Target for Cancer Therapy: A Review. OncoTargets Ther. 2020, 13, 2183–2191. [Google Scholar] [CrossRef] [PubMed]
- Hu, S.; Yin, F.; Nie, L.; Wang, Y.; Qin, J.; Chen, J. Estrogen and Estrogen Receptor Modulators: Potential Therapeutic Strategies for COVID-19 and Breast Cancer. Front. Endocrinol. 2022, 13, 829879. [Google Scholar] [CrossRef] [PubMed]
- Kumar, R.; Zakharov, M.N.; Khan, S.H.; Miki, R.; Jang, H.; Toraldo, G.; Singh, R.; Bhasin, S.; Jasuja, R. The Dynamic Structure of the Estrogen Receptor. J. Amino Acids 2011, 2011, 812540. [Google Scholar] [CrossRef] [PubMed]
- Lee, S.; Barron, M.G. Structure-Based Understanding of Binding Affinity and Mode of Estrogen Receptor α Agonists and Antagonists. PLoS ONE 2017, 12, e0169607. [Google Scholar] [CrossRef] [PubMed]
- Sinyani, A.; Idowu, K.; Shunmugam, L.; Kumalo, H.M.; Khan, R. A Molecular Dynamics Perspective into Estrogen Receptor Inhibition by Selective Flavonoids as Alternative Therapeutic Options. J. Biomol. Struct. Dyn. 2023, 41, 4093–4105. [Google Scholar] [CrossRef] [PubMed]
- Bafna, D.; Ban, F.; Rennie, P.S.; Singh, K.; Cherkasov, A. Computer-Aided Ligand Discovery for Estrogen Receptor Alpha. Int. J. Mol. Sci. 2020, 21, 4193. [Google Scholar] [CrossRef] [PubMed]
- Damkier, P.; Kjærsgaard, A.; Barker, K.A.; Cronin-Fenton, D.; Crawford, A.; Hellberg, Y.; Janssen, E.A.M.; Langefeld, C.; Ahern, T.P.; Lash, T.L. CYP2C19*2 and CYP2C19*17 Variants and Effect of Tamoxifen on Breast Cancer Recurrence: Analysis of the International Tamoxifen Pharmacogenomics Consortium Dataset. Sci. Rep. 2017, 7, 7727. [Google Scholar] [CrossRef] [PubMed]
- Yen, C.; Zhao, F.; Yu, Z.; Zhu, X.; Li, C.G. Interactions between Natural Products and Tamoxifen in Breast Cancer: A Comprehensive Literature Review. Front. Pharmacol. 2022, 13, 847113. [Google Scholar] [CrossRef] [PubMed]
- Yao, J.; Deng, K.; Huang, J.; Zeng, R.; Zuo, J. Progress in the Understanding of the Mechanism of Tamoxifen Resistance in Breast Cancer. Front. Pharmacol. 2020, 11, 592912. [Google Scholar] [CrossRef] [PubMed]
- Kurtanović, N.; Tomašević, N.; Matić, S.; Proia, E.; Sabatino, M.; Antonini, L.; Mladenović, M.; Ragno, R. Human Estrogen Receptor Alpha Antagonists, Part 3: 3-D Pharmacophore and 3-D QSAR Guided Brefeldin a Hit-to-Lead Optimization toward New Breast Cancer Suppressants. Molecules 2022, 27, 2823. [Google Scholar] [CrossRef] [PubMed]
- Lainé, M.; Fanning, S.W.; Chang, Y.-F.; Green, B.; Greene, M.E.; Komm, B.; Kurleto, J.D.; Phung, L.; Greene, G.L. Lasofoxifene as a Potential Treatment for Therapy-Resistant ER-Positive Metastatic Breast Cancer. Breast Cancer Res. 2021, 23, 54. [Google Scholar] [CrossRef] [PubMed]
- Hultsch, S.; Kankainen, M.; Paavolainen, L.; Kovanen, R.-M.; Ikonen, E.; Kangaspeska, S.; Pietiäinen, V.; Kallioniemi, O. Association of Tamoxifen Resistance and Lipid Reprogramming in Breast Cancer. BMC Cancer 2018, 18, 850. [Google Scholar] [CrossRef] [PubMed]
- Shagufta; Ahmad, I. Tamoxifen a Pioneering Drug: An Update on the Therapeutic Potential of Tamoxifen Derivatives. Eur. J. Med. Chem. 2018, 143, 515–531. [Google Scholar] [CrossRef] [PubMed]
- Zheng, Q.; Xu, F.; Nie, M.; Xia, W.; Qin, T.; Qin, G.; An, X.; Xue, C.; Peng, R.; Yuan, Z.; et al. Selective Estrogen Receptor Modulator-Associated Nonalcoholic Fatty Liver Disease Improved Survival in Patients with Breast Cancer: A Retrospective Cohort Analysis. Medicine 2015, 94, e1718. [Google Scholar] [CrossRef] [PubMed]
- Reimers, L.; Crew, K.D. Tamoxifen versus Raloxifene versus Exemestane for Chemoprevention. Curr. Breast Cancer Rep. 2012, 4, 207–215. [Google Scholar] [CrossRef] [PubMed]
- Subarnas, A.; Diantini, A.; Abdulah, R.; Zuhrotun, A.; Hadisaputri, Y.E.; Puspitasari, I.M.; Yamazaki, C.; Kuwano, H.; Koyama, H. Apoptosis Induced in MCF-7 Human Breast Cancer Cells by 2′,4′-Dihydroxy-6-Methoxy-3,5-Dimethylchalcone Isolated from Eugenia aquea Burm f. Leaves. Oncol. Lett. 2015, 9, 2303–2306. [Google Scholar] [CrossRef] [PubMed]
- Muchtaridi, M.; Yusuf, M.; Syahidah, H.N.; Subarnas, A.; Zamri, A.; Bryant, S.D.; Langer, T. Cytotoxicity of Chalcone of Eugenia Aquea burm F. Leaves against T47D Breast Cancer Cell Lines and Its Prediction as an Estrogen Receptor Antagonist Based on Pharmacophore-Molecular Dynamics Simulation. Adv. Appl. Bioinform. Chem. 2019, 12, 33–43. [Google Scholar] [CrossRef] [PubMed][Green Version]
- Prasetiawati, R.; Zamri, A.; Barliana, M.I.; Muchtaridi, M. In Silico Predictive for Modification of Chalcone with Pyrazole Derivatives as a Novel Therapeutic Compound for Targeted Breast Cancer Treatment. J. Appl. Pharm. Sci. 2019, 9, 020–028. [Google Scholar] [CrossRef]
- Lazniewski, M.; Dermawan, D.; Hidayat, S.; Muchtaridi, M.; Dawson, W.K.; Plewczynski, D. Drug repurposing for identification of potential spike inhibitors for SARS-CoV-2 using molecular docking and molecular dynamics simulations. Methods 2022, 203, 498–510. [Google Scholar] [CrossRef] [PubMed]
- Qing, X.; Lee, X.Y.; De Raeymaeker, J.; Tame, J.R.; Zhang, K.Y.; De Maeyer, M.; Voet, A.R. Pharmacophore Modeling: Advances, Limitations, and Current Utility in Drug Discovery. J. Recept. Ligand Channel Res. 2014, 7, 81–92. [Google Scholar] [CrossRef]
- de Ruyck, J.; Brysbaert, G.; Blossey, R.; Lensink, M.F. Molecular Docking as a Popular Tool in Drug Design, an in Silico Travel. Adv. Appl. Bioinform. Chem. 2016, 9, 1–11. [Google Scholar] [CrossRef] [PubMed]
- Hospital, A.; Goñi, J.R.; Orozco, M.; Gelpí, J.L. Molecular Dynamics Simulations: Advances and Applications. Adv. Appl. Bioinform. Chem. 2015, 8, 37–47. [Google Scholar] [CrossRef] [PubMed]
- Li, Z.; Wan, H.; Shi, Y.; Ouyang, P. Personal Experience with Four Kinds of Chemical Structure Drawing Software: Review on Chemdraw, Chemwindow, ISIS/Draw, and Chemsketch. J. Chem. Inf. Comput. Sci. 2004, 44, 1886–1890. [Google Scholar] [CrossRef] [PubMed]
- Daina, A.; Michielin, O.; Zoete, V. SwissADME: A Free Web Tool to Evaluate Pharmacokinetics, Drug-Likeness and Medicinal Chemistry Friendliness of Small Molecules. Sci. Rep. 2017, 7, 42717. [Google Scholar] [CrossRef] [PubMed]
- Lipinski, C.A.; Lombardo, F.; Dominy, B.W.; Feeney, P.J. Experimental and Computational Approaches to Estimate Solubility and Permeability in Drug Discovery and Development Settings. Adv. Drug Deliv. Rev. 2012, 64, 4–17. [Google Scholar] [CrossRef]
- Lagunin, A.A.; Rudik, A.V.; Pogodin, P.V.; Savosina, P.I.; Tarasova, O.A.; Dmitriev, A.V.; Ivanov, S.M.; Biziukova, N.Y.; Druzhilovskiy, D.S.; Filimonov, D.A.; et al. CLC-Pred 2.0: A Freely Available Web Application for in Silico Prediction of Human Cell Line Cytotoxicity and Molecular Mechanisms of Action for Druglike Compounds. Int. J. Mol. Sci. 2023, 24, 1689. [Google Scholar] [CrossRef] [PubMed]
- Lagunin, A.A.; Dubovskaja, V.I.; Rudik, A.V.; Pogodin, P.V.; Druzhilovskiy, D.S.; Gloriozova, T.A.; Filimonov, D.A.; Sastry, N.G.; Poroikov, V.V. CLC-Pred: A Freely Available Web-Service for in Silico Prediction of Human Cell Line Cytotoxicity for Drug-like Compounds. PLoS ONE 2018, 13, e0191838. [Google Scholar] [CrossRef] [PubMed]
- Lee, S.K.; Lee, I.H.; Kim, H.J.; Chang, G.S.; Chung, J.E.; No, K.T. The PreADME Approach: Web-Based Program for Rapid Prediction of Physico-Chemical, Drug Absorption and Drug-like Properties. In EuroQSAR 2002: Designing Drugs and Crop Protectants: Processes, Problems and Solutions; Blackwell Publishing: Malden, MA, USA, 2003; pp. 418–420. [Google Scholar]
- Banerjee, P.; Kemmler, E.; Dunkel, M.; Preissner, R. ProTox 3.0: A Webserver for the Prediction of Toxicity of Chemicals. Nucleic Acids Res. 2024, 52, W513–W520. [Google Scholar] [CrossRef] [PubMed]
- Drwal, M.N.; Banerjee, P.; Dunkel, M.; Wettig, M.R.; Preissner, R. ProTox: A Web Server for the in Silico Prediction of Rodent Oral Toxicity. Nucleic Acids Res. 2014, 42, W53–W58. [Google Scholar] [CrossRef] [PubMed]
- Berman, H.M.; Westbrook, J.; Feng, Z.; Gilliland, G.; Bhat, T.N.; Weissig, H.; Shindyalov, I.N.; Bourne, P.E. The Protein Data Bank. Nucleic Acids Res. 2000, 28, 235–242. [Google Scholar] [CrossRef] [PubMed]
- Shiau, A.K.; Barstad, D.; Loria, P.M.; Cheng, L.; Kushner, P.J.; Agard, D.A.; Greene, G.L. The Structural Basis of Estrogen Receptor/Coactivator Recognition and the Antagonism of This Interaction by Tamoxifen. Cell 1998, 95, 927–937. [Google Scholar] [CrossRef] [PubMed]
- Begam, K.A.; Kanagathara, N.; Marchewka, M.K.; Lo, A.-Y. DFT, Hirshfeld and Molecular Docking Studies of a Hybrid Compound—2,4-Diamino-6-Methyl-1,3,5-Triazin-1-Ium Hydrogen Oxalate as a Promising Anti-Breast Cancer Agent. Heliyon 2022, 8, e10355. [Google Scholar] [CrossRef] [PubMed]
- Moulishankar, A.; Sundarrajan, T. Pharmacophore, QSAR, Molecular Docking, Molecular Dynamics and ADMET Study of Trisubstituted Benzimidazole Derivatives as Potent Anti-Tubercular Agents. Chem. Phys. Impact 2024, 8, 100512. [Google Scholar] [CrossRef]
- Forli, S.; Huey, R.; Pique, M.E.; Sanner, M.F.; Goodsell, D.S.; Olson, A.J. Computational Protein–Ligand Docking and Virtual Drug Screening with the AutoDock Suite. Nat. Protoc. 2016, 11, 905–919. [Google Scholar] [CrossRef] [PubMed]
- Morris, G.M.; Huey, R.; Lindstrom, W.; Sanner, M.F.; Belew, R.K.; Goodsell, D.S.; Olson, A.J. AutoDock4 and AutoDockTools4: Automated Docking with Selective Receptor Flexibility. J. Comput. Chem. 2009, 30, 2785–2791. [Google Scholar] [CrossRef] [PubMed]
- Muchtaridi, M.; Dermawan, D.; Yusuf, M. Molecular Docking, 3D Structure-Based Pharmacophore Modeling, and ADME Prediction of Alpha Mangostin and Its Derivatives against Estrogen Receptor Alpha. J. Young Pharm. 2018, 10, 252–259. [Google Scholar] [CrossRef]
- Gurung, A.B.; Ali, M.A.; Lee, J.; Farah, M.A.; Al-Anazi, K.M. Molecular Docking and Dynamics Simulation Study of Bioactive Compounds from Ficus carica L. with Important Anticancer Drug Targets. PLoS ONE 2021, 16, e0254035. [Google Scholar] [CrossRef] [PubMed]
- Morris, G.M.; Goodsell, D.S.; Halliday, R.S.; Huey, R.; Hart, W.E.; Belew, R.K.; Olson, A.J. Automated Docking Using a Lamarckian Genetic Algorithm and an Empirical Binding Free Energy Function. J. Comput. Chem. 1998, 19, 1639–1662. [Google Scholar] [CrossRef]
- Case, D.A.; Aktulga, H.M.; Belfon, K.; Ben-Shalom, I.Y.; Brozell, S.R.; Cerutti, D.S.; Cheatham, T.E., III.; Cisneros, G.A.; Cruzeiro, V.W.D.; Darden, T.A.; et al. Amber 2021; University of California: San Francisco, CA, USA, 2021. [Google Scholar]
- Genheden, S.; Ryde, U. The MM/PBSA and MM/GBSA Methods to Estimate Ligand-Binding Affinities. Expert Opin. Drug Discov. 2015, 10, 449–461. [Google Scholar] [CrossRef] [PubMed]
- Taylor, M.; Ho, J. MM/GBSA Prediction of Relative Binding Affinities of Carbonic Anhydrase Inhibitors: Effect of Atomic Charges and Comparison with Autodock4Zn. J. Comput.-Aided Mol. Des. 2023, 37, 167–182. [Google Scholar] [CrossRef] [PubMed]
- Muchtaridi, M.; Syahidah, H.N.; Subarnas, A.; Yusuf, M.; Bryant, S.D.; Langer, T. Molecular Docking and 3D-Pharmacophore Modeling to Study the Interactions of Chalcone Derivatives with Estrogen Receptor Alpha. Pharmaceuticals 2017, 10, 81. [Google Scholar] [CrossRef] [PubMed]
- Mysinger, M.M.; Carchia, M.; Irwin, J.J.; Shoichet, B.K. Directory of Useful Decoys, Enhanced (DUD-E): Better Ligands and Decoys for Better Benchmarking. J. Med. Chem. 2012, 55, 6582–6594. [Google Scholar] [CrossRef] [PubMed]
- Yu, W.; MacKerell, A.D. Computer-Aided Drug Design Methods. In Antibiotics: Methods and Protocols; Sass, P., Ed.; Humana Press: New York, NY, USA, 2017; Volume 1520, pp. 85–106. ISBN 978-1-4939-6634-9. [Google Scholar]
- Shim, J.; MacKerell, Jr.; Alexander, D. Computational Ligand-Based Rational Design: Role of Conformational Sampling and Force Fields in Model Development. Med. Chem. Commun. 2011, 2, 356–370. [Google Scholar] [CrossRef] [PubMed]
- Yang, Y.; Zhu, Z.; Wang, X.; Zhang, X.; Mu, K.; Shi, Y.; Peng, C.; Xu, Z.; Zhu, W. Ligand-Based Approach for Predicting Drug Targets and for Virtual Screening against COVID-19. Brief. Bioinform. 2021, 22, 1053–1064. [Google Scholar] [CrossRef] [PubMed]
- Ferreira, L.G.; Dos Santos, R.N.; Oliva, G.; Andricopulo, A.D. Molecular Docking and Structure-Based Drug Design Strategies. Molecules 2015, 20, 13384–13421. [Google Scholar] [CrossRef] [PubMed]
- Kalyaanamoorthy, S.; Chen, Y.-P.P. Structure-Based Drug Design to Augment Hit Discovery. Drug Discov. Today 2011, 16, 831–839. [Google Scholar] [CrossRef] [PubMed]
- Fernandes, T.B.; Segretti, M.C.F.; Polli, M.C.; Parise-Filho, R. Analysis of the Applicability and Use of Lipinski’s Rule for Central Nervous System Drugs. Lett. Drug Des. Discov. 2016, 13, 999–1006. [Google Scholar] [CrossRef]
- Natesan, S.; Wang, Z.; Lukacova, V.; Peng, M.; Subramaniam, R.; Lynch, S.; Balaz, S. Structural Determinants of Drug Partitioning in N-Hexadecane/Water System. J. Chem. Inf. Model. 2013, 53, 1424–1435. [Google Scholar] [CrossRef] [PubMed]
- van der Spoel, D.; Manzetti, S.; Zhang, H.; Klamt, A. Prediction of Partition Coefficients of Environmental Toxins Using Computational Chemistry Methods. ACS Omega 2019, 4, 13772–13781. [Google Scholar] [CrossRef] [PubMed]
- Coimbra, J.T.S.; Feghali, R.; Ribeiro, R.P.; Ramos, M.J.; Fernandes, P.A. The Importance of Intramolecular Hydrogen Bonds on the Translocation of the Small Drug Piracetam through a Lipid Bilayer. RSC Adv. 2021, 11, 899–908. [Google Scholar] [CrossRef] [PubMed]
- Rafi, S.B.; Hearn, B.R.; Vedantham, P.; Jacobson, M.P.; Renslo, A.R. Predicting and Improving the Membrane Permeability of Peptidic Small Molecules. J. Med. Chem. 2012, 55, 3163–3169. [Google Scholar] [CrossRef] [PubMed]
- Chen, X.; Li, H.; Tian, L.; Li, Q.; Luo, J.; Zhang, Y. Analysis of the Physicochemical Properties of Acaricides Based on Lipinski’s Rule of Five. J. Comput. Biol. 2020, 27, 1397–1406. [Google Scholar] [CrossRef] [PubMed]
- Lipinski, C.A. Lead- and Drug-like Compounds: The Rule-of-Five Revolution. Drug Discov. Today Technol. 2004, 1, 337–341. [Google Scholar] [CrossRef] [PubMed]
- Zhang, M.-Q.; Wilkinson, B. Drug Discovery beyond the ‘Rule-of-Five’. Curr. Opin. Biotechnol. 2007, 18, 478–488. [Google Scholar] [CrossRef] [PubMed]
- Chagas, C.M.; Moss, S.; Alisaraie, L. Drug Metabolites and Their Effects on the Development of Adverse Reactions: Revisiting Lipinski’s Rule of Five. Int. J. Pharm. 2018, 549, 133–149. [Google Scholar] [CrossRef] [PubMed]
- Ghosh, A.; Chakraborty, M.; Chandra, A.; Alam, M.P. Structure-Activity Relationship (SAR) and Molecular Dynamics Study of Withaferin-A Fragment Derivatives as Potential Therapeutic Lead against Main Protease (Mpro) of SARS-CoV-2. J. Mol. Model. 2021, 27, 97. [Google Scholar] [CrossRef] [PubMed]
- Thomas, S.; Brightman, F.; Gill, H.; Lee, S.; Pufong, B. Simulation Modelling of Human Intestinal Absorption Using Caco-2 Permeability and Kinetic Solubility Data for Early Drug Discovery. J. Pharm. Sci. 2008, 97, 4557–4574. [Google Scholar] [CrossRef] [PubMed]
- Lambrinidis, G.; Vallianatou, T.; Tsantili-Kakoulidou, A. In Vitro, in Silico and Integrated Strategies for the Estimation of Plasma Protein Binding. A Review. Adv. Drug Deliv. Rev. 2015, 86, 27–45. [Google Scholar] [CrossRef] [PubMed]
- Charlier, B.; Coglianese, A.; De Rosa, F.; de Grazia, U.; Operto, F.F.; Coppola, G.; Filippelli, A.; Dal Piaz, F.; Izzo, V. The Effect of Plasma Protein Binding on the Therapeutic Monitoring of Antiseizure Medications. Pharmaceutics 2021, 13, 1208. [Google Scholar] [CrossRef] [PubMed]
- De Vivo, M.; Masetti, M.; Bottegoni, G.; Cavalli, A. Role of Molecular Dynamics and Related Methods in Drug Discovery. J. Med. Chem. 2016, 59, 4035–4061. [Google Scholar] [CrossRef] [PubMed]
- Bhat, V.; Chatterjee, J. The Use of in Silico Tools for the Toxicity Prediction of Potential Inhibitors of SARS-CoV-2. Altern. Lab. Anim. 2021, 49, 22–32. [Google Scholar] [CrossRef] [PubMed]
- Myshkin, E.; Brennan, R.; Khasanova, T.; Sitnik, T.; Serebriyskaya, T.; Litvinova, E.; Guryanov, A.; Nikolsky, Y.; Nikolskaya, T.; Bureeva, S. Prediction of Organ Toxicity Endpoints by QSAR Modeling Based on Precise Chemical-Histopathology Annotations. Chem. Biol. Drug Des. 2012, 80, 406–416. [Google Scholar] [CrossRef] [PubMed]
- Cavasotto, C.N.; Scardino, V. Machine Learning Toxicity Prediction: Latest Advances by Toxicity End Point. ACS Omega 2022, 7, 47536–47546. [Google Scholar] [CrossRef] [PubMed]
- Celestin, M.N.; Musteata, F.M. Impact of Changes in Free Concentrations and Drug-Protein Binding on Drug Dosing Regimens in Special Populations and Disease States. J. Pharm. Sci. 2021, 110, 3331–3344. [Google Scholar] [CrossRef] [PubMed]
- Wanat, K. Biological Barriers, and the Influence of Protein Binding on the Passage of Drugs across Them. Mol. Biol. Rep. 2020, 47, 3221–3231. [Google Scholar] [CrossRef] [PubMed]
- Su, M.; Yang, Q.; Du, Y.; Feng, G.; Liu, Z.; Li, Y.; Wang, R. Comparative Assessment of Scoring Functions: The CASF-2016 Update. J. Chem. Inf. Model. 2019, 59, 895–913. [Google Scholar] [CrossRef] [PubMed]
- Kirchmair, J.; Markt, P.; Distinto, S.; Wolber, G.; Langer, T. Evaluation of the Performance of 3D Virtual Screening Protocols: RMSD Comparisons, Enrichment Assessments, and Decoy Selection—What Can We Learn from Earlier Mistakes? J. Comput.-Aided Mol. Des. 2008, 22, 213–228. [Google Scholar] [CrossRef] [PubMed]
- Shivanika, C.; Deepak Kumar, S.; Ragunathan, V.; Tiwari, P.; Sumitha, A.; Brindha Devi, P. Molecular Docking, Validation, Dynamics Simulations, and Pharmacokinetic Prediction of Natural Compounds against the SARS-CoV-2 Main-Protease. J. Biomol. Struct. Dyn. 2022, 40, 585–611. [Google Scholar] [CrossRef]
- Mardianingrum, R.; Yusuf, M.; Hariono, M.; Mohd Gazzali, A.; Muchtaridi, M. α-Mangostin and Its Derivatives against Estrogen Receptor Alpha. J. Biomol. Struct. Dyn. 2022, 40, 2621–2634. [Google Scholar] [CrossRef] [PubMed]
- Gao, L.; Tu, Y.; Ågren, H.; Eriksson, L.A. Characterization of Agonist Binding to His524 in the Estrogen Receptor α Ligand Binding Domain. J. Phys. Chem. B 2012, 116, 4823–4830. [Google Scholar] [CrossRef] [PubMed]
- Muchtaridi, M.; Yusuf, M.; Diantini, A.; Choi, S.B.; Al-Najjar, B.O.; Manurung, J.V.; Subarnas, A.; Achmad, T.H.; Wardhani, S.R.; Wahab, H.A. Potential Activity of Fevicordin-A from Phaleria Macrocarpa (Scheff) Boerl. Seeds as Estrogen Receptor Antagonist Based on Cytotoxicity and Molecular Modelling Studies. Int. J. Mol. Sci. 2014, 15, 7225–7249. [Google Scholar] [CrossRef] [PubMed]
- Drwal, M.N.; Griffith, R. Combination of Ligand- and Structure-Based Methods in Virtual Screening. Drug Discov. Today Technol. 2013, 10, e395–e401. [Google Scholar] [CrossRef] [PubMed]
- Giordano, D.; Biancaniello, C.; Argenio, M.A.; Facchiano, A. Drug Design by Pharmacophore and Virtual Screening Approach. Pharmaceuticals 2022, 15, 646. [Google Scholar] [CrossRef] [PubMed]
- Luo, L.; Zhong, A.; Wang, Q.; Zheng, T. Structure-Based Pharmacophore Modeling, Virtual Screening, Molecular Cocking, ADMET, and Molecular Dynamics (MD) Simulation of Potential Inhibitors of PD-L1 from the Library of Marine Natural Products. Mar. Drugs 2022, 20, 29. [Google Scholar] [CrossRef]
Disclaimer/Publisher’s Note: The statements, opinions and data contained in all publications are solely those of the individual author(s) and contributor(s) and not of MDPI and/or the editor(s). MDPI and/or the editor(s) disclaim responsibility for any injury to people or property resulting from any ideas, methods, instructions or products referred to in the content. |
© 2025 by the authors. Licensee MDPI, Basel, Switzerland. This article is an open access article distributed under the terms and conditions of the Creative Commons Attribution (CC BY) license (https://creativecommons.org/licenses/by/4.0/).
