Systematic Review

Acoustic Voice Analysis as a Tool for Assessing Nasal Obstruction: A Systematic Review

1
Otolaryngology Division, Azienda Ospedaliera Universitaria, 07100 Sassari, Italy
2
Speech and Language Therapy Department, School of Health Sciences, Cappadocia University, Ürgüp 50400, Nevşehir, Turkey
3
Department of Electronic Engineering, University of Rome Tor Vergata, 00133 Rome, Italy
4
Section of Otolaryngology, Department of Medicine, Surgery and Pharmacy, Università di Sassari, 07100 Sassari, Italy
*
Author to whom correspondence should be addressed.
Appl. Sci. 2025, 15(15), 8423; https://doi.org/10.3390/app15158423
Submission received: 29 April 2025 / Revised: 23 July 2025 / Accepted: 24 July 2025 / Published: 29 July 2025
(This article belongs to the Special Issue Innovative Digital Health Technologies and Their Applications)

Abstract

Objective: This study aims to critically review and synthesize the existing literature on the use of voice analysis in assessing nasal obstruction, with a particular focus on acoustic parameters. Data sources: PubMed, Scopus, Web of Science, Ovid Medline, and Science Direct. Review methods: A comprehensive literature search was conducted without any restrictions on publication year, employing Boolean search techniques. The selection and review process of the studies followed PRISMA guidelines. The inclusion criteria comprised studies with participants aged 18 years and older who had nasal obstruction evaluated using acoustic voice analysis parameters, along with objective and/or subjective methods for assessing nasal obstruction. Results: Of the 174 abstracts identified, 118 were screened after the removal of duplicates. The full texts of 37 articles were reviewed. Only 10 studies met inclusion criteria. The majority of these studies found no significant correlations between voice parameters and nasal obstruction. Among the various acoustic parameters examined, shimmer was the most consistently affected, with statistically significant changes identified in three independent studies. A smaller number of studies reported notable findings for fundamental frequency (F0) and noise-related measures such as NHR/HNR. Conclusion: This systematic review critically evaluates existing studies on the use of voice analysis for assessing and monitoring nasal obstruction and hyponasality. The current evidence remains limited, as most investigations predominantly focus on glottic sound and dysphonia, with insufficient attention to the influence of the vocal tract, particularly the nasal cavities, on voice production. A notable gap exists in the integration of advanced analytical approaches, such as machine learning, in this field. Future research should focus on the use of advanced analytical approaches to specifically extrapolate the contribution of nasal resonance to voice thus defining the specific parameters in the voice spectrogram that can give precise information on nasal obstruction.

1. Introduction

Nasal obstruction can be considered either a symptom (and therefore a subjective complaint of the patient) or an increase in nasal resistance to airflow (which can be an objective measurable parameter). As a symptom, nasal obstruction is a discomfort associated with a sensation of insufficient airflow through the nostrils. Objective and subjective nasal obstruction are therefore assessed with different strategies, but the causes are the same [1]. The most common ones include stenosis or collapse of the nasal valve, deviation of the nasal septum, hypertrophy of the inferior turbinates, rhinosinusitis with/without nasal polyps (CRSwNP, CRSsNP), choanal stenosis or atresia, and masses in the nasopharynx [2].
Nasal obstruction can be assessed through three distinct strategies: patient-reported outcomes, physician assessments, and objective measurements [3]. Patient-reported outcome measures (PROMs) include the Nasal Obstruction Symptom Evaluation (NOSE) scale [4] and visual analog scales (VAS) [5], which measure the severity of symptoms. Physicians frequently employ grading systems such as the modified Lund-Kennedy endoscopic score [6], the nasal polyp score (NPS), or semiquantitative clinical evaluations (e.g., mild, moderate, severe obstruction) obtained from rhinoscopy and nasal endoscopy. The objective measures consist of, among others, acoustic rhinometry, which evaluates the dimensions of the nasal cavity [7], rhinomanometry, which evaluates airflow resistance [8], and peak nasal inspiratory flow (PNIF) [9]. Imaging techniques, which include CT, can identify structural causes, such as septal deviation [10], and can also be scored (as in the Lund–Mackay scoring system). Although each method possesses limitations, their combined application enhances diagnostic accuracy. Nasal cavities are involved in resonance phenomena leading to the genesis of voice; therefore, obstruction may also result in perceptible alterations in voice quality. In fact, hyponasality, also known as rhinophonia clausa, is a condition characterized by a decrease in the typical nasal resonance during speaking due to obstruction, that is, a hindered flow of air via the nasal channel [11]. Hyponasality may impact the articulation of nasal consonants, namely the sounds /m/, /n/, and /ŋ/. Nasal consonants may sound like their oral phoneme cognates (b/m, d/n, and g/ŋ) when nasal resonance is diminished. If hyponasality is extreme, it can also impact the quality of vowels [12]. The impact of nasal obstruction on voice output is evident, as it can be perceived not only by clinicians but also by lay listeners, who are usually able to detect nasal obstruction through hyponasality of speech.
In the literature, various attempts can be found to objectify this perceptive detection of nasal obstruction through acoustic voice analysis, as acoustic analysis is increasingly used in clinical practice due to technological advances and lower equipment costs.
A key study [13] indicated that nasometric measurements can accurately represent nasal patency, exhibiting moderate sensitivity and high specificity, and correlating hyponasality ratings with clinical airflow impairment.
These findings confirm that analysis of voice can enhance conventional airflow and imaging evaluations, providing a practical clinical approach for diagnosing and monitoring nasal obstruction in conditions.
The purpose of this systematic review is therefore to obtain a more comprehensive understanding of the present state of knowledge about voice analysis as a tool to assess and/or monitor nasal obstruction. It aims to consolidate limited but emerging evidence that shows how voice analysis can be utilized for screening for nasal obstruction. This review aims not only to summarize current knowledge but also to provide a conceptual framework for developing noninvasive, voice-based monitoring tools that could be useful in telemedicine and chronic care pathways. It also identifies methodological gaps, promising acoustic parameters, and current trends to guide future clinical and technical improvements.

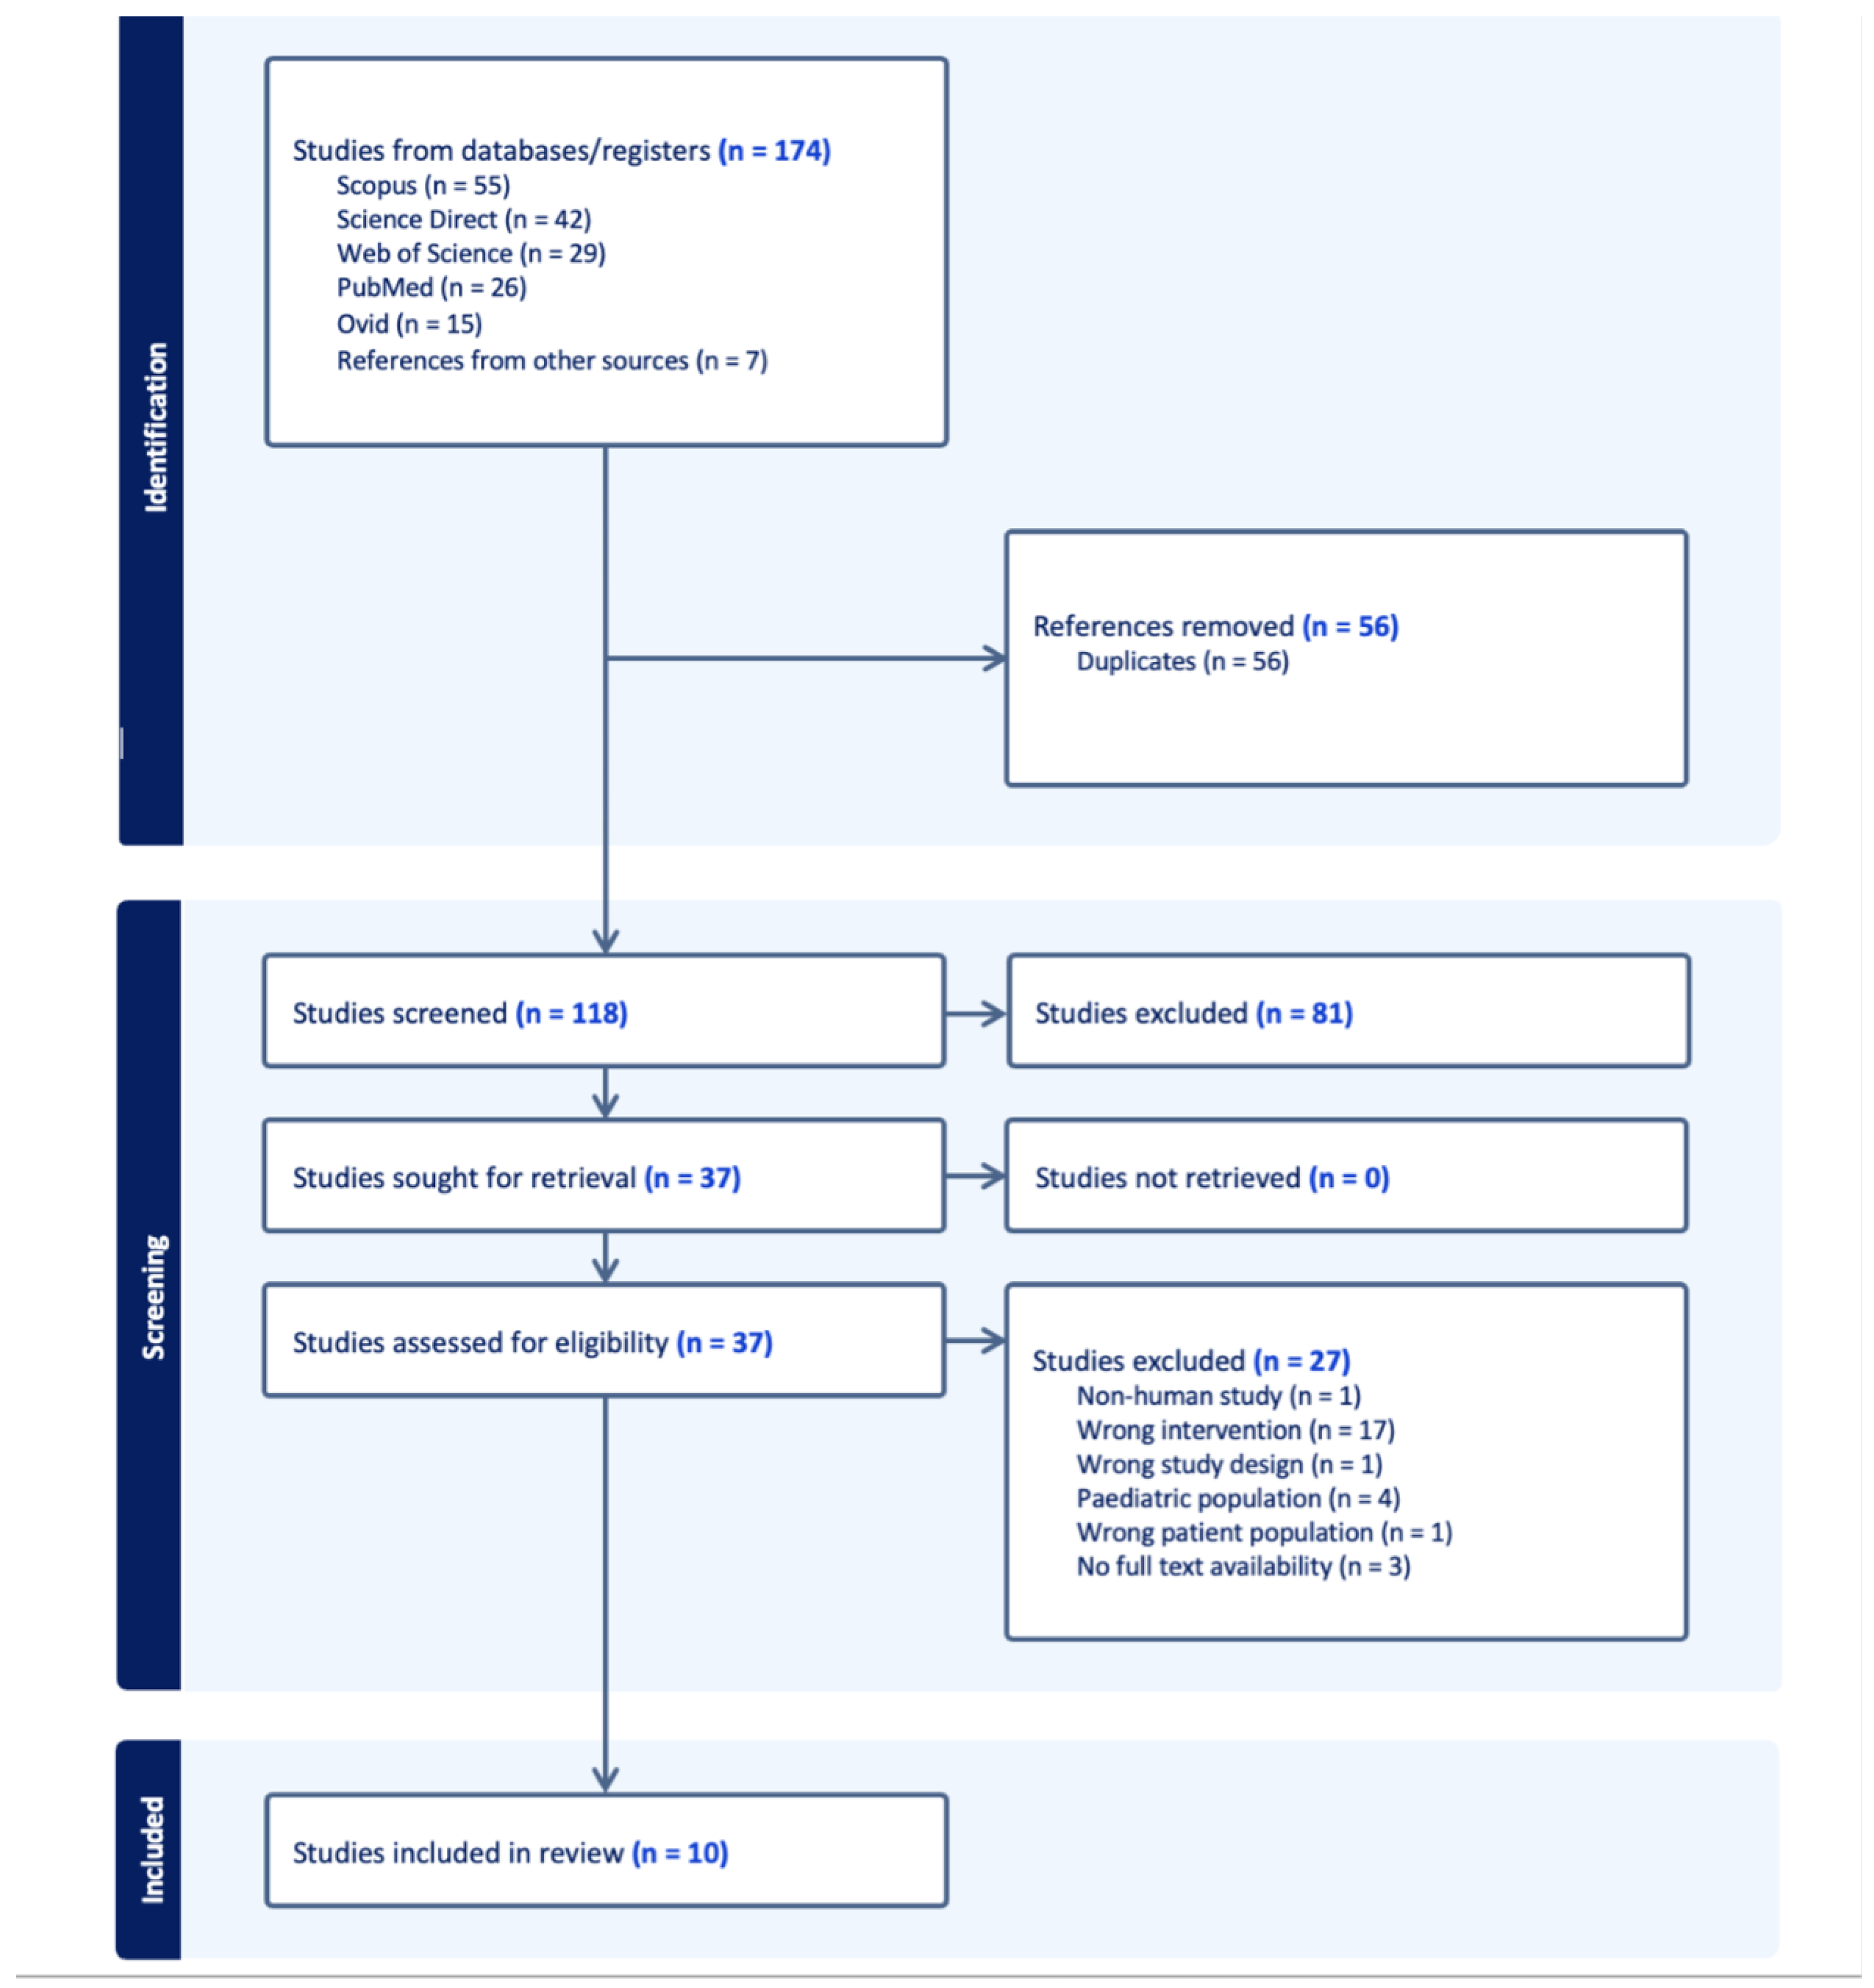
2. Materials and Methods

In this research, the methodology adhered to PRISMA (Preferred Reporting Items for Systematic Reviews and Meta-analyses) principles [14] to systematically search and analyze the literature in order to collect the current evidence about correlations between the voice and the objective/subjective measurements of nasal obstruction.

2.1. Search Methods

A comprehensive literature review was conducted using databases that include PubMed, Scopus, Web of Science, Ovid Medline, and ScienceDirect. The literature search was conducted without specifying any year range. We performed a Boolean search in the literature where the OR modifier was used to connect words within the same category, while the AND modifier was utilized to link different categories. The final search was executed on 18 January 2024.
The following search string was used across all databases (see Listing 1):
Listing 1: Search query used in the systematic review (PubMed syntax shown)
("nasal obstruction" [Title/Abstract]
OR "chronic sinusitis" [Title/Abstract]
OR "poliposis" [Title/Abstract]
OR "nasal polyp" [Title/Abstract]
OR "septal deviation" [Title/Abstract]
OR "turbinate hypertrophy" [Title/Abstract]
OR "choanal atresia" [Title/Abstract]
OR ("swollen" [All Fields]
AND "nasal tissues" [Title/Abstract])
OR "foreign body in nose" [Title/Abstract]
OR "nose surgery" [Title/Abstract])
AND ("acoustic voice analysis" [Title/Abstract]
OR "acoustic voice measurement" [Title/Abstract]
OR "spectogram" [Title/Abstract]
OR "jitter" [Title/Abstract]
OR "shimmer" [Title/Abstract]
OR "harmonic to noise ratio" [Title/Abstract]
OR "hyponasality" [Title/Abstract]
OR "acoustic analysis" [Title/Abstract]
OR "nasometer" [Title/Abstract])

2.2. Selection Criteria

In this study, the PRISMA principles [14] were adhered to throughout the process of selecting and reviewing studies. The results of the previously mentioned searches were imported into the Covidence systematic review software (Veritas Health Innovation, Melbourne, Australia, accessible at www.covidence.org). Duplicates were removed, and the remaining studies were screened based on title and abstract. An additional check was performed on the references of the retrieved articles. The full texts of the articles were evaluated to determine whether they met the inclusion and exclusion criteria outlined previously (see below). Two authors independently reviewed each article at both the title/abstract and full-text stages, blinded to each other’s ratings. Disagreements were resolved through consensus meetings among all six reviewers.
The inclusion criteria were as follows: (i) studies involving adult human participants (≥18 years); (ii) studies with participants having a clinically diagnosed nasal obstruction, regardless of their etiology (e.g., septal deviation, nasal polyposis, chronic rhinosinusitis); (iii) studies that presented data about at least one acoustic parameter of voice [15,16,17]. Exclusion criteria comprised the following: (i) studies lacking original empirical data (e.g., reviews, commentaries); (ii) studies with less than five participants; (iii) studies that did not evaluate any acoustic parameter (eg. voice analysis relied exclusively on perceptual evaluation) or without correlation between voice and nasal obstruction, including studies using only a nasometer, which measures relative sound energy but not acoustic parameters; (iv) studies evaluating exclusively hypernasality; (v) studies that did not include any specific assessment of nasal obstruction; (vi) pediatric populations or animal studies. The list of 27 excluded studies is available in the Supplementary Materials (File S1). We have included the PRISMA checklist as Supplementary File (S3).
This review was not registered in a protocol database (e.g., PROSPERO) due to its narrative scope. It excluded grey literature sources, such as conference proceedings, dissertations, preprints, and unpublished studies. Approval from the ethics committee was not required, as this review did not directly involve human or animal subjects.

2.3. Data Extraction

Using a standard template, data were independently extracted by each author from the selected studies. Extracted data included study design, sample size, and demographics (Table 1 and Table 2), as well as outcome measures assessing the correlation between voice and nasal obstruction. (Table 3). Outcome measures of voice and nasal obstruction used in the different studies are listed in the Results section.

2.4. Quality Assessment

We used a modified Downs and Black checklist to assess the methodological quality of the included studies [29]. This checklist encompasses 27 criteria that comprehensively address the areas of reporting, external and internal validity, and power. The original Downs and Black checklist is evaluated on a scale of 32. A two-point rating system is used for all items, with the exception of items 5 and 27. The categorization of “yes” is worth one point, whereas “no” or “unable to determine” is worth zero points. The rating for item 5, which evaluates the description of confounders, is two points; “yes” receives two points, “partial description” receives one, and “no” receives zero. The original score for item 27 was five points, which pertains to the statistical efficacy of the sample size. For the objectives of this review, item 27 was modified to be scored as ‘1’ if power was reported, and ‘0’ if not. Only 19 of the Downs and Black Checklist’s questions are completely relevant to observational research, while eight of them are exclusive to randomized controlled trials (questions 4, 8, 13, 14, 15, 19, 23, and 24), as the other studies have pointed out [30,31]. We therefore used a modified Downs and Black Checklist, excluding the aforementioned items. The final version used for the present study included, therefore, 19 items with a maximum score of 20 points.
Two independent reviewers performed the evaluation. All discrepancies were resolved through discussion and consensus. The overall score of each study was transformed into a percentage by dividing its raw score by 20 and then multiplying the result by 100 to enable a quality grading of the studies. J Kennelly’s ranking system was then used to classify the overall critical appraisal percentage as either “good,” “fair,” or “poor” quality [32]. We utilized Kennelly’s model to classify papers with critical appraisal scores of 71% or higher as good quality, 54–70% as fair quality, and 53% or less as poor quality when applied to the modified Downs and Black scoring system.

3. Results

The initial search yielded 174 abstracts; after removing duplicates, 118 remained. Eighty-one studies were excluded upon the title and abstract check for clearly not meeting the inclusion criteria. The full texts of 37 articles were reviewed in detail. We excluded 27 studies for the following reasons: non-human studies (n = 1), wrong intervention (surgical interventions that lacked both preoperative and postoperative objective evaluations of nasal obstruction, n = 17), wrong study design (n = 1), pediatric population (n = 4), wrong patient population (n = 1), no full text availability (n = 3). Ten studies that specifically included a correlation of nasal obstruction (evaluated with any approach, including PROM, objective measurements, and physician assessment) with acoustic voice analysis were included. Figure 1 shows the PRISMA flowchart for this systematic review.
The methodological quality of the included studies, assessed using the modified Downs and Black checklist [29] indicated that the overall methodological quality was generally fair, with a mean score of 65%. The minimum score was 55% [18,26], while the maximum score was 75% [19].
These results suggest that most studies had adequate reporting and internal validity; however, limitations were identified in aspects such as statistical power, external validity, and the management of confounding variables. The score range of 55% to 75% reflects variability in rigor among studies, which should be considered when interpreting the findings. Kennelly’s classification indicates that none of the studies fell below the threshold for poor quality; however, the limited number of high-quality studies highlights the necessity for more methodologically robust studies. The evaluation of the quality of each study is included in the Supplementary Material (File S2).
Many different approaches have been used to assess nasal obstruction (Section 3.1) and many different voice assessment tools have been evaluated for their correlation with nasal obstruction itself (Section 3.2); we listed them below.

3.1. Nasal Obstruction Assessment

This section reviews the methods used to evaluate nasal function and obstruction, including objective methods such as the Nasometer, AR and ARM, PROMS such as the NOSE Questionnaire, and grading systems like the Nasal Polyp and Lund–Mackay Scores. These instruments collectively offer insights into nasal airflow, structural anomalies, and symptom intensity, and are often used to assess the results of surgical and therapeutic procedures.

3.1.1. Nasometer

The Nasometer is a computer-based device that assesses oral-nasal balance in speech by quantifying the relative intensities of oral and nasal sounds during speech production. Kay Elemetrics first released the Model 6200 in 1986 [13], and it has since become a popular clinical and research instrument for assessing resonance disorders. Two studies in this review [19,20] used the updated Nasometer II (Model 6450; KayPENTAX, Lincoln Park, NJ, USA). In one of them [19], nasalance was measured using various speech samples, including nasal, oral, and mixed stimuli. There were significant differences in nasalance scores before and after surgery at 1, 3, and 6 months (p < 0.05). In the other study [20], nasality was measured using the sustained vowel /a/. After surgery, the average and maximum nasalance values increased significantly (p < 0.05), but the lowest value remained unaltered.

3.1.2. Acoustic Rhinometry

Acoustic rhinometry (AR) is a noninvasive method for measuring the nasal cavity geometry by detecting sound wave reflections, which aids in the diagnosis and monitoring of nasal obstruction [33]. It allows for objective measurements of minimal cross-sectional area (MCA), minimal cross-sectional volume (MCV), and total nasal volume (TNV).
Minimal cross-sectional area (MCA): MCA is the narrowest section of the nasal airway, often located at the nasal valve or anterior inferior turbinate, and is used to evaluate airway patency [34]. Two studies in this review assessed MCA using acoustic rhinometry [22,24]. In the first [22], individuals with a deviated septum showed significant increases in MCA at one and three months postoperatively compared to baseline (p < 0.001). However, there was no difference between the one- and three-month values (p > 0.05). In the second [24], both right and left MCA1 and MCA2 values were significantly different between the nasal obstruction and control groups (p < 0.01).
Minimal cross-sectional volume (MCV): MCV measures the volume of the nasal passage near the MCA, allowing for volumetric assessment of constricted areas. In one study [24], MCV1 and MCV2 assessments for both nasal sides revealed significant differences between the nasal obstruction and control groups (p < 0.01).
Total nasal volume (TNV): TNV is estimated by integrating the area-distance curve from the nasal entrance to a predetermined posterior point in the cavity [35]. TNV values are reported to improve after surgeries for nasal obstruction [22].

3.1.3. Anterior Rhinomanometry (ARM)

Rhinomanometry is a diagnostic procedure that measures nasal airflow resistance [36]. Active anterior rhinomanometry involves attaching a pressure-sensing instrument to one nasal passage at a time and measuring resistance individually on each side. The sensor tube quantifies the total airflow through the nasal passage and therefore the total nasal resistance [37].
Total nasal resistance (TNR): TNR is the resistance to airflow during breathing, and is determined by measuring pressure and flow variations [37]. Three studies in this review reported TNR [21,22,27]. In the first [21], patients with septal deviation had a significant decline in mean partial nasal resistance for both nostrils one month following surgery (p < 0.05), while no significant changes were observed in controls. Similarly, the second study [22] showed significant decreases in TNR at one and three months postoperatively compared to baseline (p < 0.001). However, no significant difference was identified between the postoperative time points (p > 0.05). In the third study [27], patients with septal deviation had significantly higher preoperative TNR than controls (p = 0.001), although postoperative measures showed a significant decrease (p = 0.001).

3.1.4. Nasal Obstruction Symptom Evaluation Questionnaire (NOSE)

The NOSE questionnaire is a patient-reported outcome measure designed to evaluate the degree of nasal obstruction symptoms and how they affect the patient’s quality of life [4]. It was utilized in three studies included in this review [22,23,25]. In the first one [22], mean NOSE scores showed significant improvements at one and three months post-surgery compared to baseline (p < 0.001). Significant differences were also observed between one- and three-month scores (p < 0.0014). The second study [23] found that postoperative NOSE ratings were significantly lower than preoperative values in all patient groups operated on for septal deviation (p = 0.001). The third study [25] found significant improvements in NOSE ratings after surgery for all participants (p < 0.001), including those in Group A (severe septal deviation) and Group B (narrowed nasal airway).

3.1.5. Nasal Polyp Score

The nasal polyp score categorizes polyps according to their dimensions and anatomical position inside the nasal cavity and paranasal sinuses at endoscopy. The system comprises the following: NPS 0 (no polyp), NPS I (polyp located in the middle meatus), NPS II (polyp extending into the middle meatus), and NPS III (whole nasal cavity obstruction). It has been used in a study included in the present review [19]. After surgery, most patients showed improved nasal polyp scores and minimal or no recurrence at 6 months. A statistical comparison of pre- and postoperative polyp grades was not provided.

3.1.6. Lund–Mackay Score

The Lund–Mackay score evaluates sinus opacification using computed tomography (CT) to determine the severity of chronic rhinosinusitis (CRS) as defined by Lund et al. [38]. Ref. [19] used Lund–Mackay scores for patients with bilateral nasal polyposis through preoperative CT scans of the paranasal sinus. The average Lund–Mackay score observed on preoperative CT scans was 8.1. In another study [20], prior to functional endoscopic sinus surgery (FESS), the mean, minimum, and maximum Lund–Mackay scores of patients with rhinosinusitis and rhinosinus polyposis were 13.1 (9.2), 0, and 24, respectively; however, the results after the surgery were not shared.

3.2. Using Voice to Assess Nasal Obstruction

In theory, voice can provide information on nasal obstruction through three general approaches: the acoustic analysis (objective), the perceptual (by physicians or speech therapists) assessment, and the patient-reported outcomes. In Table 2 the experiment details of the retrieved studies are summarized, and in Table 3 the presence of any significant variation is recorded.

3.2.1. Acoustic Analysis

Several acoustic parameters have been assessed in relation to nasal obstruction in the included studies in correlation with nasal obstruction.
Jitter: Jitter indicates short-term variations in the fundamental frequency, signifying inconsistencies in vocal fold vibration during phonation [39]. This metric was assessed in eight studies included in this review. No significant alterations in jitter were noted before and after surgery for nasal obstruction in most studies [19,20,22,23,25,26,27]. Only one study [21] reported a significant postoperative reduction in jitter (%) after surgery (p < 0.05) in patients with septal deviation, with values nearing those of healthy controls.
Shimmer: Shimmer indicates short-term amplitude fluctuations in the vocal signal, indicating instability in vocal intensity [39]. This review included eight studies that assessed shimmer. In some of them, shimmer did not significantly change after surgery for nasal obstruction [19,20,25,26,27]. The research by [23] indicated that in groups I and II (patients with minor and moderate nasal deviation, respectively), the differences in mean pre- and postoperative shimmer values were not statistically significant (p > 0.05). However, in group III (patients with severe nasal deviation), the mean postoperative shimmer value was significantly lower than the preoperative value (p = 0.003). Other studies [21,22] noted a decrease in shimmer after surgery.
Fundamental frequency (F0): F0 represents the frequency of vocal fold vibration, quantified in cycles per second (Hz) [39]. Eight studies included in this review assessed F0 in relation to nasal obstruction. Most studies found no effect of nasal obstruction surgery on F0 [19,20,22,23,26,27]. Conversely, two of them describe the impact of surgery for nasal obstruction on F0 values [21,25].
F1: F1 represents the first formant and is affected by tongue height during articulation [40]. This review included three papers that evaluated F1. None of them reported significant modifications after surgery for nasal obstruction [22,23,27].
F2: F2 represents the second resonance frequency of the vocal tract and is linked to tongue frontness [40]. Research [22,23,27] indicated no significant modifications in F2 values after surgery for nasal obstruction.
F3: F3 represents the third formant, typically associated with lip rounding [40] and has been assessed in three studies included in the present review in relation to surgery for nasal obstruction. None of the studies reported significant changes in F3 between pre- and postoperative periods [22,23,27].
F4: F4 represents the fourth formant, influenced by the size of the pharyngeal cavity in relation to the laryngeal inlet [40,41] and has been evaluated in three studies. None of them [22,23,27] detected significant variations between preoperative and postoperative F4 values.
Noise to harmonic ratio (NHR)- Harmonic to noise ratio (HNR): NHR measures the ratio of aperiodic (noise) to periodic (harmonic) elements in the vocal signal; elevated values generally suggest dysphonia. Conversely, HNR assesses voice quality by measuring harmonic energy in relation to noise, with elevated values indicating a more normophonic voice [42]. NHR was evaluated in six studies, whereas HNR was assessed in one. Most of them failed to detect any statistically significant modifications in NHR and HNR post-surgery (FESS or septoplasty) at multiple time points or among patient groups with varying degrees of nasal obstruction [19,20,22,23,26,27]. However, only one study [21] reported a significant reduction in NHR (p < 0.05) in patients with septal deviation after surgery, with values approaching those of healthy controls.
Voice turbulence index (VTI): VTI indicates the energy of high-frequency noise in the voice, frequently associated with turbulent airflow resulting from inadequate vocal fold adduction [43]. In one study [21], patients with septal deviation exhibited a significant postoperative decrease in VTI (p < 0.05), with values approximating those of healthy controls (p < 0.05).
Soft phonation index (SPI): SPI measures the ratio of low- to high-frequency harmonic energy, acting as a marker for vocal fold adduction during phonation [43]. One study [21] indicates a significant postoperative reduction in SPI (p < 0.05) and normalization relative to healthy adults (p < 0.05).
Degree of voiceless (DUV): DUV quantifies the proportion of nonharmonic segments within the voice sample, indicating the capacity for sustained voicing [44]. In one study [21], DUV exhibited a significant reduction postoperatively (p < 0.05), with values approximating those of normophonic individuals (p < 0.05).
Degree of voice breaks (DVB): DVB indicates the proportion of voiced interruptions to overall phonation duration [44]. In patients with septal deviation, one study [21] observed a substantial postoperative decrease in DVB (p < 0.05), with values markedly approaching those of healthy controls (p < 0.05).
Peak amplitude variation (vAm): vAm indicates long-term amplitude variations in the vocal signal [44]. In patients with septal deviation, one study [21] documented a significant decrease in vAm post-surgery (p < 0.05), with values significantly aligning with the normative range found in healthy adults (p < 0.05).
Long-term average spectrum (LTAS): LTAS denotes a composite spectral signal obtained from a fast Fourier transform of speech, containing both glottal source and vocal tract resonance attributes [45]. In one work [18], LTAS analysis of typically speaking individuals was employed to simulate and compare normal, hyponasal, hypernasal, and mixed resonance conditions. The hyponasal condition showed unique spectral features, including a significantly higher amplitude at 2450 Hz compared to other conditions, alongside a consistent spectral peak at 450 Hz common with the normal condition. Z-score analysis indicated that hyponasal speech exhibited the lowest peak values overall, significantly lower than those of hypernasal and mixed conditions. At 450 Hz, the mixed condition exhibited significantly lower oral stimulus values compared to hyponasal and normal conditions, while at 650 Hz, hyponasal resonance yielded considerably higher z scores than the other two conditions. At 550 Hz, both normal and hyponasal conditions surpassed the hypernasal and mixed conditions in response to oral stimuli. In terms of function centroid values, the hyponasal condition demonstrated low Function 1 centroids, similar to the normal condition, whereas the hypernasal and mixed conditions displayed heightened values. Function 2 centroid analysis correlated low values with hypernasality, whereas the hyponasal condition exhibited a centroid of 0.20, in proximity to the normal condition’s 0.40. The nasal stimulus at 250 Hz demonstrated diminished nasal formant energy in the simulated hyponasal condition relative to the normal pattern.
Voice onset time (VOT): VOT quantifies the duration from the release of a stop consonant to the initiation of voicing [46]. In one work [24], individuals with nasal obstruction demonstrated elevated VOT values for /t/ and /k/, while showing reduced values for /p/ in comparison to controls; however, these differences lacked statistical significance.

3.2.2. Subjective Scales: Perceptual Voice Evaluation and PROMs

This section presents a summary of the findings of studies that evaluated voice using subjective tools, including the GIRBAS scale, the Voice Handicap Index (VHI), and the Visual Analogue Scale (VAS), to assess nasal obstruction and its modification after therapeutic measures (mainly surgical).
GIRBAS The GIRBAS scale is a clinician-rated tool designed for the perceptual assessment of voice quality [47]. In one study [19], the assessment of patients undergoing surgery for bilateral nasal polyposis revealed no significant differences between preoperative and postoperative scores.
Voice handicap index (VHI) The VHI is a widely used tool that relies on patient reports to assess the effects of voice disorders in functional, physical, and emotional domains [48]. In one study [21], Group A exhibited a marked improvement in VHI scores postoperatively, although statistical significance was not indicated; additionally, no statistically significant changes were noted in Group B. Another study [22] indicated statistically significant reductions in VHI-30 scores at one and three months after surgery for nasal obstruction. Other studies [23,25] have documented a statistically significant improvement in VHI only in a selected group of patients after surgery for nasal obstruction.
Visual analogue scale (VAS) In a study [19], patient satisfaction regarding voice quality after surgery for nasal obstruction showed a progressive increase over time (p < 0.05). In another study [24], the right- and left-sided nasal obstruction degree VAS values of the study group were significantly higher than those of the controls (p < 0.01).
Reported voice change after surgery In one study [27], following septoplasty, 61% of patients with septal deviation reported no change in their voice, 36% reported improvement, and 3% experienced deterioration.

3.3. Findings Summary

Overall, the results indicate a potential role for acoustic analysis in assessing nasal obstruction; however, the overall level of evidence is moderate, necessitating cautious interpretation of the findings. Table 3 presents the results of the various studies, including the parameters used to measure nasal obstruction and voice outcomes, as well as the statistically significant changes. Table 4 provides a summary of the primary outcomes by parameter, detailing the number of studies, direction of change, statistical significance, and corresponding citations.

4. Discussion

The management of chronic inflammatory airway diseases, such as CRS and asthma, has improved significantly over the last few decades, thanks to better knowledge and classification, as well as novel therapeutic agents, particularly “biologic” molecularly targeted drugs, mainly antibodies against key molecules of typical inflammatory pathways involved in the pathogenesis of both diseases. However, this new standard of care, with a revolution in diagnostic work up, treatment and follow up, is costly, both for the time required to healthcare workers and patients in order to collect all the information necessary for the definition of the phenotype/endotype of the disease and assessment of the response to treatments and for the cost of the new drugs. It is critical, now that the COVID-19 pandemic has dramatically highlighted the insufficiency of personnel and resources within Western National Health Systems. It means that in a real-world setting, a standard of care management of chronic non-fatal diseases (such as CRS) over time may no longer be sustainable.
For CRS, the standard of care defined by the most recent EPOS guidelines requires periodic and complex evaluations that include subjective assessments from patients and objective assessments from doctors [49]. In subjective assessment, PROMs play a key role and have been increasingly used. They improve shared decision-making, symptom management, patient satisfaction, and quality of life. PROMs are essential for guiding and customizing personalized care strategies [50]. On the other hand, questionnaires present problems of accuracy and response rate, and, most of all, the administration of PROMs is time-consuming [50,51].
Remote health monitoring systems, which have already demonstrated potential for improving the efficiency and quality of healthcare services, particularly in managing chronic diseases and the elderly [52], may offer a suitable solution for administering PROM questionnaires in the context of CRS care.
Conversely, remote health monitoring systems can also access voice through mobile phones, tablets, computers, and wearables. Voice can serve as an invaluable resource for delivering objective information regarding the remote monitoring of nasal obstruction and, consequently, CRSwNP. These are the concept and needs behind the present review, which aims to define the present state of the art for the assessment of nasal obstruction through voice. It is clear that voice analysis has the theoretical potential to develop into a noninvasive, adjustable monitoring tool, especially when combined with machine learning techniques. Combining acoustic voice analysis with patient-reported outcome measures (PROMs) and other objective tests could provide a complete and affordable way to handle nasal obstruction and create personalized treatment plans [15,50,52].
Therefore, the present review aims to outline the current state of our knowledge about the specific voice output features that define the hyponasality of speech (HN-VOFs), or our ability to reliably obtain information about nasal obstruction through acoustic voice analysis. In this context, the findings of the current study are somewhat disappointing. In the existing literature, only 10 studies have attempted to measure nasal obstruction using voice analysis in conjunction with objective evaluations of nasal obstruction. Out of those studies, only one from 2009 [21] shows a clear link between a surgical procedure (septoplasty) and various measurements. However, it does not directly relate to how open the nasal passages are, and many of those measurements (VTI, SPI, DUV, DVB, and vAM) have not been examined in other research. Among traditional acoustic measures, shimmer emerged as the most sensitive parameter, with statistically significant changes observed in three studies [21,22,23]. In contrast, jitter, although often mentioned, was only shown to be important in one study [21], which suggests it is not very effective at detecting voice changes related to nasal issues. Parameters such as F0, NHR, and HNR were also investigated; however, only a few studies [21,22] found significant relationships with nasal obstruction. Therefore, current knowledge about HN-VOFs is limited and conflicting. This failure may be attributed to methodological heterogeneity, small sample sizes (see Table 1), variability in speech materials, diverse acoustic measurement protocols, and a lack of standardized recording equipment (Table 2) [19,20,21,23,26,27,53]. However, we do believe that the main reason is that the current approach to acoustic voice analysis is focused on the features correlated with glottic sound and dysphonia and not on the modifications of the glottic output by the vocal tract, which ultimately produces the voice. If we want to use voice output to obtain information on the vocal tract, including the nasal cavities, we must focus on the features of voice output directly impacted by it. The most obvious approach could be an analysis of the resonance in the whole spectrum of the harmonics of our voice, and machine learning (ML) and artificial intelligence (AI) could be helpful in this matter [54].
In fact, machine learning (ML) and artificial intelligence (AI) techniques can enhance the detection of subtle voice changes linked to nasal obstruction by analyzing intricate, multidimensional acoustic data, potentially improving current outcomes [54].

5. Limitations

Several studies in this review included a small number of participants, which generally reduced their statistical power and the applicability of the results. There is a lack of standardized speech tasks and recording protocols across the studies. Additionally, there are limited controls for confounding factors, such as coexisting laryngeal conditions, which are rarely taken into account. In many studies, there is no correlation with physiological assessments.
All these aspects detract from the possibility of a considerable amount of research having concentrated on time-based perturbation measures, including jitter, shimmer, and noise-to-harmonic ratio, while neglecting other potentially important measures for the assessment of hyponasal speech, such as long-term average spectrum (LTAS), nasal murmur amplitude, cepstral peak prominence (CPP), or spectral tilt. Moreover, the parameters discussed above are mainly designed to evaluate the stability and consistency of vocal fold vibration during phonation; however, they are not as effective for assessing resonance characteristics. Most studies depended exclusively on vowel prolongations, missing continuous speech and potentially diminishing the ecological validity of the findings. Several studies lacked control groups, which are important for separating the effects of nasal obstruction and its treatment on acoustic parameters from other influencing factors. Additionally, numerous studies did not provide essential information regarding the conditions under which voice samples were recorded, such as calibration, specifications of microphones and interfaces, and the recording environment, all of which can substantially affect the quality of voice signals. Ultimately, only a limited number of studies have investigated the correlation between acoustic voice alterations and physiological assessments of nasal obstruction, such as rhinomanometry or acoustic rhinometry, hence constraining the comprehension of their interaction. Additionally, this review has its limitations. Only articles published in English were included, potentially introducing language bias. A meta-analysis could not be conducted due to methodological heterogeneity. Grey literature and conference abstracts were omitted, potentially leading to publication bias. Future systematic reviews may improve through preregistration, the inclusion of non-English studies, and the consideration of unpublished data to augment comprehensiveness and reproducibility.

6. Conclusions

This systematic review provides an in-depth analysis of the application of voice analysis as a tool for assessing nasal obstruction, with particular attention given to acoustic parameters and their correlation with objective and subjective measures of obstruction. The results indicate that, although acoustic voice analysis represents a potential tool for assessing nasal obstruction and hyponasality, available evidence remains limited. Currently, most studies focus on evaluating glottic sound alterations and dysphonia, rather than the effects that the vocal tract, including nasal cavities, may have on voice production. This highlights the need for further research to develop more advanced algorithms and validate standardized protocols for voice analysis in nasal obstruction assessment.
Concerning the relationship between acoustic analysis parameters and nasal obstruction, the present research found that the shimmer parameter was the one that changed the most in cases of nasal obstruction and exhibited significant changes in the majority of studies (3 studies). Only a few studies found significant differences in F0 and noise-related parameters such as NHR and HNR, depending on the nasal obstruction condition. Despite only being studied in one study, the parameters of SPI, VTI, DUV, DVB, vAm, and LTAS showed statistically significant results. This implies that these parameters, having not received sufficient interest, could be helpful for future research. In contrast, although extensively assessed, jitter demonstrated significant changes in only one study and exhibited limited sensitivity in this context. However, the lack of standard methods for voice recording, extracting parameters, and analyzing them continues to be a major methodological bottleneck that makes it hard to compare studies and create reliable, noninvasive assessment tools. For future studies, Machine learning (ML) models can be trained to recognize subtle acoustic patterns in the spectrograms that humans or traditional analysis methods may not easily detect. Spectrogram use in nasal obstruction assessment is a prominent method, as nasal obstruction alters the resonance characteristics of speech. Obstructed nasal passages may affect the nasal formants, particularly in nasal speech sounds and vowels. Thanks to spectrogram analysis, it is possible to capture the spectral consequences of nasal airflow impairment visually. For subjective voice evaluation parameters, VHI was the most widely used assessment. In three studies, it demonstrated a statistically significant improvement, with specific effects in subgroups. On the other hand, measures like GIRBAS and general patient-reported outcome yielded limited or descriptive findings. These results support the inclusion of both perceptual and patient-reported evaluations to comprehensively capture voice outcomes related to nasal obstruction.
In conclusion, although preliminary evidence supports the use of acoustic voice analysis in the assessment of nasal obstruction, further research is needed to strengthen its validity, improve the accuracy of analysis tools, and develop standardized clinical protocols.

Supplementary Materials

The following supporting information can be downloaded at https://www.mdpi.com/article/10.3390/app15158423/s1, Figure S1: PRISMA flowchart; Supplementary File S1: List of excluded studies; Supplementary File S2: Quality assessment; Supplementary File S3: PRISMA checklist.

Author Contributions

Conceptualization, F.B., G.Y.-P., and P.L.; methodology, G.Y.-P., C.C., and F.B.; validation, G.Y.-P., E.D., C.C., and D.R.; formal analysis, G.Y.-P. and F.B.; investigation, G.Y.-P. and C.C.; resources, G.Y.-P.; software, G.Y.-P.; data curation, G.Y.-P. and C.C.; writing—original draft preparation, F.B., G.Y.-P., and P.L.; writing—review and editing, F.B., G.Y.-P., C.C., P.L., L.B., E.D., and D.R.; supervision, F.B.; project administration, F.B.; funding acquisition, F.B. All authors have read and agreed to the published version of the manuscript.

Funding

This work has been supported by a grant from the Regione Autonoma della Sardegna (RAS)–Centro Regionale di Programmazione-Cod.Fisc. 80002870923 through the ‘Legge Regionale 12 dicembre 2022, N. 22’.

Institutional Review Board Statement

Approval from the ethics committee was not required, as this review did not directly involve human or animal subjects.

Informed Consent Statement

Not applicable.

Data Availability Statement

The data presented in this study are available on request from the corresponding author.

Conflicts of Interest

The authors declare no conflicts of interest.

References

  1. Jessen, M.; Malm, L. Definition, prevalence and development of nasal obstruction. Allergy 1997, 52, 3–6. [Google Scholar] [CrossRef]
  2. Hsu, D.W.; Suh, J.D. Anatomy and physiology of nasal obstruction. Otolaryngol. Clin. N. Am. 2018, 51, 853–865. [Google Scholar] [CrossRef] [PubMed]
  3. Keeler, J.; Most, S.P. Measuring nasal obstruction. Facial Plast. Surg. Clin. 2016, 24, 315–322. [Google Scholar] [CrossRef] [PubMed]
  4. Stewart, M.G.; Witsell, D.L.; Smith, T.L.; Weaver, E.M.; Yueh, B.; Hannley, M.T. Development and validation of the Nasal Obstruction Symptom Evaluation (NOSE) scale. Otolaryngol. Neck Surg. 2004, 130, 157–163. [Google Scholar] [CrossRef] [PubMed]
  5. Ciprandi, G.; Mora, F.; Cassano, M.; Gallina, A.M.; Mora, R. Visual analog scale (VAS) and nasal obstruction in persistent allergic rhinitis. Otolaryngol. Neck Surg. 2009, 141, 527–529. [Google Scholar] [CrossRef]
  6. Psaltis, A.J.; Li, G.; Vaezeafshar, R.; Cho, K.S.; Hwang, P.H. Modification of the Lund-Kennedy endoscopic scoring system improves its reliability and correlation with patient-reported outcome measures. Laryngoscope 2014, 124, 2216–2223. [Google Scholar] [CrossRef]
  7. Hilberg, O.; Jackson, A.; Swift, D.; Pedersen, O. Acoustic rhinometry: Evaluation of nasal cavity geometry by acoustic reflection. J. Appl. Physiol. 1989, 66, 295–303. [Google Scholar] [CrossRef]
  8. Clement, P. Committee report on standardization of rhinomanometry. Rhinology 1984, 22, 151–155. [Google Scholar]
  9. Blomgren, K.; Simola, M.; Hytonen, M.; Pitkaranta, A. Peak nasal inspiratory and expiratory flow measurements-practical tools in primary care? Rhinology 2003, 41, 206–210. [Google Scholar]
  10. Elahi, M.M.; Frenkiel, S.; Fageeh, N. Paraseptal structural changes and chronic sinus disease in relation to the deviated septum. J. Otolaryngol. 1997, 26, 236–240. [Google Scholar]
  11. Zehnhoff-Dinnesen, A.; Wiskirska-Woznica, B.; Neumann, K.; Nawka, T. Phoniatrics I: Fundamentals, Voice Disorders, Disorders of Language and Hearing Development; Springer: Berlin/Heidelberg, Germany, 2020. [Google Scholar]
  12. Kummer, A.W. Cleft Palate & Craniofacial Anomalies: Effects on Speech and Resonance; Cengage Learning: Boston, MA, USA, 2013. [Google Scholar]
  13. Dalston, R.M.; Warren, D.W.; Dalston, E.T. Use of nasometry as a diagnostic tool for identifying patients with velopharyngeal impairment. Cleft Palate-Craniofacial J. 1991, 28, 184–189. [Google Scholar] [CrossRef]
  14. Page, M.J.; McKenzie, J.E.; Bossuyt, P.M.; Boutron, I.; Hoffmann, T.C.; Mulrow, C.D.; Shamseer, L.; Tetzlaff, J.M.; Akl, E.A.; Brennan, S.E. The PRISMA 2020 statement: An updated guideline for reporting systematic reviews. BMJ 2021, 372, n71. [Google Scholar] [CrossRef] [PubMed]
  15. Maryn, Y.; Roy, N.; De Bodt, M.; Van Cauwenberge, P.; Corthals, P. Acoustic measurement of overall voice quality: A meta-analysis. J. Acoust. Soc. Am. 2009, 126, 2619–2634. [Google Scholar] [CrossRef] [PubMed]
  16. Yumoto, E.; Gould, W.J.; Baer, T. Harmonics-to-noise ratio as an index of the degree of hoarseness. J. Acoust. Soc. Am. 1982, 71, 1544–1550. [Google Scholar] [CrossRef] [PubMed]
  17. Lee, G.S.; Yang, C.C.; Wang, C.P.; Kuo, T.B. Effect of nasal decongestion on voice spectrum of a nasal consonant-vowel. J. Voice 2005, 19, 71–77. [Google Scholar] [CrossRef]
  18. De Boer, G.; Bressmann, T. Application of linear discriminant analysis to the nasometric assessment of resonance disorders: A pilot study. Cleft Palate-Craniofacial J. 2015, 52, 173–182. [Google Scholar] [CrossRef]
  19. Naruekon, J.; Kasemsiri, P.; Thanaviratananich, S.; Prathanee, B.; Thongrong, C.; Reechaipichitkul, W. Voice quality changes after functional endoscopic sinus surgery in patients with nasal polyps. Sci. Rep. 2022, 12, 21225. [Google Scholar] [CrossRef]
  20. Majidi, M.R.; Asghari, M.; Abbaszadeh, E.; Demneh, A.S.; Hejrati, S. Effect of functional endoscopic sinus surgery on the voice quality among patients with rhinosinus polyposis. Iran. J. Otorhinolaryngol. 2019, 31, 197–1101. [Google Scholar]
  21. Mora, R.; Jankowska, B.; Dellepiane, M.; Mora, F.; Crippa, B.; Salami, A. Acoustic features of voice after septoplasty. Med. Sci. Monit. Int. Med J. Exp. Clin. Res. 2009, 15, CR269-73. [Google Scholar]
  22. Apaydın, E.; İkincioğulları, A.; Çolak, M.; Atan, D.; Ensari, S.; Dere, H.H. The Voice Performance After Septoplasty With Surgical Efficacy Demonstrated Through Acoustic Rhinometry and Rhinomanometry. J. Voice 2020, 34, 649.e15–649.e20. [Google Scholar] [CrossRef]
  23. Karakurt, S.E.; Özcan, K.M.; İkincioğullari, A.; Çetin, M.A.; Özcan, M.; Dere, H.H. Is nasal septum deviation severity a significant factor on voice in patients undergoing septoplasty? J. Coll. Physicians Surg. Pak. 2020, 30, 287–291. [Google Scholar] [CrossRef] [PubMed]
  24. Altundağ, A.; Akpınar, M.E.; Koçak, I.; Tekin, M. Does nasal obstruction affect the articulation of plosive consonants? Turk. J. Ear Nose Throat 2011, 21, 129–136. [Google Scholar] [CrossRef] [PubMed]
  25. Atan, D.; Özcan, K.M.; Gürbüz, A.B.T.; Dere, H. The effect of septoplasty on voice performance in patients with severe and mild nasal septal deviation. J. Craniofacial Surg. 2016, 27, 1162–1164. [Google Scholar] [CrossRef] [PubMed]
  26. Acar, A.; Cayonu, M.; Ozman, M.; Eryilmaz, A. Changes in Acoustic Parameters of Voice After Endoscopic Sinus Surgery in Patients with Nasal Polyposis. Indian J. Otolaryngol. Head Neck Surg. 2014, 66, 381–385. [Google Scholar] [CrossRef]
  27. Gulec, S.; Kulahli, I.; Sahin, M.I.; Kokoğlu, K.; Gunes, M.S.; Avci, D.; Arli, T. Effect of septoplasty on voice quality: A prospective-controlled trial. Clin. Exp. Otorhinolaryngol. 2016, 9, 238–243. [Google Scholar] [CrossRef]
  28. Boersma, P. Praat, a system for doing phonetics by computer. Glot. Int. 2001, 5, 341–345. [Google Scholar]
  29. Downs, S.H.; Black, N. The feasibility of creating a checklist for the assessment of the methodological quality both of randomised and non-randomised studies of health care interventions. J. Epidemiol. Community Health 1998, 52, 377–384. [Google Scholar] [CrossRef]
  30. Moura, L.T.R.d.; Bedor, C.N.G.; Lopez, R.V.M.; Santana, V.S.; Rocha, T.M.B.d.S.d.; Wünsch Filho, V.; Curado, M.P. Occupational exposure to organophosphate pesticides and hematologic neoplasms: A systematic review. Rev. Bras. Epidemiol. 2020, 23, e200022. [Google Scholar] [CrossRef]
  31. Vieira, M.d.C.S.; Boing, L.; Machado, Z.; de Azevedo Guimarães, A.C. Sintomas do envelhecimento masculino relacionados à atividade física e qualidade de vida: Uma revisão sistemática. Rev. Bras. Ciênc. Mov. 2017, 25, 183–198. [Google Scholar] [CrossRef]
  32. Kennelly, J. Methodological Approach to Assessing the Evidence; Springer: Berlin/Heidelberg, Germany, 2011. [Google Scholar]
  33. Cingi, C.; Muluk, N.B. All Around the Nose: Basic Science, Diseases and Surgical Management; Springer Nature: Cham, Switzerland, 2019. [Google Scholar]
  34. Clement, P.A.; Gordts, F. Consensus report on acoustic rhinometry and rhinomanometry. Rhinology 2005, 43, 169–179. [Google Scholar]
  35. Grymer, L.F.; Hilberg, O.; Pedersen, O.F.; Rasmussen, T.R. Acoustic rhinometry: Values from adults with subjective normal nasal patency. Rhinology 1991, 29, 35–47. [Google Scholar]
  36. Merkle, J.; Kohlhas, L.; Zadoyan, G.; Mösges, R.; Hellmich, M. Rhinomanometric reference intervals for normal total nasal airflow resistance. Rhinology 2014, 52, 292–299. [Google Scholar] [CrossRef]
  37. Thiagarajan, B. Nasal resistance its importance and measurement. ENT Scholar 2012, 1, 1–4. [Google Scholar]
  38. Lund, V.J.; Mackay, I.S. Staging in rhinosinusitis. Rhinology 1993, 31, 183. [Google Scholar]
  39. Boone, D.R.; McFarlane, S.C.; Von Berg, S.L.; Zraick, R.I. The Voice and Voice Therapy; Pearson Education: London, UK, 2013. [Google Scholar]
  40. Aalto, D.; Malinen, J.; Vainio, M. Formants. Oxford Research Encyclopedia of Linguistics; Oxford University Press: Oxford, UK, 2018. [Google Scholar]
  41. Bele, I.V. The speaker’s formant. J. Voice 2006, 20, 555–578. [Google Scholar] [CrossRef] [PubMed]
  42. Fernandes, J.F.; Freitas, D.; Junior, A.C.; Teixeira, J.P. Determination of Harmonic Parameters in Pathological Voices—Efficient Algorithm. Appl. Sci. 2023, 13, 2333. [Google Scholar] [CrossRef]
  43. Dhir, V.; Relekar, S.A. Normative voice data on selected parameters for young adults using VISI PITCH IV. Int. J. Sci. Eng. Res. 2020, 11, 292–304. [Google Scholar]
  44. KayPENTAX. SOFTWARE INSTRUCTION MANUAL Multi-Dimensional Voice Program (MDVP) Model 5105; KayPENTAX: Lincoln Park, NJ, USA, 2008. [Google Scholar]
  45. Tjaden, K.; Sussman, J.E.; Liu, G.; Wilding, G. Long-term average spectral (LTAS) measures of dysarthria and their relationship to perceived severity. J. Med. Speech-Lang. Pathol. 2010, 18, 125–132. [Google Scholar]
  46. Groll, M.D.; Hablani, S.; Stepp, C.E. The relationship between voice onset time and increase in vocal effort and fundamental frequency. J. Speech Lang. Hear. Res. 2021, 64, 1197–1209. [Google Scholar] [CrossRef]
  47. Dejonckere, P.H.; Remacle, M.; Fresnel-Elbaz, E.; Woisard, V.; Crevier-Buchman, L.; Millet, B. Differentiated perceptual evaluation of pathological voice quality: Reliability and correlations with acoustic measurements. Rev. Laryngol.-Otol. 1996, 117, 219–224. [Google Scholar]
  48. Jacobson, B.H.; Johnson, A.; Grywalski, C.; Silbergleit, A.; Jacobson, G.; Benninger, M.S.; Newman, C.W. The Voice Handicap Index (VHI): Development and Validation. Am. J. Speech-Lang. Pathol. 1997, 6, 66–70. [Google Scholar] [CrossRef]
  49. Fokkens, W.J.; Viskens, A.S.; Backer, V.; Conti, D.; De Corso, E.; Gevaert, P.; Scadding, G.K.; Wagemann, M.; Bernal-Sprekelsen, M.; Chaker, A. EPOS/EUFOREA update on indication and evaluation of Biologics in Chronic Rhinosinusitis with Nasal Polyps 2023. Rhinology 2023, 61, 194–202. [Google Scholar] [CrossRef]
  50. Dykewicz, M.S.; Wallace, D.V.; Bandi, S.; Mahdavinia, M.; Sedaghat, A.R. Patient-Reported Outcome Measures in Rhinitis and Chronic Rhinosinusitis. J. Allergy Clin. Immunol. Pract. 2024, 12, 2574–2582. [Google Scholar] [CrossRef] [PubMed]
  51. Worth, A.; Hammersley, V.S.; Nurmatov, U.; Sheikh, A. Systematic literature review and evaluation of patient reported outcome measures (PROMs) for asthma and related allergic diseases. Prim. Care Respir. J. 2012, 21, 455–458. [Google Scholar] [CrossRef] [PubMed]
  52. Dalloul, A.H.; Miramirkhani, F.; Kouhalvandi, L. A review of recent innovations in remote health monitoring. Micromachines 2023, 14, 2157. [Google Scholar] [CrossRef] [PubMed]
  53. Patel, R.R.; Awan, S.N.; Barkmeier-Kraemer, J.; Courey, M.; Deliyski, D.; Eadie, T.; Paul, D.; Švec, J.G.; Hillman, R. Recommended protocols for instrumental assessment of voice: American Speech-Language-Hearing Association expert panel to develop a protocol for instrumental assessment of vocal function. Am. J. Speech-Lang. Pathol. 2018, 27, 887–905. [Google Scholar] [CrossRef]
  54. Pruthi, T.; Espy-Wilson, C.Y. Acoustic parameters for automatic detection of nasal manner. Speech Commun. 2004, 43, 225–239. [Google Scholar] [CrossRef]
Figure 1. The PRISMA flowchart used in the present review.
Applsci 15 08423 g001
Table 1. Publication details, research, and participant characteristics of the included studies.
Ref.Study DesignNumber of SubjectsStudy/ControlGender (m:f)
[18]Prospective experimental study1616/00:16
[19]Prospective observational study4646/029:17
[20]Prospective observational study3030/020:10
[21]Non randomized prospective study6020/4060:0
[22]Prospective observational study4242 (62 initially)/025:17
[23]Prospective observational study6969/054:15
[24]Case-control observational study4120/2121:20
[25]Prospective observational study4343/033:10
[26]Prospective observational study4343/031:12
[27]Prospective controlled trial6333 (50 initially)/3019:14 (study), 18:12 (control)
Table 2. Experiment details of the included studies.
Ref.InterventionControl GroupAcoustic Analysis InstrumentSpeech MaterialAcoustic Parameters
[18]Patient simulationnoPraat [28]Oral and nasal sentencesspectrogram and LTAS
[19]FESSnoNasometer II: Model 6450, Computerized speech lab (CSL): Model 4500Oral, nasal and oro-nasal sentences, vowel soundsjitter, NHR, F0, shimmer
[20]FESSnoNasometer II: Model 6450, Computerized Speech Lab (CSL4500)[â], [u], [i], [a], [e], [o] vowelsjitter, shimmer, HNR, F0
[21]septoplastyyesMDVP (Multi Dimensional Voice Program, Kay Elemetrics)Oral, nasal and oro-nasal sentences, a, e, i vowels,Fo, jitter, shimmer, NHR, VTI, SPI, DUV, DVB, vAm
[22]septoplastynoPraat [28][a] vowel, /ma/ syllableF0, jitter, shimmer, HNR, F1, F2, F3, F4
[23]septoplastynoPraat [28][a] vowel, /mana/ wordF0, jitter, shimmer, NHR, F1, F2, F3, F4
[24]no interventionyesMulti Speech Program[pa], [ta], [ka] syllablesVoice Onset Time
[25]septoplastynoXION Medical DIVAS 2.5 Digital Voice Analysis Software[a] vowelF0, jitter, shimmer
[26]FESSnoMulti-dimensional voice program[a] vowelF0, jitter, shimmer, NHR
[27]septoplastyyesMulti-dimensional Voice Program[i], [e], [a], [o], [u] vowels recorded; [n] consonant and [i] in [mini] word and [a] vowel, analysedF0, jitter, shimmer, NHR, F1, F2, F3, F4
Table 3. Nasal obstruction and voice assessment parameters with reported significance in different studies.
Reference[18][19][20][21][22][23][24][25][26][27]
Nasal Obstruction Measurements
Nasometer
MCA
MCV
TNV
TNR
NOSE
Nasal Polyp Score §
Lund–Mackay
Acoustic Voice Analysis
Jitter ×××× ×××
Shimmer ××✓‡ ×××
F0 ×××× ✓‡××
F1 ×× ×
F2 ×× ×
F3 ×× ×
F4 ×× ×
NHR ×× × ××
HNR
VTI
SPI
DUV
DVB
vAm
LTAS
VOT ×
Subjective Voice Assessment
GIRBAS ×
VAS
VHI §✓‡ ✓‡
PROM for voice change *
✓: Significant change, ×: No significant change, §: Descriptive findings without statistical test, ✓‡: Significant change only in a subgroup, †: No post-op score. *: 61% no change, 36% favorable change, 3% worsening.
Table 4. Summary of parameter outcomes: direction and significance through studies.
ParameterNo. of StudiesDirection of ChangeStatistical Significance (p < 0.05)Ref.
Nasometry Score (Nasometer)2Significant increase ↑ in 2/2 studies (Post-op)Yes[19,20]
MCA (AR)2Significant increase ↑ in 1/2 studies [22] (Post-op), Significant decrease ↓ in 1/2 studies [24] (Obstruction vs. Control)Yes[22,24]
MCV (AR)1Significant decrease ↓ in 1/1 study (Obstruction vs. control)Yes[24]
TNV (AR)1Significant increase ↑ in 1/1 study (Post-op)Yes[22]
TNR (ARM)3Significant decrease ↓ in 3/3 studies (Post-op)Yes[21,22,27]
NOSE Score3Significant decrease ↓ in 3/3 studies (Post-op)Yes[22,23,25]
Nasal Polyp Score1Descriptive onlyNot reported[19]
Lund–Mackay Score2Descriptive onlyNot reported[19,20]
Jitter8Significant decrease ↓ in 1/8 studies [21] (Post-op)1 study[19,20,21,22,23,25,26,27]
Shimmer8Significant decrease ↓ in 3/8 studies [21,22] (only in a subgroup [23]) (Post-op)3 studies[19,20,21,22,23,25,26,27]
F08Significant increase ↑ in 1/8 studies (only in a subgroup [25])-decrease ↓ in 1/8 studies [21] (Post-op)2 studies[19,20,21,22,23,25,26,27]
F13No significant change in 3/3 studiesNo[22,23,27]
F23No significant change in 3/3 studiesNo[22,23,27]
F33No significant change in 3/3 studiesNo[22,23,27]
F43No significant change in 3/3 studiesNo[22,23,27]
NHR6Significant decrease ↓ in 1/6 studies [21] (Post-op)1 study[19,20,21,23,26,27]
HNR1No significant change in 1/1 studyNo[22]
VTI1Significant decrease ↓ in 1/1 study (Post-op)Yes[21]
SPI1Significant decrease ↓ in 1/1 study (Post-op)Yes[21]
DUV1Significant decrease ↓ in 1/1 study (Post-op)Yes[21]
DVB1Significant decrease ↓ in 1/1 study (Post-op)Yes[21]
vAm1Significant decrease ↓ in 1/1 study (Post-op)Yes[21]
LTAS1Not applicable (simulation)Yes[18]
VOT1No significant change in 1/1 studyNo[24]
GIRBAS1No significant change in 1/1 studyNo[19]
VHI4Significant decrease ↓ in 1/4 studies [22]; decrease↓ only in a subgroup in 2/4 studies [23,25]; descriptive improvement in 1/4 studies [21] (Post-op)3 studies[21,22,23,25]
VAS2Significant increase ↑ (satisfaction) in 1/2 studies [19] (Post-op); Significant increase ↑ (symptom) in 1/2 studies (Obstruction vs. Control) [24]Yes[19,24]
PROM (Voice Change)136% improvedDescriptive[27]
Note: ↑ = increase; ↓ = decrease.
Disclaimer/Publisher’s Note: The statements, opinions and data contained in all publications are solely those of the individual author(s) and contributor(s) and not of MDPI and/or the editor(s). MDPI and/or the editor(s) disclaim responsibility for any injury to people or property resulting from any ideas, methods, instructions or products referred to in the content.

