Article

Sustainable Packaging Design: Packaging Optimization and Material Reduction for Environmental Protection and Economic Benefits to Industry and Society

by
Elias D. Georgakoudis
1,*,
Georgia G. Pechlivanidou
2 and
Nicoleta S. Tipi
3
1
Department of Supply Chain Management, International Hellenic University, 60100 Katerini, Greece
2
School of Mathematics, Aristotle University of Thessaloniki, 54124 Thessaloniki, Greece
3
Department of People and Organisations, Faculty of Business and Law, The Open University, Milton Keynes MK7 6AA, UK
*
Author to whom correspondence should be addressed.
Appl. Sci. 2025, 15(15), 8289; https://doi.org/10.3390/app15158289
Submission received: 3 June 2025 / Revised: 2 July 2025 / Accepted: 24 July 2025 / Published: 25 July 2025

Abstract

This paper analyzes the concept of packaging redesign, with the primary objective of improving material utilization. It further examines the potential environmental and economic benefits that may result from effective packaging redesign for both industry and society. The research is based on a specific case study comparing two alternative bottle designs with identical capacity, focusing on shape, material usage, and space efficiency. A detailed numerical comparison highlights the advantages and disadvantages of each option. The analysis demonstrates that an optimized bottle design can lead to substantial material savings and waste reduction. For example, an 8% reduction in bottle weight could eliminate approximately 1.6 million tons of material annually, potentially translating into economic savings exceeding 3 billion U.S. dollars per year. The study underscores how strategic packaging redesign can yield significant benefits in terms of material efficiency and cost savings for companies. It also contributes to the field of Life Cycle Analysis by linking packaging design innovation to key environmental and economic outcomes, while ensuring that packaging continues to protect products and meet the needs of the end consumer.

1. Introduction

The COVID-19 pandemic has caused significant changes to the market as numerous logistics operations were disrupted by the unprecedented and peculiar conditions. These included the closure of national borders, restrictions on the movement of people and goods, social distancing measures and restriction of visits to stores, disruption of supply chains, changes in consumer behavior, and others, which prevailed throughout the world over an extended period of time [1]. As described by Gulseven et al. [2], the COVID-19 crisis has drastically contributed to the current state of global growth. The above issue is clearly underlined by Chmielarz et al. [3], who argue that during the pandemic, e-commerce emerged as an optimum alternative for consumers to shop differently and have access to products from many different locations and many countries.
In addition, environmental problems, such as global warming, air and water pollution, and climate change in general, represent some of the most significant issues in recent years. Various natural phenomena and the modern lifestyle, characterized by increased consumption of natural resources and fossil fuel combustion, contribute to the alteration in global mean temperature.
Climate change is already affecting populations worldwide [4,5,6,7]. The various environmental changes are becoming more and more severe and pose serious challenges to business and governments [6,8,9]. The impacts include both direct (e.g., heat stress, rising sea levels, extreme temperatures, reduced agricultural productivity) and indirect (e.g., economic losses, waterborne diseases, increased energy consumption) consequences [10,11]. Moreover, Tubiello et al. [12] indicate agriculture as a significant factor to climate change and the most vulnerable sector in economic terms due to the severe environmental problems.
Busby et al. [13] support that the consequences resulting from climate change are not the same for all countries. It is further underlined that there is significant variation in vulnerability to climate change even in different regions of the same countries. According to Brundtland [14], the environmental problems could have significant social and economic consequences. Baarsch et al. [15] report that the negative macroeconomic impacts could be less severe—although significant enough—if the rise in global mean temperature remains close to 1.5 °C. For this reason, the affected economies will need to adapt to new circumstances in order to avoid potentially large economic losses. It should be stressed that governments in many countries are now taking measures in an effort to contribute to environmental protection [16].
Many researchers argue that climate change is one of the most significant dangers that should be faced drastically in order to avoid severe consequences in the future [17,18,19]. In addition, many communities worldwide are now taking measures in an effort to face environmental problems such as global warming and carbon emissions [20,21,22]. In an effort to face these problems, 183 nations and the European Union have signed the Paris climate agreement (December 2015), aiming to hold global warming below 2 °C [23,24].
Kwabena et al. [25] support that economic growth can positively affect environmental quality and sustainability. However, globalization, except for its serious economic and income advantages, further undermines the efforts to improve environmental quality and sustainability. On the other hand, some researchers underline that the level of acceptance for the adoption of sustainability practices in business or society is clearly affected by cultural characteristics [26,27,28,29].
Environmental efforts on sustainability and environmental protection have offered plenty of chances for differentiation among companies. Nowadays, many companies implement environmentally responsible practices. Such acts offer significant competitive advantages to the companies involved [30]. Several efforts include planning to save energy by increasing the energy efficiency of buildings and reducing global greenhouse gas emissions [31,32]. Other efforts include investigations on marketing strategies in order to promote sustainability and educate consumers on environmentally friendly consumption [33].
One of the most serious problems for the environment is the amount of materials and products that, when discarded, end up in landfills after a short or longer time period [34]. Economic growth and environmental aggravation are strongly related. Thus, recycling seems an effective solution for the environment, the economy, and the community. In addition, packaging redesign [35] could offer further advantages such as the reduction in material usage, which in turn would reduce the amount of waste sent to landfills and therefore would help to alleviate the environmental impact on air, ground, and water [36,37]. Here, we should underline that some countries are having difficulties with imported raw materials while in many cases, the flow of materials, parts, and products is problematic (due to war, tax regulations, increased transportation costs, and others) [38,39]. Thus, recycling, in addition to environmental protection, is also an effective way to reduce imports and energy use [40,41].
This research investigates how packaging redesign and shape optimization can reduce material use and waste. The analysis includes the comparison between different product scenarios and the contribution to waste reduction for each case. The research is based on two different bottle designs and connects packaging redesign, material reduction due to shape optimization, waste reduction, and economic savings in the base of environmental protection in the supply chain.

2. Literature Review

2.1. CO2 Emissions

The problem of rising CO2 emissions and the resulting environmental burden is increasingly significant, compelling governments worldwide to take drastic action and industries to help reduce their environmental footprint. There is a strong belief that climate change and economic growth are tightly connected. In addition, the consumption of fossil fuels such as coal, diesel, or gasoline, which are significant factors for economic growth, is responsible for the majority of CO2 emissions.
Muhammad [42] argues that carbon dioxide (CO2) emissions increase with rising energy consumption, which in turn is the result of economic growth. Al-Mulali & Sab [43] investigated the relationship between electricity consumption, economic growth, and CO2 emissions over the period 1990 to 2008. They found that CO2 emissions and electricity consumption have a long-running relationship with economic growth. In the same manner, Saidi & Hammami [44] examined the relationship between energy consumption and carbon dioxide emissions on economic growth for 58 countries over the period 1990 to 2012. They show that energy consumption clearly affects economic growth but with the consequence of high pollution as a result of high CO2 emissions.
On the other hand, many researchers argue that there is no significant evidence that links carbon dioxide emissions and economic development [45,46]. Guan et al. [47] state that China’s rapid industrialization and urbanization in recent years turned the country into the largest carbon emitter. For this reason, China is now taking measures in an effort to reduce its CO2 emissions [48]. Xu et al. [49] investigated the evolution of CO2 emissions in China and report that emissions will likely peak between 2029 and 2035.
The need for the governments to take measures and adopt environmentally friendly technologies for the reduction in CO2 emissions is intense. Saidi & Hammami [44] concluded that among others, the governments are trying to find effective ways to fight poverty, increase economic opportunities, and pose measures to protect the environment.
Except for efforts to reduce emissions and produce cleaner (renewable) energy, the heating and transportation sectors are making efforts to reduce carbon dioxide emissions by incorporating technologies such as heat pumps, waste heat recovery, and electric vehicles [50,51]. The transport sector, which relies mainly on fossil fuels—although serious efforts are now being made to alleviate its dependence on them—is facing serious problems in reducing its environmental footprint [52].
The reduction in global emissions in order to minimize the negative impacts for the environment should be a main target for both developed and developing countries [53,54,55]. Many researchers argue that the implementation of new technologies, the utilization of electromobility, and the drastic improvements of the efficiency in the use of the current vehicles are important steps in the right direction [56,57]. However, it is argued that there are serious differences and dissimilarities between different countries and thus it is important to adjust the policy measures to the special needs of each one of them [58,59,60].
In any case, the severe consequences of climate change need to be faced worldwide. According to scientists, the problems are going to become more intense and affect directly or indirectly the global economy, businesses, and society.

2.2. The Role of Plastics

The use of plastic packaging has increased over the last decades. New technologies and improved manufacturing processes have increased the importance of plastic as a packaging material, since it is lightweight and offers enhanced protection to the product it contains at an affordable cost [61]. In addition, plastic packaging appears to be durable and easily customizable, which underscores the reasons for its popularity across a wide range of applications [62]. Moreover, plastic packaging is very popular in the food industry because of its ability to preserve and extend the shelf life of food and beverage products [63]. The broad use of plastics is evident from the fact that around 1 million plastic bottles are bought worldwide every minute [64], while the bottled water market is growing rapidly in many countries [65].
For all these reasons, plastic is widely used in the food industry, automotive industry, electrical and electronics industry, agriculture, furniture, and other sectors [66]. However, its widespread use has drawbacks and has raised concerns, particularly regarding environmental protection due to the accumulation of plastic debris [67]. In Europe, 30% of plastic waste generated is collected for recycling, 39% is incinerated, and 31% ends up in landfills [68].
At the same time, not all plastics are easily recycled, as there are numerous types of plastic polymers, and most commonly used plastics are not biodegradable [66]. According to Meng et al. [69], plastic waste entering the ocean on an annual basis range from 4.8 to 12.7 million tons. Meanwhile, the Mediterranean Sea appears to be a significant accumulation zone of floating plastic debris originating from both domestic (European) and external sources [70].
In addition, the recycling process is costly and technologically challenging, particularly due to the difficulty of fully separating mixed polymers [71,72]. According to the EPA—United States Environmental Protection Agency—polyethylene terephthalate (PET) achieves a relatively high recycling rate (e.g., the recycling rate for 2018 was 29.1%). On the other hand, De Marchi et al. [73] report that Italian consumers are willing to substitute PET materials with the more expensive but more sustainable bio-based water bottles.

2.3. Packaging Redesign and Sustainability

Undoubtedly, the use of packaging today is essential for most products. The length and complexity of modern distribution channels dictate the use of new and innovative packaging, adapted to the specific needs of both the products and the markets in which they are distributed.
While packaging protects and facilitates the movement of products along the supply chain, it also adds to the total shipping weight and increases the overall size of the product. Among other factors, packaging shape can influence consumers’ perceptions regarding the quality and usability of the product, and it can, furthermore, attract customers and affect their buying decisions [74].
The concept of sustainability in packaging has become one of the most significant issues in recent years. According to the Cambridge Dictionary [75], sustainability is defined as “the quality of causing little or no damage to the environment and therefore able to continue for a long time.” A comprehensive definition of sustainable packaging is provided by the Sustainable Packaging Coalition [76], which defines sustainable packaging as packaging that
  • Is beneficial, safe, and healthy for individuals and communities throughout its life cycle;
  • Meets market criteria for both performance and cost;
  • Is sourced, manufactured, transported, and recycled using renewable energy;
  • Optimizes the use of renewable or recycled source materials;
  • Is manufactured using clean production technologies and best practices;
  • Is made from materials that are healthy throughout the life cycle;
  • Is physically designed to optimize materials and energy;
  • Is effectively recovered and utilized in biological and/or industrial closed-loop cycles.
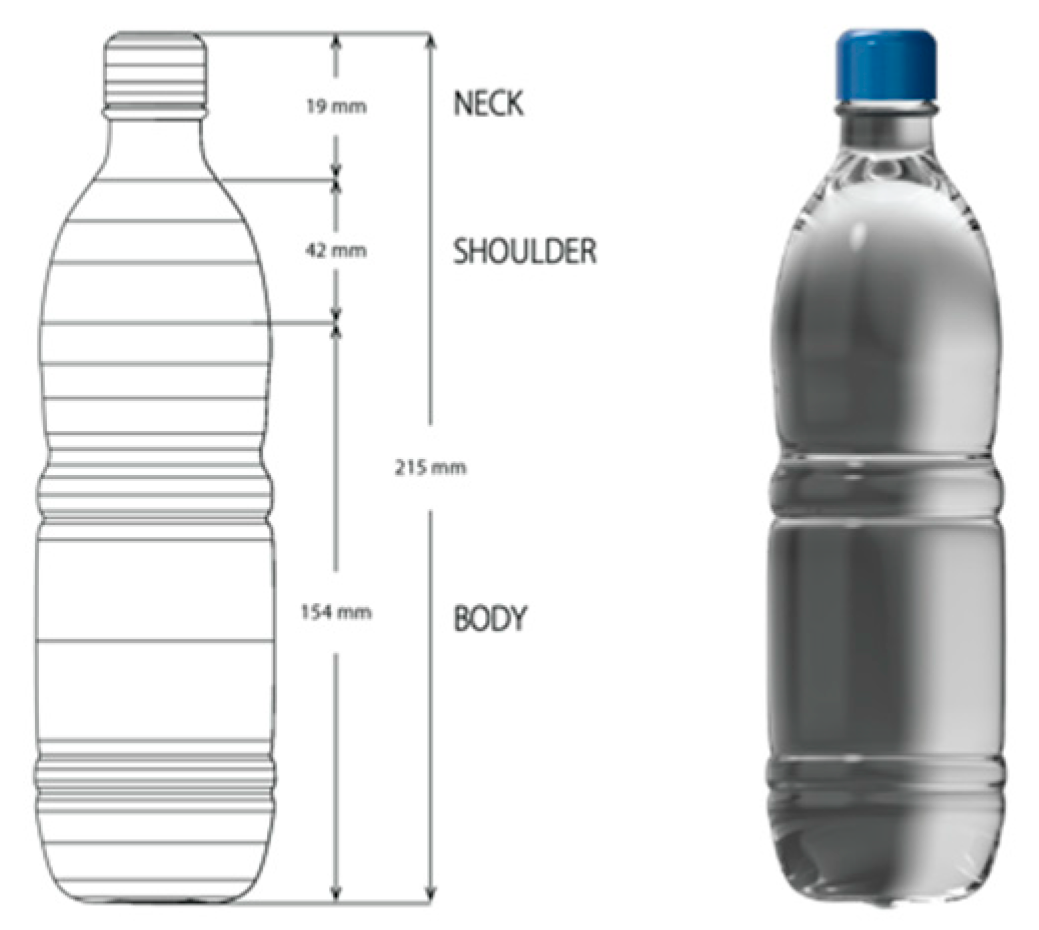
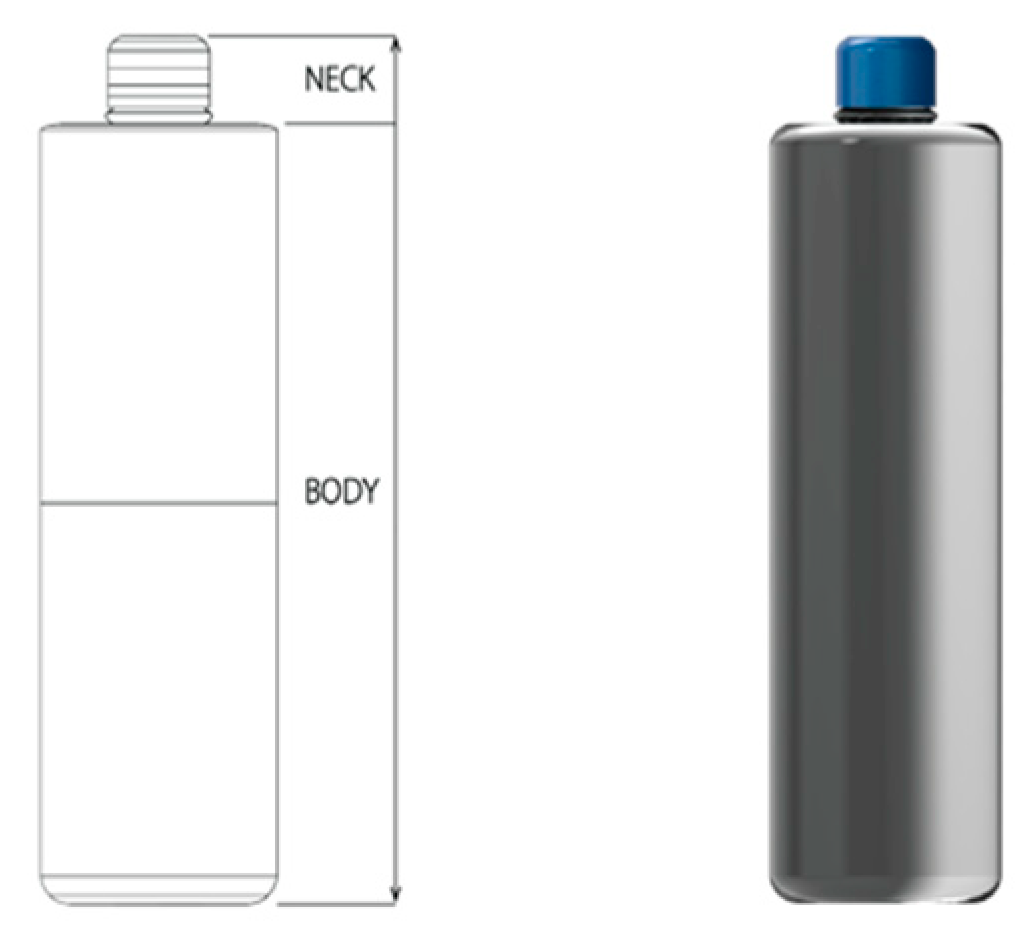
Beyond consumer interest in convenient packaging (e.g., easy to open, resealable, etc.), there is strong demand for packaging that is modern not only in design but also in terms of materials and biodegradability. Today, the use of green and eco-friendly materials, recyclability, and biodegradability of packaging, the reduction in overall CO2 emissions, and the mitigation of severe industrial environmental impacts are among the key elements consumers are seeking [35,77,78].
However, life cycle assessment (LCA) has been used for years as the primary design approach to evaluate sustainability in packaging [79]. Bjørn and Hauschild [80] describe LCA as the most accurate tool to measure improvements in eco-efficiency and to contribute to reduced resource consumption and pollution. According to Niero et al. [81], with respect to packaging, LCA studies mainly aim to reduce material usage and minimize environmental impacts, without compromising the protective function of the packaging. However, Wever and Vogtländer [79] argue that LCA does not allow for a definitive decision on whether a packaging design is sustainable. They explain that LCA enables comparison between design alternatives that are approximately equal in functionality and quality. Companies should always aim for a functional packaging solution that integrates sustainable elements, low environmental impact, and features that attract consumers and influence their purchasing behavior [82]. In addition, Keller et al. [83] explore the importance of recyclability and examine how packaging optimization can reduce environmental impact. They emphasize that avoiding the use of chemicals, insoluble adhesives, and large, non-soluble labels could significantly reduce packaging’s environmental burden.
On the other hand, Svanes et al. [84] argue that packaging optimization is more important than material minimization. They also suggest that a truly sustainable strategy should incorporate all elements of sustainability—environmental protection, reduced distribution and operational costs, market acceptance, and user-friendliness. In an effort to promote plastic reduction, Vazquez et al. [85] investigate how reducing the thickness of shampoo bottles can be successful while maintaining functionality and performance. Additionally, Gavazzi et al. [86] state that effective packaging design is strongly connected to material selection, logistics, and lifespan, all of which influence sustainability. Furthermore, enhanced functionality of packaging materials adds value to the packaging design.
Recent studies in sustainable packaging design underline various methodological advances, focusing mainly on the integration of life cycle assessment (LCA), circular economy approaches, and decision support tools. Jagoda et al. (2023) [87] proposed a framework that combines tools such as LCA and analytical cost estimation to enable a holistic evaluation of packaging designs in terms of user satisfaction, environmental performance, and cost efficiency. In addition, Thakker and Bakshi (2023) [88] proposed a multiobjective optimization framework for evaluating and ranking conceptual packaging eco-innovations based on their potential contribution to a Sustainable Circular Economy (SCE) within the grocery bags value chain. Similarly, Landi et al. (2020) [89] developed an eco-design methodology supported by virtual prototyping and LCA tools to redesign kitchen hood packaging, demonstrating that using molded pulp materials can reduce environmental impacts while maintaining performance standards.
This study does not focus solely on material minimization; instead, it introduces a parametric approach that emphasizes design optimization to deliver both environmental and economic benefits, while remaining adaptable across different scenarios and enabling early-stage packaging decisions.

3. The Case Study

The following case study is an investigation of the packaging redesign challenge. The main aim is to show that a thorough analysis and an in-depth investigation of a product’s packaging may lead to major changes and multiple benefits. Such benefits include savings in storage and transportation capacity, reduction in material usage through changes in the shape of the product, as well as additional advantages for the environment and the community.
In this case study, two different bottle options are investigated in terms of shape and material efficiency. The first option is a conventional bottle with variable diameter, while the second is a uniform, fully cylindrical design. The two bottles have the same capacity, and the main aim is to improve material utilization and demonstrate the gains resulting from this process. The comparison between the bottles highlights the strengths and weaknesses of each option.
To support the analytical formulation, the bottle is modeled as a simplified cylindrical structure, defined by its height and radius. The material is assumed to be homogeneous, with uniform thickness and mechanical properties across the entire surface. Geometric features such as base curvature and neck tapering are deliberately omitted at this stage to preserve generality and ensure parametric clarity. These assumptions provide a solid foundation for the model’s initial development, with the possibility for refinement in later stages based on specific design requirements.
Wolfram Mathematica v.12 was used to calculate the relationship between the size of the redesigned bottle and its height, ensuring that the volume of the initial bottle and the final bottle remains equal. A Mathematica script was developed to calculate the relationship between the parameters mentioned above.
As a second step, Rhinoceros v.6 CAD software was used to design the bottles and ensure the accuracy of their dimensions.
The analysis shows that packaging redesign based on a detailed examination can offer significant economic benefits for the company in terms of the volume of materials used during manufacturing. In addition, this substantial material reduction may also contribute to environmental benefits such as lower greenhouse gas emissions, reduced energy consumption in production, and decreased solid waste volumes.

Mathematical Modeling—Relations
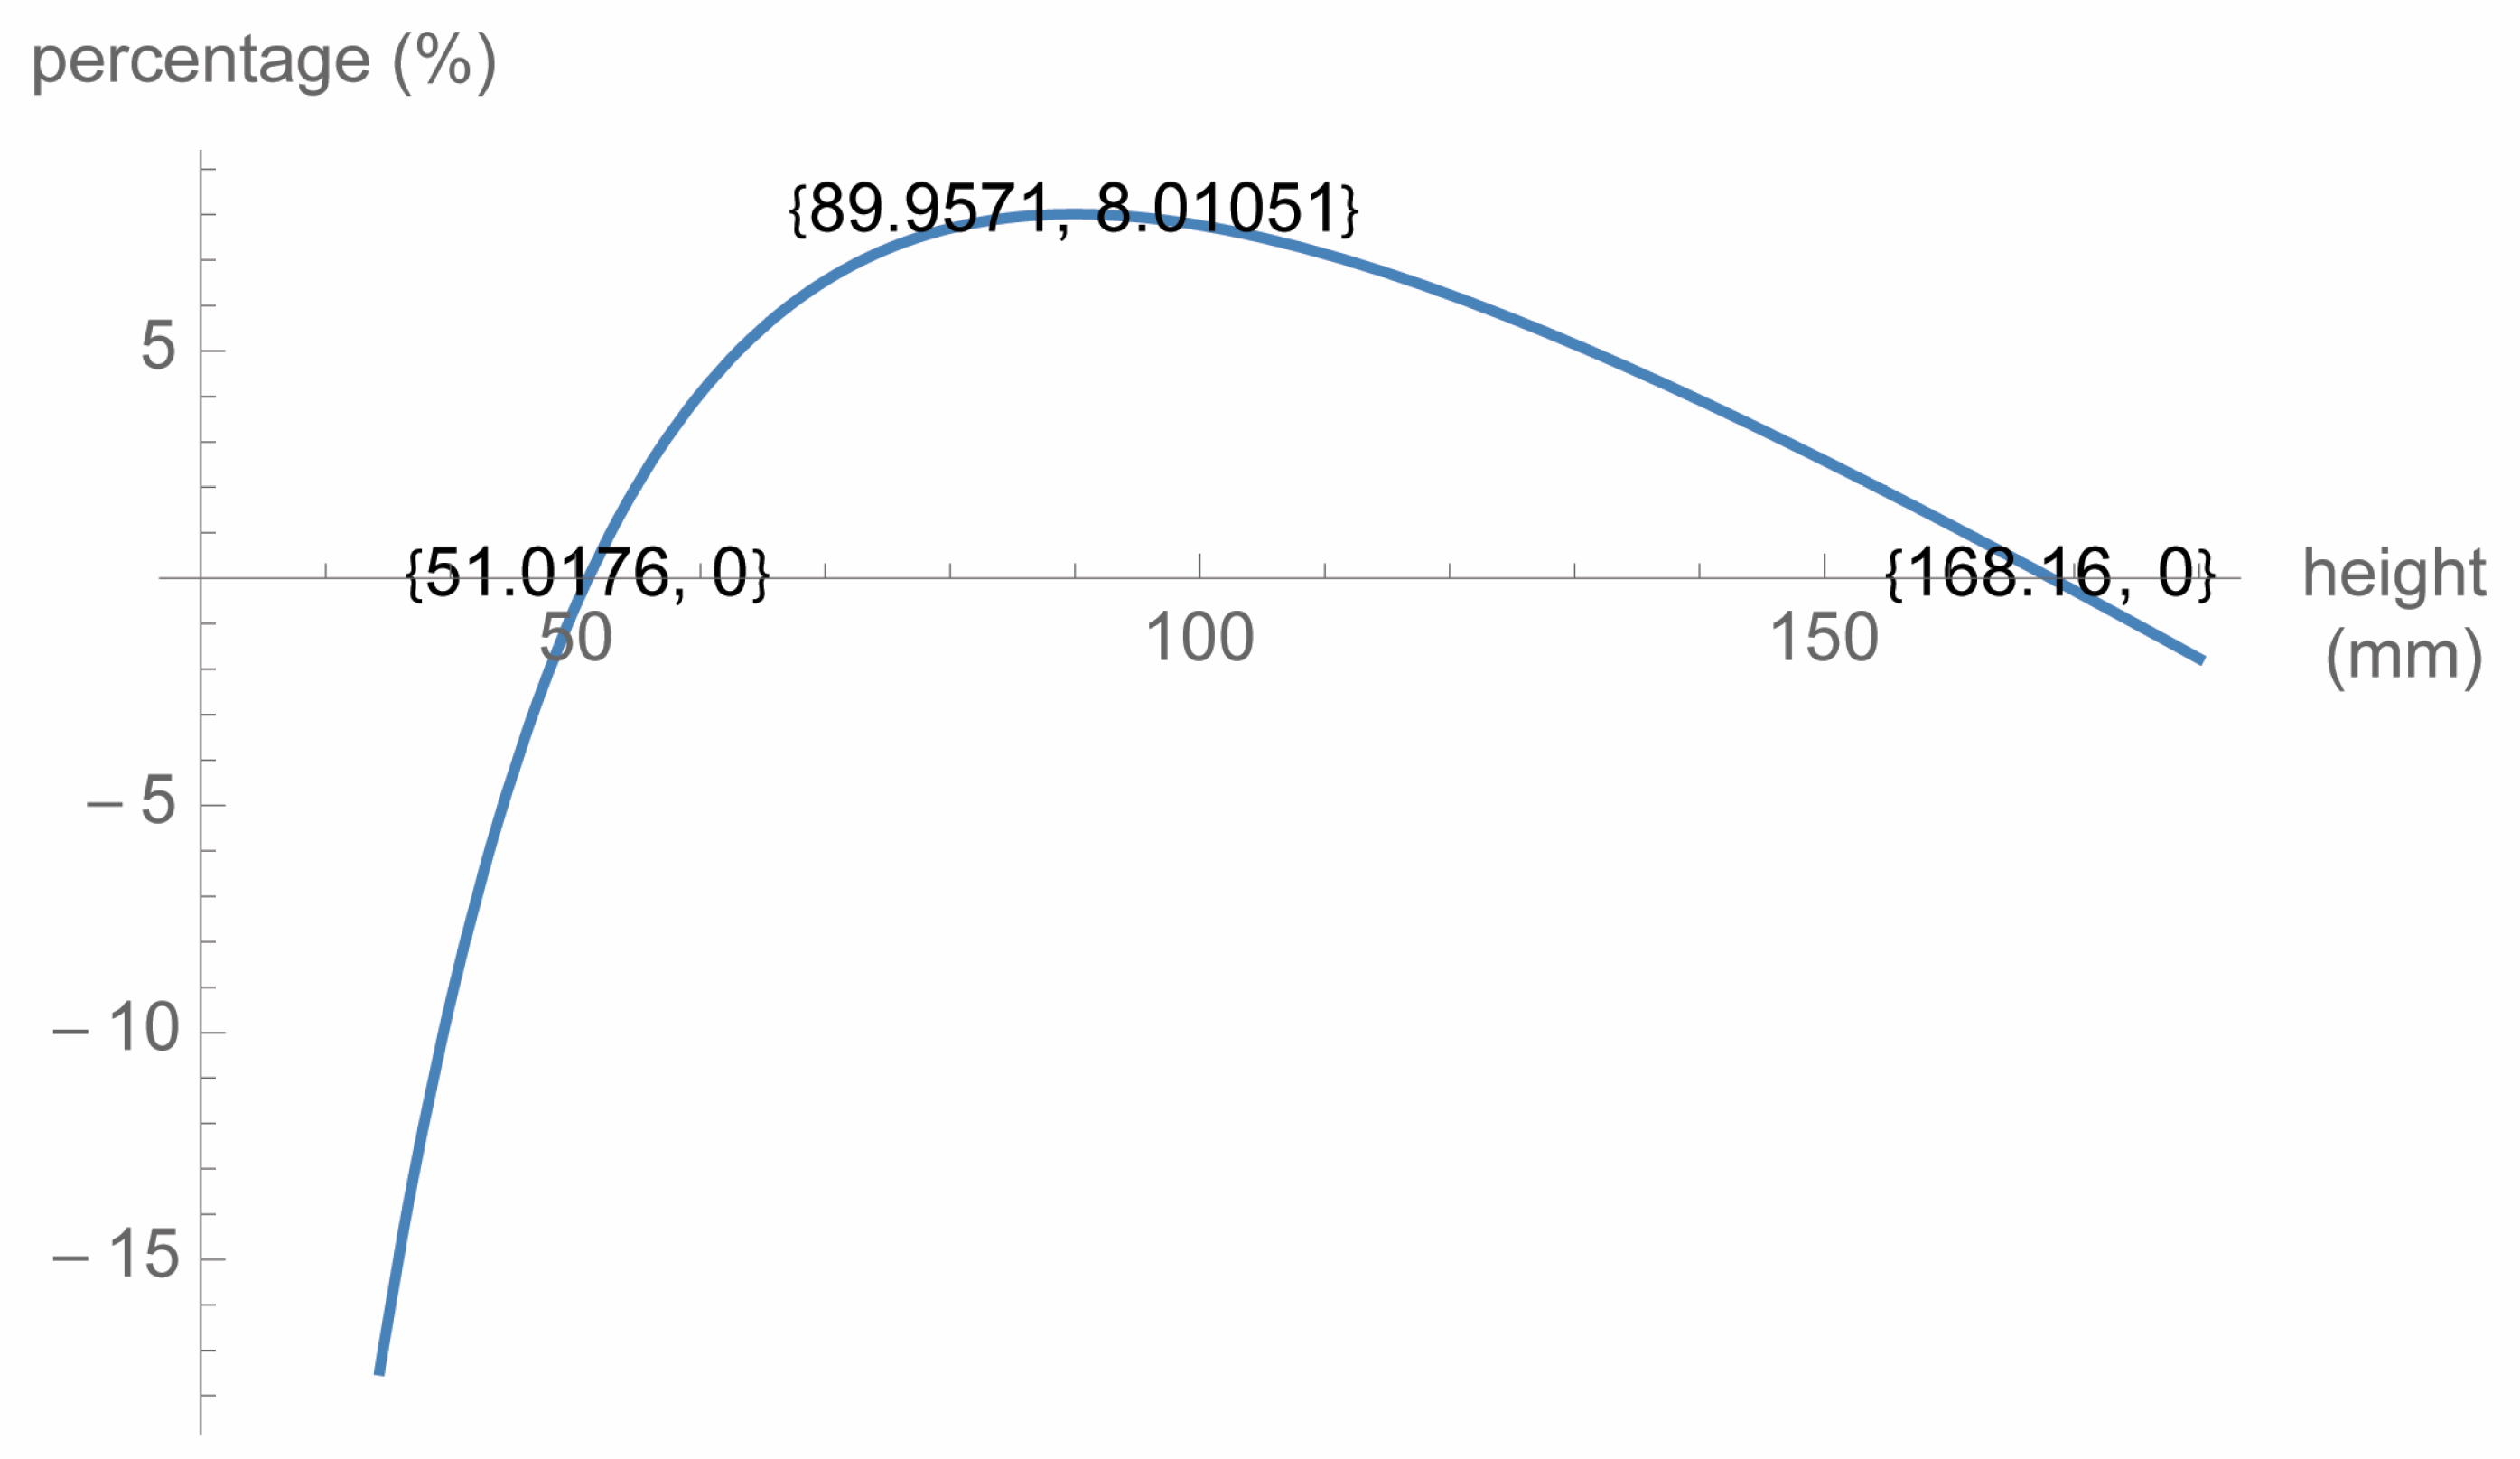
In this case study, the two bottles are assumed to have the same volume.
Thus,
v 1 = v 2
The volume for the initial bottle is the following (Figure 1):
v 1 = π p 1 a 2 h 1 a + π p 2 h + 1 3 π p 2 h 2 a + 2 3 π p 1 a 2 h 2 a
While the volume of the final bottle is the following (Figure 2):
v 2 = π p k 2 h k + π p 2 h
For the next step, the area for both bottles should be estimated in order to demonstrate the advantages or disadvantages of redesigning in terms of material usage.
Thus, the area for the initial bottle is the following:
e 1 = 2 π p h + π p 2 + 2 π p 1 a h 1 a + + π p 1 a 2 + π p 1 a h 2 a h 2 a 2 p 2 + p 2 p 1 a 2 2 h 2 a 2 p 1 a 2 + + h 2 a p 1 a A r c S i n h 2 a 2 + p 2 p 1 a 2 p 2 + p 1 a 2 h 2 a p 1 a h 2 a 2 + p 2 p 1 a 2 p 2 + p 1 a 2 10 6
And the area for the final bottle is the following:
e 2 = ( 2 π p k h k + 2 π p k 2 + 2 π p h ) 10 6  
In order to calculate the dimensions of the final bottle, while maintaining the same volume in both bottles, the radius of the final bottle is derived by the following relation.
p k = h 2 a p 2 + 3 h 1 a p 1 a 2 + 2 h 2 a p 1 a 2 3 h k
where
v 1 = volume of initial bottle
v 2 = volume of final bottle
e 1 = surface area of initial bottle
e 2 = surface area of final bottle
p 1 a = body radius (initial bottle)
p k = body radius (final bottle)
p = neck radius
h 1 a = body height (initial bottle)
h 2 a = shoulder height (initial bottle)
h k = total height (final bottle)
h = neck height
The neck for both bottles has been designed to have the same dimensions. Modifying the neck would require costly adjustments to machinery and closures, potentially disrupting operations. Keeping it unchanged allows the redesign to focus on the bottle body, enabling material and logistical improvements without affecting functionality or manufacturing efficiency.
A code in Mathematica has been developed in order to calculate the relation between the height and the radius of the final bottle.
The outcomes are presented in Table 1.
As shown in Table 1, the solution in which the reduction in material usage is maximized corresponds to the final bottle with a total height of 89.9571 mm and a radius of 44.9785 mm. In this solution, the surface area of the initial bottle is estimated at 0.0428 m2, while the surface area of the final bottle is 0.0393 m2. The final bottle uses 8.01% less material while maintaining the same volume as the initial bottle; this reduction was estimated by comparing the surface areas of the two designs, assuming uniform wall thickness and identical material properties.
On the other hand, the solution in which the height of the final bottle is 168.16 mm and its radius is 32.8975 mm results in the same surface area as the initial bottle, i.e., 0.0428 m2, with zero gain in material usage.
Thus, in the present case, the following cases could be defined:
a.
When the functions are calculated by considering the total height ( h k ) of the new bottle as the variable, and the radius is calculated in relation to this height, in order to reduce the quantity of material (see Figure 3):
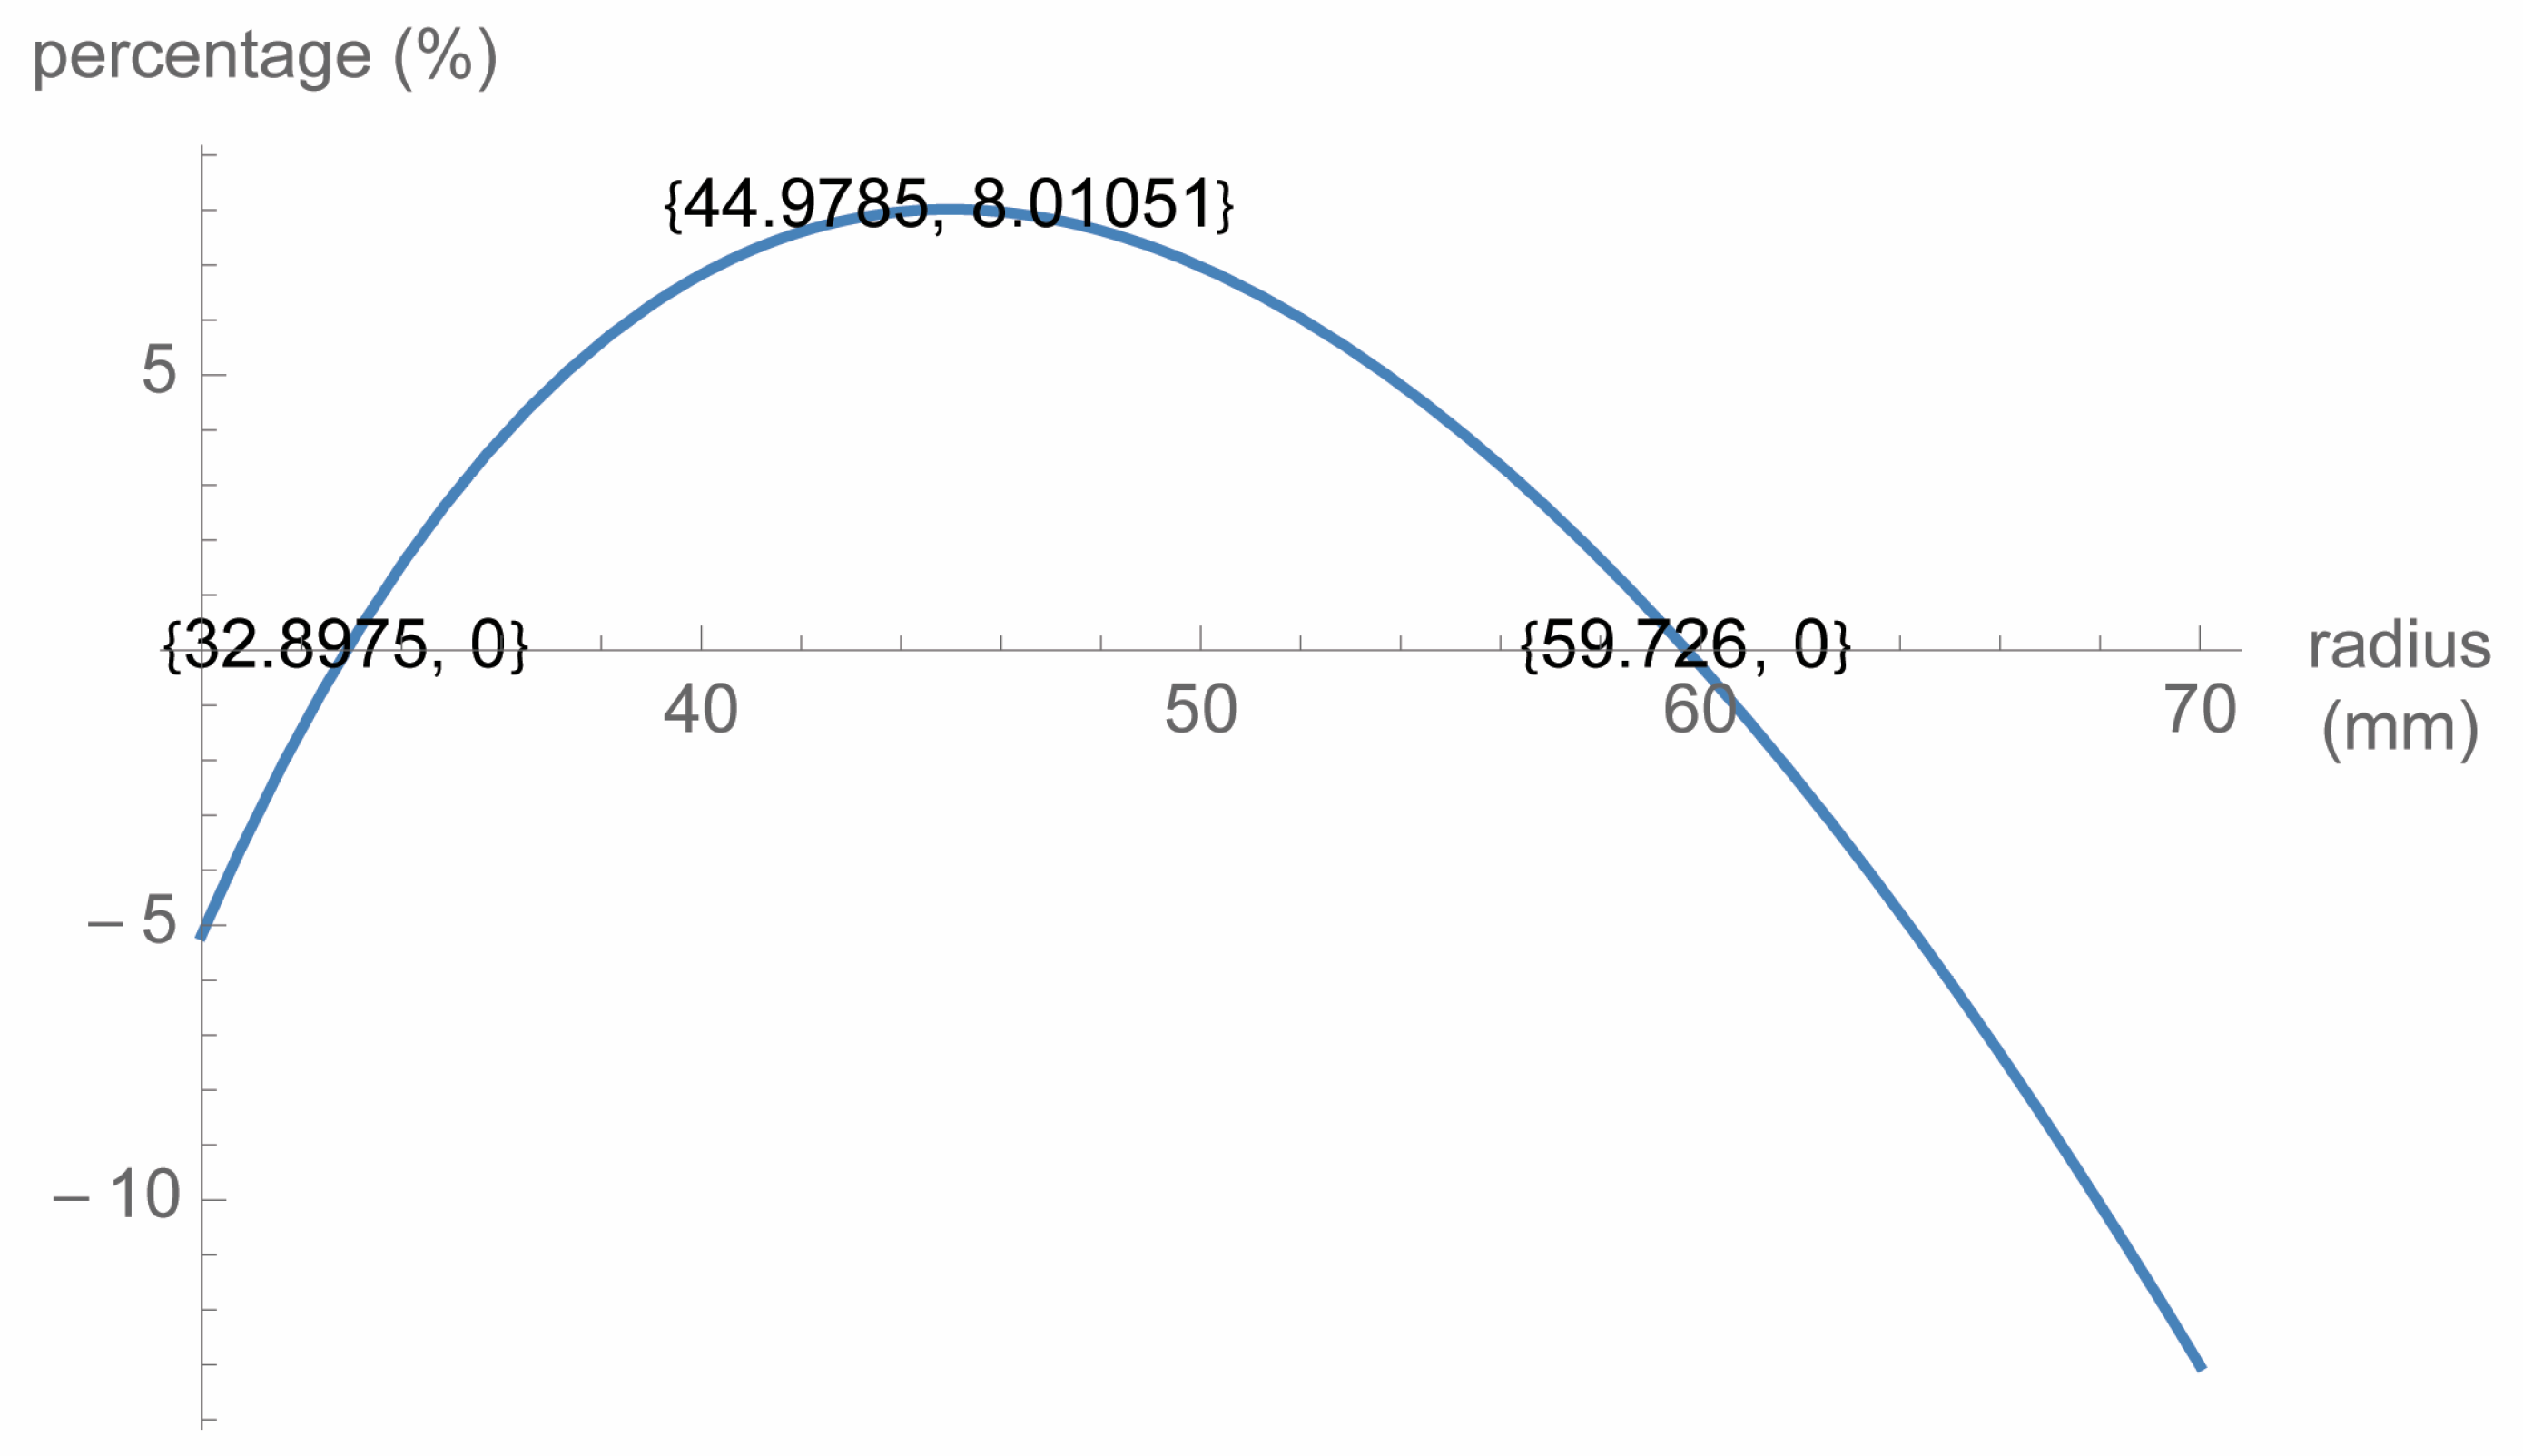
h k   ( 51.0176 ,   168.16 )
b.
When the functions are calculated by considering the radius ( p k ) of the new bottle as the variable, and the height of the new bottle is calculated with respect to this radius, in order to reduce the quantity of material (see Figure 4):
p k ( 32.8975 , 59.726 )

4. Discussion

The above analysis clearly shows that a bottle with a uniform, fully cylindrical design and any height between approximately 51 mm and 168 mm could lead to a significant reduction in packaging material usage compared to the initial partly cylindrical bottle. The maximum reduction in packaging material usage of approximately 8%, as described above, appears to be significant in both economic and environmental terms.
The approximate weight of a regular semi-cylindrical PET bottle is around 10 g. If a successful bottle redesign achieves an 8% weight reduction, the weight of the fully cylindrical PET bottle would be approximately 9.2 g. Around 1.6 billion plastic bottles are produced daily worldwide, while annual PET bottle production is estimated at 583.3 billion units [90].
This volume of production corresponds to approximately 54,800 metric tons of PET daily, or around 20 million tons annually [91]. An 8% reduction in material usage would translate to approximately 4384 tons less material usage per day, or about 1,600,000 tons annually, for the production of the same number of volume-identical bottles. Figure 5 illustrates this material reduction, showing a decrease in annual material consumption from 20 million to 18.4 million tons as a result of the packaging redesign.
In economic terms, this reduction in material usage leads to enormous cost savings. According to Plastics Information Europe [92], the price of PET in May 2022 was approximately 1887 U.S. dollars or 1760 euros per metric ton. As shown above, reducing annual PET usage by 1,600,000 tons corresponds to a cost reduction of 3,019,200,000 U.S. dollars or 2,816,000,000 euros.
In an ever-changing world, and with the emergence of environmental problems caused by industrial production, reducing the use of materials and energy—wherever possible—is imperative. The use of plastic has increased over the years, partly due to its contribution to the protection and preservation of food [61]. According to Ellen MacArthur Foundation et al. [93], beyond its physical characteristics—such as low weight, which contributes to reduced transport costs and various environmental benefits—it is also a low-cost material that offers high levels of protection to the contained product. This enhanced protection further contributes to a reduced environmental impact by preserving energy resources and raw materials [94].
The above analysis underlines the combined environmental and economic benefits that may result from effective packaging redesign. Today, when even the slightest change in industrial production can affect the environment to varying degrees, interventions such as packaging redesign—which may lead to a significant reduction in material usage and further environmental mitigation—are essential (Figure 6).
The concept of packaging redesign in terms of material reduction (without compromising product protection) is of high importance and should be considered a critical issue for both industry and governments. While efforts to protect the environment have become more intense in recent years, governments increasingly focus on imposing taxes through concepts such as the Polluter Pays Principle [95] (The principle is based on the concept that the polluters bear the costs of their pollution. These costs include the costs of measures adopted to prevent, properly manage, and protect the environment from the burden caused by the polluter.).
In addition to this principle, and based on the findings of the present investigation, governments should consider providing incentives to producers to reduce their environmental impact by pursuing a partial or total redesign of their product packaging, instead of imposing taxes that are ultimately passed on to final consumers through higher product prices.
Incentives for industries that succeed in becoming involved may include economic reliefs and could be evaluated by connecting measurable data on the basis of reducing the product’s environmental footprint as a result of the packaging redesign as well as the reduction in material and energy usage.
On the other hand, the economic benefits for the organizations are equally significant. As we saw above, the significant economic savings in material usage as a result of a sophisticated packaging redesign should be taken into consideration by the managers.
Packaging optimization, which could be the result of efforts towards environmental protection and further economic savings, should be evaluated and thoroughly designed since it could be beneficial for both the industry and the community.

5. Conclusion and Policy Implications

In this study, one aspect of the packaging redesign concept has been investigated. It has been estimated that redesigning—or even completely changing—the shape of a bottle could offer significant economic and environmental benefits. Due to the enormous volume of bottles produced worldwide on a daily basis, even small material efficiency improvements per item could result in significant savings that ultimately have a positive effect on the environment. This process could also be applied to a variety of products, as it is a design that can be tailored to any packaging shape and can offer considerable benefits to the user.
However, product changes should be based on a detailed analysis of the specific requirements and final characteristics of the packaging itself. There are significant limitations in how shape parameters such as radius and height interact to preserve volume and material efficiency.
It should also be noted that other critical aspects, such as marketing strategy, must be taken into account. In many cases, companies are reluctant to proceed with partial or complete packaging redesign due to marketing reasons. Thus, it is essential for the marketing department to be involved in such crucial decisions [78].
The use of multilayered, non-recyclable labels is another issue that must be addressed. Alternative solutions, such as embossed features on the packaging or the use of soluble labels, should also be examined from an environmental protection perspective.
Further investigation could also explore the relationship between packaging redesign, material reduction, and space optimization during transportation due to shape improvements. According to Georgakoudis et al. [35], a single bottle redesign could offer significant space efficiency and lead to considerable economic savings (e.g., transportation costs) for the industry. In some cases, total costs can be reduced by 21% or more.
It should be underlined that although the present study focuses on material-related and environmental benefits that may result from packaging redesign, minor or more substantial changes in packaging geometry can also influence consumer behavior and overall user experience. However, these aspects were not within the scope of the present analysis, even though they represent an important area for future research—particularly in linking shape optimization with marketing considerations that incorporate user-oriented design principles.
In any case, the issue requires careful consideration, in-depth analysis, and rational solutions. Industrial development and environmental degradation are interconnected concepts. The supply chain requires clarity, sincere efforts, and sustainable solutions throughout its entire length in order to achieve optimal results for both industry and society.
This case study centers on a particular bottle type, characterized by distinct structural features such as its shape and constituent materials. As a result, the analysis is most relevant to bottles sharing similar design attributes. While the underlying modeling approach holds promise for broader applications—such as packaging with different geometries (e.g., rectangular or oval forms) or alternative materials (e.g., glass or multilayer laminates)—such extensions would likely require tailored adjustments. These might involve, for example, accounting for differences in mechanical behavior, geometric complexity, or overall structural performance. Future work could explore these variables in greater depth, offering insights into how adaptable and resilient the proposed method is when applied across a wider spectrum of packaging designs.

Author Contributions

Methodology, G.G.P. and N.S.T.; Formal analysis, G.G.P.; Investigation, E.D.G.; Resources, E.D.G.; Writing—original draft, E.D.G.; Writing—review & editing, E.D.G., G.G.P. and N.S.T.; Supervision, E.D.G.; Project administration, E.D.G. All authors have read and agreed to the published version of the manuscript.

Funding

This research received no external funding.

Institutional Review Board Statement

Not applicable.

Informed Consent Statement

Not applicable.

Data Availability Statement

The original contributions presented in this study are included in the article. Further inquiries can be directed to the corresponding author.

Conflicts of Interest

The authors declare no conflict of interest.

References

  1. Dulambayeva, R.; Jumabayev, S.; Marmontova, T.; Zhunussova, A. COVID–19 in transport industry: The case of Kazakhstan: Government measures and public reaction. Transp. Res. Procedia 2022, 63, 1377–1388. [Google Scholar] [CrossRef]
  2. Gulseven, O.; Al Harmoodi, F.; Al Falasi, M.; Alshomali, I. How the COVID-19 pandemic will affect the UN Sustainable Development Goals? SSRN Electron. J. 2020, 3592933. [Google Scholar] [CrossRef]
  3. Chmielarz, W.; Zborowski, M.; Xuetao, J.; Atasever, M.; Szpakowska, J. COVID-19 pandemic as sustainability determinant of e-commerce in the creation of information society. Procedia Comput. Sci. 2022, 207, 4378–4389. [Google Scholar] [CrossRef]
  4. National Oceanic and Atmospheric Administration. Climate Change Impacts. Available online: https://www.noaa.gov/education/resource-collections/climate/climate-change-impacts (accessed on 13 August 2021).
  5. Alexander, L.V.; Allen, S.K.; Bindoff, N.L.; Bréon, F.-M.; Church, J.A.; Cubasch, U.; Emori, S.; Forster, P.; Friedlingstein, P.; Gillett, N.P.; et al. Climate change 2013: The physical science basis. In Contribution of Working Group I to the Fifth Assessment Report of the Intergovernmental Panel on Climate Change (IPCC); Cambridge University Press: Cambridge, UK, 2013. [Google Scholar]
  6. Intergovernmental Panel on Climate Change. Summary for Policymakers. In Climate Change 2021: The Physical Science Basis. Contribution of Working Group I to the Sixth Assessment Report of the Intergovernmental Panel on Climate Change; Masson-Delmotte, V., Zhai, P., Pirani, A., Connors, S.L., Péan, C., Berger, S., Caud, N., Chen, Y., Goldfarb, L., Gomis, M.I., et al., Eds.; Cambridge University Press: Cambridge, UK, 2021. [Google Scholar]
  7. Foster, G.; Rahmstorf, S. Global temperature evolution 1979–2010. Environ. Res. Lett. 2011, 6, 044022. [Google Scholar] [CrossRef]
  8. Okereke, C.; Wittneben, B.; Bowen, F. Climate change: Challenging business, transforming politics. Bus. Soc. 2011, 51, 7–30. [Google Scholar] [CrossRef]
  9. Allen, M.; Barros, V.; Broome, J. IPCC Fifth Assessment Synthesis Report—Climate Change 2014 Synthesis Report; IPCC: Geneva, Switzerland, 2014; p. 116. [Google Scholar]
  10. Palinkas, L.A.; Wong, M. Global climate change and mental health. Curr. Opin. Psychol. 2020, 32, 12–16. [Google Scholar] [CrossRef] [PubMed]
  11. Cevik, S.; Jalles, J.T. For whom the bell tolls: Climate change and income inequality. Energy Policy 2023, 174, 113475. [Google Scholar] [CrossRef]
  12. Tubiello, F.N.; Karl, K.; Flammini, A.; Gütschow, J.; Obli-Laryea, G.; Conchedda, G.; Pan, X.Y.; Sally, Y.Q.; Heiðarsdóttir, H.H.; Wanner, N.; et al. Pre- and post-production processes increasingly dominate greenhouse gas emissions from agri-food systems. Earth Syst. Sci. Data 2022, 14, 1795–1809. [Google Scholar] [CrossRef]
  13. Busby, J.W.; Cook, K.H.; Vizy, E.K.; Smith, T.G.; Bekalo, M. Identifying hot spots of security vulnerability associated with climate change in Africa. Clim. Change 2014, 124, 717–731. [Google Scholar] [CrossRef]
  14. Brundtland, G.H. Our Common Future; Oxford University Press: Oxford, UK, 1987. [Google Scholar]
  15. Baarsch, F.; Granadillos, J.R.; Hare, W.; Knaus, M.; Krapp, M.; Schaeffer, M.; Lotze-Campen, H. The impact of climate change on incomes and convergence in Africa. World Dev. 2020, 126, 104699. [Google Scholar] [CrossRef]
  16. Guest, R. The economics of sustainability in the context of climate change: An overview. J. World Bus. 2010, 45, 326–335. [Google Scholar] [CrossRef]
  17. Abdelzaher, D.M.; Martynov, A.; Abdel Zaher, A.M. Vulnerability to climate change: Are innovative countries in a better position? Res. Int. Bus. Financ. 2020, 51, 101098. [Google Scholar] [CrossRef]
  18. Flaherty, M.; Gevorkyan, A.; Radpour, S.; Semmler, W. Financing climate policies through climate bonds—A three stage model and empirics. Res. Int. Bus. Financ. 2017, 42, 468–479. [Google Scholar] [CrossRef]
  19. Winn, M.; Kirchgeorg, M.; Griffiths, A.; Linnenluecke, M.K.; Günther, E. Impacts from climate change on organizations: A conceptual foundation. Bus. Strategy Environ. 2011, 20, 157–173. [Google Scholar] [CrossRef]
  20. Shuai, C.; Chen, X.; Wu, Y.; Zhang, Y.; Tan, Y. A three-step strategy for decoupling economic growth from carbon emission: Empirical evidences from 133 countries. Sci. Total Environ. 2019, 646, 524–543. [Google Scholar] [CrossRef]
  21. Wu, Y.; Tam, V.W.Y.; Shuai, C.; Shen, L.; Zhang, Y.; Liao, S. Decoupling China’s economic growth from carbon emissions: Empirical studies from 30 Chinese provinces (2001–2015). Sci. Total Environ. 2019, 656, 576–588. [Google Scholar] [CrossRef]
  22. Lai, S.; Lu, J.; Luo, X.; Ge, J. Carbon emission evaluation model and carbon reduction strategies for newly urbanized areas. Sustain. Prod. Consum. 2022, 31, 13–25. [Google Scholar] [CrossRef]
  23. United Nations. Paris Agreement. 2015. Available online: https://unfccc.int/sites/default/files/english_paris_agreement.pdf (accessed on 17 September 2024).
  24. Rogelj, J.; den Elzen, M.; Höhne, N.; Fransen, T.; Fekete, H.; Winkler, H.; Schaeffer, R.; Rocha, M.; Oberthür, S.; Meinshausen, M. Paris Agreement climate proposals need a boost to keep warming well below 2 °C. Nature 2016, 534, 631–639. [Google Scholar] [CrossRef]
  25. Twerefou, D.K.; Danso-Mensah, K.; Bokpin, G.A. The environmental effects of economic growth and globalization in Sub-Saharan Africa: A panel general method of moments approach. Res. Int. Bus. Financ. 2017, 42, 939–949. [Google Scholar] [CrossRef]
  26. Offermann-van Heek, J.; Arning, K.; Linzenich, A.; Ziefle, M. Trust and distrust in carbon capture and utilization industry as relevant factors for the acceptance of carbon-based products. Front. Energy Res. 2018, 6, 73. [Google Scholar] [CrossRef]
  27. Georgakoudis, E.D. Packaging Operations Within the Greek Logistic Industry: Evaluating and Redesigning Paper Packaging in Compliance with Environmental Regulations. Ph.D. Thesis, The University of Huddersfield, Huddersfield, UK, 2014. [Google Scholar]
  28. Parboteeah, K.P.; Addae, H.M.; Cullen, J.B. Propensity to support sustainability initiatives: A cross-national model. J. Bus. Ethics 2011, 105, 403–413. [Google Scholar] [CrossRef]
  29. Husted, B.W. Culture and ecology: A cross-national study of the determinants of environmental sustainability. Manag. Int. Rev. 2005, 45, 349–371. [Google Scholar]
  30. Galbreath, J.; Charles, D.; Klass, D. Knowledge and the climate change issue: An exploratory study of cluster and extra-cluster effects. J. Bus. Ethics 2013, 125, 11–25. [Google Scholar] [CrossRef]
  31. da Guarda, E.L.A.; Domingos, R.M.A.; Jorge, S.H.M.; Durante, L.C.; Sanches, J.C.M.; Leão, M.; Callejas, I.J.A. The influence of climate change on renewable energy systems designed to achieve zero energy buildings in the present: A case study in the Brazilian savannah. Sustain. Cities Soc. 2020, 52, 101843. [Google Scholar] [CrossRef]
  32. Kim, M.H.; Kim, D.; Heo, J.; Lee, D.W. Energy performance investigation of net plus energy town: Energy balance of the Jincheon Eco-Friendly Energy Town. Renew. Energy 2020, 147, 1784–1800. [Google Scholar] [CrossRef]
  33. Fuxman, L.; Mohr, I.; Mahmoud, A.B.; Grigoriou, N. The new 3Ps of sustainability marketing: The case of fashion. Sustain. Prod. Consum. 2022, 31, 384–396. [Google Scholar] [CrossRef]
  34. Tipi, N.; Georgakoudis, E.D. Packaging Design and Sustainability—The Case of Paper Packaging Supply Chain. In Sustainable and Green Supply Chains and Logistics: Case Study Collection; Bak, Ö., Ed.; Kogan Page: London, UK, 2021; pp. 147–161. [Google Scholar]
  35. Georgakoudis, E.D.; Pechlivanidou, G.G.; Tipi, N.S. The packaging redesign issue—Space exploitation and environmental benefits. Manag. Environ. Qual. Int. J. 2022, 34, 1–20. [Google Scholar] [CrossRef]
  36. Craighill, A.L.; Powell, J.C. Lifecycle assessment and economic evaluation of recycling: A case study. Resour. Conserv. Recycl. 1996, 17, 75–96. [Google Scholar] [CrossRef]
  37. da Cruz, N.F.; Simões, P.; Marques, R.C. Economic cost recovery in the recycling of packaging waste: The case of Portugal. J. Clean. Prod. 2012, 37, 8–18. [Google Scholar] [CrossRef]
  38. Fraser, D. The Effect of War on Food Prices. BBC News. Available online: https://www.bbc.com/news/uk-scotland-60644376 (accessed on 7 March 2022).
  39. Simchi-Levi, D.; Haren, P. How the War in Ukraine is Further Disrupting Global Supply Chains. Harvard Business Review. Available online: https://hbr.org/2022/03/how-the-war-in-ukraine-is-further-disrupting-global-supply-chains (accessed on 19 March 2025).
  40. Risch, B.W.K. The raw material supply of the European Community: The importance of secondary raw materials. Resour. Policy 1978, 4, 181–188. [Google Scholar] [CrossRef]
  41. Dussaux, D.; Glachant, M. How much does recycling reduce imports? Evidence from metallic raw materials. J. Environ. Econ. Policy 2018, 8, 128–146. [Google Scholar] [CrossRef]
  42. Muhammad, B. Energy consumption, CO2 emissions and economic growth in developed, emerging and Middle East and North Africa countries. Energy 2019, 179, 232–245. [Google Scholar] [CrossRef]
  43. Al-Mulali, U.; Che Sab, C.N.B. Electricity consumption, CO2 emission, and economic growth in the Middle East. Energy Sources Part B Econ. Plan. Policy 2018, 13, 257–263. [Google Scholar] [CrossRef]
  44. Saidi, K.; Hammami, S. The impact of energy consumption and CO2 emissions on economic growth: Fresh evidence from dynamic simultaneous-equations models. Sustain. Cities Soc. 2015, 14, 178–186. [Google Scholar] [CrossRef]
  45. Coondoo, D.; Dinda, S. Causality between income and emission: A country group-specific econometric analysis. Ecol. Econ. 2002, 40, 351–367. [Google Scholar] [CrossRef]
  46. Richmond, A.K.; Kaufmann, R.K. Is there a turning point in the relationship between income and energy use and/or carbon emissions? Ecol. Econ. 2006, 56, 176–189. [Google Scholar] [CrossRef]
  47. Guan, D.; Hubacek, K.; Weber, C.L.; Peters, G.P.; Reiner, D.M. The drivers of Chinese CO2 emissions from 1980 to 2030. Glob. Environ. Change 2008, 18, 626–634. [Google Scholar] [CrossRef]
  48. Shen, L.; Wu, Y.; Lou, Y.; Zeng, D.; Shuai, C.; Song, X. What drives the carbon emission in the Chinese cities?—A case of pilot low carbon city of Beijing. J. Clean. Prod. 2018, 174, 343–354. [Google Scholar] [CrossRef]
  49. Xu, G.; Schwarz, P.; Yang, H. Determining China’s CO2 emissions peak with a dynamic nonlinear artificial neural network approach and scenario analysis. Energy Policy 2019, 128, 752–762. [Google Scholar] [CrossRef]
  50. Oliveira, T.; Varum, C.; Botelho, A. Econometric modeling of CO2 emissions abatement: Comparing alternative approaches. Renew. Sustain. Energy Rev. 2019, 105, 310–322. [Google Scholar] [CrossRef]
  51. Zhang, C.; Luo, H.; Wang, Z. An economic analysis of waste heat recovery and utilization in data centers considering environmental benefits. Sustain. Prod. Consum. 2022, 31, 127–138. [Google Scholar] [CrossRef]
  52. Fridell, E.; Bäckström, S.; Stripple, H. Considering infrastructure when calculating emissions for freight transportation. Transp. Res. Part D Transp. Environ. 2019, 69, 346–363. [Google Scholar] [CrossRef]
  53. Abokyi, E.; Appiah-Konadu, P.; Abokyi, F.; Oteng-Abayie, E.F. Industrial growth and emissions of CO2 in Ghana: The role of financial development and fossil fuel consumption. Energy Rep. 2019, 5, 1339–1353. [Google Scholar] [CrossRef]
  54. Mikayilov, J.I.; Galeotti, M.; Hasanov, F.J. The impact of economic growth on CO2 emissions in Azerbaijan. J. Clean. Prod. 2018, 197, 1558–1572. [Google Scholar] [CrossRef]
  55. Winkler, H.; Spalding-Fecher, R.; Tyani, L. Comparing developing countries under potential carbon allocation schemes. Clim. Policy 2002, 2, 303–318. [Google Scholar] [CrossRef]
  56. Du, H.; Chen, Z.; Peng, B.; Southworth, F.; Ma, S.; Wang, Y. What drives CO2 emissions from the transport sector? A linkage analysis. Energy 2019, 175, 195–204. [Google Scholar] [CrossRef]
  57. Kazancoglu, Y.; Ozkan-Ozen, Y.D.; Ozbiltekin, M. Minimizing losses in milk supply chain with sustainability: An example from an emerging economy. Resour. Conserv. Recycl. 2018, 139, 270–279. [Google Scholar] [CrossRef]
  58. Stern, D.I.; Common, M.S.; Barbier, E.B. Economic growth and environmental degradation: The environmental Kuznets curve and sustainable development. World Dev. 1996, 24, 1151–1160. [Google Scholar] [CrossRef]
  59. Stern, D.I.; Common, M.S. Is there an environmental Kuznets curve for sulfur? J. Environ. Econ. Manag. 2001, 41, 162–178. [Google Scholar] [CrossRef]
  60. Dinda, S. Environmental Kuznets curve hypothesis: A survey. Ecol. Econ. 2004, 49, 431–455. [Google Scholar] [CrossRef]
  61. Matthews, C.; Moran, F.; Jaiswal, A.K. A review on European Union’s strategy for plastics in a circular economy and its impact on food safety. J. Clean. Prod. 2021, 283, 125263. [Google Scholar] [CrossRef]
  62. Marsh, K.; Bugusu, B. Food packaging—Roles, materials, and environmental issues. J. Food Sci. 2007, 72, R39–R55. [Google Scholar] [CrossRef]
  63. Leal Filho, W.; Saari, U.; Fedoruk, M.; Iital, A.; Moora, H.; Klöga, M.; Voronova, V. An overview of the problems posed by plastic products and the role of extended producer responsibility in Europe. J. Clean. Prod. 2019, 214, 550–558. [Google Scholar] [CrossRef]
  64. Laville, S.; Taylor, M. A Million Bottles a Minute: World’s Plastic Binge “As Dangerous as Climate Change”. The Guardian. Available online: https://www.theguardian.com/environment/2017/jun/28/a-million-a-minute-worlds-plastic-bottle-binge-as-dangerous-as-climate-change (accessed on 28 June 2017).
  65. Etale, A.; Jobin, M.; Siegrist, M. Tap versus bottled water consumption: The influence of social norms, affect and image on consumer choice. Appetite 2018, 121, 138–146. [Google Scholar] [CrossRef]
  66. Geyer, R.; Jambeck, J.R.; Law, K.L. Production, use, and fate of all plastics ever made. Sci. Adv. 2017, 3, e1700782. [Google Scholar] [CrossRef]
  67. Rambonnet, L.; Vink, S.C.; Land-Zandstra, A.M.; Bosker, T. Making citizen science count: Best practices and challenges of citizen science projects on plastics in aquatic environments. Mar. Pollut. Bull. 2019, 145, 271–277. [Google Scholar] [CrossRef] [PubMed]
  68. Drzyzga, O.; Prieto, A. Plastic waste management, a matter for the “community”. Microb. Biotechnol. 2018, 12, 66–68. [Google Scholar] [CrossRef]
  69. Meng, Q.J.; Ji, Q.; Zhang, Y.G.; Liu, D.; Grossnickle, D.M.; Luo, Z.X. An arboreal docodont from the Jurassic and mammaliaform ecological diversification. Science 2015, 347, 764–768. [Google Scholar] [CrossRef]
  70. Cózar, A.; Sanz-Martín, M.; Martí, E.; González-Gordillo, J.I.; Ubeda, B.; Gálvez, J.Á.; Irigoien, X.; Duarte, C.M. Plastic accumulation in the Mediterranean Sea. PLoS ONE 2015, 10, e0121762. [Google Scholar] [CrossRef]
  71. Dilkes-Hoffman, L.S.; Lane, J.L.; Grant, T.; Pratt, S.; Lant, P.A.; Laycock, B. Environmental impact of biodegradable food packaging when considering food waste. J. Clean. Prod. 2018, 180, 325–334. [Google Scholar] [CrossRef]
  72. Faraca, G.; Astrup, T. Plastic waste from recycling centres: Characterisation and evaluation of plastic recyclability. Waste Manag. 2019, 95, 388–398. [Google Scholar] [CrossRef]
  73. De Marchi, E.; Pigliafreddo, S.; Banterle, A.; Parolini, M.; Cavaliere, A. Plastic packaging goes sustainable: An analysis of consumer preferences for plastic water bottles. Environ. Sci. Policy 2020, 114, 305–311. [Google Scholar] [CrossRef]
  74. Calver, G. What Is Packaging Design? RotoVision: Leinfelden-Echterdingen, Germany, 2004. [Google Scholar]
  75. Sustainability|Meaning in the Cambridge English Dictionary. Cambridge Dictionary; Cambridge University Press: Cambridge, UK, 2019. Available online: https://dictionary.cambridge.org/dictionary/english/sustainability (accessed on 16 April 2025).
  76. Sustainable Packaging Coalition. About Us—Sustainable Packaging Coalition. Available online: https://sustainablepackaging.org/about-us (accessed on 12 May 2025).
  77. Bumbudsanpharoke, N.; Ko, S. Packaging technology for home meal replacement: Innovations and future prospective. Food Control 2022, 132, 108470. [Google Scholar] [CrossRef]
  78. Georgakoudis, E.D.; Tipi, N.S.; Bamford, C.G. Packaging redesign—Benefits for the environment and the community. Int. J. Sustain. Eng. 2018, 11, 307–320. [Google Scholar] [CrossRef]
  79. Wever, R.; Vogtländer, J. Eco-efficient value creation: An alternative perspective on packaging and sustainability. Packag. Technol. Sci. 2012, 26, 229–248. [Google Scholar] [CrossRef]
  80. Bjørn, A.; Hauschild, M.Z. Absolute versus relative environmental sustainability. J. Ind. Ecol. 2012, 17, 321–332. [Google Scholar] [CrossRef]
  81. Niero, M.; Hauschild, M.Z.; Hoffmeyer, S.B.; Olsen, S.I. Combining eco-efficiency and eco-effectiveness for continuous loop beverage packaging systems: Lessons from the Carlsberg Circular Community. J. Ind. Ecol. 2017, 21, 742–753. [Google Scholar] [CrossRef]
  82. Yokokawa, N.; Amasawa, E.; Hirao, M. Design assessment framework for food packaging integrating consumer preferences and environmental impact. Sustain. Prod. Consum. 2021, 27, 1514–1525. [Google Scholar] [CrossRef]
  83. Keller, J.; Scagnetti, C.; Albrecht, S. The relevance of recyclability for the life cycle assessment of packaging based on design for life cycle. Sustainability 2022, 14, 4076. [Google Scholar] [CrossRef]
  84. Svanes, E.; Vold, M.; Møller, H.; Pettersen, M.K.; Larsen, H.; Hanssen, O.J. Sustainable packaging design: A holistic methodology for packaging design. Packag. Technol. Sci. 2010, 23, e887. [Google Scholar] [CrossRef]
  85. Vazquez, Y.V.; Dutari, T.; Castillo, L.A.; Barbosa, S.E. Ecodesign approach for plastic minimization in shampoo bottles. Packag. Technol. Sci. 2023, 36, 823–831. [Google Scholar] [CrossRef]
  86. Gavazzi, P.; Dobrucka, R.; Przekop, R. Current trends in the German packaging industry. Logforum 2022, 18, 27–33. [Google Scholar] [CrossRef]
  87. Jagoda, S.U.M.; Gamage, J.R.; Karunathilake, H.P. Environmentally sustainable plastic food packaging: A holistic life cycle thinking approach for design decisions. J. Clean. Prod. 2023, 400, 136680. [Google Scholar] [CrossRef]
  88. Thakker, V.; Bakshi, B.R. Ranking eco-innovations to enable a sustainable circular economy with net-zero emissions. ACS Sustain. Chem. Eng. 2023, 11, 1363–1374. [Google Scholar] [CrossRef]
  89. Landi, D.; Cicconi, P.; Germani, M. Analyzing the environmental sustainability of packaging for household appliances: A test case. Procedia CIRP 2020, 90, 355–360. [Google Scholar] [CrossRef]
  90. Tiseo, I. PET Global Bottle Production 2021. Statista. Available online: https://www.statista.com/statistics/723191/production-of-polyethylene-terephthalate-bottles-worldwide (accessed on 12 September 2023).
  91. Patel, U. Aluminium vs. Plastic: Who’ll Win the Water Bottle War? Wood Mackenzie. Available online: https://www.woodmac.com/news/feature/aluminium-vs-plastic-who-will-win-the-water-bottle-war (accessed on 3 September 2019).
  92. Plastics Information Europe. Polymer Prices—Plastics Information Europe. PIE Web. Available online: https://pieweb.plasteurope.com/Default.aspx?pageid=199&docid=24983 (accessed on 4 May 2023).
  93. Ellen MacArthur Foundation; McKinsey Company; World Economic Forum. The New Plastics Economy: Rethinking the Future of Plastics. Available online: https://ellenmacarthurfoundation.org/the-new-plastics-economy-rethinking-the-future-of-plastics (accessed on 3 December 2016).
  94. Yun, B.; Bisquert, P.; Buche, P.; Croitoru, M.; Guillard, V.; Thomopoulos, R. Choice of environment-friendly food packagings through argumentation systems and preferences. Ecol. Inform. 2018, 48, 24–36. [Google Scholar] [CrossRef]
  95. European Environment Agency. Special Report: The Polluter Pays Principle. Available online: https://www.eca.europa.eu/Lists/ECADocuments/SR21_12/SR_polluter_pays_principle_EN.pdf (accessed on 6 June 2021).
Figure 1. Initial bottle illustration.
Applsci 15 08289 g001
Figure 2. Final bottle illustration.
Applsci 15 08289 g002
Figure 3. Total height open interval.
Applsci 15 08289 g003
Figure 4. Total radius open interval.
Applsci 15 08289 g004
Figure 5. Material volume reduction based on packaging redesign.
Applsci 15 08289 g005
Figure 6. Packaging redesign: Environmental and economic benefits.
Applsci 15 08289 g006
Table 1. Mathematical relations.
Total Height (mm) Radius (mm) Bottle Shoulder (mm) Neck (mm) Area (m2)
Initial BottleFinal BottleInitial BottleFinal BottleInitial BottleFinal BottleInitial BottleFinal Bottle
2158031.547.6956420190.04275250.0394616
215 189.957131.544.9785420190.04275250.0393278
2159031.544.9678420190.04275250.0393278
21510031.542.6602420190.04275250.0394328
21511031.540.6749420190.04275250.0397015
21512031.538.9433420190.04275250.0400853
21513031.537.4155420190.04275250.0405513
21514031.536.0545420190.04275250.0410766
21515031.534.8319420190.04275250.0416453
21516031.533.7259420190.04275250.0422455
215 2168.1631.532.8975420190.04275250.0427525
21517031.532.7189420190.04275250.0428685
21518031.531.7971420190.04275250.0435081
21519031.530.949420190.04275250.0441591
21520031.530.1653420190.04275250.0448181
21521031.529.4384420190.04275250.0454819
21522031.528.7615420190.04275250.0461485
21523031.528.1293420190.04275250.046816
1 Optimum solution—Comparison between the two configurations. The production of the final bottle requires 8.011% less material. 2 Zero-gain solution—Both configurations have the same volume (0.000577706 m3) and the same surface area (0.0427525 m2).
Disclaimer/Publisher’s Note: The statements, opinions and data contained in all publications are solely those of the individual author(s) and contributor(s) and not of MDPI and/or the editor(s). MDPI and/or the editor(s) disclaim responsibility for any injury to people or property resulting from any ideas, methods, instructions or products referred to in the content.

