Article

Chemometric Classification of Feta Cheese Authenticity via ATR-FTIR Spectroscopy

by
Lamprini Dimitriou
1,
Michalis Koureas
2,
Christos S. Pappas
3,
Athanasios Manouras
4,
Dimitrios Kantas
1 and
Eleni Malissiova
1,*
1
Food of Animal Origin Laboratory, Animal Science Department, University of Thessaly, 41221 Larisa, Greece
2
Laboratory of Hygiene and Epidemiology, Faculty of Medicine, University of Thessaly, 41222 Larisa, Greece
3
Laboratory of Chemistry, Department of Food Science and Human Nutrition, Agricultural University of Athens, 11855 Athens, Greece
4
Laboratory of Food Chemistry, Biochemistry and Technology, Nutrition and Dietetics Department, University of Thessaly, 42132 Trikala, Greece
*
Author to whom correspondence should be addressed.
Appl. Sci. 2025, 15(15), 8272; https://doi.org/10.3390/app15158272
Submission received: 23 June 2025 / Revised: 22 July 2025 / Accepted: 23 July 2025 / Published: 25 July 2025

Abstract

The authenticity of Protected Designation of Origin (PDO) Feta cheese is critical for consumer confidence and market integrity, particularly in light of widespread concerns over economically motivated adulteration. This study evaluated the potential of Attenuated Total Reflectance–Fourier Transform Infrared (ATR-FTIR) spectroscopy combined with chemometric modeling to differentiate authentic Feta from non-Feta white brined cheeses. A total of 90 cheese samples, consisting of verified Feta and cow milk cheeses, were analyzed in both freeze-dried and fresh forms. Spectral data from raw, first derivative, and second derivative spectra were analyzed using principal component analysis–linear discriminant analysis (PCA-LDA) and Partial Least Squares Discriminant Analysis (PLS-DA) to distinguish authentic Feta from non-Feta cheese samples. Derivative processing significantly improved classification accuracy. All classification models performed relatively well, but the PLS-DA model applied to second derivative spectra of freeze-dried samples achieved the best results, with 95.8% accuracy, 100% sensitivity, and 90.9% specificity. The most consistently highlighted discriminatory regions across models included ~2920 cm−1 (C–H stretching in lipids), ~1650 cm−1 (Amide I band, corresponding to C=O stretching in proteins), and the 1300–900 cm−1 range, which is associated with carbohydrate-related bands. These findings support ATR-FTIR spectroscopy as a rapid, non-destructive tool for routine Feta authentication. The approach offers promise for enhancing traceability and quality assurance in high-value dairy products.

1. Introduction

Feta cheese holds a central place in Greece’s culinary tradition and remains one of the country’s most widely recognized food exports. Recognized as a Protected Designation of Origin (PDO) product by the European Union (Regulation EC 1829/2002) [1], Feta is not only linked to Greece’s cultural identity, but also supports a substantial part of the Greek livestock sector and contributes notably to the national agri-food economy [2].
Authentic Feta is produced exclusively from sheep’s milk, or a mixture of sheep’s and up to 30% goat’s milk, sourced from animals raised in specific regions of Greece under defined feeding and husbandry conditions [3]. Its distinctive profile results from the specificity of the raw materials and the traditional methods of production and maturation, which impart characteristic organoleptic and physicochemical properties. According to recent compositional studies on commercial PDO Feta products, the cheese typically contains 45–60% moisture, 21–25% fat (in total weight), and 14–50% protein, depending on milk origin and processing conditions [4,5]. The lipid fraction of Feta consists predominantly of short- and medium-chain fatty acids, while its protein matrix includes caseins and whey proteins, whose structure is influenced by enzymatic coagulation and brine aging. Additionally, the salt content typically exceeds 2.5%, contributing both to microbial stability and to its distinct sensory profile.
The differentiation of white brined cheeses, such as Greek Feta and similar products made from cow’s or goat’s milk, is significant for consumer protection as well as for ensuring product quality and regulatory compliance. PDO cheeses like Feta carry a high added value and are subject to strict compositional and production standards [6]. Adulteration with lower-cost raw materials not only compromises product quality but also undermines consumer trust and places compliant producers at a competitive disadvantage.
Economically, the global cost of food fraud has been estimated to range from USD 10 to 65 billion per year, affecting both consumer confidence and supply chain integrity [7]. Within the European Union, the sales value of GI-protected cheeses such as Feta was estimated at EUR 6.3 billion in 2010, with an annual consumer loss of approximately EUR 644.7 million attributed to GI infringement [8]. These data highlight the pressing need for reliable, efficient, and field-deployable methods to verify authenticity and support regulatory enforcement.
Recent research has shown that despite the strict regulatory framework governing its production, Feta remains susceptible to adulteration, most notably through the inclusion of cow’s milk or vegetable fats. An investigation by Pidiaki, Manouras, and Malissiova (2016) reported that 14 out of 34 samples were found to be adulterated with cow’s milk [9]. These practices aim to reduce production costs but significantly compromise the product’s quality, nutritional value, and authenticity, while undermining consumer trust and disadvantaging compliant producers.
In recent years, the scientific community has underscored the importance of authenticating PDO products, particularly Feta, using advanced analytical techniques. Studies such as those by Stefos et al. (2024) and Ganopoulos et al. (2013) have employed molecular methods (e.g., Polymerase Chain Reaction, High-Resolution Melting) to detect bovine DNA in Feta samples [10,11]. Other research has focused on spectroscopic approaches (e.g., MALDI-TOF-MS, NIR) for purposes of authentication and quality control [12]. Attenuated Total Reflectance–Fourier Transform Infrared (ATR-FTIR) spectroscopy has emerged as a promising tool for the analysis of dairy products, offering a rapid, non-destructive, and cost-effective solution [13].
Several analytical platforms have been explored for this purpose, each with distinct strengths and limitations. Compared to molecular techniques such as PCR or HRM analysis, which require DNA extraction, species-specific primers, and thermal cycling, ATR-FTIR is reagent-free, non-destructive, and involves minimal sample preparation.
While MALDI-TOF-MS offers high-resolution identification of peptides and proteins and is widely used in microbiological analysis, it is less suitable for non-biological adulterants in complex food matrices and involves expensive instrumentation and trained personnel. NIR spectroscopy, on the other hand, enables fast and non-invasive screening with excellent repeatability but is less specific in heterogeneous samples, particularly when detecting low levels of adulteration [14]. In contrast, ATR-FTIR provides a favorable balance between specificity, speed, and practicality, making it particularly attractive for routine authenticity screening in quality assurance workflows [15]. Its operational simplicity, low per-sample cost, and potential for portable deployment further enhance its applicability.
With its ability to detect characteristic absorption spectra of compounds such as proteins, lipids, and carbohydrates, ATR-FTIR provides a chemical fingerprint of a sample’s composition. When combined with chemometric methods, it enables classification and quantitative estimation of adulterants—even at low concentrations [16]. Similar applications of ATR-FTIR spectroscopy have demonstrated successful performance in distinguishing PDO mozzarella [6] and in discriminating cheeses derived from different milk species [17], thereby supporting the reliability of this methodology across a broad range of white brined cheese production contexts. This spectroscopic technique has also been successfully applied to other cheese types, including Italian Pecorino [18], Turkish white cheese [19], and Halloumi [20], but existing studies on Feta have largely been limited to general compositional analysis or microbiological profiling, such as those by Tzora et al. (2021), Papadakis et al. (2021), and Bozoudi et al. (2016), without systematically addressing adulteration or developing robust chemometric authenticity models [21,22,23].
Despite its potential, ATR-FTIR spectroscopy has not been systematically applied to the authentication of PDO Feta. To our knowledge there are no previous studies that explored its use for reliably distinguishing authentic Feta from cheeses made with cow’s milk or other non-compliant ingredients. This highlights a clear gap in applied research focused on classification-based approaches for authenticity assessment, using spectral data and chemometric tools. Based on this context, the present study was designed around the following theoretical framework: (1) ATR-FTIR spectroscopy can capture chemical fingerprint information relevant to cheese composition, including signals from lipids, proteins, and carbohydrates; (2) chemometric classification models (PCA-LDA and PLS-DA) can effectively discriminate between complex spectral profiles from authentic and non-authentic cheese samples; and (3) freeze-drying and spectral preprocessing enhance spectral resolution and model performance. These assumptions guided the development and evaluation of a classification pipeline for the authentication of PDO Feta cheese.

2. Materials and Methods

2.1. Sample Collection, Preparation, and Storage

A total of 90 white cheese samples were collected between June and August 2024 from various local retail shops across Thessaly, Greece. The samples included 50 traditional Feta cheese samples and 40 non-Feta white brined cheese samples. A slightly higher number of Feta samples (n = 50) were collected to account for possible exclusions following ELISA-based adulteration screening. The non-Feta white brined cheeses were 100% cow milk-based, commercially available in local supermarkets, and verified via label inspection to lack any vegetable fat or milk blends. All samples were transported to the laboratory in a cooled container with ice packs to maintain refrigeration conditions. Upon arrival, each sample was subjected to visual and olfactory inspection to ensure suitability for analysis.
Approximately 30–50 g of each cheese sample was homogenized manually using a sterile knife and glass rod to achieve a uniform texture. Following homogenization, the sample was divided into two equal portions.
One portion was analyzed raw, while the other underwent freeze-drying using a BIOBASE Freeze Dryer (Model: BK-FD10P, BIOBASE Group, Jinan, China). The samples were first frozen at −50 °C for 2 h. Then, they were dried under vacuum at a pressure of 50 Pa for about 48 h, with the temperature gradually increasing from −50 °C to −20 °C. A final drying step was carried out at +25 °C for 12 h to remove remaining moisture. Although moisture was not measured after drying, the freeze-drying conditions used are commonly known to reduce water content below 2% in cheese, ensuring stable and reproducible FTIR spectra [24,25,26,27]. All samples (raw and freeze-dried) were stored at −18 °C until further analysis. Before FTIR scanning, frozen samples were thawed slowly in the fridge for 24 h. Freeze-dried samples were checked visually to confirm complete drying.

2.2. Enzyme-Linked Immunosorbent Assay (ELISA)

To verify the authenticity of the Feta cheese samples, a cow milk-specific ELISA was performed using the Bio-Shield Cow Cheese ELISA Kit (ProGnosis Biotech S.A., Larissa, Greece, Cat. No. B0348), which is designed for the detection of cow’s milk in brined soft cheeses. The assay targets bovine IgG and was carried out in duplicate for each sample, following the manufacturer’s instructions. Absorbance was measured at 450 nm using a microplate spectrophotometer (Multiskan™ FC, Thermo Fisher Scientific Inc., Waltham, MA, USA).
The method exhibits a limit of detection (LOD) of 0.04% and a limit of quantification (LOQ) of 0.10%, with 100% recovery, according to the product specifications. The intra-assay precision at the 1% adulteration level was 5.5%. The assay demonstrates very high specificity, with cross-reactivity below 0.01% for both sheep and goat immunoglobulins, and 3.2% for buffalo IgG, effectively minimizing false positives from non-target milk species. These characteristics render the method highly suitable for detecting bovine adulteration in Protected Designation of Origin (PDO) products such as Feta. Therefore, any sample exhibiting bovine milk protein levels above the LOQ (0.10%) was considered adulterated with cow’s milk. While the assay exhibits 3.2% cross-reactivity with buffalo IgG, the likelihood of interference from buffalo milk is negligible, as this milk type is not widely produced or used in Greece and is significantly costlier than cow’s milk, which is the primary source of economically motivated adulteration [12,28,29,30].

2.3. Instrumental Analysis

FTIR measurements were performed using a Nicolet 6700 FT-IR Spectrometer (Thermo Fisher Scientific), equipped with a Deuterated Triglycine Sulfate (DTGS) detector and operated through OMNIC software (version 9.1.24). Each sample was analyzed in triplicate (n = 3), and the mean spectrum was used for further processing. A small quantity of sample was applied onto the diamond crystal of the Attenuated Total Reflectance (ATR) accessory (Smart iTR, Thermo Fisher Scientific), ensuring full and uniform sample–crystal contact. Between measurements, the ATR crystal was thoroughly cleaned with ethanol and deionized water to prevent contamination. Spectral data were collected in the mid-infrared region (4000–525 cm−1) using air as background. Instrument parameters included 32 scans per sample, 4 cm−1 resolution, and absorbance mode. Prior to sample measurements, a background spectrum was recorded to account for instrument and environmental effects. A 30 min warm-up period preceded spectral acquisition to ensure detector stability. The total analysis time was under 6 min per sample (including triplicate measurements and surface cleaning), and the method required minimal sample amounts, making it highly cost-efficient compared to molecular or chromatographic techniques.

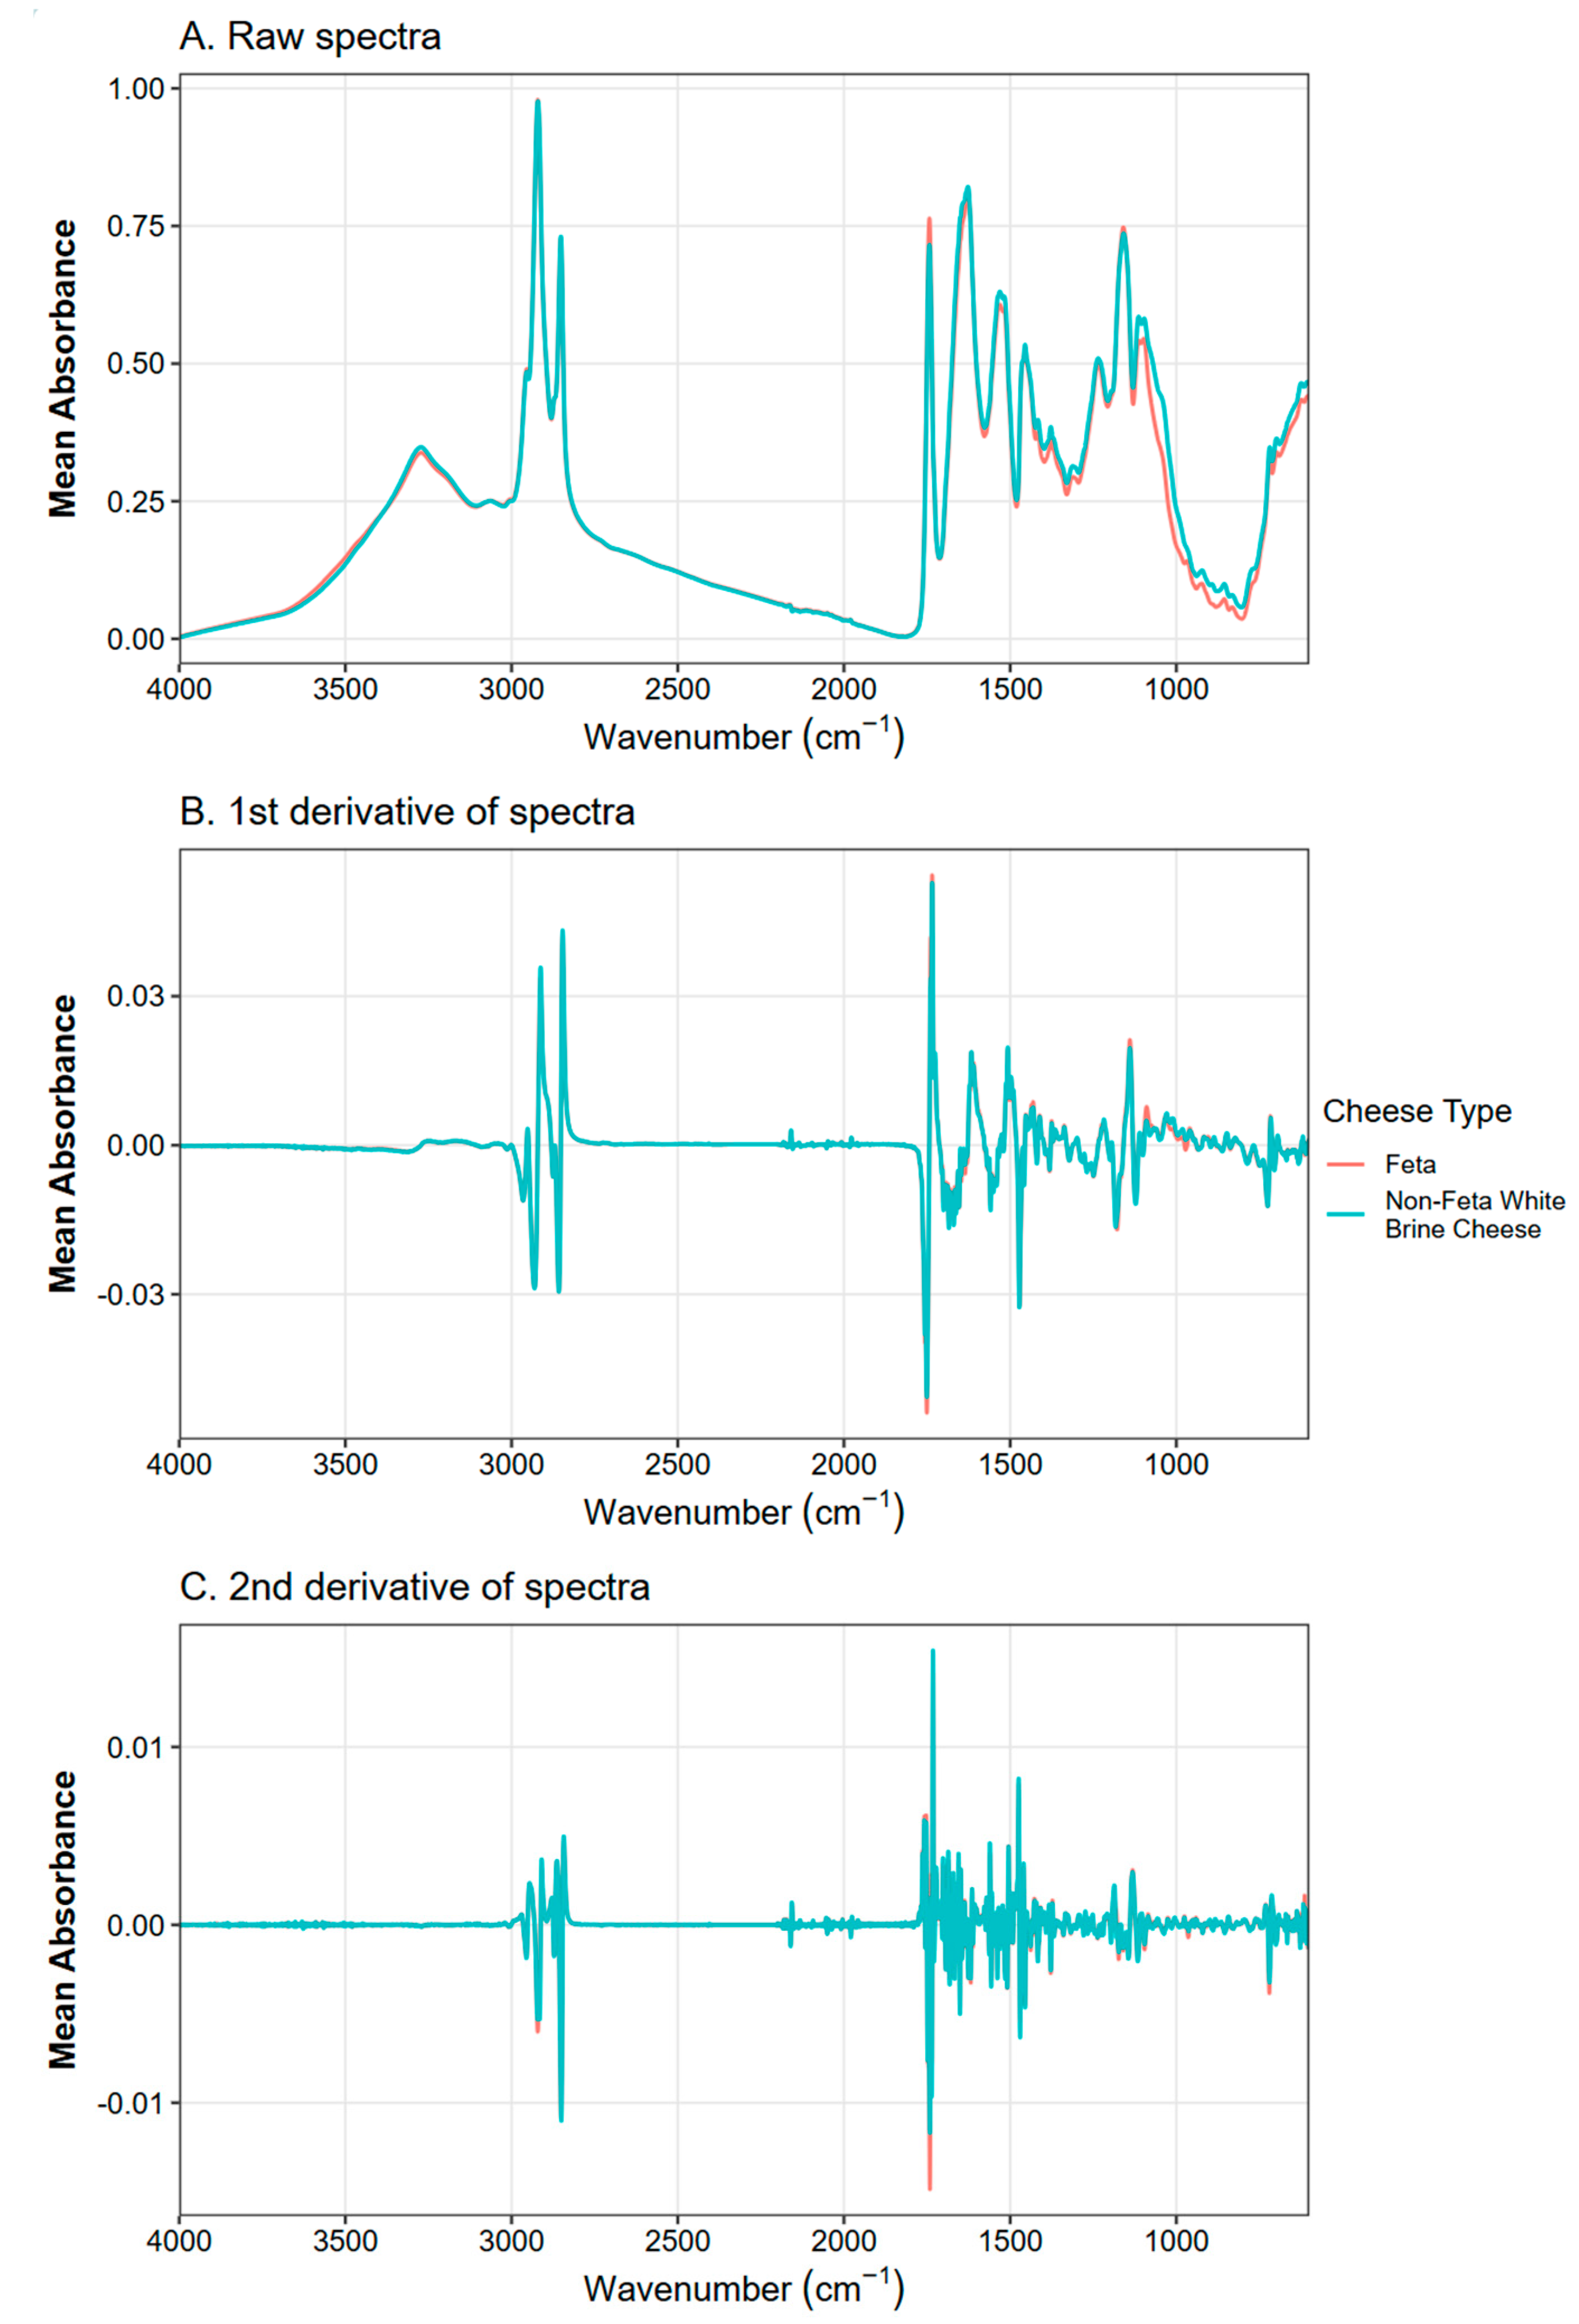
2.4. Spectral Processing

Preprocessing of the FTIR spectra was performed to enhance signal clarity and ensure comparability across samples. Using the OMNIC software’s Macros/Basic tools, preprocessing steps included baseline correction, automatic smoothing, scale normalization, and adjustment of display limits. Processed spectra were then exported as CSV files containing wavenumber (cm−1) and absorbance values. For visualization, both individual and mean absorbance spectra per group (Feta, non-Feta white brined cheese) were plotted against the corresponding wavenumbers. Spectral regions below 600 cm−1 were excluded from all analyses. Samples flagged as adulterated by ELISA results were removed from the dataset. For each sample, absorbance values were ordered by increasing wavenumber and three signal representations (raw, first derivative, second derivative) were computed, as shown in Table 1.

2.5. Classification Models

Classification models were developed separately for both freeze-dried and non-freeze-dried cheese samples to assess the performance across sample states. The procedures described below were applied identically to both datasets.

2.5.1. Principal Component Analysis–Linear Discriminant Analysis

For each of the three signal types (raw absorbance, first derivative, second derivative), a principal component analysis (PCA) was performed using centered, scaled variables. The first two principal component scores were extracted and plotted with 95% confidence ellipses to visualize group separation, and a scree plot of the percentage variance explained by the first ten components was generated to assess dimensionality.
A train/test split (70/30) was applied to each signal matrix. On the training portion, linear discriminant analysis (LDA) models were trained under repeated 10-fold cross-validation (five repeats). The number of principal components retained (from 1 to 10) was treated as a tuning parameter; for each candidate dimension, the model’s ROC-AUC (Receiver Operating Characteristic curve—Area Under the Curve), sensitivity, and specificity were recorded. The optimal component number was selected by the highest cross-validated ROC-AUC. This best PCA-LDA configuration was then applied to the test set. Test-set predictions yielded a confusion matrix from which sensitivity, specificity, and accuracy were computed, and class-probability scores were used to calculate ROC-AUC.

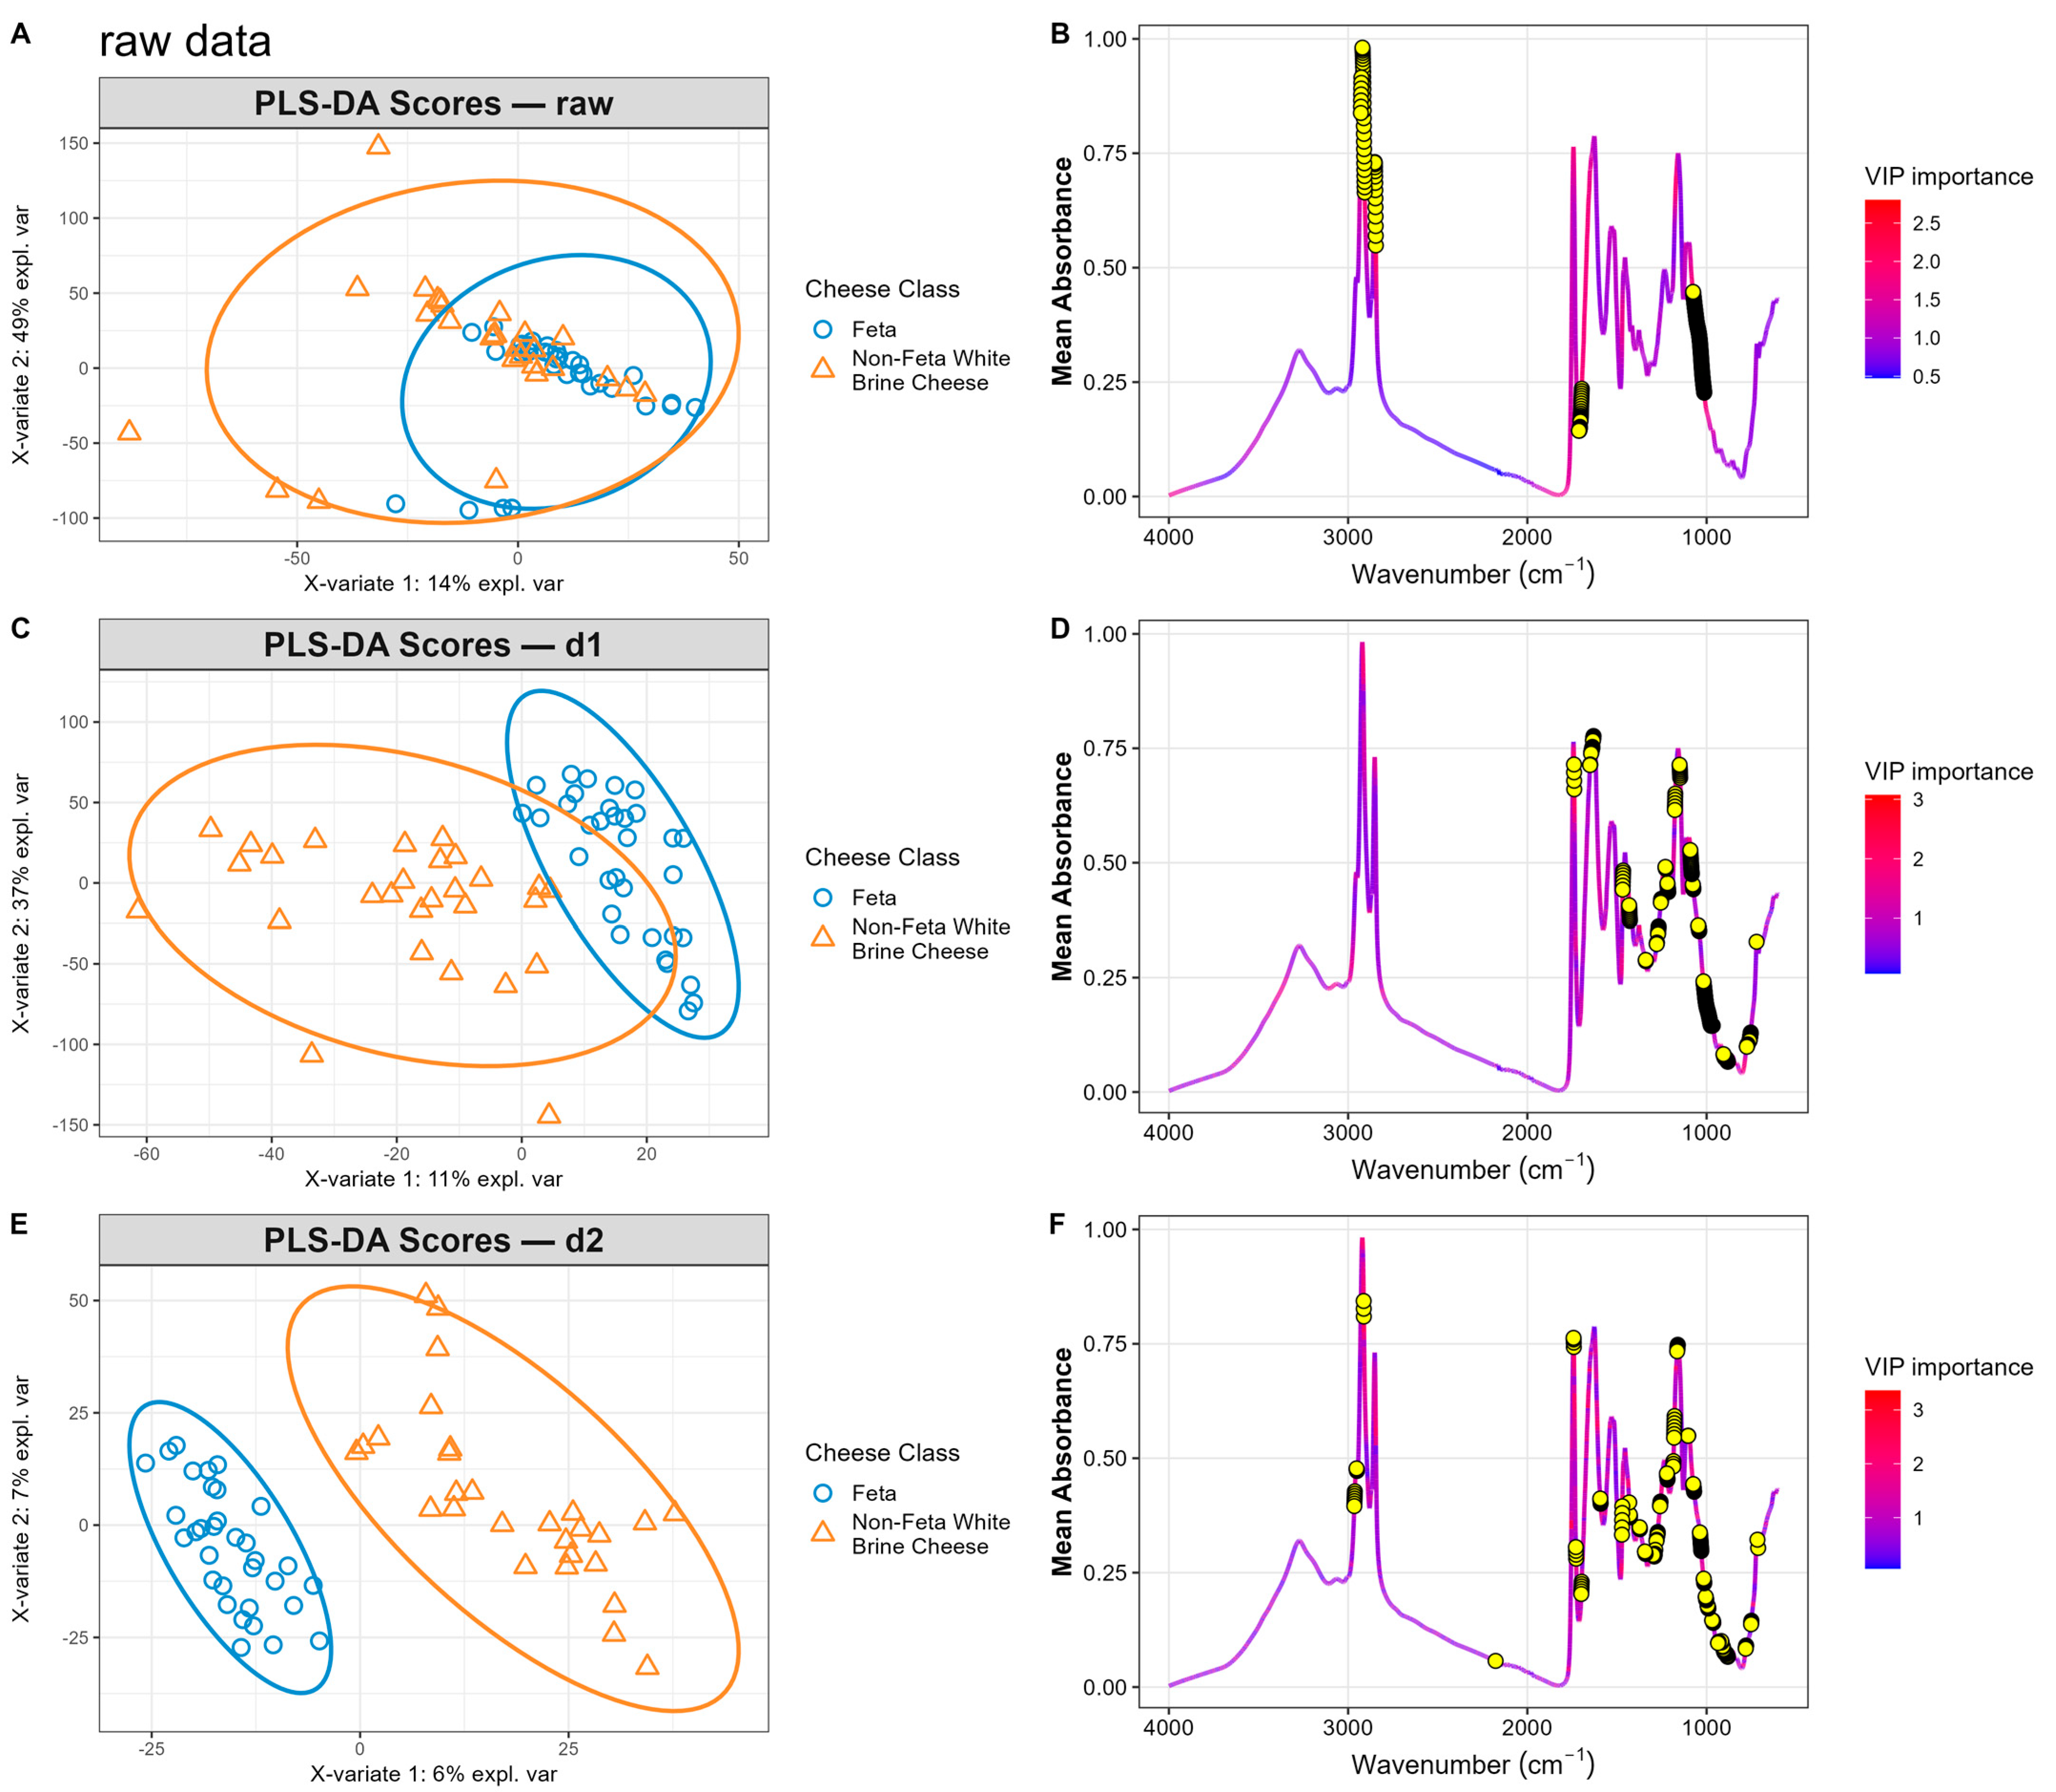
2.5.2. Partial Least Squares Discriminant Analysis

The same train/test split (70/30) was applied, using stratified sampling to preserve class proportions. On the training set, partial least squares discriminant analysis (PLS-DA) was performed with up to ten latent components. Model performance was evaluated by ten-fold cross-validation, repeated ten times, using balanced error rate (BER) as the selection criterion. The optimal number of components minimizing BER was chosen for the final PLS-DA model. Scores on the first two latent variables were plotted, and sample classification was assessed via maximum-distance prediction. Receiver operating characteristic (ROC) curves and confusion matrices quantified AUC, sensitivity, specificity, and accuracy in both the training and test sets. To interpret the results, variable importance in projection (VIP) scores were computed for the selected model, smoothed with a moving average, and merged with mean absorbance to identify key spectral regions, which were highlighted in a VIP spectrum plot. The process was repeated for the raw spectra and the first and second derivative spectra.

3. Results

3.1. ELISA Screening for Cow’s Milk Adulteration in Feta Samples

The ELISA screening for cow’s milk adulteration in Feta samples confirmed the authenticity of the majority of specimens. Out of the fifty Feta samples analyzed using the Bio-Shield Cow Cheese ELISA kit, only four were found to contain detectable levels of bovine milk proteins above the method’s quantification limit (LOQ = 0.10%), and were therefore excluded from the spectral dataset used for chemometric modeling. The exclusion of suspect samples ensured that the FTIR models were trained exclusively on verified authentic Feta specimens, enhancing the reliability and interpretability of classification outcomes. As a result, a total of 86 samples (46 authentic Feta and 40 non-Feta white brined cheeses) were retained and used in all subsequent chemometric modeling.

3.2. Exploratory Analysis

The initial assessment of the FTIR spectra revealed consistent patterns across cheese categories, with notable absorbance features characteristic of protein, lipid, and carbohydrate functional groups. Figure 1 presents the FT-IR spectra of freeze-dried samples of Feta and non-Feta white brined cheeses for the different expressions. Figure 1A displays the mean raw spectra for all samples, with strong absorption bands observed near 3300 cm−1 (O–H and N–H stretching), 2920 cm−1 (C–H asymmetric stretching in lipids), and in the fingerprint region between 1800 and 600 cm−1, where Amide I, Amide II, ester carbonyl, and C–O/C–N stretching are apparent. The raw absorbance curves for Feta and non-Feta white brined cheeses are largely similar, reflecting the shared major functional groups, and visual inspection cannot reliably distinguish the two classes. The most intense bands and the broad fingerprint region appear nearly identical between groups, with minor differences in the carbonyl (~1745 cm−1) and CH2 bending (~1460 cm−1) regions. The first derivative (Figure 1B) and the second derivative (Figure 1C) reveal minor differences. However, the derivatives helped sharpen peak shapes and uncover less prominent features—particularly within the complex fingerprint region (1800–600 cm−1). For instance, improved definition is visible in the Amide I–II region (~1700–1500 cm−1) and in parts of the spectrum between 1300 and 1000 cm−1. A comparable spectral overview was also performed for fresh (non-freeze-dried) samples, which also exhibited similar absorbance patterns across the same wavenumber regions. Although slight baseline fluctuations were observed—likely due to higher moisture content—the overall spectral structure remained consistent. A summary figure is included in the Supplementary Materials (Supplementary Figure S1). The higher classification accuracy obtained with freeze-dried samples (e.g., PLS-DA accuracy = 95.8% vs. 85% for fresh samples) is most likely due to the removal of water, which reduces the broad O–H absorption around 3300 cm−1 and lowers baseline noise. Moisture elimination also improves sample homogeneity and baseline stability, thereby enhancing the contrast of key lipid, protein, and carbohydrate bands in the fingerprint region. These factors collectively give clearer, more reproducible spectra and facilitate better model discrimination.
Principal component analysis was conducted to explore potential clustering patterns among the cheese samples using raw, first derivative, and second derivative FTIR spectra. As shown in Figure 2A,C,E, there was no distinct separation between Feta and non-Feta white brined cheese samples under any preprocessing condition. Although PC1 captured a substantial proportion of the total variance in the raw spectra (62.0%), and less so in the derivative transformations (42.1% and 12.6%, respectively), this variance did not translate into clear group separation in the PC score plots. The substantial overlap between classes across all preprocessing modes was observed, indicating that unsupervised PCA alone is insufficient to discriminate cheese types based on FTIR data. These findings justify the application of supervised classification methods for more effective group differentiation. A similar lack of class separation was observed in the PCA of non-freeze-dried samples (Supplementary Figure S2).

3.3. Classification Models

Supervised classification using PCA followed by linear discriminant analysis (PCA-LDA) demonstrated strong discriminative power across all preprocessing strategies (Table 2). Model performance improved progressively from raw spectra to first- and second derivative representations. Using raw spectra with 10 principal components, the model achieved a training AUC of 0.849 and a test AUC of 0.916. However, while sensitivity was perfect on the test set, specificity dropped to 0.545, suggesting a tendency to misclassify non-Feta cheeses as Feta. However, derivative preprocessing significantly enhanced model performance. When using the first derivative, the model with nine PCs achieved 100% sensitivity and nearly 82% specificity, with an overall accuracy of almost 92%. Second derivative preprocessing produced the best training performance (AUC = 0.980), with similarly high-test sensitivity and specificity. These results confirm that applying spectral derivatives enhances class-separating features while reducing overfitting risk, indicating that PCA-LDA is a reliable approach for distinguishing Feta from non-Feta white brined cheeses.
Partial least squares discriminant analysis (PLS-DA) yielded high classification performance across all spectral preprocessing methods, with notable improvements when using derivative spectra (Table 3). The model based on raw spectra (eight latent variables) achieved a high AUC in the training set (0.992), with a sensitivity and specificity of 0.970 and 0.929, respectively. However, performance dropped on the test set, where the AUC was 0.874 and specificity decreased to 0.818, suggesting modest overfitting. First derivative preprocessing resulted in a more compact model (three latent variables) and perfect training performance (AUC = 1.000). On the test set, sensitivity remained at 1.000, though specificity declined to 0.727, indicating improved detection of Feta samples but more frequent misclassification of non-Feta cheeses. Second derivative preprocessing provided the most balanced and robust results. The model, with nine latent variables, showed perfect training classification and sustained strong performance on the test set, with AUC = 0.958, sensitivity = 1.000, specificity = 0.909, and overall accuracy of 95.8%. It should be noted that while the choice of nine latent variables (LVs) was based on minimizing the balanced error rate (BER), a model with only two LVs also performed very well on the training set, showing only marginally lower accuracy. This suggests that similar classification power might be achieved with a simpler model, depending on application needs. These results indicate that second derivative transformation enhances discriminative spectral features and generalization capability in PLS-DA models. Although freeze-dried samples offered improved classification performance, comparable accuracy levels were also achieved using fresh samples, as shown in the Supplementary Materials. This supports the method’s flexibility for rapid screening applications without necessitating extended pretreatment when time constraints exist. PLS-DA score plots for the train set (Figure 3A,C,E) show projections of the first two latent variables derived from models built on raw, first derivative, and second derivative spectra, respectively. The degree of separation between Feta and non-Feta white brined cheese samples improved with spectral preprocessing. In the raw spectra (Figure 3A), moderate class overlap remained evident. First derivative preprocessing (Figure 3C) showed clearer group boundaries, while second derivative preprocessing (Figure 3E) produced the most distinct clustering, with minimal overlap between groups. VIP score profiles (Figure 3B,D,F) consistently highlighted spectral regions important for classification.
A complementary classification analysis was also performed using fresh (non-freeze-dried) cheese samples. In these samples, lower overall performance metrics in both PCA-LDA and PLS-DA models were observed. Similarly, when derivative preprocessing was applied, the performance improved, achieving high sensitivity and moderate specificity. Full performance metrics, along with relevant classification figures for the fresh dataset, are provided in the Supplementary Material (Supplementary Tables S1 and S2 and Figures S1 and S2).

4. Discussion

This study confirms the effectiveness of ATR-FTIR spectroscopy combined with chemometric modeling (PCA-LDA, PLS-DA) for differentiating authentic PDO Feta from other white brined cheeses. Spectral preprocessing—especially the use of derivatives—enhanced the resolution of critical features, particularly in the fingerprint region, improving the models’ discriminatory power. Freeze-dried samples yielded higher classification performance, compared to fresh samples. In freeze-dried samples, models based on second derivative spectra achieved AUC values above 0.95 and test-set accuracies exceeding 95%. Similar studies have reported comparable success using derivative-enhanced FTIR data for cheese authentication. For example, Ayvaz et al. (2021) and Spognardi et al. (2018) demonstrated high discrimination accuracy in PDO mozzarella and kasseri cheese, respectively, highlighting the generalizability of the method to various protected dairy products [6,17]. Regarding milk origin, Tarapoulouzi et al. (2024) [31] reported perfect classification between cow versus goat/sheep milk cheeses (49 samples, Orthogonal Partial Least Squares Discriminant Analysis [OPLS-DA] 100% accuracy) and noted the remaining issue of discriminating goat from sheep cheese. Similarly, a study on Ricotta whey cheese applied FTIR and SPORT-LDA to classify samples by milk source, demonstrating robust separation between cow versus small ruminant milk [32]. Our results support previous findings and further extend them by specifically focusing on brined cheeses, with particular emphasis on Feta cheese. Furthermore, studies on pure milk samples identified routine band differences, such as enhanced CH2, Amide I/II, and lactose bands in sheep, cow, and goat milk, forming spectral foundations consistent with cheese differentiation [33].
PLS-DA models generally outperformed PCA-LDA, achieving higher classification accuracy on the test set (0.958 vs. 0.917, respectively). This aligns with the strengths of PLS-DA in handling collinear and high-dimensional spectral data. In addition, PLS-DA models maintained excellent performance even with a small number of latent variables, indicating that the models were not overly complex. PCA-LDA, while simpler and computationally less intensive, still achieved acceptable performance, particularly when second derivative spectra were used. PLS-DA also offered better interpretability through variable importance in projection (VIP) scores, which provided direct insight into key discriminatory features. Overall, while both approaches were effective, PLS-DA demonstrated greater robustness and adaptability for spectral classification in this context.
Also, it was observed that freeze-drying of samples had a substantial effect on the model’s performance. In PLS-DA models applied to second derivative spectra, freeze-dried samples achieved 95.8% test accuracy and 90.9% specificity, compared to 89.0% accuracy in raw samples (see Supplementary Table S2). A similar trend was observed in PCA-LDA results (91.7% vs. 81.5% accuracy), supporting the claim that freeze-drying improves spectral definition and classification performance.
The improved classification performance observed in freeze-dried samples is likely due to enhanced spectral clarity resulting from the removal of water content. Water strongly absorbs in the mid-infrared region, especially around ~3300 cm−1 (O–H stretching) and ~1600 cm−1 (H–O–H bending), which can obscure weaker but informative signals. Lyophilization minimizes this interference, leading to better-resolved bands for proteins, lipids, and carbohydrates. Additionally, freeze-drying improves sample homogeneity by removing structural water and reducing surface variability, which likely enhances the reproducibility and discriminative power of the FTIR measurements.
Partial least squares discriminant analysis of FTIR data highlighted several spectral regions that contributed to distinguishing Feta from other white brined cheeses. Key features were associated with protein amide bands, carbohydrate linkages, phosphate groups, and lipid structures. All preprocessing methods identified strong discriminant bands near ~2920 cm−1 (C–H stretching in lipids), ~1650 cm−1 (Amide I from proteins), and within the 1300–900 cm−1 region. Interestingly, the use of derivative spectra not only improved model performance but also emphasized different spectral regions as being most influential in distinguishing between classes. Derivative processing enhances the resolution of overlapping bands, making it easier to distinguish subtle features that are otherwise obscured in the raw spectrum. In complex samples like cheese, where signals heavily overlap, this can isolate smaller but relevant variations. Moreover, the derivative spectrum highlights rate-of-change in absorbance, which often corresponds to subtle changes in band shape—features that may be more diagnostic of compositional differences than absolute absorbance values.
Second derivative spectral variables with VIP scores exceeding 2 were observed primarily in the lipid (C=O at ~1740, CH2 at ~1450 cm−1) and protein-related regions (Amide III near ~1650, ~1540, and ~1240 cm−1), indicating that differences in fat and protein composition were the most discriminative features. These results are consistent with known compositional variations across cheese types and milk species. Patterns reflect the underlying chemical composition of the samples and align with markers of milk origin and processing. In particular, the region between 750 and 770 cm−1 can be attributed to aromatic C–H out-of-plane bending [34], likely originating from amino acids such as phenylalanine and tyrosine in casein and whey proteins [35]. The region around 880–930 cm−1 can also represent signals from aromatic amino acids and but also glycosidic C–O–C linkages in lactose [36]. Another notable region lies between 990 and 1075 cm−1, which is dominated by carbohydrate-related vibrations. This includes a prominent C–O stretching band near 1040 cm−1, commonly attributed to lactose in dairy products. In cheeses—particularly fresh white varieties—this region reflects residual lactose or other sugars, as well as C–O and O–H vibrations associated with organic acids such as lactic acid [37]. The 1160–1186 cm−1 region may represent a combination of ester and glycosidic C–O stretching, reflecting both milk fat and carbohydrate contributions. High VIP scores were consistently found in the 1200–1300 cm−1 window, where Amide III, phosphate, and fatty ester vibrations overlapped. Further discriminatory features were observed between 1427 and 1727 cm−1, including Amide I, aromatic ring modes, and ester carbonyls. The absorption band at ~1745 cm−1 corresponds to the C=O stretching vibration of ester functional groups in lipids, particularly triglycerides, as documented in studies on cheese and food matrices [13]. The high-wavenumber range 2952–2964 cm−1 corresponds to CH3 and CH2 asymmetric stretching—a reliable indicator of fatty acid chains in triglycerides. In general, comparable spectrochemical markers have been reported in studies of PDO mozzarella, where regions around ~1745, 2925–2850, and 1500–900 cm−1 were effective in discriminating milk origin [13,17,38].
Unlike prior FTIR-based studies which focused on general compositional profiling or microbiota analysis, the present work offers several novel contributions to the authentication of PDO Feta cheese. Specifically, the application of second derivative spectra combined with chemometric classification enabled the identification of unique discriminatory regions such as ~1040 cm−1 (C–O stretching in lactose and lactic acid), 1240–1300 cm−1 (Amide III and phosphate groups), and ~1745 cm−1 (C=O stretching in lipids). These spectral markers, highlighted through VIP score analysis, provide enhanced molecular resolution compared to raw spectra and have not been systematically employed for Feta classification to date. Furthermore, the use of freeze-drying as a preparatory step significantly improved spectral clarity and model performance, with classification accuracy exceeding 95%. These findings demonstrate methodological advancements in both spectral treatment and sample preparation, positioning this approach as a robust framework for non-destructive authenticity assessment of high-value dairy products.
While the findings of this study are encouraging, certain limitations should be acknowledged. The sample set, although representative, was limited in geographic diversity, which may affect broader generalizability. Additionally, external factors such as seasonal milk variation or specific processing differences were not systematically controlled. Nonetheless, the high classification accuracy across both freeze-dried and raw samples supports the robustness of the methodology. Future research should focus on expanding the dataset to include wider regional and seasonal variation, and explore the use of advanced machine learning techniques to further enhance model precision and adaptability for routine authenticity screening.
While this study focused on milk species adulteration, other forms of economic adulteration remain a concern. These include the use of vegetable fats to replace milk fat, the incorporation of non-local or non-certified sheep’s milk, and deviations from traditional maturation processes. Although not directly targeted in this study, the FTIR-based method is sensitive to changes in lipid and protein composition and may have broader utility in detecting such adulteration types. Future work could explore the method’s applicability in identifying non-dairy fat adulteration or verifying PDO-compliant production practices.

5. Conclusions

This study demonstrates the effectiveness of ATR-FTIR spectroscopy combined with supervised chemometric models (PCA-LDA and PLS-DA) as a robust, rapid, and non-destructive approach for verifying the authenticity of PDO Feta cheese. The results highlight the importance of both spectral preprocessing and sample preparation, with freeze-dried samples, particularly those analyzed using second derivative transformations, yielding the highest classification accuracy (95.8%), perfect sensitivity, and strong specificity.
Key discriminatory spectral regions included bands associated with lipids (~2920 and ~1745 cm−1), proteins (~1650 and 1540 cm−1), and carbohydrates (~1040–1060 cm−1), confirming the method’s ability to resolve subtle molecular differences between authentic and non-authentic cheese types.
Beyond its analytical performance, the approach offers practical advantages: it is rapid (requiring less than 6 min per sample), reagent-free, and uses minimal sample quantities, features that make it well-suited for routine quality control and authenticity verification in regulatory or industrial settings.
Future research should aim to validate the method on broader datasets, including seasonal, geographic, and adulterated samples, as well as mixed-milk cheeses. In parallel, the integration of advanced machine learning techniques and portable FTIR systems could facilitate real-time, in-field authentication, expanding the method’s applicability across the dairy supply chain.

Supplementary Materials

The following supporting information can be downloaded at: https://www.mdpi.com/article/10.3390/app15158272/s1, Figure S1: Mean FT-IR spectra and derivatives for raw cheeses; Figure S2: PCA score and scree plots for raw samples under raw, d1, and d2 preprocessing; Table S1: PCA-LDA metrics for raw samples; Table S2: PLS-DA metrics for raw samples.

Author Contributions

Conceptualization, E.M.; methodology, C.S.P., E.M., A.M. and D.K.; software, M.K.; validation, L.D. and M.K.; formal analysis, L.D.; investigation, E.M., M.K. and L.D.; resources, D.K. and E.M.; data curation, M.K. and L.D.; writing—original draft preparation, E.M., M.K. and L.D.; writing—review and editing, D.K., C.S.P., A.M. and E.M.; visualization, M.K.; supervision, E.M., C.S.P. and A.M.; project administration, E.M. All authors have read and agreed to the published version of the manuscript.

Funding

This research received no external funding.

Institutional Review Board Statement

Not applicable.

Informed Consent Statement

Not applicable.

Data Availability Statement

The data presented in this study are available on request from the corresponding author.

Acknowledgments

We would like to thank V. Kossyva from the Laboratory of Food Chemistry, Biochemistry and Technology, Department of Nutrition and Dietetics, for her valuable support in the freeze-drying of the samples. Special thanks also go to T. Xudia from the Laboratory of Foods of Animal Origin, Department of Animal Science, University of Thessaly, for her contribution to the ELISA analysis.

Conflicts of Interest

The authors declare no conflicts of interest.

Abbreviations

The following abbreviations are used in this manuscript:
ATR-FTIRAttenuated Total Reflectance–Fourier Transform Infrared Spectroscopy
PDOProtected Designation of Origin
PCAPrincipal Component Analysis
PLS-DAPartial Least Squares Discriminant Analysis
PCA-LDAPrincipal Component Analysis–Linear Discriminant Analysis
LODLimit of Detection
LOQLimit of Quantification
ROCReceiver Operating Characteristic curve
AUCArea Under the Curve
BERBalanced Error Rate
LVsLatent Variables
DTGSDeuterated Triglycine Sulfate
VIPVariable Importance in Projection
FTIRFourier Transform Infrared
OPLS-DAOrthogonal Partial Least Squares Discriminant Analysis

References

  1. Commission Regulation (EC) No 1829/2002 of 14 October 2002 Amending the Annex to Regulation (EC) No 1107/96 with Regard to the Name ‘Feta’ (Text with EEA Relevance), Vol. 277. 2002. Available online: http://data.europa.eu/eli/reg/2002/1829/oj/eng (accessed on 9 May 2025).
  2. Pulina, G.; Milán, M.J.; Lavín, M.P.; Theodoridis, A.; Morin, E.; Capote, J.; Thomas, D.L.; Francesconi, A.H.D.; Caja, G. Invited review: Current production trends, farm structures, and economics of the dairy sheep and goat sectors. J. Dairy Sci. 2018, 101, 6715–6729. [Google Scholar] [CrossRef] [PubMed]
  3. Commission Regulation (EC) No 1107/96 of 12 June 1996 on the Registration of Geographical Indications and Designations of Origin Under the Procedure Laid Down in Article 17 of Council Regulation (EEC) No 2081/92. Available online: https://eur-lex.europa.eu/eli/reg/1996/1107/oj/eng (accessed on 18 June 2025).
  4. Katsouri, E.; Magriplis, E.; Zampelas, A.; Nychas, G.J.; Drosinos, E.H. Nutritional Characteristics of Prepacked Feta PDO Cheese Products in Greece: Assessment of Dietary Intakes and Nutritional Profiles. Foods 2020, 9, 253. [Google Scholar] [CrossRef] [PubMed]
  5. Hammam, A.R.A.; Kapoor, R.; Salunke, P.; Metzger, L.E. Compositional and Functional Characteristics of Feta-Type Cheese Made from Micellar Casein Concentrate. Foods 2021, 11, 24. [Google Scholar] [CrossRef]
  6. Spognardi, S.; Passaretti, D.; Vistocco, D.; Cappelli, L.; Papetti, P. Determining the Authenticity of PDO Buffalo Mozzarella: An Approach Based on Fourier Transform Infrared (MIR-FTIR) Spectroscopy and on Chemometric Tools. Int. J. Latest Res. Sci. Technol. 2018, 7, 1–6. Available online: https://www.semanticscholar.org/paper/Determining-the-authenticity-of-PDO-buffalo-an-on-Spognardi-Passaretti/f8528e86041d8dda9f9f00ed57ec8183e2e88eac (accessed on 9 June 2025).
  7. Cardin, M.; Cardazzo, B.; Mounier, J.; Novelli, E.; Coton, M.; Coton, E. Authenticity and Typicity of Traditional Cheeses: A Review on Geographical Origin Authentication Methods. Foods 2022, 11, 3379. [Google Scholar] [CrossRef] [PubMed]
  8. Value of Production of Agricultural Products and Foodstuffs, Wines, Aromatised Wines and Spirits Protected by a Geographical Indication (GI). Available online: https://op.europa.eu/en/publication-detail/-/publication/131c84a8-3c1f-4835-9a83-fbdd0abc9b2e (accessed on 16 July 2025).
  9. Pidiaki, E.; Manouras, A.; Malissiova, E. Assessment of Feta Cheese Adulteration in the Region of Thessaly, Greece—Implications for Consumer Protection. In Proceedings of the IAFP’s 12th European Symposium on Food Safety, Athens, Greece, 11–13 May 2016; Available online: https://iafp.confex.com/iafp/euro16/webprogram/Paper11608.html (accessed on 9 May 2025).
  10. Ganopoulos, I.; Sakaridis, I.; Argiriou, A.; Madesis, P.; Tsaftaris, A. A novel closed-tube method based on high resolution melting (HRM) analysis for authenticity testing and quantitative detection in Greek PDO Feta cheese. Food Chem. 2013, 141, 835–840. [Google Scholar] [CrossRef] [PubMed]
  11. Stefos, G.; Argyrokastritis, A.; Bizelis, I.; Moatsou, G.; Anifantakis, E.; Rogdakis, E. Detection of bovine mitochondrial DNA specific sequences in Feta cheese and ovine yogurt by PCR-RFLP. Milchwissenschaft 2004, 59, 509–511. [Google Scholar]
  12. Kritikou, A.S.; Aalizadeh, R.; Damalas, D.E.; Barla, I.V.; Baessmann, C.; Thomaidis, N.S. MALDI-TOF-MS integrated workflow for food authenticity investigations: An untargeted protein-based approach for rapid detection of PDO feta cheese adulteration. Food Chem. 2022, 370, 131057. [Google Scholar] [CrossRef] [PubMed]
  13. Saji, R.; Ramani, A.; Gandhi, K.; Seth, R.; Sharma, R. Application of FTIR spectroscopy in dairy products: A systematic review. Food Humanit. 2024, 2, 100239. [Google Scholar] [CrossRef]
  14. Mafra, I.; Honrado, M.; Amaral, J.S. Animal Species Authentication in Dairy Products. Foods. 2022, 11, 1124. [Google Scholar] [CrossRef] [PubMed]
  15. Dimitriou, L.; Koureas, M.; Pappas, C.; Manouras, A.; Kantas, D.; Malissiova, E. Rapid Classification of Cow, Goat, and Sheep Milk Using ATR-FTIR and Multivariate Analysis. Sci 2025, 7, 87. [Google Scholar] [CrossRef]
  16. Smaoui, S.; Tarapoulouzi, M.; Agriopoulou, S.; D’Amore, T.; Varzakas, T. Current State of Milk, Dairy Products, Meat and Meat Products, Eggs, Fish and Fishery Products Authentication and Chemometrics. Foods 2023, 12, 4254. [Google Scholar] [CrossRef] [PubMed]
  17. Ayvaz, H.; Mortas, M.; Dogan, M.A.; Atan, M.; Yildiz Tiryaki, G.; Karagul Yuceer, Y. Near- and mid-infrared determination of some quality parameters of cheese manufactured from the mixture of different milk species. J. Food Sci. Technol. 2021, 58, 3981–3992. [Google Scholar] [CrossRef] [PubMed]
  18. Di Donato, F.; Biancolillo, A.; Foschi, M.; D’Archivio, A.A. Application of SPORT algorithm on ATR-FTIR data: A rapid and green tool for the characterization and discrimination of three typical Italian Pecorino cheeses. J. Food Compos. Anal. 2022, 114, 104784. [Google Scholar] [CrossRef]
  19. Yaman, H.; Aykas, D.P.; Jiménez-Flores, R.; Rodriguez-Saona, L.E. Monitoring the ripening attributes of Turkish white cheese using miniaturized vibrational spectrometers. J. Dairy Sci. 2022, 105, 40–55. [Google Scholar] [CrossRef] [PubMed]
  20. Tarapoulouzi, M.; Kokkinofta, R.; Theocharis, C.R. Chemometric analysis combined with FTIR spectroscopy of milk and Halloumi cheese samples according to species’ origin. Food Sci. Nutr. 2020, 8, 3262–3273. [Google Scholar] [CrossRef] [PubMed]
  21. Tzora, A.; Nelli, A.; Voidarou, C.; Fthenakis, G.; Rozos, G.; Theodorides, G.; Bonos, E.; Skoufos, I. Microbiota “Fingerprint” of Greek Feta Cheese through Ripening. Appl. Sci. 2021, 11, 5631. [Google Scholar] [CrossRef]
  22. Bozoudi, D.; Torriani, S.; Zdragas, A.; Litopoulou-Tzanetaki, E. Assessment of microbial diversity of the dominant microbiota in fresh and mature PDO Feta cheese made at three mountainous areas of Greece. LWT—Food Sci. Technol. 2016, 72, 525–533. [Google Scholar] [CrossRef]
  23. Papadakis, P.; Konteles, S.; Batrinou, A.; Ouzounis, S.; Tsironi, T.; Halvatsiotis, P.; Tsakali, E.; Van Impe, J.F.M.; Vougiouklaki, D.; Strati, I.F.; et al. Characterization of Bacterial Microbiota of P.D.O. Feta Cheese by 16S Metagenomic Analysis. Microorganisms 2021, 9, 2377. [Google Scholar] [CrossRef] [PubMed]
  24. Plessas, S.; Ganatsios, V.; Mantzourani, I.; Bosnea, L. White Brined Cheese Production by Incorporation of a Traditional Milk-Cereal Prebiotic Matrix with a Candidate Probiotic Bacterial Strain. Appl. Sci. 2021, 11, 6182. [Google Scholar] [CrossRef]
  25. Dimitrellou, D.; Kourkoutas, Y.; Banat, I.M.; Marchant, R.; Koutinas, A.A. Whey-cheese production using freeze-dried kefir culture as a starter. J. Appl. Microbiol. 2007, 103, 1170–1183. [Google Scholar] [CrossRef] [PubMed]
  26. Slozhenkina, M.I.; Gorlov, I.F.; Serova, O.P.; Bozhkova, S.E.; Kotova, A.S. The study of factors affecting the drying process and the quality of dry cheese. IOP Conf. Ser. Earth Environ. Sci. 2021, 640, 032018. [Google Scholar] [CrossRef]
  27. Cao, W.; Passot, S.; Irlinger, F.; Fonseca, F. Investigation of Freezing and Freeze-Drying for Preserving and Re-Using a Whole Microbial Cheese Community. Foods 2024, 13, 1809. [Google Scholar] [CrossRef] [PubMed]
  28. Rau, J.; Korte, N.; Dyk, M.; Wenninger, O.; Schreiter, P.; Hiller, E. Rapid animal species identification of feta and mozzarella cheese using MALDI-TOF mass-spectrometry. Food Control 2020, 117, 107349. [Google Scholar] [CrossRef]
  29. Melissari, F.; Papadakis, A.; Chatzitheodorou, D.; Tran, D.; Schouteten, J.; Athanasiou, G.; Zahariadis, T. Experiences Using Ethereum and Quorum Blockchain Smart Contracts in Dairy Production. J. Sens. Actuator Netw. 2024, 13, 6. [Google Scholar] [CrossRef]
  30. Tran, D.; De Steur, H.; Gellynck, X.; Papadakis, A.; Schouteten, J.J. The heterogeneity of consumer preference for blockchain-based food traceability: The role of governmental trust and information-seeking behaviour. Food Qual. Prefer. 2025, 126, 105424. [Google Scholar] [CrossRef]
  31. Tarapoulouzi, M.; Pashalidis, I.; Theocharis, C.R. Discrimination of Cheese Products Regarding Milk Species’ Origin Using FTIR, 1H-NMR, and Chemometrics. Appl. Sci. 2024, 14, 2584. [Google Scholar] [CrossRef]
  32. Foschi, M.; Biancolillo, A.; Reale, S.; Poles, F.; D’Archivio, A.A. Classification of “Ricotta” whey cheese from different milk and Designation of Origin-protected samples through infrared spectroscopy and chemometric analysis. J. Food Compos. Anal. 2025, 138, 107019. [Google Scholar] [CrossRef]
  33. Nicolaou, N.; Xu, Y.; Goodacre, R. Fourier transform infrared spectroscopy and multivariate analysis for the detection and quantification of different milk species. J. Dairy Sci. 2010, 93, 5651–5660. [Google Scholar] [CrossRef] [PubMed]
  34. Socrates, G. Infrared and Raman Characteristic Group Frequencies: Tables and Charts, 3rd ed.; Wiley: Chichester, UK, 2010. [Google Scholar]
  35. Skeie, S.; Feten, G.; Almøy, T.; Østlie, H.; Isaksson, T. The use of near infrared spectroscopy to predict selected free amino acids during cheese ripening. Int. Dairy J. 2006, 16, 236–242. [Google Scholar] [CrossRef]
  36. Balieiro, A.L.; Santos, R.A.; Pereira, M.M.; Figueiredo, R.T.; Freitas, L.S.; de Alsina, O.L.S.; Lima, A.S.; Soares, C.M.F. Adsorption Process of Molecularly Imprinted Silica for Extraction of Lactose from Milk. Braz. J. Chem. Eng. 2016, 33, 361–372. [Google Scholar] [CrossRef]
  37. Yaman, H.; Aykas, D.P.; Rodriguez-Saona, L.E. Monitoring Turkish white cheese ripening by portable FT-IR spectroscopy. Front. Nutr. 2023, 10, 1107491. [Google Scholar] [CrossRef] [PubMed]
  38. De Jesus, J.; Silva, G.; Gonçalves, B.-H.; De Souza, M.; Santos, L.; Ferrão, S. Quick Identification of the Time of Maturation of Artisanal Minas Cheese by FTIR-ATR Spectroscopy and Multivariate Techniques. J. Braz. Chem. Soc. 2020, 31, 2000–2011. [Google Scholar] [CrossRef]
Figure 1. Mean FT-IR spectra and their derivatives for Feta vs. non-Feta white brined cheeses.
Applsci 15 08272 g001
Figure 2. PCA of FTIR spectra for Feta (●) and non-Feta white brined cheese (▲) under raw absorbance (A,B), first derivative (C,D), and second derivative (E,F) preprocessing. Score plots (A,C,E) and scree plots (B,D,F) show PC1/PC2 variance explained. Colored dashed lines indicate group separation boundaries: red for Feta, blue for non-Feta white brined cheese.
Applsci 15 08272 g002
Figure 3. PLS-DA score plots (A,C,E) in the train set and corresponding VIP (B,D,F) for freeze-dried cheese samples using raw (A,B), first derivative (C,D), and second derivative (E,F) FTIR spectra. Features with a VIP score > 2 are highlighted with a yellow point.
Applsci 15 08272 g003
Table 1. Preprocessing transformation equations for FTIR spectra.
Signal RepresentationEquation
Raw absorbance-
First derivatived1(ν) = (A(ν) − A(ν − Δν))/Δν
Second derivatived2(ν) = (A(ν + Δν) − 2·A(ν) + A(ν − Δν))/(Δν)2
where A(ν) is the absorbance at wavenumber ν and Δν is the spacing to the adjacent data point.
Table 2. PCA-LDA classification performance metrics for raw, first derivative, and second derivative FTIR spectra.
Train SetTest Set
Preprocessing# PCsAUCSensitivitySpecificityAUCSensitivitySpecificityAccuracy
Raw Spectra100.8490.9130.6930.9161.0000.5450.792
First Derivative90.9480.9700.7930.9511.0000.8180.917
Second Derivative70.9800.9700.8270.9301.0000.8180.917
Table 3. PLS-DA classification performance metrics for raw, first derivative, and second derivative FTIR spectra.
Train SetTest Set
Preprocessing# LVsAUCSensitivitySpecificityAUCSensitivitySpecificityAccuracy
Raw Spectra80.9920.9700.9290.8740.8460.8180.833
First Derivative31.0001.0000.9640.9231.0000.7270.875
Second Derivative91.0001.0001.0000.9581.0000.9090.958
Disclaimer/Publisher’s Note: The statements, opinions and data contained in all publications are solely those of the individual author(s) and contributor(s) and not of MDPI and/or the editor(s). MDPI and/or the editor(s) disclaim responsibility for any injury to people or property resulting from any ideas, methods, instructions or products referred to in the content.

