Article

Assessing the Impact of Risk-Warning eHMI Information Content on Pedestrian Mental Workload, Situation Awareness, and Gap Acceptance in Full and Partial eHMI Penetration Vehicle Platoons

1
Faculty of Science and Engineering, University of Nottingham Ningbo China, Ningbo 315100, China
2
Nottingham Ningbo China Beacons of Excellence Research and Innovation Institute, Ningbo 315101, China
3
Ningbo Global Innovation Center, Zhejiang University, Hangzhou 310027, China
*
Author to whom correspondence should be addressed.
Appl. Sci. 2025, 15(15), 8250; https://doi.org/10.3390/app15158250
Submission received: 29 May 2025 / Revised: 15 July 2025 / Accepted: 23 July 2025 / Published: 24 July 2025

Abstract

External Human–Machine Interfaces (eHMIs) enhance pedestrian safety in interactions with autonomous vehicles (AVs) by signaling crossing risk based on time-to-arrival (TTA), categorized as low, medium, or high. This study compared five eHMI configurations (single-level low, medium, high; two-level low-medium, medium-high) against a three-level (low-medium-high) configuration to assess their impact on pedestrians’ crossing decisions, mental workload (MW), and situation awareness (SA) in vehicle platoon scenarios under full and partial eHMI penetration. In a video-based experiment with 24 participants, crossing decisions were evaluated via temporal gap selection, MW via P300 event-related potentials in an auditory oddball task, and SA via the Situation Awareness Rating Technique. The three-level configuration outperformed single-level medium, single-level high, two-level low-medium, and two-level medium-high in gap acceptance, promoting safer decisions by rejecting smaller gaps and accepting larger ones, and exhibited lower MW than the two-level medium-high configuration under partial penetration. No SA differences were observed. Although the three-level configuration was generally appreciated, future research should optimize presentation to mitigate issues from rapid signal changes. Notably, the single-level low configuration showed comparable performance, suggesting a simpler alternative for real-world eHMI deployment.

1. Introduction

According to the Society of Automotive Engineers (SAE) classification, Level 4 and Level 5 autonomous vehicles (AVs) are capable of fully performing all driving tasks without human intervention, even in complex traffic environments [1]. This autonomy allows vehicle occupants to engage in non-driving activities such as resting, reading, or working. Consequently, AVs hold significant potential to enhance traffic safety and operational efficiency by minimizing human error and optimizing driving behavior [2]. However, these advancements present new challenges, particularly in pedestrian–AV communication. In the absence of a human driver, traditional nonverbal communication cues such as eye contact and hand gestures are no longer available [3,4]. These cues are especially critical in uncontrolled traffic environments [5], where approximately 77% of fatal pedestrian accidents in urban areas occur [6].
To bridge this communication gap, researchers have proposed the implementation of external human–machine interfaces (eHMIs) [7,8]. These interfaces, which may display text, symbols, or abstract lighting patterns on vehicle components such as windshields, hoods, or grilles, are designed to communicate the AV’s driving mode, intentions, or risk-warnings to nearby pedestrians [8]. Empirical studies have demonstrated that eHMIs can positively influence pedestrian–AV interactions by enhancing pedestrians’ perceived safety, increasing their trust, and supporting safer street-crossing decision-makings, e.g., [9,10,11].

1.1. Information Content of Risk Warning eHMI

Risk-warning eHMIs are interfaces designed to alert pedestrians to risk levels for crossing based on the AV’s time-to-arrival (TTA) [11,12,13]. When the AV is far away (TTA ≥ 5.1 s), the eHMI could signal low risk; as the AV approaches (3.7 s ≤ TTA < 5.1 s), the eHMI could signal medium risk; and when the AV is very close (TTA < 3.7 s), the eHMI could signal high risk [11,14]. A low-risk signal allows pedestrians to cross confidently. A medium-risk signal could prompt pedestrians to either hasten their crossing or wait. A high-risk warning could advise pedestrians to refrain from crossing. While these visual cues serve as proactive guidance for pedestrians, AVs still retain the ability to dynamically adjust their driving behavior, such as slowing down or performing emergency braking, based on pedestrians’ actual crossing behaviors. By introducing a risk-warning communication mechanism, AVs are no longer required to automatically yield upon every instance of pedestrian detection. Accordingly, risk-warning eHMIs offer a promising approach to enhance pedestrian safety while improving traffic efficiency [11].
Building on the risk level classification, risk-warning eHMIs can be designed to convey a single-level (low, medium, or high), two-level (low–medium, medium–high), or three-level (low–medium–high) of risk levels. An explicit, ‘always-on’ three-level low-medium-high risk warning eHMI could offer greater transparency, leading to clearer mental models. However, it may not be necessary for the eHMI to explicitly announce all levels of risk. Not explicitly conveying a message can also serve as a form of communication. Therefore, it is crucial to investigate whether reducing the explicit conveyance of one or two risk levels could minimize visual clutter and mental workload (MW) in dynamic traffic scenarios while still enabling optimal communication.
According to the definition by [15], MW “represents the degree of activation of a finite pool of resources, limited in capacity, while cognitively processing a primary task over time”. Due to the limited capacity of human cognitive resources, an increase in MW for task execution can impair situation awareness (SA) by competing for cognitive resources necessary to maintain SA [16,17]. SA refers to an individual’s ability to perceive, comprehend, and predict their environment [18]. In pedestrian–AV interactions, SA involves pedestrians predicting vehicle behavior based on their perception and comprehension of vehicle and road features [19]. Therefore, eHMI designs should effectively reduce MW, or at the very least, ensure that they do not increase MW compared to conditions without such interfaces, as emphasized by [20] and Hancock, Krems, and Ackermann, as cited in [21].
Previous studies have also suggested the possibility of reducing the explicit conveyance of one or two risk levels. Ref. [11] reported that for larger time gaps, pedestrians are able to make crossing decisions more easily, adhering to their traditional crossing behavior, which in turn reduces the effectiveness of low-risk signals. Therefore, they suggested that the risk levels presented by the eHMI may be more advantageous in high-risk situations. Additionally, research on both single-level low [22] and single-level high [13] configurations has reported that they can aid pedestrians in street-crossing decision-making.
Moreover, previous studies have highlighted the different impacts of risk signals (high-risk, medium-risk, and low-risk) on pedestrians’ street-crossing behavior and perceived urgency [12,13]. Ref. [13] speculated that pedestrians tend to exhibit lower compliance with prohibitive alerts (i.e., high-risk signal) compared to permissive alerts (i.e., low-risk signal). Once a crossing decision is made, pedestrians are more likely to disregard high-risk warnings and proceed without stopping. Additionally, medium- and high-risk signals tend to elicit a stronger sense of urgency compared to low-risk signals [12]. While urgency can be useful for drawing attention, excessive urgency may elevate pedestrians’ arousal levels, leading them to overestimate their waiting time [23], which in turn increases the likelihood of signal violations and unsafe crossing behaviors [24,25].
In addition, previous research on intent eHMIs [26,27] provides evidence of differences in pedestrian preferences between continuous communication and a specific state. “Intent eHMI” refers to an interface that clearly conveys the intentions of AVs to enhance pedestrian understanding, such as whether the vehicle will yield or not. Compared to a single-feedback approach, where “yielding” is displayed only when the vehicle yields and no signal is shown when the vehicle does not yield, multi-state feedback (e.g., showing “yielding” when the vehicle yields and “non-yielding” when it does not) offers pedestrians more information, which is subjectively perceived as more favorable.
Based on the above insights, this study aims to compare the reduced eHMI configurations, which convey single-level (low, medium, or high) or two-level (low–medium or medium–high), with the full three-level progression (low–medium–high) of risk levels. The goal is to determine which approach most effectively facilitates communication, thereby improving pedestrians’ street-crossing decision-making, reducing MW, enhancing SA, and increasing pedestrian preference in interactions with AVs.

1.2. Risk Warning eHMI Penetration in Vehicle Platoon

Real-world traffic environments are inherently complex; however, existing eHMI research has predominantly focused on simple interactions between a pedestrian and a single AV, e.g., [9,10,28,29,30], with relatively less attention given to interactions involving multiple vehicles. One such traffic condition involving multiple vehicles is the vehicle platoon. A vehicle platoon refers to a sequence of vehicles passing consecutively, each potentially traveling at different speeds and having varying TTA, e.g., [11,13,14,22].
Additionally, vehicle platoons may undergo a transition period from partial AV penetration (AVs and traditional vehicles (TVs) sharing the road) to full AV penetration, along with a corresponding shift toward full eHMI penetration (where all AVs are equipped with eHMI) within these platoons, e.g., [11,31,32,33]. Previous studies have shown that under full eHMI penetration conditions, the use of risk-warning eHMI with a single-level low risk information [22]; a single-level high risk information [13] and three-level low–medium–high risk [11,14] improves pedestrians’ crossing decision. However, Ref. [11] examined the use of three-level low–medium–high risk eHMI under partial eHMI penetration conditions and found that pedestrians’ crossing decisions tend to be less safe when encountering TVs without eHMIs. In our earlier study [34], we extended the work of [11] by examining the cognitive effects of three-level low–medium–high eHMIs, and found that partial eHMI penetration condition significantly increased pedestrians’ MW and decreased SA compared to full penetration.
Building on these considerations, this study aims to investigate how eHMI configurations affect pedestrians’ cognitive and behavioral responses in vehicle platoon scenarios, under both partial and full eHMI penetration conditions. The goal is to identify the most effective eHMI configurations that facilitate communication across different stages of AV deployment.

2. Method

2.1. Participants

This study involved 24 volunteers (M = 20.42 years, SD = 0.93), including 11 females and 13 males, all of whom were staff and students from Qilu University of Technology. Regarding familiarity with AVs, 8.33% (2/24) of participants had driven a L3 or higher AV, 33.33% (8/24) had seen such AVs on the road, such as delivery vehicles, and 29.17% (7/24) of participants were familiar with the latest developments in autonomous driving technology. In terms of trust in AVs, 8.33% (2/24) of participants did not trust them, 50% (12/24) were uncertain, and 41.67% (10/24) trusted them. On average, participants spent 61.04 min (SD = 42.68) walking on roads daily. All participants were right-handed and reported having normal or corrected vision and hearing. None had a history of neurological or psychological disorders. Ethical approval for the study was granted by the University’s Research Ethics Committee, and informed written consent was obtained from each participant prior to the experiment.

2.2. Experiment Setup

2.2.1. Apparatus and Materials

In this study, a video-watching method was utilized to simulate street-crossing tasks. The visual stimuli were displayed on an LG 34WR50QK curved LED monitor (LG Display Co., Ltd., Seoul, Republic of Korea), featuring a 34-inch screen and a resolution of 3440 × 1440 pixels. This method, due to its safety and simplicity, has been widely adopted to study the impact of eHMI on pedestrians’ street-crossing decisions and their perception and understanding of eHMIs, e.g., [28,31,35,36].
Traffic scenario. The street-crossing scenario, developed using Unity (version 2023.2.3), represented a typical secondary urban road, characterized by an open two-lane layout without traffic lights or zebra crossings. In such unregulated environments, eHMIs play a critical role by providing clear visual cues that help pedestrians make safe and confident crossing decisions [37].
As depicted in Figure 1, each traffic lane measured 3.5 m in width, and the total length of the visible roadway extended 100 m. The simulated environment featured clear weather and standard daylight conditions, replicating a typical daytime pedestrian crossing scenario. The video stimulus portrayed the traffic scene from a first-person pedestrian viewpoint, positioned at the curb and oriented perpendicular to the road. To ensure uniformity across participants, the camera angle remained static throughout the simulation, eliminating the possibility for viewers to alter the visual perspective.
Vehicle platoon. Traffic flowed from left to right in the near lane at a constant speed, without acceleration or deceleration, while the far lane remained empty. To enhance realism, all vehicles were sedans, and their gap size and speed were randomized. The initial vehicle appeared 100 m from the pedestrian at the left edge of the screen, traveling at a constant speed of 36 km/h. Subsequent vehicles moved at either 30 km/h or 36 km/h, with each speed equally represented. Speeds below 40 km/h were selected because pedestrians tend to underestimate higher velocities [38], and the two similar speeds reflected realistic variations under comparable road conditions. Gap size, defined as the TTA of approaching vehicles, ranged from 2 to 6 s in 0.5 s increments (i.e., 2, 2.5, 3, 3.5, 4, 4.5, 5, 5.5, 6 s). The simulation ensured that, after the rear of a preceding vehicle passed the participant, the next vehicle arrived at a position corresponding to one of these nine gap sizes, randomized in equal proportions. A total of 72 trials (2 speeds × 9 gap sizes × 4 repetitions) were presented in a fully randomized order, preceded by one fixed-speed vehicle, resulting in 73 vehicles in total.

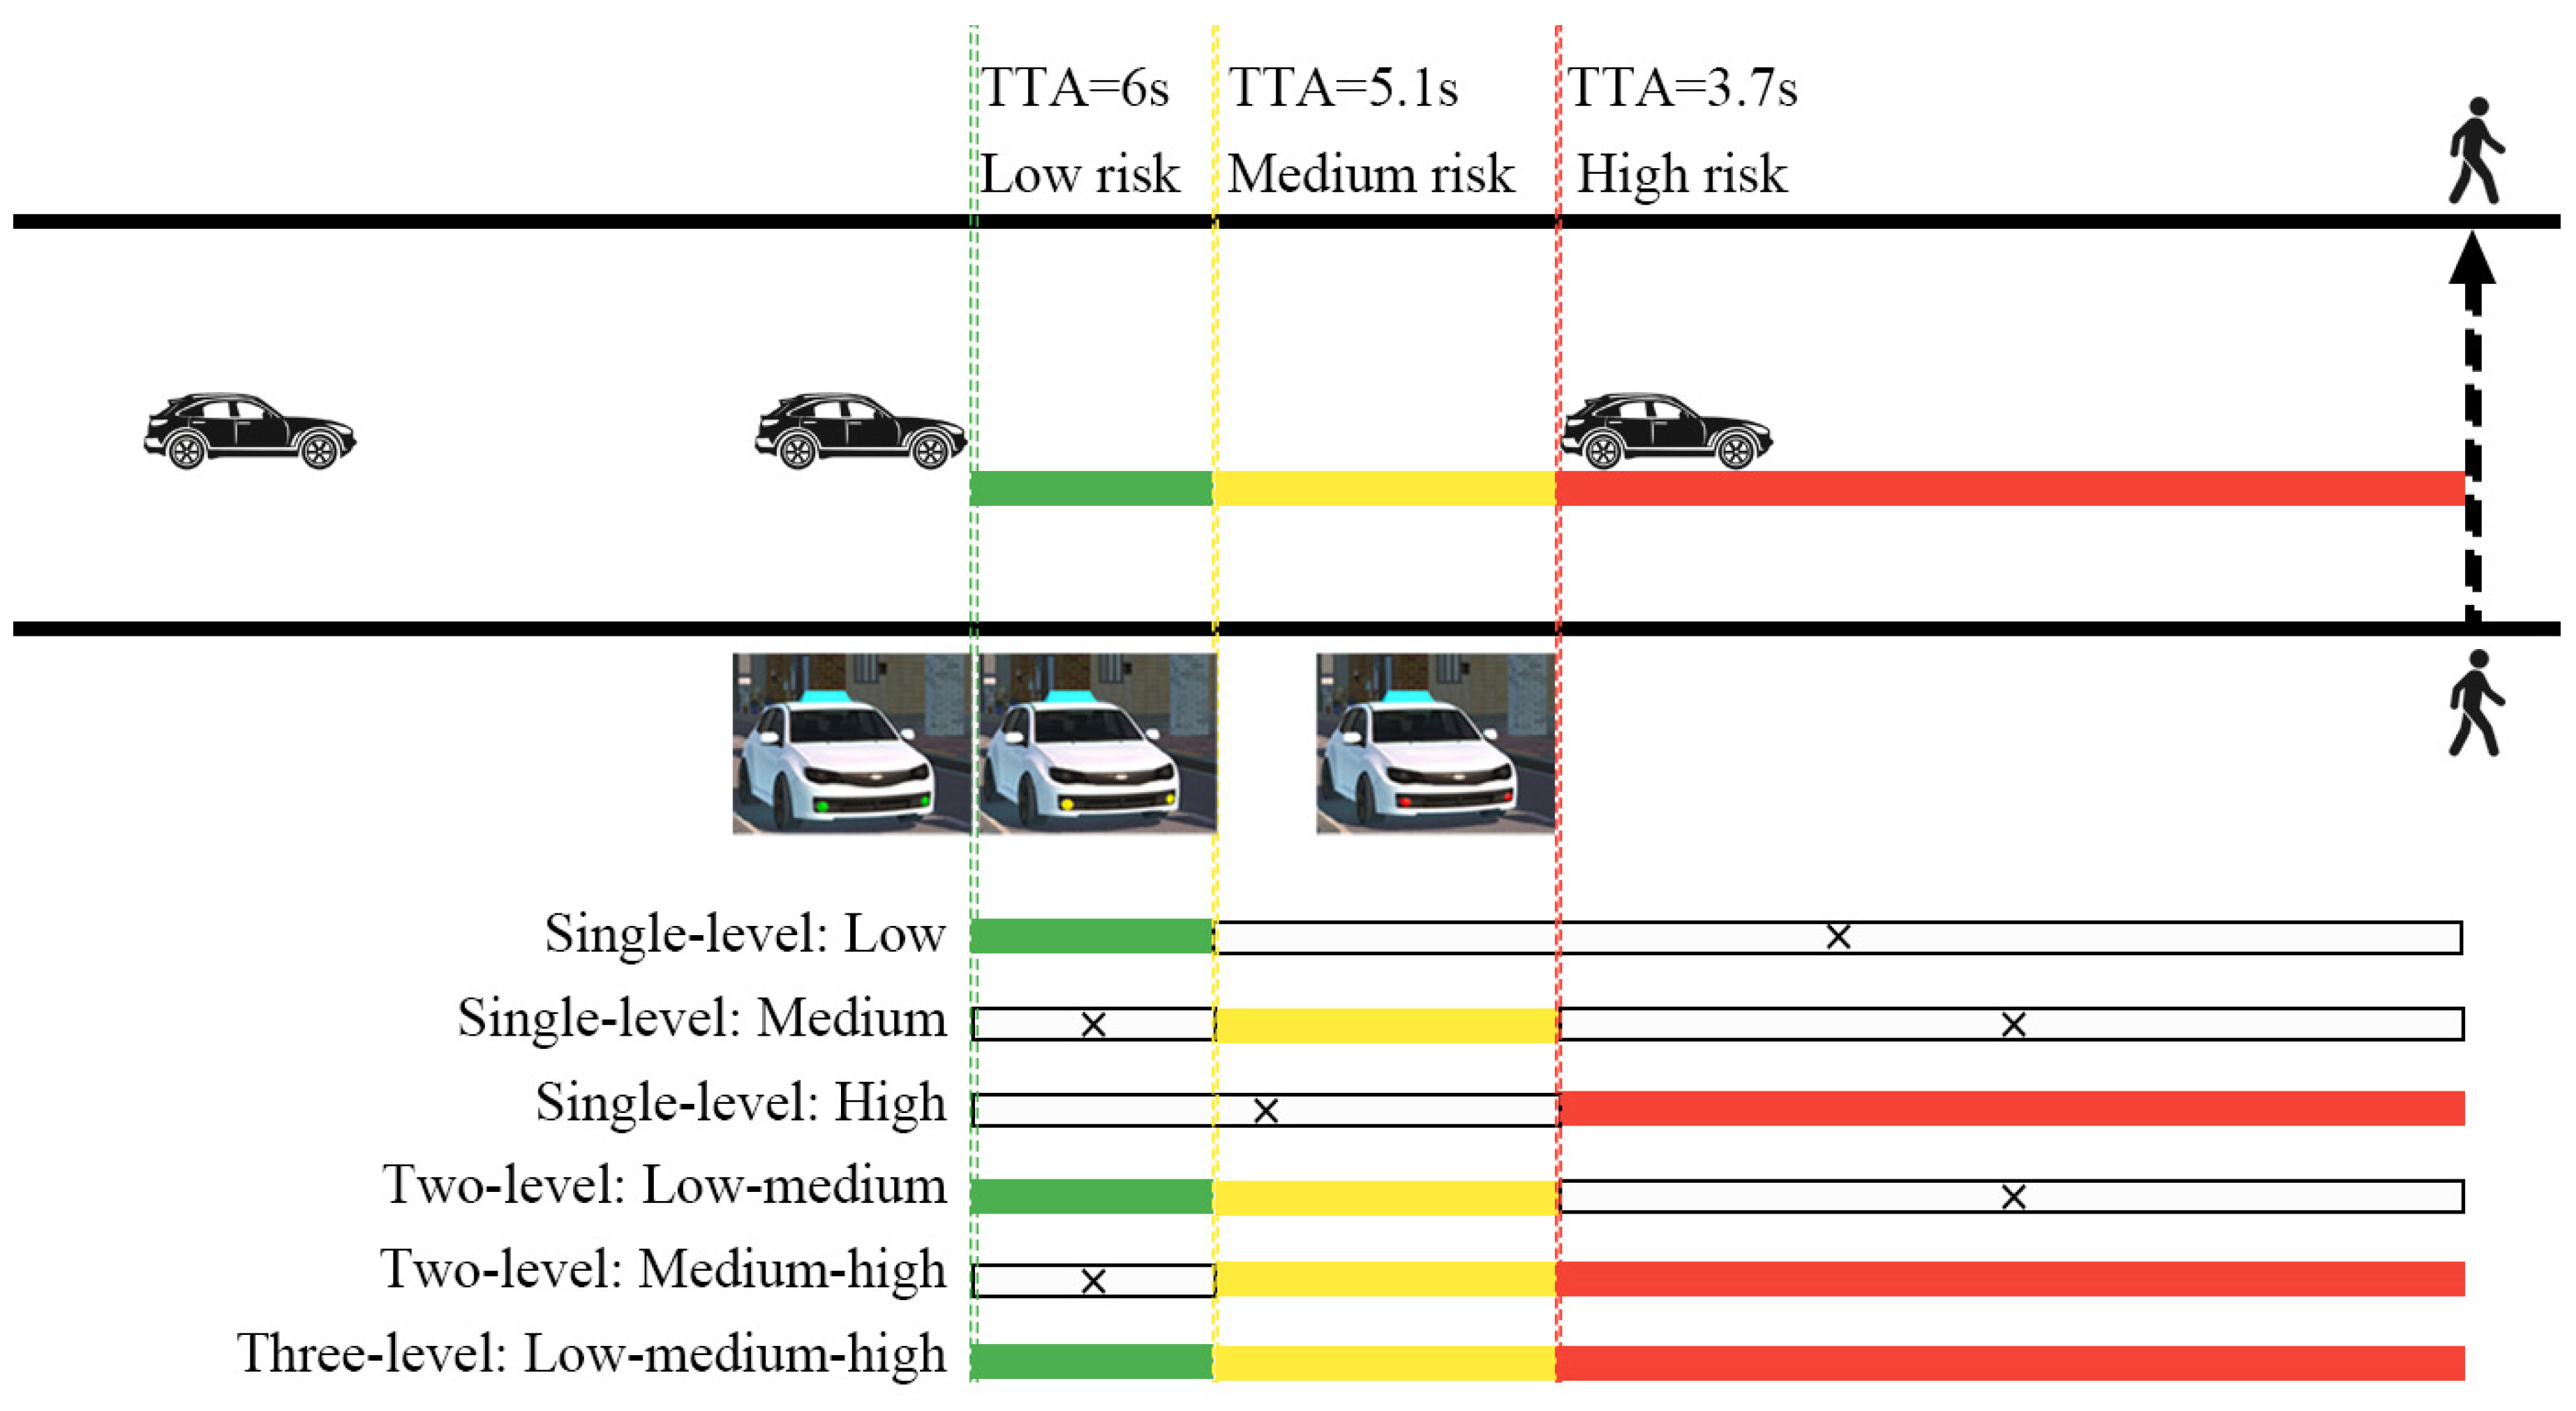
2.2.2. Experiment Design

As risk-warning eHMIs lack standardization, this study adopted a triadic color scheme—red, yellow, and green (as shown in Figure 2)—to indicate crossing risk levels: red for high risk, yellow for medium risk, and green for low risk. The experiment adopted a within-subjects design, manipulating the information content conveyed by the eHMIs (as shown in Figure 2), which included the following configurations:
(1)
Single-level: Low
The eHMI was activated only when TTA ≥ 5.1 s, displaying a green light and indicating a low-risk scenario. When TTA < 5.1 s, the eHMI was deactivated.
(2)
Single-level: Medium
The eHMI was activated only when 3.7 s ≤ TTA < 5.1 s, displaying a yellow light and indicating a medium-risk scenario. It was deactivated when TTA ≥ 5.1 s or TTA < 3.7 s.
(3)
Single-level: High
The eHMI was activated only when TTA < 3.7 s, displaying a red light and indicating a high-risk scenario. It was deactivated when TTA ≥ 3.7 s.
(4)
Two-level: Low-medium
The eHMI was activated when TTA ≥ 3.7 s. It displayed a green light when TTA ≥ 5.1 s, which transitioned to yellow at TTA = 5.1 s and remained yellow while 3.7 s ≤ TTA < 5.1 s. The eHMI was deactivated when TTA < 3.7 s.
(5)
Two-level: Medium-high
The eHMI was activated when TTA < 5.1 s. It displayed a yellow light when 3.7 s ≤ TTA < 5.1 s, which shifted to red at TTA = 3.7 s and remained red while TTA < 3.7 s. The eHMI was deactivated when TTA ≥ 5.1 s.
(6)
Three-level: Low-medium-high
The eHMI was continuously active across the full TTA range. It displayed a green light when TTA ≥ 5.1 s, transitioned to yellow at TTA = 5.1 s, and further shifted to red at TTA = 3.7 s, remaining red while TTA < 3.7 s
Two eHMI penetration conditions were tested independently: full and partial. In the full penetration condition (as shown in Figure 3), all vehicles were AVs equipped with a risk-warning eHMI. Also, a cyan light (CIE chromaticity: x = 0.15, y = 0.38) atop each AV, per ISO/TR 23049:2018 [39], signaled its autonomously driving mode. In the partial penetration condition, 50% of the vehicles were AVs with eHMIs (Partial-AVs), while the remaining 50% were TVs without eHMI (Partial-TVs). AVs and TVs appeared in random order, with the cyan light present only atop AVs in this condition.

2.3. Dependent Variables

2.3.1. Gap Acceptance

Gap acceptance was recorded based on whether participants chose to cross or wait in front of an oncoming vehicle [11,13,14,22]. Each vehicle was associated with a predetermined temporal gap; selecting a larger gap provides more time for safe crossing, whereas selecting a smaller gap may increase the potential risk during the crossing process.

2.3.2. P300

MW was assessed using P300 event-related potentials (ERPs) during a concurrent auditory oddball task. This approach was chosen because of the limitations of alternative physiological measures (e.g., eye-tracking, head movement) in capturing the effects on pedestrians’ MW. These measures are primarily sensitive to visual load and susceptible to the ‘looking but not seeing’ phenomenon, where visual attention does not guarantee cognitive processing [40]. Additionally, such measures are influenced by factors such as stimulus duration, novelty, and complexity [41,42], or brightness [35]. Furthermore, eye-tracking parameters vary in task-specific applicability, necessitating complementary measures to ensure robust and valid MW assessment [43,44].
In the oddball task, participants were required to count rare high-pitch tones (2000 Hz, 52.5 dB, 500 ms, p = 0.2) among frequent low-pitch tones (1000 Hz, 52.5 dB, 500 ms, p = 0.8), adhering to oddball paradigm standards [45]. A total of 60 high-pitch tones and 240 low-pitch tones were presented randomly, with 500 ms interstimulus intervals. Counting was opted instead of providing a physical response to the high-pitch tones due to the prior research finding that motor-evoked potentials could potentially interfere with the P300 effects [46].
The P300 effect, elicited by high-pitch tones, manifests as the third positive deflection 250–450 ms post-stimulus, predominantly in centro-parietal regions [47]. In this study, it was quantified as peak amplitude within this window at the Cz electrode. Given that mental resources are limited, higher P300 amplitudes elicited by the oddball task reflect lower mental demands imposed by the primary task [46,48].
EEG data were recorded using the Neuroscan system and Curry 8.0 software with 64 Ag/AgCl electrodes (extended 10–20 system; Figure 4). Although only Cz data were analyzed, all electrodes were recorded for potential future use. Signals were digitized at 1000 Hz, and electrode impedance was maintained below 20 kΩ using Easy Gel, adjusted as needed. Stimuli and event timing were controlled via E-Prime 2.0.

2.3.3. Oddball Counting Error Rate

Behavioral performance of the oddball task was assessed using counting error rates for high-pitch tones, defined as deviations from the correct number of target tones (i.e., 60). These error rates serve as an indicator of available mental resources, with lower error rates reflecting lower mental demands imposed by the primary task [46].

2.3.4. Situation Awareness

SA was evaluated using the Three-Dimensional Situation Awareness Rating Technique (3D-SART) [49], a subjective yet widely validated method for comparing interface designs, e.g., effect of different hazard warning eHMI designs mounted on parked AVs on pedestrians’ SA [50]. It measures three constructs: attentional demand (task-imposed load), attentional supply (available mental capacity), and understanding (comprehension of the situation). Each was rated from 1 (low) to 7 (high).

2.3.5. Feedback

Upon completing the experiment, participants participated in a brief interview session, during which they were asked to respond to two questions: (1) to rank the six eHMI information content configurations according to their personal preferences; and (2) to explain the reasoning behind their ranking.

2.4. Procedure

Upon arrival, participants provided written informed consent and were then briefed on the experimental procedure. They were informed that the task simulated a street-crossing scenario without crosswalks or traffic signals, and thus no clear right-of-way was established. It was specifically emphasized that the vehicles in the platoon would not slow down or yield, requiring participants to select sufficiently large temporal gaps to ensure safe crossing. This clarification ensured that participants’ decisions were based solely on vehicle speed and gap size, eliminating assumptions or expectations about whether the vehicles would yield.
Participants were then introduced to the eHMI signals: cyan roof lights indicated AVs, while green, yellow, and red lights, positioned in place of fog lights, conveyed low, medium, and high crossing risk, respectively. Familiarizing participants with eHMI meanings was essential, as prior research indicates that once eHMI was internalized, the influence of eHMI presentations on crossing decisions diminishes [51,52].
Additionally, participants were instructed to press the ‘1’ key on the keyboard if they decided to cross the street. For each approaching vehicle, an observation was recorded, including the participant’s gap acceptance (cross or wait), eHMI penetration condition (partial or full), vehicle type (AV with eHMI [Partial-AVs] or TV without eHMI [Partial-TVs]), vehicle speed (30 km/h or 36 km/h), and gap size (ranging from 2 to 6 s in 0.5 s increments). The vehicle platoon continued to proceed regardless of whether the participant pressed the key.
For the concurrent oddball task, participants were instructed to count the occurrences of infrequent high-pitch tones embedded within a continuous stream of low-pitch tones. They were then repeatedly exposed to both high-pitch and low-pitch tones until they could reliably distinguish between the two.
Importantly, participants were explicitly informed that their primary task was to make safe street-crossing decisions, and that their attention should be directed primarily toward that task rather than the secondary oddball task.
Participants were then seated 60 cm from a screen (see Figure 4), with their right index finger resting on the “1” key. A practice phase followed, combining the primary task (under low-medium-high risk condition) and the oddball task to familiarize participants with both.
Subsequently, participants were fitted with EEG helmets (see Figure 4). Once electrode impedance was reduced below 20 kΩ, the formal experiment commenced.
The experiment comprised six eHMI information content blocks under partial or full penetration conditions, each paired with an oddball task. The order of blocks was counterbalanced across participants using a Latin square design to mitigate order effects. After each block, participants rated their SA for the primary task using the 3D-SART.
Each block (practice and experimental) lasted five minutes, followed by a three-minute rest interval to minimize fatigue. The total experiment duration was approximately 1.5 h, with participants receiving CNY 50 as compensation.

2.5. Data Analysis

2.5.1. Gap Acceptance Analysis

To evaluate pedestrians’ gap acceptance, a Generalized Linear Mixed Model (GLMM) with a logit link function was fitted using R (version 4.3.2). The GLMM analysis was conducted separately for the two eHMI penetration conditions (full and partial). Within the partial penetration condition, separate GLMMs were also fitted for AVs equipped with eHMI (Partial-AVs) and TVs without eHMI (Partial-TVs).
Gap acceptance was modeled as a binary outcome (cross vs. wait) for each vehicle-pedestrian encounter, with gap size, vehicle speed, and eHMI information content as fixed effects and participant as a random effect by the maximum likelihood method. Gap size (2.0–6.0 s, in 0.5 s intervals) was standardized (M = 0, SD = 1) prior to analysis. For each condition (Full, Partial-AVs, Partial-TVs), we began with a full model including all main effects, two-way interactions, and the three-way interaction. Model selection employed stepwise reduction based on Akaike Information Criterion (AIC), which balances model fit and complexity. AIC was chosen over the Bayesian Information Criterion (BIC) due to its suitability for exploratory analyses, as it imposes a less stringent penalty on model complexity, enabling better representation of intricate pedestrian–AV interactions in our dataset.

2.5.2. P300 Analysis

EEG Data Processing
EEG data were processed using MATLAB R2020a (MathWorks, Natick, MA, USA). Following an initial review, two participants were excluded due to poor data quality—one from the full penetration condition and one from the partial penetration condition—resulting in 22 participants included in the final analysis.
For these remaining EEG data, noisy segments were removed. Then, a Finite Impulse Response (FIR) band-pass filter (low cutoff: 1 Hz; high cutoff: 30 Hz) was applied. Artifacts were identified via extended Infomax Independent Component Analysis (ICA). Independent components associated with typical artifacts (e.g., muscle, eye, and cardiac activity) were excluded based on standardized criteria, with thresholds ranging from 0.9 to 1. The EEG data were then re-referenced, binned, and segmented into epochs spanning 200 ms pre-stimulus to 800 ms post-stimulus onset. Baseline correction was performed by subtracting the mean voltage of the 200 ms pre-stimulus interval. Epochs exhibiting anomalies—defined as values exceeding two standard deviations from the mean based on probability and kurtosis—were discarded. For each participant, ERPs were averaged across all remaining epochs, and the P300 amplitude was extracted for each eHMI information content condition under both partial and full penetration conditions.
P300 Analysis
Data analysis was conducted using R (version 4.3.2) to compare P300 amplitudes across six eHMI information content conditions, separately for partial and full penetration scenarios. This approach focused on the averaged MW across the entire block of the street-crossing task under each eHMI information content condition, rather than on individual pedestrian–vehicle encounter.
Data normality was assessed using the Shapiro–Wilk test. For normally distributed data, ANOVA was performed, followed by Tukey’s HSD post hoc tests for pairwise comparisons if significant. For non-normally distributed data, the Friedman test was used, with significant results followed by pairwise comparisons using the Wilcoxon signed-rank test. p-values were adjusted using the Bonferroni correction to control for Type I error.

2.5.3. Oddball Counting Error Rate Analysis

Behavioral performance of the oddball task was assessed by calculating counting error rates for high-pitched tones. This was achieved by subtracting the expected count of 60 from each participant’s reported count and taking the absolute value. The analysis focused on the total error rate across the entire block of each eHMI information content condition, rather than on individual pedestrian-vehicle encounter. These error rates were then analyzed using the same statistical procedures applied to P300 amplitudes.

2.5.4. Situation Awareness Analysis

SA scores were calculated using the formula: SA = Understanding − (Demand − Supply). The analysis focused on the SA scores assessed after the entire block of each eHMI information content condition, rather than for individual pedestrian-vehicle encounter. Statistical analyses were conducted using the same procedures applied to P300 amplitudes.

2.5.5. Feedback Analysis

A semantic analysis of participant feedback was conducted in two phases: (1) statistical analysis of ranking frequencies, calculating how each eHMI information content condition was assigned to each ranking position; and (2) qualitative analysis of the pros and cons for each information content.

3. Results

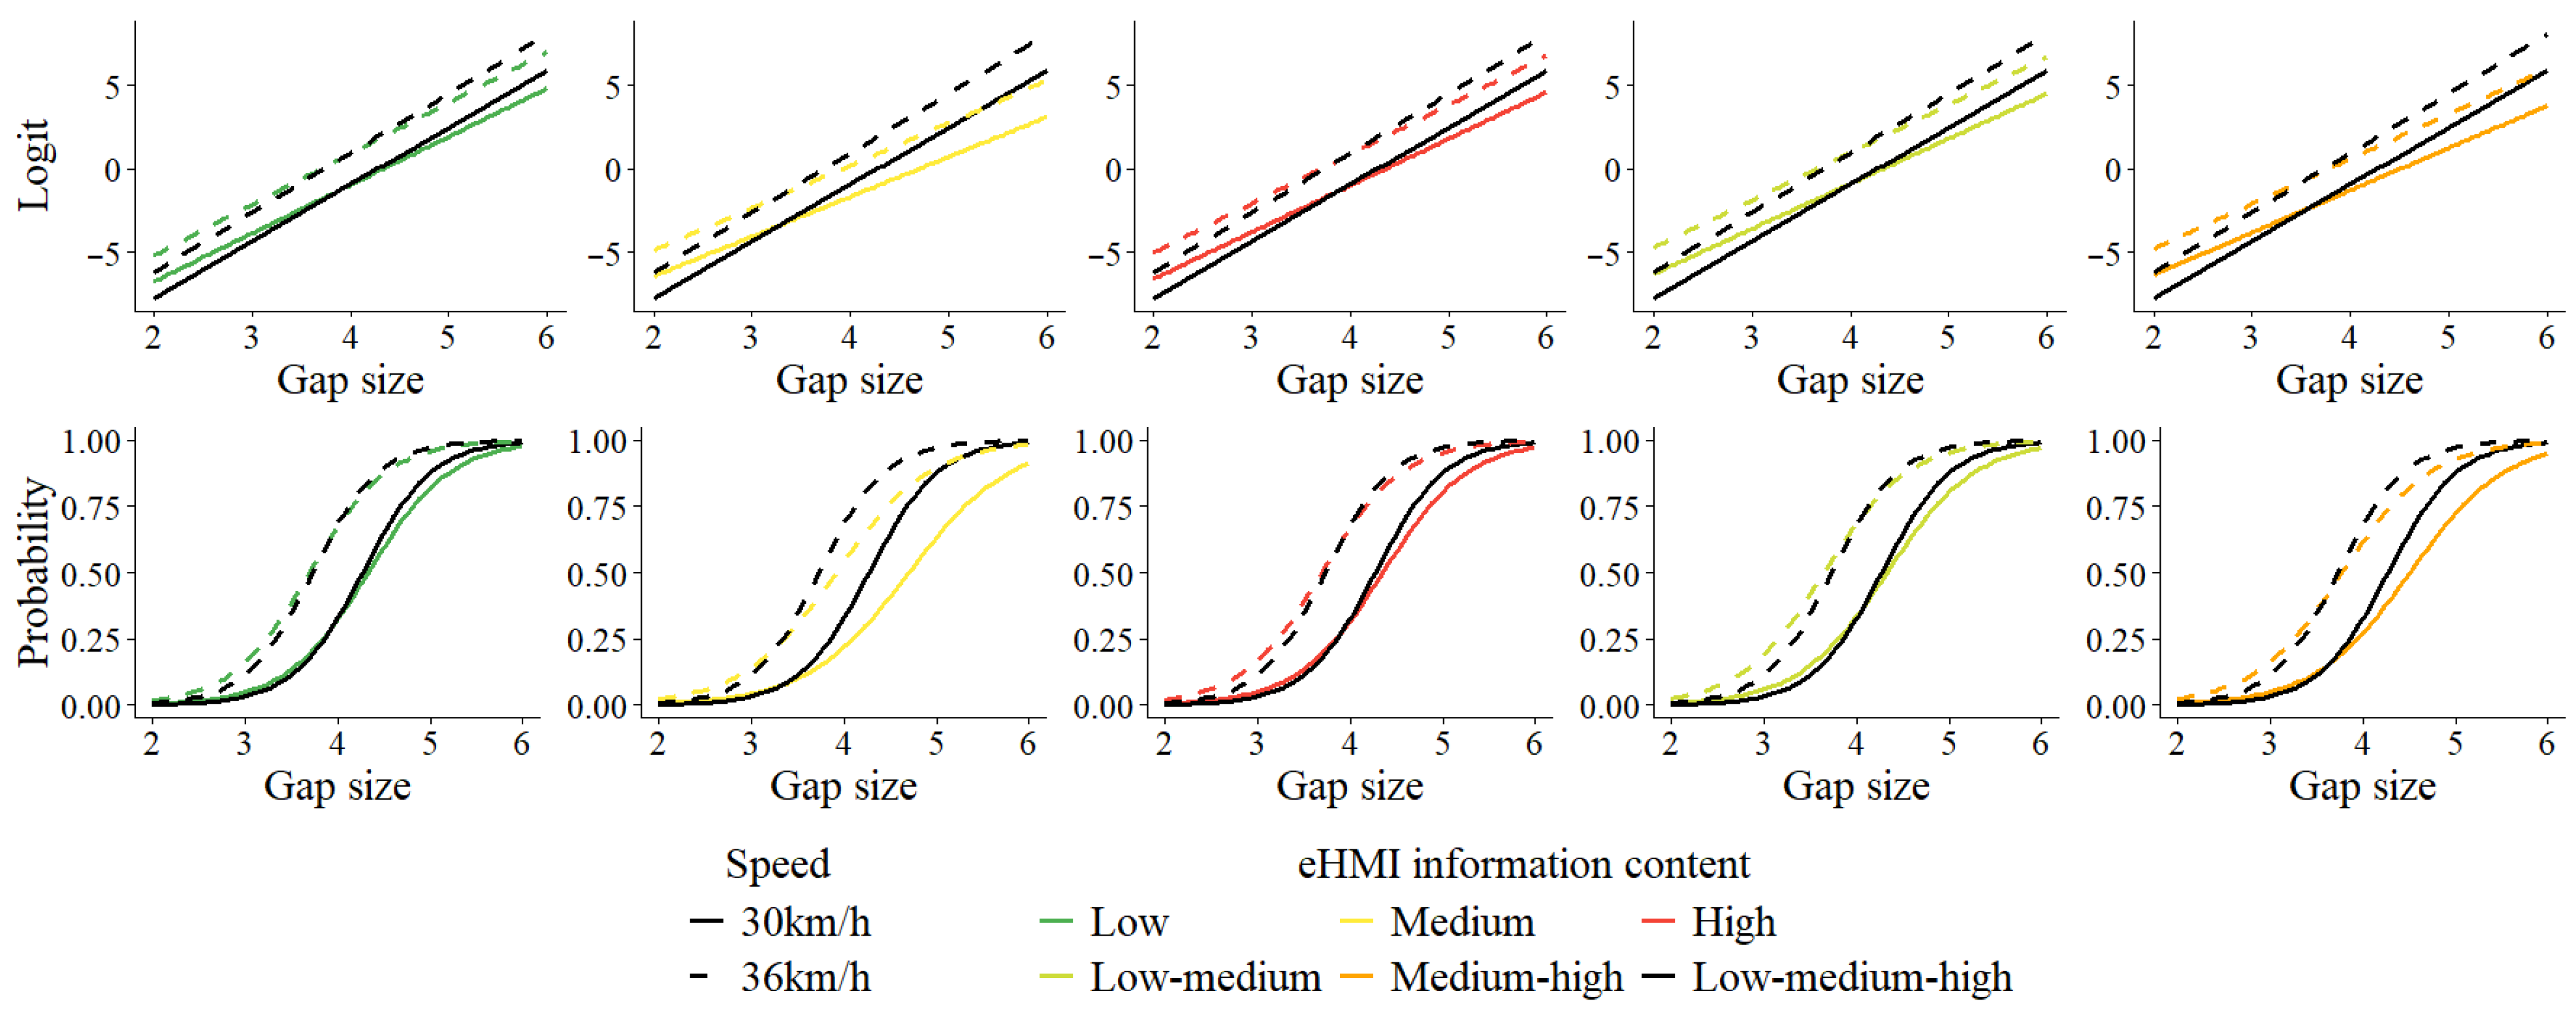
3.1. Results of Gap Acceptance

Across all three conditions, the three-way interaction was not statistically significant (Full: χ2(5) = 6.92, p = 0.227; Partial-AVs: χ2(5) = 3.80, p = 0.578; Partial-TVs: χ2(5) = 6.15, p = 0.292) and was therefore removed. After removing the three-way interaction, the two-way interaction between eHMI information content and speed was not significant in any of the models (Full: χ2(5) = 5.43, p = 0.366; Partial-AVs: χ2(5) = 2.88, p = 0.719; Partial-TVs: χ2(5) = 6.66, p = 0.247) and was excluded.
After removing the two-way interaction between eHMI information content and speed, the interaction between eHMI information content and gap size was statistically significant in the Full (χ2(5) = 11.38, p = 0.044) and Partial-AVs (χ2(5) = 11.71, p = 0.039) models, while the interaction between speed and gap size was significant in the Partial-TVs model (χ2(1) = 7.86, p = 0.005). To maintain consistency across model structures, both interactions, eHMI information content × gap size and speed × gap size, were retained in the final fixed-effects specification for all three models.

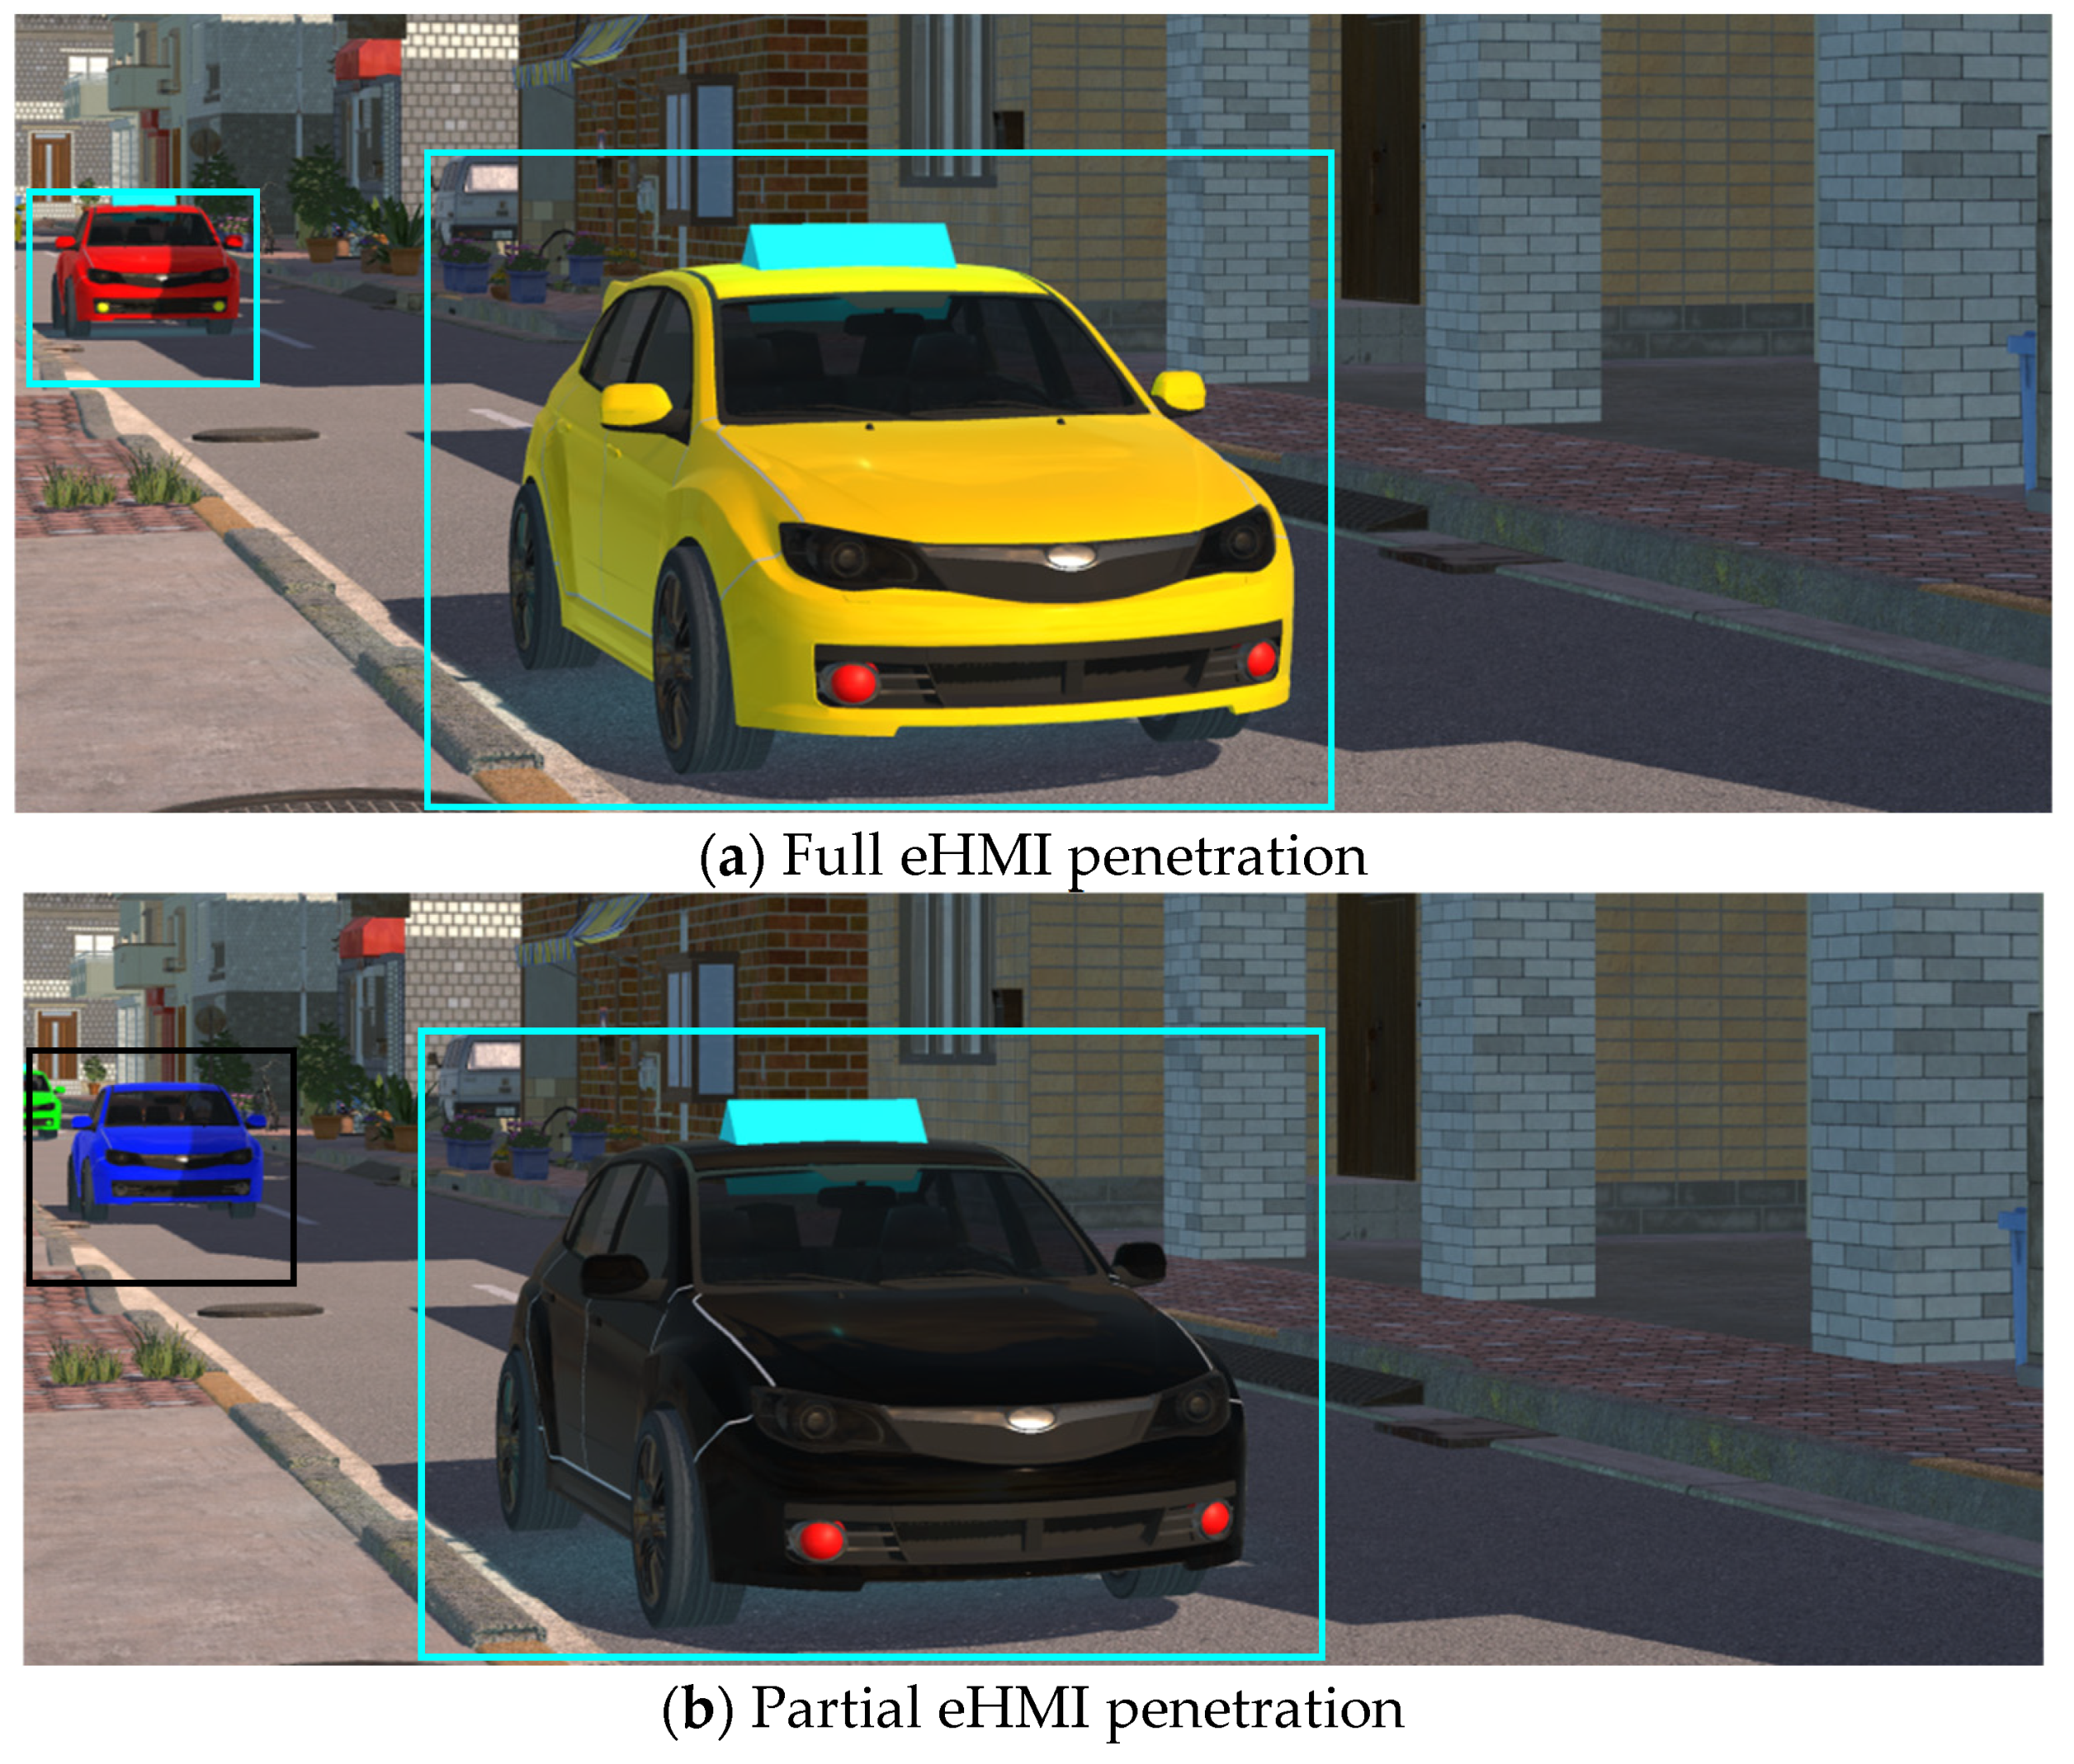
3.1.1. Gap Acceptance Under Full eHMI Penetration Condition

A total of 5184 vehicle–pedestrian encounters were recorded for 12 participants, with each completing 432 trials (2 speeds × 9 gap sizes × 4 repetitions × 6 eHMI information content conditions). Table 1 presents the fixed effects of the final model, showing significant effects of eHMI information content, gap size, and vehicle speed on gap acceptance.
Larger gap sizes and higher vehicle speeds increased the likelihood of crossing. Compared to the three-level low–medium–high condition, participants were more likely to cross under single-level medium, single-level high, two-level low–medium, and two-level medium–high conditions. Significant negative interaction effects with gap size were observed for single-level medium, single-level high, and two-level medium–high conditions, indicating reduced sensitivity to gap size variations. This pattern suggests a higher likelihood of accepting smaller gaps (potentially unsafe) or rejecting larger gaps (missed opportunities), as illustrated in Figure 5.

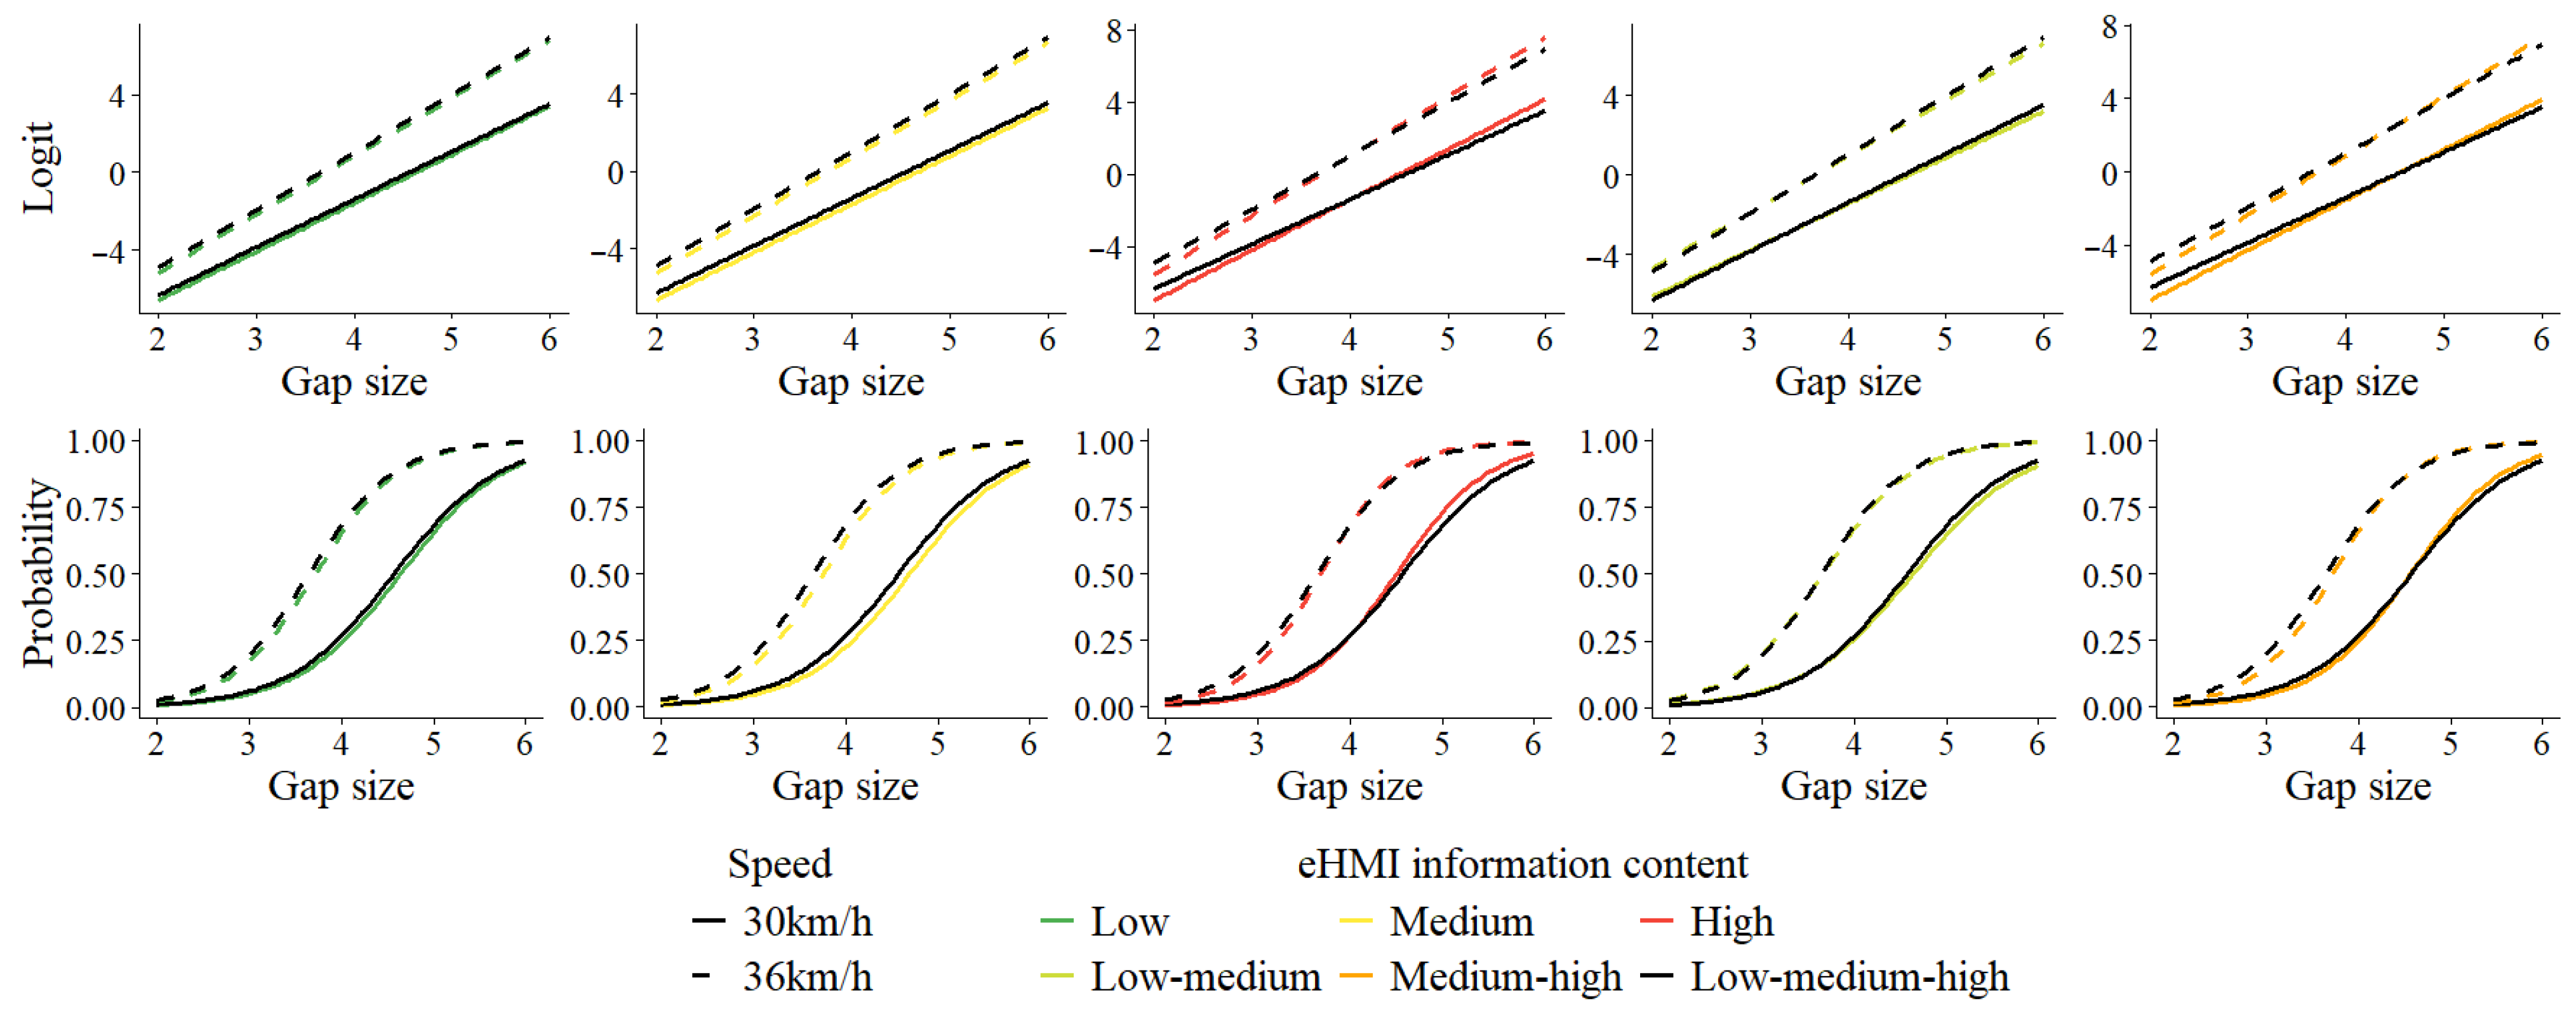
3.1.2. Gap Acceptance Under Partial eHMI Penetration Condition

Due to a technical error in the recording software, data from one participant were lost, resulting in a final sample of 11 participants for the partial eHMI penetration condition. Each participant completed 432 trials, yielding a total of 4752 vehicle-pedestrian encounters. AVs equipped with eHMI (n = 2376) and TVs without eHMI (n = 2376) were analyzed separately.
AVs with eHMI
Table 2 shows that gap size and vehicle speed also exerted statistically significant main effects on participants’ gap acceptance. Similarly, the likelihood of crossing increased with larger temporal gaps and higher vehicle speeds. Regarding eHMI information content, the single-level medium configuration yielded a significant lower likelihood of crossing compared to the three-level low–medium–high condition. Notably, the interactions between gap size and eHMI information content conditions, including the single-level medium, two-level low–medium, and two-level medium–high configurations, were statistically significant and associated with negative coefficients. The interaction between gap size and the single-level high eHMI condition was marginal. As illustrated in Figure 6, these negative interactions suggest that participants exhibited reduced sensitivity to variations in temporal gap under these conditions.
TVs Without eHMI
Table 3 shows that gap size, vehicle speed, and their interaction exerted statistically significant effects on pedestrians’ gap acceptance. Specifically, the likelihood of crossing increased with larger temporal gaps and higher vehicle speeds. Moreover, at higher speeds, participants’ gap acceptance rose more sharply with increasing gap size, indicating heightened sensitivity to temporal gap variations under faster traffic conditions, as illustrated in Figure 7.

3.2. Results of P300

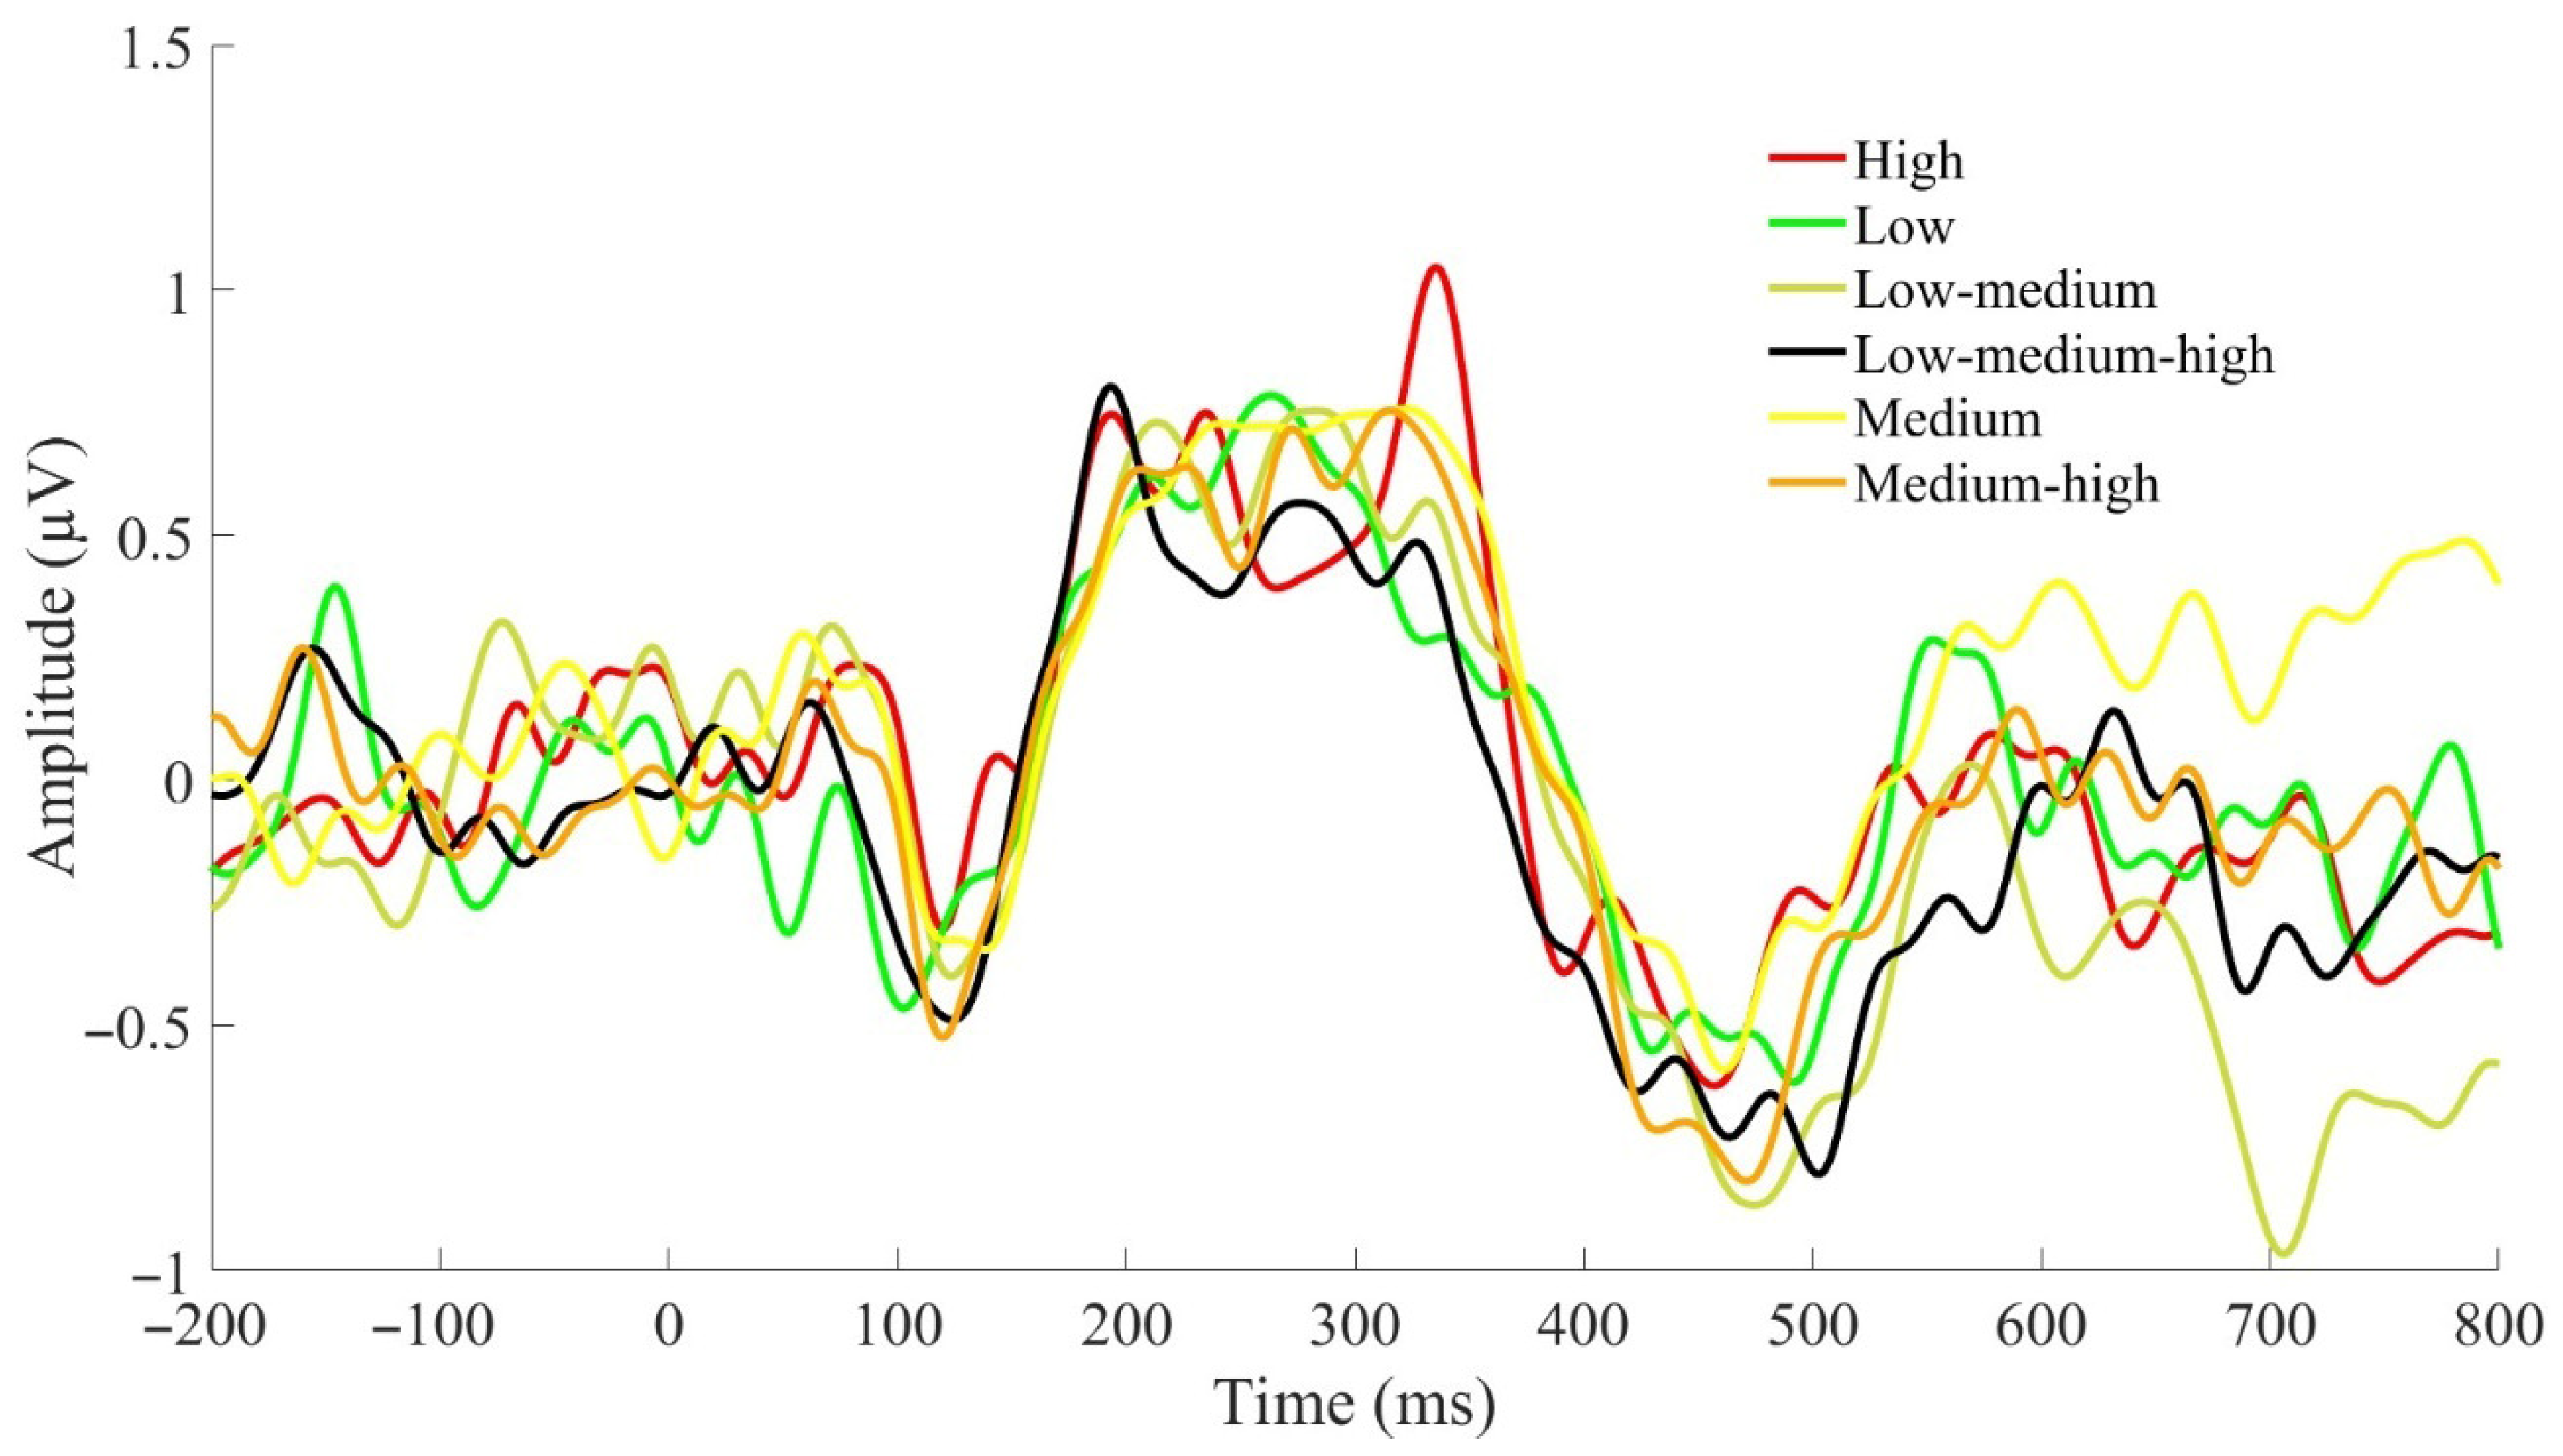
3.2.1. P300 Under Full eHMI Penetration Condition

The mean and SD of P300 across different eHMI information content conditions under full eHMI penetration condition are presented in Table 4 below. Based on the results of the Shapiro–Wilk normality test, significant deviations from normality were observed for the single-level low (p = 0.025) condition, suggesting that these data do not follow a normal distribution. As a result, a Friedman test was conducted to compare the differences between the eHMI information content conditions. The results of the Friedman test indicated that the differences between the eHMI information content conditions were not statistically significant (χ2(5) = 2.06, p = 0.840). Figure 8 illustrates the P300 effects across different eHMI information content conditions under the full penetration condition.

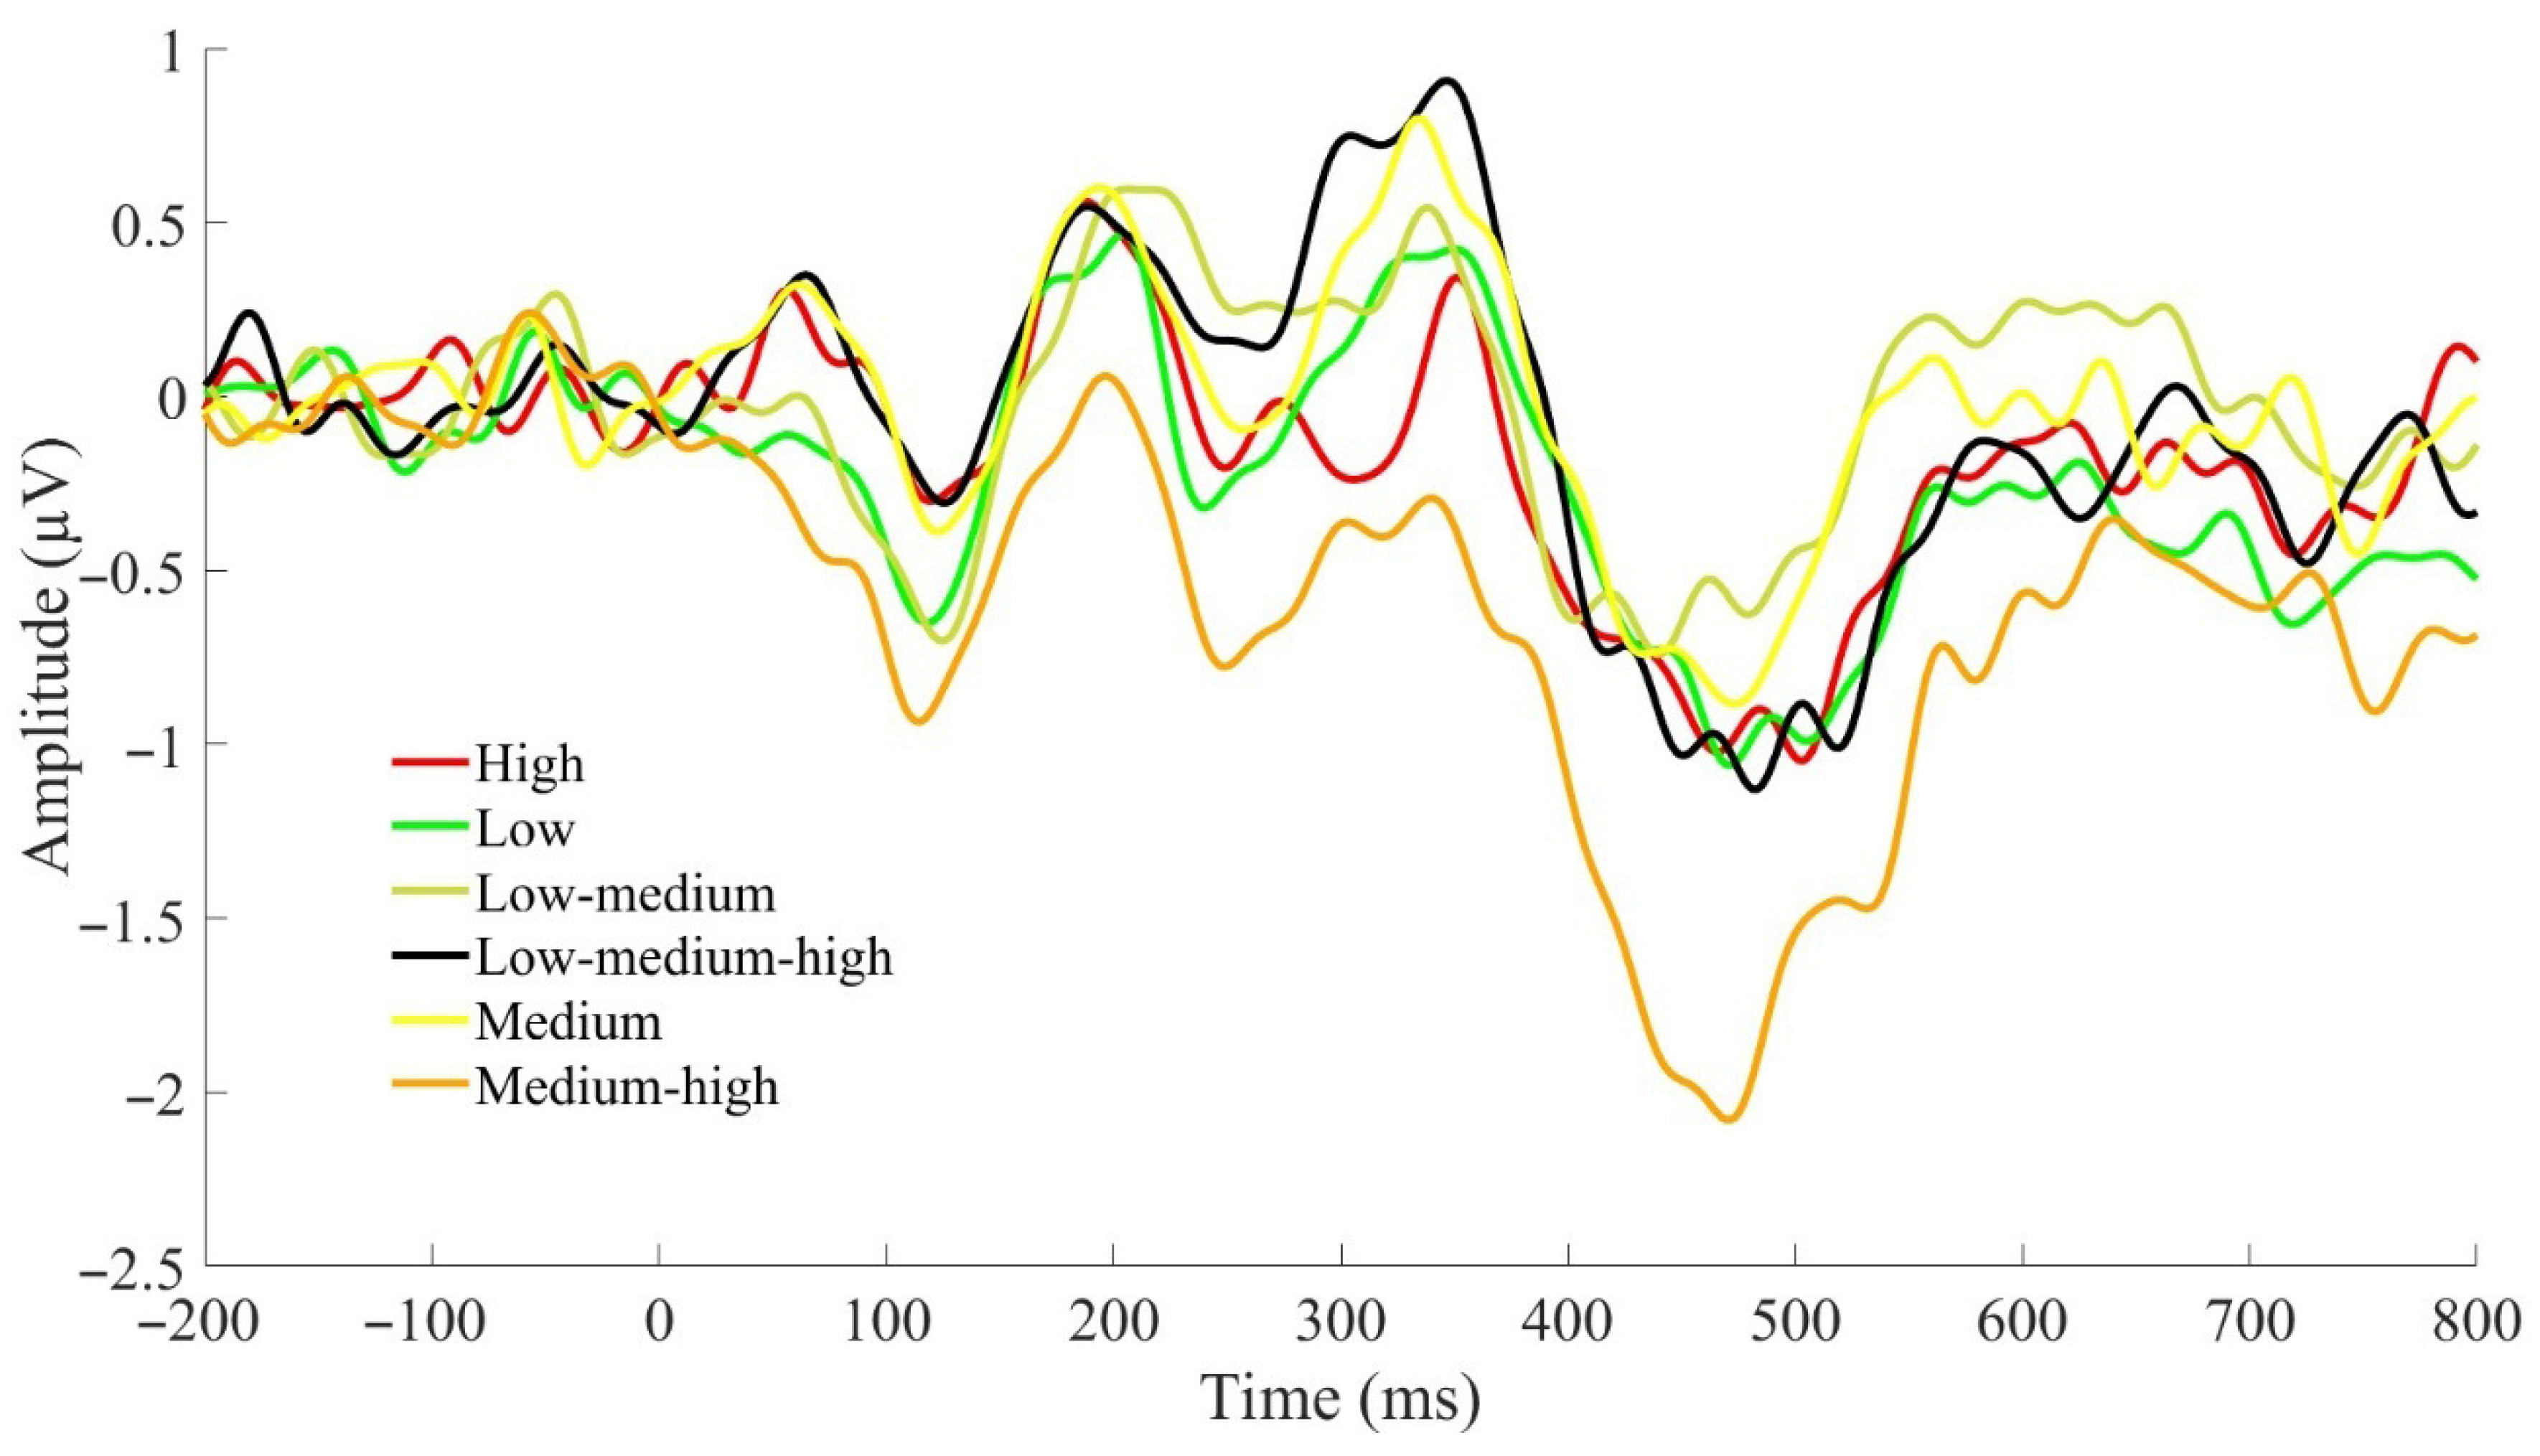
3.2.2. P300 Under Partial eHMI Penetration Condition

The mean and SD of P300 across different eHMI information content conditions under the partial eHMI penetration condition are presented in Table 5. Based on the results of the Shapiro–Wilk normality test, significant deviations from normality were observed for the single-level low risk (p = 0.030), two-level medium-high risk (p = 0.031), and three-level low-medium-high risk (p < 0.001) conditions, suggesting that these data do not follow a normal distribution. As a result, a Friedman test was conducted to compare the differences between the eHMI information content conditions. The results of the Friedman test indicated a significant difference (χ2(5) = 14.58, p = 0.012). Pairwise comparisons using the Wilcoxon test revealed that two-level medium-high was significantly lower than three-level low-medium-high condition (p = 0.037). No other eHMI information content conditions showed significant differences. Figure 9 illustrates the P300 effects across different eHMI information content conditions under the partial penetration condition.

3.3. Results of Oddball Counting Error Rate

3.3.1. Oddball Counting Error Rate Under Full eHMI Penetration Condition

The mean and SD of oddball counting error rate across different eHMI information content conditions are presented in Table 6. Based on the results of the Shapiro–Wilk normality test, significant deviations from normality were observed for the single-level medium (p = 0.028), single-level high (p = 0.017), three-level low–medium–high risk (p = 0.006) conditions, suggesting that these data do not follow a normal distribution. As a result, a Friedman test was conducted to compare the differences between the eHMI information content conditions. The Friedman test revealed no statistically significant differences between the eHMI information content conditions (χ2(5) = 3.37, p = 0.643).

3.3.2. Oddball Counting Error Rate Under Partial eHMI Penetration Condition

The mean and SD of oddball counting error rate across different eHMI information content conditions are presented in Table 7. Based on the results of the Shapiro–Wilk normality test, significant deviations from normality were observed for the single-level low (p < 0.001), single-level medium (p = 0.037), single-level high (p = 0.004), two-level low-medium (p = 0.006) conditions, suggesting that these data do not follow a normal distribution. As a result, a Friedman test was conducted to compare the differences between the eHMI information content conditions. The Friedman test indicated that the differences between the eHMI information content conditions were not statistically significant (χ2(5) = 8.41, p = 0.135).

3.4. Results of Situation Awareness

3.4.1. SA Under Full eHMI Penetration Condition

The mean and SD of SA across different eHMI information content conditions under full eHMI penetration condition are presented in Table 8. Based on the results of the Shapiro–Wilk normality test, no significant deviations from normality were observed for any of the conditions, allowing the assumption that the data follow a normal distribution. A one-way ANOVA was conducted to examine the effect of eHMI information content condition on SA. The results revealed no statistically significant differences among the six eHMI information content conditions (F(5, 66) = 0.733, p = 0.601).

3.4.2. SA Under Partial eHMI Penetration Condition

The mean and SD of SA across different eHMI information content conditions under the partial eHMI penetration condition are presented in Table 9. Based on the results of the Shapiro–Wilk normality test, significant deviations from normality were observed for the three-level low-medium-high (p = 0.029) and two-level medium-high (p = 0.023) conditions, suggesting that these data do not follow a normal distribution. Therefore, a Friedman test was conducted, revealing a statistically significant difference among the six conditions (χ2(5) = 11.37, p = 0.045). However, post hoc pairwise comparisons using the Wilcoxon signed-rank test with Bonferroni correction did not reveal any statistically significant differences between individual condition pairs.

3.5. Results of Feedback

3.5.1. eHMI Information Content Ranking Under Full eHMI Penetration Condition

Under the condition of full eHMI penetration, the ranking rate for each eHMI information content condition was calculated, as presented in Table 10, with the highest percentage highlighted in bold.

3.5.2. eHMI Ranking Under Partial eHMI Penetration Condition

Under the condition of partial eHMI penetration, the ranking rate for each condition was presented in Table 11, with the highest percentage highlighted in bold.

3.5.3. Pros and Cons for Each Information Content

Table 12 summarized pedestrians’ preferences regarding the eHMI information content, along with their corresponding justifications. Participants P1–P12 were involved in the full eHMI penetration condition, while P13–P24 participated under the partial eHMI penetration condition.

4. Discussion

This study investigates the impact of six risk-warning eHMI information content conditions on pedestrian behavior and perception in vehicle–pedestrian interactions. These conditions include single-level (low, medium, or high risk), two-level progression (low–medium or medium–high), and a full three-level progression (low–medium–high). The analysis evaluates pedestrians’ gap acceptance, MW, and SA under both full and partial eHMI penetration scenarios within vehicle platoons. Additionally, qualitative interview data were collected to explore participants’ subjective perceptions of each eHMI condition. By integrating cognitive measures, behavioral responses, and qualitative insights, this multi-method approach provides complementary perspectives, enhancing understanding of risk-warning eHMI effectiveness [53].

4.1. Effects of eHMI Information Contents, Gap Size and Speed on Gap Acceptance

The findings reveal typical gap acceptance patterns [54]: pedestrians are more likely to accept larger temporal gaps, with the probability of crossing increasing significantly as gap size expands. Additionally, higher vehicle speeds significantly increase the likelihood of crossing. This might be due to the fact that, under higher speed conditions, the spatial distance between the vehicle and the pedestrian is greater for the same temporal gap size. Pedestrians tend to perceive this larger spatial distance as a safer situation, thereby increasing the likelihood of crossing. This observation aligns with the previously identified ‘farther and safer’ perceptual bias [55].
This perceptual bias is further reflected in the interaction between vehicle speed and gap size when pedestrians encounter TVs without eHMI under partial eHMI penetration conditions (Partial-TVs), where larger gaps at higher speeds result in a steeper increase in crossing probability. However, this interaction effect did not reach statistical significance under full eHMI penetration conditions or when pedestrians encountered AVs with eHMI under partial penetration conditions (Partial-AVs). This discrepancy may potentially be due to the presence of eHMI. Prior studies suggest that eHMI presence enhances pedestrians’ sensitivity to gap size variations, similar to the effect of vehicle speed [11,14]. The six eHMI configurations in this study may have heightened pedestrians’ sensitivity to the interaction between eHMI and gap size, thereby diminishing the effect of vehicle speed and gap size interaction.
Under both Full- and Partial-AVs conditions, the interaction between eHMI information content and gap size was significant. Compared to the three-level low–medium–high configuration, simplified eHMI configurations—single-level medium, single-level high, two-level low–medium, and two-level medium–high—reduced pedestrians’ sensitivity to gap size variations. Interview data suggest that the three-level configuration was preferred due to that it enabled continuous monitoring and assessment of crossing risk, consistent with findings that multi-state feedback in “intent eHMI” is preferred by pedestrians [27]. Participants also noted that the three-level eHMI resembled traditional traffic lights, enhancing familiarity and acceptability, as supported by [30].
Moreover, the medium-risk eHMI signal posed particular challenges due to its semantic ambiguity. Participants (e.g., P1, P2, P3, P4, P6, P7, P8, P19) reported difficulty interpreting whether the signal indicated “safe” or “dangerous.” This aligns with [9], who found that ambiguous signals, such as a yellow “Caution! Blind Spot” warning, increased alertness but lacked clear guidance. Participants expressed a preference for unambiguous signals, e.g., “Safe” or “Dangerous”. Due to the lack of clear semantic guidance, medium-risk eHMI particularly requires continuous presentation alongside both low- and high-risk signals. When used continuously with only one of these signals, as in the two-level low–medium and two-level medium–high configurations, pedestrians’ sensitivity to variations in gap size is significantly reduced.
The lack of significant differences in gap acceptance between the single-level low-risk eHMI and the three-level configuration may stem from the early activation of the low-risk signal, allowing pedestrians sufficient time for rational decision-making. When the low-risk eHMI is deactivated at a TTA of less than 5.1 s, pedestrians may interpret this as an implicit indication that crossing is no longer safe [27]. This reinforces the effectiveness of the single-level low-risk configuration. Additionally, interview data (e.g., P21) indicated that pedestrians primarily relied on the low-risk signal in the two-level low–medium configuration, often making crossing decisions during the low-risk phase without considering subsequent signals.
Another reason could be that pedestrians exhibited higher compliance with permissive (low-risk) signals compared to prohibitive (high-risk) signals, consistent with [13]. High-risk signals, typically appearing at TTA less than 3.7 s, often failed to deter pedestrians who had already initiated crossing. Moreover, medium- and high-risk signals induced a sense of urgency [12], potentially increasing perceived waiting time [23] and encouraging violations of prohibitive signals [24,25].

4.2. Effects of eHMI Information Contents on MW and SA

Under conditions of full eHMI penetration, no significant differences in MW were observed across the tested eHMI information content configurations. This finding may be attributed to the complexity of multi-vehicle traffic scenarios. Prior research indicates that variations in eHMI information content influence MW in simpler scenarios involving one or two AVs [33,56]. However, in more complex multi-vehicle environments, different eHMI designs did not yield significant MW differences [32,57,58].
In contrast, significant MW differences emerged under partial eHMI penetration conditions. This may be due to the increased cognitive demands of partial penetration scenarios, where pedestrians must adapt their crossing decisions to account for both AVs equipped with eHMIs and TVs without eHMIs [11]. In such contexts, the impact of eHMI information content on MW is likely amplified. Notably, the two-level medium–high configuration significantly increased MW compared to the three-level low-medium-high configuration, potentially due to the perceived urgency of medium- and high-risk signals [12].
Additionally, participant feedback highlighted that the three-level eHMI configuration may elevate MW. Specifically, participants (e.g., P16, P19) reported that interpreting three distinct risk levels increased cognitive complexity, while rapid transitions between levels made it challenging for pedestrians to react (e.g., P14). This observation aligns with ranking results under full eHMI penetration, where 33% of participants ranked the three-level configuration as the most preferred, yet another 33% ranked it as the least preferred (6th). These findings are consistent with theory of [17], which posits that high information volume and rapid data changes can overwhelm individuals due to limited cognitive processing capacity.
In terms of SA, no significant differences were observed across the six information content conditions under the full eHMI penetration condition. Although vehicle kinematics, eHMI, and environmental factors are critical for SA [59], prior studies emphasize vehicle kinematics—particularly speed and distance—as the primary cues for pedestrian crossing decisions, e.g., [12,19,60,61,62].
However, significant SA differences were detected under partial eHMI penetration, likely due to the heightened cognitive demands of this scenario amplifying the influence of eHMI content. As pairwise comparisons revealed no significant differences, further investigation into eHMI’s impact on SA is warranted.

4.3. Implications for eHMI Design and Application Scenarios

This study recommends prioritizing a three-level low–medium–high eHMI configuration to provide pedestrians with continuous risk feedback, thereby enhancing decision-making during street crossings. However, future designs should refine presentation methods to mitigate the potential negative effects of rapid signal changes on MW, as effective information presentation significantly improves processing efficiency [17]. Additionally, a single-level low-risk eHMI configuration may serve as a viable alternative to the three-level design. Future research should compare these configurations to provide robust empirical evidence.
In partial eHMI penetration scenarios, prior studies indicate that the three-level configuration increases MW, reduces SA, and decreases sensitivity to gap size when pedestrians encounter TVs without eHMIs compared to no-eHMI conditions [34]. However, this study found that simplifying eHMI content did not significantly reduce MW, enhance SA, or improve gap size sensitivity compared to the three-level configuration. These findings suggest that deploying AVs with eHMIs in dedicated lanes may mitigate their potential negative impacts on pedestrian cognition and behavior [11].

4.4. Limitations

While this study contributes important findings, several limitations warrant consideration. First, the sample size is relatively small, particularly for EEG-based research, which may limit statistical power and the generalizability of findings. Additionally, demographic factors such as age, gender, occupant status, trust in AVs, and familiarity with AVs could influence results. For example, prior studies have identified age-related differences in MW among pedestrians [63], gender-based variations in eHMI comprehension [64], and nationality-driven differences in eHMI effects on street-crossing decisions [65,66]. Future research should employ larger, more diverse samples to enhance generalizability and systematically investigate the impact of these demographic factors. Second, given the constraints in manipulating AV platoons in real-world settings, as well as safety concerns, a video-based simulation was adopted. While this method offered useful observations, it likely reduced the sense of actual risk for participants. Third, the use of a fixed camera perspective did not reflect individual differences in height, which could influence one’s field of vision. These factors highlight the need for future studies conducted in real-world or immersive VR environments. Fourth, while the uncontrolled traffic scenario without traffic lights or crosswalks is highly relevant, it is imperative to investigate eHMI performance in signalized environments. Such studies would elucidate how infrastructural elements moderate eHMI effects on crossing decisions and MW [37]. Fifth, this study was conducted under clear weather and daylight conditions, excluding adverse weather (e.g., rain, fog) and variable lighting, which may compromise eHMI visibility [19]. This is particularly pertinent for risk-warning eHMIs based on TTA, where low-risk signals (TTA > 5.1 s) may be less discernible in challenging conditions, requiring further investigation. Moreover, adverse weather, such as rain or extreme heat, is associated with elevated injury risks and crash severity [67,68]. Thus, evaluating eHMI effectiveness in enhancing pedestrian safety under such conditions is imperative. Sixth, this research focused on an abstract light-based eHMI [8]. Although such abstract eHMI can be effectively understood, especially after repeated exposures or dedicated training [10,29,37], alternative eHMI designs—such as textual displays, symbolic icons, or human-like representations—should be systematically examined in future investigations. Seventh, the within-subject design may introduce learning or fatigue effects, potentially biasing results. Although we employed familiarization, randomization, and rest periods to mitigate these issues, future studies should further investigate trial-order effects, learning curves, and fatigue to better understand their impact on eHMI effectiveness.

5. Conclusions

This study demonstrates that the three-level eHMI configuration outperforms single-level (medium or high) and two-level (low–medium or medium–high) configurations in enhancing pedestrians’ sensitivity to gap size under both full and partial eHMI penetration conditions. Specifically, under the three-level configuration condition, pedestrians were more likely to reject smaller gaps and accept larger ones, indicating improved decision-making safety. Furthermore, under partial penetration conditions, the three-level configuration resulted in lower MW compared to the two-level medium-high configuration. Despite these advantages, the rapid signal changes in the three-level configuration may pose challenges, necessitating future research to optimize presentation methods and mitigate potential drawbacks. Notably, the single-level low configuration exhibited comparable performance in gap acceptance, MW, and SA, suggesting it as a simpler, yet effective, alternative for real-world eHMI deployment.

Author Contributions

Conceptualization, F.Y., X.S., J.B., B.L., L.F.M.L. and S.Z.; Formal analysis, F.Y.; Funding acquisition, X.S.; Investigation, F.Y.; Supervision, X.S., B.L. and S.Z.; Writing—original draft, F.Y.; Writing—review and editing, X.S., J.B. and L.F.M.L. All authors have read and agreed to the published version of the manuscript.

Funding

This research was funded by a grant from the Zhejiang Ningbo Science and Technology Bureau, 2025 Key Technological Innovation Program of Ningbo City, grant number 2022Z080.

Institutional Review Board Statement

This study was conducted in accordance with the ethical standards of the institutional and national research committees and with the Helsinki declaration. Ethical approval was obtained from the Ethics Review Committee of University of Nottingham Ningbo, China (Approval Number: FOSE-202425-037).

Informed Consent Statement

Informed consent was obtained from all subjects involved in the study. Written informed consent has been obtained from the subject in Figure 4 to publish this paper.

Data Availability Statement

Data will be made available on request.

Acknowledgments

We sincerely thank the School of Art and Design at Qilu University of Technology, as well as Puhong Li and her research team, for generously providing the essential equipment and facilities that supported this research.

Conflicts of Interest

The authors declare that they have no known competing financial interests or personal relationships that could have appeared to influence the work reported in this paper.

References

  1. SAE International. Levels of Driving Automation. 2022. Available online: https://www.sae.org/blog/sae-j3016-update (accessed on 19 July 2024).
  2. Yang, S.; Du, M.; Chen, Q. Impact of connected and autonomous vehicles on traffic efficiency and safety of an on-ramp. Simul. Model. Pract. Theory 2021, 113, 102374. [Google Scholar] [CrossRef]
  3. de Winter, J.; Dodou, D. External human–machine interfaces: Gimmick or necessity? Transp. Res. Interdiscip. Perspect. 2022, 15, 100643. [Google Scholar] [CrossRef]
  4. Man, S.S.; Huang, C.; Ye, Q.; Chang, F.; Chan, A.H.S. Pedestrians’ interaction with eHMI-equipped autonomous vehicles: A bibliometric analysis and systematic review. Accid. Anal. Prev. 2025, 209, 107826. [Google Scholar] [CrossRef] [PubMed]
  5. Uttley, J.; Lee, Y.M.; Madigan, R.; Merat, N. Road user interactions in a shared space setting: Priority and communication in a UK car park. Transp. Res. Part F Traffic Psychol. Behav. 2020, 72, 32–46. [Google Scholar] [CrossRef]
  6. National Safety Council. Pedestrians. 2021. Available online: https://injuryfacts.nsc.org/motor-vehicle/road-users/pedestrians/ (accessed on 21 July 2024).
  7. Bazilinskyy, P.; Dodou, D.; de Winter, J. Survey on eHMI concepts: The effect of text, color, and perspective. Transp. Res. Part F Traffic Psychol. Behav. 2019, 67, 175–194. [Google Scholar] [CrossRef]
  8. Dey, D.; Habibovic, A.; Löcken, A.; Wintersberger, P.; Pfleging, B.; Riener, A.; Martens, M.; Terken, J. Taming the eHMI jungle: A classification taxonomy to guide, compare, and assess the design principles of automated vehicles’ external human-machine interfaces. Transp. Res. Interdiscip. Perspect. 2020, 7, 100174. [Google Scholar] [CrossRef]
  9. Chen, X.; Li, X.; Hou, Y.; Yang, W.; Dong, C.; Wang, H. Effect of eHMI-equipped automated vehicles on pedestrian crossing behavior and safety: A focus on blind spot scenarios. Accid. Anal. Prev. 2025, 212, 107915. [Google Scholar] [CrossRef] [PubMed]
  10. de Clercq, K.; Dietrich, A.; Nunez Velasco, J.P.; de Winter, J.; Happee, R. External human-machine interfaces on automated vehicles: Effects on pedestrian crossing decisions. Hum. Factors 2019, 61, 1353–1370. [Google Scholar] [CrossRef] [PubMed]
  11. Song, Y.; Jiang, Q.; Chen, W.; Zhuang, X.; Ma, G. Pedestrians’ road-crossing behavior towards eHMI-equipped autonomous vehicles driving in segregated and mixed traffic conditions. Accid. Anal. Prev. 2023, 188, 107115. [Google Scholar] [CrossRef] [PubMed]
  12. Li, Y.; Dikmen, M.; Hussein, T.G.; Wang, Y.; Burns, C. To cross or not to cross: Urgency-based external warning displays on autonomous vehicles to improve pedestrian crossing safety. In Proceedings of the 10th International Conference on Automotive User Interfaces and Interactive Vehicular Applications, Toronto, ON, Canada, 23–25 September 2018; pp. 188–197. [Google Scholar]
  13. Rahimian, P.; O’Neal, E.E.; Zhou, S.; Plumert, J.M.; Kearney, J.K. Harnessing vehicle-to-pedestrian (V2P) communication technology: Sending traffic warnings to texting pedestrians. Hum. Factors 2018, 60, 833–843. [Google Scholar] [CrossRef] [PubMed]
  14. Chen, W.; Jiang, Q.; Zhuang, X. Comparison of pedestrians’ gap acceptance behavior towards automated and human-driven vehicles. Engineering Psychology and Cognitive Ergonomics. In Proceedings of the Cognition and Design: 17th International Conference, EPCE 2020, Held as Part of the 22nd HCI International Conference, HCII 2020, Copenhagen, Denmark, 19–24 July 2020; pp. 253–261. [Google Scholar]
  15. Longo, L.; Wickens, C.D.; Hancock, G.; Hancock, P.A. Human mental workload: A survey and a novel inclusive definition. Front. Psychol. 2022, 13, 883321. [Google Scholar] [CrossRef] [PubMed]
  16. Vidulich, M.A.; Tsang, P.S. Mental workload and situation awareness. In Handbook of Human Factors and Ergonomics, 4th ed.; Salvendy, G., Ed.; John Wiley & Sons, Inc.: Hoboken, NJ, USA, 2012; pp. 243–273. [Google Scholar]
  17. Endsley, M.R. Situation awareness. In Handbook of Human Factors and Ergonomics, 5th ed.; Salvendy, G., Karwowski, W., Eds.; John Wiley & Sons, Inc.: Hoboken, NJ, USA, 2021; pp. 434–455. [Google Scholar]
  18. Endsley, M.R. Toward a theory of situation awareness in dynamic systems. Hum. Factors J. Hum. Factors Ergon. Soc. 1995, 37, 32–64. [Google Scholar] [CrossRef]
  19. Palmeiro, A.R.; van der Kint, S.; Vissers, L.; Farah, H.; de Winter, J.; Hagenzieker, M. Interaction between pedestrians and automated vehicles: A Wizard of Oz experiment. Transp. Res. Part F Traffic Psychol. Behav. 2018, 58, 1005–1020. [Google Scholar] [CrossRef]
  20. Kaß, C.; Schoch, S.; Naujoks, F.; Hergeth, S.; Keinath, A.; Neukum, A. Standardized test procedure for external human–machine interfaces of automated vehicles. Information 2020, 11, 173. [Google Scholar] [CrossRef]
  21. Tabone, W.; de Winter, J.; Ackermann, C.; Bärgman, J.; Baumann, M.; Deb, S.; Emmenegger, C.; Habibovic, A.; Hagenzieker, M.; Hancock, P.A.; et al. Vulnerable road users and the coming wave of automated vehicles: Expert perspectives. Transp. Res. Interdiscip. Perspect. 2021, 9, 100293. [Google Scholar] [CrossRef]
  22. Rahimian, P.; O’Neal, E.E.; Yon, J.P.; Franzen, L.; Jiang, Y.; Plumert, J.M.; Kearney, J.K. Using a virtual environment to study the impact of sending traffic alerts to texting pedestrians. In Proceedings of the IEEE Virtual Reality (VR), Greenville, SC, USA, 19–23 March 2016; pp. 141–149. [Google Scholar]
  23. Cao, Y.; Zhuang, X.; Ma, G. Shorten pedestrians’ perceived waiting time: The effect of tempo and pitch in audible pedestrian signals at red phase. Accid. Anal. Prev. 2019, 123, 336–340. [Google Scholar] [CrossRef] [PubMed]
  24. Raoniar, R.; Maurya, A.K. Pedestrian red-light violation at signalised intersection crosswalks: Influence of social and non-social factors. Saf. Sci. 2022, 147, 105583. [Google Scholar] [CrossRef]
  25. Mukherjee, D.; Mitra, S. A comprehensive study on factors influencing pedestrian signal violation behaviour: Experience from Kolkata City, India. Saf. Sci. 2020, 124, 104610. [Google Scholar] [CrossRef]
  26. Colley, M.; Bajrovic, E.; Rukzio, E. Effects of pedestrian behavior, time pressure, and repeated exposure on crossing decisions in front of automated vehicles equipped with external communication. In Proceedings of the CHI Conference on Human Factors in Computing Systems, New Orleans, LA, USA, 29 April–5 May 2022; pp. 1–11. [Google Scholar]
  27. Dey, D.; Habibovic, A.; Berger, M.; Bansal, D.; Cuijpers, R.H.; Martens, M. Investigating the need for explicit communication of non-yielding intent through a slow-pulsing light band (SPLB) eHMI in AV-pedestrian interaction. In Proceedings of the 14th International Conference on Automotive User Interfaces and Interactive Vehicular Applications, Seoul, Republic of Korea, 17–20 September 2022; pp. 307–318. [Google Scholar]
  28. Zhao, X.; Li, X.; Rakotonirainy, A.; Bourgeois-Bougrine, S.; Gruyer, D.; Delhomme, P. The ‘invisible gorilla’ during pedestrian-AV interaction: Effects of secondary tasks on pedestrians’ reaction to eHMIs. Accid. Anal. Prev. 2023, 192, 107246. [Google Scholar] [CrossRef] [PubMed]
  29. Liu, H.; Hirayama, T. Pre-instruction for pedestrians interacting autonomous vehicles with eHMI: Effects on their psychology and walking behavior. IEEE Trans. Intell. Transp. Syst. 2025, 1–12. [Google Scholar] [CrossRef]
  30. Lee, Y.M.; Sidorov, V.; Madigan, R.; Garcia de Pedro, J.; Markkula, G.; Merat, N. Hello, is it me you’re stopping for? The effect of external human machine interface familiarity on pedestrians’ crossing behaviour in an ambiguous situation. Hum. Factors 2025, 67, 264–279. [Google Scholar] [CrossRef] [PubMed]
  31. Lyu, W.; Zhang, W.; Wang, X.; Ding, Y.; Yang, X. Pedestrians’ responses to scalable automated vehicles with different external human-machine interfaces: Evidence from a video-based eye-tracking experiment. Transp. Res. Part F Traffic Psychol. Behav. 2024, 103, 112–127. [Google Scholar] [CrossRef]
  32. Colley, M.; Britten, J.; Rukzio, E. Scalability in external communication of automated vehicles: Evaluation and recommendations. Proc. ACM Interact. Mob. Wearable Ubiquitous Technol. 2023, 7, 1–26. [Google Scholar] [CrossRef]
  33. Colley, M.; Walch, M.; Gugenheimer, J.; Askari, A.; Rukzio, E. Towards inclusive external communication of autonomous vehicles for pedestrians with vision impairments. In Proceedings of the 2020 CHI Conference on Human Factors in Computing Systems, Honolulu, HI, USA, 25–30 April 2020; pp. 1–14. [Google Scholar]
  34. Yang, F.; Sun, X.; Ma, J.; Zhou, S.; Liu, B.; Li, P.; Lyu, W.; Wen, S. Neuroergonomic evaluation of risk-warning eHMI penetration rates in vehicle platoons: Effects on pedestrians’ mental workload, situation awareness, and gap acceptance. Sci. Rep. 2025. submitted. [Google Scholar]
  35. Eisma, Y.B.; van Gent, L.; de Winter, J. Should an external human-machine interface flash or just show text? A study with a gaze-contingent setup. Transp. Res. Part F Traffic Psychol. Behav. 2023, 97, 140–154. [Google Scholar] [CrossRef]
  36. Bazilinskyy, P.; Kooijman, L.; Dodou, D.; de Winter, J. How should external human-machine interfaces behave? Examining the effects of colour, position, message, activation distance, vehicle yielding, and visual distraction among 1,434 participants. Appl. Ergon. 2021, 95, 103450. [Google Scholar] [CrossRef] [PubMed]
  37. Yang, Y.; Lee, Y.M.; Madigan, R.; Solernou, A.; Merat, N. Interpreting pedestrians’ head movements when encountering automated vehicles at a virtual crossroad. Transp. Res. Part F Traffic Psychol. Behav. 2024, 103, 340–352. [Google Scholar] [CrossRef]
  38. Sun, R.; Zhuang, X.; Wu, C.; Zhao, G.; Zhang, K. The estimation of vehicle speed and stopping distance by pedestrians crossing streets in a naturalistic traffic environment. Transp. Res. Part F Traffic Psychol. Behav. 2015, 30, 97–106. [Google Scholar] [CrossRef]
  39. ISO/TR 23049:2018; Road Vehicles—Ergonomic Aspects of External Visual Communication from Automated Vehicles to Other Road Users. International Organization for Standardization: Geneva, Switzerland, 2018. Available online: https://www.iso.org/standard/74397.html (accessed on 30 January 2024).
  40. Salmon, P.; Stanton, N.; Walker, G.; Green, D. Situation awareness measurement: A review of applicability for C4i environments. Appl. Ergon. 2006, 37, 225–238. [Google Scholar] [CrossRef] [PubMed]
  41. Tobii. Metrics for Eye Tracking Analytics. Available online: https://developer.tobii.com/xr/learn/analytics/fundamentals/metrics/ (accessed on 30 January 2024).
  42. Guo, F.; Lyu, W.; Ren, Z.; Li, M.; Liu, Z. A video-based, eye-tracking study to investigate the effect of eHMI modalities and locations on pedestrian–automated vehicle interaction. Sustainability 2022, 14, 5633. [Google Scholar] [CrossRef]
  43. Marquart, G.; Cabrall, C.; de Winter, J. Review of eye-related measures of drivers’ mental workload. Procedia Manuf. 2015, 3, 2854–2861. [Google Scholar] [CrossRef]
  44. Bindschädel, J.; Krems, I.; Kiesel, A. Active vehicle pitch motion for communication in automated driving. Transp. Res. Part F Traffic Psychol. Behav. 2022, 87, 279–294. [Google Scholar] [CrossRef]
  45. Kolev, V.; Demiralp, T.; Yordanova, J.; Ademoglu, A.; Isoglu-Alkaç, Ü. Time–frequency analysis reveals multiple functional components during oddball P300. Neuroreport 1997, 8, 2061–2065. [Google Scholar] [CrossRef] [PubMed]
  46. Liebherr, M.; Corcoran, A.W.; Alday, P.M.; Coussens, S.; Bellan, V.; Howlett, C.A.; Immink, M.A.; Kohler, M.; Schlesewsky, M.; Bornkessel-Schlesewsky, I. EEG and behavioral correlates of attentional processing while walking and navigating naturalistic environments. Sci. Rep. 2021, 11, 22325. [Google Scholar] [CrossRef] [PubMed]
  47. Polich, J. 50+ years of P300: Where are we now? Psychophysiology 2020, 57, e13616. [Google Scholar] [CrossRef] [PubMed]
  48. Giraudet, L.; Imbert, J.P.; Berenger, M.; Tremblay, S.; Causse, M. The neuroergonomic evaluation of human machine interface design in air traffic control using behavioral and EEG/ERP measures. Behav. Brain Res. 2015, 294, 246–253. [Google Scholar] [CrossRef] [PubMed]
  49. Bolton, M.; Biltekoff, E.; Humphrey, L. The level of measurement of subjective situation awareness and its dimensions in the situation awareness rating technique (SART). IEEE Trans. Hum.-Mach. Syst. 2022, 52, 1147–1154. [Google Scholar] [CrossRef]
  50. Colley, M.; Li, S.; Rukzio, E. Increasing pedestrian safety using external communication of autonomous vehicles for signalling hazards. In Proceedings of the 23rd International Conference on Mobile Human-Computer Interaction, Toulouse, France, 27 September–1 October 2021; pp. 1–10. [Google Scholar]
  51. Eisele, D.; Petzoldt, T. Effects of traffic context on eHMI icon comprehension. Transp. Res. Part F Traffic Psychol. Behav. 2022, 85, 1–12. [Google Scholar] [CrossRef]
  52. Zhao, X.; Li, X.; Rakotonirainy, A.; Bourgeois-Bougrine, S.; Zhu, Z.; Delhomme, P. Crossing roads in a social context: How behaviors of others shape pedestrian interaction with automated vehicles. Transp. Res. Part F Traffic Psychol. Behav. 2024, 102, 88–106. [Google Scholar] [CrossRef]
  53. Madigan, R.; Lee, Y.M.; Lyu, W.; Carlowitz, S.; de Pedro, J.G.; Merat, N. Pedestrian interactions with automated vehicles: Does the presence of a zebra crossing affect how eHMIs and movement patterns are interpreted? Transp. Res. Part F Traffic Psychol. Behav. 2023, 98, 170–185. [Google Scholar] [CrossRef]
  54. Kadali, B.R.; Vedagiri, P.; Rathi, N. Models for pedestrian gap acceptance behaviour analysis at unprotected mid-block crosswalks under mixed traffic conditions. Transp. Res. Part F Traffic Psychol. Behav. 2015, 32, 114–126. [Google Scholar] [CrossRef]
  55. Chuang, C.H.; Chiu, T.F.; Hsu, H.C.; Lin, S.S. Coupling mobile brain imaging and virtual reality omnidirectional treadmill to explore attenuated situational awareness during distracted walking. IEEE Trans. Cogn. Dev. Syst. 2024, 16, 1063–1076. [Google Scholar] [CrossRef]
  56. Forke, J.; Fröhlich, P.; Suette, S.; Gafert, M.; Puthenkalam, J.; Diamond, L.; Zeilinger, M.; Tscheligi, M. Understanding the headless rider: Display-based awareness and intent-communication in automated vehicle-pedestrian interaction in mixed traffic. Multimodal Technol. Interact. 2021, 5, 51. [Google Scholar] [CrossRef]
  57. Holländer, K.; Hoggenmüller, M.; Gruber, R.; Völkel, S.T.; Butz, A. Take it to the curb: Scalable communication between autonomous cars and vulnerable road users through curbstone displays. Front. Comput. Sci. 2022, 4, 844245. [Google Scholar] [CrossRef]
  58. Tran, T.T.M.; Parker, C.; Hoggenmüller, M.; Wang, Y.; Tomitsch, M. Exploring the impact of interconnected external interfaces in autonomous vehicles on pedestrian safety and experience. In Proceedings of the CHI Conference on Human Factors in Computing Systems, Honolulu, HI, USA, 11–16 May 2024; pp. 1–17. [Google Scholar]
  59. Jiang, Q.; Zhuang, X.; Ma, G. Evaluation of external HMI in autonomous vehicles based on pedestrian road crossing decision-making model. Adv. Psychol. Sci. 2022, 29, 1979–1992. [Google Scholar] [CrossRef]
  60. Dey, D.; Matviienko, A.; Berger, M.; Pfleging, B.; Martens, M.; Terken, J. Communicating the intention of an automated vehicle to pedestrians: The contributions of eHMI and vehicle behavior. IT-Inf. Technol. 2020, 63, 123–141. [Google Scholar] [CrossRef]
  61. Dey, D.; Terken, J. Pedestrian interaction with vehicles: Roles of explicit and implicit communication. In Proceedings of the 9th International Conference on Automotive User Interfaces and Interactive Vehicular Applications, Oldenburg, Germany, 24–27 September 2017; pp. 109–113. [Google Scholar]
  62. Lee, Y.M.; Madigan, R.; Giles, O.; Garach-Morcillo, L.; Markkula, G.; Fox, C.; Camara, F.; Rothmueller, M.; Vendelbo-Larsen, S.A.; Rasmussen, P.H.; et al. Road users rarely use explicit communication when interacting in today’s traffic: Implications for automated vehicles. Cogn. Technol. Work 2020, 23, 367–380. [Google Scholar] [CrossRef]
  63. Dommes, A. Street-crossing workload in young and older pedestrians. Accid. Anal. Prev. 2019, 128, 175–184. [Google Scholar] [CrossRef] [PubMed]
  64. Chang, C.M. A gender study of communication interfaces between an autonomous car and a pedestrian. In Proceedings of the 12th International Conference on Automotive User Interfaces and Interactive Vehicular Applications, Virtual Event, 21–22 September 2020; pp. 42–45. [Google Scholar]
  65. Joisten, P.; Liu, Z.; Theobald, N.; Webler, A.; Abendroth, B. Communication of automated vehicles and pedestrian groups: An intercultural study on pedestrians’ street crossing decisions. In Proceedings of the Mensch und Computer 2021, Ingolstadt, Germany, 5–8 September 2021; pp. 49–53. [Google Scholar]
  66. Lanzer, M.; Babel, F.; Yan, F.; Zhang, B.; You, F.; Wang, J.; Baumann, M. Designing communication strategies of autonomous vehicles with pedestrians: An intercultural study. In Proceedings of the 12th International Conference on Automotive User Interfaces and Interactive Vehicular Applications, Virtual Event, 21–22 September 2020; pp. 122–131. [Google Scholar]
  67. Hsu, C.K.; Rodriguez, D.A. A comparison of heat effects on road injury frequency between active travelers and motorized transportation users in six tropical and subtropical cities in Taiwan. Soc. Sci. Med. 2024, 360, 117333. [Google Scholar] [CrossRef] [PubMed]
  68. Zhai, X.; Huang, H.; Sze, N.N.; Song, Z.; Hon, K.K. Diagnostic analysis of the effects of weather condition on pedestrian crash severity. Accid. Anal. Prev. 2019, 122, 318–324. [Google Scholar] [CrossRef] [PubMed]
Figure 1. Traffic scene from the perspective of a pedestrian.
Applsci 15 08250 g001
Figure 2. Variations in risk-warning eHMI information content. The symbol “×” denotes eHMI deactivation in specific TTA ranges for each condition.
Applsci 15 08250 g002
Figure 3. Variations in eHMI penetration rates within vehicle platoon.
Applsci 15 08250 g003
Figure 4. EEG helmet and electrodes placement.
Applsci 15 08250 g004
Figure 5. The predicted outcome of gap acceptance in probability and logit space under full eHMI penetration conditions.
Applsci 15 08250 g005
Figure 6. The predicted outcome of gap acceptance in probability and logit space for vehicles with eHMI under partial eHMI penetration condition.
Applsci 15 08250 g006
Figure 7. The predicted outcome of gap acceptance in probability and logit space for vehicles without eHMI under partial eHMI penetration condition.
Applsci 15 08250 g007
Figure 8. P300 effects across different eHMI information content conditions under full penetration condition.
Applsci 15 08250 g008
Figure 9. P300 effects across different eHMI information content conditions under partial penetration condition.
Applsci 15 08250 g009
Table 1. GLMM results for gap acceptance under full eHMI penetration conditions.
PredictorsEstimateStd. Errorz ValuePr (>|z|)
(Intercept)−1.7240.422−4.091<0.001
‘eHMI’ Low0.2410.2021.1910.234
‘eHMI’ Medium0.3850.1931.9910.046
‘eHMI’ High0.5040.1952.5910.010
‘eHMI’ Low-medium0.9130.1984.601<0.001
‘eHMI’ Medium-high0.7680.1943.955<0.001
Speed 36 km/h1.9360.12315.744<0.001
Gap size4.7930.30715.625<0.001
‘eHMI’ Low: Gap size−0.0860.382−0.2250.822
‘eHMI’ Medium: Gap size−0.8580.345−2.4870.013
‘eHMI’ High: Gap size−0.7070.351−2.0130.044
‘eHMI’ Low-medium: Gap size−0.3680.367−1.0020.316
‘eHMI’ Medium-high: Gap size−0.7440.349−2.1300.033
Speed 36 km/h: Gap size−0.0350.207−0.1670.867
Table 2. GLMM results for gap acceptance of AVs with eHMI under partial eHMI penetration conditions.
PredictorsEstimateStd. Errorz ValuePr (>|z|)
(Intercept)−0.9140.480−1.9040.057
‘eHMI’ Low−0.0300.271−0.1110.912
‘eHMI’ Medium−0.7370.267−2.7560.006
‘eHMI’ High−0.0610.269−0.2270.821
‘eHMI’ Low-medium0.0380.2670.1410.888
‘eHMI’ Medium-high−0.3540.266−1.3330.183
Speed 36 km/h1.8710.16711.231<0.001
Gap size4.3920.40410.861<0.001
‘eHMI’ Low: Gap size−0.6630.470−1.4110.158
‘eHMI’ Medium: Gap size−1.3200.437−3.0190.003
‘eHMI’ High: Gap size−0.7900.462−1.7090.087
‘eHMI’ Low-medium: Gap size−0.9110.456−2.0010.045
‘eHMI’ Medium-high: Gap size−1.1290.445−2.5380.011
Speed 36 km/h: Gap size0.2020.2420.8350.404
Table 3. GLMM results for gap acceptance of vehicles without eHMI under partial eHMI penetration condition.
PredictorsEstimateStd. Errorz ValuePr (>|z|)
(Intercept)−1.3820.534−2.5890.010
‘eHMI’ Low−0.1940.255−0.7630.446
‘eHMI’ Medium−0.3200.256−1.2500.211
‘eHMI’ High−0.0030.259−0.0130.989
‘eHMI’ Low-medium−0.0760.251−0.3050.760
‘eHMI’ Medium-high−0.1350.259−0.5220.601
Speed 36 km/h2.4120.17813.585<0.001
Gap size3.1760.28211.242<0.001
‘eHMI’ Low: Gap size0.0410.3470.1190.905
‘eHMI’ Medium: Gap size0.0310.3470.0900.928
‘eHMI’ High: Gap size0.4100.3691.1120.266
‘eHMI’ Low-medium: Gap size−0.1580.336−0.4690.639
‘eHMI’ Medium-high: Gap size0.3530.3650.9670.333
Speed 36 km/h: Gap size0.6470.2332.7720.006
Table 4. Mean and SD of P300 amplitude across different eHMI information content conditions under full penetration condition.
P300LowMediumHighLow-MediumMedium-HighLow-Medium-High
Mean1.261.361.351.291.261.17
SD1.170.901.000.821.461.22
Table 5. Mean and SD of P300 amplitude across different eHMI information content conditions under partial penetration condition.
P300LowMediumHighLow–MediumMedium–HighLow–Medium–High
Mean1.101.370.971.030.331.47
SD1.511.491.610.941.101.97
Table 6. Mean and SD of oddball counting error rate across different eHMI information content conditions under full penetration condition.
OddballLowMediumHighLow–MediumMedium–HighLow–Medium–High
Mean3.004.583.002.753.754.83
SD2.834.683.572.863.915.13
Table 7. Mean and SD of oddball counting error rate across different eHMI information content conditions under partial penetration condition.
OddballLowMediumHighLow–MediumMedium–HighLow–Medium–High
Mean1.802.303.403.705.001.90
SD2.822.164.483.334.521.79
Table 8. Mean and SD of SA across different eHMI information content conditions under full penetration condition.
SALowMediumHighLow–MediumMedium–High Low–Medium–High
Mean4.256.255.585.925.005.50
SD2.733.363.032.872.522.61
Table 9. Mean and SD of SA across different eHMI information content conditions under the partial penetration condition.
SALowMediumHighLow–MediumMedium–HighLow–Medium–High
Mean4.834.083.173.423.254.75
SD2.542.251.912.331.922.65
Table 10. Ranking rates of different eHMI information content conditions under the full eHMI penetration condition.
eHMI Information Content ConditionsRankings
123456
Medium–high0.330.170.000.330.080.08
Low–medium–high0.330.080.080.080.080.33
High0.250.080.080.170.250.17
Low–medium0.000.500.170.080.250.00
Low0.080.080.420.170.080.17
Medium0.000.080.250.170.250.25
Table 11. Ranking rates of different eHMI information content conditions under partial penetration condition.
eHMI Information Content ConditionsRankings
123456
Low–medium–high0.420.330.170.000.000.08
Low–medium0.170.250.080.250.170.08
Low0.170.000.500.000.250.08
Medium–high0.170.080.170.330.080.17
Medium0.000.080.080.330.420.08
High0.080.250.000.080.080.50
Table 12. Pros and cons of different eHMI information content.
eHMI Information ContentProsCons
Low-risk(a) Adequate yet concise information that minimizes the need for extensive cognitive analysis and prevents excessive allocation of attentional resources.
(b) Information timing that offers sufficient response time.
(c) Low-risk eHMI signals contribute to reduced anxiety and increased pedestrian comfort.
Full: P1, P2, P3, P5, P7, P8
Partial: P13, P15, P17, P21
Since AVs are still at a considerable distance, pedestrians do not need to rely on eHMI to indicate “low risk” when making crossing decisions.
Full: P6
Partial: P24
Medium- riskeHMI indicating medium crossing risk serves as a warning. Given that the medium crossing risk phase is the most uncertain, it is essential to provide a clear alert.
Partial: P20
An eHMI indicating only medium crossing risk, carries a high degree of ambiguity—leaving it unclear whether it signals permission to cross or a warning not to cross.
Full: P1, P2, P3, P4, P6, P7, P8,
Partial: P19
High-riskAn eHMI indicating high crossing risk provides a crucial warning against crossing, thereby enhancing pedestrian safety during road-crossing decisions.
Full: P4, P9, P12
Partial: P14, P16, P18, P19, P24
(a) When eHMI indicates high crossing risk, the vehicle is already very close to the pedestrian, requiring an urgent response.
(b) eHMI indicating high crossing risk, along with its corresponding warning color, induces a sense of fear in pedestrians.
Full: P1, P2, P5
Low-medium risk(a) Information timing that offers sufficient response time.
(b) Providing continuous information, which increases the level of certainty.
Full: P2, P5
In the low–medium eHMI condition, the medium risk information is unnecessary, as pedestrians would cross during the low risk period.
Partial: P21
Medium-high riskThe medium risk signal could serve as a transitional cue, helping participants anticipate the high-risk signal.
Full: P9
Partial: P16, P24
eHMI indicating medium and high crossing risk, along with its corresponding warning color, induces a sense of anxiety in pedestrians.
Full: P1, P5, P10
Partial: P13, P17, P21
Low-medium-high risk(a) Provides continuous information, enhancing certainty.
(b) Analogous to traffic lights, a familiar signal system for pedestrians.
Full: P3, P6, P10, P11
Partial: P13, P20, P22, P23
(a) Mentally demanding.
(b) Rapid information changes lead to misjudgments.
(c) High-risk information may be redundant, as medium-risk signals suffice.
Full: P5
Partial: P14, P16, P19
Disclaimer/Publisher’s Note: The statements, opinions and data contained in all publications are solely those of the individual author(s) and contributor(s) and not of MDPI and/or the editor(s). MDPI and/or the editor(s) disclaim responsibility for any injury to people or property resulting from any ideas, methods, instructions or products referred to in the content.

