Article

Microbiological and Sensory Quality of Artisanal Sour Cream

1
Department of Dairy Science, Faculty of Agriculture, University of Zagreb, Svetošimunska Cesta 25, 10000 Zagreb, Croatia
2
Department of Animal Science and Technology, Faculty of Agriculture, University of Zagreb, Svetošimunska Cesta 25, 10000 Zagreb, Croatia
3
Laboratory for Mastitis and Raw Milk Quality, Croatian Veterinary Institute, Savska Cesta 143, PP 883, 10000 Zagreb, Croatia
4
Department of Microbiology, Faculty of Agriculture, University of Zagreb, Svetošimunska Cesta 25, 10000 Zagreb, Croatia
5
Laboratory for Microbiology of Food and Animal Feed, Veterinary Institute Križevci, Croatian Veterinary Institute, Zakmardijeva 10, 48260 Križevci, Croatia
*
Authors to whom correspondence should be addressed.
Appl. Sci. 2025, 15(15), 8234; https://doi.org/10.3390/app15158234
Submission received: 6 May 2025 / Revised: 3 July 2025 / Accepted: 23 July 2025 / Published: 24 July 2025

Abstract

Following hygiene standards in milk production is essential for making high-quality sour cream, especially when using traditional methods that rely on raw milk. The aim of this study was to determine the physicochemical, microbiological, and sensory quality of artisanal sour cream samples collected from major marketplaces in the wider Zagreb area. On average, the samples contained 27.99% milk fat, 3.30% protein, 34.29% dry matter, 6.51% fat-free dry matter and 3.00% lactose, with considerable variability observed across all components. Microbiological analysis revealed the presence of Staphylococcus aureus in 35.30% of the samples, Enterobacteriaceae in 76.47%, Escherichia coli in 94.11%, Bacillus spp. in 23.53%, and yeasts in 100% of the samples. Listeria monocytogenes and Salmonella spp. were not detected. The sensory analysis of the textural properties showed significant variability in firmness, adhesiveness, viscosity, creaminess, and fizziness. Samples with higher milk fat and dry matter content were rated better for creaminess, viscosity and mouth firmness. Flavour assessments, particularly for cream and diacetyl notes, also varied widely among samples. These findings highlight the complexity of sour cream’s sensory attributes and the significant influence of ingredient composition and processing techniques on appearance, aroma, texture, taste, and flavour. Principal component analysis (PCA) with Varimax rotation simplified the data structure and identified key dimensions of quality variation. Principal component analysis (PCA) revealed that the first principal component (PC1) effectively discriminated the cream samples based on sensory attractiveness and indicators of spoilage and highlighted the association between off-flavour and microbial contamination with inferior characteristics. The second principal component (PC2) captured the differences in physicochemical characteristics and showed a gradient from richer, creamier samples with higher fat content to those with lower acidity and higher freshness.

1. Introduction

Sour cream is a dairy product consisting of concentrated milk fat, in which the fat globules are protected by a surrounding membrane [1]. It is widely appreciated for its rich taste and is consumed on its own, often paired with other dairy products such as fresh cow’s milk cheese, or used as an ingredient in various culinary dishes and in butter production.
Today, there is a wide range of dairy products on the market, with cheese (including fresh, soft, smoked, and hard varieties), milk, and sour cream being among the most common. Traditionally, in Croatian marketplaces, small-scale producers sell artisanal sour cream in plastic containers, plastic bags, or glass jars. However, this type of distribution can negatively affect product quality, as the cream is exposed to various external conditions throughout the distribution chain, increasing the risk of contamination and spoilage [2]. Artisanal sour cream, in particular, often has a shorter shelf life, mostly due to the absence of adequate heat treatment and sterile conditions during milking, handling, and storage. Unfortunately, there is little publicly available information on the quality of sour cream found in public marketplaces. In Croatia, small-scale dairy processing households must be registered in the Register of Small Agricultural Households and comply with the provisions of the Rulebook on the Registration and Approval of Facilities and on the Registration of Food Business Operators [3] in order to meet the food safety standards set by Regulation (EC) No 852/2004 on the hygiene of foodstuffs.
Currently, there are 884 such households registered for the production of fresh cheese and cream in the Republic of Croatia. These households are permitted to process up to 50 litres of milk per day from animals kept on their own farms, which must have brucellosis- and tuberculosis-free herd status. Their products may be sold at the place of production, at markets, as part of tourism offerings, or through direct delivery, provided they comply with the requirements of Regulation (EC) No 852/2004. However, many artisanal dairy products are often sold without proper labelling, often lacking basic information such as name, expiry date, storage instructions, and nutritional composition. Consumers must therefore rely on their own judgement or the advice of vendors when making purchasing decisions.
The traditional method of making artisanal sour cream involves the spontaneous fermentation of raw milk at the household level. In the absence of homogenisation, milk fat separates and rises to the surface due to differences in density among milk components, forming sour cream. Its quality depends on several factors, such as the season of production, the microbiological quality of the raw milk, the hygienic conditions, and the skill of the producer [4]. The method of producing sour cream in households is often primitive: freshly milked raw milk is left to ferment at room temperature and the fat layer that forms on the surface is collected. This process, however, can lead to the presence of pathogenic microorganisms, posing potential risks to consumer health [5].
The basic prerequisite for the production of high-quality cream is the use of microbiologically clean raw milk and minimizing the time milk is stored at elevated temperatures. When raw milk is of high quality (total bacterial count < 20,000/mL), microbial spoilage in the cream is negligible. In contrast, milk with a high microbial load (total microbial count > 100,000/mL), even when refrigerated, significantly compromises cream quality [6]. Pathogenic microorganisms commonly associated with milk and dairy products include Staphylococcus aureus, Salmonella spp., E. coli, L. monocytogenes, Y. enterocolitica, and Campylobacter spp. These pathogens can originate from various sources, including the farm environment, milking equipment, handling personnel, and airborne contamination [2,7,8].
Despite these health risks, many consumers continue to favour “artisanal” dairy products, perceiving them as more natural or of higher quality than factory-produced alternatives. However, sour cream sold under unhygienic conditions may pose significant health risk to consumers [4]. To maintain the microbiological quality of fresh cream, it is crucial to use fresh raw milk under strictly hygienic conditions. In the dairy industry, rigorous standards are implemented to ensure product safety and quality. Raw milk should be cooled immediately after milking, which slows down the growth of potentially harmful microorganisms. Alternatively, raw milk can also undergo a pasteurisation process, which further reduces the risk of contamination. The aim of this study was to evaluate the physicochemical, microbiological, and sensory properties of sour cream bought at public marketplaces in the city of Zagreb, in order to assess their compliance with food safety and hygiene standards.

2. Materials and Methods

2.1. Sampling

The study was conducted in June 2024. A total of 17 artisanal sour cream samples were collected at the public marketplaces in the city of Zagreb. Until sampling, they were stored in large plastic buckets (with a capacity of 5 L) and placed in glass display refrigerators. At the moment of sampling, the vendors packed the required quantity (approximately 0.5 L) of cream into plastic bags/glass jars/plastic containers, depending on what they had available. All samples were stored at +4 °C until analysis to preserve their quality and stability. Sampling was carried out using a random selection method to ensure the representativeness of the samples.

2.2. Physicochemical Analysis

The physicochemical analyses of the cream samples were carried out in the Reference Laboratory for milk and dairy products at the University of Zagreb, Faculty of Agriculture. Milk fat was analysed gravimetrically according to HRN EN ISO 2450:2008 [9], protein according to the Kjeldahl method [10], dry matter gravimetrically [11], and lactose using liquid chromatography [12]. Total solids non-fat in cream samples was determined mathematically by subtracting the milk fat content from the total dry matter.
Fatty acid methyl esters were prepared by base-catalysed methanolysis of the glycerides in an essentially non-alcoholic solution. After a certain reaction time, the mixture was neutralised by the addition of crystalline sodium hydrogen sulfate to avoid saponification of preformed esters according to HRN ISO 15884:2003 [13]. The fatty acid methyl esters thus prepared were then analysed using gas chromatography according to HRN ISO 15885:2003 [14]. For this purpose, a Shimadzu GC Plus-2010 (Kyoto, Japan, 2013) gas chromatograph with an FID detector and an InertCap PureWax capillary column (Kyoto, Japan) with the dimensions 0.25 mm I.D × 30 m and df = 0.25 μm was used. The analysis was performed using the normalisation method, whereby the injection mode was divided and the injector temperature set to 250 °C. The sample (1 μL) was injected with a split ratio of 1:50. The initial temperature of the column was 50 °C, and after 5 min, the temperature was increased by 5 °C per min up to 260 °C and maintained at that level for 30 min. The carrier gas was helium.
A Mettler Toledo pH metre (Greifensee, Switzerland) was used to determine the acidity of the cream. The titratable acidity (°SH) was determined by titrating the sample with a standardised 0.25 M sodium hydroxide solution (NaOH) with the addition of phenolphthalein as an indicator in accordance with ISO/TS 22113:2012 [15].

2.3. Microbiological Analysis

In order to determine the presence of potentially pathogenic microorganisms and the general microbiological quality of the sour cream samples, microbiological analysis was carried out at the Veterinary Institute in Križevci, Croatia, in accordance with the applicable norms and standard methods. All samples were stored at a temperature of +4 °C until analysis in order to preserve the quality and stability of the product. The procedures for isolation and enumeration of specific microorganisms are described below.

2.3.1. Isolation of Bacteria of the Salmonella Genus

The isolation of Salmonella bacteria was performed according to the method described in the standards HRN EN ISO 6579-1:2017 [16] and HRN EN ISO 6579-1:2017/A1:2020 [17]. The sample consisted of 25 g of sour cream diluted with 225 mL of buffered peptone water (Biokar, Allonne, France). The sample was inoculated into the selective broths MKTTn (Biokar, Allonne, France) and RVS (Oxoid, UK) and incubated at the recommended temperature for 24 to 48 h. After incubation, the samples were transferred to selective agars (XLD agar-Biokar, Allonne, France, and RAMBACH agar-Merck, Darmstadt, Germany) for identification of Salmonella spp.

2.3.2. Isolation of the Bacterial Species Listeria monocytogenes

The method described in the standard HRN EN ISO 11290-1:2017 [18] was used to isolate Listeria monocytogenes. The test portion of the sample consisted of 25 g of sour cream diluted with 225 mL of Fraser broth ½ (Biokar, Allonne, France) with a reduced inhibitor concentration. After the incubation recommended in the mentioned ISO standard, the sample was transferred to Fraser broth 1/1 (Biokar, Allonne, France) with full concentration of selective inhibitors. The inoculated samples were then transferred to ALOA agar (Biokar, Allonne, France) and Palcam agar (Biokar, Allonne, France) to confirm and observe individual colonies.

2.3.3. Isolation of Coagulase-Positive Staphylococci/Staphylococcus aureus

The method according to the standard HRN EN ISO 6888-1:2021/A1:2023 [19] was used to isolate and determine the number of coagulase-positive staphylococci. In brief, this method involved diluting 10 g of sour cream with 90 mL of buffered peptone water (Biokar, Allonne, France). After dilution, the samples were inoculated onto Baird-Parker agar (Biokar, Allonne, France) and incubated at a temperature of 34 °C to 38 °C for 24 ± 2 h. Typical black/grey, shiny, and convex colonies indicate the presence of coagulase-positive staphylococci. After incubation, the colonies were confirmed using biochemical tests, including the coagulase test. This test was performed by adding 0.3 mL of rabbit plasma (Merck, Darmstadt, Germany) to the inoculated samples, which allowed accurate identification and confirmation of the staphylococci.

2.3.4. Isolation of Enterobacteriaceae

The isolation of Enterobacteriaceae bacteria was performed according to the standard HRN EN ISO 21528-2:2017 [20]. For analysis, 10 g of sour cream was diluted with 90 mL of buffered peptone water (Biokar, Allonne, France) and inoculated onto VRBG agar (Biokar, Allonne, France). The samples were incubated at a temperature of 34 °C to 38 °C for 24 ± 2 h. Characteristic colonies were identified by visual inspection and confirmed by further biochemical tests.

2.3.5. Isolation of Escherichia coli

The method for isolating and enumerating the bacterial species Escherichia coli is based on the HRN ISO 16649-2:2001 [21] standard. In total, 10 g of sour cream was diluted with 90 mL of buffered peptone water (Biokar, Allonne, France) and inoculated onto TBX agar (Biokar, Allonne, France). Incubation was carried out at 44 °C for 18 to 24 h and confirmed that the typical colonies were blue in colour.

2.3.6. Yeast Isolation

Yeast isolation and enumeration was performed according to the standard HRN ISO 21527-1:2012 [22]. A sample of 10 g sour cream was diluted with 90 mL buffered peptone water (Biokar, Allonne, France) and inoculated onto DRBC agar (Biokar, Allonne, France). Incubation was performed at 25 °C for 5 days.

2.3.7. Isolation of Sulphite-Reducing Clostridium spp.

The method according to the standard HRN EN ISO 15213-1:2023 [23] was used for the isolation and enumeration of sulphite-reducing Clostridium spp. The test portion of the sample consisted of 10 g of sour cream diluted with 90 mL of buffered peptone water (Biokar, Allonne, France) and inoculated under anaerobic conditions on ISA agar (ferrous sulphite) (Condalab, Madrid, Spain). Incubation was performed at 37 °C for 48 ± 2 h.

2.4. Determination of Cream Colour

The colour measurements were performed in triplicate at random points on the surface of the cream. The parameters L* (lightness), a* (red-green colour), and b* (yellow-blue colour) were measured using a Minolta Chroma-Metre CR-410 with a measuring range of 50 mm diameter, defined by the International Commission on Illumination [24].
CIELAB is a universally recognised standard for colour specification and contains three basic aspects:
-
L*—lightness (lustre) of the cream, which can range from dark to light
-
a*—spectrum from green to red
-
b*—spectrum from blue to yellow
The average of three replicate measurements per sample was calculated and used in the statistical analysis as the representative value for each sour cream sample.

2.5. Sensory Analysis

The sensory analysis was carried out in the Laboratory for Sensory Analyses of Agri-Food Products at the University of Zagreb, Faculty of Agriculture, equipped in accordance with HRN ISO standard 8589:2007 [25] (technical conditions of the room: relative humidity 50–55%, temperature 20–22 °C, lighting 4000 K and 500 lux on the workbench). Prior to the sensory analysis, the study was approved by the Ethics Committee of the Faculty of Agriculture at the University of Zagreb for the sensory analysis of agricultural products and foodstuffs, and the testers signed a declaration of consent at the beginning of the evaluation. Sensory analysis of cream samples was performed on the second day after sample delivery using modified quantitative descriptive analysis (QDA) by 5 expert assessors (scientific teaching staff: 3 women, 2 men; age 39 to 49 years) selected and trained according to ISO 22935-1:2023 [26]. The performance of each assessor was evaluated relative to the performance of the entire panel to determine the sufficiency of training. All properties were evaluated using Compusense software with an electronic questionnaire on a numerical and unipolar intensity scale from 0 to 9 to assess the intensity of the evaluated property, where zero represents the statement “not present/not pronounced” and 9 represents the statement “strongly present/strongly pronounced”.
During the development of the terminology, the assessors agreed to evaluate 5 groups of attributes (Table 1): appearance, odour, texture, taste, and flavour. The samples were coded and served at room temperature in 50 mL plastic cups with a sample volume of 20 mL. The assessors were instructed to use potted water, white bread, and apples as neutralisers between samples. The samples were presented monadically in a randomised order, and a 5 min break was considered between samples. A total of three sessions were held, and six samples and one replicate sample were assessed in each session, followed by a 20 min break. This resulted in a total of 5 individual sensory assessments, which were used for the calculation of mean intensity values. The replicated sample was used for the calculation of the assessor’s repeatability (calculation based on the differences in absolute values between the scores assigned to the different descriptors of the sample and its replicate) in Big Sensory Soft (Centro Studi Assaggiatori, Brescia, Italy). Furthermore, the assessor’s accuracy was calculated as the absolute difference between the scores assigned to the different descriptors across samples and the median values of the panel, and the assessor’s precision was calculated based on the standard deviation of the scores given by the assessor, descriptor by descriptor, and increases as the assessor assigns more variable scores for each descriptor across samples. To ensure the consistency and validity of the results, a quality control mechanism was applied in which any session in which an assessor did not meet the predefined thresholds for repeatability, accuracy, or precision, based on calculations in Big Sensory Soft, was repeated. This approach ensured that only data reflecting reliable and consistent assessor performance was included in the final analysis, thereby strengthening the overall robustness of the results.

2.6. Statistical Data Analysis

Statistical data processing was performed using the SAS Studio 3.81 statistical package [27]. The PROC MEANS procedure was used to calculate the descriptive statistics. The PROC PRINCOMP procedure was used to perform a principal component analysis (PCA). The correlation matrix was selected to account for differing measurement units and to normalise variance across variables. Following extraction, Varimax rotation was applied to the principal components to enhance interpretability by maximizing the loading variance and promoting the formation of thematically distinct factor structures.

3. Results and Discussion

3.1. Physicochemical Composition of the Cream

The physicochemical composition of the sour cream samples, i.e., the content of milk fat, protein, total solids, solids non-fat, lactose, and the acidity of the cream (expressed in pH and °SH) is presented in Table 2.
The average milk fat content was 27.99%, while the protein, total solids, solids non-fat (SNF), and lactose contents averaged 3.30%, 34.29%, 6.51%, and 3.00%, respectively. Sample 11 exhibited the lowest values for all measured components, whereas sample 6 had the highest. The coefficients of variation indicate a considerable variability among the samples: 24.06% for milk fat, 16.68% for protein, 18.06% for total solids, 17.22% for SNF, and 29.09% for lactose. This variability in components can be attributed to several factors, including animal nutrition, season of cream production, stage of lactation, and breed (genotype). It is known that milk yield and milk fat content are negatively correlated. For example, Holstein cows produce a larger volume of milk with a lower milk fat content, while Jersey cows yield less milk but with a higher fat percentage. Additionally, milk fat and protein concentrations are highest at the beginning of lactation and gradually decline as lactation progresses. The milk fat and protein content is usually highest in winter and autumn, when cows have a greater appetite due to lower temperatures [28]. During the summer heat, the milk fat content decreases due to the loss of saliva through thermoregulation, which leads to a decrease in the buffering capacity of the rumen contents. This process leads to a slight drop in the pH value and lower acetic acid production in the rumen.
The high variability observed in the physicochemical parameters of fermented cream from Zagreb marketplaces may be linked to differences in sensory quality. A comparison with earlier research by Lukač and Samaržija [29] on cream samples collected at the Zagreb marketplaces showed a milk fat content ranging from 13.5% to 36.5%, with an average of 25.83%. Similarly, Kirin [4] reported an average milk fat content of 26.5% in cream samples collected from marketplaces in Bjelovar, which is slightly lower than the average found in the present study (27.99%). The minimum milk fat content in Bjelovar samples was 22.5%, which is 7.14% higher than the lowest value recorded in this study. Conversely, the maximum fat content in Bjelovar cream was 34.0%, which is 5.8% lower than the highest value reported in our study (Table 2). Despite differences in time and location, these findings indicate a general consistency in the chemical composition of artisanal cream across regions and over time. The relatively minor variations suggest that traditional artisanal cream production methods have remained stable, and the quality of the final product has not changed significantly. These data provide a valuable reference point for future research into cream quality and consumer preferences. The importance of this study lies in its contribution to understanding the extent of variability in the composition of traditional cream, which underlines the need for standardisation and quality control. This is particularly important for products sold directly at markets, where production processes are less regulated. The novelty of the research also lies in the fact that it focuses on small-scale, traditional production methods, which are less documented compared to industrial processes. It provides a baseline dataset that can be referred to in future studies aimed at optimising the quality of cream, developing consumer-oriented standards and improving the overall marketability of these products. This basic knowledge is important to harmonise traditional practises with modern quality expectations and consumer preferences.
The pH values of the cream samples showed very low variability, ranging from 4.09 in sample 14 to 4.71 in sample 11, with an average of 4.40. When compared to data from cream samples collected at Bjelovar marketplaces [4], which reported a minimum pH of 4.14, a maximum of 4.48, and an average of 4.31, no significant differences were observed. In contrast, titratable acidity (expressed in °SH) demonstrated much greater variability, with values ranging from 3.92 to 20.92, and an average of 9.40. This stands in stark contrast to earlier findings from Zagreb marketplaces [29], where the average titratable acidity was 29.88 °SH, indicating substantial differences likely due to variations in production conditions. The observed variability in both pH and titratable acidity can be attributed to differences in the microbiological quality of the raw milk and the fermentation process itself. During natural fermentation, lactic acid bacteria, either naturally present in the milk or introduced through environmental exposure, produce lactic acid, lowering the pH and contributing to the formation of the gel structure characteristic of sour cream. In traditional sour cream production, inoculation with defined starter cultures is not practiced; instead, the process relies on spontaneous acidification by indigenous microflora. To achieve the desired pH and sensory quality, it is critical to halt further acidification by cooling the product to 4 °C at the appropriate stage of fermentation.
The variability in °SH values may also reflect the influence of undissociated acids and other compounds with high buffering capacity, which affect the measurement of titratable acidity. Although creams with higher fat content are generally expected to exhibit higher titratable acidity, this trend was not consistently observed. For example, sample 6 had the highest milk fat content (39.8%) but relatively low titratable acidity (5.24 °SH), whereas sample 17 exhibited the highest titratable acidity (20.92 °SH) despite having a lower fat content (24.42%). While a partial correlation between milk fat and °SH was noted in some samples, fat content alone does not fully explain the differences. Variations in fermentation time likely played a significant role, emphasizing the importance of carefully monitoring acidity levels during the fermentation process to ensure consistent product quality.

Fatty Acid Composition

Table 3 shows the proportions of saturated fatty acids (SFAs) identified in each sour cream sample.
Saturated fatty acids are an important group of milk lipids, and the analysis revealed the presence of major SFAs, including butyric acid (C4:0), caproic acid (C6:0), caprylic acid (C8:0), capric acid (C10:0), lauric acid (C12:0), myristic acid (C14:0), pentadecylic acid (C15:0), palmitic acid (C16:0), and stearic acid (C18:0). In addition, several minor SFAs were detected in smaller amounts or only in certain samples, such as undecylic acid (C11:0), tridecylic acid (C13:0), margaric acid (C17:0), arachidic acid (C20:0), heneicosylic acid (C21:0), beheic acid (C22:0), tricosylic acid (C23:0), and lignoceric acid (C24:0), indicating a diverse SFA profile across samples. Based on the data from Table 3 and Table 4, it is evident that SFAs dominate the fatty acid composition in all analysed cream samples. The highest proportion of SFAs was found in sample 10 (72.47%), while sample 12 had the lowest (58.03%). These findings are consistent with earlier reports, including Barbir et al. [30], who noted that the fatty acid composition of animal-derived foods varies considerably due to various factors such as diet, age, body weight, sex, and genotype of the animal. Their study emphasised the predominance of butyric and other short-chain fatty acids (SCFAs) in dairy fats, while polyunsaturated fatty acids (PUFAs) typically appear in lower concentrations. In line with known biosynthetic pathways, SCFAs (C4:0–C16:0) are synthesised de novo in the udder, while long-chain fatty acids (LCFAs; >C18:0) are derived from the bloodstream. Of the over 400 fatty acids identified in cow’s milk, butyric acid, produced via biohydrogenation of unsaturated fatty acids in the rumen, and oleic acid, formed by desaturation of stearic acid in the udder, are the most prominent. Although unsaturated fatty acids are less abundant, linoleic and α-linolenic acids are the most notable among them.
The results from this study show slight differences compared to those of Izsó et al. [31], who reported average SFA contents in cream samples as follows: butyric acid 3.69%, caproic 2.50%, caprylic 1.37%, capric 2.89%, lauric 3.58%, myristic 11.63%, pentadecylic 1.21%, palmitic 32.57%, and stearic acid 9.47%. While most SFAs in our study were present in slightly higher concentrations, butyric and stearic acids were somewhat lower. The total SFA content in this study averaged 66.05%, which is approximately 4.1% lower than the 70.15% reported by Izsó et al. [31]. Nonetheless, the results align with those of Mieželienė et al. [32], who reported over 55% SFA content in fermented cream samples. Overall, the high SFA content, particularly of butyric, myristic, palmitic, and stearic acids, reflects a characteristic feature of dairy products. These elevated levels are largely attributed to specific metabolic and microbial processes in ruminants, which shape the fatty acid profile of milk and its derivatives.
The most abundant monounsaturated fatty acids (MUFAs) identified in the cream samples were myristoleic acid (C14:1), palmitoleic acid (C16:1), and oleic acid (C18:1n9), while other MUFAs such as pentadecanoic acid (C15:1), heptadecenoic (C17:1), gadoleic (C20:1n9), erucic (C22:1n9), and nervonic acid (C24:1n9) were detected in fewer samples. Among the polyunsaturated fatty acids (PUFAs), linoleic acid (C18:2n6) and alpha-linolenic acid (C18:3n3) were the most abundant, while thers such as gamma-linolenic acid (C18:3n6), eicosadienoic acid (C20:2), dihomo-gamma-linolenic acid (C20:3n6), arachidonic acid (C20:4n6), eicosatrienoic acid (C20:3n3), eicosapentaenoic acid (C20:5n3), and docosadenoic acid (C22:2) were present in lower concentrations. According to Izsó et al. [31], the MUFA content in sour cream purchased in April was 23.37 g/100 g, while the PUFA content was 2.65 g/100 g. In comparison, the results of the present study (Table 4) indicate slightly higher values: 26.86 g/100 g for MUFAs and 2.71 g/100 g for PUFAs.
These findings suggest that the sour cream samples collected during the spring period may contain a slightly higher proportion of unsaturated fatty acids compared to those obtained in the summer months. Indeed, the fatty acid composition of milk and cream is strongly influenced by the animal’s diet [33]. For example, winter feeding with concentrated rations typically results in a lower proportion of unsaturated fatty acids, whereas summer feeding with green, protein- and fibre-rich forage tends to increase their presence in milk. However, dietary differences alone cannot fully explain the variations in fatty acid composition, as multiple factors are involved. Health status, particularly udder conditions such as mastitis, can significantly alter milk composition due to impaired fatty acid synthesis within the mammary gland. Seasonal effects also play a crucial role, with environmental factors like temperature and humidity influencing animal metabolism and, consequently, milk composition. For example, high ambient temperatures above 24 °C, especially when combined with humidity levels exceeding 90%, can induce heat stress in dairy cows [28]. During such periods, cows typically consume less feed and more water, which can negatively affect the chemical and fatty acid composition of both milk and cream.

3.2. Microbiological Quality of the Cream

Microbiological criteria for fermented cream made from unpasteurised milk are laid down in the Guide to Microbiological Criteria for Foodstuffs (2009) of the Ministry of Agriculture, Fisheries and Rural Development of the Republic of Croatia. According to these guidelines, Salmonella spp. and Listeria monocytogenes must not be present in a 25 g sample in order to ensure the microbiological safety and harmlessness of such a product. The limits for coagulase-positive staphylococci (Staphylococcus aureus) and bacteria of the genus Enterobacteriaceae are 100–1000 cfu/g, while yeasts and moulds are permitted in quantities of 10–100 cfu/g of product. If these criteria are met, fermented cream made from raw milk is considered microbiologically safe and suitable for human consumption.
Microbiological analysis of artisanal cream samples collected from marketplaces in Zagreb revealed the absence of L. monocytogenes and Salmonella. However, several other contaminants were frequently detected (Table 5). Staphylococcus aureus was found in 6 samples (35.30%) at elevated levels, while Enterobacteriaceae were present in 13 samples (76.47%). Notably, Escherichia coli was detected in 16 of the 17 samples (94.11%), and Bacillus spp. in 4 samples (23.53%). Clostridium spp. was present in all samples, though below 10 cfu/mL.
Yeasts were detected in 100% of the samples, indicating poor hygiene during milking, as well as potentially inadequate production and storage conditions. It is worth mentioning that some yeast species are known to be resistant to common dairy industry disinfectants, complicating efforts to ensure microbiological safety of the product.
The high prevalence of psychrotrophic microorganisms which are the major contributors to spoilage, poses a significant challenge in cream and butter production, especially when chilled milk is used as chilled milk is used [34]. Among the most commonly isolated pathogens, S. aureus is responsible for causing both clinical and subclinical mastitis in dairy animals, with a prevalence of 30–40%. This bacterium produces heat-resistant enterotoxins, meaning that its presence in cream may persist even after thermal processing. Contamination likely occurs during milking or subsequent handling.
The widespread presence of E. coli, a bacterium originating from the digestive tracts of humans and animals, strongly suggests faecal contamination and poor milking hygiene in 16 out of 17 samples. Particularly concerning were samples 5 and 6, which contained E. coli levels more than 100 times the acceptable limit, posing significant health risk. The frequent detection of Enterobacteriaceae reinforces evidence of unsanitary practices during milking, equipment used, or environmental exposure, such as from bedding or feed. The presence of Bacillus spp. in four samples may be due to contamination from soil or animal faeces. Compared to earlier studies, such as Kirin [4], who found Enterobacteriaceae in 58.33% and E. coli in 25% of cream samples from Bjelovar marketplaces, the current findings are notably worse. Similarly, Markov et al. [35] reported L. monocytogenes in 10% and S. aureus in 41.66% of samples, along with significant Enterobacteriaceae and E. coli contamination.
Overall, none of the cream samples in this study met microbiological safety standards for human consumption. The findings point to systemic hygiene failures during milking, processing, and storage, all of which negatively affect both the safety and sensory quality of the product. When compared to previous research, the consistently poor microbiological quality highlights an urgent need to improve hygiene practices in the production of artisanal cream.

3.3. Sensory Analysis of Sour Cream Samples

3.3.1. Instrumental Colour

Table 6 presents the colour parameters for each sour cream sample, including the lightness (L*), redness/greenness (a*), and yellowness/blueness (b*).
The average values across all samples were 99.35 for L*, −1.93 for a*, and 15.63 for b*. The lowest L* value, indicating the least cream lustre, was recorded in sample 13 (96.72), while the highest was in sample 3 (102.33). Redness (a*) values ranged from a minimum of −3.26 in sample 14 to a maximum of −0.94 in sample 10. For the b* parameter, which reflects the yellow-blue spectrum, sample 9 showed the lowest value (8.69), and sample 8 the highest (24.14). Lightness (L*) showed minimal variability, with a coefficient of variation (CV) of just 1.75%. In contrast, a* and b* values exhibited higher variability, with CVs of 34.49% and 26.13%, respectively, indicating more pronounced differences in redness and yellowness between samples. Comparatively, Shepard et al. [36], reported lower colour values in their study: L* values ranged from 82.1 to 85.4, a* values from −2.72 to −1.20, and b* values from 7.68 to 15.00. This suggests that the sour cream samples in the present study exhibited greater brightness, more intense colour characteristics, and broader variation.
The colour of fermented cream is strongly influenced by its chemical composition and production process. Milk fat content is a primary factor: samples with higher fat content tend to have a more intense yellow-blue component (b*). The colour parameter L* shows a moderate positive correlation with milk fat content (r = 0.62), suggesting that higher brightness may be associated with increased fat levels. Similarly, the b* parameter exhibits a strong positive correlation (r = 0.74), indicating that samples with more intense yellow coloration tend to have higher fat content. In contrast, the a* parameter shows a negligible negative correlation with milk fat content (r = −0.03), suggesting no meaningful relationship between redness and fat content (Table 7).

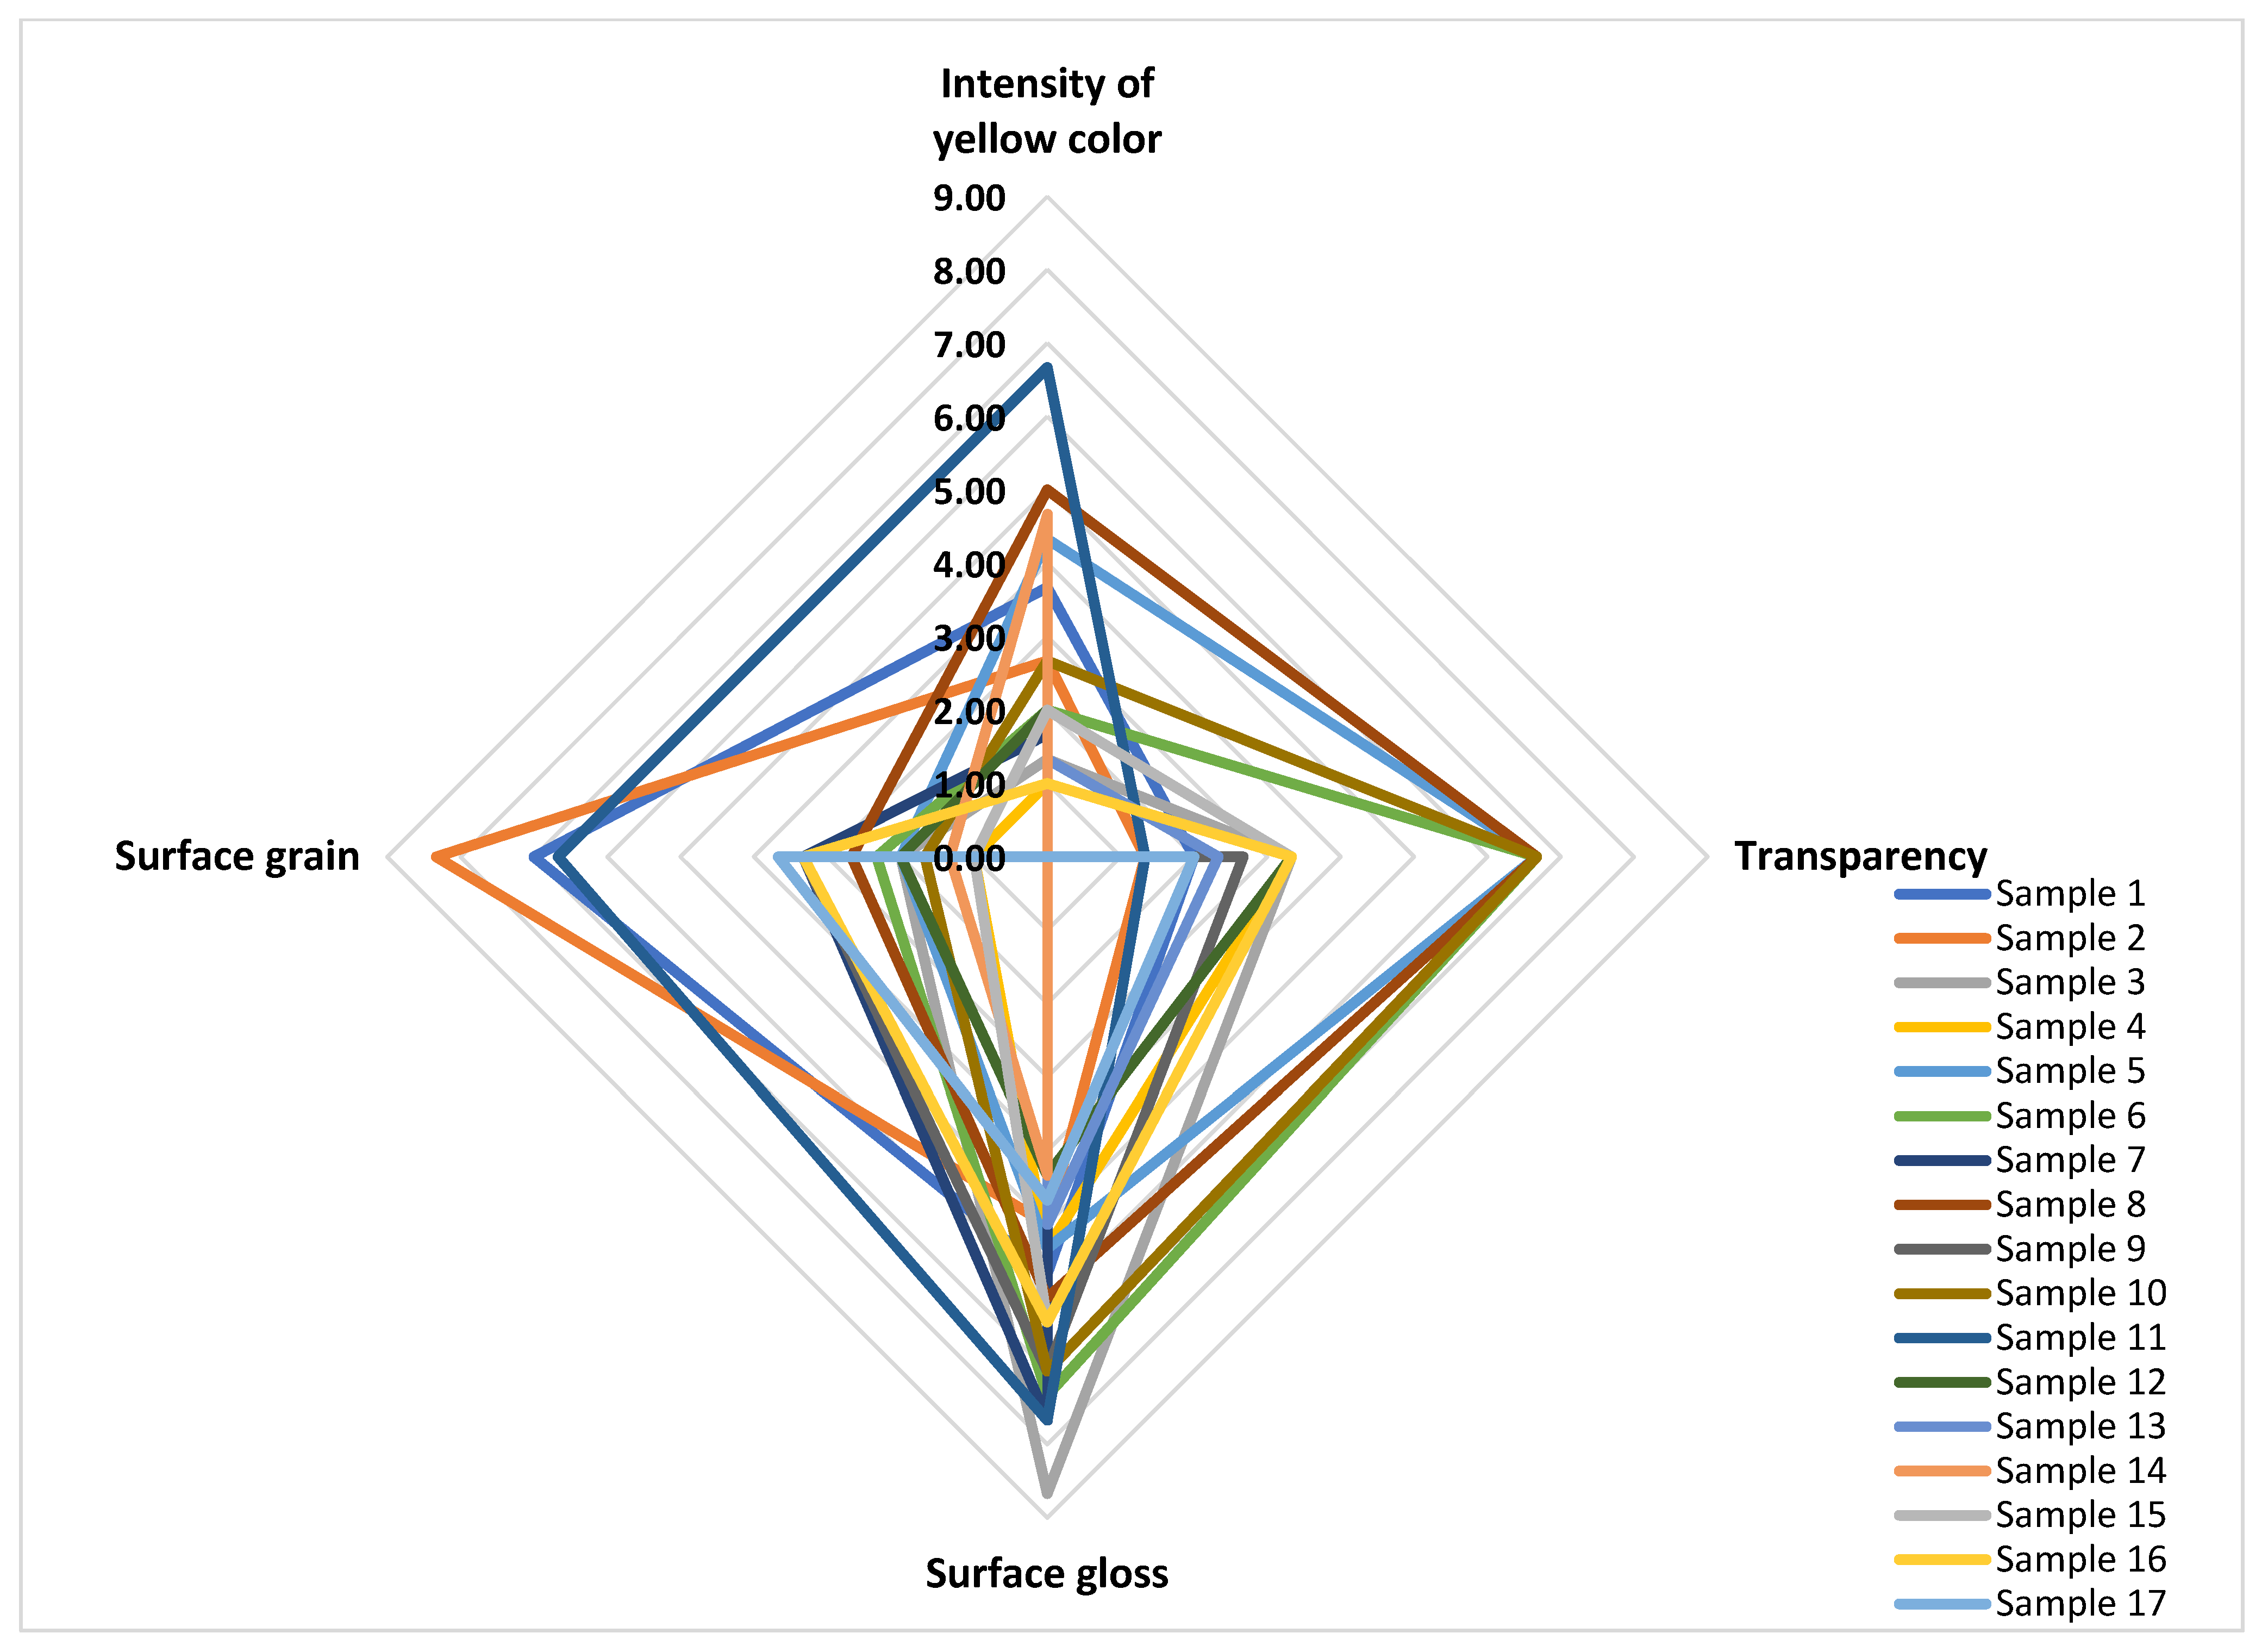
3.3.2. Cream Appearance

Figure 1 displays the results of the sensory evaluation of cream appearance, covering attributes such as yellow colour intensity, transparency, surface gloss, and granularity. The analysis revealed notable differences among the samples in all evaluated characteristics.
The consistency of the cream ranged from runny to thick and had lumps. Transparency was rated on a scale of 0 (white) to 9 (clear), with an average score of 1, indicating that most creams appeared opaque. Yellow colour intensity, assessed on a scale of 0 (lightest) to 9 (darkest), averaged a score of 2. Surface gloss values ranged from 4 to 9.
Milking hygiene and technological processes were found to significantly influence cream appearance. In general, homogenisation and milk fat content are closely related to colour and gloss levels. Samples with a more intense yellow hue, such as samples 8 and 14, both containing over 30% milk fat, received a score of 5 for yellowness. In contrast, sample 9, which had the lowest yellow intensity score (0), also had the lowest b* value (8.69) and a fat content below 20%.
Surface granularity scores ranged from 0 to 8, highlighting substantial variability. While a granular texture is not typical for cream, it can result from processing errors, particularly in artisanal production settings with limited quality control.

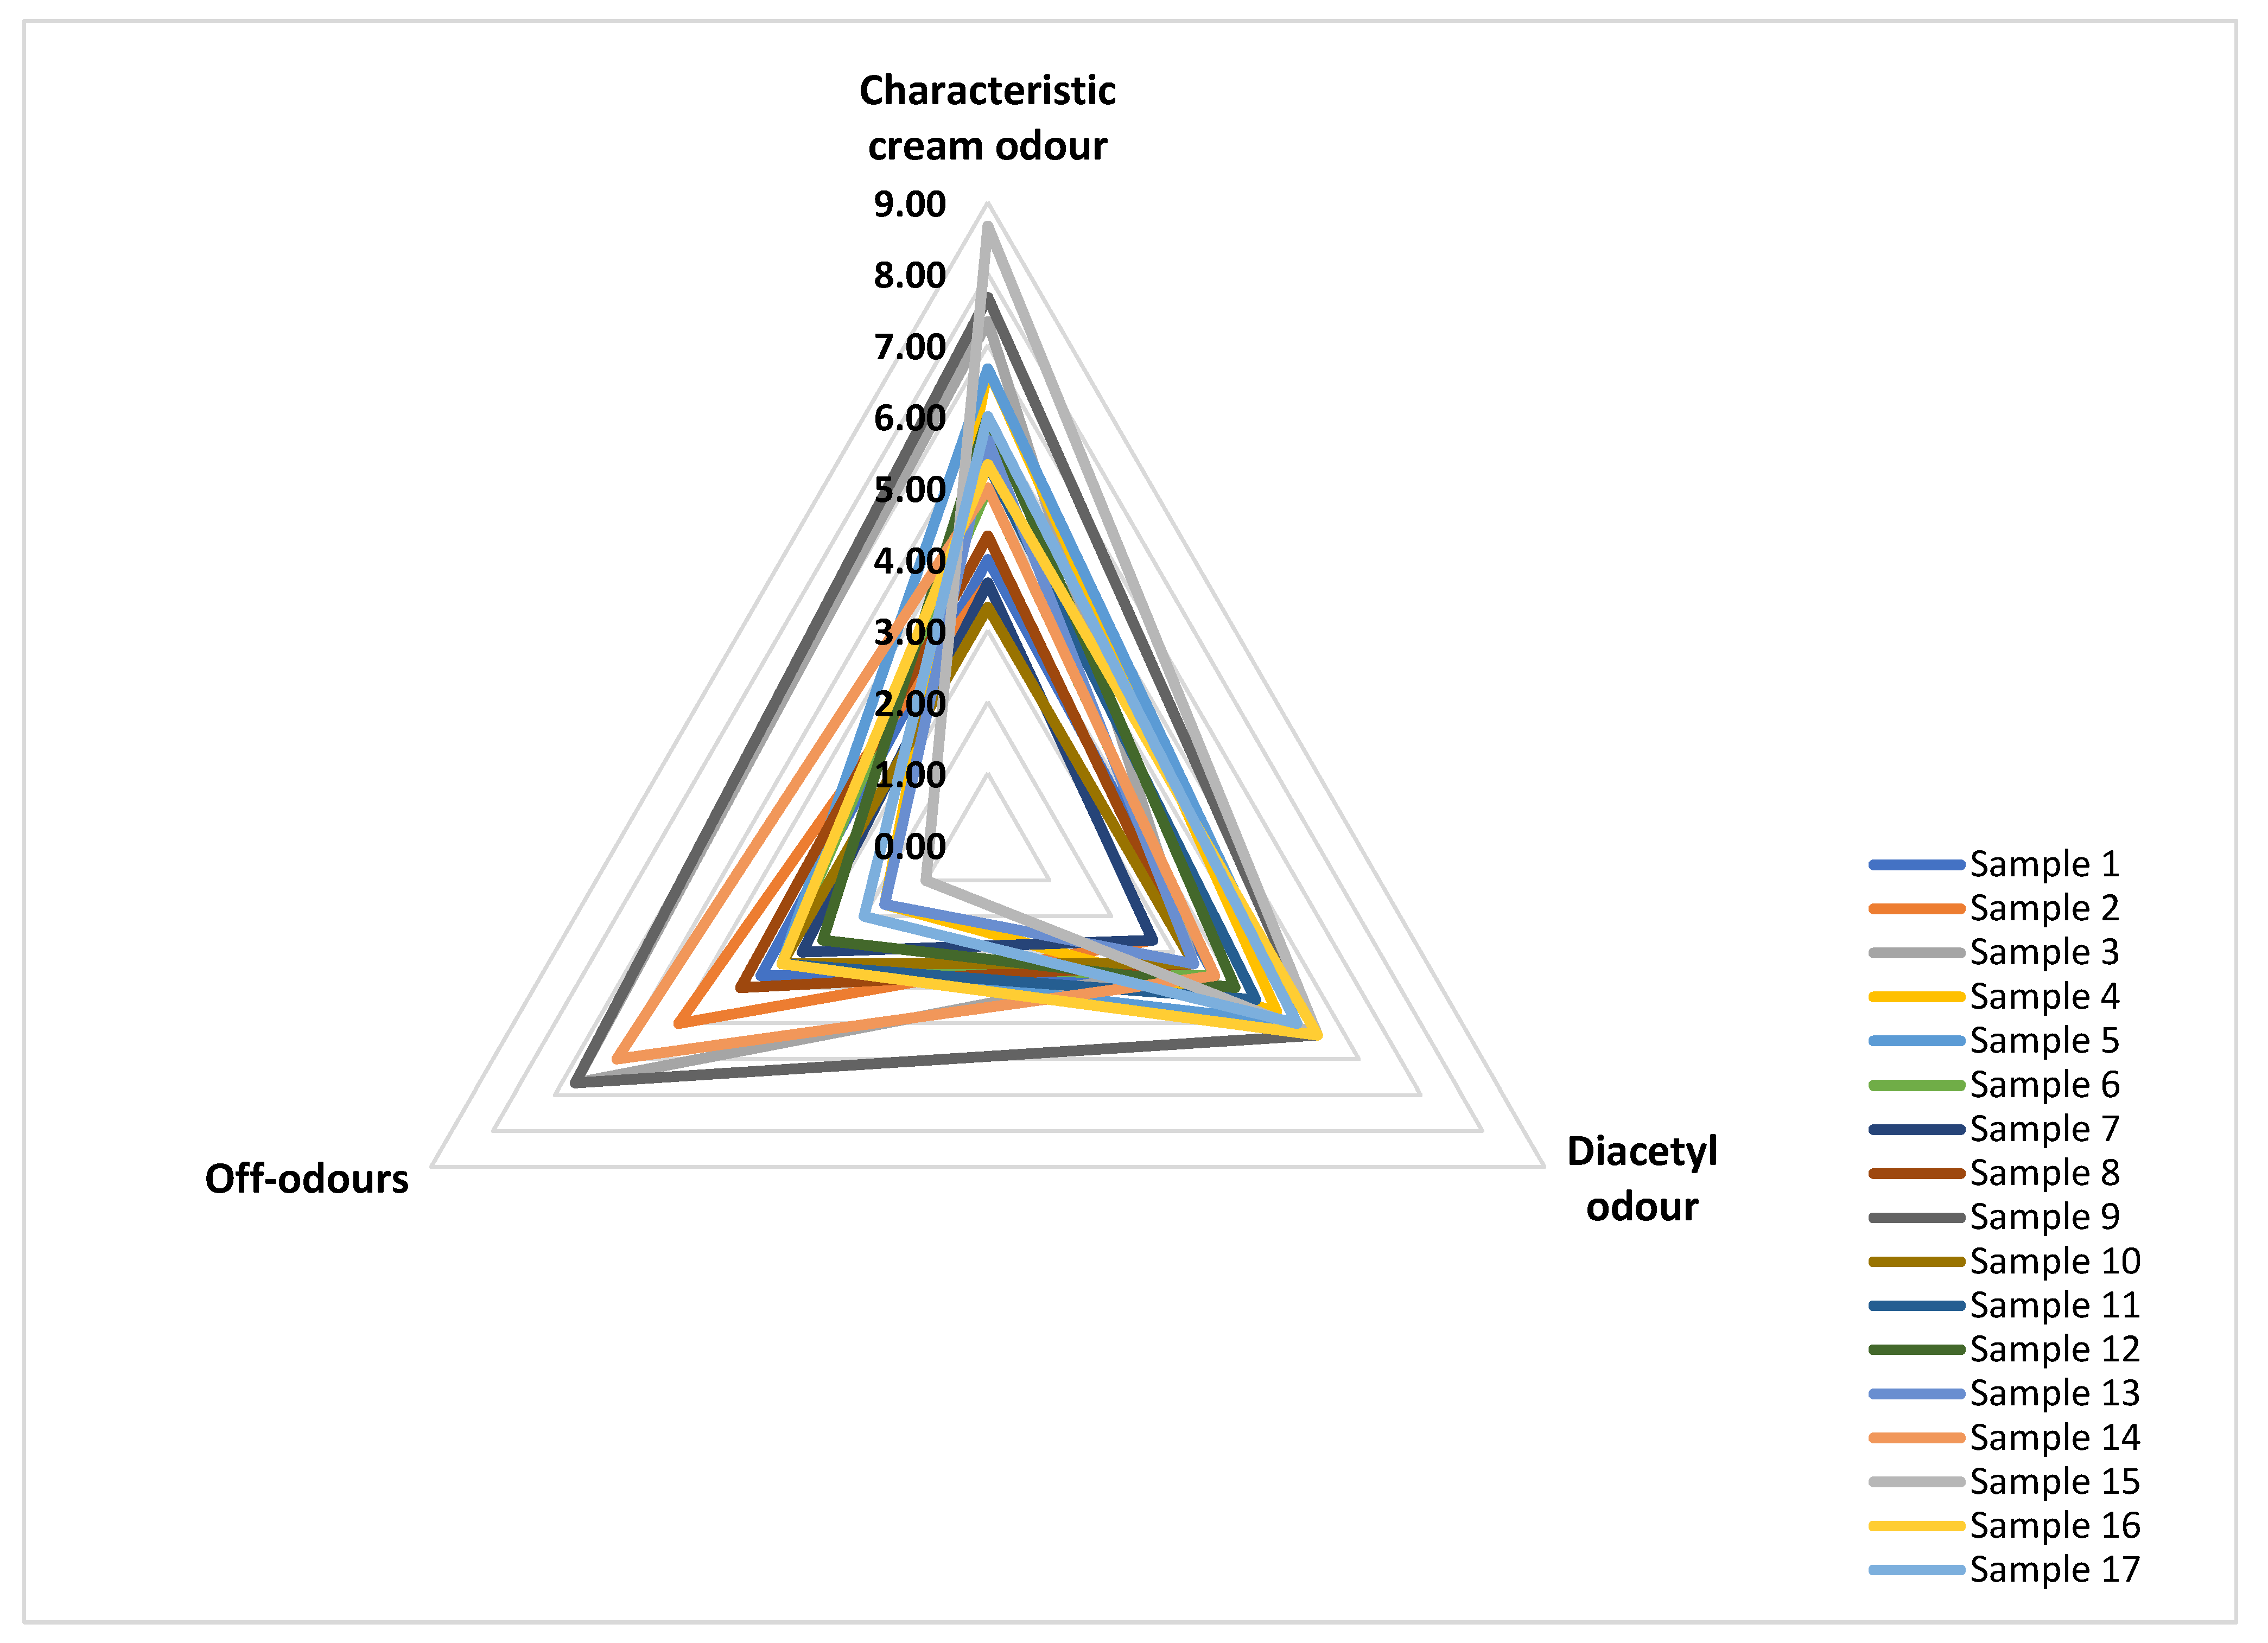
3.3.3. Odour Profile

Figure 2 presents odour ratings for various cream samples based on three parameters: characteristic cream odour, diacetyl odour, and off-odour. The results indicate notable variability among the samples.
Characteristic cream odour scores ranged from 3 to 9, with the majority falling between 5 and 8. Diacetyl odour, associated with the buttery aroma typical of fermented dairy products, was generally rated as moderate, with scores between 3 and 5. Off-odours were present in all samples, receiving scores from 2 to 4, which is noticeable but not dominant. These undesirable odours are often caused by environmental exposure during milking or by high microbial loads in the milk and cream. Microorganisms can produce volatile compounds through fermentation and decomposition, which negatively affect aroma. Enzymatic activity, particularly from lipases, can further affect odour by releasing free fatty acids from milk fat, contributing to off-notes [37]. These results reveal significant differences in odour profiles, likely influenced by differences in hygiene practices, raw milk quality, and processing methods.

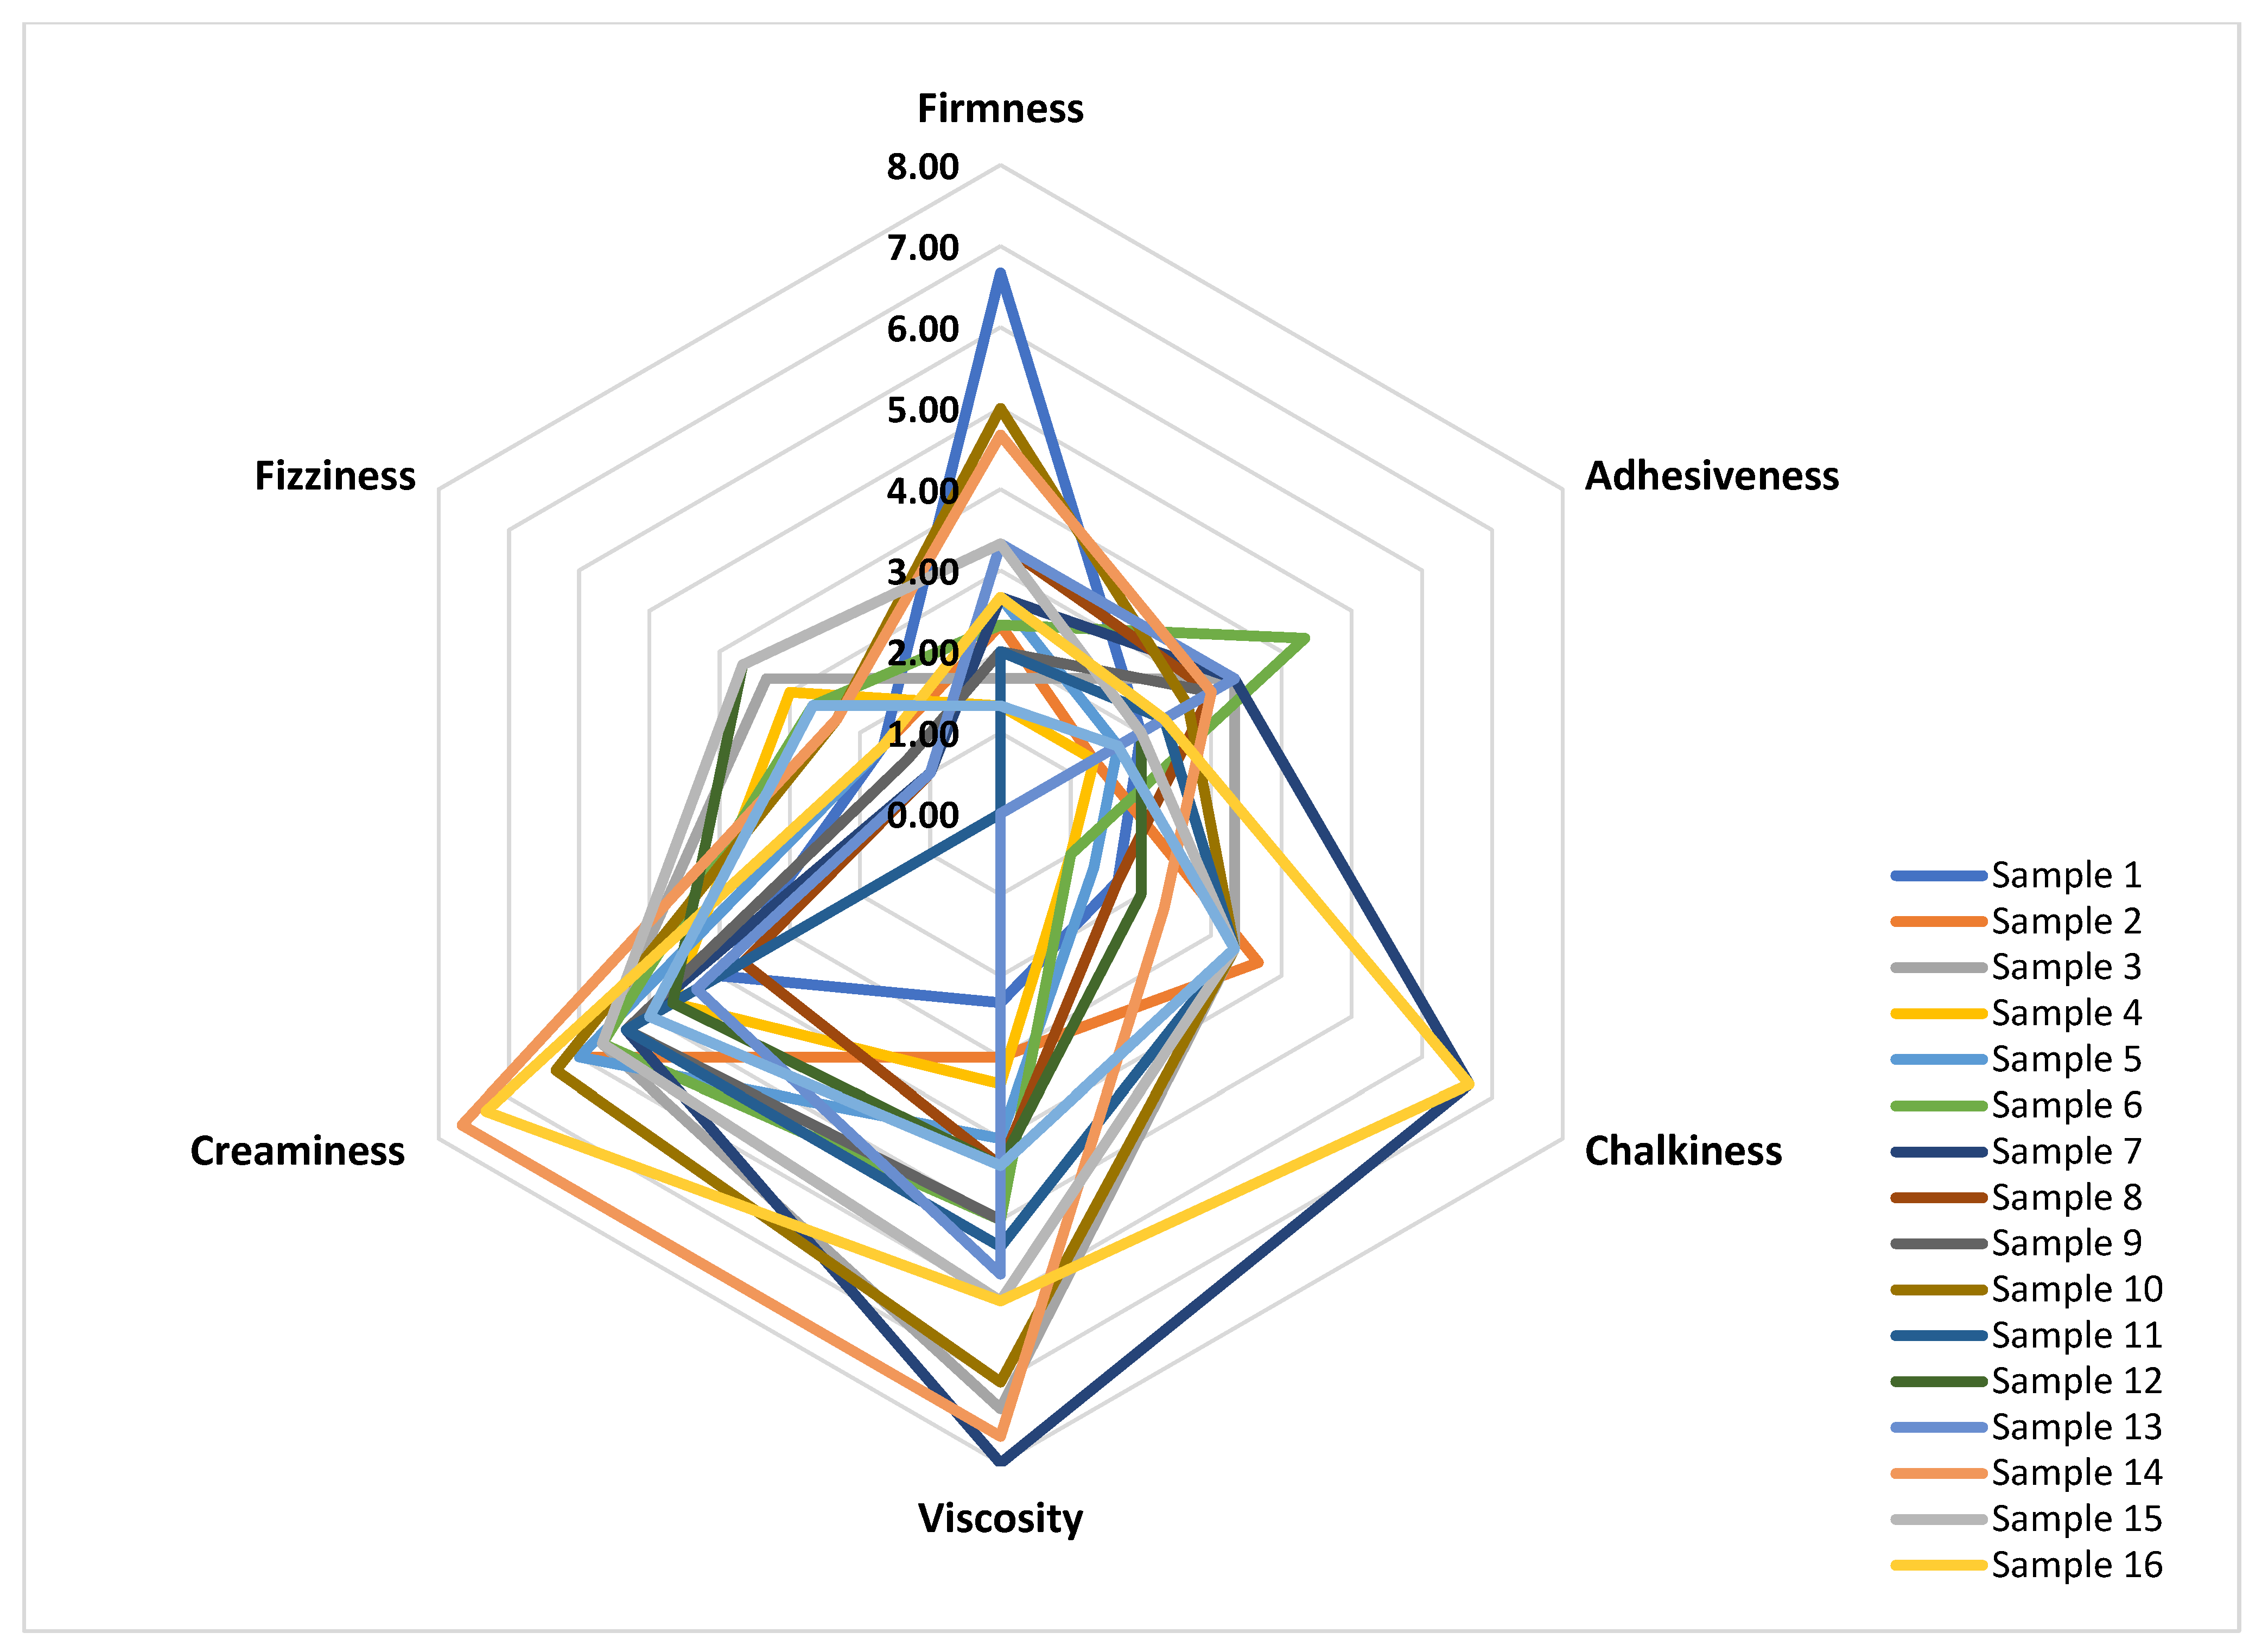
3.3.4. Texture Properties

The results shown in Figure 3 indicate considerable differences between the samples in the sensory evaluation of the cream texture.
Firmness scores varied from 0 to 5, while viscosity ranged from 2 to 8, averaging between 5 and 6. Adhesiveness was moderate across samples, with ratings between 2 and 3. Chalkiness, potentially caused by the addition of milk powder or whey-based ingredients, varied from 0 to 4. Creaminess ranged from 4 to 8, while fizziness, which is undesirable in cream, was rated 0 to 4. This fizziness may result from gas production by lactic acid bacteria or yeasts, indicating possible microbial contamination [2]. Higher milk fat and dry matter contents were associated with better creaminess, viscosity, and firmness, contributing to superior texture scores of sour cream samples in our study. This is in accordance with the results by Shepard et al. [36], who noted that creams with higher fat content typically exhibit improved viscosity and firmness. Moreover, the technological process, particularly homogenisation, significantly affects mouthfeel. Homogenisation improves the uniformity and distribution of fat globules, enhancing creaminess and reducing separation. The perception of creaminess, or mouth-coating richness, is closely linked to milk fat flavour, which is primarily evaluated via olfaction. In low-fat and fat-free sour cream products, this perception becomes more challenging. In order to achieve a creamy perception with low-fat and fat-free sour cream, it is crucial to take the milk fat flavour into account. For these products, the evaluation of texture is more important than the sense of smell, although the perception of creaminess can be improved by multisensory approach [38].

3.3.5. Taste Properties

The results presented in Figure 4 indicate considerable variability in the taste properties of cream, including intensity of sweet, salty, sour, bitter, and astringency.
Sweetness and saltiness were weakly expressed, with sweet taste scores ranging from 0 to 3 and salty taste from 0 to 1. As expected for fermented dairy products, acidity emerged as the dominant sensory attribute, exhibiting greater variability with scores between 1 and 5. This pronounced sour taste is the result of lactic acid production by lactic acid bacteria and is significantly influenced by the bacterial culture used and the timely termination of acidification [39]. All samples exhibited high yeast concentrations, which can affect taste, flavour, and appearance, as shown in Table 4. Bitterness, often associated with yeast presence, ranged from 0 to 4, with sample 12 displaying the highest levels. The occurrence of bitterness can be explained by microbial proteolysis, which increases the content of hydrophobic peptides and certain glycerides resulting from fat breakdown [40]. Astringency, reflecting oral mucosa dehydration, was rated from 0 to 4, while sweetness, saltiness, and bitterness were less pronounced overall. Research by Shepard et al. [36] confirms that soreness is the dominant sensory characteristic of sour cream and emphasises that heat treatment before or during fermentation further shapes its sensory profile. Additionally, fat content plays a crucial role in taste perception; full-fat sour cream tends to exhibit lower off-flavour intensity compared to reduced-fat varieties. These differences can be attributed to the interaction of milk fat with aromatic compounds such as acetaldehyde, 2,3-butanedione, and acetoin, with low-fat products releasing volatiles more rapidly, thereby influencing the sensory experience [41].

3.3.6. Flavour Properties

Figure 5 illustrates the sensory characteristics related to the cream flavour, including the characteristic cream flavour, diacetyl flavour, off-flavours, and flavour persistence.
A significant variability in flavour attributes was observed. The characteristic cream flavour received scores between 3 and 8, with a median of 5, whereas diacetyl flavour showed a slightly narrower range, from 2 to 6, with a median of 4. These flavours arise from biochemical processes occurring before, during, and after fermentation. Off-flavours were detected in a substantial number of samples, with scores ranging from 0 to 7 and a median of 3. These findings can be linked to poor hygiene practices during milking and production, which is confirmed by the results of the microbiological analysis. Exposure of milk to the barn environment and high yeast concentrations in the samples likely exacerbated the occurrence of off-flavours. Flavour persistence varied between 5 and 8. Aroma compounds in sour cream are product of chemical changes during processing, including lipolysis, glycolysis, and proteolysis [36]. Similar volatile compounds have been identified in other fermented dairy products, indicating comparable flavour profiles [42,43]. Despite observed variability, the cream samples exhibited distinct characteristic aromas. The relationship between flavour, processing methods, and fat content critically shapes the sensory characteristics of sour cream and, ultimately, consumer preferences. A deep understanding of these dynamics enables manufacturers to better adapt their products to market demand and improve the quality of fermented dairy products.

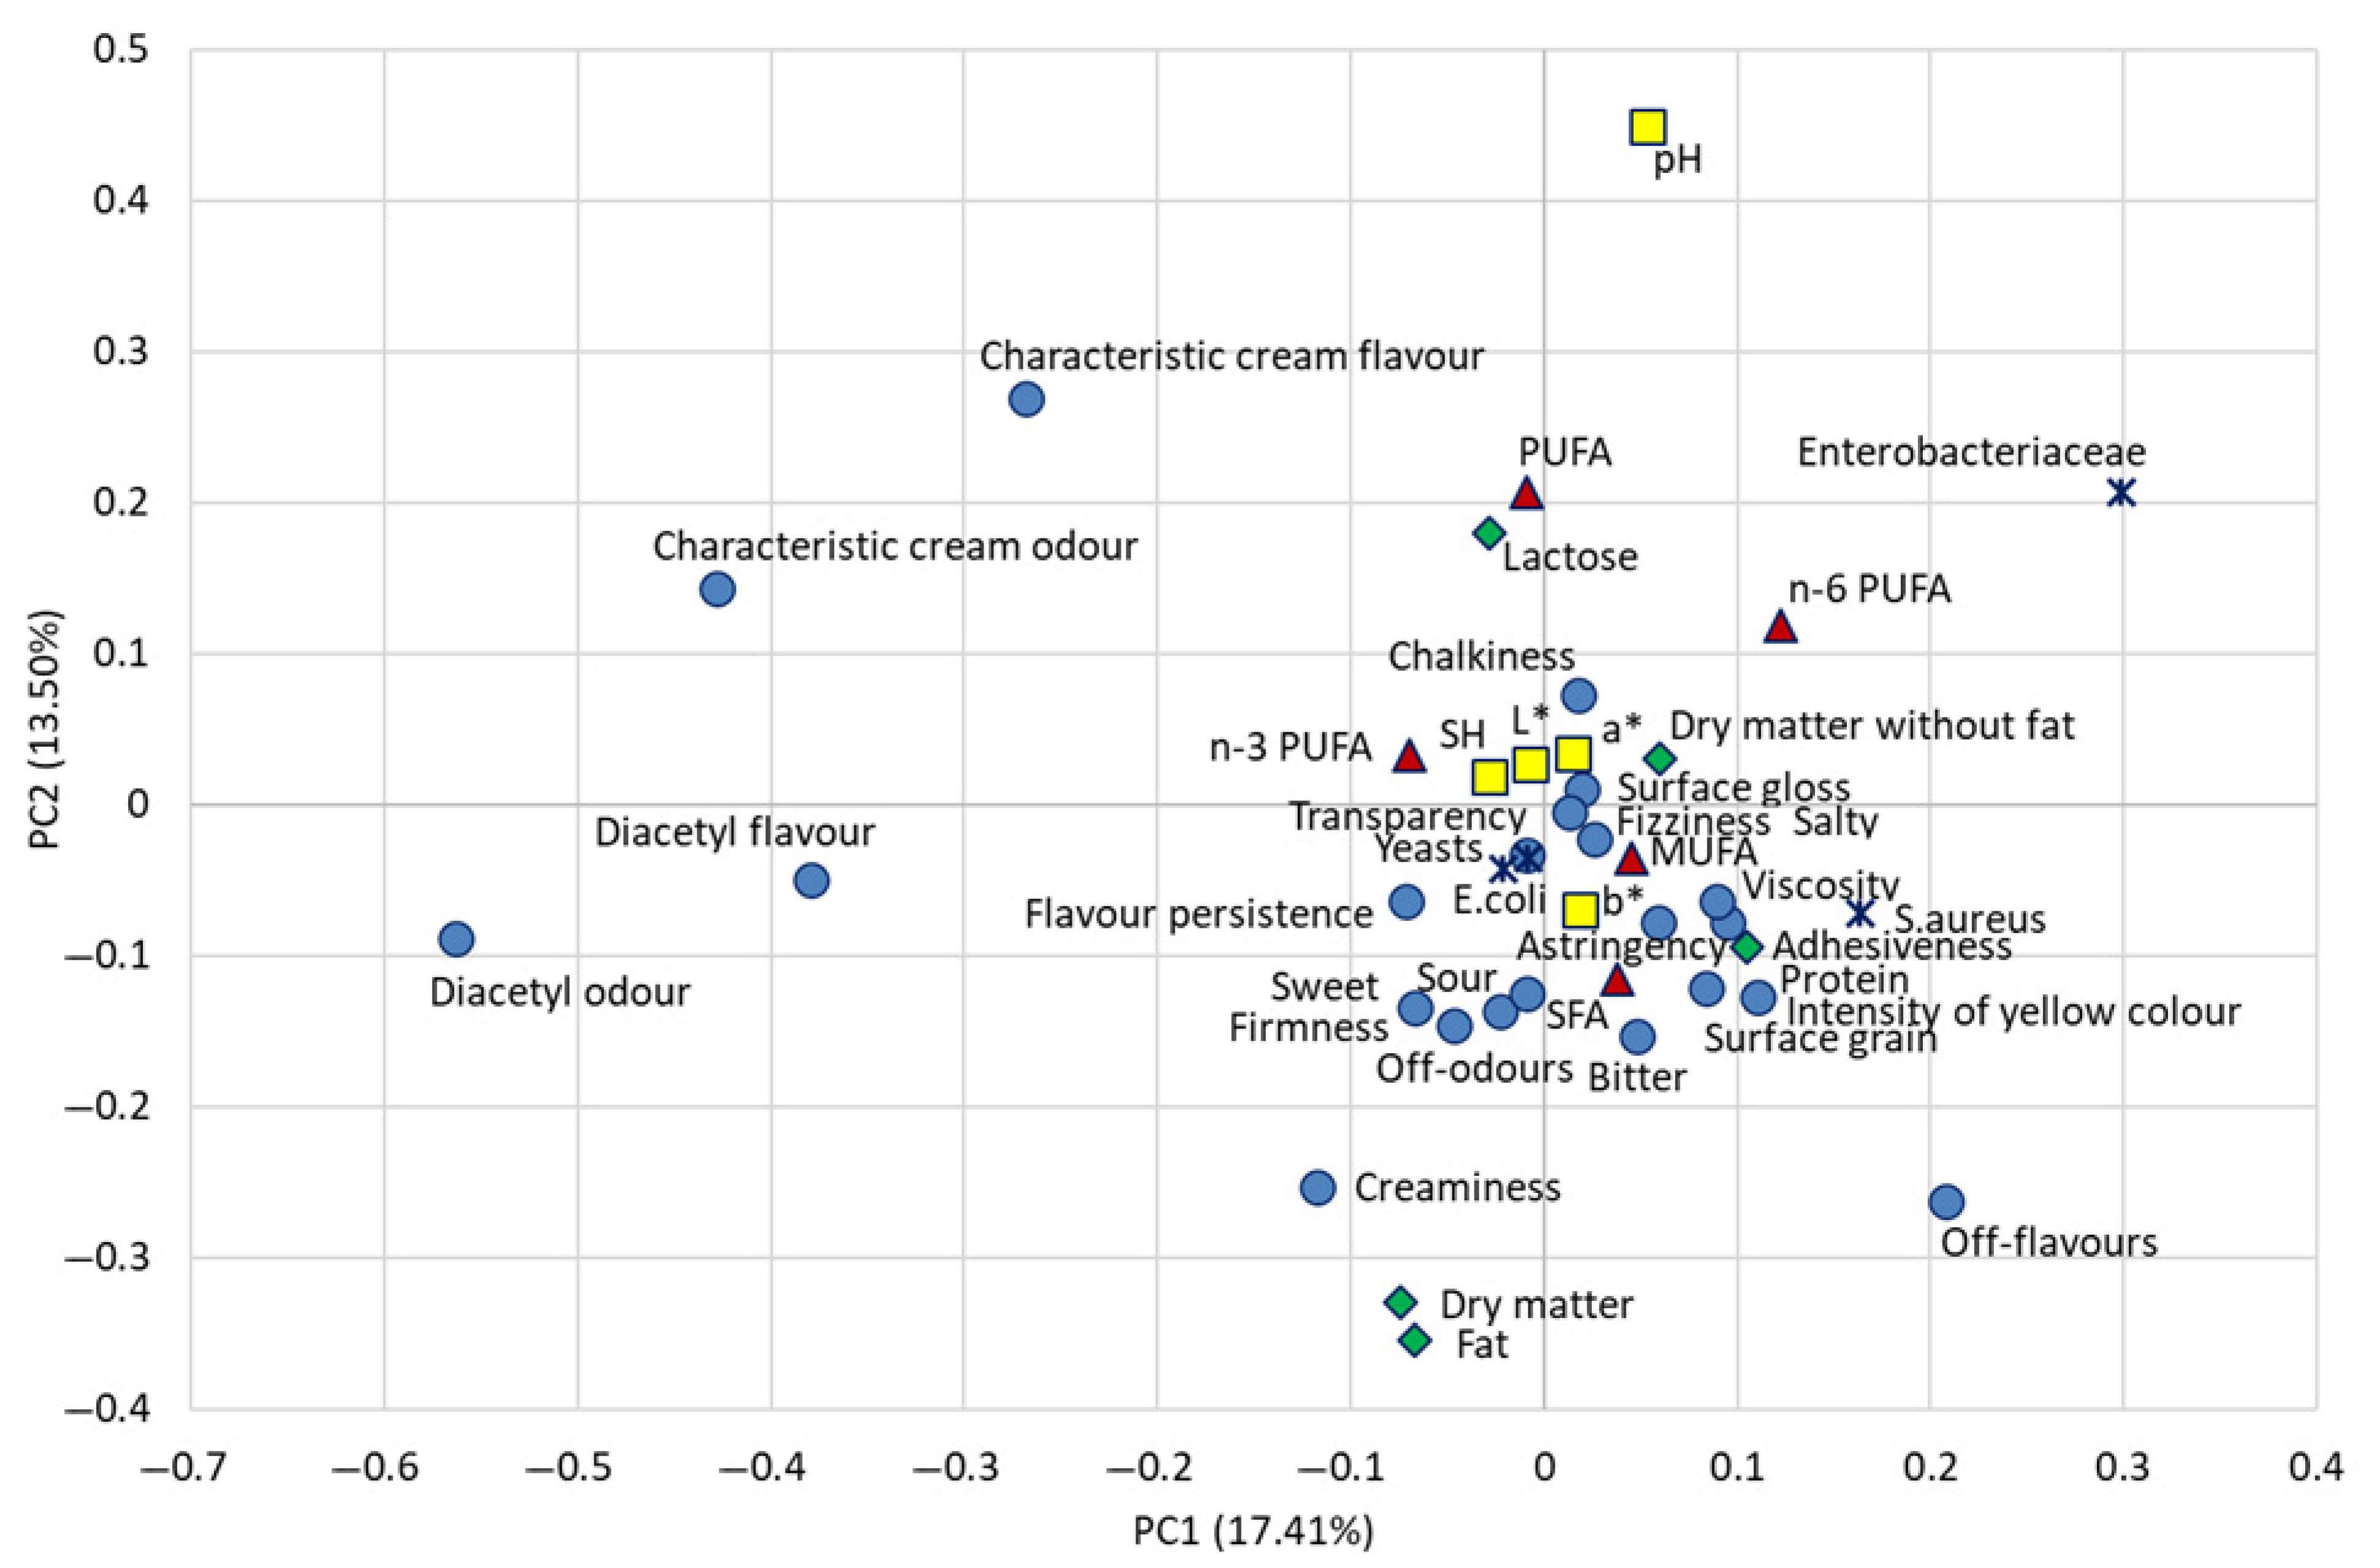
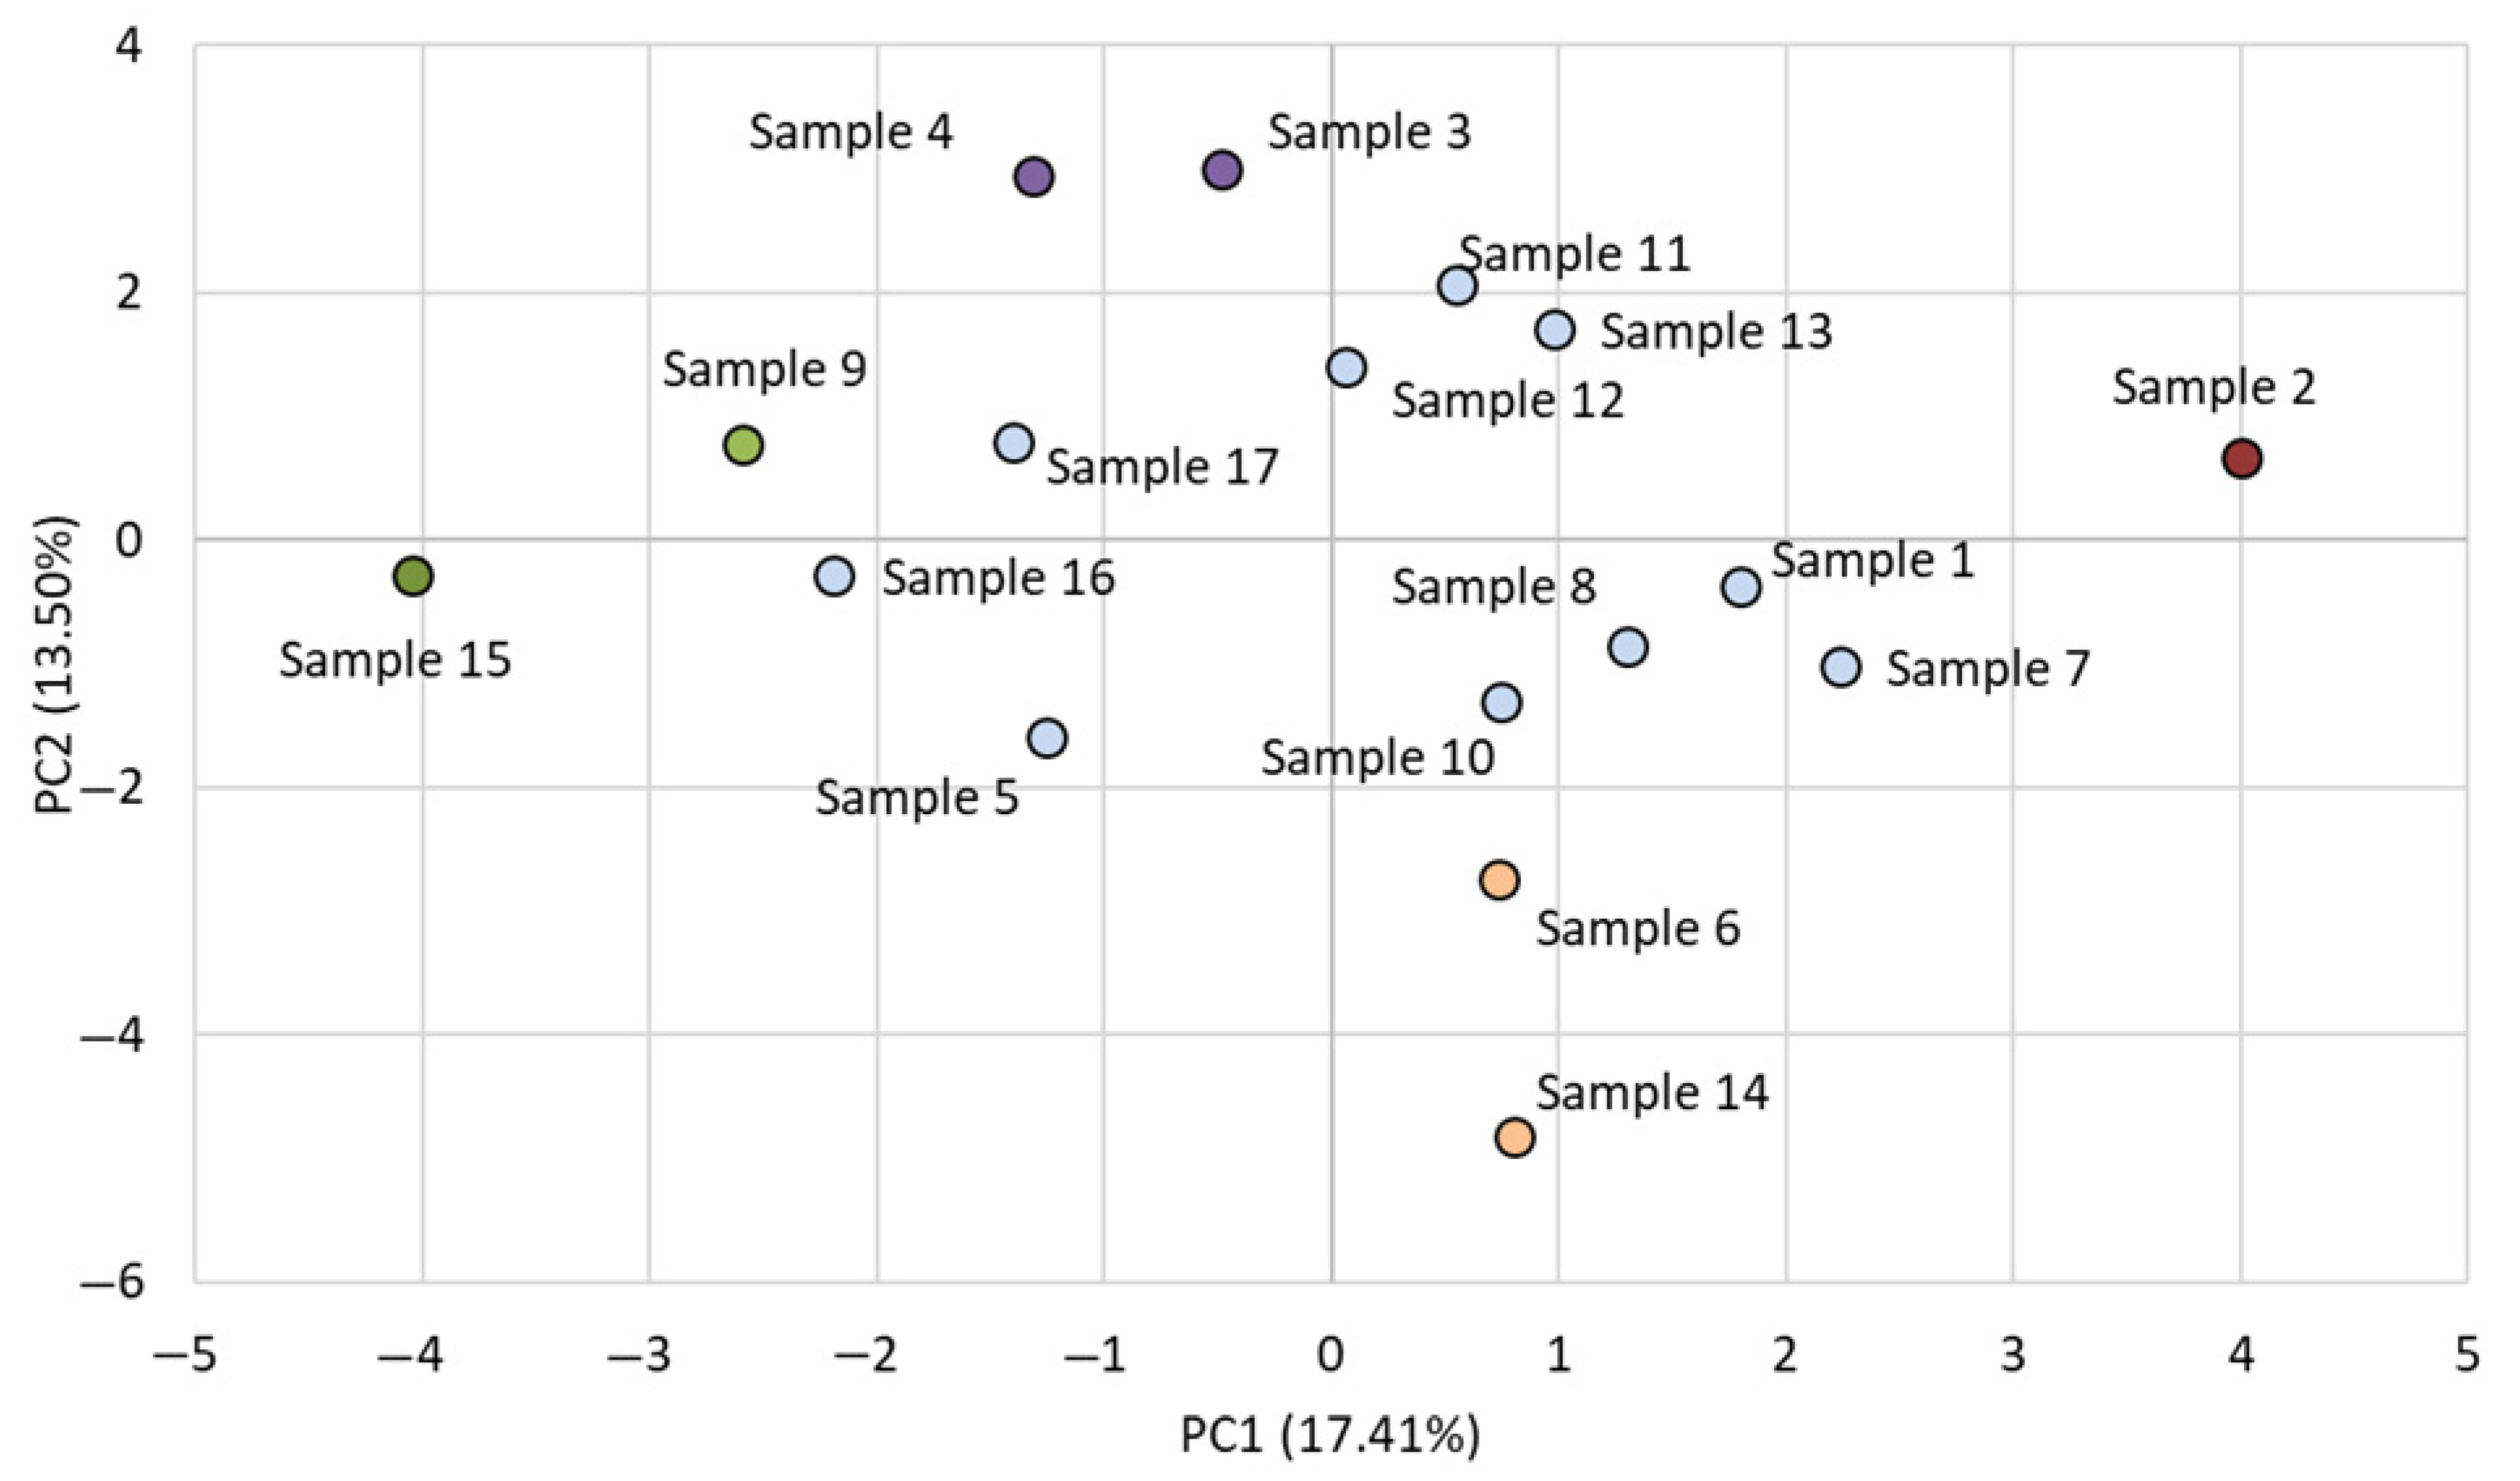
3.4. Principal Component Analysis

Principal component analysis (PCA) was performed to investigate the relationships between the physicochemical, microbiological, and sensory variables of the cream samples (Figure 6) and to evaluate the distribution and grouping of each sample (Figure 7). The first two principal components (PC1 and PC2) explained 17.41% and 13.50% of the total variance, respectively, for a total of 30.91%. Although the explained variance is relatively modest, the distribution of variables and samples in the PCA charts provides useful insights into the differentiation of cream characteristics.
As shown in Figure 1, PC1 (horizontal axis) separates the samples mainly on the basis of sensory and microbiological characteristics. On the positive side of PC1, there is a clear association with off-flavours and higher counts of Enterobacteriaceae and Staphylococcus aureus, indicating spoilage, microbial contamination, and reduced sensory quality. In contrast, the negative side of PC1 is associated with diacetyl odour, diacetyl flavour, characteristic cream flavour, and characteristic cream odour, indicating characteristics related to freshness and desirable sensory quality. This means that PC1 effectively distinguishes between samples of higher sensory quality and those with signs of spoilage or microbial deterioration.
In contrast, PC2 (vertical axis) appears to separate the samples according to physicochemical characteristics. The positive side of PC2 is mainly influenced by pH, PUFA content (especially n-6 PUFA), and lactose, suggesting a relationship with fermentation processes, lipid composition, and sugar content. The negative side of PC2, on the other hand, is determined by fat content, dry matter content, and creaminess, indicating samples with a richer texture and composition but potentially lower acidity or freshness indicators. This means that PC2 represents a gradient from chemically richer, more textured samples to samples with lower acidity and lipid oxidation potential.
Figure 7 shows the projection of the individual cream samples into the PCA space. The wide scatter of points reflects a high degree of heterogeneity in the physicochemical, microbiological, and sensory properties of the samples. Sample 2 (marked red in Figure 7) is clearly separated along the positive axis of PC1, indicating a unique profile possibly due to increased microbial contamination or pronounced off-flavour development, as shown by the association with spoilage-related variables. Conversely, samples 15 and 9 (marked green in Figure 7) on the negative side of PC1 are closely associated with diacetyl flavour and odour, which may reflect the influence of beneficial microbial cultures or spontaneous fermentation contributing to an enhanced butter flavour typical of fresh, well-fermented cream, with no evidence of microbial spoilage.
Along PC2, samples 3 and 4 (marked purple in Figure 7) are located in the upper left quadrant and appear to be characterised by positive sensory attributes such as cream flavour and odour combined with a higher pH. This combination indicates lower acidity and preserved freshness, possibly due to an early fermentation stage or minimal microbial metabolism. In contrast, samples 14 and 6 (marked orange in Figure 7), located in the lower right quadrant, are more closely related to fat content, dry matter, and creaminess. These samples likely represent richer, more texturally dense creams, possibly due to higher lipid concentration or longer maturation, which may improve mouthfeel, but may also be associated with more advanced stages of production or slight sensory deterioration, depending on the accompanying microbiological quality.
In addition to the previously discussed samples, the remaining cream samples exhibited a number of intermediate characteristics. Their distribution reflects the diversity of cream products available on the market and illustrates the value of PCA in visualising complex, multidimensional quality data. These samples, which were not strongly separated along any of the two principal components, showed moderate or balanced profiles. Located near the centre of the PCA plot, they did not exhibit extreme values in sensory, microbiological, or physicochemical parameters. This indicates a typical level of variability found in artisanal cream products, where factors such as small-scale production, varying raw milk quality, and less standardised processing methods contribute to a broader range of quality characteristics. These samples did not exhibit distinct quality characteristics, such as an intense cream flavour and diacetyl aroma, but also showed no clear signs of spoilage such as bitterness, off-odour, or increased bacterial counts. These are probably products that meet acceptable quality standards but do not have any special characteristics. Their intermediate positioning in the PCA space emphasises the extent to which differences in artisanal production methods, handling, and storage conditions can affect cream quality, even within a relatively narrow product category.

4. Conclusions

The analyses revealed that domestic cream sourced from marketplaces in Zagreb exhibits a highly variable chemical composition, with considerable differences in fat, protein, and dry matter content, which are most likely influenced by different production processes. It was confirmed that the fatty acid profile is predominantly characterised by saturated fats, with a significant proportion of monounsaturated and polyunsaturated fatty acids. Moreover, the detection of pathogenic microorganisms such as Escherichia coli and Staphylococcus aureus raises serious public health concerns, highlighting deficiencies in hygiene practices during production and handling. While the visual appearance of the cream samples was generally acceptable, consistency varied markedly, ranging from runny to thick and lumpy textures. The samples also exhibited a distinct sour taste and noticeable off-flavours, both indicative of spoilage. These findings underscore the urgent need for more frequent quality control measures in the domestic dairy sector to ensure consumer safety. The principal component analysis (PCA) provided valuable insights into the complex relationships between the physicochemical, microbiological, and sensory properties of the cream samples. The first principal component (PC1) allowed effective differentiation of the samples according to their sensory quality by distinguishing between samples with desirable characteristics and those with signs of spoilage. The second principal component (PC2) highlighted the differences in physicochemical properties, including pH and fat content, reflecting the different texture and compositional profiles of the creams. Overall, the PCA results highlight the heterogeneity of cream products on the market and the influence of production methods on their quality characteristics. Together, these insights facilitate more accurate sample classification and may inform future strategies for quality control and process optimisation in the production of domestic dairy products.

Author Contributions

Conceptualisation, D.B.L. and I.K.; methodology, D.B.L. and N.H.; software, I.K.; validation, all authors; formal analysis, D.B.L., M.B., and V.J.T.; investigation, all authors; resources, I.K.; data curation, D.B.L., I.K., and I.V.; writing—original draft preparation, M.B. and D.B.L.; writing—review and editing, I.K., L.C., B.R., I.V., N.H., and V.J.T.; visualisation, D.B.L., I.K. and I.V.; supervision, V.J.T.; funding acquisition, D.B.L. All authors have read and agreed to the published version of the manuscript.

Funding

This research was partly funded by the University of Zagreb, Croatia, as part of its support for core funding of scientific and artistic activities and by the project “Centre for Food Safety and Quality” (KK.01.1.1.02.0004), funded by the European Regional Development Fund.

Institutional Review Board Statement

The study was conducted in accordance with the Declaration of Helsinki, and the protocol was approved by the Ethics Committee of the Faculty of Agriculture, University of Zagreb on Sensory Analysis of Agri-Food Products (Class No.: 114-02/25-03/01; Reg. No.: 251-71-29-02/20-25-2).

Informed Consent Statement

All subjects gave their informed consent for inclusion before they participated in the study.

Data Availability Statement

The data are available on request from the corresponding author.

Conflicts of Interest

The authors declare no conflicts of interest.

References

  1. CXS 288-197; Codex Alimentarius. Standard for Cream and Prepared Creams. (FAO/WHO). Codex Alimentarius: Rome, Italy, 2022; Codex Standard 288. Available online: https://www.fao.org/fao-who-codexalimentarius/ (accessed on 1 February 2025).
  2. Samaržija, D. Dairy Microbiology; Croatian Dairy Association: Zagreb, Croatia, 2021; pp. 2–21, 130–176, 187–193, 228–235, 240–259. [Google Scholar]
  3. Official Gazette. Rulebook on the Registration and Approval of Facilities and on the Registration of Food Business Operators. NN 129/2019. 2019. Available online: https://narodne-novine.nn.hr/clanci/sluzbeni/2019_12_123_2434.html (accessed on 1 February 2025).
  4. Kirin, S. Bjelovar homemade cream. Mljekarstvo 2009, 59, 343–348. [Google Scholar]
  5. Hergešić, B. Mikrobiolological quality of sour cream. Mljekarstvo 1965, 15, 73–76. [Google Scholar]
  6. Samaržija, D. Fermented Milks, Cream and Butter. [Online]. University of Zagreb, Faculty of Agriculture. 2011. Available online: https://urn.nsk.hr/urn:nbn:hr:204:303724 (accessed on 1 February 2025).
  7. Tesfaw, L.B.; Alemu, S.; Alemayehu, H.; Sisay, Z.; Negussie, H. Prevalence and antimicrobial resistance profile of Salmonella isolates from dairy products of Addis Ababa, Ethiopia. Afr. J. Microbiol. Res. 2013, 7, 5046–5050. [Google Scholar] [CrossRef]
  8. Bintsis, T. Foodborne pathogens. AIMS Microbiol. 2017, 3, 529–563. [Google Scholar] [CrossRef] [PubMed]
  9. HRN EN ISO 2450; Determination of Fat Content—Gravimetric Method (Reference Method). Croatian Standards Institute: Zagreb, Croatia, 2008.
  10. HRN EN ISO 8968-1:2014; Determination of Nitrogen Content—Part 1: Kjeldahl Principle and Crude Protein Calculation. Croatian Standards Institute: Zagreb, Croatia, 2014.
  11. HRN ISO 6731:2010; Milk, Cream and Evaporated Milk—Determination of Total Solids Content (Reference Method). Croatian Standards Institute: Zagreb, Croatia, 2017.
  12. HRN ISO 22662:2024; Milk and Milk Products—Determination of Lactose Content by High-Performance Liquid Chromatography (Reference Method). Croatian Standards Institute: Zagreb, Croatia, 2010.
  13. HRN ISO 15884:2002; Milk Fat—Preparation of Fatty Acid Methyl Esters. Croatian Standards Institute: Zagreb, Croatia, 2003.
  14. HRN ISO 15885:2002; Milk Fat—Determination of The Fatty Acid Composition by Gas-Liquid Chromathography. Croatian Standards Institute: Zagreb, Croatia, 2003.
  15. ISO/TS 22113; Milk and Milk Products—Determination of the Titratable Acidity of Milk Fat. Croatian Standards Institute: Zagreb, Croatia, 2012.
  16. HRN EN ISO 6579-1:2017; Microbiology of the Food Chain—Horizontal Method for the Detection, Enumeration and Serotyping of Salmonella—Part 1: Detection of Salmonella spp. Croatian Standards Institute: Zagreb, Croatia, 2017.
  17. HRN EN ISO 6579-1:2017/A1; Microbiology of the Food Chain—Horizontal Method for the Detection, Enumeration and Serotyping of Salmonella—Part 1: Detection of Salmonella spp.—Amendment 1 Broader Range of Incubation Temperatures, Amendment to the Status of Annex D, and Correction of the Composition of MSRV and SC. Croatian Standards Institute: Zagreb, Croatia, 2020.
  18. HRN EN ISO 11290-1:2017; Microbiology of the Food Chain—Horizontal Method for the Detection and Enumeration of Listeria Monocytogenes and Other Listeria spp.—Part 1: Detection Method. Croatian Standards Institute: Zagreb, Croatia, 2017.
  19. HRN EN ISO 6888-1:2021/A1:2023; Microbiology of the Food Chain—Horizontal Method for the Enumeration of Coagulase-Positive Staphylococci (Staphylococcus aureus and Other Species)—Part 1: Method Using Baird-Parker Agar Medium. Croatian Standards Institute: Zagreb, Croatia, 2023.
  20. HRN EN ISO 21528-2:2017; Microbiology of the Food Chain—Horizontal Method for the Detection and Enumeration of Enterobacteriaceae—Part 2: Colony-Count Technique. Croatian Standards Institute: Zagreb, Croatia, 2017.
  21. HRN ISO 16649-2:2001; Microbiology of Food and Animal Feeding Stuffs—Horizontal Method for the Enumeration of Beta-Glucuronidase-Positive Escherichia coli—Part 2: Colony-Count Technique at 44 Degrees C Using 5-Bromo-4-chloro-3-indolyl Beta-D-Glucuronide. Croatian Standards Institute: Zagreb, Croatia, 2001.
  22. HRN ISO 21527-1:2008; Microbiology of Food and Animal Feeding Stuffs—Horizontal Method for the Enumeration of Yeasts and Molds—Part 1: Colony Count Technique in Products with Water Activity Greater than 0.95. Croatian Standards Institute: Zagreb, Croatia, 2012.
  23. HRN EN ISO 15213-1:2023; Microbiology of The Food Chain—Horizontal Method for the Detection and Enumeration of Clostridium spp.—Part 1: Enumeration of Sulfite-Reducing Clostridium spp. by Colony-Count Technique. Croatian Standards Institute: Zagreb, Croatia, 2023.
  24. CIE. Recommendations on Uniform Color Spaces, Color Difference Equations, Psychometric Color Terms (Supplement nº. 2 of Publication Commission Internationale de l’Eclairage (CIE) nº. 15 (E-1.3.1); Bureau Central de la CIE: Paris, France, 1978. [Google Scholar]
  25. HRN ISO 8589:2007; Sensory Analysis—General Guidance for the Design of Test Rooms. Croatian Standards Institute: Zagreb, Croatia, 2008.
  26. ISO 22935-1; Milk and Milk Products—Sensory Analysis—Part 1: Recruitment, Selection, Training and Monitoring of Assessors. Croatian Standards Institute: Zagreb, Croatia, 2023.
  27. SAS Institute. SAS Studio, Enterprise Edition, Release: 3.81; SAS Institute: Cary, NC, USA, 2022. [Google Scholar]
  28. Konjačić, M.; Marković, T.; Ivanković, A.; Stručić, D. Effect of year and season on the chemical composition and hygienic quality of organic cow’s milk. Stockbreeding: J. Anim. Improv. 2015, 69, 45–53. [Google Scholar]
  29. Lukač, J.; Samaržija, D. Quality of home-made dairy products on Zagreb green-market. Mljekarstvo 1990, 40, 209–215. [Google Scholar]
  30. Barbir, T.; Vulić, A.; Pleadin, J. Fats and fatty acids in food of animal origin. Vet. Pract. 2014, 45, 97–110. [Google Scholar]
  31. Izsó, T.; Kasza, G.Y.; Somogyı, L. Differences between fat-related characteristics of sour cream and sour cream analogues. Acta Aliment. 2020, 49, 390–397. [Google Scholar] [CrossRef]
  32. Mieželienė, A.; Alenčikienė, G.; Zaborskienė, G.; Garmienė, G. Effect of fat origin on sensory and physicochemical characteristics of sour cream. Milchwissenschaft 2012, 67, 64–67. [Google Scholar]
  33. Palmquist, D.L.; Beaulieu, A.D.; Barbano, D.M. Feed and Animal Factors Influencing Milk Fat Composition. J. Dairy Sci. 1993, 76, 1753–1771. [Google Scholar] [CrossRef] [PubMed]
  34. Samaržija, D.; Podoreški, M.; Sikora, S.; Skelin, A.; Pogačić, T. Spoilage microorganisms in milk and dairy products. Mljekarstvo 2007, 57, 251–273. [Google Scholar]
  35. Markov, K.; Frece, J.; Čvek, D.; Delaš, F. Listeria monocytogenes and other contaminants in fresh cheese and cream from Zagreb city area domestic production. Mljekarstvo 2009, 59, 225–231. [Google Scholar]
  36. Shepard, L.; Miracle, R.E.; Leksrisompong, P.; Drake, M.A. Relating sensory and chemical properties of sour cream to consumer acceptance. J. Dairy Sci. 2013, 96, 5435–5454. [Google Scholar] [CrossRef] [PubMed]
  37. European Union. Cream. Modern and Innovative Online-Based Know-How on European Dairy Processing (Milk-ed). 2022. Available online: https://milk-ed.eu/wp-content/uploads/2022/05/Cream_HR.pdf (accessed on 1 February 2025).
  38. Jervis, S.M.; Gerard, P.; Drake, S.; Lopetcharat, K.; Drake, M.A. The perception of creaminess in sour cream. J. Sens. Stud. 2014, 29, 248–257. [Google Scholar] [CrossRef]
  39. Wang, Y.; Wu, J.; Lv, M.; Shao, Z.; Hungwe, M.; Wang, J.; Bai, X.; Xie, J.; Wang, Y.; Geng, W. Metabolism Characteristics of Lactic Acid Bacteria and the Expanding Applications in Food Industry. Front. Bioeng. Biotechnol. 2021, 12, 612285. [Google Scholar] [CrossRef] [PubMed]
  40. Wilbey, R.A. Microbiology of cream and butter. In Dairy Microbiology Handbook: The Microbiology of Milk and Milk Products; Wiley-Interscience: Hoboken, NJ, USA, 2002; pp. 123–174. [Google Scholar]
  41. Li, D.; Cui, Y.; Wu, X.; Li, J.; Min, F.; Zhao, T.; Zhang, J.; Zhang, J. Graduate Student Literature Review: Network of flavor compounds formation and influence factors in yogurt. J. Dairy Sci. 2024, 107, 8874–8886. [Google Scholar] [CrossRef] [PubMed]
  42. Bandić, L.M.; Oštarić, F.; Vinceković, M.; Mikulec, N. Biochemistry of aroma compounds in cheese. Mljekarstvo 2023, 73, 211–224. [Google Scholar] [CrossRef]
  43. Tian, H.; Xiong, J.; Yu, H.; Chen, C.; Lou, X. Flavor optimization in dairy fermentation: From strain screening and metabolic diversity to aroma regulation. Trends Food Sci. Technol. 2023, 141, 104194. [Google Scholar] [CrossRef]
Figure 1. The appearance properties of sour cream.
Applsci 15 08234 g001
Figure 2. The odour profile of sour cream samples.
Applsci 15 08234 g002
Figure 3. The texture profile of sour cream samples.
Applsci 15 08234 g003
Figure 4. The taste profile of sour cream samples.
Applsci 15 08234 g004
Figure 5. The flavour profile of sour cream.
Applsci 15 08234 g005
Figure 6. Loading plot of the first two principal components after Varimax rotation.
Applsci 15 08234 g006
Figure 7. Score plot of the samples in the plane defined by the first two principal components after Varimax rotation.
Applsci 15 08234 g007
Table 1. Sensory attributes, definitions, and range.
Sensory AttributeDefinition
Appearance
Intensity of yellow colourIntensity of yellow colour (white to yellow)
TransparencyDegree of transparency (opaque to fully transparent)
Surface glossIntensity of surface gloss (dull to glossy)
Surface grainVisibility of surface grain (smooth to grainy)
Odour
Characteristic cream odourIntensity of typical cream odour (absent to intense)
Diacetyl odourIntensity of buttery (diacetyl) odour (absent to intense)
Off-odoursIntensity of off-odours (absent to intense)
Texture
FirmnessIntensity of firmness (soft to firm)
AdhesivenessDegree of adhesiveness in mouth (non-adhesive to highly adhesive)
ChalkinessPerception of chalky mouthfeel (absent to pronounced)
ViscosityIntensity of viscosity (liquid to thick)
CreaminessIntensity of creaminess (watery to very creamy)
FizzinessPresence of fizziness or effervescence (absent to strong)
Taste
SweetIntensity of sweet taste (not sweet to very sweet)
SaltyIntensity of salty taste (not salty to very salty)
SourIntensity of sour taste (not sour to very sour)
BitterIntensity of bitter taste (not bitter to very bitter)
AstringencyIntensity of astringency (none to strong)
Flavour
Characteristic cream flavourIntensity of typical cream flavour (absent to strong)
Diacetyl flavourIntensity of buttery (diacetyl) flavour (absent to strong)
Off-flavoursIntensity of undesirable flavours (none to strong)
Flavour persistenceDuration of flavour after swallowing (short to long)
Table 2. Physicochemical composition of sour cream samples (n = 17).
SampleMilk Fat
(%)
Protein
(%)
TS
(%)
SNF
(%)
Lactose
(%)
pH°SH
127.742.9333.76.33.034.488.40
218.614.7725.085.551.704.537.84
319.352.9226.768.024.494.707.72
423.163.1329.937.423.644.675.60
533.302.8938.334.782.144.3712.00
639.802.7244.34.751.784.115.24
730.803.5236.896.512.574.305.24
836.522.9642.257.162.774.585.68
925.283.2531.706.713.174.359.12
1033.993.0540.417.423.374.253.92
1115.363.2323.118.024.524.7114.24
1225.923.5132.806.583.374.599.20
1326.303.1931.414.341.924.3111.48
1435.894.5442.746.992.314.099.36
1529.923.2935.995.782.784.1114.84
1629.413.1936.197.193.594.369.04
1724.423.0931.387.183.874.3520.92
Min15.362.7223.114.341.704.093.92
Max39.804.7744.308.024.524.7120.92
Mean27.993.3034.296.513.004.409.40
SD6.730.556.191.120.870.204.30
CV24.0616.6818.0617.2229.094.6245.76
TS = total solids; SNF = solids non-fat; LSM = least-square mean; CV = coefficient of variability; SD = standard deviation.
Table 3. Saturated fatty acid content (g/100 g fat).
C4:0C6:0C8:0C10:0C12:0C14:0C15:0C16:0C18:0SFA (%)
14.212.341.322.823.1510.731.1026.8510.9464.56
23.582.261.373.313.7712.310.0032.187.9968.09
34.092.311.332.933.3411.271.1928.1111.2866.80
43.452.462.432.582.8710.242.0229.4511.1767.44
53.942.211.212.512.8511.051.1729.6210.1465.48
63.871.961.042.132.409.341.0628.4810.9162.20
74.492.371.343.093.6411.941.6229.4510.0469.20
85.422.090.951.621.676.910.8126.6512.8160.35
94.592.491.392.883.1611.391.1827.4211.5367.18
105.552.731.523.113.5211.071.0331.6410.7872.47
114.922.371.272.622.939.661.1026.8410.5964.42
124.201.961.102.122.408.191.0624.178.9258.03
133.611.871.022.182.619.661.4428.4410.3562.58
144.902.491.302.582.8210.321.7128.029.9066.12
153.842.281.343.073.5811.601.1631.189.3668.31
163.732.271.373.263.8312.081.1131.4510.4770.67
173.882.221.232.673.0811.531.1831.5810.4168.95
SFA (%)—saturated fatty acid.
Table 4. Monounsaturated and polyunsaturated fatty acid content (g/100 fat).
SampleMUFAPUFA
C14:1C16:1C18:1n9C18:2n6C18:3n3
10.771.5425.072.230.71
20.881.5620.142.330.78
30.891.4823.601.980.50
41.581.7820.812.540.14
51.021.6224.561.690.31
60.751.7128.092.030.44
71.061.9621.751.661.32
80.542.1833.892.070.23
90.771.1423.511.940.42
100.931.5020.602.750.00
110.811.4421.941.850.69
120.001.5218.802.011.07
130.860.1026.321.890.47
140.801.6522.620.591.24
150.941.6421.792.060.53
160.771.4020.562.090.38
171.021.3122.862.000.00
MUFA—monounsaturated fatty acid; PUFA—polyunsaturated fatty acid.
Table 5. Results of the microbiological analysis of sour cream.
SampleYeast
cfu/mL
B. spp.
cfu/mL
L. mon.
cfu/mL
St. aur.
cfu/mL
Ent.
cfu/mL
Sal.
cfu/mL
E. coli
cfu/mL
Cl. spp.
cfu/mL
172,727+13,636973250<10
254,545<10<10080,0003909<10
350,000<10<10063641364<10
490,000<10<10020,0009091<10
586,364<10<10015,63611,364<10
6104,545<10363630,00012,727<10
7145,455<1027,27313,63635<10
8109,091<10<1001445180<10
990,909<10<100718409<10
1050,000+345518,1823636<10
1155,455<10<10016,3644545<10
12172,727+<10019,0915455<10
1370,909<10227359,0912727<10
1454,545<10<100973255<10
15107,273<10<100636150<10
1681,818<10<10010,0904773<10
17163,636+19093636955<10
+ = Positive; − = Negative; B. spp = Bacillus spp.; L. mon. = L. monocytogenes; St. aur. = S. aureus; Ent. = Enterobacteriaceae; Sal. = Salmonella; Cl. spp. = Clostridium spp.
Table 6. Colour parameters of sour cream samples collected from marketplaces in Zagreb.
Colour Parameter
SampleL*a*b*
197.34−2.0217.29
299.62−2.7217.15
3102.33−1.8814.3
498.29−1.979.73
5102.29−1.1416.81
699.53−1.0615.26
7101.12−1.7215.83
897.63−1.9924.14
998.24−1.868.69
1099.1−0.9415.32
1199.6−2.4413.08
1296.98−1.8416.57
1396.72−1.7613.02
1499.11−3.2623.47
15101.57−3.0718.78
1699.94−1.1314.71
1799.52−1.9311.57
Min96.72−3.268.69
Max102.33−0.9424.14
Mean99.35−1.9315.63
SD1.730.664.08
CV1.7534.4926.13
LSM = least-square mean; CV = coefficient of variability; SD = standard deviation.
Table 7. Correlation coefficients between colour parameters and milk fat content.
L*a*b*p-Value
a*−0.49 0.0174
b*0.310.43 0.15110.042
Milk fat0.62−0.020.740.00170.9090.00005
Disclaimer/Publisher’s Note: The statements, opinions and data contained in all publications are solely those of the individual author(s) and contributor(s) and not of MDPI and/or the editor(s). MDPI and/or the editor(s) disclaim responsibility for any injury to people or property resulting from any ideas, methods, instructions or products referred to in the content.

