
An Integrated Risk Assessment of Rockfalls Along Highway Networks in Mountainous Regions: The Case of Guizhou, China


Abstract
1. Introduction
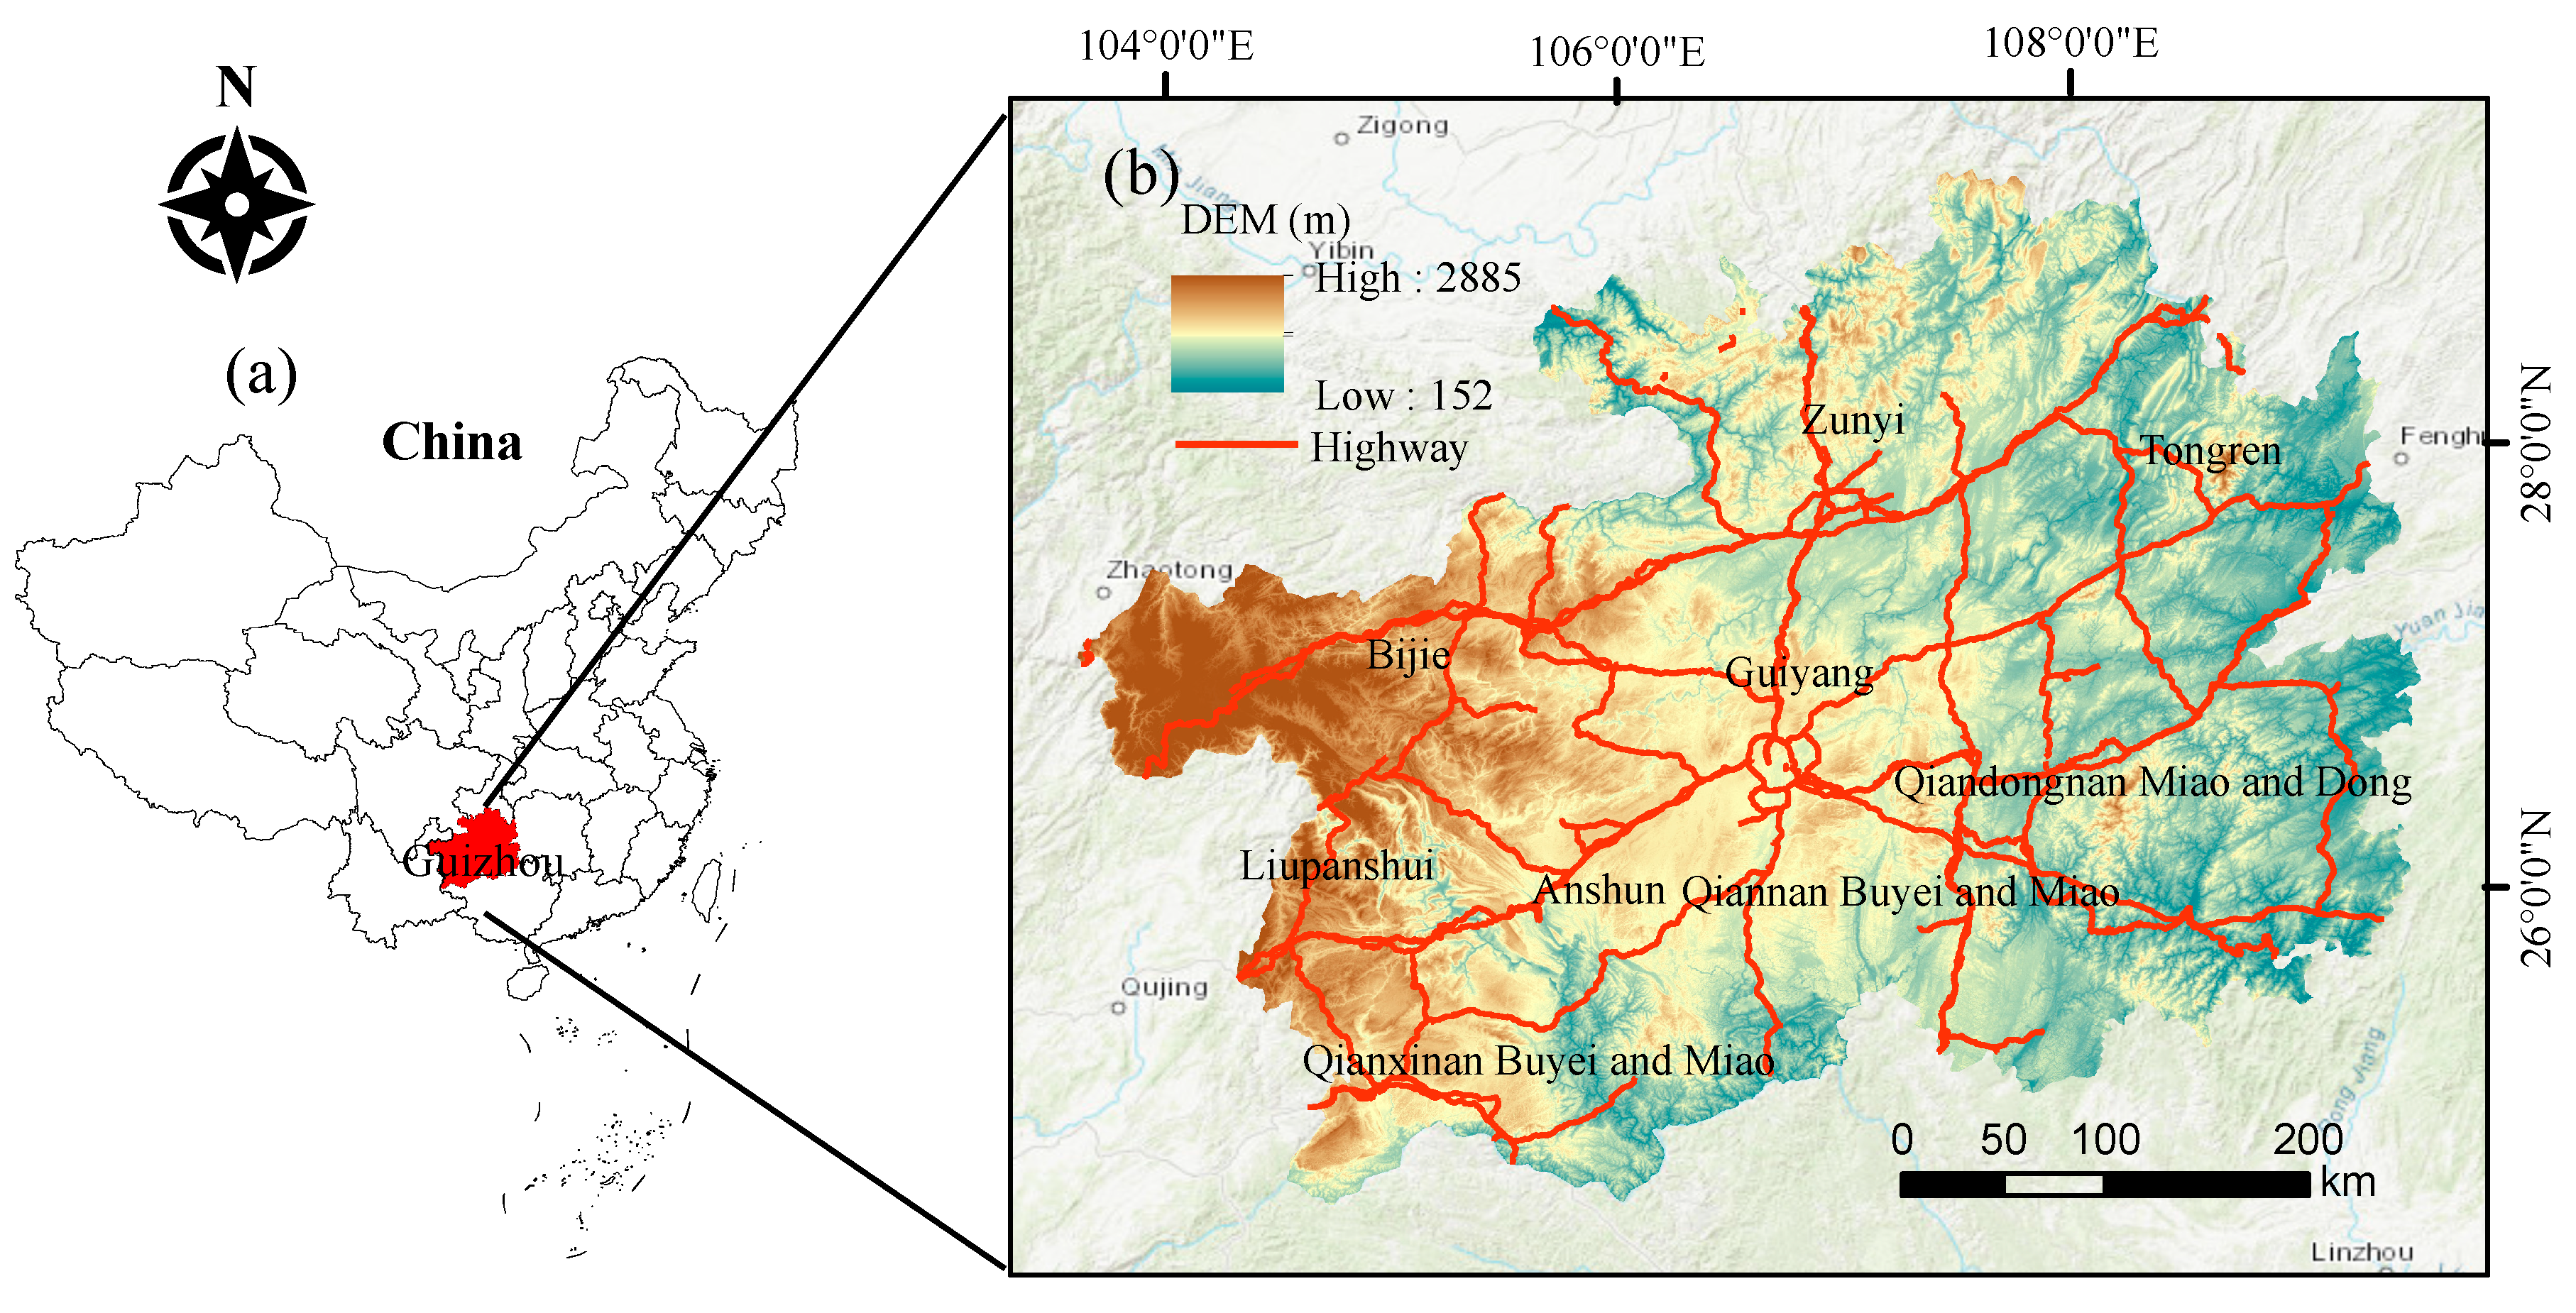
2. Study Area
3. Methodology
3.1. Data Preparation
3.2. Highway Rockfall Susceptibility
- (1)
- Elevation. Elevation is the absolute distance from a certain point along the vertical direction to a certain point. It is an important factor influencing the occurrence and development of geologic hazards such as rockfall and their morphological characteristics [41]. The greater the elevation, the greater the gravitational potential energy of the rockfall. The terrain of Guizhou Province is high in the west and low in the east, and the average elevation reaches more than 1000 m. At different elevation ranges, there is significant variability in vegetation cover, rainfall, temperature variations, and the intensity of human engineering activities. These factors directly or indirectly affect the occurrence of geologic hazards.
- (2)
- Slope. Slope reflects the steepness of the surface of the rockfall hazard site, and is generally expressed as the ratio of the vertical distance from a point on the slope surface to the foot of the slope and the horizontal distance from the foot of the slope. Some slopes are potentially hazardous. The steeper the slope, the more water and soluble salts will gradually accumulate down the slope, directly affecting the vegetation distribution on the slope [39]. The movement of water within the slope, the denudation and material distribution of the rock and soil bodies on the slope surface, and the stress characteristics within the slope body will be different for different slope locations, and the probability of a rockfall will vary. The probability of rockfalls will also change accordingly. The greater the slope, the more likely the rocks are to be eroded, leading to the occurrence of rockfall accidents. Moreover, the greater the slope, the greater the kinetic energy of the rockfall.
- (3)
- NDVI. The NDVI is calculated from landsat8 OLI remote sensing satellite bands. The NDVI can separate vegetation from water and soil, can objectively reflect changes in the amount of vegetation cover, and is the best indicator of vegetation growth status and vegetation cover [49]. The vegetation significantly influences the stability of a slope. Studies have shown that vegetation can strengthen the shear capacity of soil through its root system, which has the effect of soil consolidation and slope protection. As the vegetation cover increases, the stability of the slope improves, and the probability of rockfalls decreases.
- (4)
- Aspect. Aspect is expressed as the angle between the projection of the normal direction of the slope on the plane and the due north direction. Aspect has an effect on both the number of days of sunshine and the total radiation received by the slope [44]. Due to differences in the amount of solar radiation received, the evaporation of water from the slope surface, the distribution of vegetation on the slope surface, the pore water pressure, and the wet–dry cycle of the slope will vary from one slope direction to another, which in turn will lead to rainfall, vegetation cover, erosion, and weathering of the slopes.
- (5)
- Distance from fault. A fault is a structure in which the earth’s crust is fractured by force, and significant relative displacement of rock masses occurs along both sides of the fracture plane [13]. Faults disrupt the rock and soil structure in the vicinity, and the integrity of the slope is compromised. The closer the fault, the more discontinuous the rock, and the looser the soil, the higher the probability of rockfalls.
- (6)
- Relief amplitude. Relief amplitude is the difference between the elevation of the highest point and the elevation of the lowest point in a given area. It is a macroscopic indicator that characterizes the topography of a region [58]. Relief amplitude is mainly the result of tectonic movements and surface erosion and represents the degree of regional surface denudation and cutting. As relief amplitude increases, the probability of rockfalls increases.
- (7)
- Lithology. Lithology refers to some properties that reflect the characteristics of the rock. In different lithologies, shear strength is distinct; permeability is also different; the stability of the slope, destabilization degree, and resistance to stability are different; and the ease of occurrence of geologic disasters is also different [41]. Lithology directly affects the size and extent of rockfalls. In this research, the lithologies are categorized into five categories as very soft rock, soft rock, softer rock, harder rock, and hard rock, and are given the labels 1, 2, 3, 4, and 5.
- (8)
- RWI. The RWI reflects the degree of rock weathering, which is usually affected by temperature, humidity, sunshine, wind speed, and other factors. When the degree of rock weathering is very high, the rock will be broken, the strength of the rock will be reduced, and rockfall disasters will occur more easily [56,57]. In this research, the wind speed, sunshine duration, daily maximum temperature, and humidity index are taken as the factors to calculate the RWI. The greater the wind speed, the stronger the erosion and weathering effect on rocks, while sunshine and high temperature will accelerate rock weathering, and high humidity will also accelerate rock weathering. These four factors are normalized and superimposed to get the RWI.
3.3. Highway Rainfall Hazard
- (1)
- Average annual rainfall. Guizhou Province has a plateau-type subtropical climate with abundant rainfall, and the average annual rainfall is mostly between 1100 and 1400 mm. It can be seen in Figure 6a that the average annual rainfall distribution of the whole Guizhou Province is higher in the southeast and lower in the northwest. Average annual rainfall can be a good reflection of the climate of the study area; the greater the mean annual rainfall, the greater the surface runoff of the slope, and the greater the probability that the slope will be subjected to rainwater erosion. This can lead to the disruption of slope integrity and vegetation cover, ultimately leading to rockfall accidents.
- (2)
- Daily maximum rainfall. Daily maximum rainfall is the amount of rainfall in a 24 h period, which can be representative of extreme severe weather. The daily maximum rainfall in Guizhou Province is shown in Figure 6b, which shows that the daily maximum rainfall in Guizhou Province mainly occurs in the central and southern parts of the province. Excessive daily maximum rainfall causes large amounts of surface runoff from slopes, eroding the slopes, washing away the rocks on the slopes’ surface, and reducing vegetation’s protective effect on the slopes. It makes rockfalls much more likely to occur.
3.4. Highway Rockfall Vulnerability
- (1)
- Population. Population is an important social indicator that reflects the size of a city’s development. The greater the population, the greater the likelihood of injury or death from rockfall accidents and the greater the susceptibility of the highway rockfall. The population of the entire Guizhou Province is mainly concentrated in the northwestern part of the province, while the eastern and southern parts of the province have a smaller population distribution since they are areas where ethnic minorities gather. The population distribution of the entire Guizhou Province is shown in Figure 7a. In this study, the population distribution of the whole Guizhou Province was mapped by the GIS and extracted through the previously established buffer zone of 500 m range as the number of people that might be affected by the rockfall hazard along the study area.
- (2)
- GDP. GDP is an important indicator that reflects the social economy and can well reflect the level of urban development. The higher the city’s GDP, the higher the damage caused by rockfall. In this study, the GDP was obtained from the data released by the Guizhou Provincial Government. Population increases will also promote economic growth, so the economic situation and population distribution of Guizhou Province are similar. Both are high in the northwest and low in the east, as well as in the south. The GDP distribution of the entire Guizhou Province is shown in Figure 7b.
- (3)
- Land use type. The land use type is also a reflection of how well a city has been developed and constructed. In this research, land use types in Guizhou Province were categorized into trees, flooded vegetation, crops, built-up areas, and clearings. The impact of highway rockfall vulnerability varies by land use type. Once rockfall accidents occur, the built-up area will be more affected, but the vegetation cover area will be less affected. The land use type distribution of the entire Guizhou Province is shown in Figure 7c. The land use types in this study have an accuracy of 10 m, which can accurately reflect the land use types along the study area, and different land types are affected differently by rockfall hazards; for example, they will have a large impact on built-up areas and a small impact on land types such as clearings.
3.5. Highway Rockfall Risk
4. Results
4.1. Highway Rockfall Susceptibility Map
4.2. Highway Rainfall Hazard Map
4.3. Highway Rockfall Vulnerability Map
4.4. Highway Rockfall Risk Map
5. Discussion
6. Conclusions
- (1)
- The total highway rockfall risk in the whole of Guizhou Province is high. High-risk areas dominate, making up 41.19% of the total risk area. Medium-risk and low-risk areas account for 28.09% and 18.87%, respectively, while very high-risk areas represent just 11.84%.
- (2)
- The highway rockfall risk in Guizhou Province is characterized by a high spatial distribution in the west and a low spatial distribution in the east. BJ has the largest percentage of highway mileage that is above the high-risk level, over 70%, while QDN has the largest percentage of road mileage that is below the medium-risk level, over 75%.
- (3)
- A logistic regression analysis revealed that the RWI is the most important factor influencing highway rockfall susceptibility. The distance from the fault is the most negatively correlated indicator of highway rockfall susceptibility. The elevation has the least effect on the susceptibility to highway rockfalls.
- (4)
- By extracting the risk probabilities of disaster and non-disaster points and plotting the ROC curve, its AUC value reached 0.827. This proves that the model of this study is highly accurate.
Author Contributions
Funding
Institutional Review Board Statement
Informed Consent Statement
Data Availability Statement
Acknowledgments
Conflicts of Interest
References
- Hungr, O.; Leroueil, S.; Picarelli, L. The Varnes classification of landslide types, an update. Landslides 2014, 11, 167–194. [Google Scholar] [CrossRef]
- Matsuoka, N.; Sakai, H. Rockfall activity from an alpine cliff during thawing periods. Geomorphology 1999, 28, 309–328. [Google Scholar] [CrossRef]
- Tesfa, C.; Woldearegay, K. Characteristics and susceptibility zonation of landslides in Wabe Shebelle Gorge, south eastern Ethiopia. J. Afr. Earth Sci. 2021, 182, 104275. [Google Scholar] [CrossRef]
- Gariano, S.L.; Guzzetti, F. Landslides in a changing climate. Earth-Sci. Rev. 2016, 162, 227–252. [Google Scholar] [CrossRef]
- He, Y.; Thies, S.; Avner, P.; Rentschler, J. Flood impacts on urban transit and accessibility—A case study of Kinshasa. Transp. Res. Part D Transp. Environ. 2021, 96, 102889. [Google Scholar] [CrossRef]
- Li, G.; Lei, Y.; Yao, H.; Wu, S.; Ge, J. The influence of land urbanization on landslides: An empirical estimation based on Chinese provincial panel data. Sci. Total Environ. 2017, 595, 681–690. [Google Scholar] [CrossRef] [PubMed]
- Ma, F.; Ao, Y.; Wang, X.; He, H.; Liu, Q.; Yang, D.; Gou, H. Assessing and enhancing urban road network resilience under rainstorm waterlogging disasters. Transp. Res. Part D Transp. Environ. 2023, 123, 103928. [Google Scholar] [CrossRef]
- Tiranti, D.; Mallen, L.; Nicolò, G. Rockfall hazard estimation and related applications for a preliminary risk assessment at regional scale: An example from northwestern Italian Alps. Landslides 2023, 20, 1691–1704. [Google Scholar] [CrossRef]
- Wang, T.; Qu, Z.; Yang, Z.; Nichol, T.; Clarke, G.; Ge, Y.E. Climate change research on transportation systems: Climate risks, adaptation and planning. Transp. Res. Part D Transp. Environ. 2020, 88, 102553. [Google Scholar] [CrossRef]
- Alvioli, M.; Santangelo, M.; Fiorucci, F.; Cardinali, M.; Marchesini, I.; Reichenbach, P.; Rossi, M.; Guzzetti, F.; Peruccacci, S. Rockfall susceptibility and network-ranked susceptibility along the Italian railway. Eng. Geol. 2021, 293, 106301. [Google Scholar] [CrossRef]
- Weidner, L.; Walton, G.; Phillips, C. Investigating the influences of precipitation, snowmelt, and freeze-thaw on rockfall in Glenwood Canyon, Colorado using terrestrial laser scanning. Landslides 2024, 21, 2073–2091. [Google Scholar] [CrossRef]
- He, F.; Gu, L.; Wang, T.; Zhang, Z. The synthetic geo-ecological environmental evaluation of a coastal coal-mining city using spatiotemporal big data: A case study in Longkou, China. J. Clean. Prod. 2017, 142, 854–866. [Google Scholar] [CrossRef]
- Liu, W.; Zhang, Y.; Liang, Y.; Sun, P.; Li, Y.; Su, X.; Wang, A.; Meng, X. Landslide risk assessment using a combined approach based on InSAR and random forest. Remote Sens. 2022, 14, 2131. [Google Scholar] [CrossRef]
- Zhu, J.; Liu, K.; Wang, M.; Xu, W.; Liu, M.; Zheng, J. An empirical approach for developing functions for the vulnerability of roads to tropical cyclones. Transp. Res. Part D Transp. Environ. 2022, 102, 103136. [Google Scholar] [CrossRef]
- Pan, A. Study on mobility-disadvantage group’risk perception and coping behaviors of abrupt geological hazards in coastal rural area of China. Environ. Res. 2016, 148, 574–581. [Google Scholar] [CrossRef] [PubMed]
- Pavlova, I.; Makarigakis, A.; Depret, T.; Jomelli, V. Global overview of the geological hazard exposure and disaster risk awareness at world heritage sites. J. Cult. Herit. 2017, 28, 151–157. [Google Scholar] [CrossRef]
- Chen, L.; Ma, P.; Yu, C.; Zheng, Y.; Zhu, Q.; Ding, Y. Landslide susceptibility assessment in multiple urban slope settings with a landslide inventory augmented by InSAR techniques. Eng. Geol. 2023, 327, 107342. [Google Scholar] [CrossRef]
- Wang, X.; Liu, H.; Sun, J. A new approach for identification of potential rockfall source areas controlled by rock mass strength at a regional scale. Remote Sens. 2021, 13, 938. [Google Scholar] [CrossRef]
- Su, Q.; Zhang, J.; Zhao, S.; Wang, L.; Liu, J.; Guo, J. Comparative assessment of three nonlinear approaches for landslide susceptibility mapping in a coal mine area. ISPRS Int. J. Geo-Inf. 2017, 6, 228. [Google Scholar] [CrossRef]
- Tian, N.; Lan, H. The indispensable role of resilience in rational landslide risk management for social sustainability. Geogr. Sustain. 2023, 4, 70–83. [Google Scholar] [CrossRef]
- Jena, R.; Pradhan, B.; Beydoun, G.; Sofyan, H.; Affan, M. Integrated model for earthquake risk assessment using neural network and analytic hierarchy process: Aceh province, Indonesia. Geosci. Front. 2020, 11, 613–634. [Google Scholar] [CrossRef]
- Wang, Z.; Zhang, T.; Wang, L.; Tang, Z. The integrated assessment system of eco-geological environmental carrying capacity for Dujiangyan-Wenchaun highway. Sci. Surv. Mapp. 2016, 41, 77–81. [Google Scholar] [CrossRef]
- Jia, L.; Wang, J.; Gao, S.; Fang, L.; Wang, D. Landslide risk evaluation method of open-pit mine based on numerical simulation of large deformation of landslide. Sci. Rep. 2023, 13, 15410. [Google Scholar] [CrossRef] [PubMed]
- Yu, C.; Chen, J. Application of a GIS-based slope unit method for landslide susceptibility mapping in Helong City: Comparative assessment of ICM, AHP, and RF model. Symmetry 2020, 12, 1848. [Google Scholar] [CrossRef]
- Sharma, M.; Upadhyay, R.K.; Tripathi, G.; Kishore, N.; Shakya, A.; Meraj, G.; Kanga, S.; Singh, S.K.; Kumar, P.; Johnson, B.A. Assessing landslide susceptibility along India’s National Highway 58: A comprehensive approach integrating remote sensing, GIS, and logistic regression analysis. Conservation 2023, 3, 444–459. [Google Scholar] [CrossRef]
- Ali, Z.; Dahri, N.; Vanclooster, M.; Mehmandoostkotlar, A.; Labbaci, A.; Ben Zaied, M.; Ouessar, M. Hybrid Fuzzy AHP and Frequency Ratio Methods for Assessing Flood Susceptibility in Bayech Basin, Southwestern Tunisia. Sustainability 2023, 15, 15422. [Google Scholar] [CrossRef]
- Chang, M.; Dou, X.; Su, F.; Yu, B. Remote sensing and optimized neural networks for landslide risk assessment: Paving the way for mitigating Afghanistan landslide damage. Ecol. Indic. 2023, 156, 111179. [Google Scholar] [CrossRef]
- Guo, Z.; Guo, F.; Zhang, Y.; He, J.; Li, G.; Yang, Y.; Zhang, X. A python system for regional landslide susceptibility assessment by integrating machine learning models and its application. Heliyon 2023, 9, e21542. [Google Scholar] [CrossRef] [PubMed]
- Lu, J.; Ren, C.; Yue, W.; Zhou, Y.; Xue, X.; Liu, Y.; Ding, C. Investigation of landslide susceptibility decision mechanisms in different ensemble-based machine learning models with various types of factor data. Sustainability 2023, 15, 13563. [Google Scholar] [CrossRef]
- Tang, H.; Wang, C.; An, S.; Wang, Q.; Jiang, C. A Novel Heterogeneous Ensemble Framework Based on Machine Learning Models for Shallow Landslide Susceptibility Mapping. Remote Sens. 2023, 15, 4159. [Google Scholar] [CrossRef]
- Zhao, Z.; Xu, Z.; Hu, C.; Wang, K.; Ding, X. Geographically weighted neural network considering spatial heterogeneity for landslide susceptibility mapping: A case study of Yichang City, China. Catena 2024, 234, 107590. [Google Scholar] [CrossRef]
- Liao, W.; Li, L.; Wu, Y.J.; Shi, Z.H. Land use change and eco-environmental vulnerability evaluation in the Danjiangkou Reservoir Area. J. Nat. Resour. 2011, 26, 1879–1889. [Google Scholar]
- Tan, Y.; Guo, D.; Bai, B. Geological hazard risk assessment based on information quantity model in Fuling District, Chongqing City. China. J. Geo-Inf. Sci. 2015, 17, 1554–1562. [Google Scholar]
- Ruan, Y.; Huo, R.; Chen, J.; Liu, W.; Zhou, X.; Wang, T.; Hou, M.; Huang, W. Assessing the Susceptibility of Landslides in the Tuoding Section of the Upper Reaches of the Jinsha River, China, Using a Combination of Information Quantity Modeling and GIS. Water 2023, 15, 3685. [Google Scholar] [CrossRef]
- Jin, J.L.; Cui, Y.L.; Xu, C.; Zheng, J.; Miao, H.B. Application of logistic regression model for hazard assessment of landslides caused by the 2012 Yiliang Ms 5.7 earthquake in Yunnan Province, China. J. Mt. Sci. 2023, 20, 657–669. [Google Scholar] [CrossRef]
- Yang, H.; Wu, Q.; Dong, J.; Xie, F.; Zhang, Q. Landslide risk mapping using the weight-of-evidence method in the datong mining area, qinghai province. Sustainability 2023, 15, 11330. [Google Scholar] [CrossRef]
- Zhang, Y.; Deng, L.; Han, Y.; Sun, Y.; Zang, Y.; Zhou, M. Landslide hazard assessment in highway areas of Guangxi using remote sensing data and a pre-trained XGBoost model. Remote Sens. 2023, 15, 3350. [Google Scholar] [CrossRef]
- Chaoyong, S.; Shaoqi, Z.; Xuling, L.; Yu, Z.; Hui, L. Using DInSAR to inventory landslide geological disaster in Bijie, Guizhou, China. Front. Earth Sci. 2023, 10, 1024710. [Google Scholar] [CrossRef]
- Chen, L.; Zhao, C.; Chen, H.; Kang, Y.; Li, B.; Liu, X. The Detection and Control Factor Analysis of Active Landslides in Guizhou Province, China, Using Sentinel-1 SAR Imagery. Remote Sens. 2023, 15, 5468. [Google Scholar] [CrossRef]
- Zhang, Y.; Ayyub, B.M.; Gong, W.; Tang, H. Risk assessment of roadway networks exposed to landslides in mountainous regions—A case study in Fengjie County, China. Landslides 2023, 20, 1419–1431. [Google Scholar] [CrossRef]
- Lin, J.; Chen, W.; Qi, X.; Hou, H. Risk assessment and its influencing factors analysis of geological hazards in typical mountain environment. J. Clean. Prod. 2021, 309, 127077. [Google Scholar] [CrossRef]
- Liu, K.; Wang, M.; Zhou, T. Increasing costs to Chinese railway infrastructure by extreme precipitation in a warmer world. Transp. Res. Part D Transp. Environ. 2021, 93, 102797. [Google Scholar] [CrossRef]
- Wang, Y.; Wen, H.; Sun, D.; Li, Y. Quantitative assessment of landslide risk based on susceptibility mapping using random forest and geodetector. Remote Sens. 2021, 13, 2625. [Google Scholar] [CrossRef]
- Crawford, M.M.; Dortch, J.M.; Koch, H.J.; Zhu, Y.; Haneberg, W.C.; Wang, Z.; Bryson, L.S. Landslide Risk Assessment in Eastern Kentucky, USA: Developing a Regional Scale, Limited Resource Approach. Remote Sens. 2022, 14, 6246. [Google Scholar] [CrossRef]
- Eitvandi, N.; Sarikhani, R.; Derikvand, S. Landslide susceptibility mapping by integrating analytical hierarchy process, frequency ratio, and fuzzy gamma operator models, case study: North of Lorestan Province, Iran. Environ. Monit. Assess. 2022, 194, 600. [Google Scholar] [CrossRef] [PubMed]
- Hader, P.R.P.; Reis, F.A.G.V.; Peixoto, A.S.P. Landslide risk assessment considering socionatural factors: Methodology and application to Cubatão municipality, São Paulo, Brazil. Nat. Hazards 2022, 110, 1273–1304. [Google Scholar] [CrossRef]
- Liu, Z.; Sun, L.; Zhang, Y.; Yu, Z. Landslide risk evaluation based on slope unit: A case on the Western Hubei area, China. Arab. J. Geosci. 2022, 15, 1072. [Google Scholar] [CrossRef]
- Wu, W.; Guo, S.; Shao, Z. Landslide risk evaluation and its causative factors in typical mountain environment of China: A case study of Yunfu City. Ecol. Indic. 2023, 154, 110821. [Google Scholar] [CrossRef]
- Liu, Q.; Zhang, B.; Tang, A. Landslide risk of regional roads: Consider the road mileage of expected losses. Transp. Res. Part D Transp. Environ. 2023, 120, 103771. [Google Scholar] [CrossRef]
- Lv, J.; Rui, Z.; Age, S.; Ruikai, H.; Xu, H.; Renzhe, W.; Xin, B.; Guoxiang, L. Exploring the spatial patterns of landslide susceptibility assessment using interpretable Shapley method: Mechanisms of landslide formation in the Sichuan-Tibet region. J. Environ. Manag. 2024, 366, 121921. [Google Scholar] [CrossRef] [PubMed]
- Meng, S.; Shi, Z.; Li, G.; Peng, M.; Liu, L.; Zheng, H.; Zhou, C. A novel deep learning framework for landslide susceptibility assessment using improved deep belief networks with the intelligent optimization algorithm. Comput. Geotech. 2024, 167, 106106. [Google Scholar] [CrossRef]
- Zhang, A.; Zhao, X.; Zhao, X.; Zheng, X.; Zeng, M.; Huang, X.; Wu, P.; Jiang, T.; Wang, S.; He, J. Comparative study of different machine learning models in landslide susceptibility assessment: A case study of Conghua District, Guangzhou, China. China Geol. 2024, 7, 104–115. [Google Scholar]
- Zhang, Q.; He, Y.; Zhang, L.; Lu, J.; Gao, B.; Yang, W.; Chen, H.; Zhang, Y. A landslide susceptibility assessment method considering the similarity of geographic environments based on graph neural network. Gondwana Res. 2024, 132, 323–342. [Google Scholar] [CrossRef]
- Sholichin, M.; Othman, F.; Prayogo, T.B.; Rahardjo, S.S.P. Assessing Landslide susceptibility and formulating adaptation strategies in the Konto Watershed, East Java, Indonesia. Int. J. Disaster Risk Reduct. 2024, 113, 104797. [Google Scholar] [CrossRef]
- Qiu, H.; Xu, Y.; Tang, B.; Su, L.; Li, Y.; Yang, D.; Ullah, M. Interpretable Landslide Susceptibility Evaluation Based on Model Optimization. Land 2024, 13, 639. [Google Scholar] [CrossRef]
- Ietto, F.; Parise, M.; Ponte, M.; Calcaterra, D. Geotechnical characterization and landslides in the weathered granitoids of Calabria (southern Italy). Rend. Online Soc. Geol. Ital. 2012, 21, 551–552. [Google Scholar]
- Ietto, F.; Perri, F.; Cella, F. Geotechnical and Landslide Aspects in Weathered Granitoid Rock Masses (Serre Massif, Southern Calabria, Italy). Catena 2016, 145, 301–315. [Google Scholar] [CrossRef]
- Liu, Y.; Zhang, W.; Zhang, Z.; Xu, Q.; Li, W. Risk factor detection and landslide susceptibility mapping using Geo-Detector and Random Forest Models: The 2018 Hokkaido eastern Iburi earthquake. Remote Sens. 2021, 13, 1157. [Google Scholar] [CrossRef]
- Yi, X.; Xiao, T.; Yuan, L.; Huan, H.; Wen, A.B. Social vulnerability assessment of landslide disaster based on improved TOPSIS method: Case study of eleven small towns in China. Ecol. Indic. 2022, 143, 109316. [Google Scholar] [CrossRef]
- Ying, L.; Shiyu, G.; Zhiru, Z.; Meijiao, L.; Caizhi, S.; Yiqin, Z. Vulnerability Evaluation of Rainstorm Disaster Based on ESA Conceptual Framework: A Case Study of Liaoning Province, China. Sustain. Cities Soc. 2020, 64, 102540. [Google Scholar]
- Sun, D.; Wang, J.; Wen, H.; Ding, Y.; Mi, C. Landslide susceptibility mapping (LSM) based on different boosting and hyperparameter optimization algorithms: A case of Wanzhou District, China. J. Rock Mech. Geotech. Eng. 2024, 16, 3221–3232. [Google Scholar] [CrossRef]


| Article | Slope | Elevation | Relief Amplitude | Aspect | NDVI | Lithology | Distance from Fault | RWI |
|---|---|---|---|---|---|---|---|---|
| Lin et al. (2021) [41] | √ | √ | √ | √ | √ | √ | ||
| Liu et al. (2021) [42] | √ | √ | √ | |||||
| Wang et al. (2021) [43] | √ | √ | √ | |||||
| Liu et al. (2022) [13] | √ | √ | √ | √ | √ | |||
| Crawford et al. (2022) [44] | √ | √ | √ | √ | √ | √ | ||
| Eitvandi et al. (2022) [45] | √ | √ | √ | √ | √ | √ | ||
| Hader et al. (2022) [46] | √ | √ | √ | √ | √ | |||
| Liu et al. (2022) [47] | √ | √ | √ | √ | √ | √ | ||
| Chen et al. (2023) [39] | √ | √ | √ | √ | √ | |||
| Wu et al. (2023) [48] | √ | √ | √ | √ | √ | √ | ||
| Liu et al. (2023) [49] | √ | √ | √ | |||||
| Lv et al. (2024) [50] | √ | √ | √ | √ | √ | √ | ||
| Meng et al. (2024) [51] | √ | √ | √ | √ | ||||
| Zhang et al. (2024) [52] | √ | √ | √ | √ | √ | √ | ||
| Zhang et al. (2024) [53] | √ | √ | √ | √ | √ | |||
| This work | √ | √ | √ | √ | √ | √ | √ | √ |
| Value | Description |
|---|---|
| 0.5 | Two factors are of equal importance |
| 0.6 | One factor is slightly more important than the other |
| 0.7 | One factor is significantly more important than the other |
| 0.8 | One factor is much more important than the other |
| 0.9 | One factor is extremely more important than the other |
| 0.1~0.4 | In contrast to comparisons with a value of 0.6~0.9 |
| Factor | Class | Information Value | Factor | Class | Information Value |
|---|---|---|---|---|---|
| Elevation Slope NDVI Relief amplitude Distance from fault | <500 m 500~1000 m 1000~1500 m >1500 m <10° 10–25° 25–40° >40° <0.2 0.2–0.4 0.4–0.6 0.6–0.8 >0.8 <150 m 150~300 m 300~450 m >450 m <1.5 km 1.5–3 km 3–4.5 km >4.5 km | −0.004715 −0.052104 0.011811 0.073626 −0.254924 0.146219 0.266531 −0.094343 0.863558 0.215351 0.196962 −0.127839 −0.455454 −0.419209 0.152283 0.163818 0.267191 0.158946 −0.096210 −0.074668 0.051317 | Lithology Aspect RWI | 1 2 3 4 5 Flat North Northeast East Southeast South Southwest West Northwest <0.2 0.2–0.4 0.4–0.6 0.6–0.8 >0.8 | 0.255183 −0.110352 −0.004681 0.1611609 −0.058467 0 0.012289 −0.034320 −0.036404 −0.002801 0.078364 −0.018094 −0.035378 0.045654 −0.11986 −0.065318 −0.28685 0.60475 0.35773 |
| Factors | Parameters |
|---|---|
| Elevation | 0.237 |
| Slope | 0.458 |
| NDVI | −2.125 |
| Aspect | 1.154 |
| Distance from fault | −2.621 |
| Relief amplitude | 0.375 |
| Lithology | −1.848 |
| RWI | 2.293 |
| α (constant term) | 1.974 |
| Index | Annual Average Rainfall | Daily Maximum Rainfall | Weight |
|---|---|---|---|
| Annual average rainfall | 0.5 | 0.3 | 0.4 |
| Daily maximum rainfall | 0.7 | 0.5 | 0.6 |
| Consistency | I (A, W) = 0.075 < 0.1 | ||
| Index | Population | GDP | Land Use Type | Weight |
|---|---|---|---|---|
| Population | 0.5 | 0.4 | 0.8 | 0.40 |
| GDP | 0.6 | 0.5 | 0.7 | 0.43 |
| Land use types | 0.2 | 0.3 | 0.5 | 0.17 |
| Consistency | I (A, W) = 0.044 < 0.1 | |||
| Rockfall Risk | Percentage |
|---|---|
| Low | 18.87% |
| Medium | 28.09% |
| High | 41.19% |
| Very high | 11.84% |
| District | Rockfall Number | Economic Loss (Thousands) |
|---|---|---|
| LPS | 5 | 29,000 |
| BJ | 2 | 21,100 |
| QXN | 3 | 4902 |
| TR | 2 | 2600 |
| GR | 2 | 1700 |
| QN | 1 | 1100 |
| AS | 1 | 900 |
| ZY | 3 | 720 |
| QDN | 2 | 400 |
Disclaimer/Publisher’s Note: The statements, opinions and data contained in all publications are solely those of the individual author(s) and contributor(s) and not of MDPI and/or the editor(s). MDPI and/or the editor(s) disclaim responsibility for any injury to people or property resulting from any ideas, methods, instructions or products referred to in the content. |
© 2025 by the authors. Licensee MDPI, Basel, Switzerland. This article is an open access article distributed under the terms and conditions of the Creative Commons Attribution (CC BY) license (https://creativecommons.org/licenses/by/4.0/).
Share and Cite
Yang, J.; Xu, Z.; Gong, M.; Zhou, S.; Huang, M. An Integrated Risk Assessment of Rockfalls Along Highway Networks in Mountainous Regions: The Case of Guizhou, China. Appl. Sci. 2025, 15, 8212. https://doi.org/10.3390/app15158212
Yang J, Xu Z, Gong M, Zhou S, Huang M. An Integrated Risk Assessment of Rockfalls Along Highway Networks in Mountainous Regions: The Case of Guizhou, China. Applied Sciences. 2025; 15(15):8212. https://doi.org/10.3390/app15158212
Chicago/Turabian StyleYang, Jinchen, Zhiwen Xu, Mei Gong, Suhua Zhou, and Minghua Huang. 2025. "An Integrated Risk Assessment of Rockfalls Along Highway Networks in Mountainous Regions: The Case of Guizhou, China" Applied Sciences 15, no. 15: 8212. https://doi.org/10.3390/app15158212
APA StyleYang, J., Xu, Z., Gong, M., Zhou, S., & Huang, M. (2025). An Integrated Risk Assessment of Rockfalls Along Highway Networks in Mountainous Regions: The Case of Guizhou, China. Applied Sciences, 15(15), 8212. https://doi.org/10.3390/app15158212