Article

Research on Deformation Mechanisms and Control Technology for Floor Heave in Deep Dynamic Pressure Roadway

1
State Key Laboratory for Tunnel Engineering, Shandong University, Jinan 250061, China
2
School of Civil Engineering, Shandong University, Jinan 250061, China
3
State Key Laboratory for Tunnel Engineering, China University of Mining and Technology—Beijing, Beijing 100083, China
*
Authors to whom correspondence should be addressed.
Appl. Sci. 2025, 15(15), 8125; https://doi.org/10.3390/app15158125
Submission received: 9 June 2025 / Revised: 11 July 2025 / Accepted: 15 July 2025 / Published: 22 July 2025

Abstract

Under deep, high-intensity mining conditions, a high mineral pressure develops at the working face, which can easily cause floor heave deformation of the roadway. In this paper, with the geological conditions of Buertai coal mine as the background, through on-site monitoring and numerical simulation, the mechanism of strong dynamic pressure roadway floor heave is clarified and a cooperative control method for roadway floor heave deformation is proposed. The main conclusions are as follows: (1) The overall strength of the floor of this strong dynamic pressure roadway is low, which can easily cause roadway floor heave, and on-site multivariate monitoring of the mine pressure is carried out, which clarifies the evolution law of the mine pressure of the mining roadway and along-the-airway roadway. (2) Combined with FLAC3D numerical simulation software, we analyze the influence of coal seam depth and floor lithology on the stability of the roadway floor and find that both have a significant influence on the stability of the roadway. Under the condition of high-intensity mining, the floor will deteriorate gradually, forming a wide range of floor heave areas. (3) Based on the deformation and damage mechanism of the roadway floor, a synergistic control method of “roof cutting and pressure relief + floor anchor injection” is proposed and various technical parameters are designed. An optimized design scheme is designed for the control of floor heave in Buertai coal mine.

1. Introduction

Floor heave, as a typical mine pressure manifestation phenomenon that frequently appears, cannot be ignored in coal mine safety mining. It is mainly related to the coupling effects of multiple factors, such as the mechanical properties of surrounding rock, mining disturbance intensity, engineering geological conditions, and so on, which brings great trouble to the construction and production of underground mines [1,2,3].
In the study of floor heave deformation mechanisms, the study of Ortongot [4] showed that floor heave deformation occurs earlier than roof deformation when there is horizontal stress in the roadway. D.J. Rockway [5] believed that the nature of the roadway surrounding rock and physico-mechanical properties, etc., play an important role in causing floor heave; Chugh [6], Afrouz [7], Tsang [8], Li [9], and Zhu [10] analyzed the various factors that cause floor heave in roadways, such as the roadway surrounding rock, rock structure, hydrogeological conditions, ground stress, and depth of the coal seam, etc. Guo [11] used numerical simulation to propose the expansion process and floor bulging mechanism of gradual fracture for research; Yang [12] analyzed the destruction characteristics of coal bodies in the side walls of deep mining tunnels based on the mechanism of rockburst and the theory of stress gradient. Liu [13] proposed that the tailing plate of the coal mining machine will be affected by mining stress during the mining process, which results in floor heave deformation. He [14] suggested that the main reason for floor heave is the low support strength and strong mining pressure impacting the weak rock layer of the floor, and Wang [15] suggested that the combination of unloading expansion and macroscopic damage is the cause of floor heave. Xu [16] utilized numerical simulation and geology to systematically describe floor heave; Gong [17] concluded that shear misalignment and extrusion are the main causes of floor heave, and the lithology of the surrounding rock and the depth of the coal seam also play important roles. Xiao [18] confirmed that the triangular relationship of rock strength weakening, stress field reconstruction, and support failure is the fundamental cause of undermining; Zheng [19] revealed the gob-side entry retaining deformation mechanisms with roof-cutting pressure relief. Liu [20] proposed the principle of high-level stress tunnel rock mass stability control, designed an optimization scheme, and verified the applicability of this optimization scheme.
In the study of floor heave deformation control, many scholars have carried out research on floor heave [21,22]. Kyle [23] controlled floor heave by cutting off stress transfer through the blasting decompression method; Wen [24] put forward a synergistic control scheme of “anti-bottom arch + modified support” as the core to inhibit the development of floor heave. Gao [25] innovatively put forward a synergistic support system of “footing–bottom angle anchorage coupling + concrete”. Gao [25] innovatively proposed a synergistic support system of “gang footing–bottom corner anchorage coupling + concrete reinforcement” to control the deformation of floor heave; He [26] proposed a three-dimensional coupled support system, which implements prestressing anchorage on the roof, restrains the perimeter rock of the two gangs, implements shear reinforcement in the bottom corner area, and forms a composite load-bearing arch structure through the injection of grout in the rigid anchor bolts. Floor heave control is achieved through multi-dimensional structural optimization. Fan [27] studied the bottom drums across more than 20 railway lines and summarized the types, causes, and mechanical models related to this issue. Xue [28] proposed a design method of roof cutting decompression and energy absorption support, which can effectively control the large deformation of peripheral rock in deep tunnels; Shi [29] discussed the deformation and fracture mechanisms of deep mine large-span chamber floor slabs and conducted similarity model tests to verify the reliability of their theoretical analysis. Huang [30] proposed an excavation compensation control method for deep chamber groups with the core of “stress compensation, peripheral rock reinforcement, and excavation and disturbance reduction”, which plays a key role in the control of peripheral rock deformation.
Therefore, this paper takes the Buertai coal mine in China as the research object and aims to study the double influence of high-intensity mining and the breaking of overlying thick and hard key layers, which exerts large dynamic pressure on the two passages in front of the working face and the passages along the empty roadway, where the mine pressure shows intense manifestations and the floor heave of the roadway is serious. The study clarifies the deformation mechanism of the floor heave, summarizes the law, and puts forward control measures which can effectively guarantee the safety and stability of the mine production.

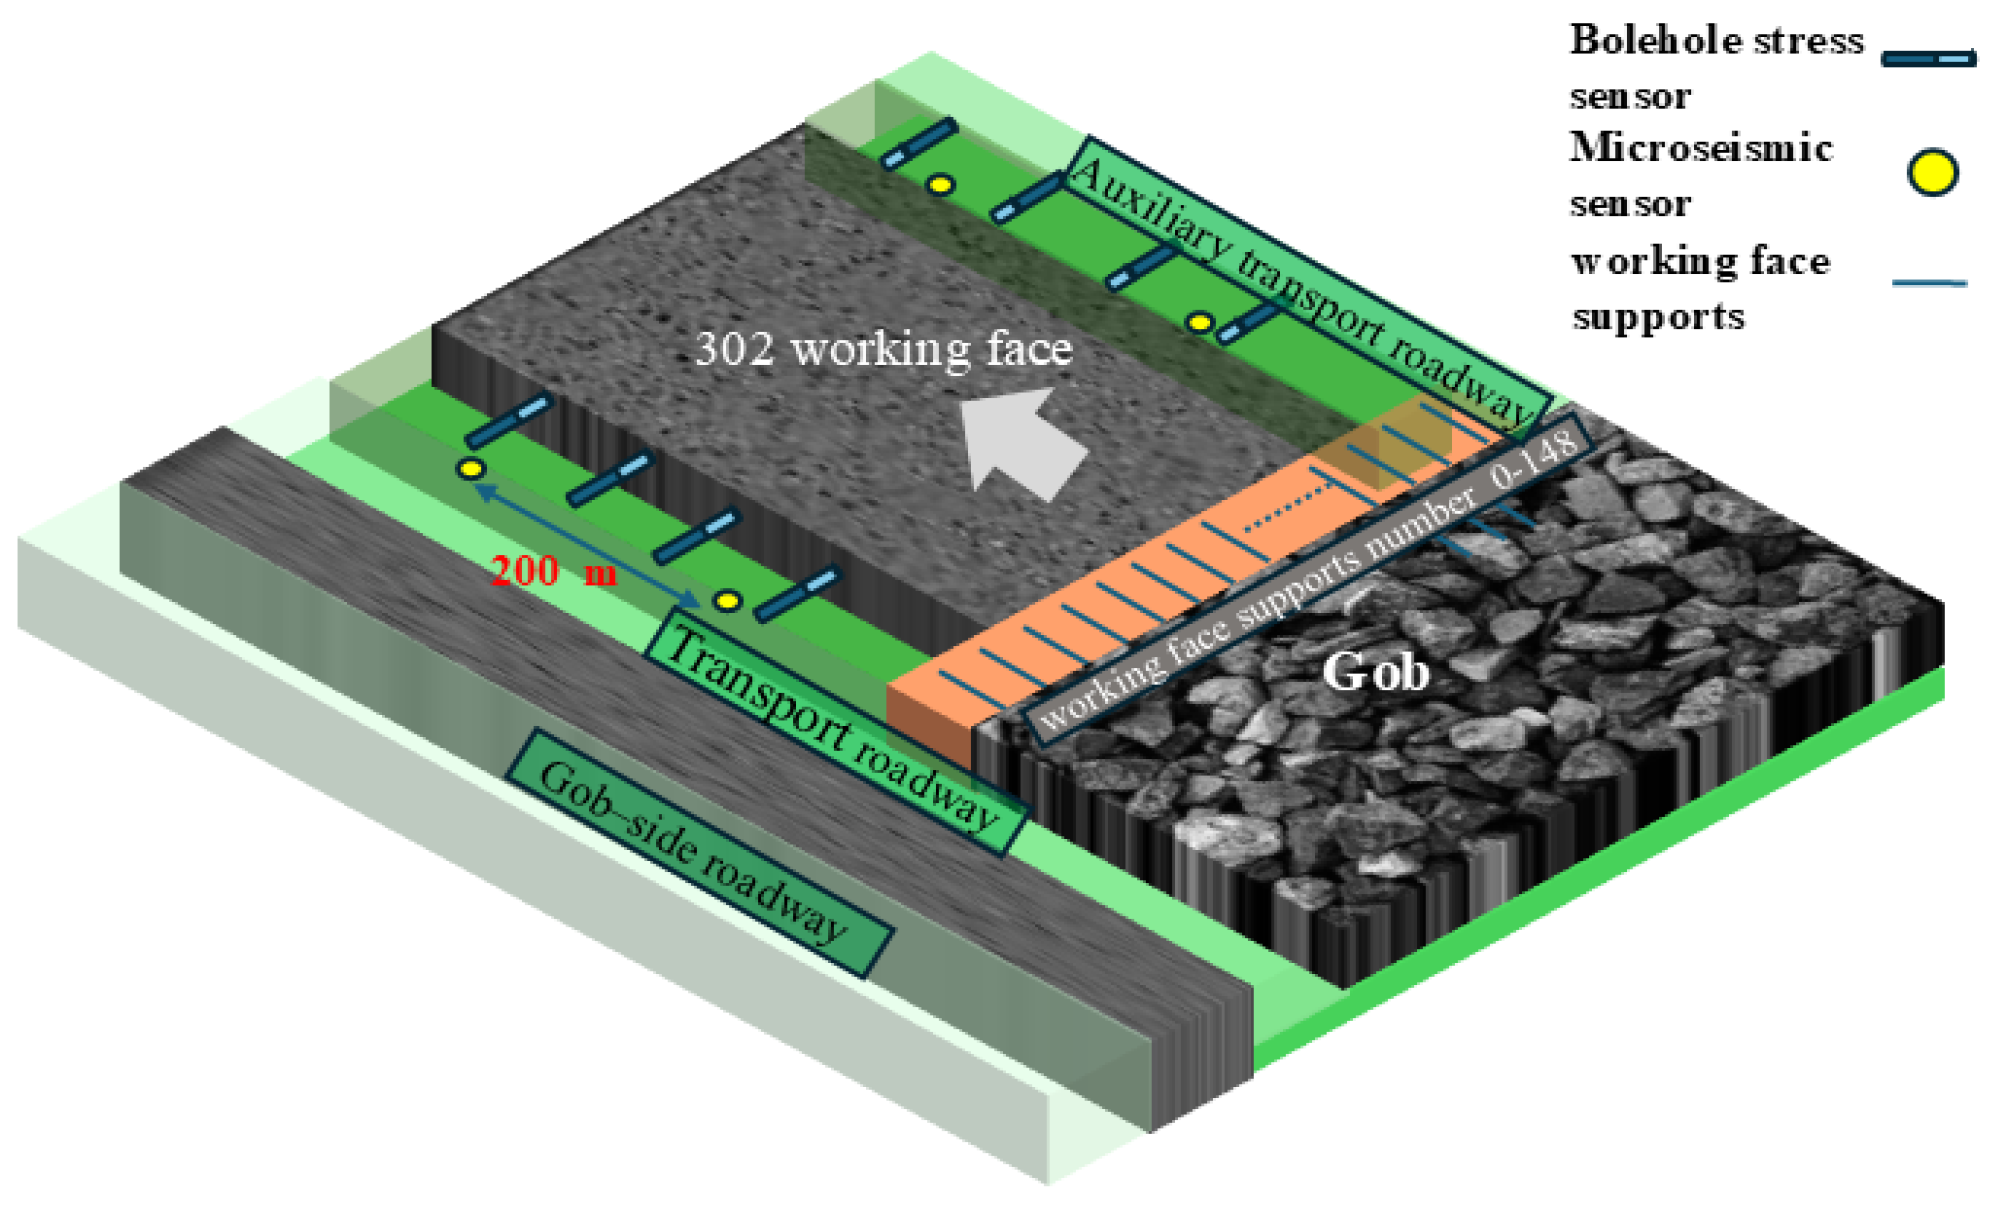
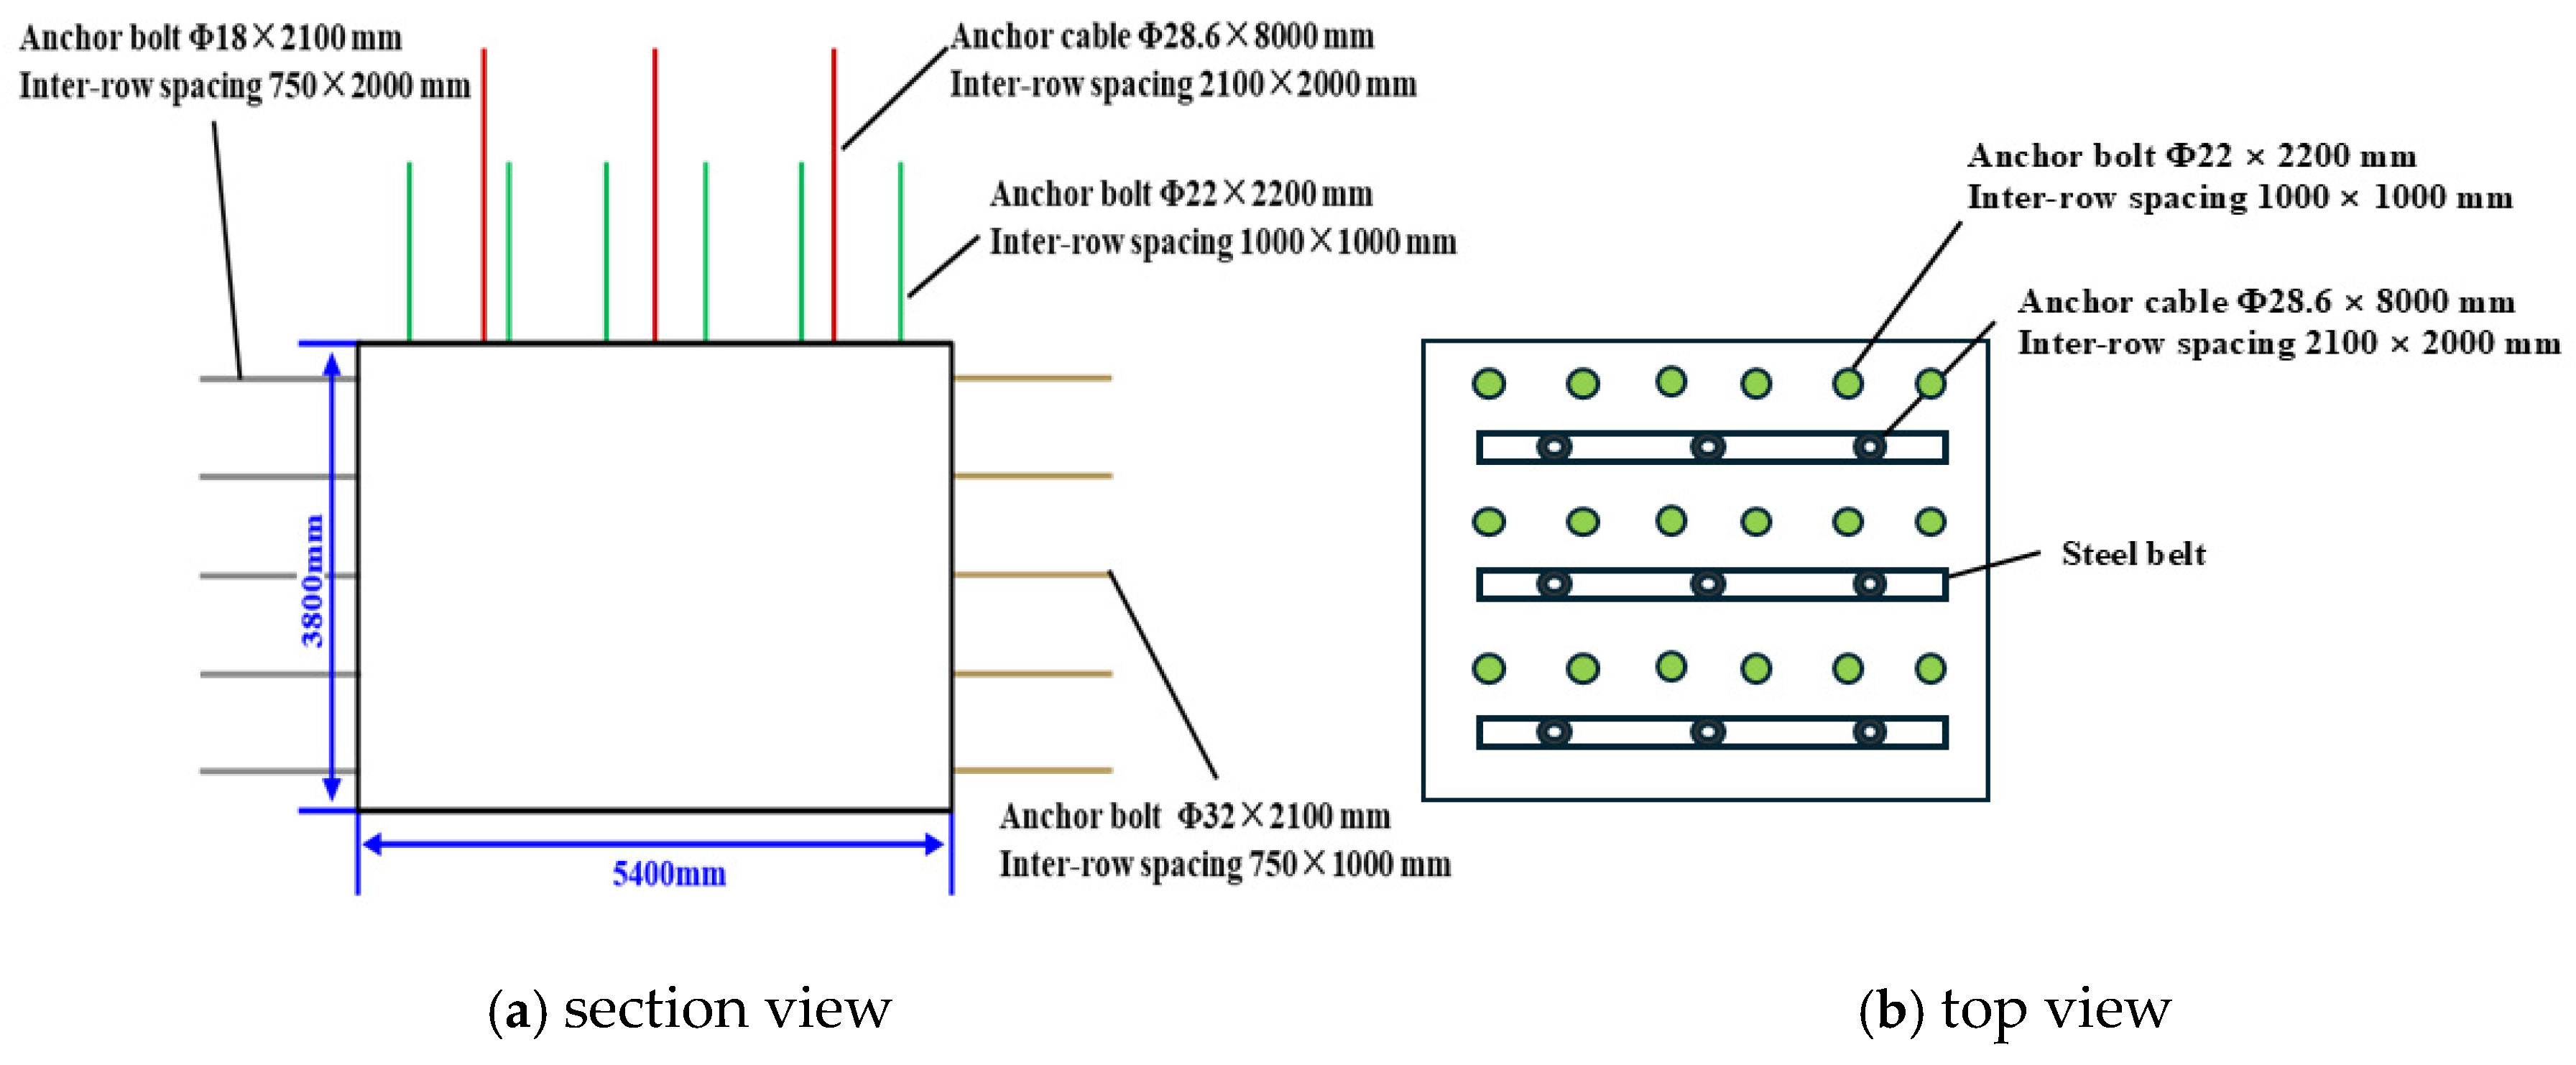
2. Engineering Background

The research object of this paper is the 302 comprehensive working face of Buertai coal mine in China. The length of the working face is 309.6 m, the length of back mining is 4676.6 m, the burial depth is 332.9–428.75 m, with an average of 381.3 m, the angle of inclination is 1–5°, the ratio of mining and releasing is 1:0.32, and the width of the coal pillar between the working faces is 20 m. The northeast is the 301 working face, and the southeast is the 12 upper coal three-panel area. The 302 working face mines the 12 upper coal area, the coal thickness is 2.55–6.27 m, with an average of 4.07 m, the immediate roof is sandy mudstone, the main roof is coarse-grained sandstone, the direct bottom is sandy mudstone, and the old bottom is siltstone, as shown in Figure 1. Four microseismic sensors and several borehole stress sensors are arranged on both sides of the working face in the advancing direction, with spacings of 200 m and 10 m, respectively. The working face advances from the cut-off point, where working face supports numbered from 0 to 148 are installed. The specific layout of the monitoring instruments is shown in Figure 2.
The width × height of the roadway along the working face is 5400 mm × 3600 mm, and the interval between the coal column and the main transportation channel of 302 on the 12 upper coal area is 20 m. The roadway adopts the form of anchor bolt + anchor cable + steel belt + anchor mesh support, and the specific support parameters of the roadway initial support and the sectional dimensions are shown in Figure 3.

3. Research on the Deformation Mechanism of the Floor Heave

3.1. Analysis of On-Site Mine Pressure Monitoring Data

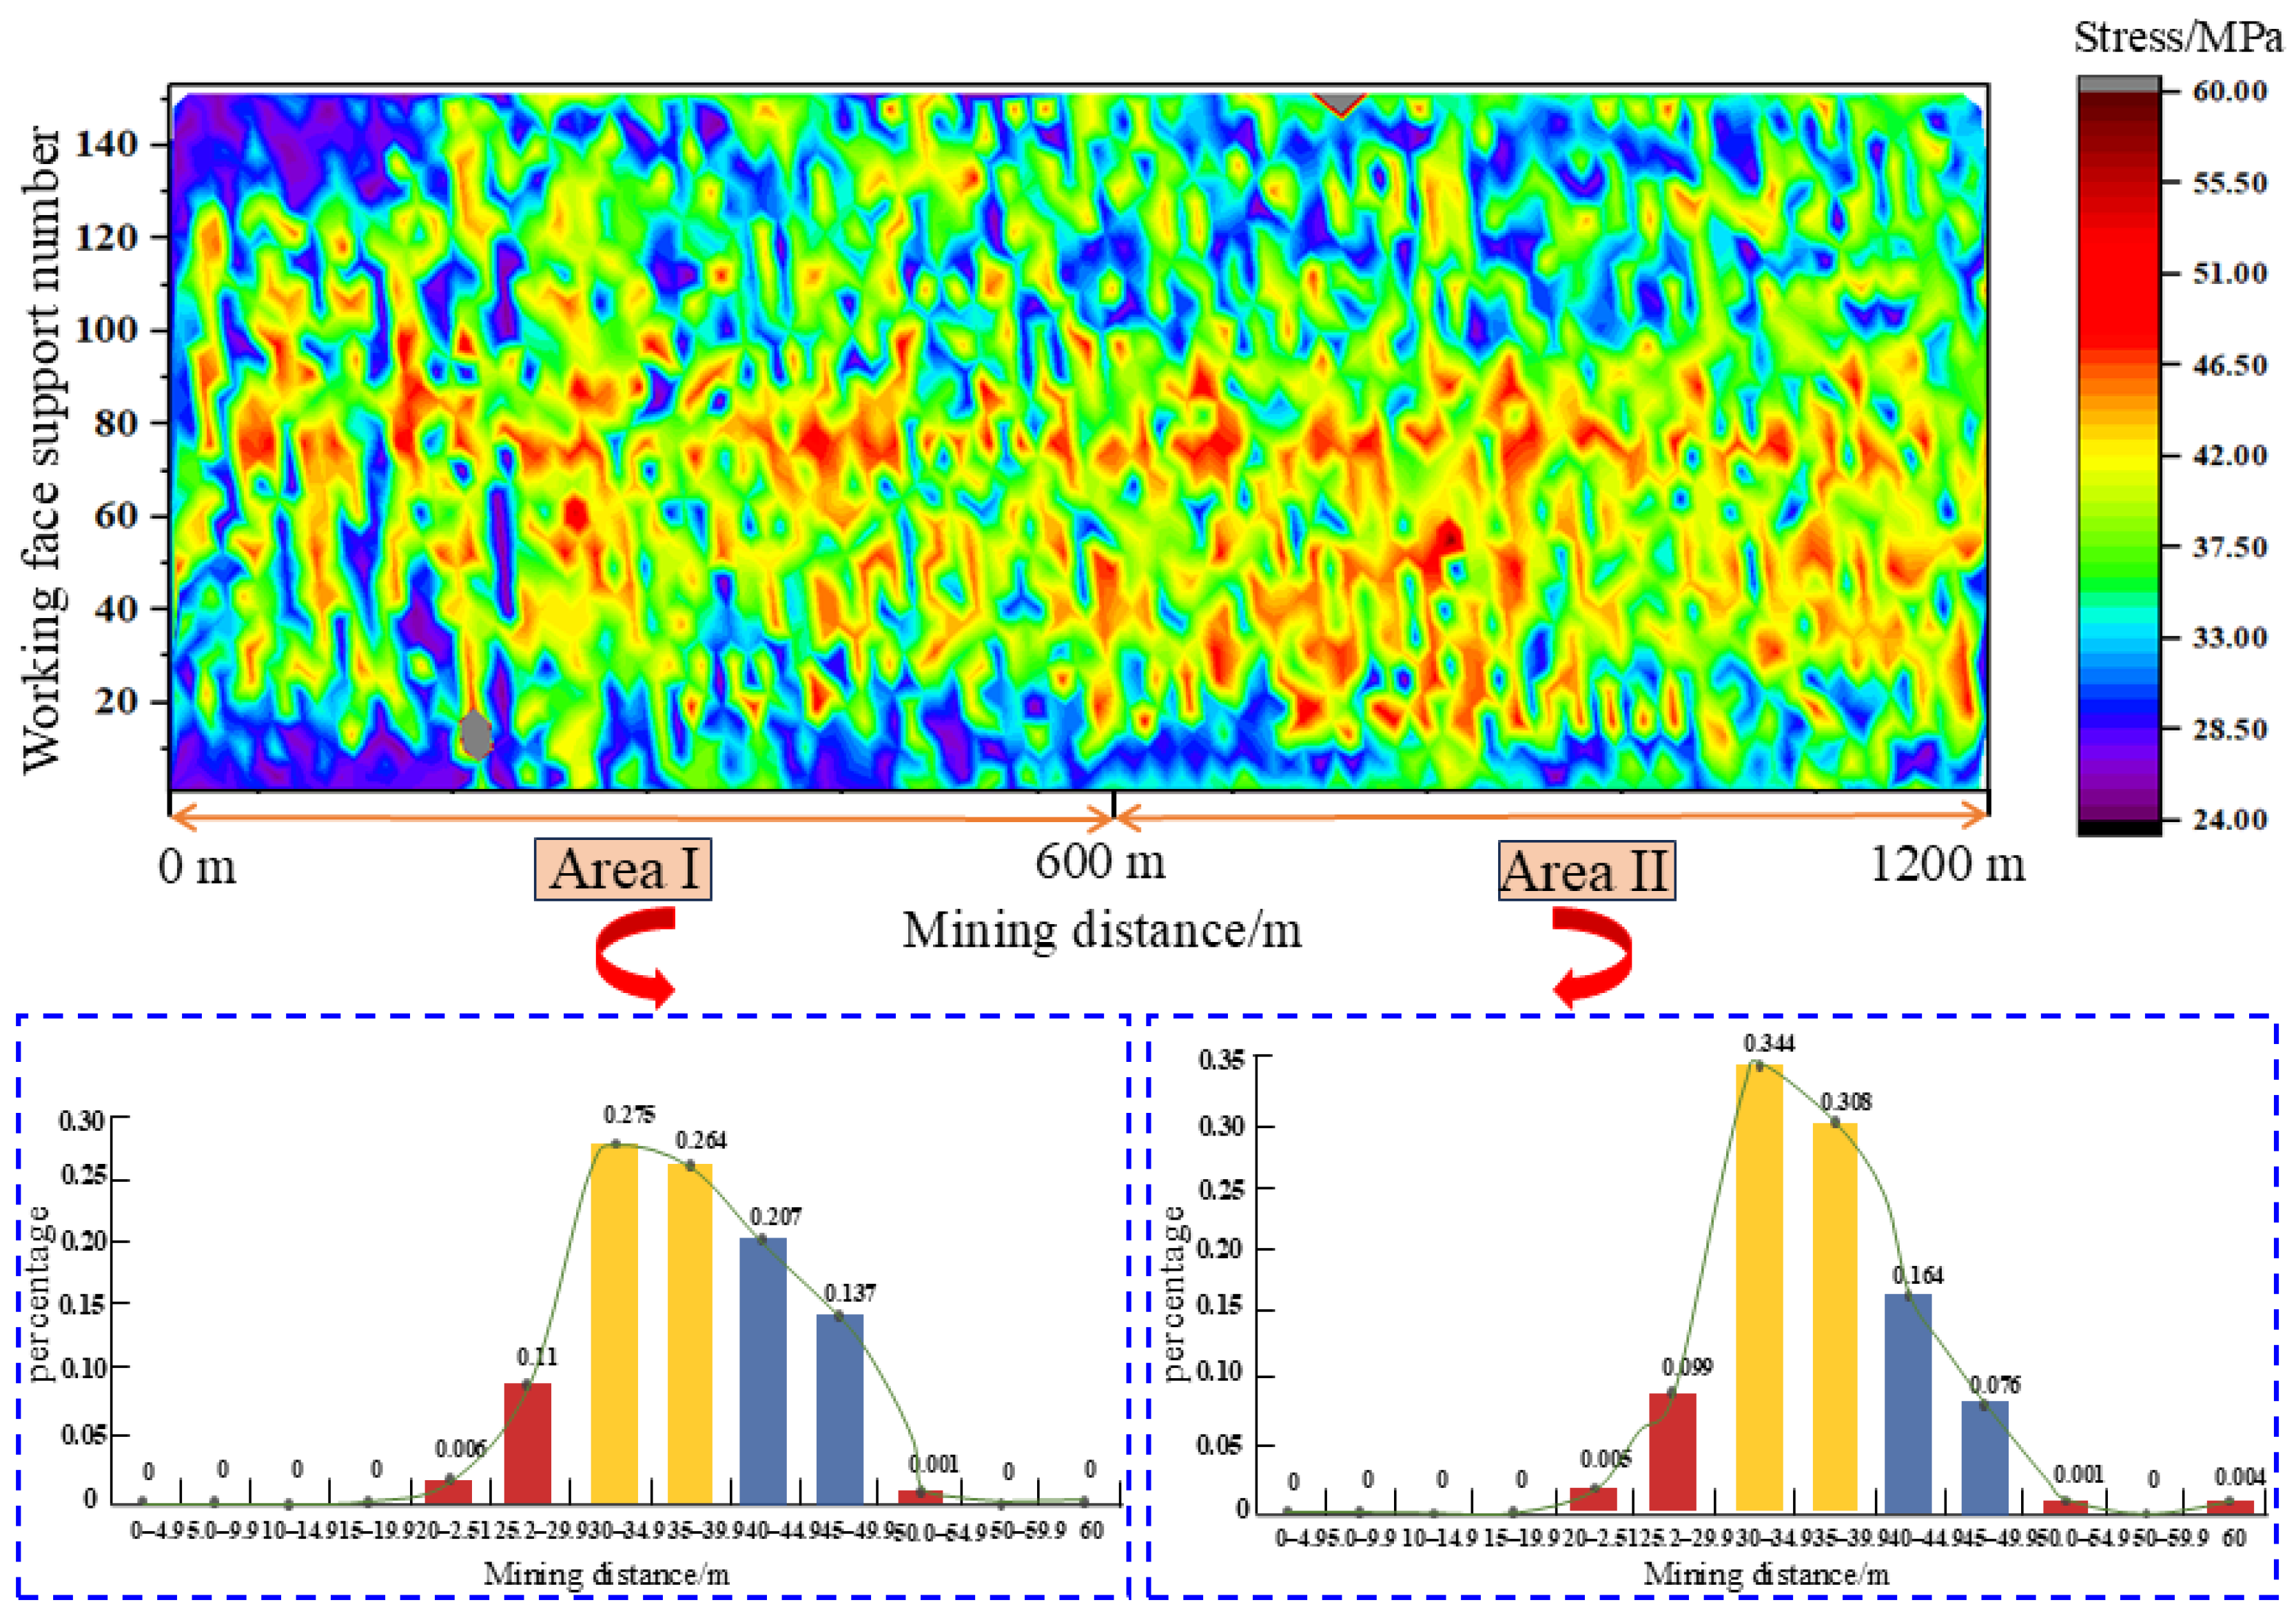
3.1.1. Analysis of Working Face Support Pressure

The changes in working face support pressure and support resistance are shown in Figure 4. The 302 working face adopts a ZFY18000/25/39D type roof coal release support, with support resistance of 18,000 kN and a support height of 2.5–3.9 m. The influence area range of a square (when pushing mining for 300 m) is 40 m before and after the square, where the overlying rock transport is stronger; the closer to the first square position, the stronger the overlying rock transport becomes. In the area affected by a square (when pushing mining for 300 m), when it is 40 m before and after the first square, the overlying rock is transported more intensely; the closer it is to the first square, the stronger the overlying rock is transported. Before the first square, it is mainly manifested as the breakage of shallow rock layers, while after the first square, it gradually develops to the higher rock layers. Approximately 30 m after the first square, the roof activity is most intense, and the support pressure reaches its peak. When the face is pushed to 800 m, the pressure on the coal pillar side supports is significantly higher than that on the solid coal side. In the floor heave area spanning from 650 m to 950 m, the supports on the coal pillar side exhibit a sustained high bearing pressure.
Taking the working face 70# support as an example, the 70# support with the working face back to mining pressure changes is shown in Figure 5. When the main roof of the first coming pressure distance is 36.8–100.5 m, the pressure value of the maximum is 52.3 MPa; when the working face average cycle coming pressure distance is 43.6 m, the pressure value of the maximum is 51.2 MPa. For the first square, there is a maximum pressure value of 47.7 MPa.

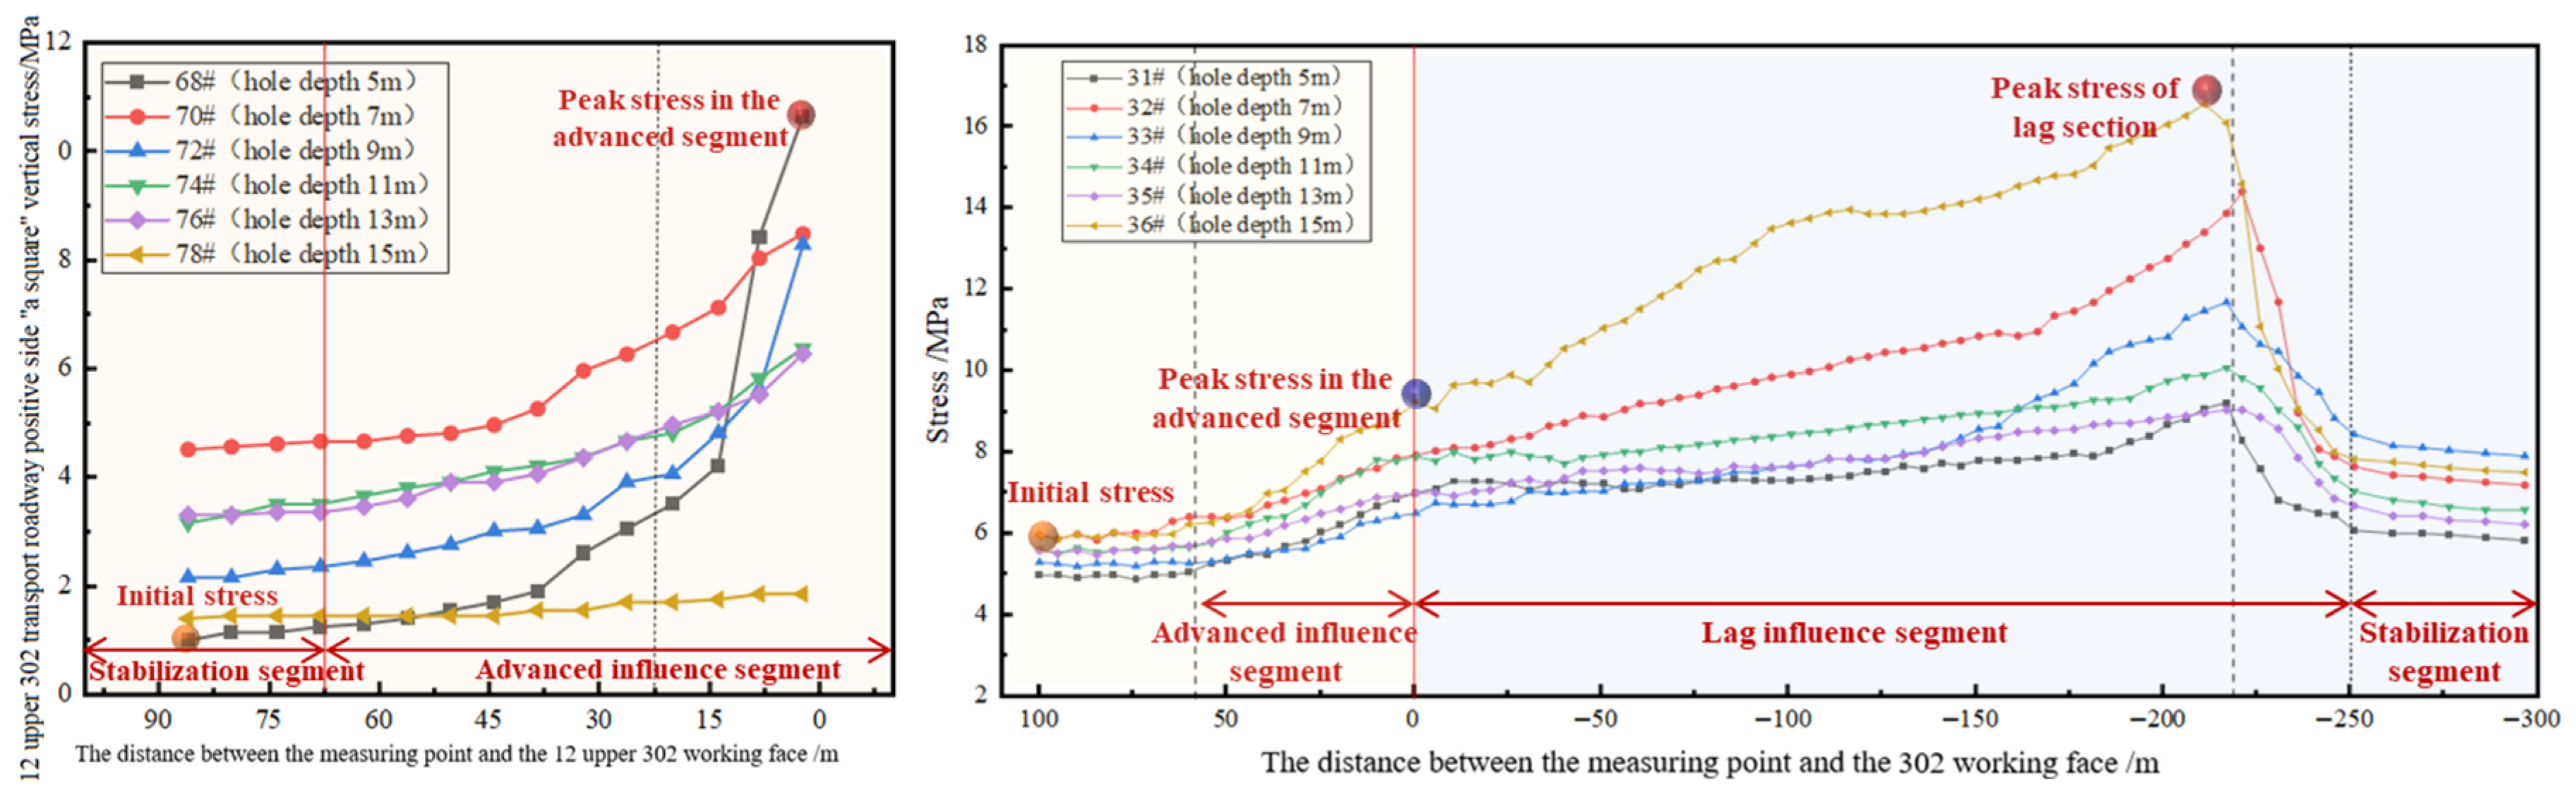
3.1.2. Analysis of Coal Body Support Pressure

The overrun support pressure of the two lanes of the working face and the lateral support pressure along the empty roadway are shown in Figure 6. The mining overrun influence distance is 70 m, the stress in the range of 20–70 m overrun grows slowly, the stress in the range of 0–20 m overrun grows sharply, and the stress in the range of 0–5 m in front of the coal wall of the working face reaches the peak. The maximal stress concentration coefficient is 2.4, and the lateral overrun influence distance of the mining along the empty roadway is 55 m. Stress peaks in the range of about 220 m behind the lagging face, and the maximal stress concentration coefficient tends to be 3.6. In the range of 0–5 m in front of the coal wall, the stress peaks and the maximum stress concentration coefficient is 2.4. The influence distance of the mining lateral forwarding along the empty roadway is 55 m, the stress peaks at the lagging face of 220 m, and the maximum stress concentration coefficient is 3.6.

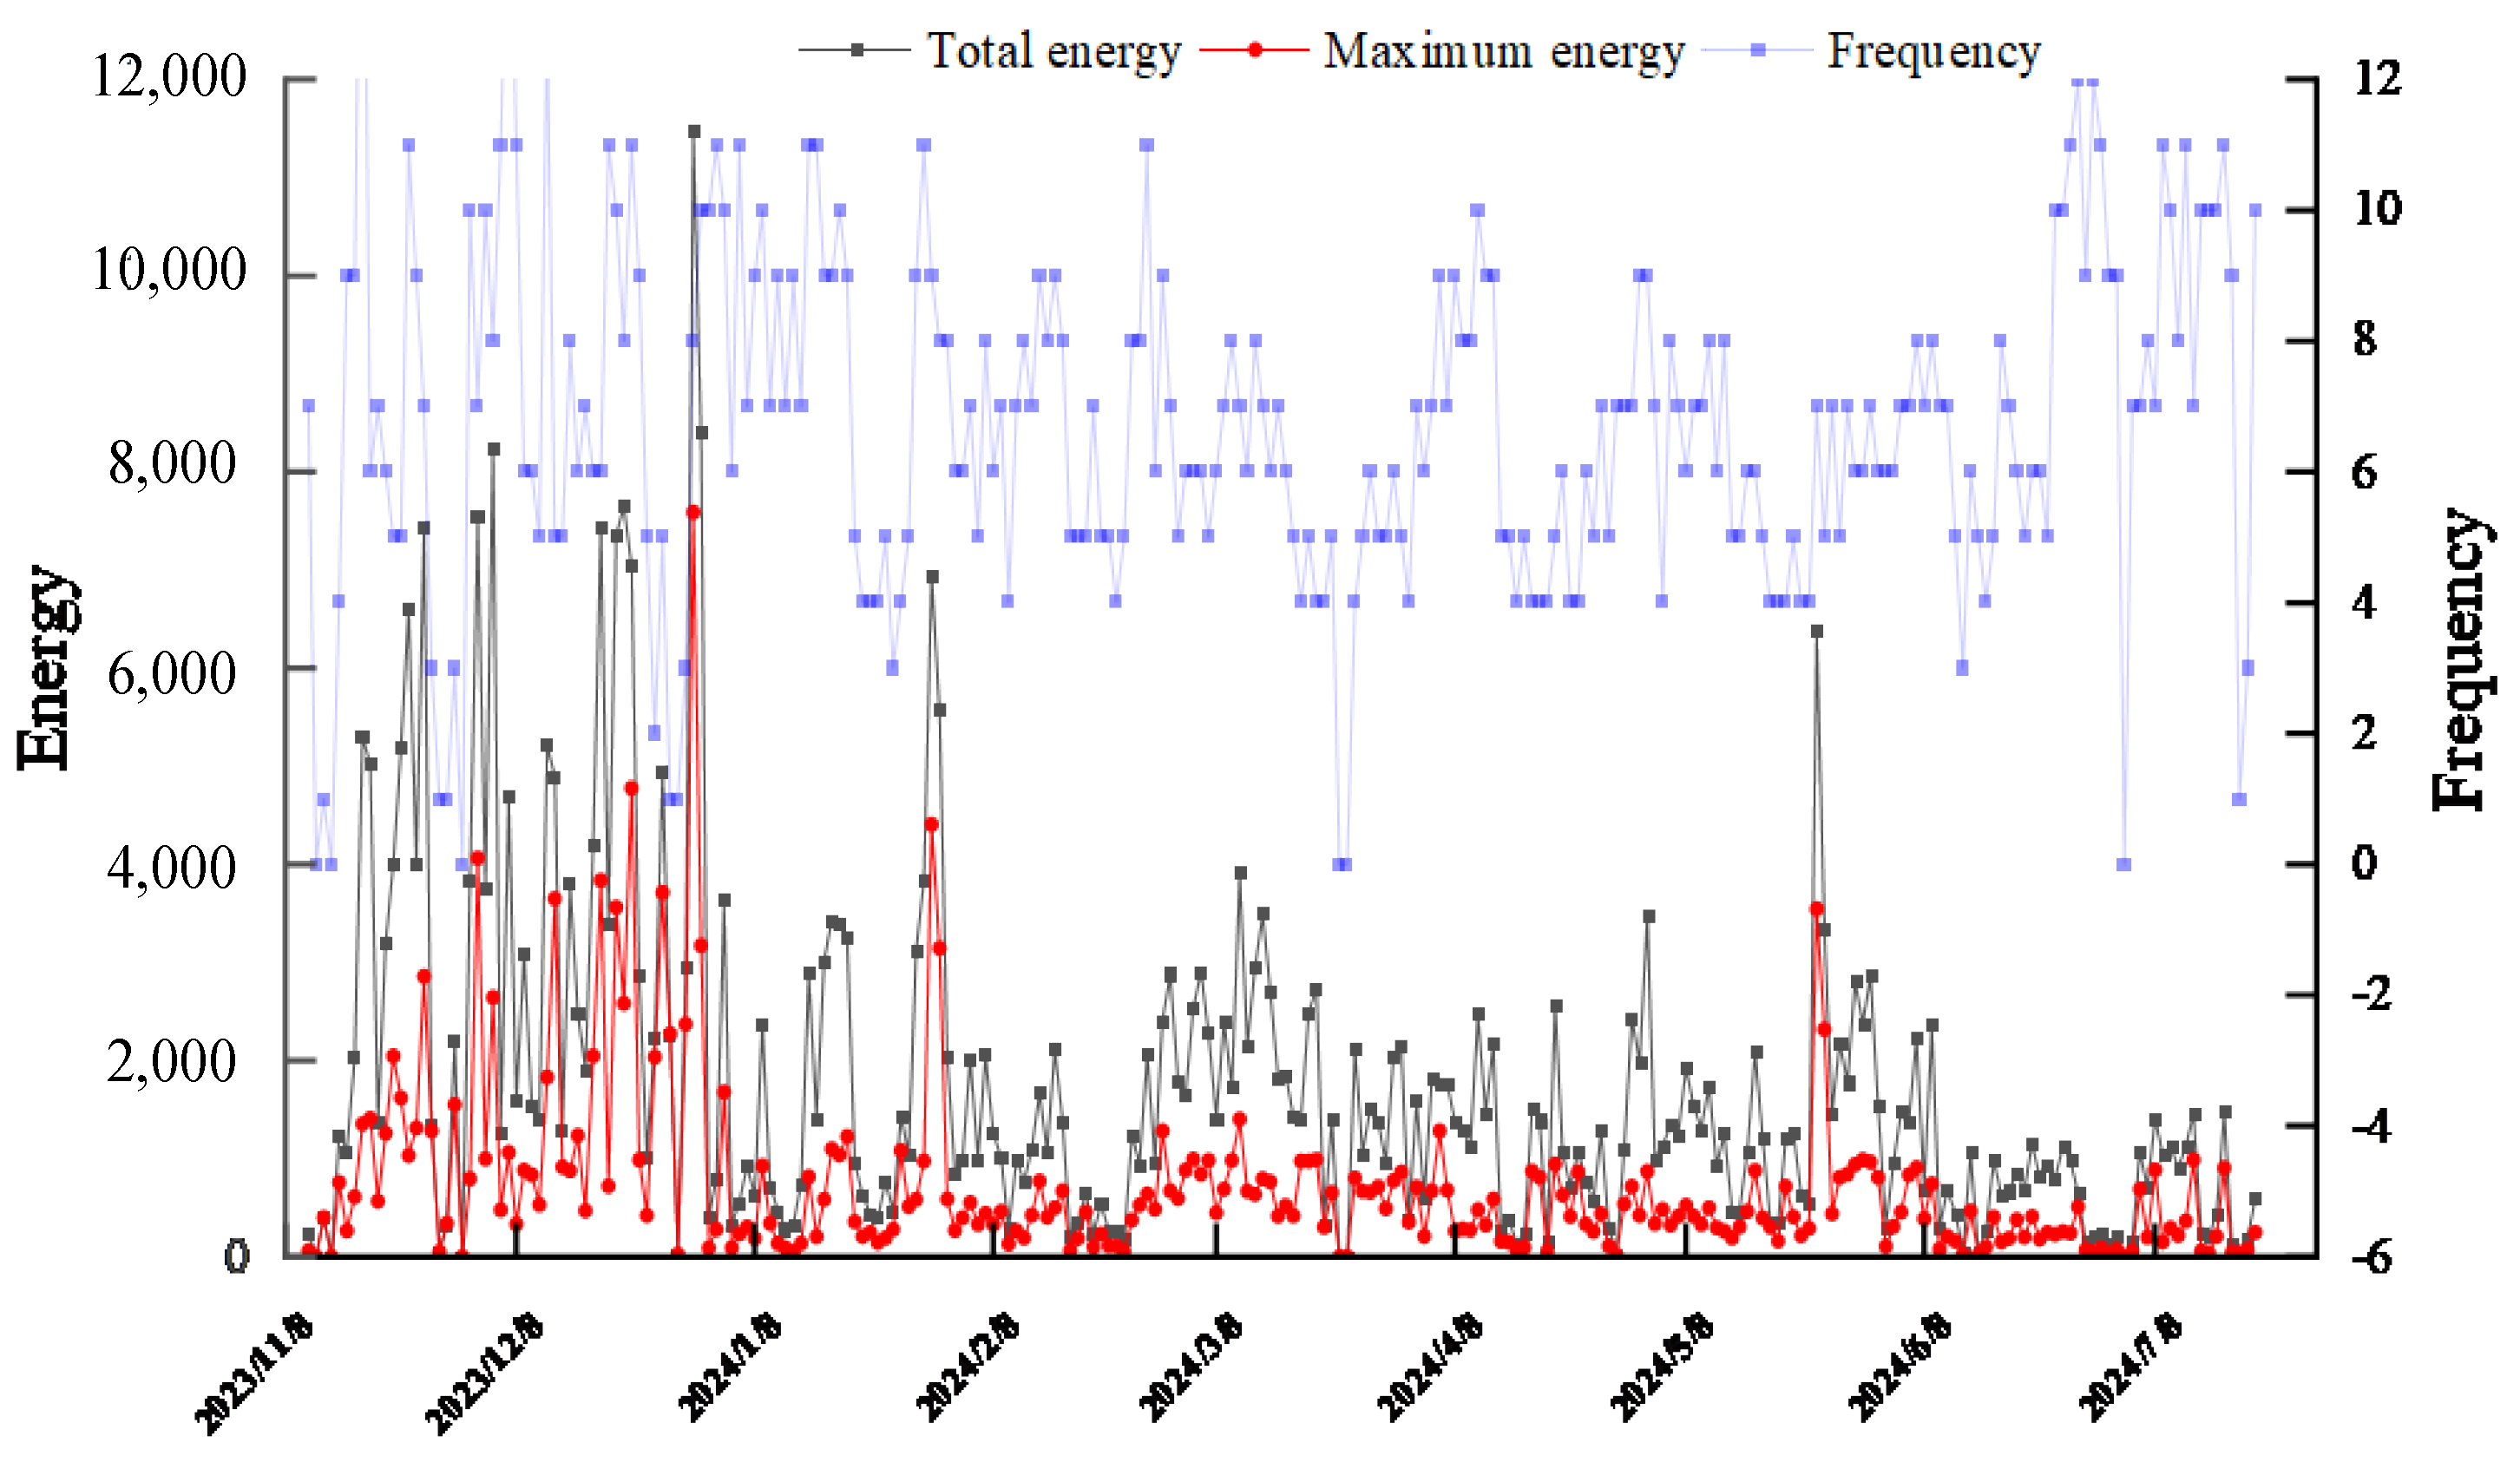
3.1.3. Analysis of Microseismic Parameters in the Slope

Figure 7 presents the energy distribution of microseismic events at the working face. The concentration of high-energy events may be related to the stress concentration and rock mass destabilization during the mining process of the working face, while low-energy events may reflect the local stress adjustment and small-scale rupture. The microseismic events show a significant distribution in energy and frequency, and the maximum total energy value of the microseismic events reaches 12,000 J before and after the “the first square”, indicating that the rock body experiences large-scale rupture and energy release at this stage. The frequency of microseismic events with total energy values between 8,000 J and 10,000 J is higher, which reflects that the rock body stress during the mining process of the working face is reduced. The frequency of the rock body stress adjustment during the mining process of the working face is high, reflecting the frequency of the rock body stress adjustment. In addition, the frequency of microseismic events with total energy value of less than 6,000 J gradually decreases, indicating that low-energy events are relatively rare in the mining process of the working face.

3.2. Numerical Analysis of Deformation and Damage Mechanism of Floor Heave in Roadway

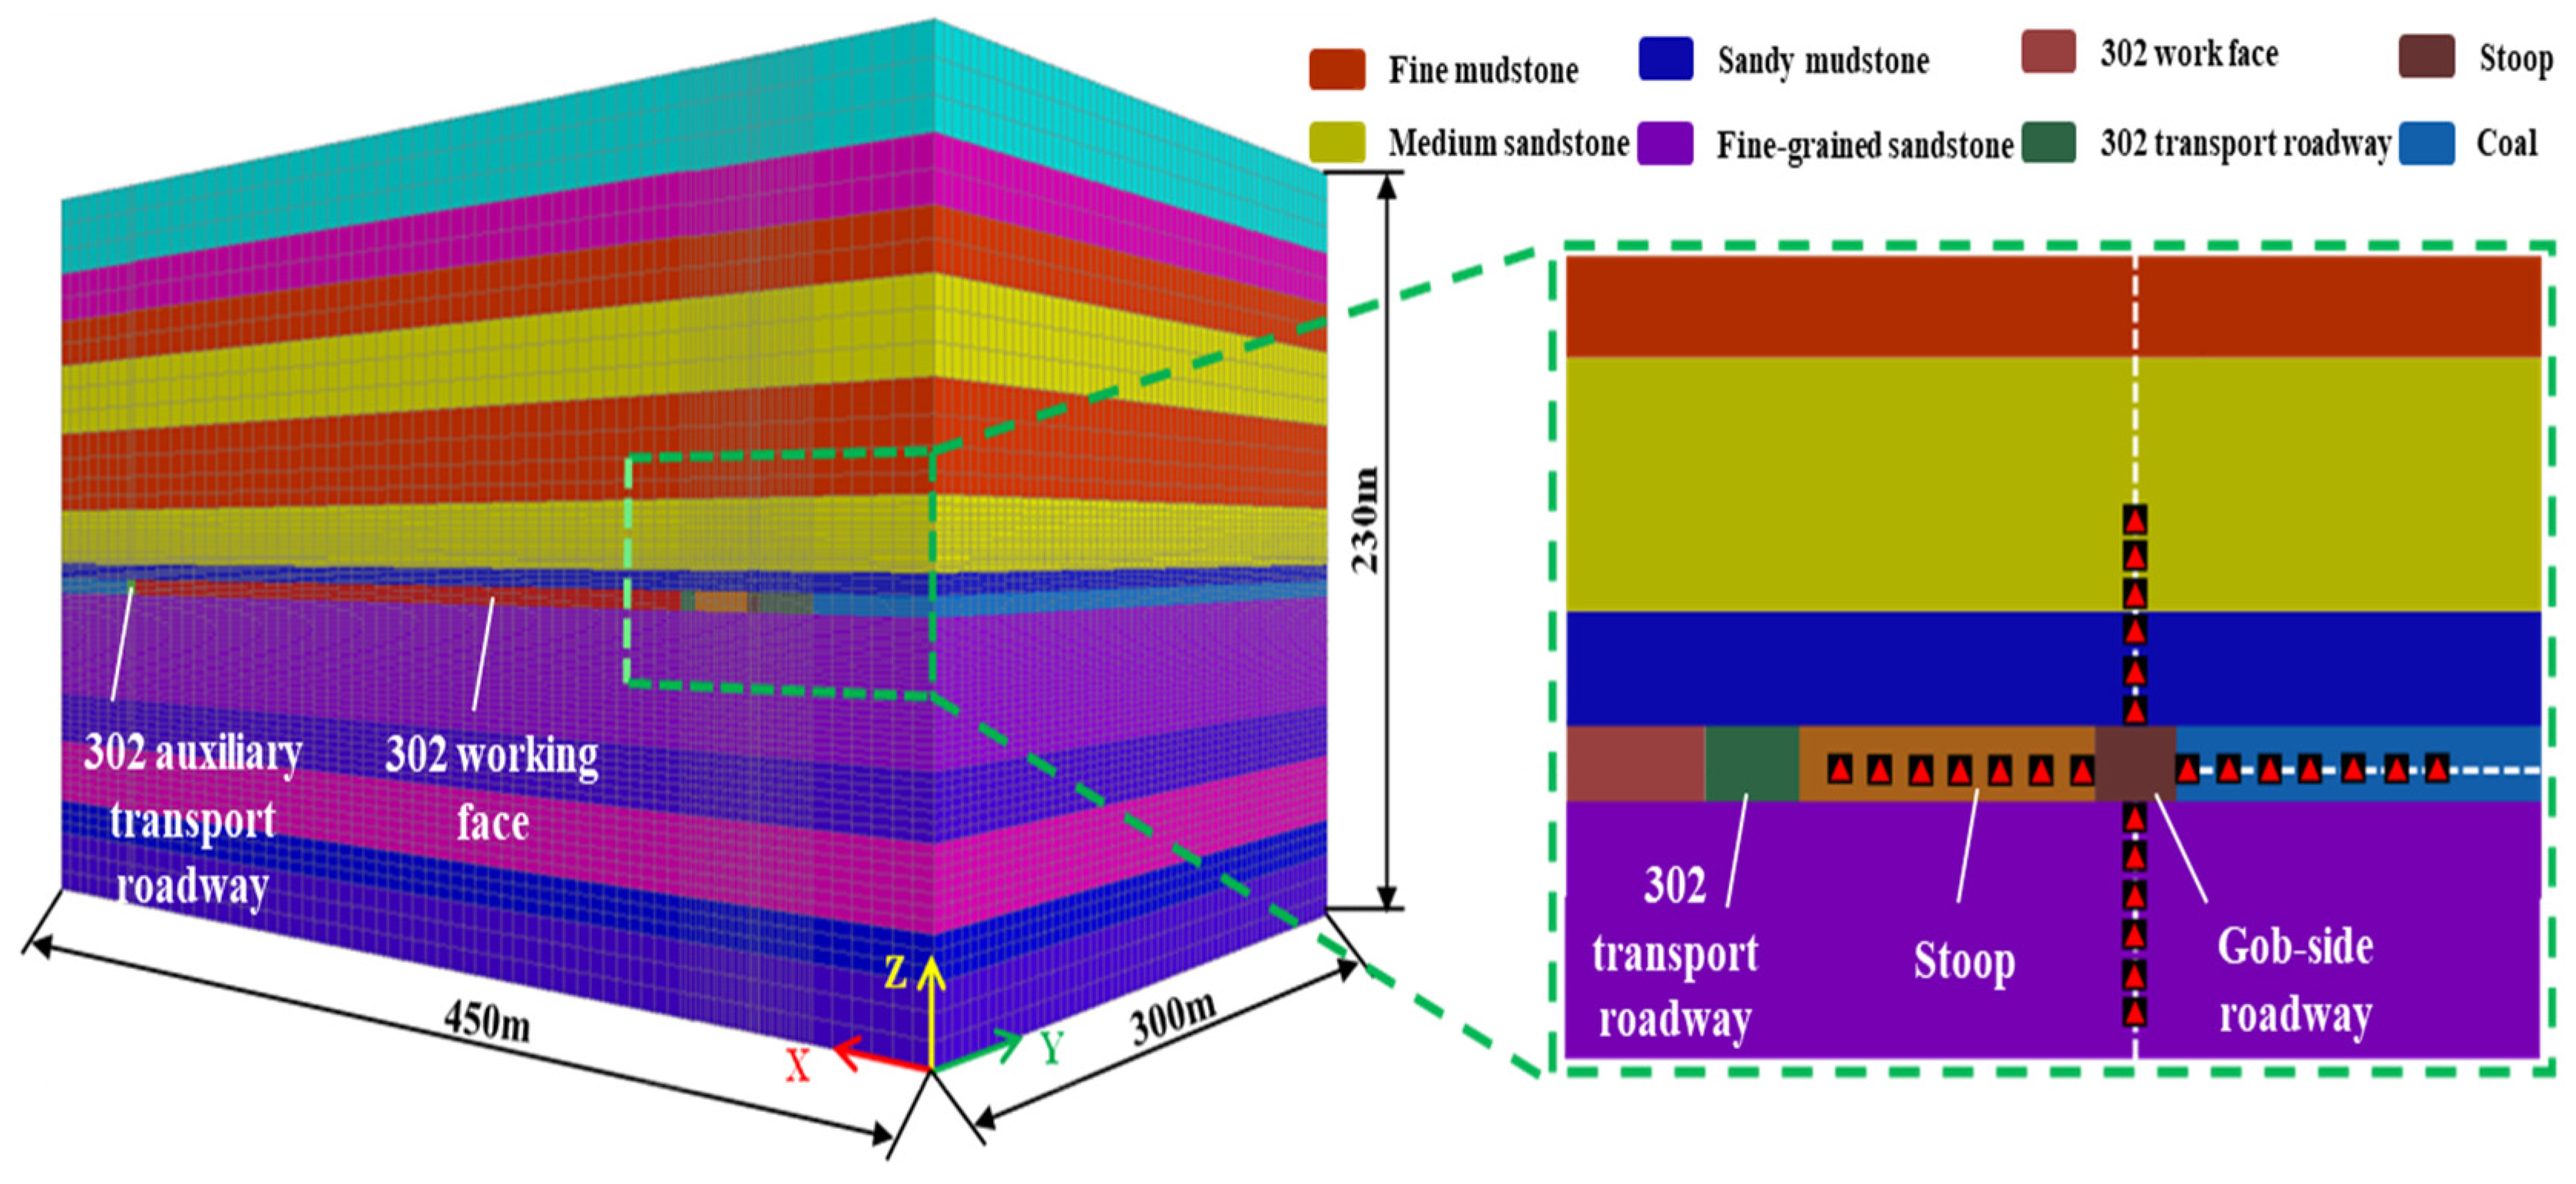
3.2.1. Numerical Modeling

In order to investigate the deformation and damage mechanism of the floor heave of the roadway, a numerical calculation model was established, and the model included the main and auxiliary transportation roadway of the 302 working face and the roadway along the airway of the working face, taking into account the influence of the boundary effect. The calculation range was 450 m × 300 m × 230 m (length × width × height). The model was discretized using hexahedral elements, with a base mesh size of 2.5 m in the far-field region. Local refinement (mesh size of 0.5–1.0 m) was applied near the roadway, as shown in Figure 8.
The top surface of the model is a free surface, the bottom is fixed, and the horizontal movement is restricted around it. The initial stress is applied so that the test working surface reaches the level of ground stress in the field. The surrounding rock is modeled by the Mohr–Coulomb intrinsic model, the anchor cable and anchor bolts are simulated by a Cable unit, and the mechanical parameters of the surrounding rock in the numerical model are shown in Table 1.

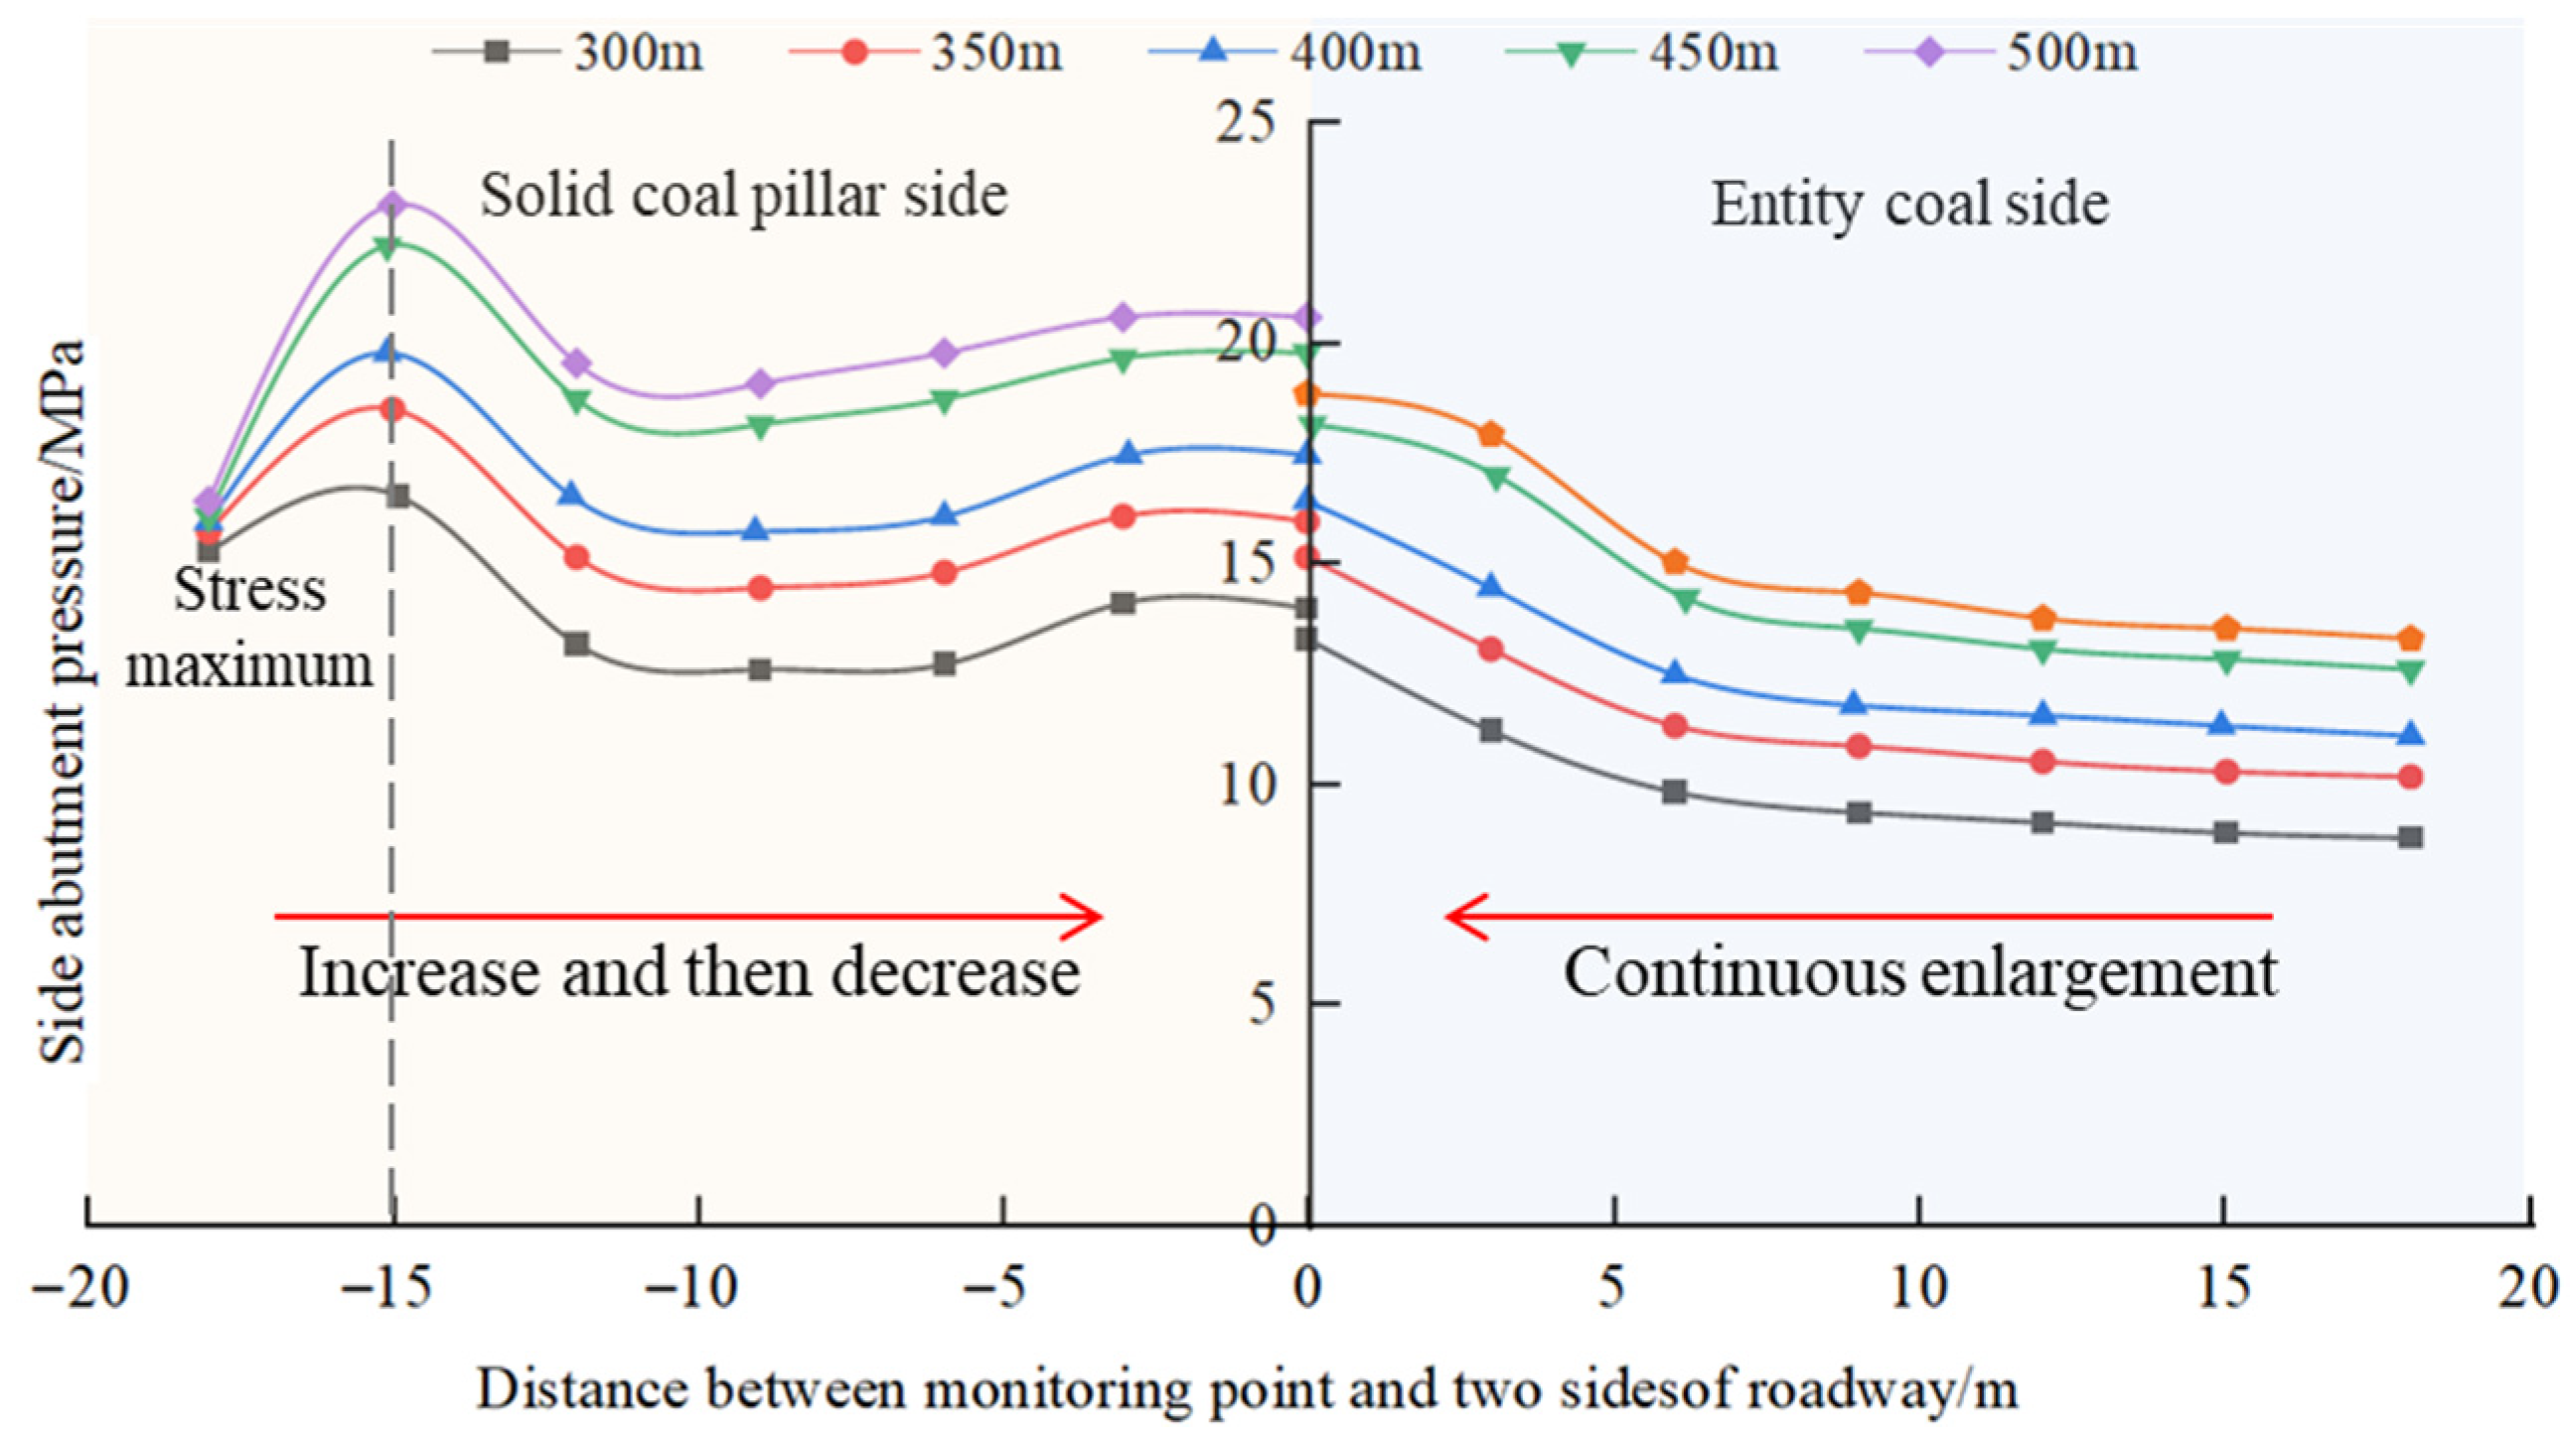
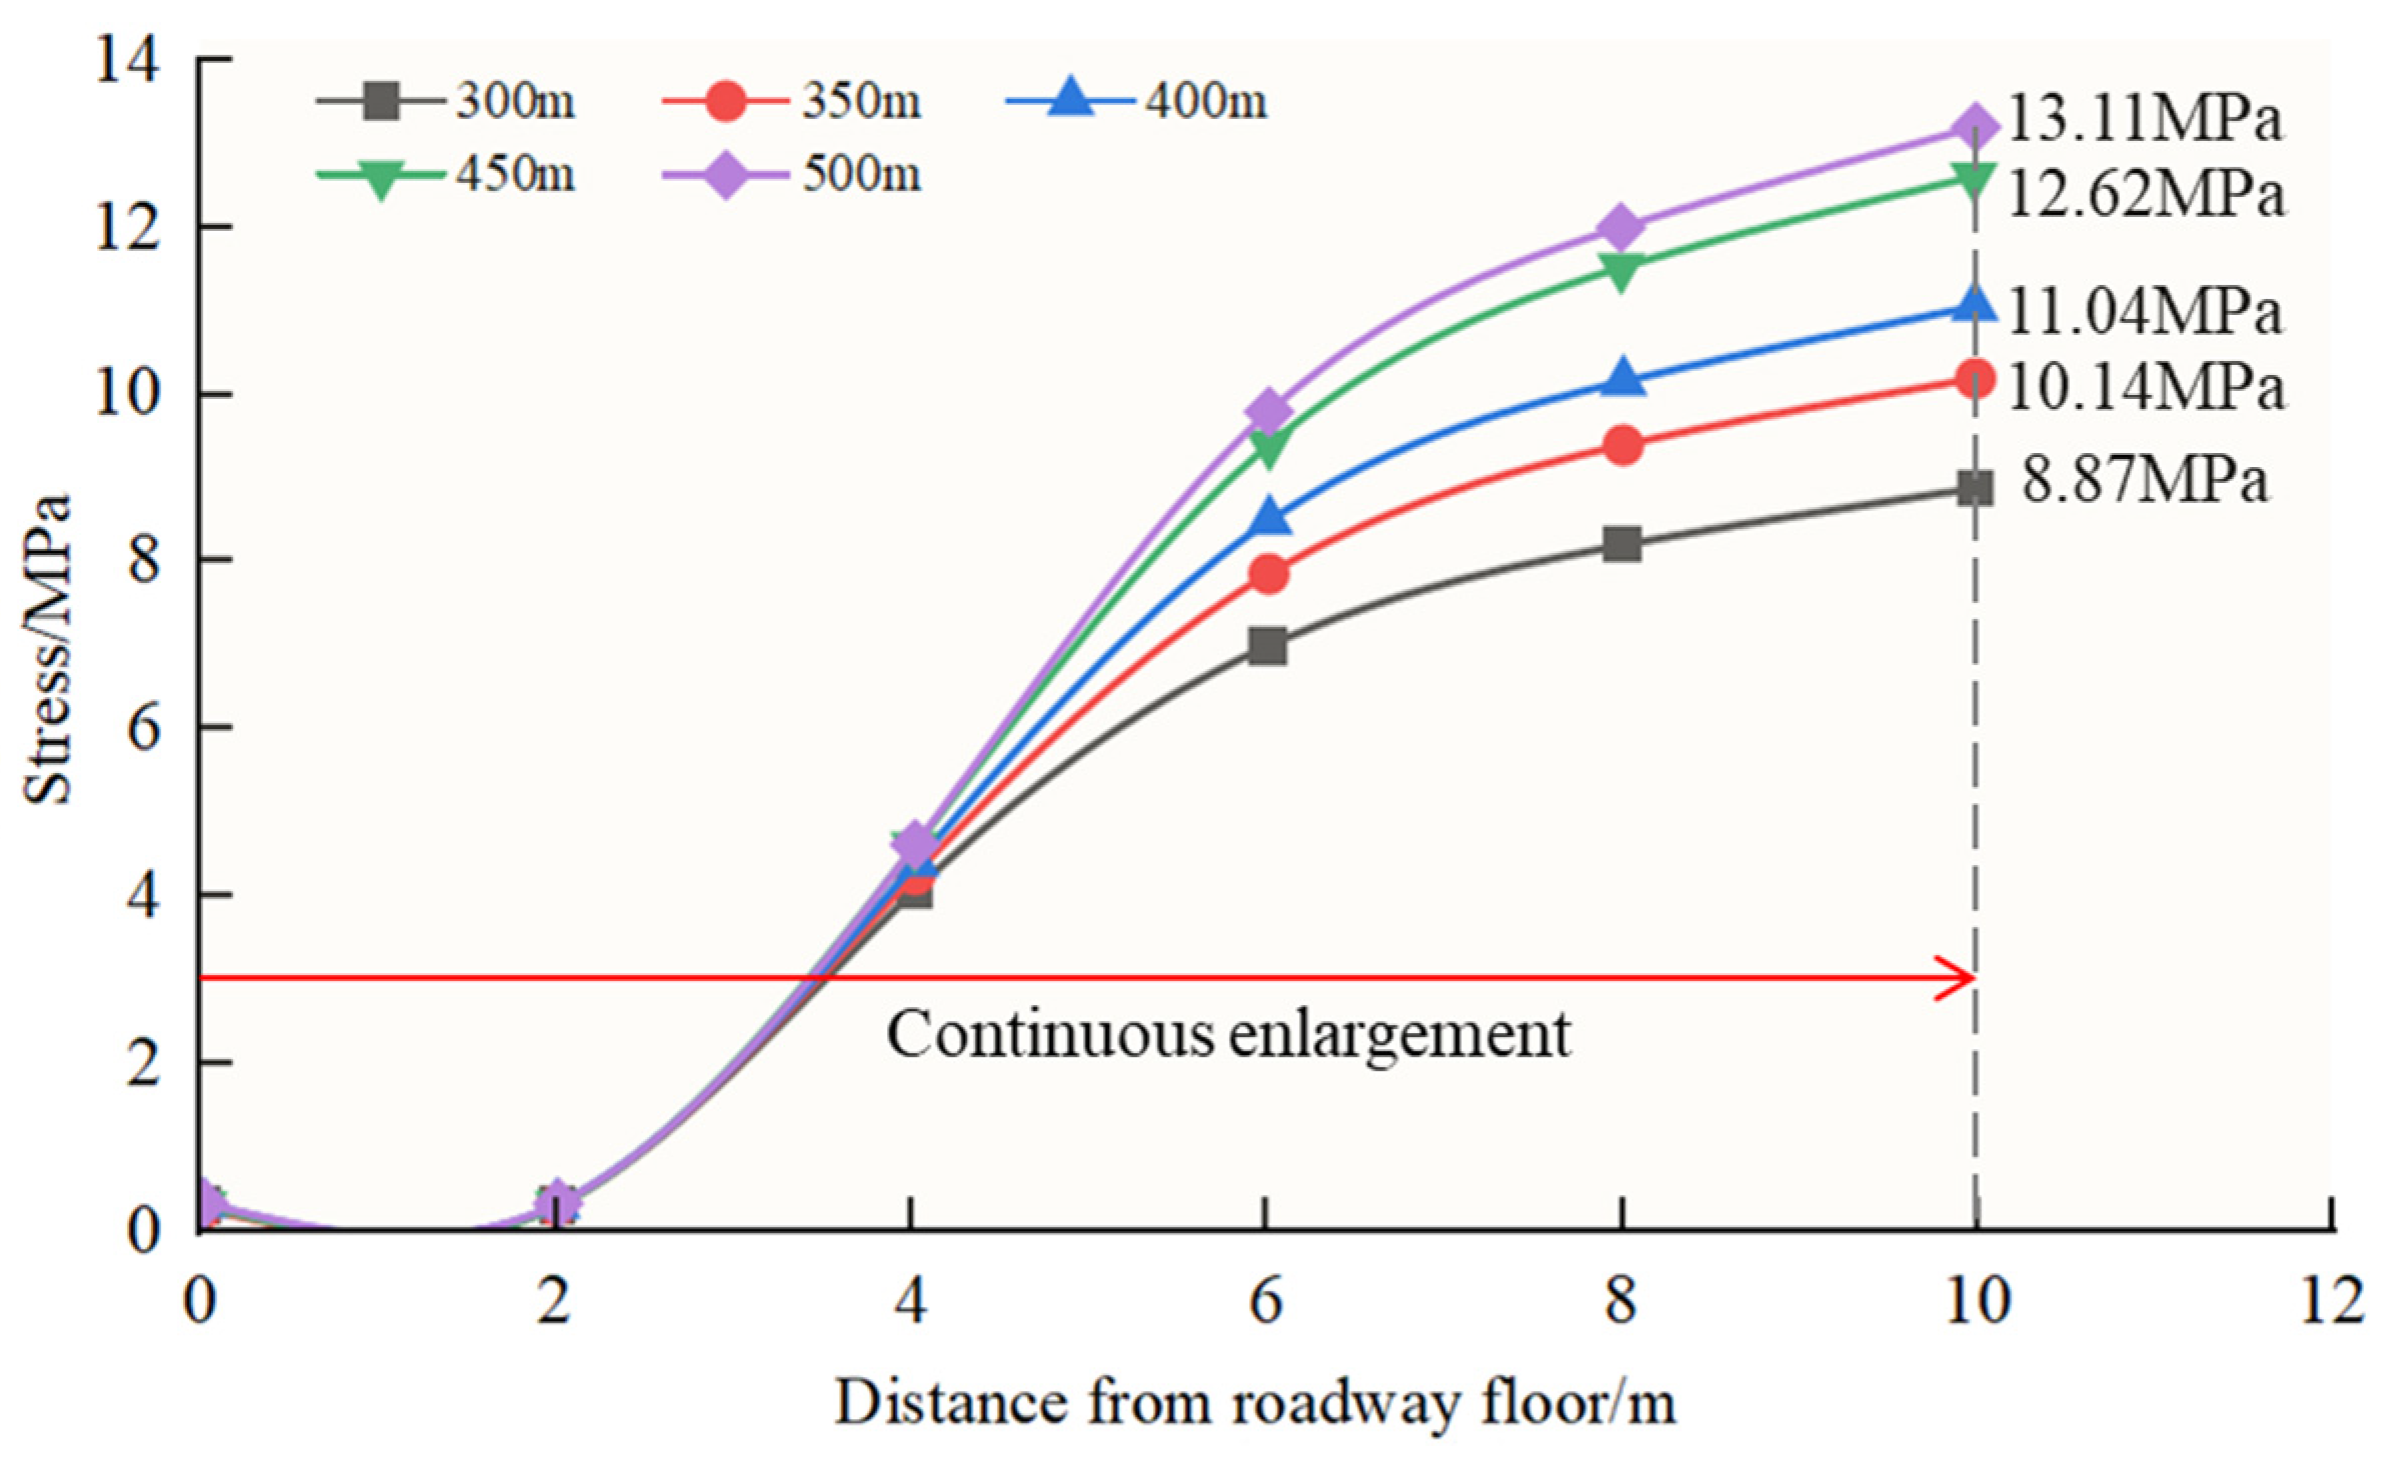
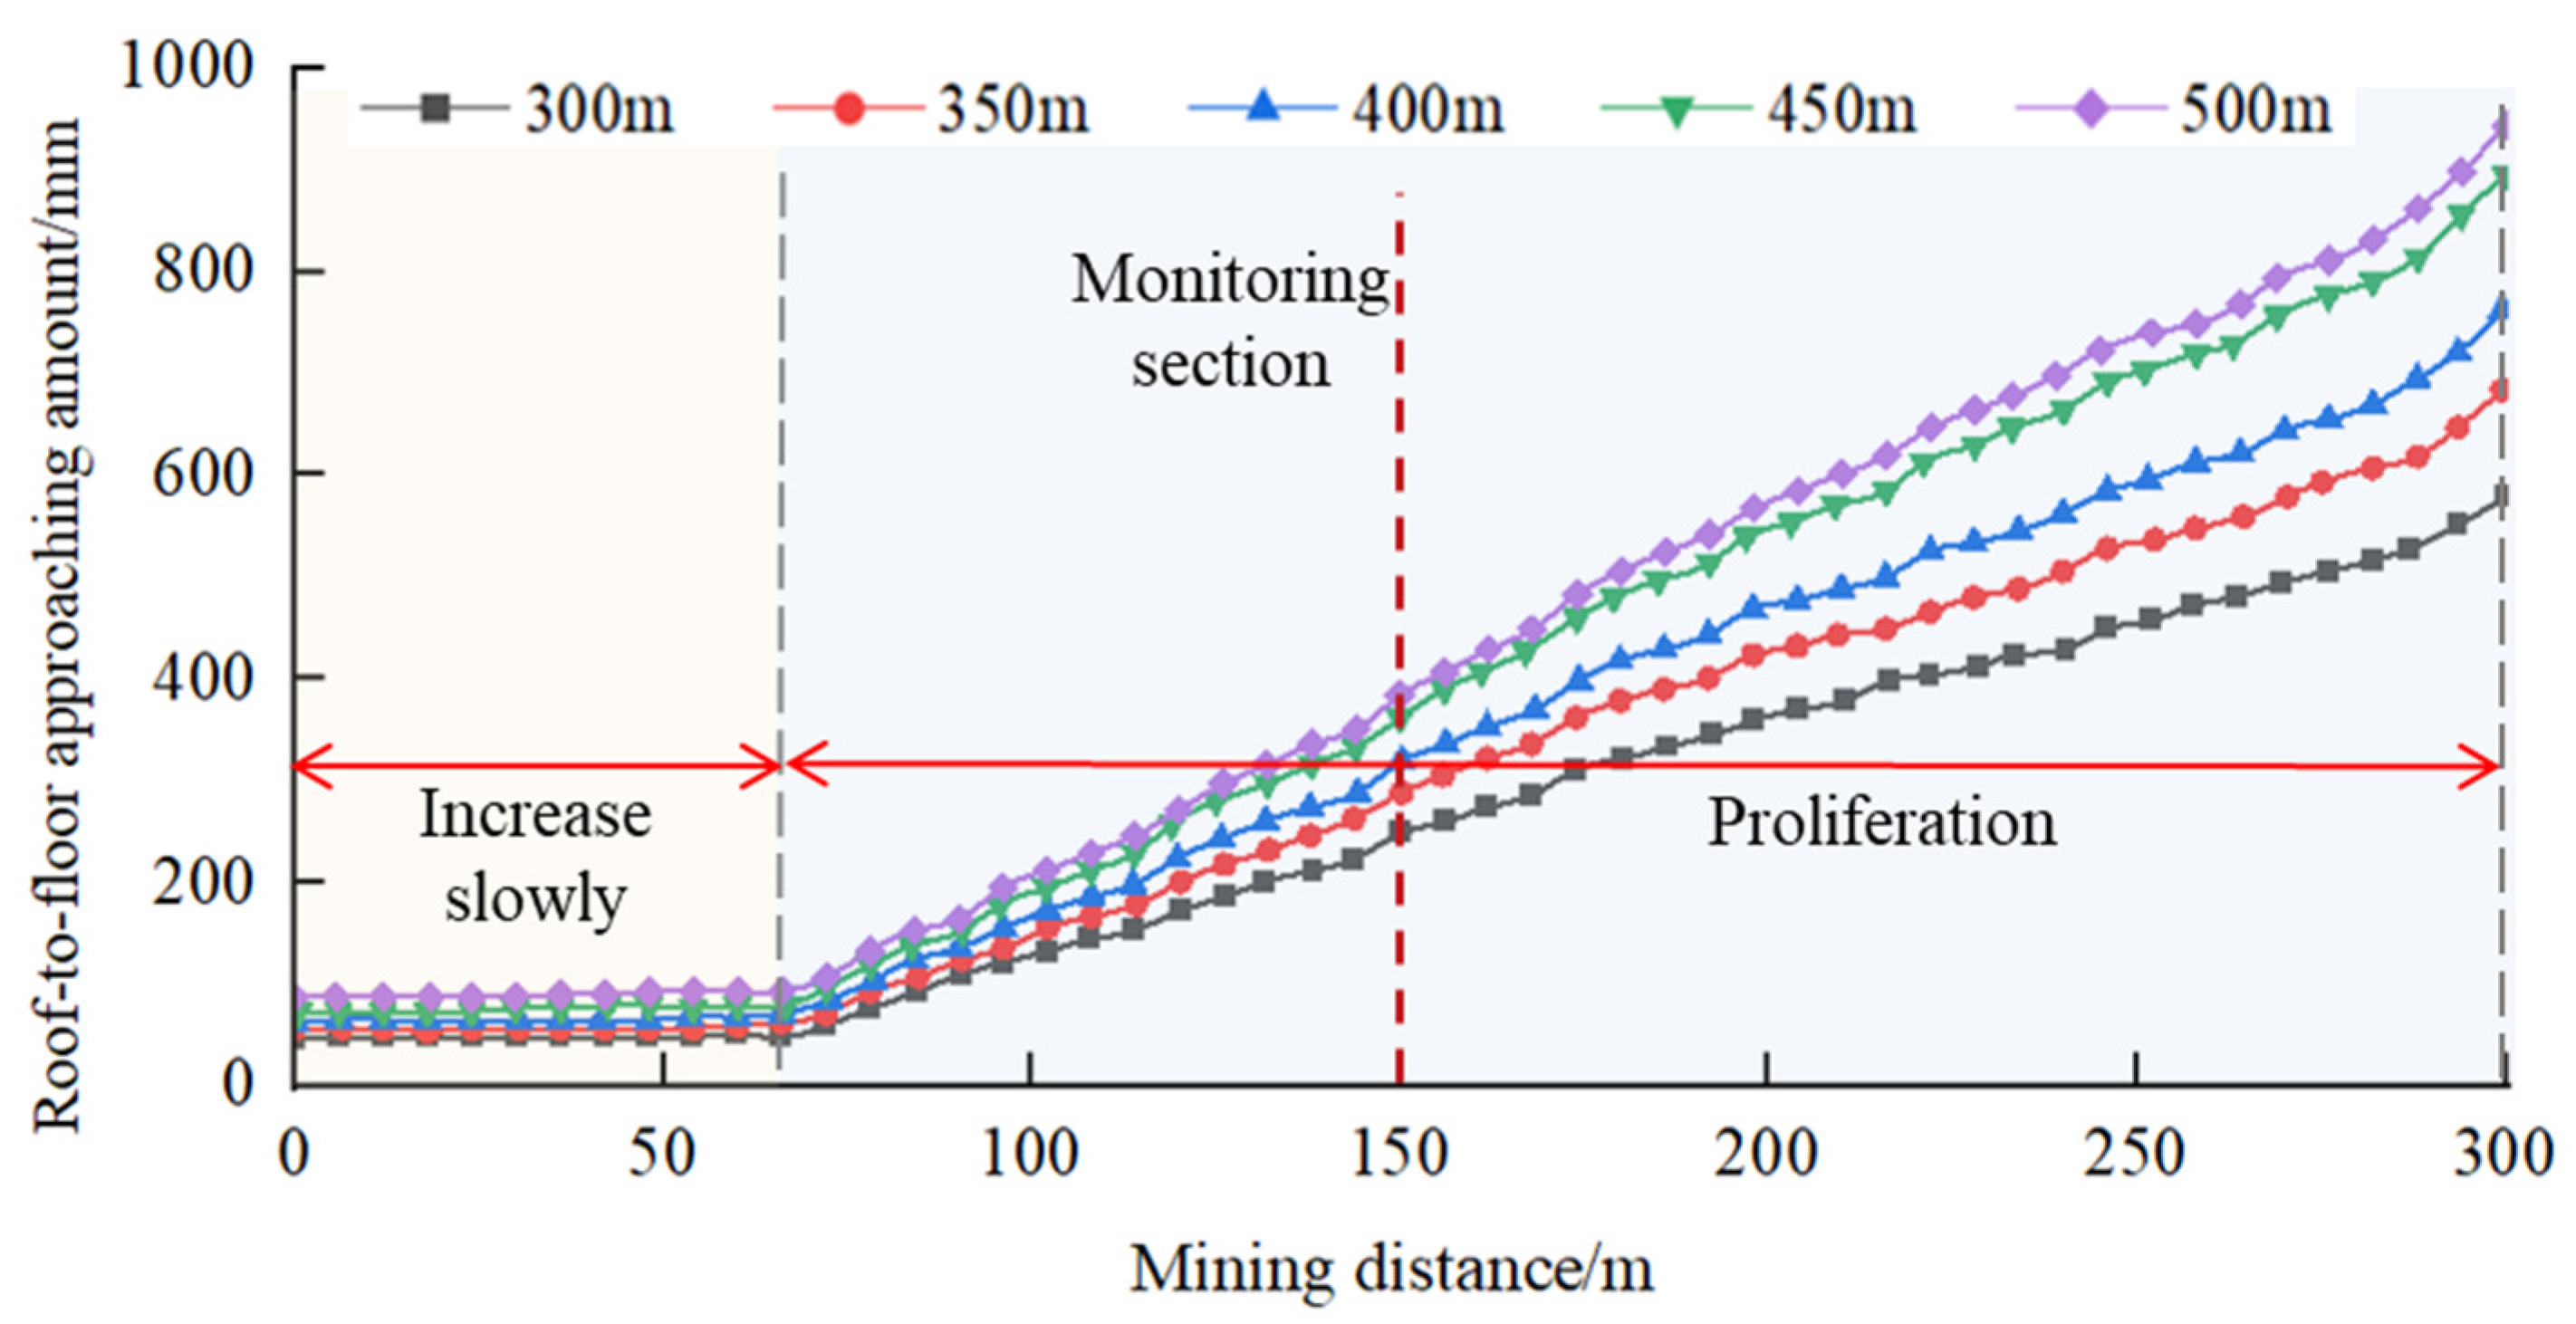
3.2.2. Influence of Coal Seam Depth on the Stability of Roadway Floor

Taking the coal seam depth as a variable, comparing the surrounding rock deformation and stress change rule under different coal seam depth conditions, the comparative research program under coal seam depths of 300 m, 350 m, 400 m, 450 m, and 500 m is selected, and the coal seam depth of 400 m represents the on-site construction program. Figure 9 shows stress distribution cloud maps under different coal seam burial depths, Figure 10 shows the lateral support pressure change curves of coal pillars and solid coal gangs, where the left side of the roadway is a coal pillar and the right side is solid coal. Figure 11 shows the change curve of the stress of the floor of the roadway, and Figure 12 shows the change curve of the roof and floor movement of the roadway.
(1) Comparative analysis of lateral support pressure: In the direction close to the center of the roadway, the lateral support pressure of the left-side solid coal pillar shows an overall “asymmetric” characteristic of increasing first and then decreasing; the lateral support pressure of the right-side solid coal gang side shows a non-linear increase in the overall characteristic of the lateral support pressure. In the process of pushing and mining, the peak of lateral support pressure is always located in the left-side solid coal pillar. During the pushing process, the peak lateral support pressure is always located in the left solid coal pillar. The peak stresses of different coal seams at different burial depths all appear at 15 m from the center of the roadway in the left solid coal pillar, and the peak stresses are 16.55 MPa, 18.54 MPa, 19.90 MPa, 22.48 MPa, and 23.16 MPa, respectively. With an increase in the burial depth of the coal seams, the lateral support pressure shows the characteristic of increasing.
(2) Comparative analysis of floor stress in the roadway: In the direction of gradual development to the depth, the floor stress in the roadway shows a trend of continuous increase. The peak values of floor stress in different coal seam depths are 8.87 MPa, 10.14 MPa, 11.04 MPa, 12.62 MPa, and 13.11 MPa, respectively, and with an increase in the coal seam depth, the floor stress is characterized by a continuous increase.
(3) Comparative analysis of the amount of roadway roof and floor migration: With the advancement of the working face, the amount of roadway roof and floor migration shows a linear growth trend; 130 m from the front of the working face, the amount of roadway roof and floor migration increases slowly, and the roadway surface deformation is more intense after pushing the mining to 130 m from the working face, i.e., the smaller the distance of the overpass is, the more intense the surface deformation of the roadway is. The different coal seam depths of the roadway roof and floor are 577.13 mm, 682.79 mm, 762.10 mm, 898.75 mm, and 945.11 mm, respectively. With an increase in the coal seam depth, the roof and floor of the roadway show an increasing trend, i.e., within a certain range, the greater the depth of the coal seams, the worse the control of the stability of the roadway.

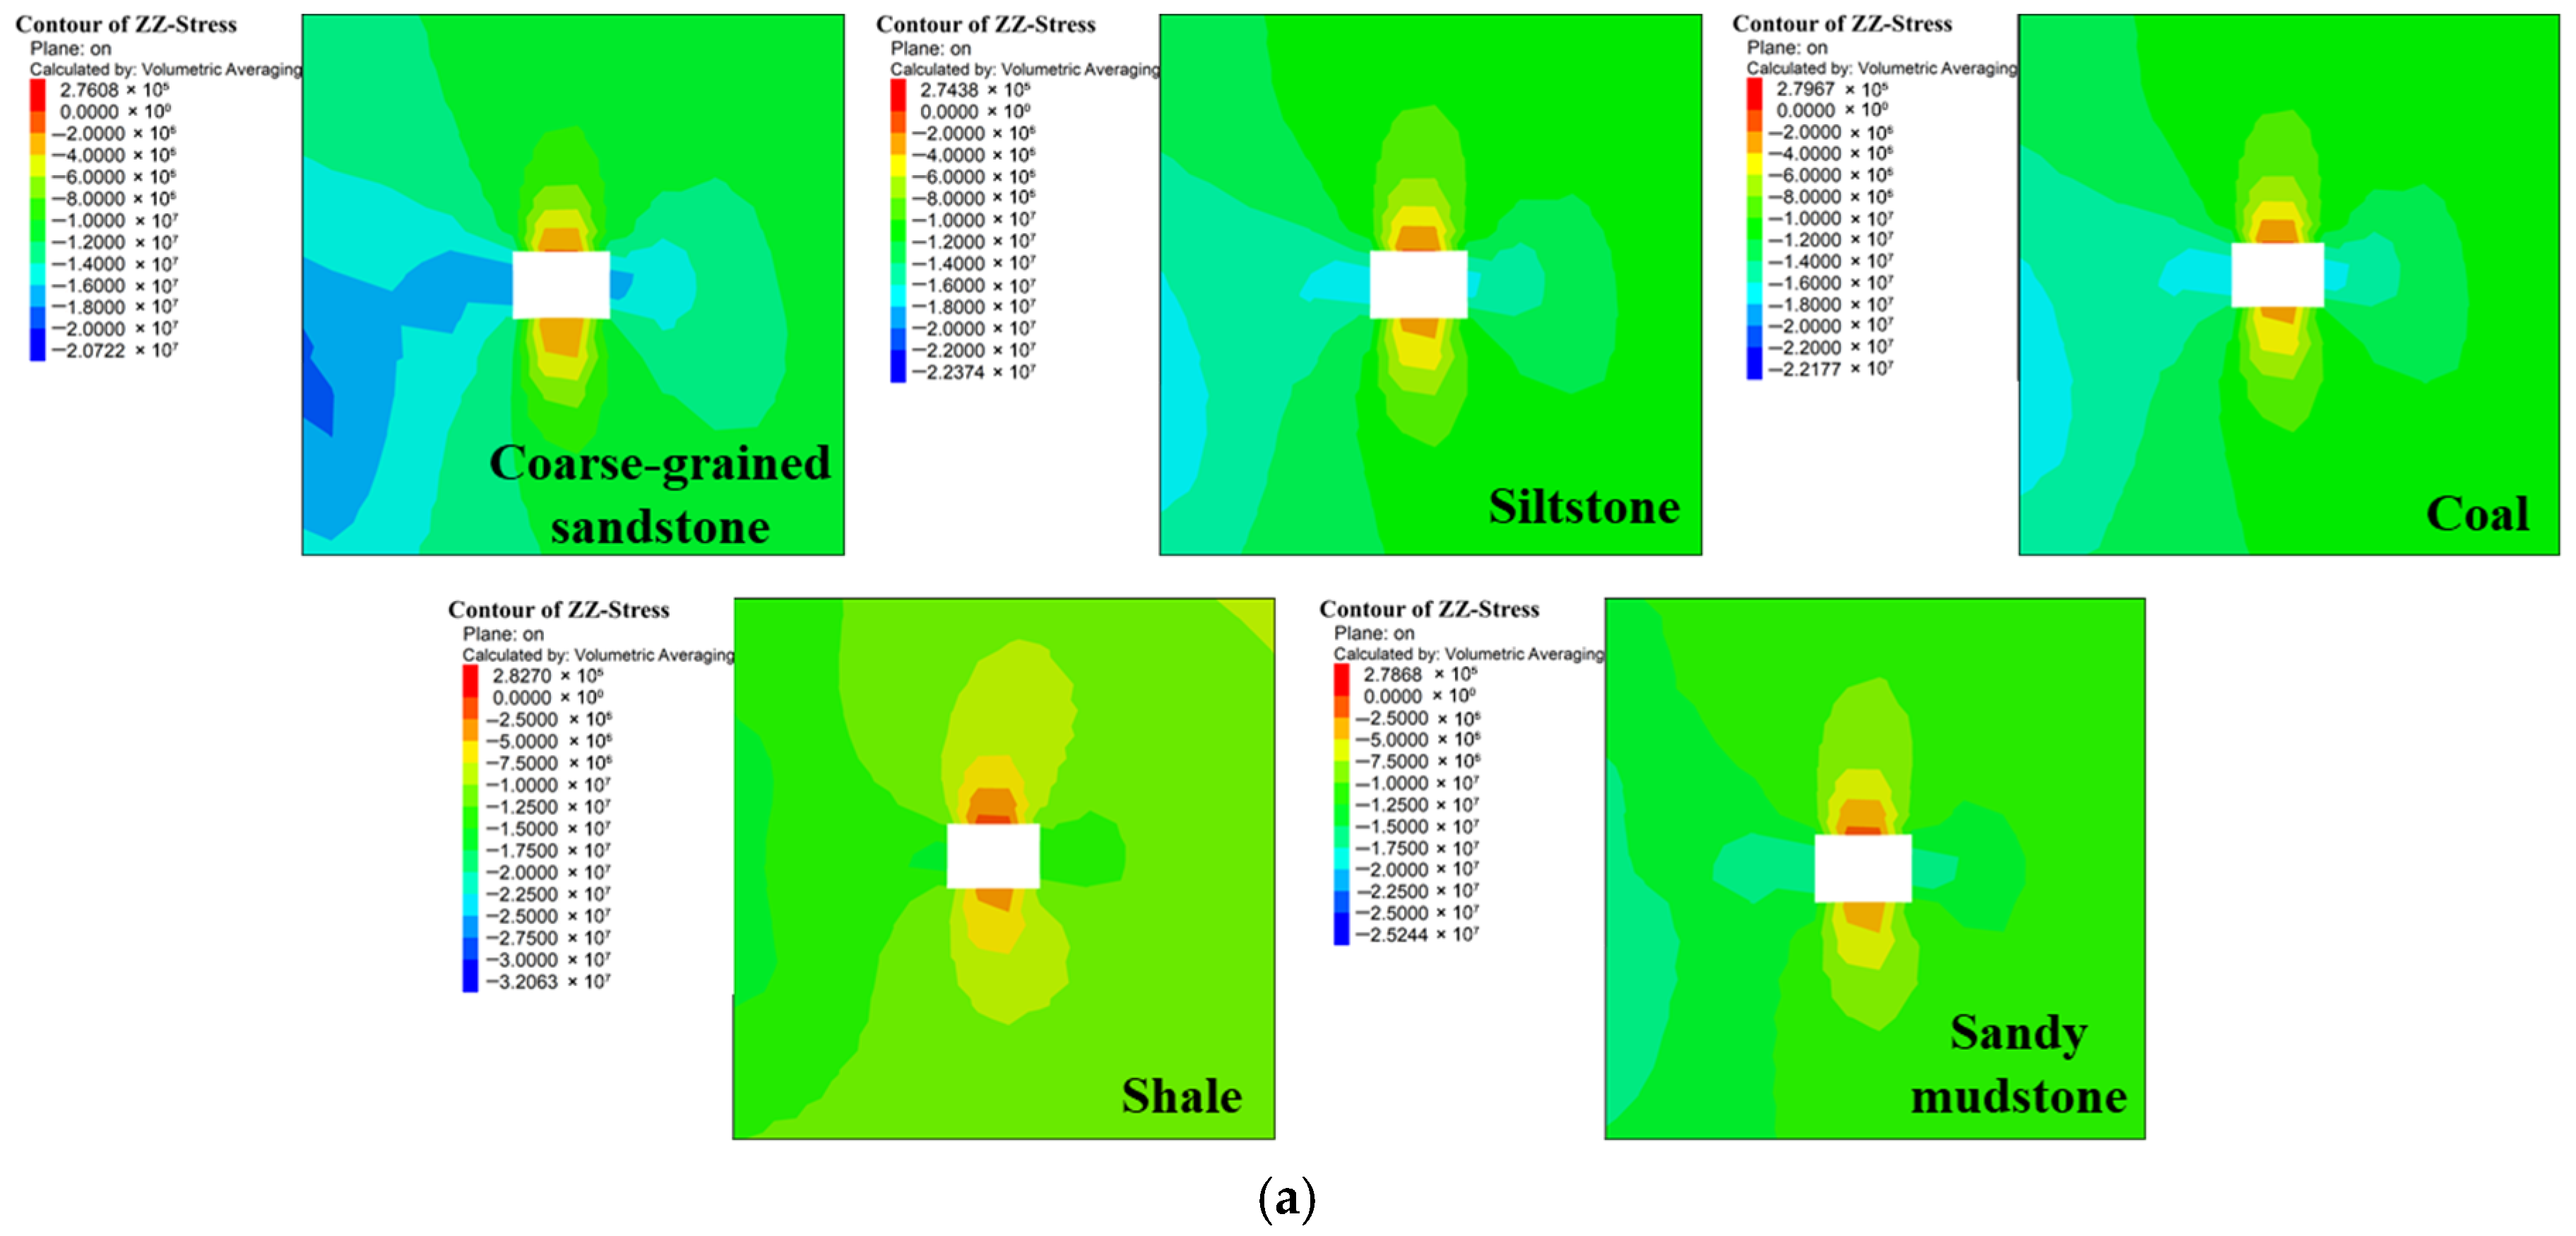
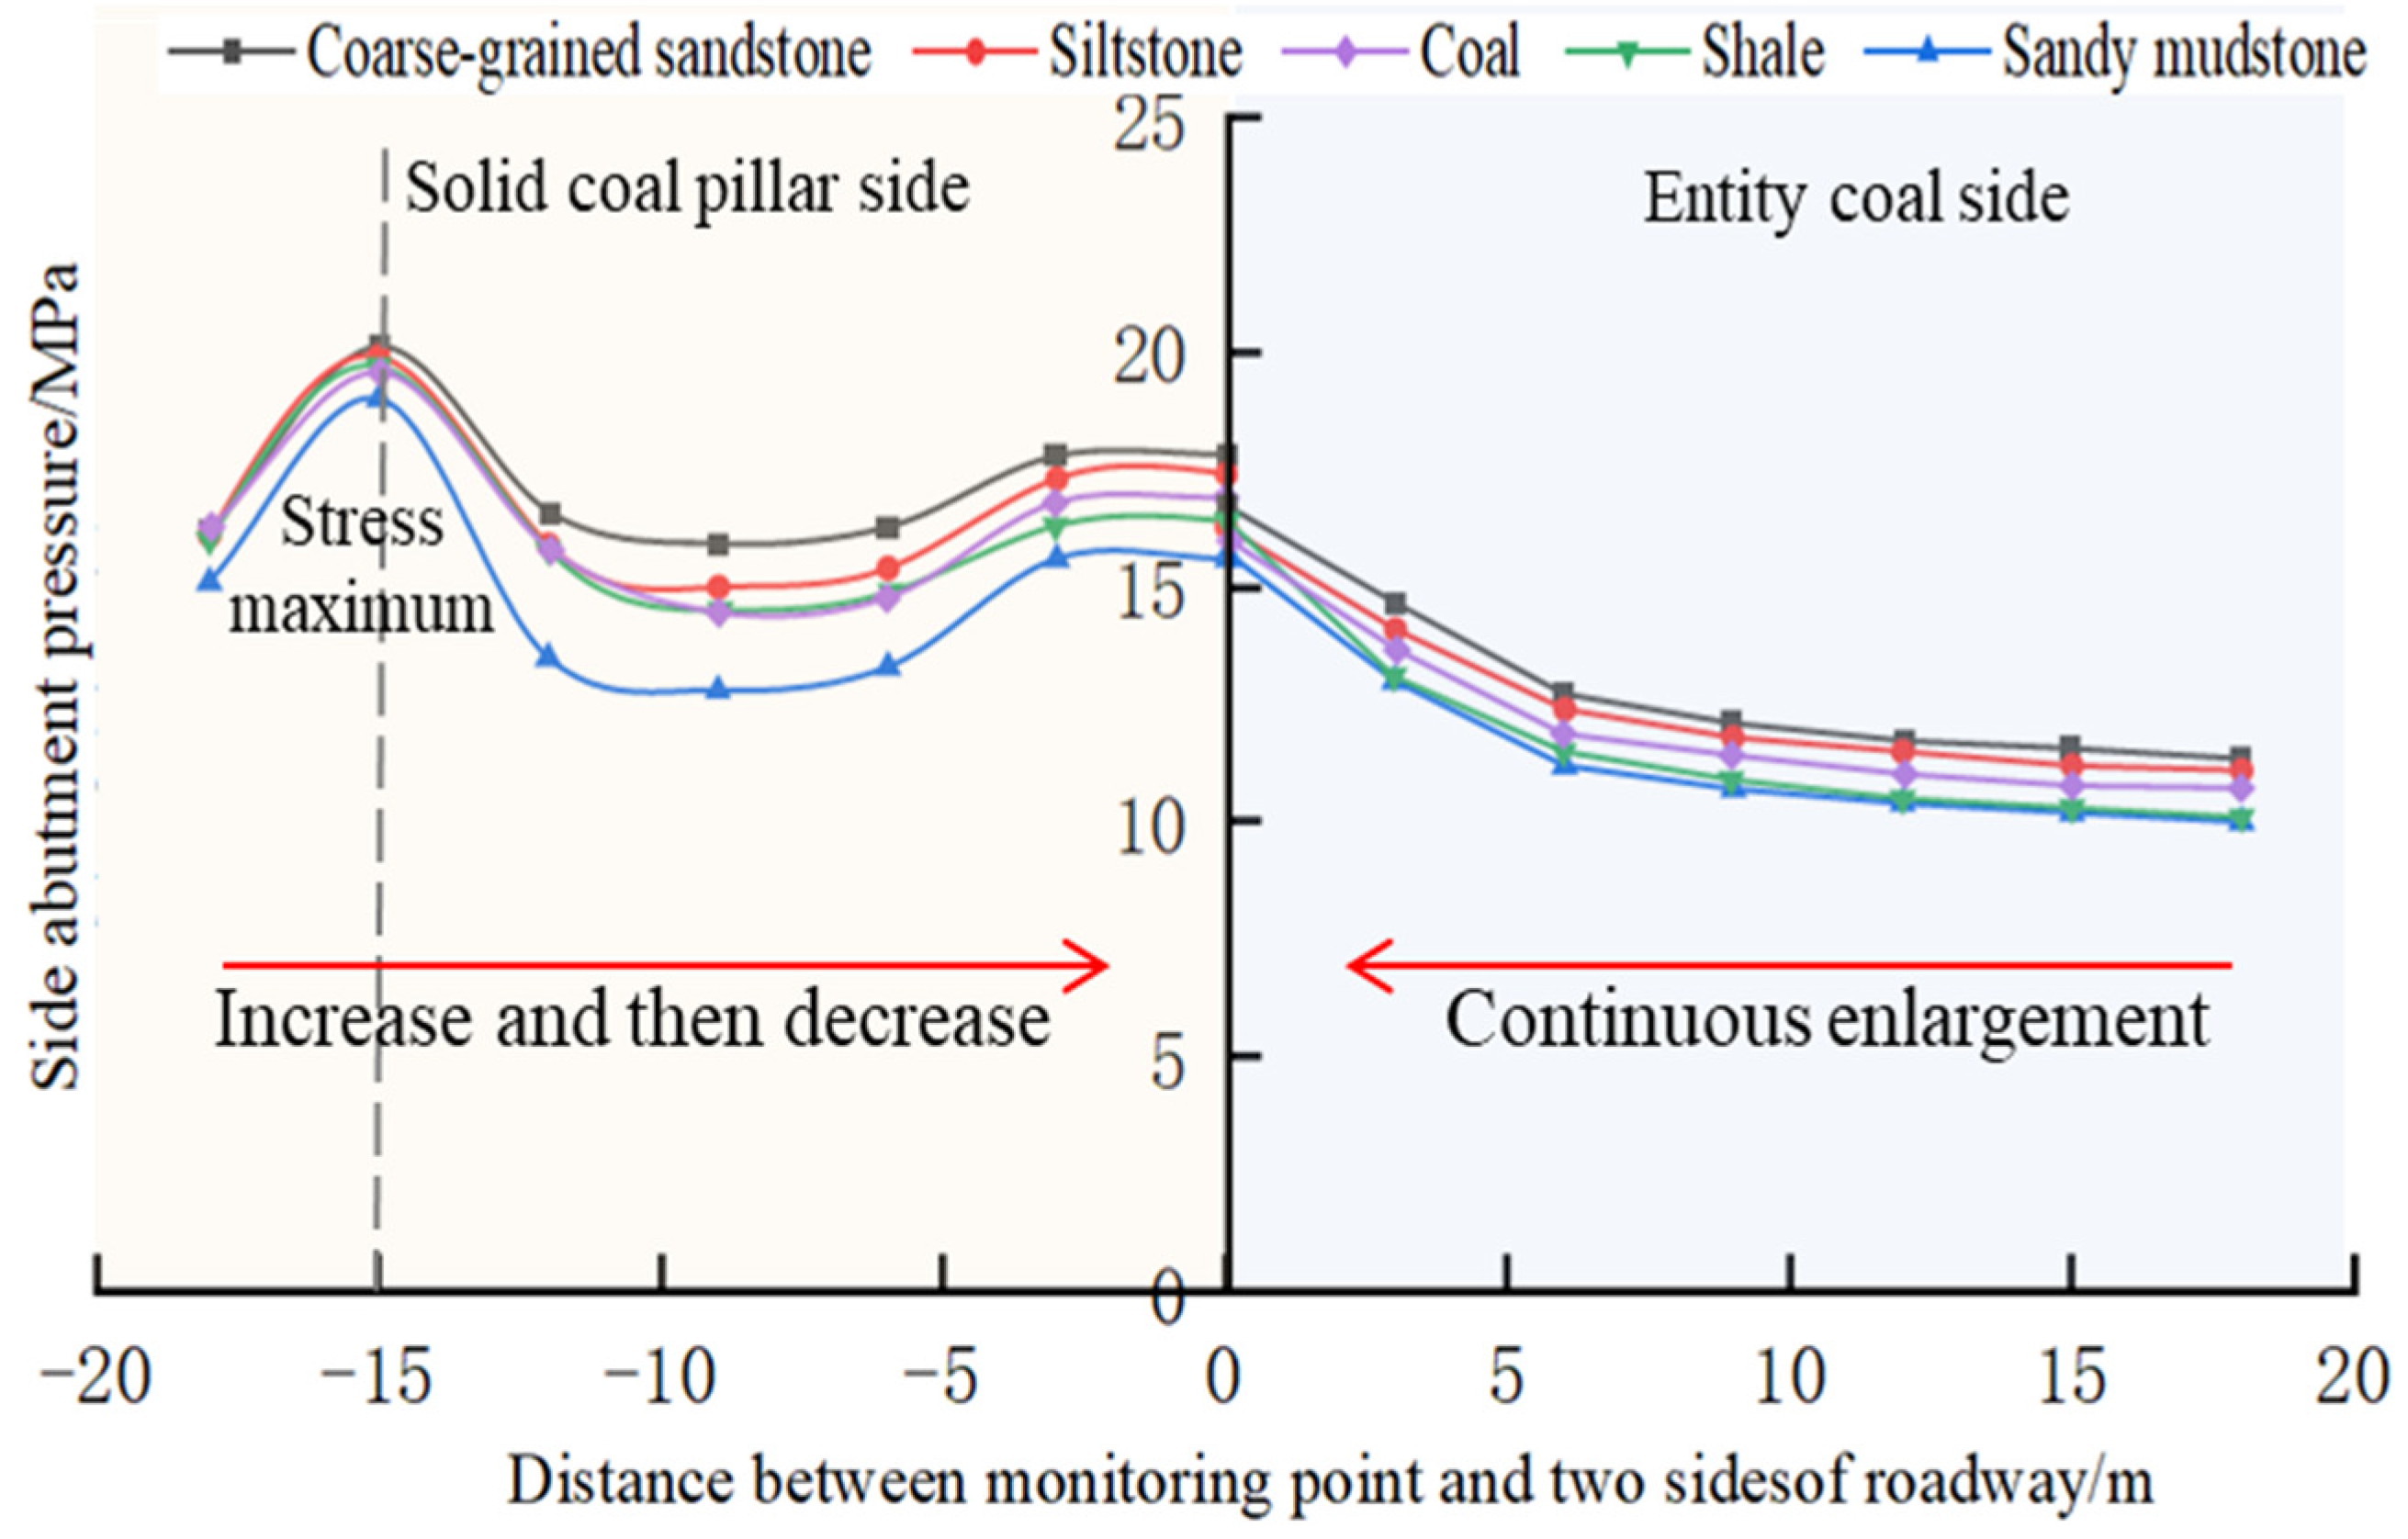
3.2.3. Influence of Floor Lithology on the Stability of the Roadway Floor

Taking the floor lithology as a variable, comparing the surrounding rock deformation and stress change rule under different floor lithology conditions, the comparative research program under floor lithology conditions of coarse-grained sandstone, siltstone, coal, shale, and sandy mudstone is selected, and the floor lithology at the site is mudstone. Figure 13 shows stress distribution cloud maps under different floor lithology conditions, Figure 14 shows the lateral support pressure change curves of coal pillars and solid coal gangs, where the left side of the roadway is coal pillar and the right side is solid coal, Figure 15 shows the change curve of the stress of the floor of the roadway, and Figure 16 shows the change curve of the amount roof and floor movement of the roadway.
(1) Comparative analysis of lateral bearing pressure: Along the centerline of the roadway, the lateral bearing pressure in the area of the left solid coal pillar (the floor lithology is coarse-grained sandstone, siltstone, sandy mudstone, shale, and coal) shows a nonlinear evolution characteristic of rising and then decreasing, while the lateral bearing pressure in the area of the right solid coal gang shows a monotonous increasing trend of continuous enhancement. During the pushing and mining process, the peak lateral bearing pressure of different floor lithologies is always located at 15 m from the left solid coal pillar, and the peak stresses are 19.90 MPa, 19.78 MPa, 19.65 MPa, 19.61 MPa, and 18.94 MPa, respectively. The change in lateral bearing pressure shows the characteristic of “coarse-grained sandstone floor, sandstone floor, sandy mudstone floor, shale floor, coal floor”.
(2) Comparative analysis of roadway floor stress: In the direction of gradual development to the depth, the roadway floor stress shows a continuous increasing trend. The peak stresses of different floor lithologies are 11.04 MPa, 11.02 MPa, 10.88 MPa, 10.52 MPa, and 10.38 MPa, respectively, and the change in roadway floor stress presents the characteristic of “coarse-grained sandstone floor, sandstone floor, sandy mudstone floor, mudstone floor, coal floor”.
(3) Comparative analysis of the amount of roadway roof and floor movement: With the advance of the working face, the amount of roadway roof and floors movement shows a non-linear growth trend. At 90 m from the front of the working face, the amount of roadway roof and floor migration increases slowly after pushing to 90 m from the front of the working face, i.e., the smaller the overrun distance is, the more drastic the deformation of the roadway surface is. The amount of roadway roof and floor migration with different floor lithologies is 762.10 mm, 740.51 mm, 712.20 mm, 728.33 mm, and 766.37 mm, and the change in the amount of the roadway roof and floor movement shows the characteristic of “coal floor, coarse-grained sandstone floor, siltstone floor, shale floor, sandy mudstone floor”.

3.2.4. Analysis of Numerical Test Results

Summarizing the results of the analysis, it can be found that the depth of the coal seam is one of the main factors affecting the deformation and damage of the floor of the roadway along the open roadway in 302 the working face: with an increase in the depth of the coal seam from 300 m to 500 m, the lateral supporting pressure, the stress of the floor of the roadway, and the amount of the roof and floor of the roadway are all characterized by an increase in the lateral supporting pressure. The floor lithology will affect the deformation and damage of the floor along the open roadway of the 302 working face: under different conditions of floor lithology, the lateral supporting pressure and the floor stress of the roadway are the largest in the case of coarse-grained sandstone as the floor, and the amount of roof and floor movement is the largest in the case of coal as the floor.

4. Integrated Design Methodology of “Roof Cutting and Pressure Relief + Floor Grouting with Bolts”

4.1. Design of Control Scheme

In order to clarify the floor heave control parameters along the hollow roadway of the 302 working face, we compare and analyze the original measures on site (No. O), the floor anchor injection program (No. A), the roof cutting and pressure relief program (No. B), and the comprehensive control program (No. C) and clarify the influence of each control measure on the floor heave of the roadway. The specific parameters are shown in Table 2.

4.2. Analysis of Results of Control Scheme

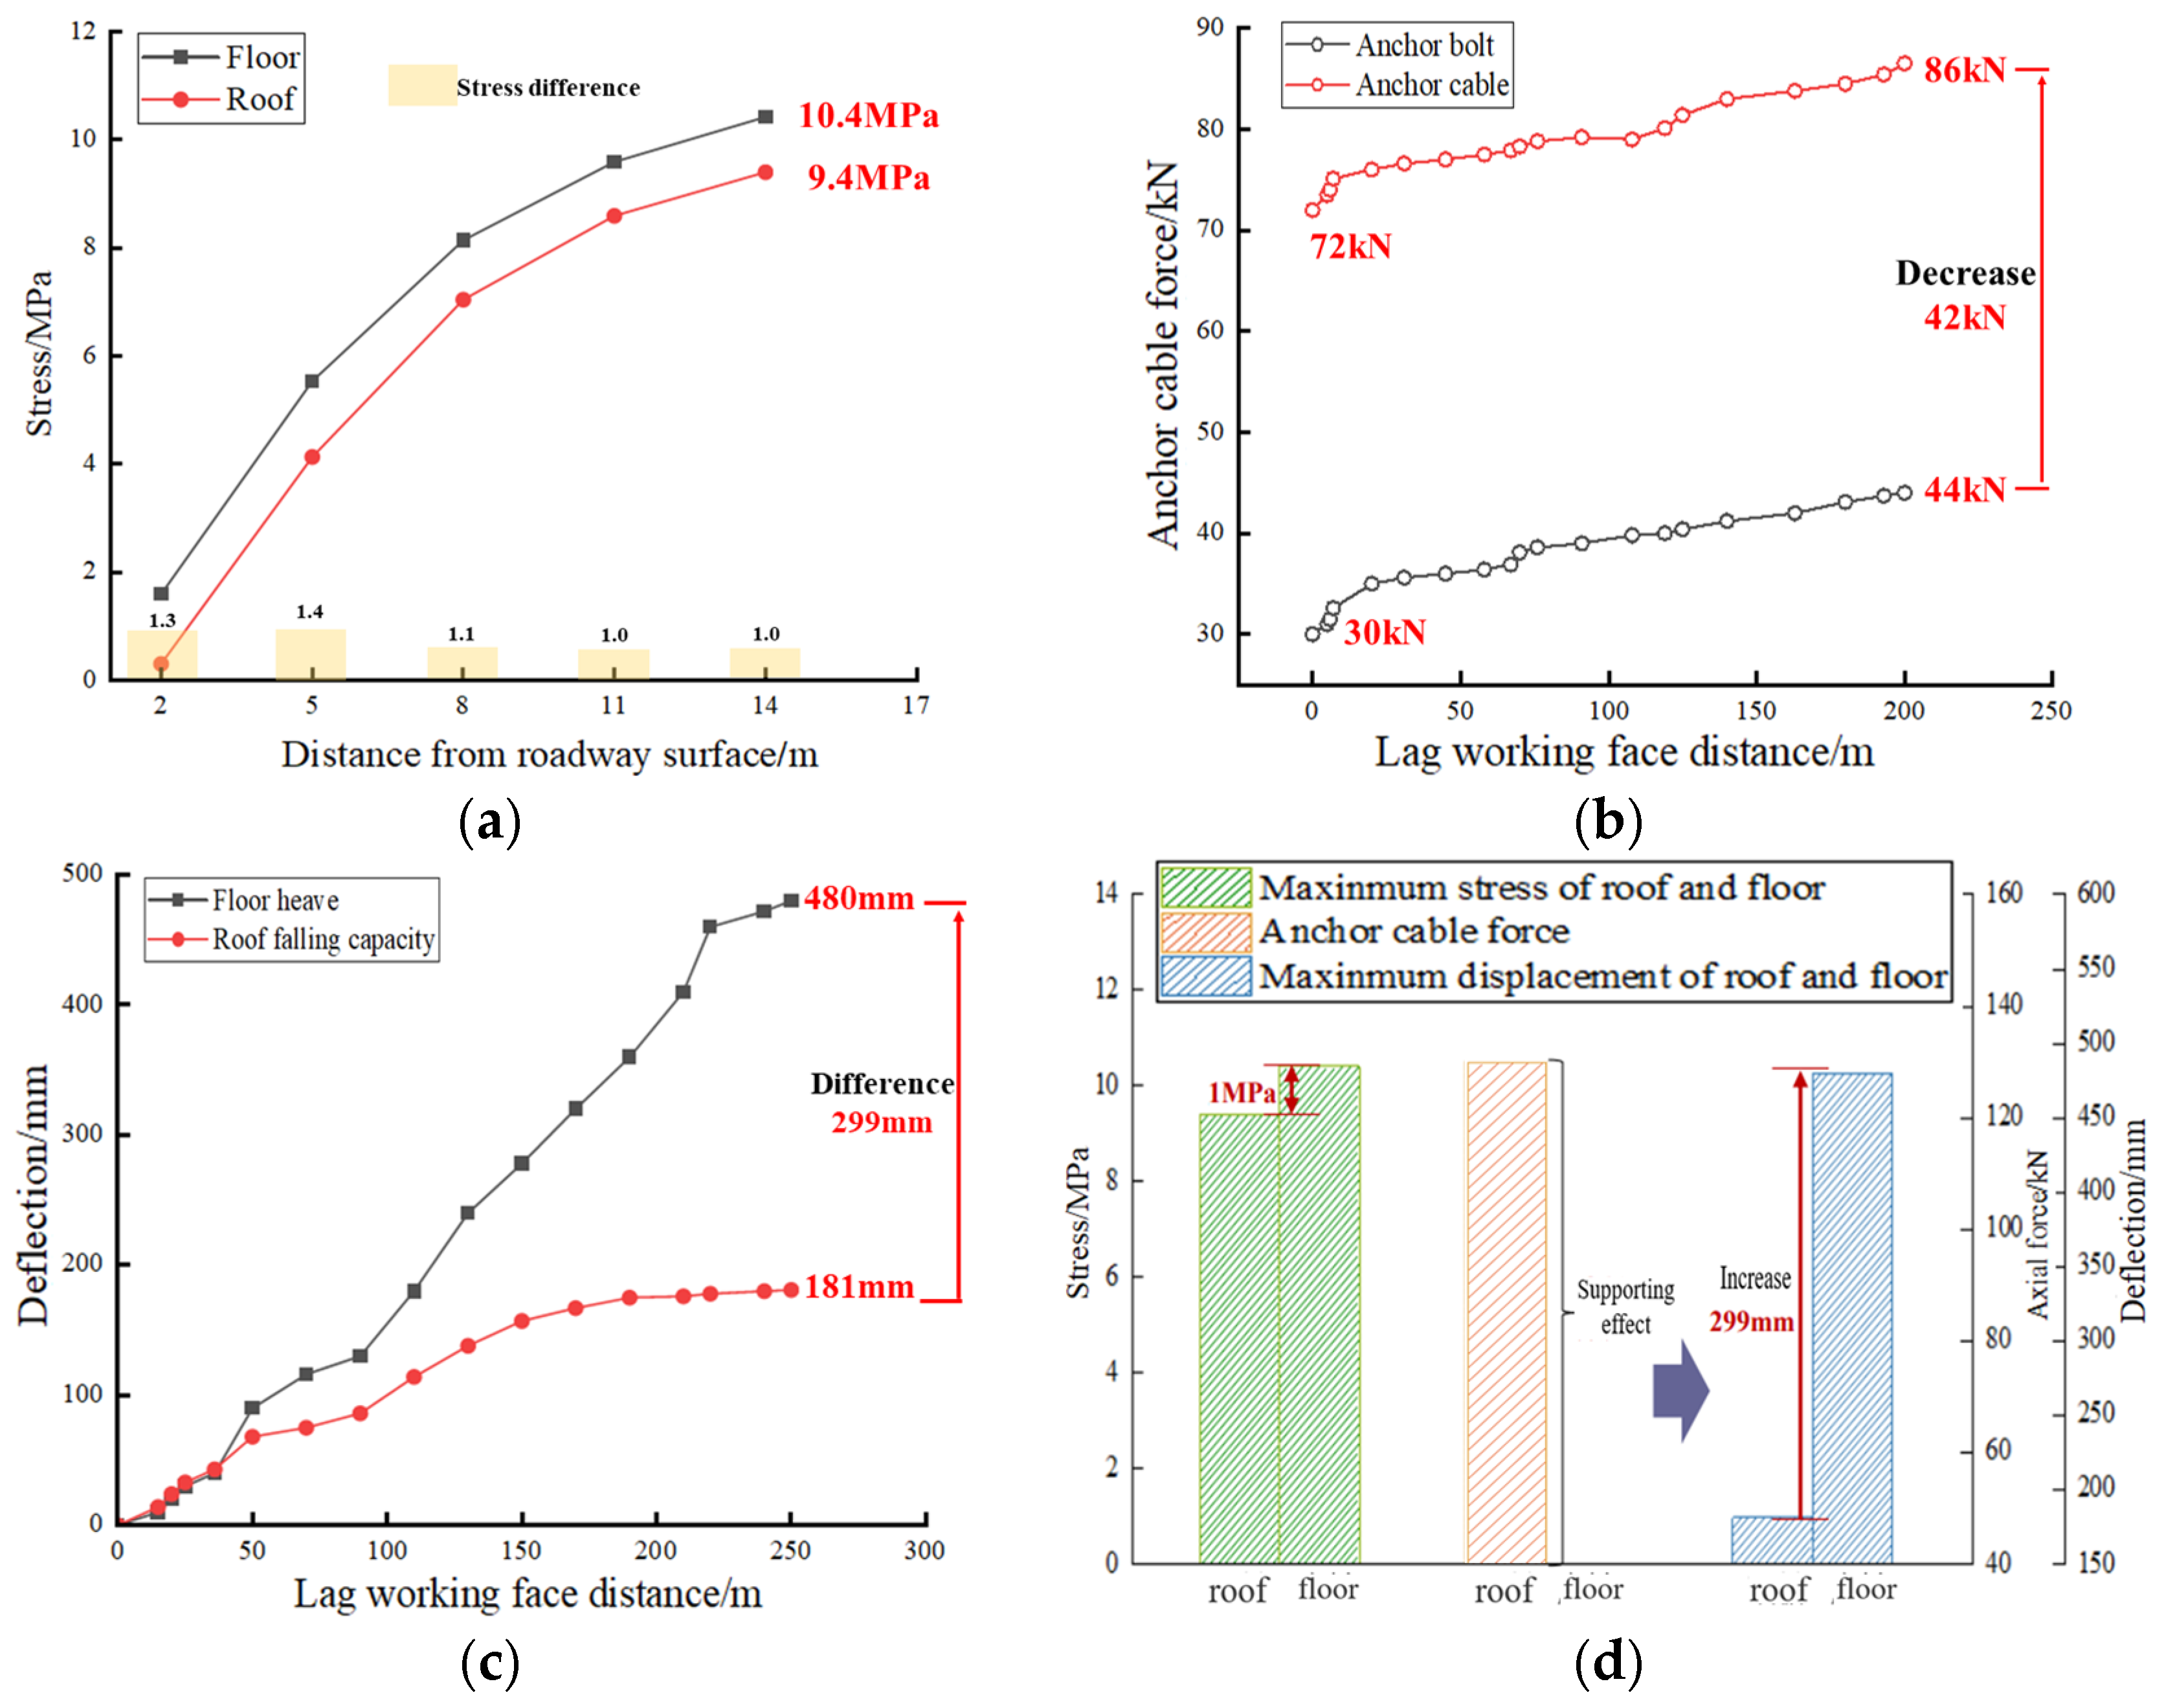
4.2.1. Analysis of Scheme O (Original Support Measures)

This type of scheme analyzes and compares the stress distribution characteristics of the roof and floor, the force changes of the anchor ropes in the roof slabs with the amount of floor heave, and the amount of roof subsidence under the original support conditions in the field. Figure 17 shows the analysis results of the O-type scheme.
(1) Characterization of roof and floor stress distribution: Under the original conditions of the site, the difference in roof and floor stress is maintained within the range of 1.0–1.4 MPa, and the stress difference reaches the maximum of 1.4 MPa at a distance of 5 m from the roadway surface. The roof stress is 10.4 MPa and the floor stress is 9.4 MPa at a distance of 14 m from the roadway surface.
(2) Analysis of roof anchor cable support force: Under the condition of original measures on site, the force of the roof anchor bolt and anchor cable in the range of about 200 m from the lagging working face is 44 kN and 86 kN, respectively, and the force of the anchor cable is 42 kN larger than that of the anchor bolt.
(3) Analysis of the change in floor heave and roof subsidence: Under the conditions of original measures in the field, within the range of 50 m–225 m of the lagging face, both show a rapid growth trend, while within the range of 225 m–250 m of the lagging face, both tend to be stabilized. In the range of 250 m of the lagging face, the maximum amount of floor heave is 480 mm and the amount of roof subsidence is 181 mm, which is a difference of 299 mm.
(4) Comparison results for roof and floor parameters under the original measures: When the difference in roof and floor stresses is close, the roof anchor bolts and anchor cables provide effective support force and control the deformation of the roof, which is manifested in the fact that the amount of floor heave is larger than the amount of roof sinking by 299 mm.

4.2.2. Analysis of Scheme A (Floor Grouting with Bolts)

This kind of scheme is analyzed and compared with the change in anchor support force, floor stress distribution, and floor heave volume under different floor lithology reinforcement coefficients. Figure 18 shows the analysis results of the A-type scheme.
(1) Analysis of anchor support force curve under different coefficients of reinforcement of base-plate lithology: Under the conditions of 1.2 times, 1.4 times, and 1.6 times the reinforcement coefficients of base-plate lithology, the force of base-plate anchors shows an upward trend with an increase in lagging distance from the working face, and the force at the lagging distance of 200 m from the working face is 52 kN, 72 kN, and 91 kN, respectively, which are 38% and 75% higher compared to the anchor with the coefficients of 1.2 times of reinforcement, respectively. Compared with the 1.2 times reinforcement factor anchor, the force is increased by 38.46% and 75%, respectively.
(2) Stress distribution of base plate with different reinforcement coefficients of base-plate lithology: Compared with the original measures in the field, the stress of the base plate with different reinforcement coefficients of base-plate lithology is basically unchanged.
(3) Analysis of the change curve of floor heave under different coefficients of floor lithology strengthening: Under the conditions of the original measures on site and floor lithology strengthening coefficients of 1.2 times, 1.4 times, and 1.6 times, the amount of floor heave in the range of 86 m–223 m of lagging workface shows a rapid growth trend, and in the range of 223 m–250 m of lagging workface, the amount of floor heave tends to be stabilized. With a lagging workface of 250 m, the amount of floor heave is 480 m, 480 m, and 480 m, respectively. At 250 m of lagging face, the amount of floor heave is 480 mm, 407 mm, 371 mm, and 321 mm respectively, and the maximum reduction in floor heave is 33.13% under the conditions that the coefficient of reinforcement of floor lithology is 1.2 times, 1.4 times, and 1.6 times compared with the original measures on site.
(4) Comparison results of different base-plate lithology strengthening coefficients: Under the condition of an unchanged number of anchors, with an increase in the base-plate lithology strengthening coefficient, the stress of the base plate increases gradually; the force of the base-plate anchor support also increases greatly, with a maximum increase of 75%, and the amount of floor heave reduces significantly, with a maximum reduction of 33.13%.

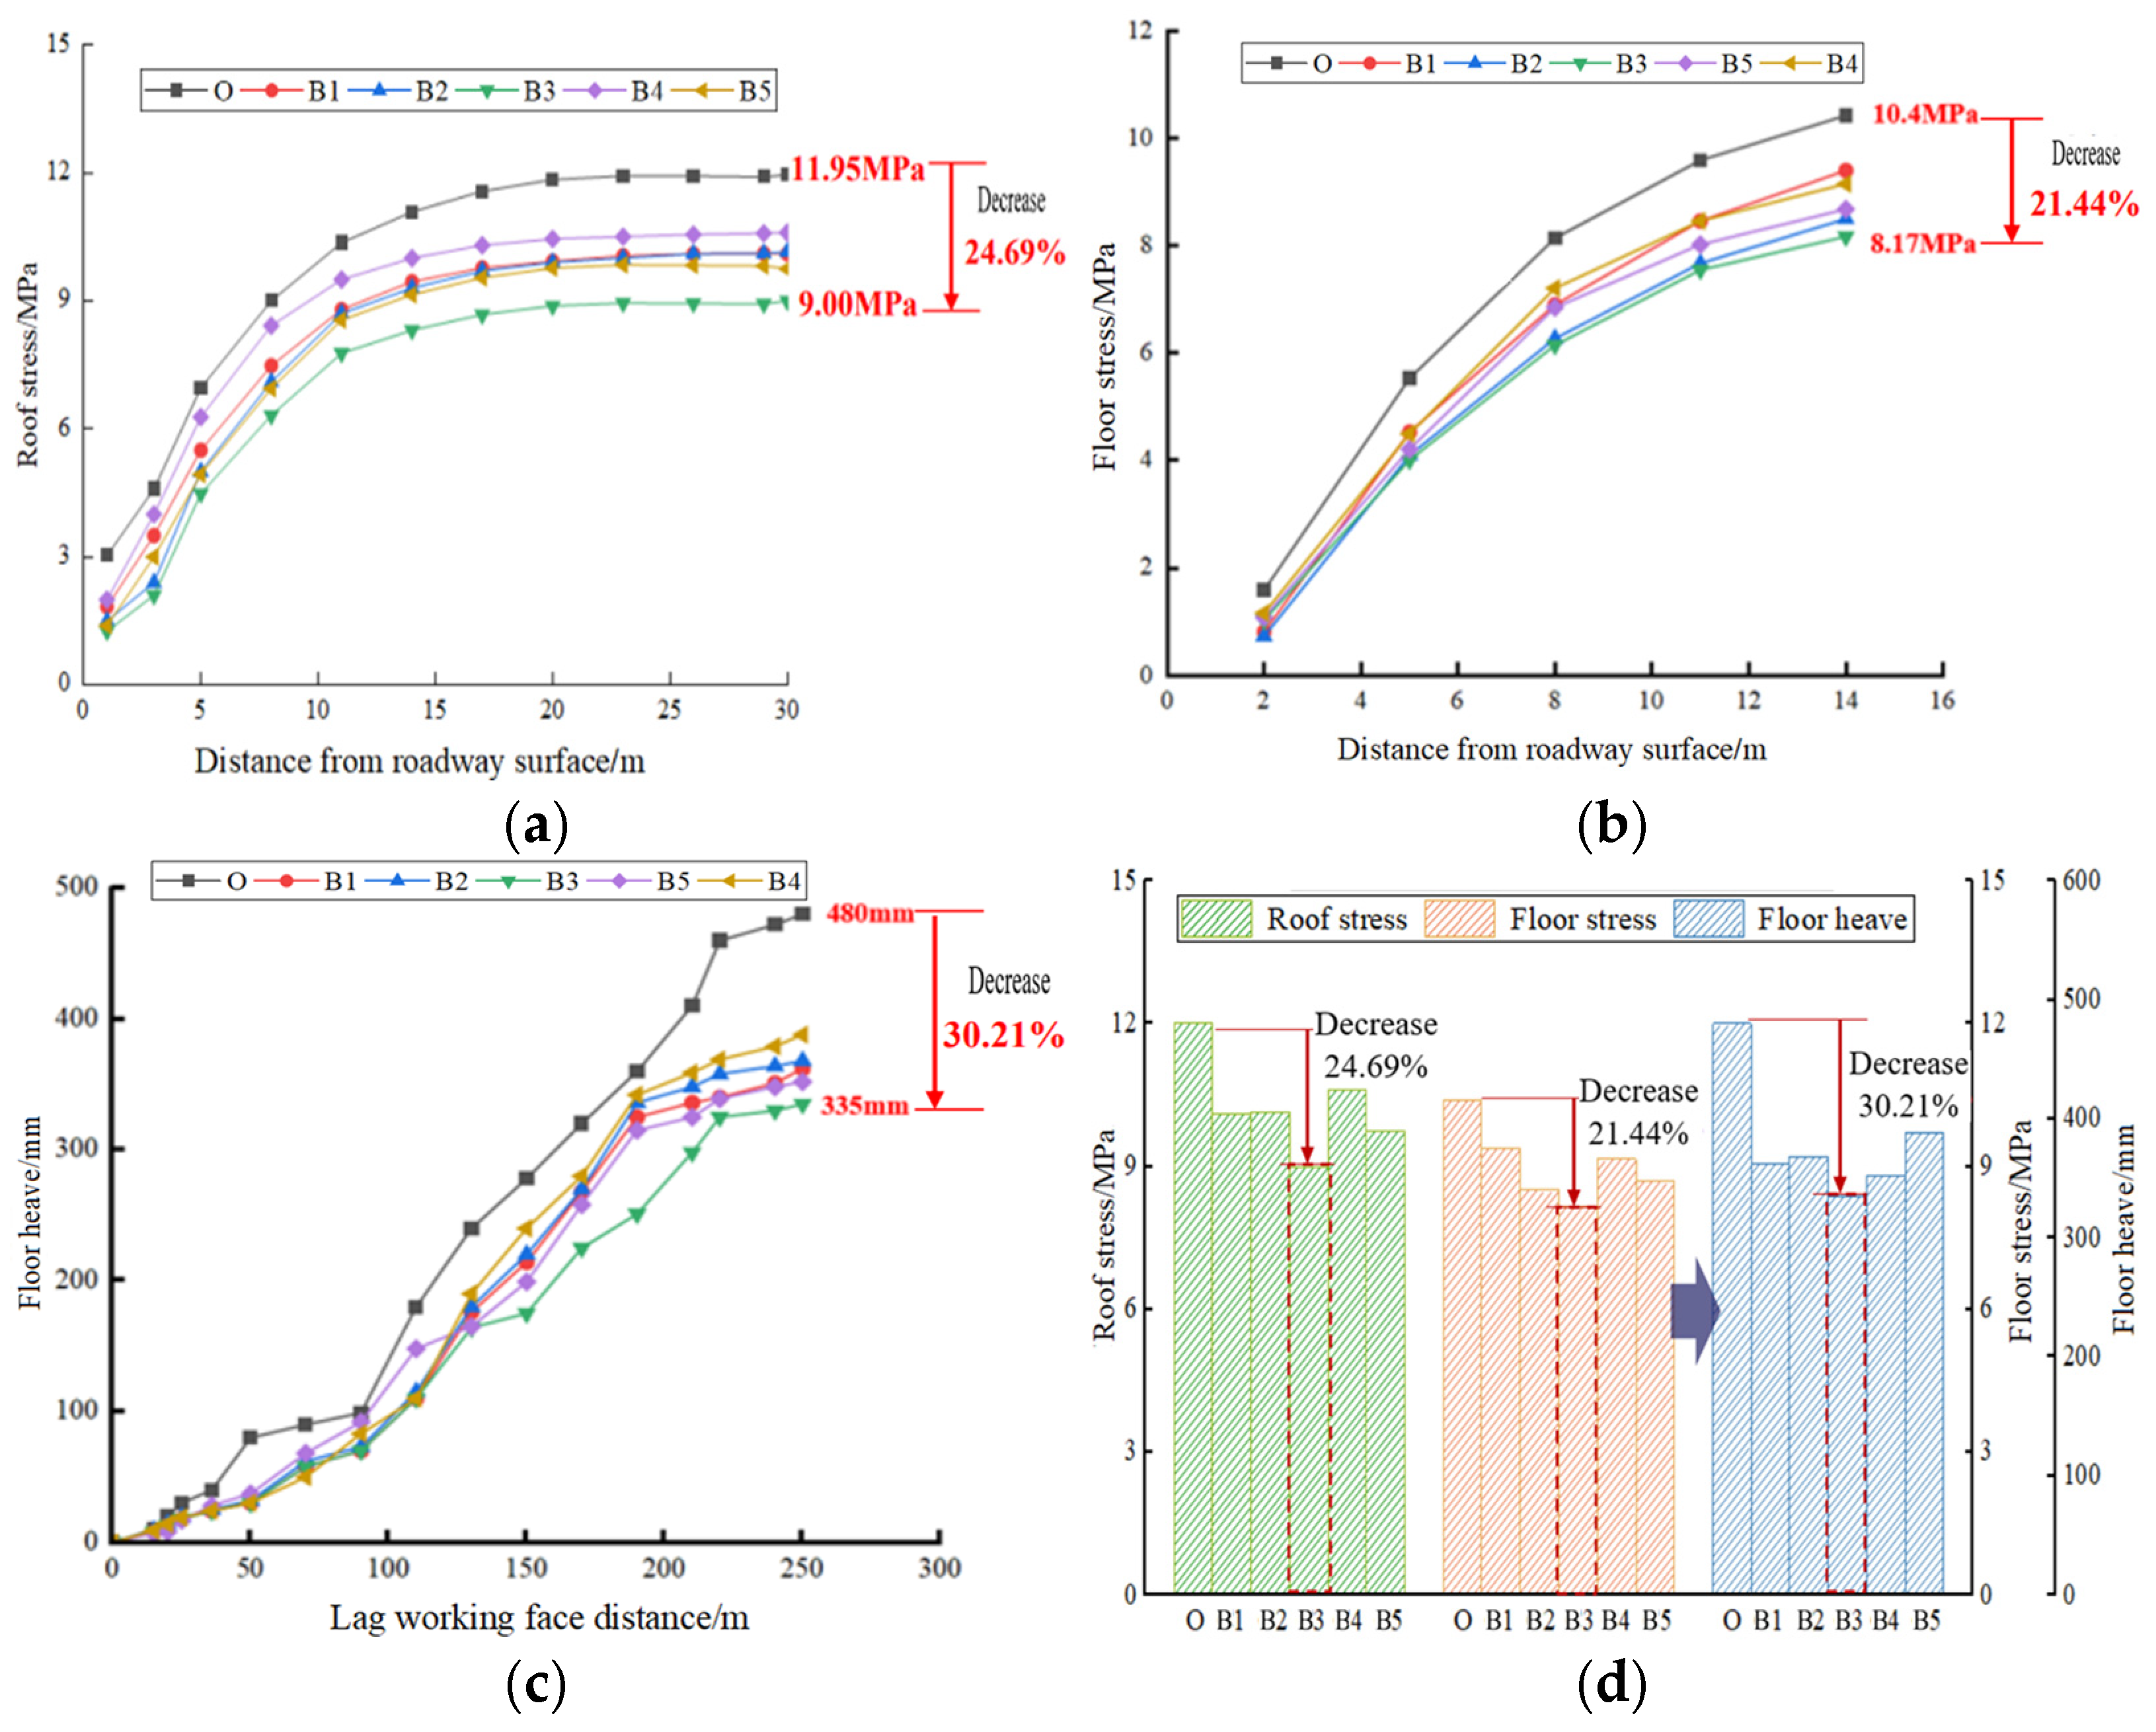
4.2.3. Analysis of Scheme B (Roof Cutting for Pressure Relief)

This type of scheme is analyzed and compared with the stress distribution characteristics of roof sand floors with different roof cutting parameters and a change in floor heave volume with different roof cutting parameters. Figure 19 shows the analysis results of the B-type scheme.
(1) Characterization of roof stress with different roof cutting parameters: Under the conditions of different roof cutting parameters, the roof stress of the roadway is smaller than that under the original measures on site, and the maximum reduction in roof stress is achieved under roof cutting parameters of 15° + 30 m, with a reduction rate of 24.69%.
(2) Characterization of floor stress under different roof cutting parameters: Under the conditions of different roof cutting parameters, the floor stress of the roadway is smaller than that under the original measures on the site, and the reduction in floor stress is the largest under the roof cutting parameter of 15° + 30 m, with a reduction rate of 21.44%.
(3) Analysis of the change curve of the floor heave volume with different roof cutting parameters: Under the conditions of the original measures and roof cutting parameters of 0° + 30 m, 10° + 30 m, 15° + 30 m, 20° + 30 m, and 15° + 20 m on site, the floor heave volume in the range of 50 m–218 m in the lagging face shows a rapid growth trend, and the floor heave volume in the range of 218 m–250 m in the lagging face tends to stabilize. In the lagging face of 250 m, the maximum floor heave amount is 480 mm, the minimum floor heave amount is 335 mm, and the floor heave parameters are 0° + 30 m, 10° + 30 m, 15° + 30 m, 20° + 30 m, and 15° + 20 m compared to the original on-site measures under the condition of floor heave. The amount of the floor heave is reduced by 30.21% at most.
(4) Comparison results of different rock reinforcement coefficients of floor: Comparing different roof cutting angles of 0–20°, the best floor heave control effect is achieved under the condition of 15°. Comparing different cutting heights of 20 m–30 m, under the condition of a cutting height of 30 m, the floor control effect is the best and the amount of floor heave is reduced by 30.21% at most.

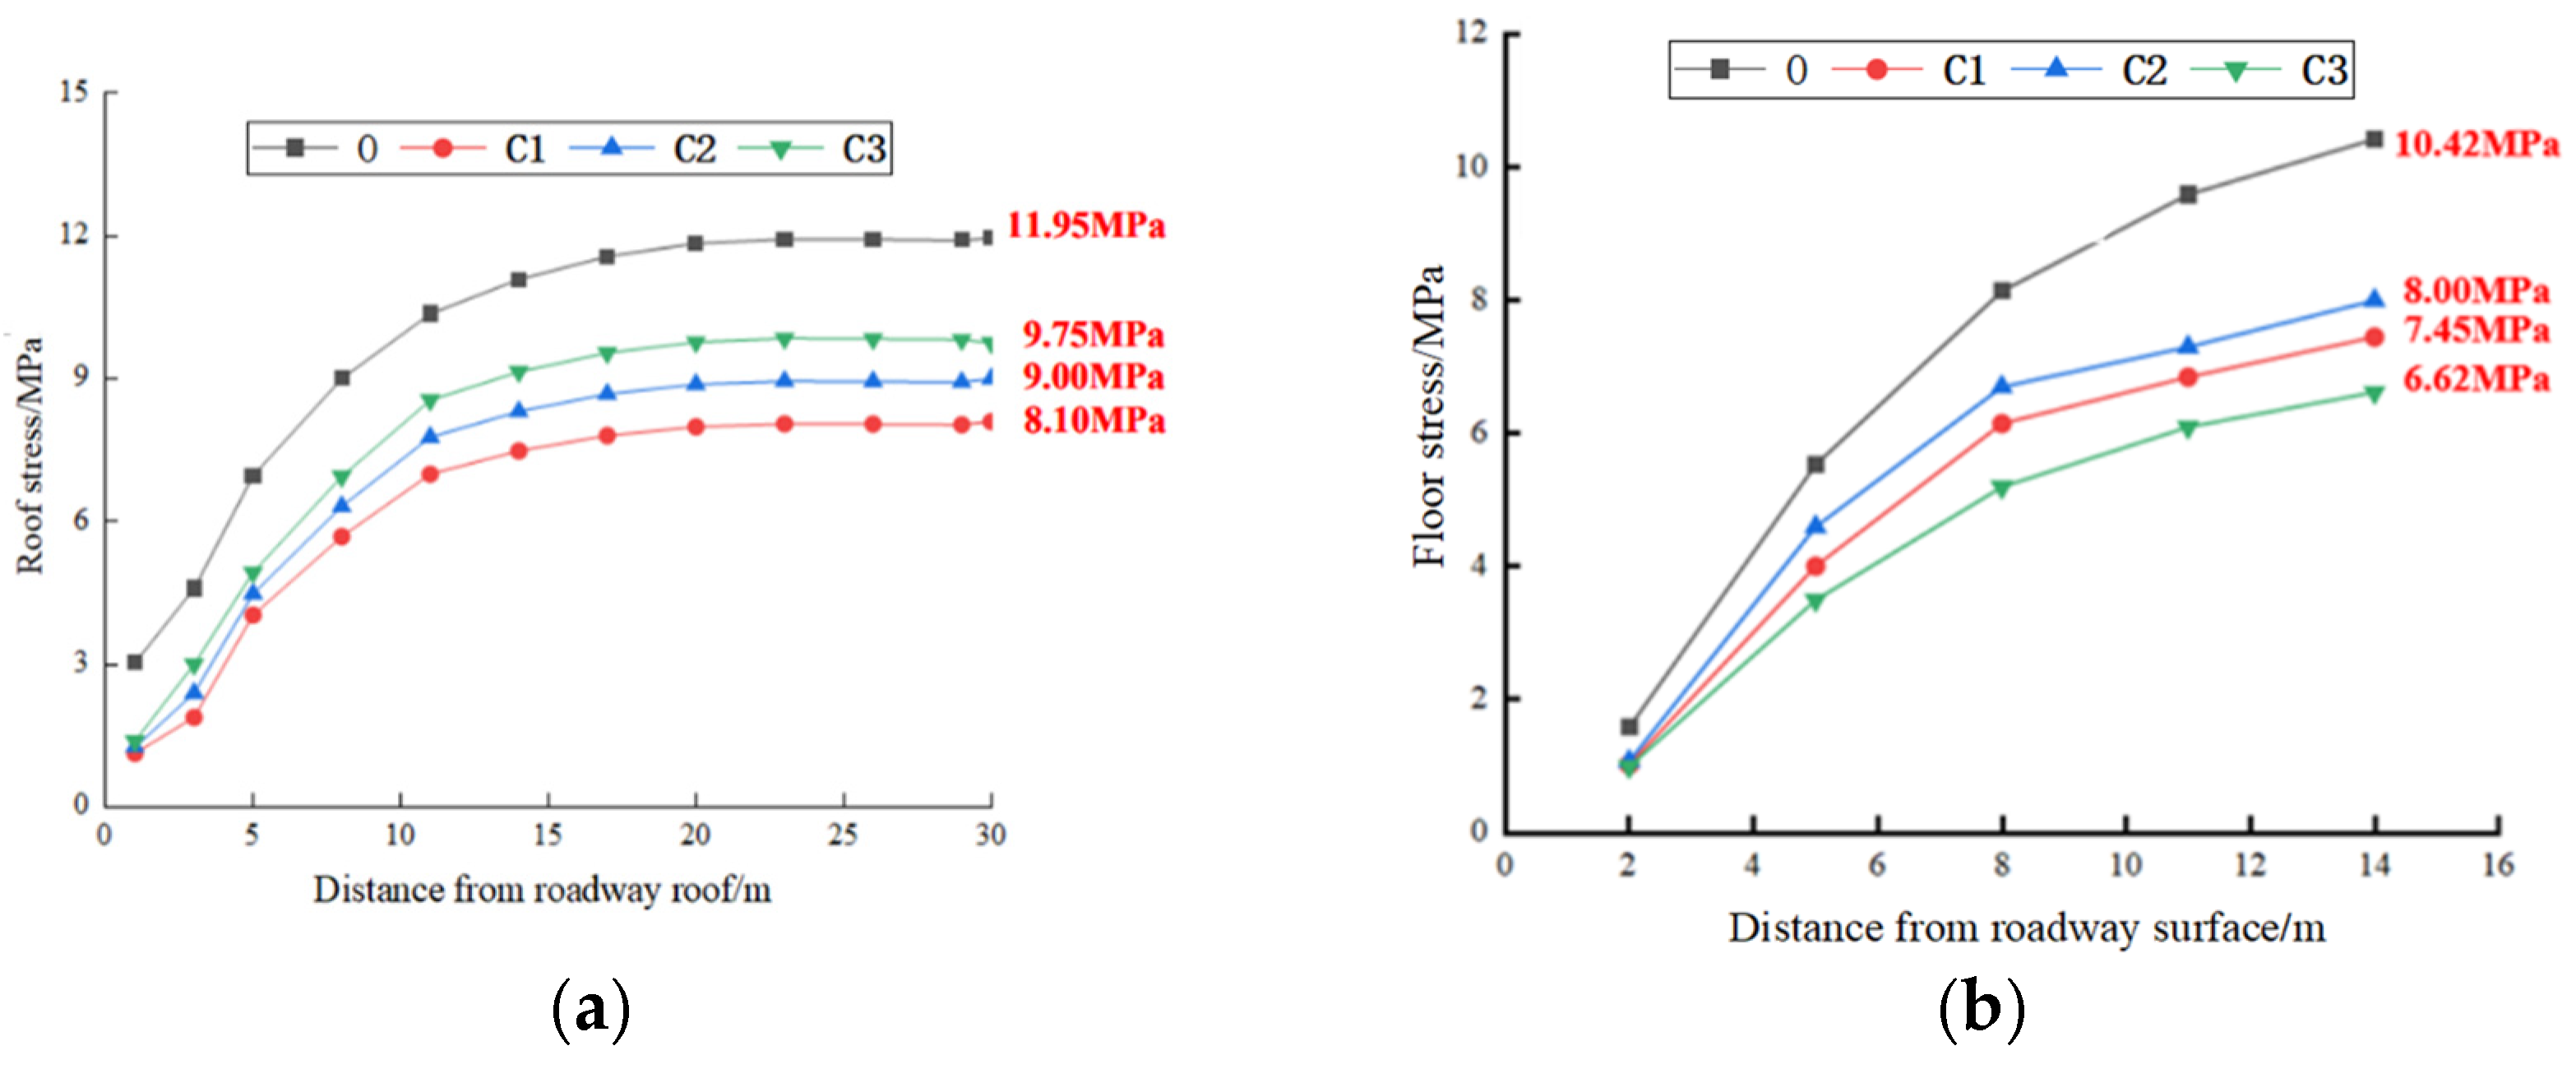
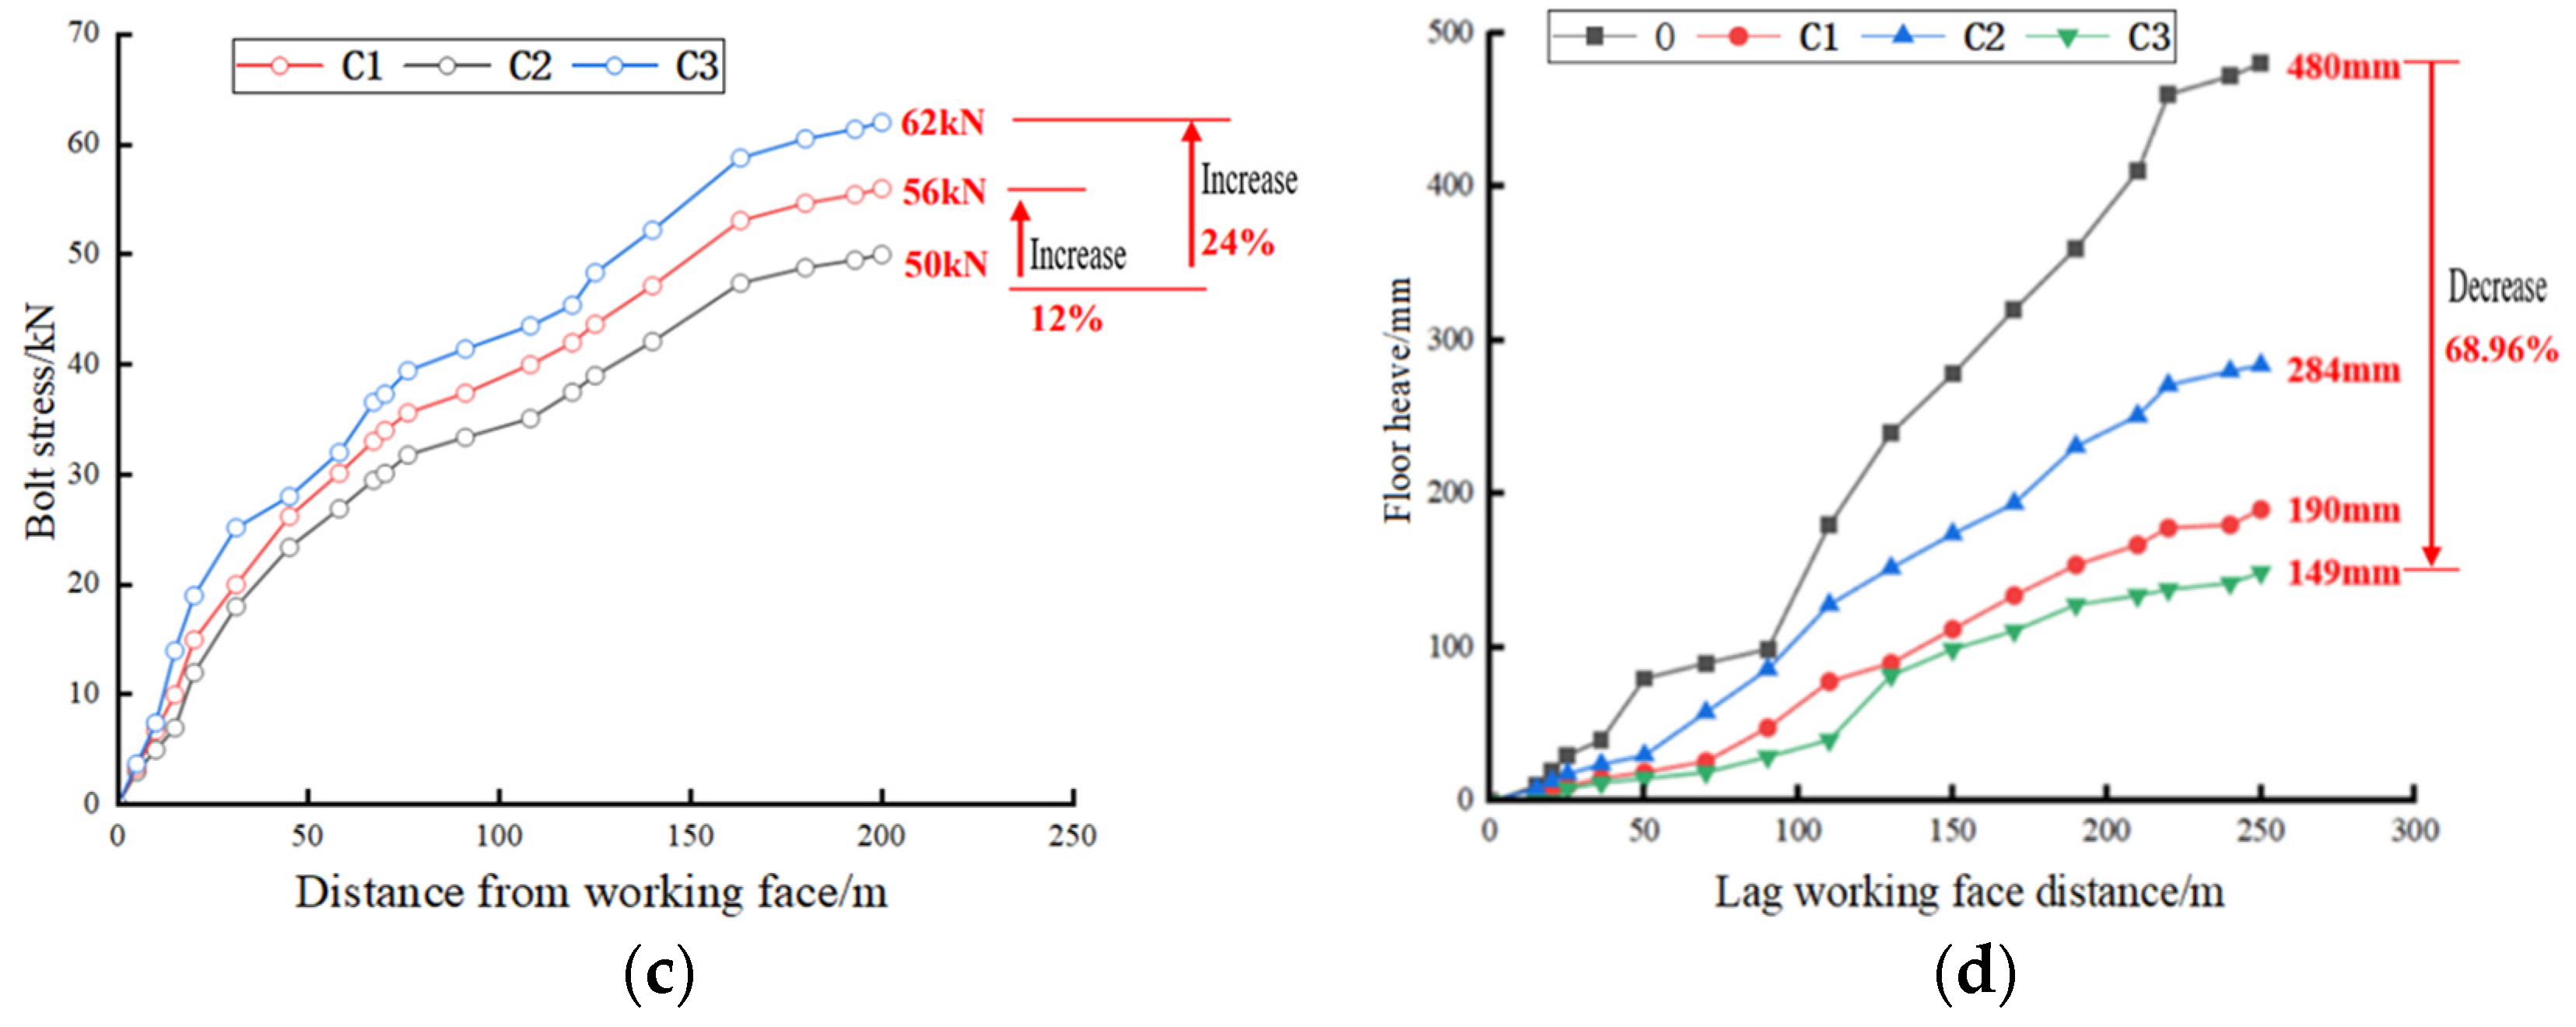
4.2.4. Analysis of Scheme C (Integrated Control Measures)

This type of scheme is analyzed and compared with the stress distribution of the roof and floors of different comprehensive control schemes, the change in anchor support force in the floor of different comprehensive control schemes, and the change in the floor heave volume of different comprehensive control schemes. Figure 20 and Figure 21 show the analysis results for the C-type scheme.
(1) Characterization of roof stress in different comprehensive control schemes: Under the conditions of different comprehensive control schemes, the roof stress of the roadway is smaller than that under the original measures on site, and the roof stress is reduced the most under the comprehensive control scheme of five anchors for the floor and 15° + 30 m for the roof cutting, with a reduction rate of 32.22%.
(2) Characterization of the floor stress under different comprehensive control schemes: Under different comprehensive control schemes, the floor stress of the roadway is smaller than that under the original measures, and the floor stress under the comprehensive control scheme of five bottom anchors and 15° + 30 m roof cutting is reduced the most, with a reduction rate of 36.47%.
(3) Different comprehensive control program floor anchor support force: For two floor anchors with roof cutting of 15° + 20 m, two anchors with roof cutting of 15° + 30 m, and five anchors with roof cutting of 15° + 30 m, the floor anchor force with the lagging distance of the working face shows an upward trend, respectively, as well as with a lagging distance of the working face of 200 m at a force of 56 kN, 50 kN, and 62 kN.
(4) Analysis of the change curve of the floor heave volume under different comprehensive control schemes: Under the conditions of the original measures in the field and two anchor bolts in the floor with 15° + 20 m roof cutting, two anchor bolts with 15° + 30 m roof cutting, and five anchor bolts with 15° + 30 m roof cutting, within the range of 95 m–220 m of lagging working face, the floor heave volume shows a rapid growth trend. Within the range of 220 m–250 m of lagging working face, the floor heave volume tends to stabilize, and the floor heave volume tends to stabilize at the range of 200 m–250 m of lagging working face. In the lagging face of 250 m, the amount of floor heave is 480 mm, 284 mm, 190 mm, and 149 mm, respectively, which is reduced by 68.96% compared with the maximum amount of floor heave under the original conditions of the field measures.
(5) Comparison results analysis of different comprehensive control programs: With the same cutting angle and lithology strengthening factor, the floor heave reduction rate is 40.83% under the condition of a cutting height of 20 m and anchoring two roots; under the condition of a cutting height of 30 m and anchoring two roots and five roots, the floor heave reduction rate is 60.42% and 68.96%, respectively.

4.3. Comparative Results Analysis of Control Schemes

The comparison results of different schemes are summarized in Table 3, and the analysis found the following:
(1) The control effect of single measure: the deformation of floor heave is reduced by about 30% under the condition of the sole use of floor anchor injection, roof cutting, and pressure relief measures.
(2) Combined measures to control the effect: with roof cutting of 15° + 20 m and anchor injection under the condition of two roots, the floor heave reduction rate is 40.83%; with roof cutting of 15° + 30 m and anchor injection under the conditions of two roots and five roots, the floor heave reduction rate is 60.42% and 68.96%, respectively.
(3) Combined with the effect of floor heave control and economic considerations, the floor heave reduction rates are 40.83% and 60.42% under the conditions of roof cutting of 15° + 20/30 m and anchoring two roots, respectively.

4.4. Optimization of Design Parameters for Cooperative Control of Roadway Floor Heave Deformation

Based on the aforementioned test results, in the 302 working face’s main transportation roadway to the coal pillar side direction of roof cutting for pressure relief and in the 302 working face along the empty roadway for the floor anchor injection reinforcement, decompression measures are used, as shown in Figure 22.
On this basis, three optimal floor heave control design schemes are proposed, and the specific design schemes are shown in Table 4, which provides the design basis for the floor heave control of the strong dynamic pressure roadway in Buertai coal mine.

5. Conclusions

This study takes the problem of floor heave along the hollow roadway in the 302 working face of Buertai coal mine in China as the research object and researches the formation mechanism of the floor heave of the roadway under strong dynamic pressure and its control technology through on-site monitoring and numerical simulation system. The main research results are as follows:
(1) The surrounding rock of this strong dynamic pressure roadway is mainly mudstone with a low strength and poor cementation. On-site monitoring shows that the maximum initial incoming pressure value of the main roof of the mine pressure face is 52.3 MPa and the maximum average cycle incoming pressure value of the working face is 51.2 MPa. The distance of mining overshooting influence is 70 m, and the stress reaches the peak in the range of 0–5 m in front of the coal wall of the working face. The distance of mining lateral overshooting influence along the empty roadway is 55 m, and the stress reaches the peak in the lagging working face of about 220 m. Microseismic events are mainly distributed in the range of 443 m in front of the working face and 248 m in the rear, and the maximum energy is mainly distributed 60 m from the roof but mainly concentrated around 40 m from the roof. The height distribution is relatively uniform.
(2) FLAC3D 7.00 software was used to analyze the influence of different coal seam depths and different floor lithologies on the stability of the roadway floor, revealing the floor heave mechanism along the hollow roadway, as follows: ① an increase in coal seam depth (300→500 m) increased the lateral support pressure by 38%, increased the roof and floor approaching quantity by 64%, and intensified the floor plastic damage under the deep, high-stress environment; ② with different floor lithologies, the lateral support pressure of the coarse-grained sandstone floor increased by 38%, and the roof and floor approaching quantity increased by 64%. ③ Considering different rock types of the floor, coarse-grained sandstone floor lateral support pressure and roadway floor stress were the largest, the roof and bottom of the coal floor had the largest amount of displacement, and soft rock floor dominated the development of the floor heave.
(3) According to the actual construction conditions along the open roadway of the 302 working face, this study determined a floor heave synergistic control method of “roof cutting and pressure relief + floor anchor injection”. Based on the numerical simulation results, three optimized design schemes were proposed to ensure the smooth collapse of the key layers in the roof cutting and the effective strengthening of the roadway floor environment, which will provide on-site design parameter guidance for the management of floor heave along the hollow roadway of the 302 working face of the Buertai Mine.

Author Contributions

Conceptualization, C.Z.; Methodology, H.X. and Y.H.; Software, J.W. and K.L.; Validation, K.L.; Formal analysis, A.W.; Investigation, A.W. and J.Z.; Writing—original draft, H.X.; Writing—review & editing, J.W. and J.Z.; Supervision, Y.H.; Funding acquisition, H.X. and C.Z. All authors have read and agreed to the published version of the manuscript.

Funding

This research was funded by National Natural Science Foundation of China (grant numbers 42177130); the China Postdoctoral Science Foundation (grant number 2023M742073); and the Shandong Postdoctora1 Science Foun-dation, China (grant number SDCX-ZG-202303010).

Institutional Review Board Statement

Not applicable.

Informed Consent Statement

Not applicable.

Data Availability Statement

The data that support the findings of this study are available from the corresponding author upon reasonable request. The data are not publicly available due to privacy.

Acknowledgments

The authors are grateful to the editors and the anonymous reviewers for their insightful comments and suggestions.

Conflicts of Interest

The authors declare that they have no known competing financial interests or personal relationships that could have appeared to influence the work reported in this paper.

References

  1. He, M.C. Research progress of deep shaft construction mechanics. J. China Coal Soc. 2021, 46, 726–746. [Google Scholar]
  2. Wang, Q.; Pan, R.; Jiang, B.; Li, S.C.; He, M.C.; Sun, H.B.; Wang, L.; Qin, Q.; Yu, H.C.; Luan, Y.C. Study on failure mechanism of roadway with soft rock in deep coal mine and confined concrete support system. Eng. Fail. Anal. 2017, 81, 155–177. [Google Scholar] [CrossRef]
  3. Wang, Q.; He, M.C.; Yang, J.; Gao, H.K.; Jiang, B.; Yu, H.C. Study of a no-pillar mining technique with automatically formed gob-side entry retaining for longwall mining in coal mines. Int. J. Rock Mech. Min. Sci. 2018, 110, 1–8. [Google Scholar] [CrossRef]
  4. Otton Goth. Prevention of Roadway Floor Heave; Coal Industry Publishing House: Beijing, China, 1985. [Google Scholar]
  5. Investigation of the effects of weak floor conditions on the stability of coal pillars: Rockaway, J D; Stephenson, R W US Bureau of Mines report OFR 12–81, July 1979, 227P. Int. J. Rock Mech. Min. Sci. Geomech. Abstr. 1981, 18, 119. [CrossRef]
  6. Chugh, Y.P.; Caudle, R.D.; Bandopadhay, C. Analysis of soft floor interaction in underground mining at an Illinois basin coal mine. In Design and Performance of Underground Excavations: ISRM Symposium—Cambridge, UK, 3–6 September 1984; Thomas Telford Publishing: London, UK, 1984. [Google Scholar]
  7. Afrouz, A.; Hassani, F.P.; Scoble, M.J. Geotechnical assessment of the bearing capacity of coal mine floors. Int. J. Mining Geol. Eng. 1988, 6, 297–312. [Google Scholar] [CrossRef]
  8. Tang, S.B.; Tang, C.A. Numerical studies on tunnel floor heave in swelling ground under humid conditions. Int. J. Rock Mech. Min. Sci. 2012, 55, 139–150. [Google Scholar] [CrossRef]
  9. Li, Z.X.; Zhang, Y.D.; Ma, Q.; Zheng, Y.; Song, G.Y.; Yan, W.Z.; Zhang, Y.; Lei, H. The floor heave mechanism and control technology of gob-side entry retaining of soft rock floor. Sustainability 2023, 15, 6074. [Google Scholar] [CrossRef]
  10. Zhu, L.; Liu, C.Y.; Gu, W.Z.; Yuan, C.F.; Wu, Y.Y.; Liu, Z.C.; Song, T.Q.; Sheng, F.T. Research on floor heave mechanisms and control technology for deep dynamic pressure roadways. Processes 2023, 11, 467. [Google Scholar] [CrossRef]
  11. Guo, X.X.; Deng, P.H.; Liu, Q.S.; Xu, X.L.; Wang, N.; Jiang, Y.L.; Yu, Y. Progressive fracture and swelling of anisotropic rock masses around deep tunnels: A new floor heave mechanical mechanism. Arab. J. Geosci. 2022, 15, 1325. [Google Scholar] [CrossRef]
  12. Yang, Y.; Li, N. Quantitative Assessment of Rock Burst Risk in Roadway Tunneling Considering Variation of Coal Mass Parameters. J. Appl. Sci. 2024, 14, 8211. [Google Scholar] [CrossRef]
  13. Liu, S.G.; Bai, J.B.; Wang, X.Y.; Wu, B.W.; Wu, W.D. Mechanisms of floor heave in roadways adjacent to a goaf caused by the fracturing of a competent roof and controlling technology. Shock. Vib. 2020, 2020, 5632943. [Google Scholar] [CrossRef]
  14. He, F.L.; Zhai, W.L.; Liu, W.X.; Sun, N.; Song, J.Y.; Zhang, J.L.; Wu, Y.H. Floor Heave Mechanism and Control Technique of Water-Rich Soft-Rock Roadway in Thick Coal Seam. Energy Sci. Eng. 2024, 12, 5316–5327. [Google Scholar] [CrossRef]
  15. Wang, F.Y.; Feng, X.T.; Zhou, Y.Y.; Yang, C.X.; Yu, X.J. The floor heave mechanism of a deep clastic rock tunnel in southwest china: An experimental study based on excavation stress paths. Rock Mech. Rock Eng. 2024, 57, 5575–5594. [Google Scholar] [CrossRef]
  16. Xu, Q.; Li, X.H.; Xia, Z.; Zheng, C.K.; Li, Y.H.; Huang, G. Mechanism and control of floor heave in two entry retained roadways using dense boreholes. Sci. Rep. 2025, 15, 17243. [Google Scholar] [CrossRef] [PubMed]
  17. Gong, H.; Li, D.Y.; Luo, P.K.; Ru, W.K.; Zhang, G.H.; Liu, Y.P. Floor heave mechanism and stiff control technology by I-beam for deep mine roadway. Eng. Fail. Anal. 2025, 175, 109600. [Google Scholar] [CrossRef]
  18. Xiao, T.Q.; Wang, Z.Y.; Liu, F.Y.; Dai, X.L.; Zhao, S.; Yu, Z.H. Study on the mechanism and technology of floor heave control of deep roadway with strong mining pressure. J. Min. Saf. Eng. 2023, 41, 666–676. [Google Scholar]
  19. Zheng, R.; Hao, B.; Shi, C.; Li, T. Study on the Ground Pressure Manifestation Patterns of Roof Cutting and Pressure Relief. J. Appl. Sci. 2025, 15, 6049. [Google Scholar] [CrossRef]
  20. Liu, S.; Liu, H.; Xie, K.; Shan, L.; Xiao, F.; Wang, B.; Wang, Y. Stability Analysis and Support Optimization for a Coal Mine Roadway Subjected to High Horizontal Stress. J. Appl. Sci. 2025, 15, 2276. [Google Scholar] [CrossRef]
  21. Xu, L.Z.; Wei, S.J. Control technology and simulation study of floor heave in high stress soft rock roadway. Geotech. Geol. Eng. 2020, 38, 4045–4058. [Google Scholar] [CrossRef]
  22. He, F.L.; Zhai, W.L.; Xu, X.H.; Song, J.Y.; Li, L.; Lv, K. Study on Mechanism and Control Technology of Asymmetric Floor Heave in a Deep Soft Rock Main Roadway. Geofluids 2022, 2022, 1149000. [Google Scholar] [CrossRef]
  23. Kyle, P.; Joel, B.; Kot, U.; Mark, K. Mitigation of floor heave in West Kentucky Coal Mine. Int. J. Min. Sci. Technol. 2016, 26, 521–525. [Google Scholar] [CrossRef]
  24. Wen, Z.J.; Jing, S.L.; Meng, F.B.; Jiang, J.Y. Control technology for floor heave of Jurassic soft rock in the Erdos Basin of China: A case study. J. Cent. South Univ. 2022, 29, 4051–4065. [Google Scholar] [CrossRef]
  25. Gao, X.X.; Shi, X.Y.; Guo, W.B. Research on floor heave control technology of soft rock roadway. Geol. Explor. 2020, 56, 1087–1095. [Google Scholar]
  26. He, M.C.; Zhang, G.F.; Wang, G.L.; Xu, Y.L.; Wu, C.Z.; Tang, Q.D. Research on mechanism and application to floor heave control of deep gateway. Chin. J. Rock Mech. Eng. 2009, 28, 2593–2598. [Google Scholar]
  27. Fan, R.; Chen, T.; Wang, S.; Jiang, H.; Yin, X. Study on Influencing Factors and Prediction of Tunnel Floor Heave in Gently Inclined Thin-Layered Rock Mass. J. Appl. Sci. 2024, 14, 7701. [Google Scholar] [CrossRef]
  28. Xue, H.J.; Wang, Q.; Jiang, B.; Jiang, Z.H.; Wang, Y.; Huang, Y.B.; He, M.C. Study on the method of pressure relief by roof cutting and absorbing energy in deep coal mines. Bull. Eng. Geol. Environ. 2023, 82, 298. [Google Scholar] [CrossRef]
  29. Jian, S.; Desen, K. Floor Heave Mechanism and Anti-Slide Piles Control Technology in Deep and Large-Span Chamber. J. Appl. Sci. 2021, 11, 4576. [Google Scholar]
  30. Huang, Y.B.; Zhang, Y.C.; Xue, H.J.; Tian, H.D.; Li, Y.Y. The Bearing Performance and Sectional Design Method of Yielding U-Shaped Steel Support. Appl. Sci. 2025, 15, 3203. [Google Scholar] [CrossRef]
Figure 1. The 302 working face layout and drill hole histograms.
Applsci 15 08125 g001
Figure 2. The 302 working face layout of monitoring instruments.
Applsci 15 08125 g002
Figure 3. The 302 gob-side roadway support section plan.
Applsci 15 08125 g003
Figure 4. Graphs analyzing on-site mine pressure monitoring dat.
Applsci 15 08125 g004
Figure 5. The 302 working face 70# support with the working face mining pressure change chart.
Applsci 15 08125 g005
Figure 6. The 302 working face two lanes of over-support pressure and gob-side roadway lateral support pressure variation graph.
Applsci 15 08125 g006
Figure 7. The 302 working face microseismic event energy variation map.
Applsci 15 08125 g007
Figure 8. Numerical model.
Applsci 15 08125 g008
Figure 9. Cloud map of stress distribution at different coal seam depths: (a) vertical stress distribution and (b) horizontal stress distribution.
Applsci 15 08125 g009
Figure 10. Lateral support pressure curves for different coal seam depths.
Applsci 15 08125 g010
Figure 11. Stress variation curves of roadway floor with different coal seam depths.
Applsci 15 08125 g011
Figure 12. Change curves of roof and floor movement in different coal seam depths.
Applsci 15 08125 g012
Figure 13. Cloud map of stress distribution at different floor lithologies: (a) vertical stress distribution and (b) horizontal stress distribution.
Applsci 15 08125 g013aApplsci 15 08125 g013b
Figure 14. Lateral support pressure curves for different floor lithologies.
Applsci 15 08125 g014
Figure 15. Stress variation curves of roadway floor with different floor lithologies.
Applsci 15 08125 g015
Figure 16. Change curves of roof and floor movement with different floor lithologies.
Applsci 15 08125 g016
Figure 17. Analysis of results for scheme O: (a) stress distribution characteristics of roof and floor roadway; (b) force diagram of roof anchor cable support; (c) change curve of floor heave and roof subsidence; and (d) comparison results of roof and floor roadway parameters under original measure conditions.
Applsci 15 08125 g017
Figure 18. Analysis of results for scheme A: (a) force curves of anchor support with different reinforcement coefficients of floor lithology; (b) floor stress distribution with different reinforcement coefficients of floor lithology; (c) variation curves of floor heave with different reinforcement coefficients of floor lithology; and (d) comparison results of reinforcement coefficients for different floor lithology.
Applsci 15 08125 g018
Figure 19. Analysis of results for scheme B: (a) stress characteristics of the roof with different roof cutting parameters; (b) stress characteristics of the floor with different roof cutting parameter; (c) variation curves of floor heave for different roof cutting parameters; and (d) comparison results of different roof cutting parameters.
Applsci 15 08125 g019
Figure 20. Analysis of results for scheme C: (a) stress characteristics of the roof with different integrated control schemes; (b) stress characteristics of the floor with different integrated control schemes; (c) forces on floor anchor support with different integrated control schemes; and (d) variation curves of floor heave for different integrated control schemes.
Applsci 15 08125 g020aApplsci 15 08125 g020b
Figure 21. Comparison results of different integrated control schemes.
Applsci 15 08125 g021
Figure 22. 302 working face cooperative control measures.
Applsci 15 08125 g022
Table 1. Mechanical parameters of the roadway enclosure.
LithologyDensity
/(kg·m−3)
Bulk
Modulus
/GPa
Shear
Modulus
/MPa
Cohesion
/MPa
Internal Friction
Angle/(°)
Tensile Strength
/MPa
Fine mudstone25001.950.732.10250.27
Medium sandstone22003.111.127.4433.20.71
Sandy mudstone23502.231.212.25280.53
Coal seam14001.310.451.11200.41
Fine-grained sandstone26003.431.585.92331.73
Table 2. Detailed parameter for different control schemes.
SchemeNo.Specific Parameters
Original support measures (Comparison group)O
Floor grouting anchorage strengthA11.2 times
A21.4 times
A31.6 times
Roof cutting for
pressure relief
B10° + 30 m
B210° + 30 m
B315° + 30 m
B420° + 30 m
B515° + 20 m
Integrated control measuresC1Two bolts, roof cutting 15° + 20 m
C2Two bolts, roof cutting 15° + 30 m
C3Five bolts, roof cutting 15° + 30 m
Table 3. Summary of results of comparison of different scenarios.
No.Specific
Parameters
Rate of Reduction of Maximum Support PressureBase-Plate Support ForceReduction Rate of Substrate StressReduction Rate of Floor Heave Deformation
Scheme O48.9 MPa0 kN10.4 MPa480 mm
Scheme A1.2 times12.7%52 kN−25.0%15.21%
1.4 times12.8%72 kN−50.0%22.71%
1.6 times13.0%91 kN−68.8%33.13%
Scheme B0° + 30 m20.5%0 kN10.1%24.50%
10° + 30 m23.1%0 kN12.0%23.33%
15° + 30 m27.7%0 kN21.4%30.21%
20° + 30 m24.4%0 kN21.4%26.67%
15° + 20 m22.3%0 kN16.5%19.17%
Scheme CTwo bolts, 15° + 20 m31.4%50 kN23.23%40.83%
Two bolts, 15° + 30 m35.5%56 kN28.50%60.42%
Five bolts, 15° + 30 m34.9%62 kN36.46%68.96%
Table 4. Optimized design schemes.
No.Parameters of Roof Cutting
for Pressure Relief
Parameters of Floor Grouting
with Bolts
Scheme 1Height 30 m, 15° dip
Apertures 153 mm
Orifice distance 0.5 m
Floor corner two bolts
Model Ø22 × 2500 mm
Row spacing 1.5 m
Scheme 2Height 30 m, 15° dip
Apertures 94 mm
Orifice distance 0.5 m
Floor corner two bolts
Model Ø22 × 2500 mm
Row spacing 2.0 m
Scheme 3Height 30 m, 15° dip
Apertures 94 mm
Orifice distance 1.0 m
Floor corner two bolts
Model Ø22 × 2500 mm
Row spacing 2.0 m
Disclaimer/Publisher’s Note: The statements, opinions and data contained in all publications are solely those of the individual author(s) and contributor(s) and not of MDPI and/or the editor(s). MDPI and/or the editor(s) disclaim responsibility for any injury to people or property resulting from any ideas, methods, instructions or products referred to in the content.

