
A Systematic Analysis of Influencing Factors on Wind Resilience in a Coastal Historical District of China

 , ,
, ,  ,
,
Abstract
1. Introduction
2. Methodology
2.1. IDEMATEL Method
2.1.1. Establish a Set of System Influencing Factors
2.1.2. Construct a Comprehensive Impact Matrix
2.1.3. Calculate the Centrality Degree and Causation Degree
2.2. ISM Method
2.2.1. Determine the Reachable Matrix
2.2.2. Hierarchical Division
2.3. MICMAC Model
2.3.1. Calculate the Dependency and Driving Force
2.3.2. Draw Dependency and Driving Force Analysis Diagrams
2.4. Case Study
3. Results
3.1. Results of IDEMATEL
3.1.1. Results of Constructing the Influencing Factor Set
3.1.2. Calculate the Comprehensive Influence Matrix
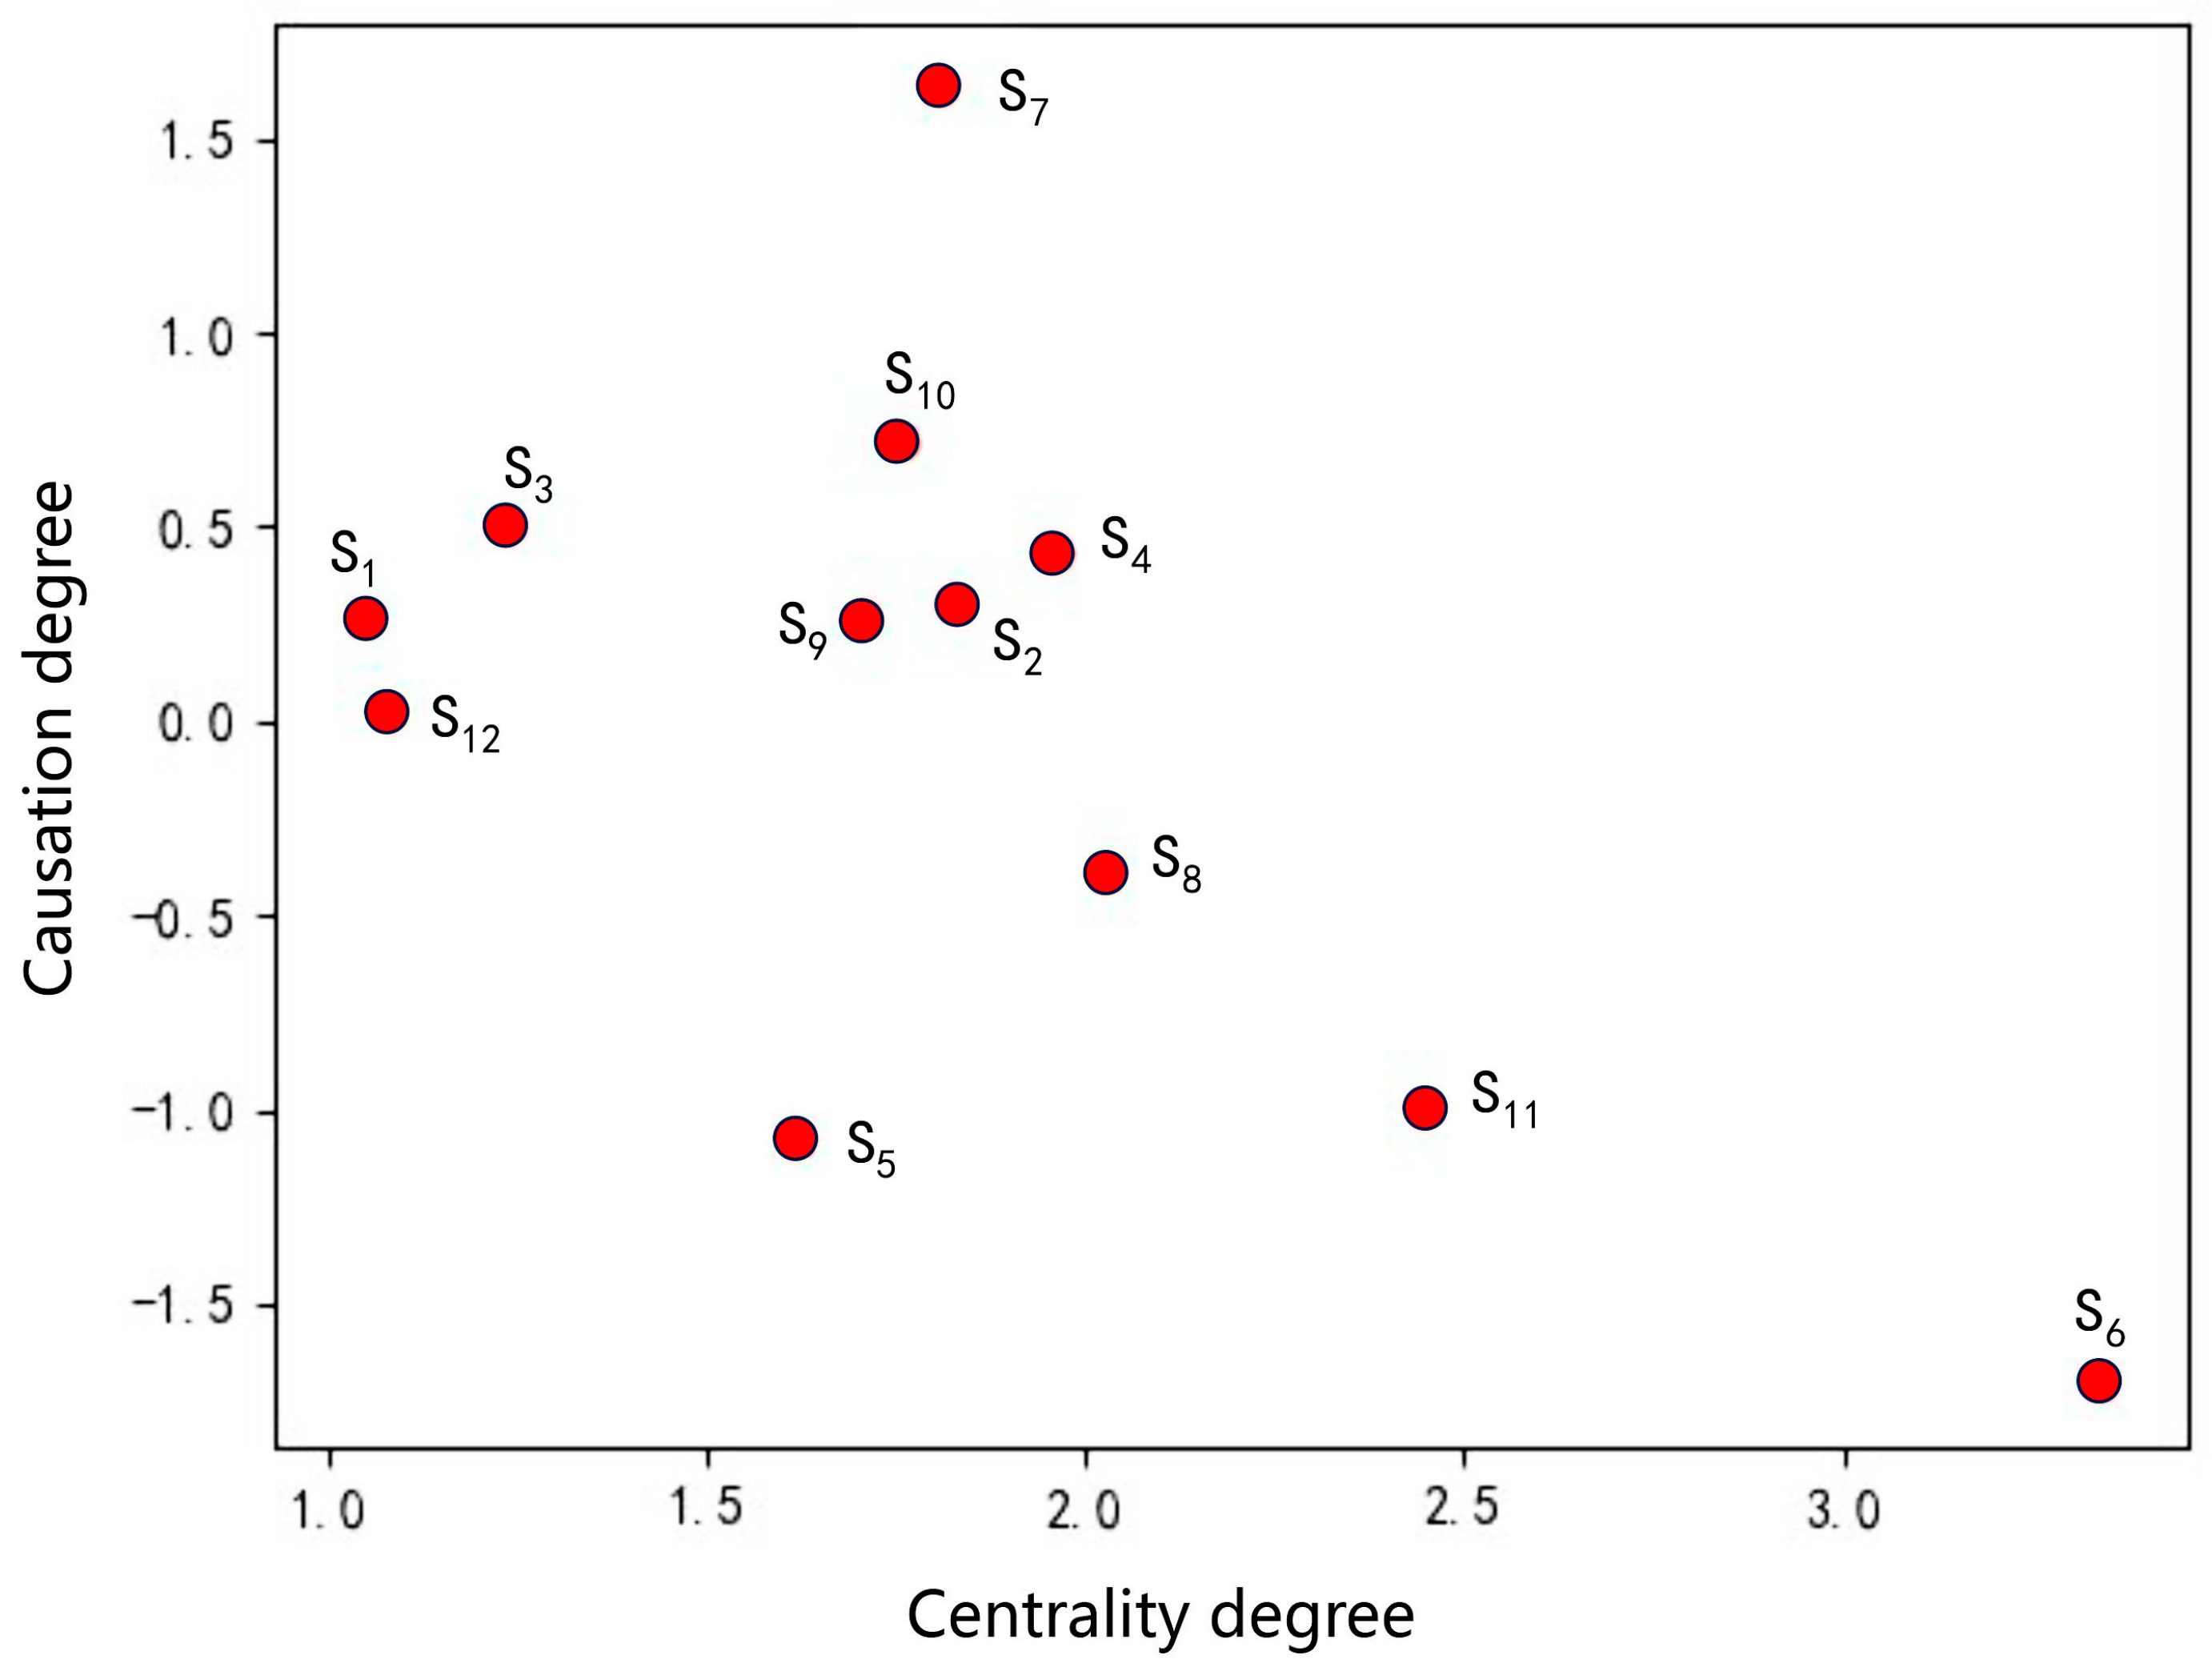
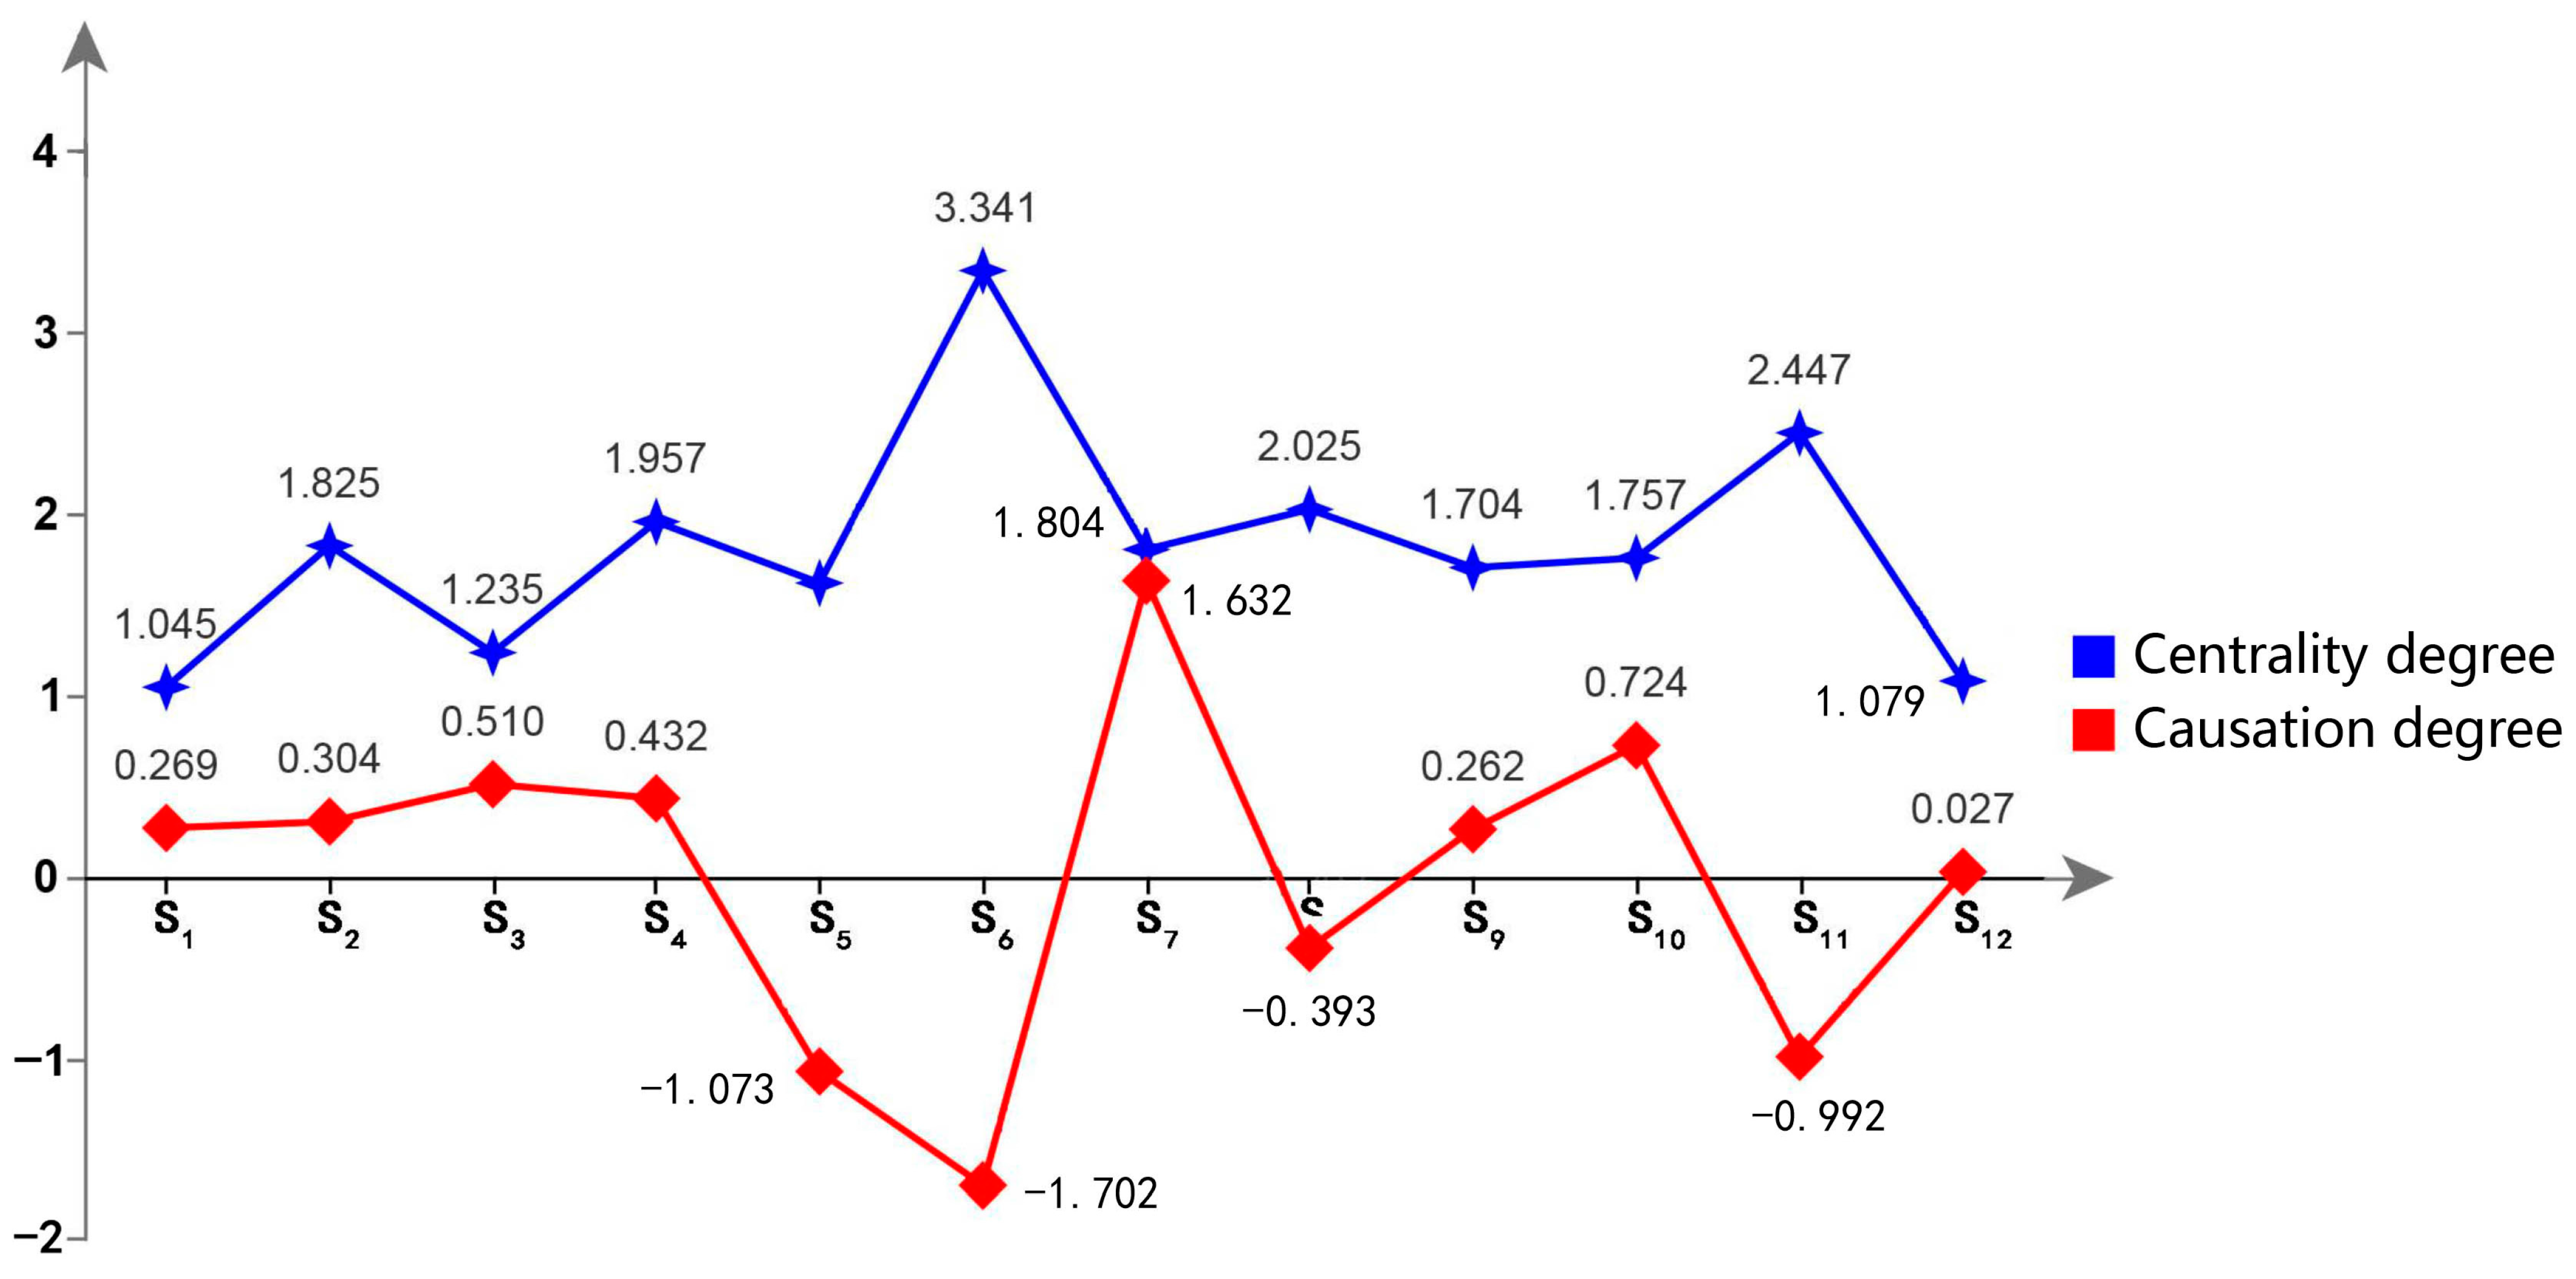
3.1.3. The Results of the Centrality and Causation Degree
3.2. Results of ISM
3.2.1. Calculate the Reachable Matrix
3.2.2. Determine the Hierarchical Division
3.3. MICMAC Results
3.3.1. Results of Dependence Degree and Driving Force
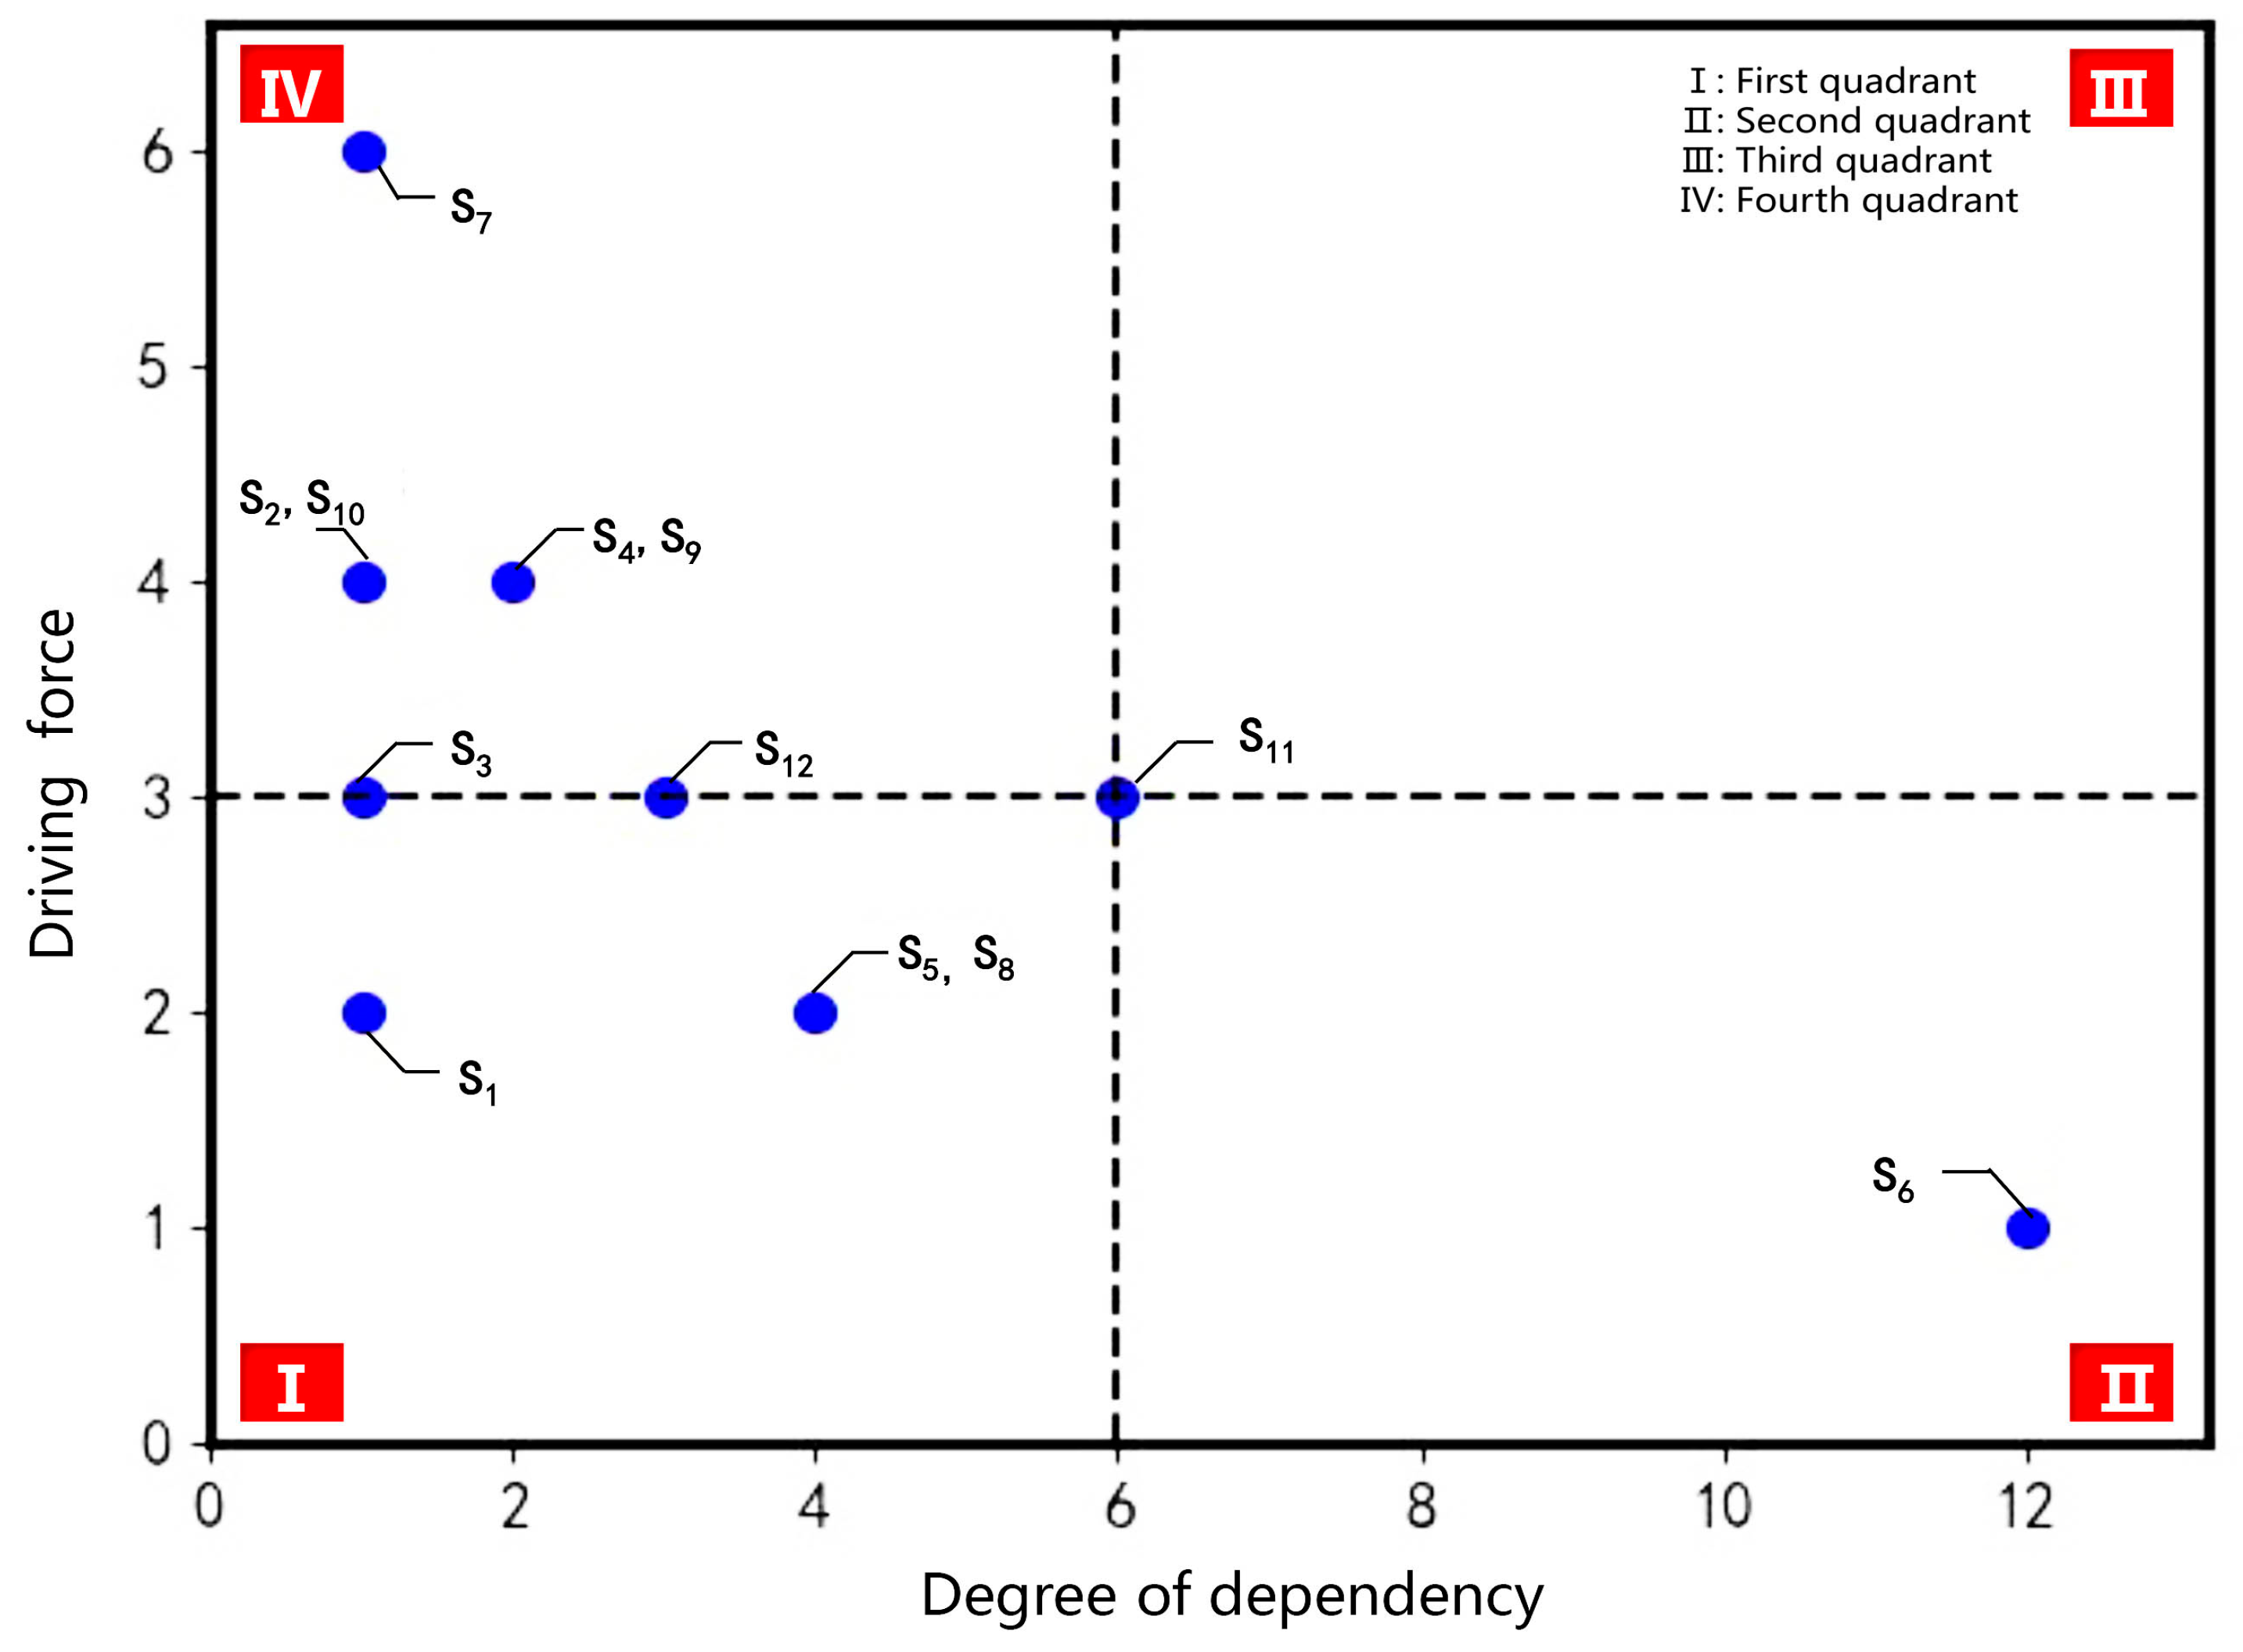
3.3.2. Dependence Degree–Driving Force Analysis Diagram
4. Discussion
5. Conclusions
- (1)
- The causal factors that rank high in centrality are primarily causal factors, with most falling under the categories of building level and typhoon characteristics. The centrality of windproof design (S6) ranks first, indicating that this factor occupies a core position at the building level and exerts significant influence on the entire system. Therefore, the internal structure of the building should be periodically inspected and reinforced on a daily basis, and building materials with wind-resistant properties should be used when reinforcing and repairing the exterior of the building. The centrality of hazard investigation (S11) ranks second, belonging to the emergency management level, which highlights its significant influence on the wind resilience influencing factor system of China’s coastal historical districts. Therefore, it is particularly important to establish a special patrol system for hidden dangers in historical districts. The centrality rankings of typhoon direction (S8) and architectural composition (S4) are third and fourth, respectively, indicating that both factors are significant influencers of the wind resilience in China’s coastal historical districts, with typhoon direction (S8) belonging to typhoon characteristics and architectural composition (S4) to the building level. The causal factors primarily include typhoon level (S7), emergency plan (S10), block direction (S3), architectural composition (S4), block form (S2), block density (S1), typhoon wind speed (S9), and safety education (S12). Among these, block direction (S3), block form (S2), and block density (S1) fall under the block level, indicating that the block level significantly influences the wind resilience influencing factor system of China’s coastal historical districts. Therefore, wind tunnel experiments can be conducted for simulation at the block level, and the density and layout of the block can be optimized based on the simulation results to improve the wind resistance of the district.
- (2)
- The 12 influencing factors affecting the wind resilience of China’s coastal historical districts are categorized into five distinct layers. The lower-level influencing factors are typically independent factors, the middle-level factors are mainly spontaneous and linkage factors, while the upper-level factors are generally dependent factors. The influencing factors in the fifth layer are block form (S2), typhoon level (S7), and emergency plan (S10). The three factors in the fifth layer exhibit greater driving force and are the most fundamental and important influencing factors in the system. The influencing factors in the fourth layer include architectural composition (S4), typhoon wind speed (S9), and safety education (S12). The driving force of the factors in the fourth layer is slightly greater than their dependence, indicating their strong connecting role. The influencing factors in the third layer are block direction (S3) and hazard investigation (S11). The driving force of the factors in the third layer is slightly greater than their dependence, positioning them in the middle of the multi-layer hierarchical structure model. This allows them to effectively connect the relationships between the lower and upper influencing factors. The influencing factors in the second layer are block density (S1), building structure (S5), and typhoon direction (S8). The driving force of the factors in the second layer is less than or equal to their dependence, meaning they directly influence the surface factors. The influencing factor in the first layer is windproof design (S6), which has high dependence and is the most susceptible to external influences in the system.
- (3)
- The building level and typhoon characteristics play a crucial leading role in the wind-resilience-influencing factor system of China’s coastal historical districts. Additionally, the block level and emergency management exert a significant influence on this system. The key influencing factor at the block level is block form (S2), at the building level is architectural composition (S4), at the typhoon characteristics level is typhoon level (S7), and at the emergency management level is emergency plan (S10). To enhance the wind resilience of coastal historical districts, it is crucial to focus on the key influencing factors at the block level (block form), building level (architectural composition), typhoon characteristics (typhoon level), and emergency management (emergency plan).
Author Contributions
Funding
Institutional Review Board Statement
Informed Consent Statement
Data Availability Statement
Acknowledgments
Conflicts of Interest
Appendix A. Questionnaire on Factors Affecting Wind Resilience of China’s Coastal Historic Districts
- Dear experts:

| Serial Number | Influencing Factors | Modification Suggestions |
|---|---|---|
| 1 | Windproof design | |
| 2 | Block form | |
| 3 | Building Structure | |
| 4 | Typhoon level | |
| 5 | Emergency Plan | |
| 6 | Typhoon wind speed | |
| 7 | Architectural composition | |
| 8 | Typhoon direction | |
| 9 | Strong typhoon | |
| 10 | Block density | |
| 11 | Block direction | |
| 12 | Hidden danger identification | |
| 13 | Resilience Concept | |
| 14 | Safety Education | |
| 15 | Impact intensity | |
| 16 | Preventive protection | |
| 17 | Risk assessment | |
| 18 | Protection and renewal | |
| 19 | Hazard investigation | |
| 20 | Coastal cities | |
| If you have other comments, please leave a message here: | ||
Appendix B. Importance Evaluation of Indices Affecting Wind Resilience of China’s Coastal Historical Districts
- Dear experts:
| Evaluation Indicators | Expert Rating | ||||
|---|---|---|---|---|---|
| 1 | 2 | 3 | 4 | 5 | |
| Windproof design | |||||
| Block form | |||||
| Building Structure | |||||
| Typhoon level | |||||
| Emergency Plan | |||||
| Typhoon wind speed | |||||
| Architectural composition | |||||
| Typhoon direction | |||||
| Block density | |||||
| Block direction | |||||
| Hidden danger identification | |||||
| Safety Education | |||||
References
- Appler, D.; Rumbach, A. Building community resilience through historic preservation. J. Am. Plan. Assoc. 2016, 82, 92–103. [Google Scholar] [CrossRef]
- Septianto, E.; Poerbo, H.W.; Firmansyah; Martokusumo, W. Understanding the attractiveness of types of historic districts in Bandung: Implementing heritage conservation based on public perception. J. Asian Archit. Build. Eng. 2024, 9, 1–16. [Google Scholar] [CrossRef]
- Charlton, J.; Kelly, K.; Greenwood, D.; Moreton, L. The complexities of managing historic buildings with BIM. Eng. Constr. Archit. Manag. 2020, 28, 570–583. [Google Scholar] [CrossRef]
- Berger, A.M.; Wilson, M.; Susskind, J.; Zeckhauser, R.J. Theorizing the resilience district: Design-based decision making for coastal climate change adaptation. J. Landsc. Archit. 2020, 15, 6–17. [Google Scholar] [CrossRef]
- You, X.; Sun, Y.; Liu, J. Evolution and analysis of urban resilience and its influencing factors: A case study of Jiangsu Province, China. Nat. Hazards 2022, 113, 1751–1782. [Google Scholar] [CrossRef] [PubMed]
- Yu, S.; Liu, H.; Kang, Q.; Cheng, J.; Gong, Y.; Ke, Y. Research on the Fire Resilience Assessment of Ancient Architectural Complexes Based on the AHP-CRITIC Method. Sustainability 2024, 16, 8022. [Google Scholar] [CrossRef]
- Croce, S.; Vettorato, D. The definition of urban surface uses: A systemic approach for climate resilient and sustainable cities. IOP Conf. Ser. Earth Environ. Sci. 2020, 588, 052035. [Google Scholar] [CrossRef]
- Jiao, L.; Li, D.; Zhang, Y.; Zhu, Y.; Huo, X.; Wu, Y. Identification of the key influencing factors of urban rail transit station resilience against disasters caused by rainstorms. Land 2021, 10, 1298. [Google Scholar] [CrossRef]
- Tao, J.; Xiao, D.; Qin, Q.; Zhuo, X.; Wang, J.; Chen, H.; Wang, Q. Climate-adaptive design of historic villages and dwellings in a typhoon-prone region in southernmost Mainland China. Int. J. Archit. Herit. 2022, 16, 117–135. [Google Scholar] [CrossRef]
- Taleb, R.; Ramanantoa, H.; Reynolds, T.; Beckett, C.T.S. Fragility assessment of traditional wooden houses in Madagascar subjected to extreme wind loads. Eng. Struct. 2023, 289, 116220. [Google Scholar] [CrossRef]
- Mazumder, R.K.; Enderami, S.A.; Sutley, E.J. A novel framework to study community-level social and physical impacts of hurricane-induced winds through synthetic scenario analysis. Front. Built Environ. 2023, 9, 1005264. [Google Scholar] [CrossRef]
- Rodríguez-Izquierdo, E.; Cid, A.; García-Meneses, P.M.; Peña-Sanabria, K.A.; Lerner, A.M.; Matus-Kramer, A.; Escalante, A.E. From resilience attributes to city resilience. Landsc. Urban Plan. 2022, 226, 104485. [Google Scholar] [CrossRef]
- Abdelhady, A.U.; Spence, S.M.J.; McCormick, J. Risk and fragility assessment of residential wooden buildings subject to hurricane winds. Struct. Saf. 2022, 94, 102137. [Google Scholar] [CrossRef]
- Patrick, C.J.; Yeager, L.; Armitage, A.R.; Carvallo, F.; Congdon, V.M.; Dunton, K.H.; Fisher, M.; Hardison, A.K.; Hogan, J.D.; Hosen, J.; et al. A system level analysis of coastal ecosystem responses to hurricane impacts. Estuaries Coasts 2020, 43, 943–959. [Google Scholar] [CrossRef]
- Lamothe, K.A.; Jackson, D.A.; Somers, K.M. Utilizing gradient simulations for quantifying community-level resistance and resilience. Ecosphere 2017, 8, e01953. [Google Scholar] [CrossRef]
- Fang, Y.N.; Tian, J.; Namaiti, A.; Zhang, S.; Zeng, J.; Zhu, X. Visual aesthetic quality assessment of the streetscape from the perspective of landscape-perception coupling. Environ. Impact Assess. Rev. 2024, 106, 107535. [Google Scholar] [CrossRef]
- Ricci, A.; Burlando, M.; Freda, A.; Repetto, M.P. Wind tunnel measurements of the urban boundary layer development over a historical district in Italy. Build. Environ. 2017, 111, 192–206. [Google Scholar] [CrossRef]
- Zhang, K.; Zhang, N.; Quan, F.; Li, Y.; Wang, S. Digital form generation of heritages in historical district based on plan typology and shape grammar: Case study on kulangsu islet. Buildings 2023, 13, 229. [Google Scholar] [CrossRef]
- Rey, T.; Leone, F.; Candela, T.; Belmadani, A.; Palany, P.; Krien, Y.; Cécé, R.; Gherardi, M.; Péroche, M.; Zahibo, N. Coastal Processes and Influence on Damage to Urban Structures during Hurricane Irma (St-Martin & St-Barthélemy, French West Indies). J. Mar. Sci. Eng. 2019, 7, 215. [Google Scholar] [CrossRef]
- Chen, Y.; Su, X. Study on factors affecting resilience behaviours of residents in coastal rural community management in response to typhoons. Ocean Coast. Manag. 2024, 258, 107400. [Google Scholar] [CrossRef]
- Johnson, P.M.; Brady, C.E.; Philip, C.; Baroud, H.; Camp, J.V.; Abkowitz, M. A factor analysis approach toward reconciling community vulnerability and resilience indices for natural hazards. Risk Anal. 2020, 40, 1795–1810. [Google Scholar] [CrossRef] [PubMed]
- Li, H.; Xu, E.; Zhang, H. High-resolution assessment of urban disaster resilience: A case study of Futian District, Shenzhen, China. Nat. Hazards 2021, 108, 1001–1024. [Google Scholar] [CrossRef]
- Shamsuddin, S. Resilience resistance: The challenges and implications of urban resilience implementation. Cities 2020, 103, 102763. [Google Scholar] [CrossRef] [PubMed]
- Snyder, A.; Matthew, S.; Leahy, N.; Gaul, R.; Hood, T.L.; Hijmans, K.; Milbrath, G. Island communities and disaster resilience: Applying the EnRiCH community resilience framework. Public Health Nurs. 2022, 39, 62–70. [Google Scholar] [CrossRef] [PubMed]
- Waights, S. The preservation of historic districts—Is it worth it? J. Econ. Geogr. 2019, 19, 433–464. [Google Scholar] [CrossRef]
- Ryberg-Webster, S.R.; Kinahan, K. Historic Preservation in Legacy City Comprehensive Plans. J. Plan. Educ. Res. 2024, 86, 123–138. [Google Scholar] [CrossRef]
- Barbera, J.; Naibert, N.; Komperda, R.; Pentecost, T.C. Clarity on Cronbach’s alpha use. J. Chem. Educ. 2020, 98, 257–258. [Google Scholar] [CrossRef]
- Wang, L.; Cao, Q.; Zhou, L. Research on the influencing factors in coal mine production safety based on the combination of DEMATEL and ISM. Saf. Sci. 2018, 103, 51–61. [Google Scholar] [CrossRef]
- Adegoriola, M.I.; Lai, J.H.K.; Abidoye, R. Critical success factors of heritage building maintenance management: An ISM-MICMAC analysis. J. Build. Eng. 2023, 75, 106941. [Google Scholar] [CrossRef]
- Zhao, L.; Wang, Q.; Hwang, B.G.; Richards, A.Y.C. Analysis of critical factors influencing sustainable infrastructure vulnerabilities using an ISM-MICMAC approach. Eng. Constr. Archit. Manag. 2024, 31, 3622–3652. [Google Scholar] [CrossRef]
- Pinheiro, V.R.F.; Fontenele, R.; Magalhães, A.; Frota, N.; Mesquita, E. Evaluation of the influence of climatic changes on the degradation of the historic buildings. Energy Build. 2024, 323, 114813. [Google Scholar] [CrossRef]
- Gim, J.; Shin, S. Disaster vulnerability and community resilience factors affecting post-disaster wellness: A longitudinal analysis of the Survey on the Change of Life of Disaster Victim. Int. J. Disaster Risk Reduct. 2022, 81, 103273. [Google Scholar] [CrossRef]
- Chen, J.; Ma, H.; Yang, S.; Zhou, Z.; Huang, J.; Chen, L. Assessment of Urban Resilience and Detection of Impact Factors Based on Spatial Autocorrelation Analysis and GeoDetector Model: A Case of Hunan Province. ISPRS Int. J. Geo-Inf. 2023, 12, 391. [Google Scholar] [CrossRef]
- Gu, D.L.; Shuai, Q.W.; Zhang, N.; Jin, N.; Zheng, Z.X.; Xu, Z.; Xu, Y.J. Multi-view street view image fusion for city-scale assessment of wind damage to building clusters. Comput. -Aided Civ. Infrastruct. Eng. 2024, 40, 198–214. [Google Scholar] [CrossRef]
- Mohandes, S.R.; Sadeghi, H.; Fazeli, A.; Mahdiyar, A.; Hosseini, M.R.; Arashpour, M.; Zayed, T. Causal analysis of accidents on construction sites: A hybrid fuzzy Delphi and DEMATEL approach. Saf. Sci. 2022, 151, 105730. [Google Scholar] [CrossRef]
- Singh, A.; Singla, A.R. Modelling and analysis of factors for implementation of smart cities: TISM approach. J. Model. Manag. 2022, 17, 1587–1622. [Google Scholar] [CrossRef]
- Liu, Q.; Liang, Y.; Jiang, H.; Gao, T. Research on the Coupled Relationship of Factors Influencing Construction Workers’ Unsafe Behaviors: A Hybrid DEMATEL-ISM-MICMAC Approach. Adv. Civ. Eng. 2023, 2023, 5570547. [Google Scholar] [CrossRef]
- He, Y.; Kang, J.; Pei, Y.; Ran, B.; Song, Y. Research on influencing factors of fuel consumption on superhighway based on DEMATEL-ISM model. Energy Policy 2021, 158, 112545. [Google Scholar] [CrossRef]
- Farooq, U.; Rehman, S.K.U.; Javed, M.F.; Jameel, M.; Aslam, F.; Alyousef, R. Investigating BIM implementation barriers and issues in Pakistan using ISM approach. Appl. Sci. 2020, 10, 7250. [Google Scholar] [CrossRef]
- Bagherian, A.; Gershon, M.; Kumar, S.; Mishra, M.K. Analyzing the relationship between digitalization and energy sustainability: A comprehensive ISM-MICMAC and DEMATEL approach. Expert Syst. Appl. 2024, 236, 121193. [Google Scholar] [CrossRef]
- Patel, M.N.; Pujara, A.A.; Kant, R.; Malviya, R.K. Assessment of circular economy enablers: Hybrid ISM and fuzzy MICMAC approach. J. Clean. Prod. 2021, 317, 128387. [Google Scholar] [CrossRef]
- Wang, W.; Liu, X.; Qin, Y.; Huang, J.; Liu, Y. Assessing contributory factors in potential systemic accidents using AcciMap and integrated fuzzy ISM-MICMAC approach. Int. J. Ind. Ergon. 2018, 68, 311–326. [Google Scholar] [CrossRef]
- Nagpal, R.; Mehrotra, D.; Sehgal, R.; Srivastava, G.; Wei Lin, J.C. Overcoming smart city barriers using multi-modal interpretive structural modeling. J. Signal Process. Syst. 2023, 95, 253–269. [Google Scholar] [CrossRef]
- Nazlabadi, E.; Maknoon, R.; Moghaddam, M.R.A.; Daigger, G.T. A novel MICMAC approach for cross impact analysis with application to urban water/wastewater management. Expert Syst. Appl. 2023, 230, 120667. [Google Scholar] [CrossRef]
- Yi, X.; Lu, S.; Zhong, Y.; Guo, Y.; Liu, L. Numerical Analysis of Roof Wind Pressure Distribution in Renovated Historical Buildings: Preventive Protection Measures to Mitigate Typhoon Damage. Appl. Sci. 2024, 14, 6136. [Google Scholar] [CrossRef]
- Abdelhady, A.U.; Spence, S.M.J.; McCormick, J. A framework for the probabilistic quantification of the resilience of communities to hurricane winds. J. Wind Eng. Ind. Aerodyn. 2020, 206, 104376. [Google Scholar] [CrossRef]
- Li, Z.; Wang, C.; Wang, J. Resilient spatial transformation and governance of public spaces in historical districts in disaster time: A literature review. J. Asian Archit. Build. Eng. 2025, 4, 1–17. [Google Scholar] [CrossRef]


| Reliability Range | Reference Standards |
|---|---|
| 0.9 ≤ Cronbach’s alpha. | Very high intrinsic credibility, credible |
| 0.8 ≤ Cronbach’s alpha < 0.9 | High intrinsic credibility and trustworthiness |
| 0.7 ≤ Cronbach’s alpha < 0.8 | Intrinsic credibility is acceptable and reliable |
| 0.6 ≤ Cronbach’s alpha < 0.7 | The scale has some problems, but it is of reference value and reliable |
| Cronbach’s alpha < 0.6 | The scale has big problems and needs to be redesigned |
| Number | Indicator | Frequency | Number | Indicator | Frequency |
|---|---|---|---|---|---|
| 1 | Windproof design | 103 | 11 | Block direction | 52 |
| 2 | Block form | 98 | 12 | Hidden danger identification | 51 |
| 3 | Building Structure | 87 | 13 | Resilience Concept | 44 |
| 4 | Typhoon level | 80 | 14 | Safety Education | 35 |
| 5 | Emergency Plan | 76 | 15 | Impact intensity | 29 |
| 6 | Typhoon wind speed | 72 | 16 | Preventive protection | 26 |
| 7 | Architectural composition | 63 | 17 | Risk assessment | 23 |
| 8 | Typhoon direction | 61 | 18 | Protection and renewal | 21 |
| 9 | Strong typhoon | 57 | 19 | Hazard investigation | 19 |
| 10 | Block density | 55 | 20 | Coastal cities | 15 |
| Test Statistics | Kendall | Asymptotic Significance |
|---|---|---|
| Evaluation indicators | 0.634 | 0.001 |
| Indicator | Average Values | Coefficients of Variation | Indicator | Average Values | Coefficients of Variation |
|---|---|---|---|---|---|
| Windproof design | 4.9438 | 0.0468 | Architectural composition | 4.9663 | 0.0365 |
| Block form | 4.0449 | 0.2004 | Typhoon direction | 4.0562 | 0.1979 |
| Building Structure | 4.9775 | 0.0299 | Block density | 4.9888 | 0.0212 |
| Typhoon level | 3.8764 | 0.2124 | Block direction | 3.8202 | 0.2109 |
| Emergency Plan | 4.9663 | 0.0365 | Hazard investigation | 4.9551 | 0.0420 |
| Typhoon wind speed | 3.9438 | 0.2036 | Safety Education | 3.9101 | 0.2027 |
| Primary Indicator | Secondary Indicator | Indicator Definition | Coding |
|---|---|---|---|
| Block level | Block density | Block density is the ratio of building area to land area | S1 |
| Block form | The space between the road surface and the buildings on either side, along with the wind field characteristics around the block, significantly influences how wind impacts the buildings | S2 | |
| Block direction | The varying angles between the blocks and the wind direction result in different distributions of wind load across the building surfaces | S3 | |
| Building level | Architectural composition | The different organizational forms of buildings significantly affect the wind field | S4 |
| Building Structure | The extent of damage to various building structures will also differ | S5 | |
| Windproof design | Selecting suitable building forms and materials can enhance a building’s wind resistance | S6 | |
| Typhoon characteristics | Typhoon level | Tropical cyclones are primarily classified into six categories based on the wind speed near their center | S7 |
| Typhoon direction | In the northern hemisphere, typhoons rotate counterclockwise. However, the relationship between various locations and typhoons differs, resulting in varying wind directions at each site | S8 | |
| Typhoon wind speed | Wind speed is a crucial parameter for numerically simulating the wind load characteristics of buildings | S9 | |
| Emergency Management | Emergency Plan | Integrating local conditions with scientific data is essential for developing effective response plans | S10 |
| Hazard investigation | Identifying areas vulnerable to typhoons can enhance wind resilience | S11 | |
| Safety Education | Enhancing the public’s ability to prevent, withstand, and respond to disasters can be achieved through educational initiatives and practical drills | S12 |
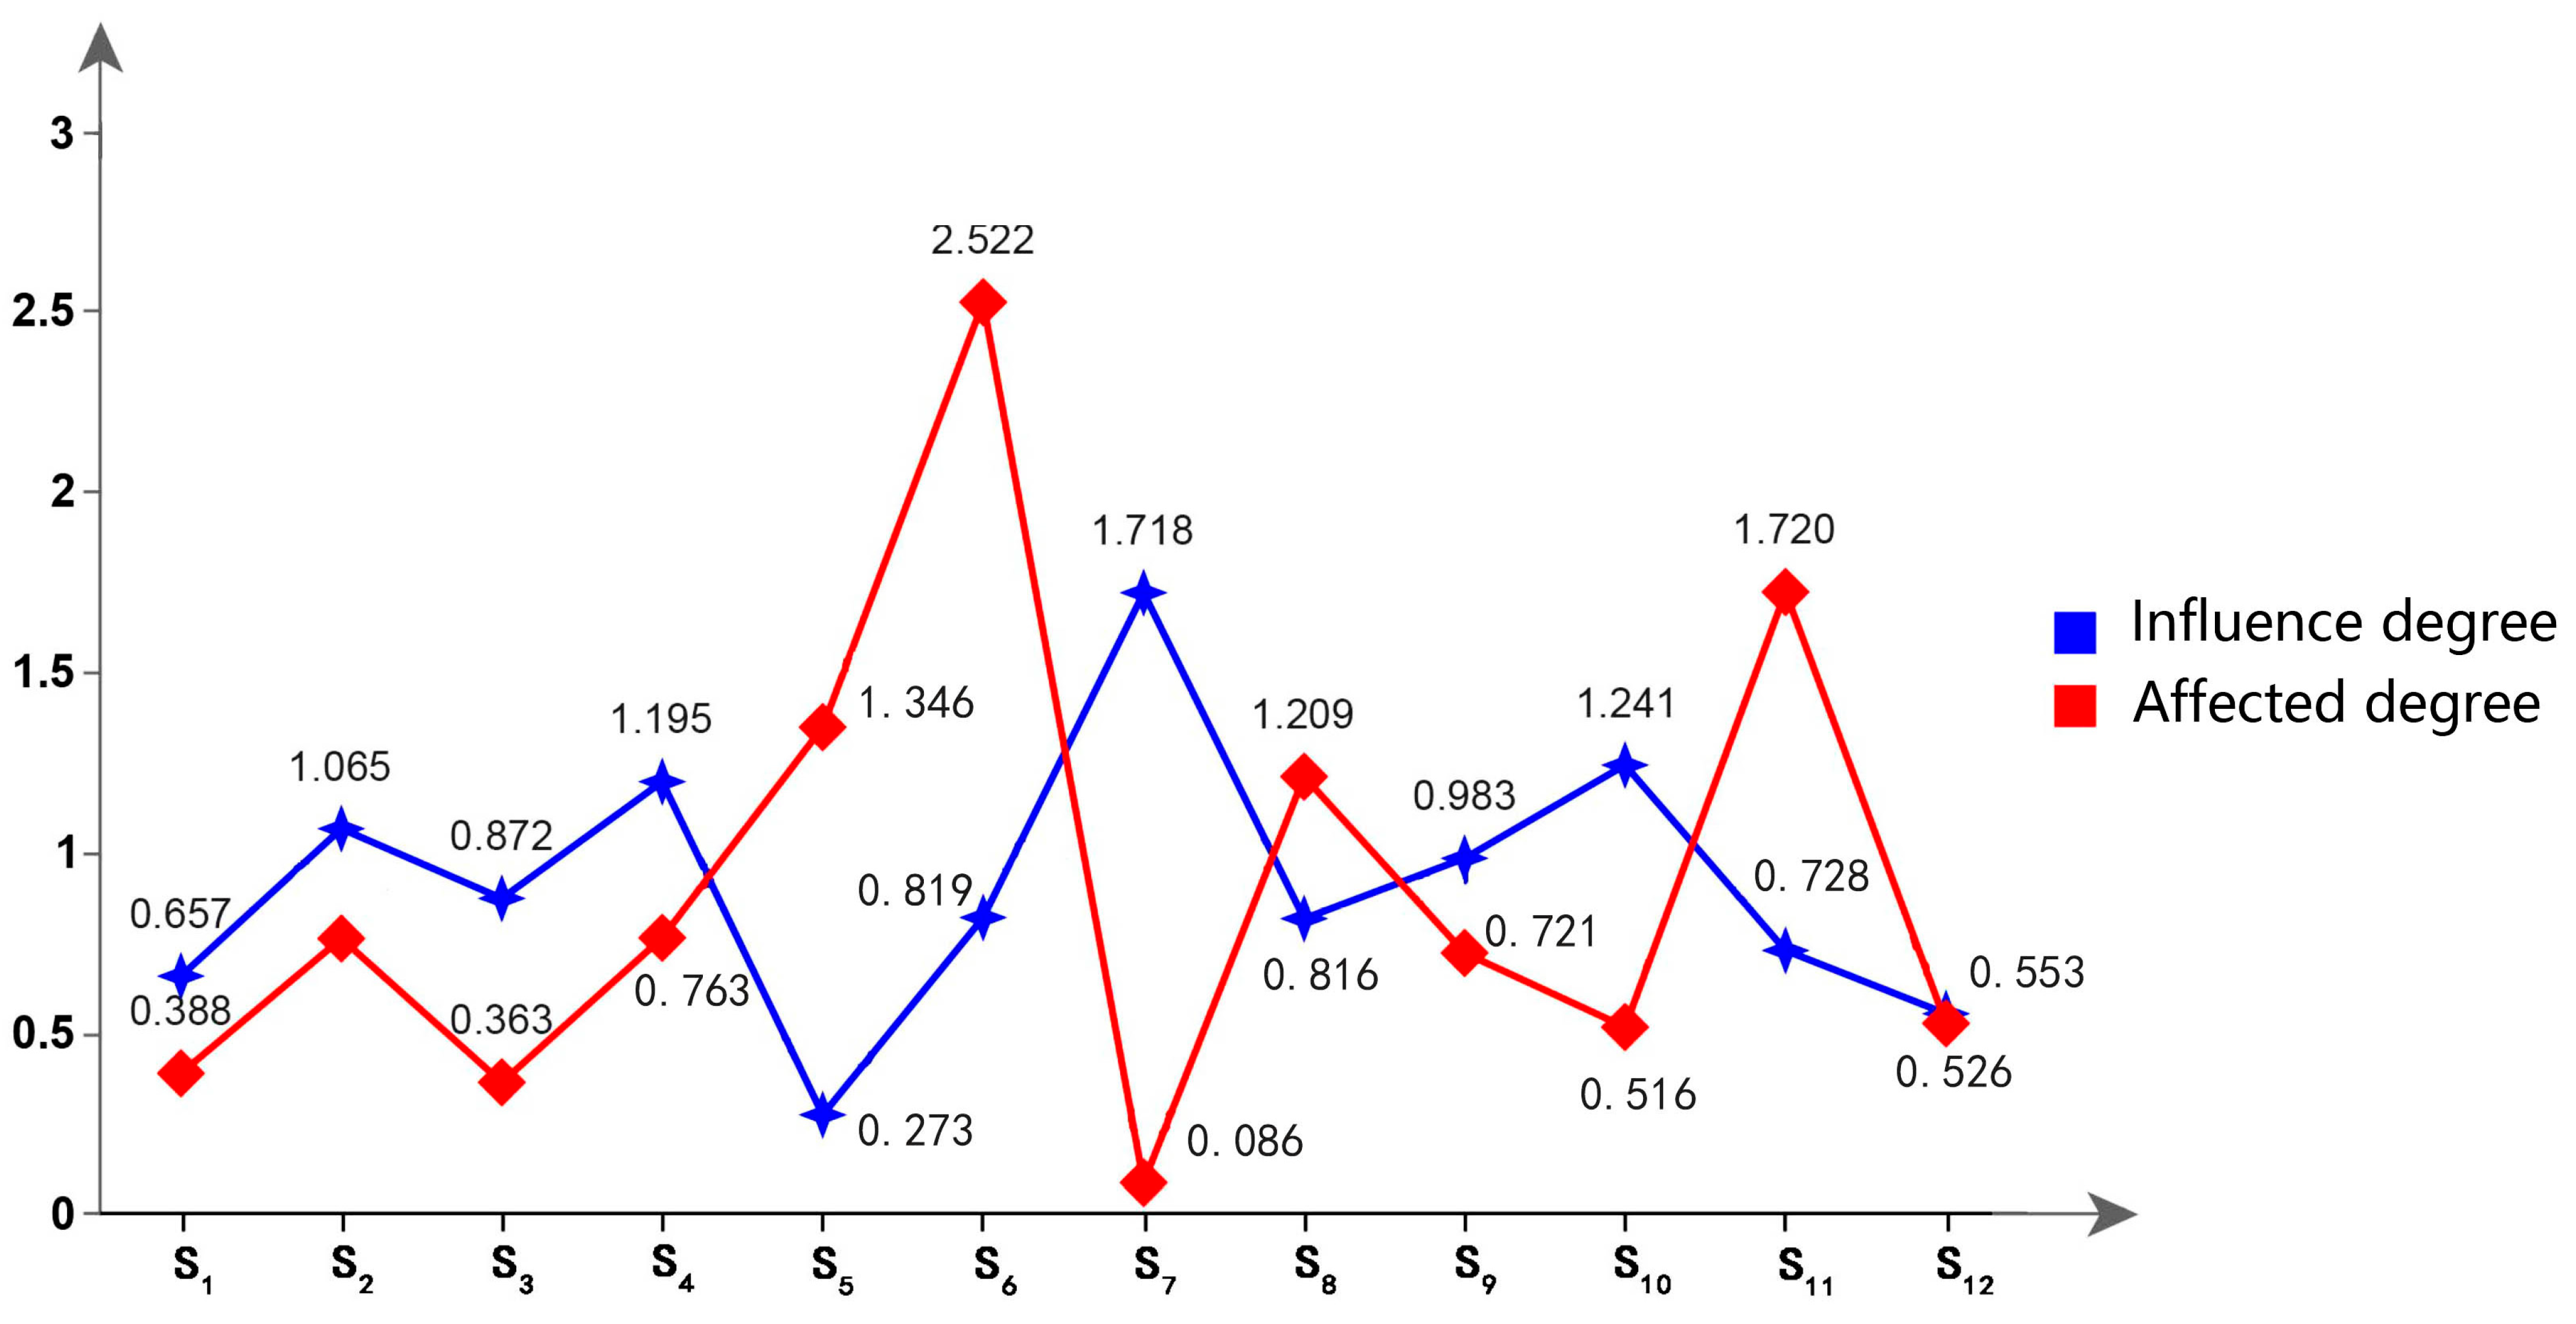
| Influencing Factors | D | E | B | C | Factor Attributes |
|---|---|---|---|---|---|
| S1 | 0.657 | 0.388 | 1.045 | 0.269 | Causal factors |
| S2 | 1.065 | 0.761 | 1.825 | 0.304 | Causal factors |
| S3 | 0.872 | 0.363 | 1.235 | 0.510 | Causal factors |
| S4 | 1.195 | 0.763 | 1.957 | 0.432 | Causal factors |
| S5 | 0.273 | 1.346 | 1.619 | −1.073 | Resulting factors |
| S6 | 0.819 | 2.522 | 3.341 | −1.702 | Resulting factors |
| S7 | 1.718 | 0.086 | 1.804 | 1.632 | Causal factors |
| S8 | 0.816 | 1.209 | 2.025 | −0.393 | Resulting factors |
| S9 | 0.983 | 0.721 | 1.704 | 0.262 | Causal factors |
| S10 | 1.241 | 0.516 | 1.757 | 0.724 | Causal factors |
| S11 | 0.728 | 1.720 | 2.447 | −0.992 | Resulting factors |
| S12 | 0.553 | 0.526 | 1.079 | 0.027 | Causal factors |
| Influencing Factors | R (Si) | A (Si) | G (Si) |
|---|---|---|---|
| S1 | S1, S6 | S1 | S1 |
| S2 | S2, S4, S6, S8 | S2 | S2 |
| S3 | S3,S6,S8 | S3 | S3 |
| S4 | S4, S6, S8, S11 | S2, S4 | S4 |
| S5 | S5, S6 | S5, S7, S9, S11 | S5 |
| S6 | S6 | S1, S2, S3, S4, S5, S6, S7, S8, S9, S10, S11, S12 | S6 |
| S7 | S5, S6, S7, S9, S11, S12 | S7 | S7 |
| S8 | S6, S8 | S2, S3, S4, S8 | S8 |
| S9 | S5, S6, S9, S11 | S7, S9 | S9 |
| S10 | S6, S10, S11, S12 | S10 | S10 |
| S11 | S5, S6, S11 | S4, S7, S9, S10, S11, S12 | S11 |
| S12 | S6, S11, S12 | S7, S10, S12 | S12 |
| Influencing Factors | Q | Y | Influencing Factors | Q | Y |
|---|---|---|---|---|---|
| S1 | 1 | 2 | S7 | 1 | 6 |
| S2 | 1 | 4 | S8 | 4 | 2 |
| S3 | 1 | 3 | S9 | 2 | 4 |
| S4 | 2 | 4 | S10 | 1 | 4 |
| S5 | 4 | 2 | S11 | 6 | 3 |
| S6 | 12 | 1 | S12 | 3 | 3 |
Disclaimer/Publisher’s Note: The statements, opinions and data contained in all publications are solely those of the individual author(s) and contributor(s) and not of MDPI and/or the editor(s). MDPI and/or the editor(s) disclaim responsibility for any injury to people or property resulting from any ideas, methods, instructions or products referred to in the content. |
© 2025 by the authors. Licensee MDPI, Basel, Switzerland. This article is an open access article distributed under the terms and conditions of the Creative Commons Attribution (CC BY) license (https://creativecommons.org/licenses/by/4.0/).
Share and Cite
Huang, B.; Ou, Z.; Zhao, G.; Wang, J.; Liu, L.; Lv, S.; Huang, B.; Liu, X. A Systematic Analysis of Influencing Factors on Wind Resilience in a Coastal Historical District of China. Appl. Sci. 2025, 15, 8116. https://doi.org/10.3390/app15148116
Huang B, Ou Z, Zhao G, Wang J, Liu L, Lv S, Huang B, Liu X. A Systematic Analysis of Influencing Factors on Wind Resilience in a Coastal Historical District of China. Applied Sciences. 2025; 15(14):8116. https://doi.org/10.3390/app15148116
Chicago/Turabian StyleHuang, Bo, Zhenmin Ou, Gang Zhao, Junwu Wang, Lanjun Liu, Sijun Lv, Bin Huang, and Xueqi Liu. 2025. "A Systematic Analysis of Influencing Factors on Wind Resilience in a Coastal Historical District of China" Applied Sciences 15, no. 14: 8116. https://doi.org/10.3390/app15148116
APA StyleHuang, B., Ou, Z., Zhao, G., Wang, J., Liu, L., Lv, S., Huang, B., & Liu, X. (2025). A Systematic Analysis of Influencing Factors on Wind Resilience in a Coastal Historical District of China. Applied Sciences, 15(14), 8116. https://doi.org/10.3390/app15148116