Abstract
Defects in GIS can be effectively detected by detecting the partial discharge (PD). The common methods of detecting partial discharge are pulse current, ultrasonic and UHF (ultra-high frequency). However, the results of different methods may be different due to the different physical quantities detected. It is important to research the differences between the PD detection methods for the PD detection and analysis. In this study, we designed metal protrusion defects in GIS, including protrusion on the conductor and enclosure. Then, we detected the PD of defects using pulse current, UHF and ultrasonic methods at the same time. The PRPD patterns, maximum discharge amplitude of different defects and PD inception voltage (PDIV) detected by the three methods were analyzed. The PRPD patterns and discharge amplitude of the different methods were very similar to each other, but the PDIVs were different. It can be concluded that the process from the PD inception to breakdown can be divided into four sections based on the PRPD and the maximum discharge amplitude. The similarity between the three methods is because their signals are all related to the pulse current during the PD process, and differences in their PDIVs are caused by the differences in sensitivity. The sensitivity of the pulse current is the lowest among the three methods due to its poor anti-jamming capability. The sensitivity of UHF is higher, and that of ultrasonic is the highest.
1. Introduction
GAS-insulated switchgear (GIS) is widely used in power systems because it has the advantages of high reliability, being environmentally friendly and especially saving space. However, some unexpected defects may occur in GIS during the manufacturing, transportation or installation processes, which threaten the safe operation of GIS. Among these defects, metal protrusion is a common defect, including metal protrusion on the conductor and metal protrusion on the enclosure [1].
Because the working electric field is very high in GIS and the field is concentrated at the metal protrusion, partial discharge (PD) happens at the protrusion. Therefore, the protrusion defect can be effectively detected by detecting the PD signals.
According to the different physical quantities detected, PD detection methods are grouped into the electrical detection method, acoustic detection method, optical method and chemical detection method [2,3,4,5,6]. Among these methods, pulse current [7,8,9], ultrahigh frequency (UHF) [10,11] and ultrasonic [12,13,14] methods are widely used. The pulse current, ultrasonic and UHF methods measure the pulse current, ultrasonic and electromagnetic signals, respectively. The results from these three methods for the same PD detection may be different due to the different physical quantities detected.
The three methods have been widely applied in partial discharge research. Li Jisheng [15] measured partial discharge signals from defects such as metal protrusions on GIS conductor surfaces using the pulse current method. Shao Xianjun [16] employed built-in and external UHF sensors (Hyundai Heavy Industries Co., Ltd., Ulsan, Republic of Korea) to detect the partial discharge characteristics of metal protrusion defects under different voltage levels and explored their development patterns. Duan Dapeng [17] conducted experimental investigations on partial discharge and its progression in defects such as metal protrusions using UHF and ultrasonic detection methods, studying their development patterns. These three detection methods are also extensively used in partial discharge identification and localization [18,19,20,21].
The existing research not only predominantly focuses on single or dual detection methods, but also lacks systematic comparative analysis of the differences among pulse current, ultrasonic and UHF methods. In this study, we set tested the metal protrusion on the enclosure and the metal protrusion on the conductor of different sizes in GIS. We also used the pulse current, ultrasonic and UHF methods to detect the PD signals at the same time to analyze the defect characteristics, and the sensitivities of different methods to detect protrusion defects were obtained. The results of this study will be helpful for PD detection and analysis in the field.
2. Experimental Setup
2.1. Experimental Platform and Detection System
The experiment was conducted on a 330 kV GIS platform, which used a gas-insulated transformer, directly connected with the GIS, as the power source. The test transformer capacity was 560 kVA, and the maximum output voltage was 280 kVrms. A photograph of the experimental system is shown in Figure 1.
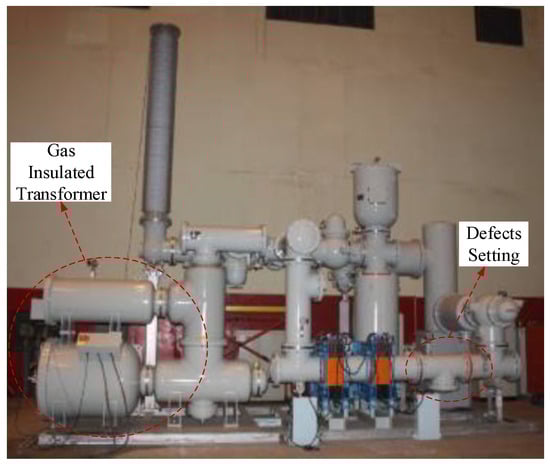
Figure 1.
Photograph of the experimental system.
Figure 2 shows the detection system. During the process of the experiment, pulse current, ultrasonic and UHF methods were used to detect the PD signals at the same time. As shown in Figure 2, the pulse current method instrument measured the signal of the detection impedance in series with the coupling capacitor, which was inside the gas-insulated transformer. Prior to testing, the system was calibrated to convert the measured impedance results into picocoulombs (pC). The signal of the ultrasonic detector was obtained using a piezoelectric ultrasonic sensor placed on the GIS shell. The UHF detector utilized a built-in planar antenna sensor (operating at 300–1500 MHz with an average effective height of 11.86 mm) to obtain the GIS signal.
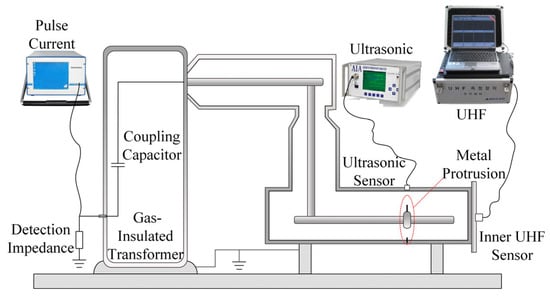
Figure 2.
Scheme of the detection system.
The detection frequency bands of the pulse current, ultrasonic and UHF methods were 10~300 kHz, 20~80 kHz and 500~1500 MHz, respectively.
2.2. Defect Design
We designed a metal protrusion on the conductor and the enclosure. The defect of protrusion on the conductor was fixed on the shield of GIS and the protrusion on the enclosure was fixed inside of the enclosure, over against the location of the defect on the conductor.
The inside radius of the enclosure was 406 mm, and the diameter of the shield was 196 mm. The defect was a cylindrical steel needle with a diameter of 0.8 mm, and the tip radius was 0.4 mm.
Photographs of the metal protrusion defects are shown in Figure 3. The lengths of the defects on the conductor were 3.5, 6 and 12 mm, and that on the enclosure was 12 mm.
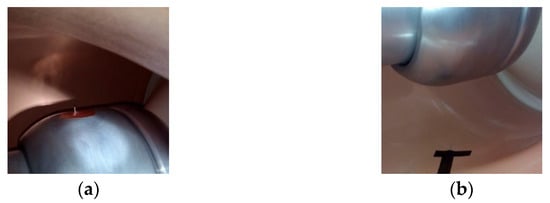
Figure 3.
Pictures of metal protrusion defects: (a) protrusion on the conductor; (b) protrusion on the enclosure.
The simulated results for the distribution diagrams of the electric field intensity of different defects under voltage of 100 kV are shown in Figure 4. As shown in the figure, the electric field at the defect is very high due to either the protrusion on the conductor or enclosure, which makes the field uniform in GIS distortion.

Figure 4.
The distribution diagrams of the electric field intensity in GIS. (a) Protrusion on the conductor; (b) protrusion on the enclosure.
Figure 5 shows the distribution curves of the electric field intensity under different sizes and defect locations. In the figure, D denotes the distance to the surface of the shield. It can be seen that the electric field changes more severely with longer protrusions. The maximum electric field under the defect of protrusion on the conductor is higher than that of the enclosure. The maximum field intensity for a 12 mm protrusion on the conductor is about 7 kV/mm, which is 5 times higher than that with no defect. Also, the maximum field for protrusion on the conductor is 3.68 times higher than that of the enclosure when the defects are both 12 mm.
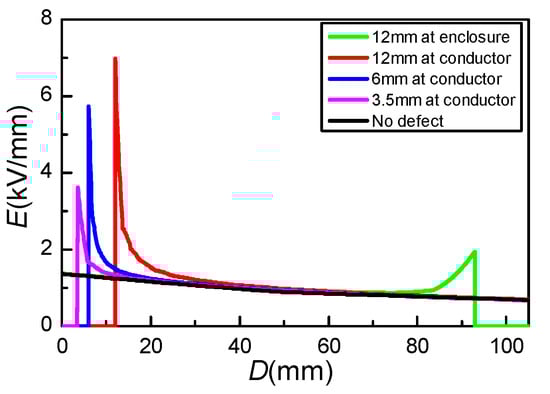
Figure 5.
The distribution curves of the electric field intensity.
2.3. Experimental Methods
The process of the experiment is shown in Figure 6.
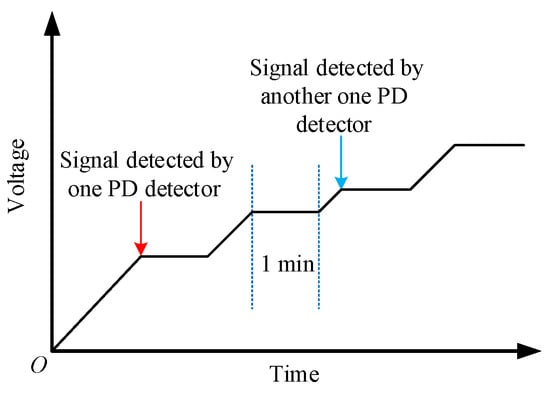
Figure 6.
Application of voltage method in the experiment.
We monitored three PD detectors at the same time when the applied voltage was gradually increased at the beginning of the experiment. Then, when a certain detector detected the PD signal at a certain voltage, which was the PD inception voltage, we suspended increasing the voltage and kept the voltage constant for 1 min. After that, we continued to gradually increase the voltage. When the detection results significantly changed, we suspended increasing the voltage and kept the voltage constant for 1 min. We were also required to suspend increasing the voltage and keep the voltage constant for 1 min when another PD detector first measured the signal during the process of increasing voltage.
3. Results
3.1. Results of Protrusion on the Conductor
We designed protrusion defects on the conductor with different lengths of 3.5 mm, 6 mm and 12 mm, respectively. The GIS was filled with SF6 at a pressure of 0.55 MPa, which was the same as the actual operation condition.
3.1.1. Detection Results for Ultrasonic Method
The PRPD (phase-resolved partial discharge) patterns for 3.5 mm protrusion on the conductor detected using the ultrasonic method are shown in Figure 7. Figure 7a shows the pattern of the inception discharge. At this point, PD only occurs at the negative half-cycle of the AC voltage. Then, PD occurs at the positive half-cycle when the voltage increases to 185.28 kV, as is shown in Figure 7b. The maximum discharge magnitude at the positive half-cycle of the voltage is bigger than that of the negative half-cycle at a higher voltage, as shown in Figure 7c–i.
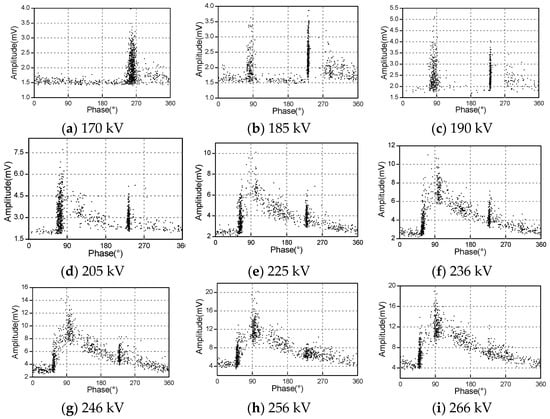
Figure 7.
PRPD pattern for 3.5 mm protrusion on the conductor detected by ultrasonic method (a) at 170 kV; (b) at 185 kV; (c) at 190 kV; (d) at 205 kV; (e) at 225 kV; (f) at 236 kV; (g) at 246 kV; (h) at 256 kV; (i) at 266 kV.
Figure 8 shows the PRPD pattern for the 6 mm protrusion on the conductor. As shown in Figure 8a,b, PD only occurs at the negative half-cycle of the AC voltage at the inception discharge, which is similar to that for the 3.5 mm detect. Figure 8c shows that PD begins to occur at the positive half-cycle of the voltage. From Figure 8d–g, it can also clearly be seen that the discharge amplitude at the positive half-cycle of voltage is higher than that of the negative half-cycle with increasing voltage. This is different from the results for 3.5 mm protrusion, which are shown in Figure 8h–l. At this point, the discharge becomes very strong. It should be noted that an extremely high discharge occasionally occurs at the peak of the AC voltage. Breakdown occurs when a voltage of 270.87 kV is kept constant for 1 min.
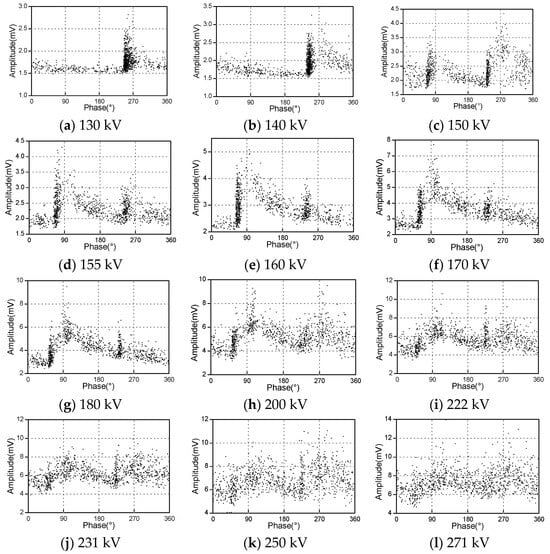
Figure 8.
PRPD pattern for 6 mm protrusion on the conductor detected by the ultrasonic method (a) at 130 kV; (b) at 140 kV; (c) at 150 kV; (d) at 155 kV; (e) at 160 kV; (f) at 170 kV; (g) at 180 kV; (h) at 200 kV; (i) at 222 kV; (j) at 231 kV; (k) at 250 kV; (l) at 271 kV.
The discharge pattern for a 12 mm metal protrusion on the conductor is shown in Figure 9. Figure 9a,b show that PD firstly occurs at the negative half-cycle of the AC voltage and then occurs at the positive half, as can be seen in Figure 9c. Figure 9d–f show that the PD magnitude at the positive half-cycle clearly increases as the voltage increases. Figure 9g–i show that an extremely high discharge occurs at the voltage peak as the voltage further increases. Breakdown occurs when a voltage of 265.25 kV is kept constant for about 20 s.
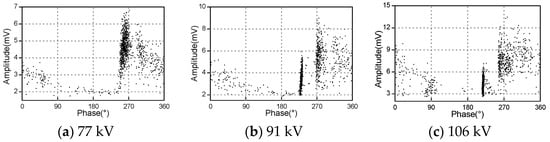
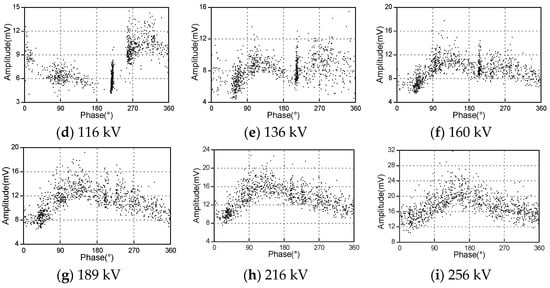
Figure 9.
PRPD pattern for 12 mm protrusion at conductor detected by the ultrasonic method (a) at 77 kV; (b) at 91 kV; (c) at 106 kV; (d) at 116 kV; (e) at 136 kV; (f) at 160 kV; (g) at 189 kV; (h) at 216 kV; (i) at 256 kV.
It is shown in Figure 10 that the PDIV (PD inception voltage) under different length defects clearly decreases as the length increases.
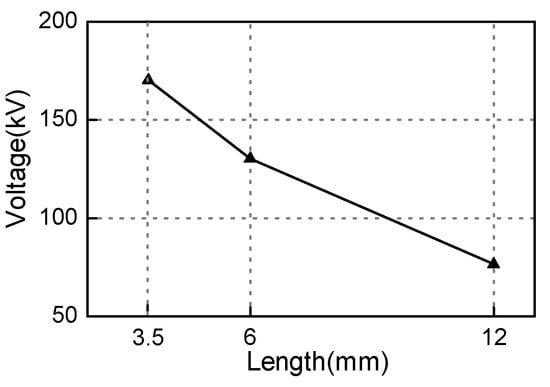
Figure 10.
Inception voltage for different length detects.
Figure 11 shows the curve of the maximum discharge amplitudes under different voltages. It can be seen that the discharge amplitude increases as the voltage increases. For a 12 mm protrusion, the maximum discharge amplitude increases slowly when the voltage is below 105 kV. Then, the discharge amplitude greatly increases at a voltage of 105 kV. When the voltage increases from 105 kV to 175 kV, the amplitude increases slightly. Finally, the maximum amplitude increases quickly until breakdown. The result of a 6 mm protrusion is similar to that of a 12 mm protrusion. At first, the amplitude increases slowly as the voltage increases. When the voltage is 175 kV, the maximum discharge amplitude greatly increases. Then, the amplitude increases slightly, and finally, it increases quickly. It can be seen from Figure 11 that the maximum discharge amplitude of 3.5 mm firstly increases slowly, then increases greatly as the voltage increases. It is expected that the amplitude will slightly increase and then increase quickly as the voltage further increases. Finally, breakdown will occur.
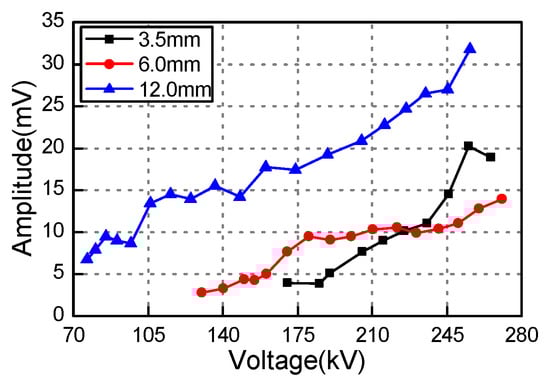
Figure 11.
Maximum discharge amplitude vs. voltage.
3.1.2. Detection Results for the UHF Method
The PRPD pattern for a 3.5 mm metal protrusion detected using the UHF method is shown in Figure 12. As is shown in Figure 12, the PDIV for a 3.5 mm protrusion detected using UHF is 225.05 kV, and the pattern shown in Figure 12a is under this voltage. At this point, PD occurs at both the negative and positive half-cycles of the AC voltage, but the amplitude for the positive is bigger than that of the negative half-cycle. As the voltage increases, PD amplitude increases and the PD phase is widened; however, the maximum amplitude of the positive is always higher than that of the negative half-cycle, as is shown in Figure 12b–e.
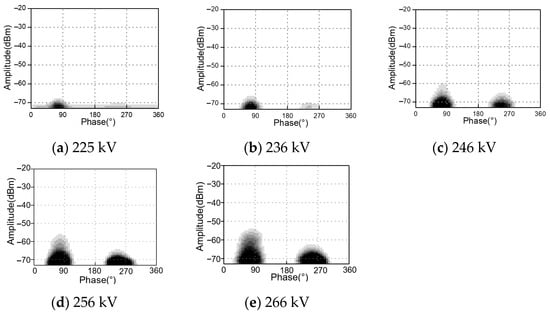
Figure 12.
PRPD pattern for 3.5 mm protrusion on the conductor detected by the UHF method (a) at 225 kV; (b) at 236 kV; (c) at 246 kV; (d) at 256 kV; (e) at 266 kV.
Figure 13 shows the pattern for a 6 mm protrusion. It can be seen from Figure 13a,b that PD firstly occurs at the positive half-cycle of the voltage at the inception, which is different from the results for the ultrasonic method. As is shown in Figure 13c–i, when the voltage increases, PD begins to occur at the negative half-cycle and then PD amplitude increases and the PD phase is widened; however, the maximum amplitude of the positive is always higher than that of the negative half-cycle.
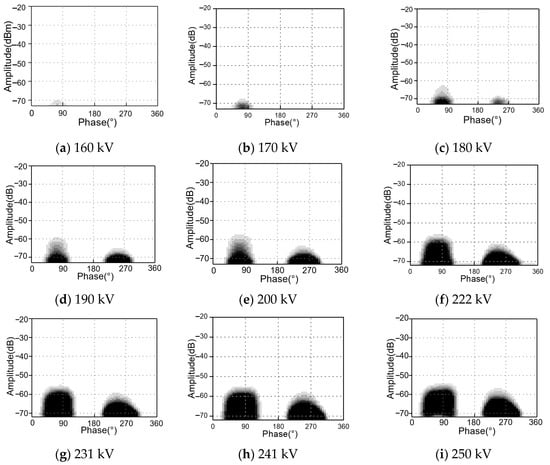
Figure 13.
PRPD pattern for 6 mm protrusion on the HV conductor detected by the UHF method (a) at 160 kV; (b) at 170 kV; (c) at 180 kV; (d) at 190 kV; (e) at 200 kV; (f) at 222 kV; (g) at 231 kV; (h) at 241 kV; (i) at 250 kV.
As is shown in Figure 14a–c, for a 12 mm protrusion, PD firstly occurs at the negative half-cycle of the voltage, which is the same as the results for the ultrasonic method. Figure 14d shows that PD occurs at the positive half-cycle as voltage increases. As the voltage further increases, PD becomes strong both at the negative and positive half-cycles of voltage.
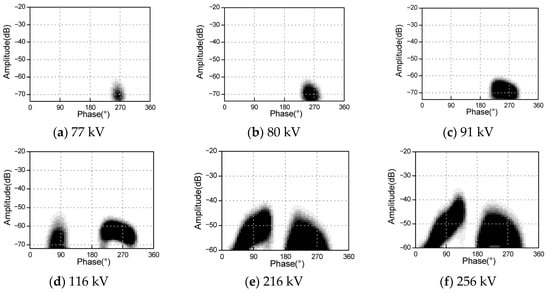
Figure 14.
PRPD pattern for 12 mm protrusion on the conductor detected by the UHF method (a) at 77 kV; (b) at 80 kV; (c) at 91 kV; (d) at 116 kV; (e) at 216 kV; (f) at 256 kV.
The PDIV detected by UHF is shown in Figure 15. It can be seen that PDIV decreases as the defect length increased.
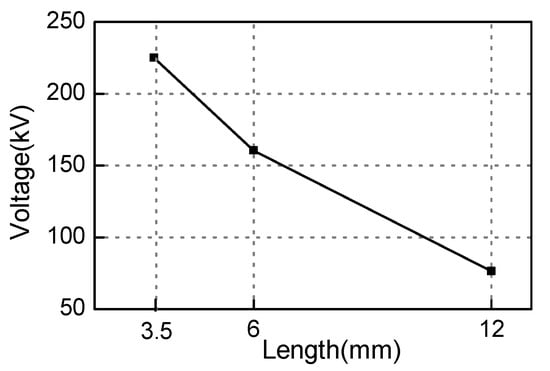
Figure 15.
PDIV detected for different lengths.
Figure 16 shows the maximum discharge amplitude under different applied voltages.
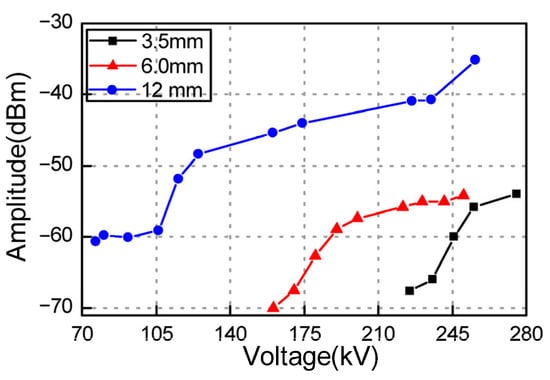
Figure 16.
Discharge magnitude vs. voltage.
In Figure 16, it can be seen that the maximum amplitude increases as the voltage increases. At the beginning, the amplitude of a 12 mm protrusion increases slowly. Then, it increases greatly under a voltage of 105~120 kV. After that, the amplitude increases slightly, and it increases quickly under high voltage. For a 6 mm protrusion, the amplitude first greatly increases, and then slightly increases as the voltage increases. The results for a 3.5 mm protrusion are similar to those for 6 mm; that is, they first greatly increase and then slightly increase.
3.1.3. Detection Results for Pulse Current Method
The pulse current detector did not detect the PD signal for the defects with lengths of 3.5 mm and 6 mm. The results for noise signals are shown in Figure 17.
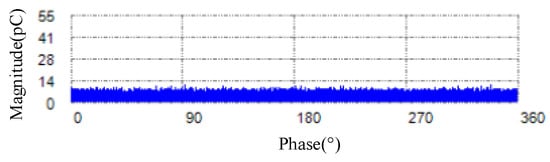
Figure 17.
Noise signals detected by the pulse current method.
For a 12 mm protrusion, the detector detected signals when the voltage was high. The PRPD pattern is shown in Figure 18.
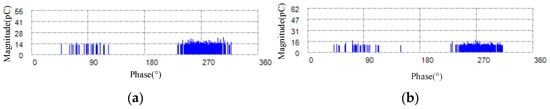
Figure 18.
PRPD patterns for 12 mm protrusion on the conductor detected by the pulse current method (a) at 235.12 kV; (b) at 255.76 kV.
From Figure 18, it can be seen that the discharge magnitude for the positive half-cycle of voltage is almost equal to that for the negative half-cycle. However, the discharge number for the positive half-cycle is less than that for the negative half-cycle.
3.2. Results of Protrusion at Enclosure
We installed a metal protrusion with the length of 12 mm on the enclosure. The pulse method did not detect the signal, but UHF and ultrasonic method both clearly detected the PD signal.
Figure 19 and Figure 20 show the PRPD patterns of protrusion on the enclosure detected by the ultrasonic and UHF methods. Comparing Figure 19 and Figure 20, it can be seen that the PRPD patterns detected by the UHF and ultrasonic method are similar. At the beginning, PD only occurs at the positive half-cycle of AC voltage, as is shown in Figure 19a and Figure 20a. Figure 19b and Figure 20b show that PD begins to occur at the negative half-cycle of the voltage as the voltage increases. Figure 19c–e and Figure 20c–e show that PD amplitude increases and PD phase is widened as the voltage further increases. At this point, the maximum amplitude of the positive half-cycle of the voltage is higher than that of the negative half-cycle. Finally, the maximum amplitude of the negative half-cycle of voltage is higher than that of the positive half-cycle, as is shown in Figure 19f–i and Figure 20f–h.
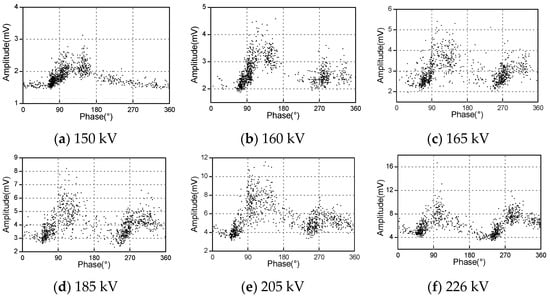
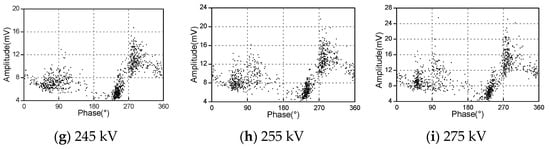
Figure 19.
PRPD pattern for a 12 mm protrusion on the enclosure detected by the ultrasonic method (a) at 150 kV; (b) at 160 kV; (c) at 165 kV; (d) at 185 kV; (e) at 205 kV; (f) at 226 kV; (g) at 245 kV; (h) at 255 kV; (i) at 275 kV.
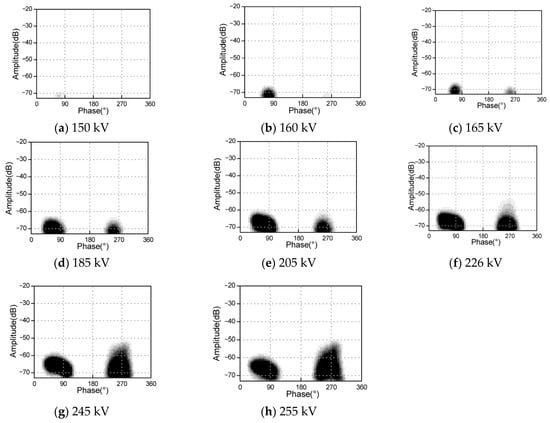
Figure 20.
PRPD pattern for a 12 mm protrusion on the enclosure detected by the UHF method: (a) 150 kV; (b) 160 kV; (c) 165 kV; (d) 185 kV; (e) 205 kV; (f) 226 kV; (g) 245 kV; (h) 255 kV.
The PDIV of the protrusion on the enclosure is 149.78 kV, which is clearly higher than that of the conductor.
Figure 21 shows the variation curve of maximum discharge amplitude under different voltages detected by the UHF and ultrasonic methods. It can be seen that the amplitude of the protrusion on the enclosure is clearly lower than that of the conductor.
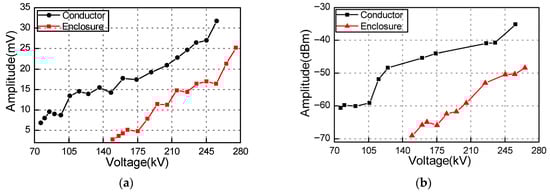
Figure 21.
Discharge amplitude vs. voltage. (a) Ultrasonic; (b) UHF.
Comparing the results of protrusion at enclosure and conductor, the PDIV of enclosure is higher than that of conductor. In addition, PD of protrusion at conductor firstly occurs at the negative half-cycle of the voltage, which is contrary to the results of enclosure.
3.3. Comparision of Results for Different Methods
There are differences between the detection results of different methods for the same defect, which are mainly reflected in the PD detection ability, PDIV, PRPD pattern and discharge magnitude, etc.
The pulse current method only detected signal for a 12 mm protrusion on the conductor during the experiment. Although UHF and the ultrasonic method both detect signal under all defects, the PDIV and PDEV (partial discharge extinction voltage) are different, as Figure 22 shows.
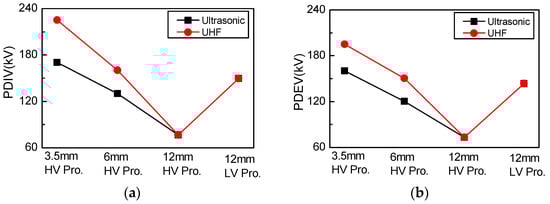
Figure 22.
PDIV and PDEV of different defects. (a) PDIV; (b) PDEV.
It can be seen from Figure 22 that PDIV and PDEV both decrease as the protrusion length increases. The PDIV and PDEV of the protrusion on the enclosure are lower than those of the conductor, although the defect length is the same. In addition, PDIV and PDEV detected by the ultrasonic method are lower than those detected by the UHF method when the defect is short. For example, the PDIV and PDEV for a 3.5 mm protrusion on the conductor detected by the UHF method are 1.32 and 1.22 times higher than those detected by the ultrasonic method, respectively. For all 12 mm defects (including both conductor and enclosure protrusions), the PDIV and PDEV measured by the UHF and ultrasonic methods are completely consistent. This indicates that for such large-sized defects, both methods possess sufficient sensitivity to accurately capture the actual PD inception activity. However, for smaller defects (3.5 mm and 6 mm conductor protrusions), the PDIV and PDEV measured by the UHF method are higher than those obtained by the ultrasonic method; therefore, the ultrasonic method is more sensitive for detecting short protrusion defects. Regarding a 12 mm protrusion on the enclosure, although the PD amplitude is significantly lower than that for conductor protrusions of the same size, and the PDIV and PDEV measured by both methods remain consistent. This demonstrates that for large-sized defects, even when the PD amplitude is relatively low, both methods can still simultaneously detect PD inception.
When PD occurs at the positive half-cycle of voltage, the PD signal is only detected by UHF. Then, the PRPD pattern will be like the results of the 3.5 mm and 6 mm protrusion on the conductor, as shown in Figure 12a and Figure 13a. This is because the initial genuine PD signals may be missed due to their amplitudes falling below the UHF detection threshold, while the larger discharge magnitudes during the positive half-cycle are captured first. Similarly, for the 12 mm protrusion on the enclosure where PD magnitudes are relatively lower, both the UHF and ultrasonic methods might only detect discharges during the positive half-cycle when the discharge magnitudes are sufficiently large, while still missing the initial negative half-cycle discharges.
Comparing Figure 7, Figure 8 and Figure 9 to Figure 12 and Figure 13, and Figure 19 to Figure 20, it can be seen that the PRPD patterns for the UHF and ultrasonic methods are similar to each other under the same voltage. The normalization results for maximum amplitude are shown in Figure 23. The figure shows that the results for the 12 mm protrusion on the conductor and enclosure detected by UHF are similar to the results detected by the ultrasonic method, as shown in Figure 12d,e. The maximum amplitude first slowly increases, then greatly increases. After that, the amplitude increases slightly, and finally increases quickly.
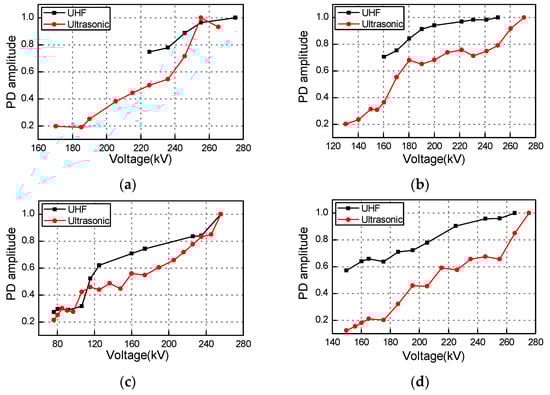
Figure 23.
The normalization results for maximum amplitude as voltage increases: (a) 3.5 mm HV protrusion; (b) 6 mm HV protrusion; (c) 12 mm HV protrusion; (d) 12 mm LV protrusion.
The PDIVs of 3.5 mm and 6 mm protrusion at conductor detected by UHF are higher than those by the ultrasonic method, so the ranges of their normalization curves are different. However, the trends of the curves are similar in the same range, as shown in Figure 12a,b. In addition, Figure 12 shows that the results detected by ultrasonic change rapidly, while the results detected by UHF change gently. This difference further confirms that the ultrasonic method exhibits greater sensitivity to minute discharges, while the UHF method demonstrates a weaker response to initial weak discharges.
Above all, the PD detection capability of the pulse current method is the weakest among the three methods. The results for the UHF and ultrasonic methods show similarities, including PRPD patterns and the variation trend of maximum amplitude with increasing voltage. This can be attributed to the fact that although the two methods detect different physical quantities (ultrasonic signals correlate with discharge energy, while UHF signals relate to the rising gradient of the pulse current), both signals originate from the pulse current generated by PD. Thus, under the same voltage, their results—whether PRPD patterns or maximum amplitude trends—exhibit consistency. The key distinction lies in the more pronounced amplitude variation in ultrasonic signals compared to UHF (Figure 23), as the discharge energy increases significantly with voltage, whereas the rise gradient of pulse current changes only marginally.
In addition, the main difference between the UHF and ultrasonic methods is their sensitivity. As the results show, the sensitivity of the ultrasonic method is higher than UHF. One reason is that the ultrasonic signal is related to the discharge energy, which can easily be detected due to it changing more obviously with the development of the PD. Another reason is that the ultrasonic sensor is closer to the PD source than the UHF sensor. This leads to the ultrasonic signal decaying relatively less than UHF.
The different sensitivities lead to their different minimum detection discharge magnitude. The order of minimum detection discharge magnitude by different methods is as follows: pulse current > UHF > ultrasonic. This leads the PDIV detected by different methods to be different, which can be explained by Figure 24.
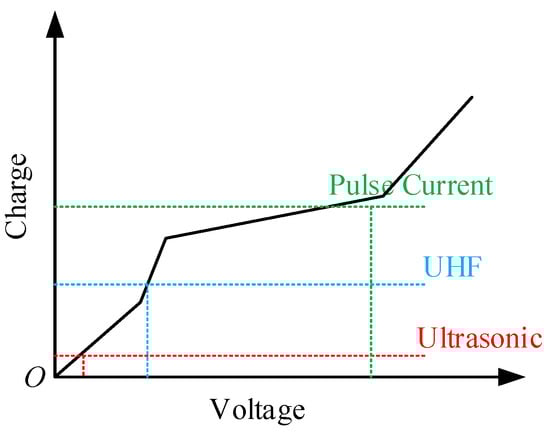
Figure 24.
PDIV detected by different methods.
In Figure 24, the solid line is the curve of maximum discharge as the voltage increases, and the horizontal dotted lines are the minimum discharge magnitude detected by different methods. The intersection of the vertical and horizontal dotted lines is the PDIV. Because the minimum detection discharge magnitude is pulse current > UHF > ultrasonic, the PDIV is pulse current > UHF > ultrasonic. The differences in sensitivity among the detection methods stem from their respective signal sources, propagation characteristics and anti-interference capabilities. The pulse current method, which is directly affected by electromagnetic interference in the circuit and relies on higher discharge levels to be triggered, exhibits the lowest sensitivity. The UHF method, which detects electromagnetic wave signals, offers moderate sensitivity but faces challenges such as electromagnetic interference, signal attenuation over long propagation distances and the fact that significant signals are only generated during the streamer discharge stage. In contrast, the ultrasonic method utilizes acoustic signals directly excited by discharge energy, producing detectable responses even in the initial discharge stage. Additionally, acoustic signals are less susceptible to electromagnetic interference and have shorter propagation paths, resulting in them having highest sensitivity. These fundamental differences lead to a hierarchical relationship in the minimum detectable discharge levels, which is as follows: pulse current method > UHF method > ultrasonic method.
4. Discussion and Analysis
Partial discharge occurs when there is a metal protrusion defect in GIS which enhances the electric field at the protrusion.
During the experiment, breakdown occurred for 6 mm and 12 mm protrusions on the conductor. According to the PRPD pattern and the maximum discharge amplitude curve detected by the UHF and ultrasonic methods, the process can be divided from the inception of PD to the breakdown of the protrusion on the conductor, into the following sections.
- (1)
- (2)
- (3)
- (4)
- When the voltage is very high, the discharge becomes very strong and there are some extreme PDs at the peak of the voltage, as shown in Figure 8k,l, etc. The maximum amplitude quickly increases. At this point, breakdown may occur.
There is strong ionization around the metal protrusion before PD occurs due to the strong electric field. As the charges drift, positive charges are accumulated around the protrusion, as is shown in Figure 25.
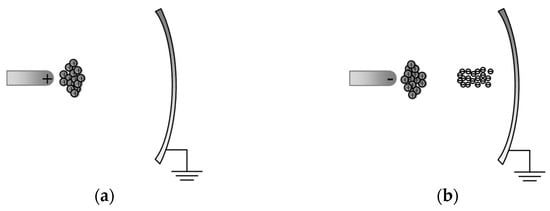
Figure 25.
Space charge distribution graph of protrusion defects. (a) Positive protrusion; (b) nega-tive protrusion.
At this point, the distribution of the electric field changes due to the effect of the space charges. The field for the positive protrusion is weakened, while the field for the negative protrusion is strengthened. This is the reason that PD first occurs at the negative half-cycle of the voltage, and then occurs at the positive half-cycle.
As PD starts to occur, the discharges are mainly the streamer discharges, which propagate in a short channel [21]. With the development of the streamer discharge, a large amount of positive charges remain in front of the protrusion, which is shown in Figure 26a. The space positive charges strengthen the electric field in front of the discharge plasma.
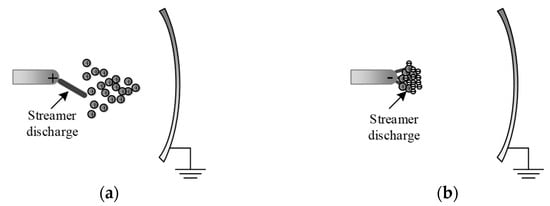
Figure 26.
Space charge distribution graph of protrusion defects under streamer discharge. (a) Positive protrusion; (b) negative protrusion.
The streamer discharges of the negative protrusion are dispersive, which make a dispersive plasma sphere around the electrode, as is shown in Figure 26b. This plasma sphere plays a similar effect in increasing the curvature radius of the electrode, which weakens the frontier field.
Therefore, the discharge magnitude of the positive protrusion is higher than that of negative protrusion. As the voltage increases, the streamer discharge propagates stepwise.
As the voltage further increases, breakdown may occur at the positive half-cycle of the voltage. At this point, the streamer discharge becomes very strong. Although the space charges weaken the frontier electric field, there is leader discharge along the periphery of the positive space charge due to the very high applied voltage, as is shown in Figure 27. The leader discharge propagates in a long channel and its magnitude is high. When the voltage increases to a certain value, breakdown occurs due to the leader discharge through the electrode.
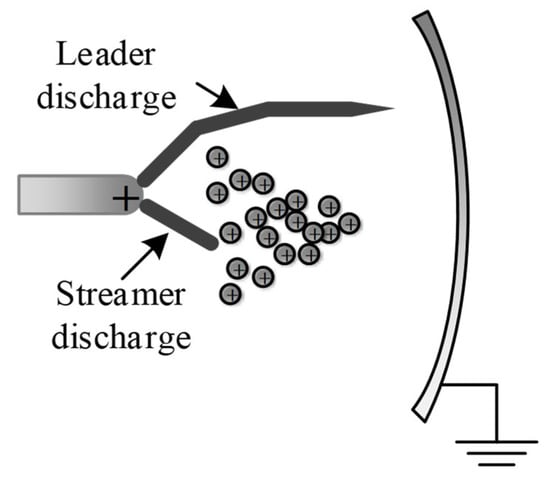
Figure 27.
Leader discharge of protrusion defects.
Above all, the PD of the protrusion on the conductor occurs at the negative half-cycle of the voltage at the beginning of the process. Then, PD occurs at the positive half-cycle as the voltage increases. Because the PD of the positive protrusion is easier to develop than that of negative protrusion, the maximum amplitude increases greatly. After that, the discharge is mainly streamer discharge. As the voltage increases, the maximum amplitude increases slightly due to the effects of space charges. Finally, leader discharge occurs, and breakdown also occurs. At this time, there is some extremely high amplitude discharge at the peak of the voltage. Therefore, the maximum amplitude increases fast.
The PD of the protrusion on the enclosure first occurs at the positive half-cycle of the voltage since the protrusion is grounded. After that, the development of the PD is similar to that of the protrusion on the conductor.
Partial discharge causes charge exchange, leading to the apparent charge on the test sample. The pulse current forms due to the apparent charge though the test circuit. The pulse current method detects the PD by measuring the pulse current. Therefore, the result of the pulse current method has a significant relationship with the circuit parameters, and the results are easily interfered with by noise.
The results have shown that the sensitivity of the pulse current method is the lowest among the three methods. The reason for this is that the PD of the protrusion is low, while the noise of the circuit is high. The PD of the 12 mm protrusion on the conductor is detected by the pulse current method at a voltage of 235.12 kV, and the maximum magnitude is about 15 pC, as is shown in Figure 18. It can be seen from Figure 17 that the magnitude of the noise is nearly 10 pC.
The ultrasonic signal of PD is caused by the charge neutralization, which produces the pulse current. The current makes the PD area expand due to the high temperature, which is similar to an explosion. After the discharge, the expansion area return to the original volume. The volume change causes the medium density to change, which forms the ultrasonic signal. The ultrasonic signal is only related to the discharge energy [12].
The UHF signal of PD is also caused by the pulse current. The rise in the current is at an ns level,; therefore, it radiate electromagnetic waves with a frequency of 0.3~3 GHz, which is the UHF signal. Because the electric field intensity of the radiated electromagnetic is positively related to the frequency of the pulse current, the UHF signal of PD in GIS is positively related to the rising gradient of the pulse current [22].
5. Conclusions
In this study, we designed metal protrusions with different lengths on the conductor and protrusion on the enclosure, and detected the PD of these defects using the pulse current, UHF and ultrasonic methods at the same time. It can be concluded that the process from the inception of the PD to breakdown can be divided four sections based on the PRPD patterns and the changes in the maximum discharge amplitude. This is related to the occurrence and development of streamer discharge and leader discharge.
In addition, although the signals of these three methods are all related to the pulse current, their sensitivities are different. Among these three methods, the sensitivity of the pulse current method is the weakest due to its poor anti-jamming capability. The sensitivity of the ultrasonic method is the highest because ultrasonic signals are related to the discharge energy and the signal propagation path is relatively shorter. The sensitivity of UHF is lower than the ultrasonic method, since the UHF signal is related to the rising gradient of the pulse current, and the signal propagation path is longer.
Author Contributions
Formal analysis, M.D.; Investigation, X.H. (Xiaochuan Huang); Resources, W.S.; Data curation, Z.Z.; Writing—original draft, W.X.; Writing—review & editing, X.K. and X.S.; Supervision, X.H. (Xutao Han). All authors have read and agreed to the published version of the manuscript.
Funding
This research was funded by the Science and Technology Project of State Grid Henan Electric Power Company: Key Technologies for Few-Photon Detection of Typical Defects in UHV/GIS Equipment (Grant No. 52170224001M). The APC was funded by the State Grid Henan Electric Power Company.
Institutional Review Board Statement
Not applicable.
Informed Consent Statement
Not applicable.
Data Availability Statement
The data presented in this study are available in the article.
Conflicts of Interest
The authors declare no conflict of interest.
References
- Sabot, A.; Petit, A.; Taillebois, J.P. GIS insulation co-ordination: On-site tests and dielectric diagnostic techniques, A utility point of view. IEEE Trans. Power Deliv. 1996, 11, 1309–1316. [Google Scholar] [CrossRef]
- Boggs, S.A.; Stone, G.C. Fundamental limitations in the measurement of corona and partial discharge. IEEE Trans. Electr. Insul. 1982, EI-17, 143–150. [Google Scholar] [CrossRef]
- Kemp, I.J. Partial discharge plant-monitoring technology: Present and future developments. IEEE Proc. Sci. Meas. Technol. 1995, 142, 4–10. [Google Scholar] [CrossRef]
- Bartnikas, R. Partial discharges-their mechanism and measurement. IEEE Trans. Dielectr. Electr. Insul. 2002, 9, 763–808. [Google Scholar] [CrossRef]
- Nattrass, D. Partial discharge XVII: The early history of partial discharge research. IEEE Electr. Insul. Mag. 1993, 9, 27–31. [Google Scholar] [CrossRef]
- Gutfleisch, F.; Niemeyer, L. Measurement and simulation of PD in epoxy voids. IEEE Trans. Dielectr. Electr. Insul. 1995, 2, 729–743. [Google Scholar] [CrossRef]
- IEC 60270; High-Voltage Test Techniques: Partial Discharge Measurement. Bureau of Indian Standards: New Delhi, India, 2011.
- Cavallini, A.; Conti, M.; Montanari, G.C.; Arlotti, C.; Contin, A. PD inference for the early detection of electrical treeing in insulation systems. IEEE Trans. Dielectr. Electr. Insul. 2004, 11, 724–735. [Google Scholar] [CrossRef]
- Si, W.; Li, J.; Yuan, P.; Li, Y. Digital detection, grouping and classification of partial discharge signals at DC voltage. IEEE Trans. Dielectr. Electr. Insul. 2008, 15, 1663–1674. [Google Scholar] [CrossRef]
- Sellars, A.G.; Farish, O.; Hampton, B.F.; Pritchard, L.S. Using the UHF technique to investigate PD produced by defects in solid insulation. IEEE Trans. Dielectr. Electr. Insul. 1995, 2, 448–459. [Google Scholar] [CrossRef]
- Kurrer, R.; Feser, K. The application of ultra-high-frequency partial discharge measurements to gas-insulated substations. IEEE Trans. Power Deliv. 1998, 13, 777–782. [Google Scholar] [CrossRef]
- Lundgaard, L.; Runde, M.; Skyberg, B. Acoustic diagnosis of gas insulated substations: A theoretical and experimental basis. IEEE Trans. Power Deliv. 1990, 5, 1751–1759. [Google Scholar] [CrossRef]
- Lundgaard, L.; Tangen, G.; Skyberg, B.; Faugstad, K. Acoustic diagnoses of GIS; field experience and development of expert system. IEEE Trans. Power Deliv. 1992, 7, 287–294. [Google Scholar] [CrossRef]
- Si, W.; Li, J.; Li, D.; Yang, J.; Li, Y. Investigation of a comprehensive identification method used in acoustic detection system for GIS. IEEE Trans. Dielectr. Electr. Insul. 2010, 17, 721–732. [Google Scholar] [CrossRef]
- Li, J.; Zhao, X.; Yang, J.; Li, D.; Li, Y. Partial Discharge Measurement and Analysis of Typical Defects in GIS. High Volt. Eng. 2009, 35, 2440–2445. [Google Scholar]
- Shao, X.; He, W.; Shi, H.; Zhou, X.; Liu, H.; Xu, H. Experimental Study on Partial Discharge Detection Characteristics of UHF Sensors in GIS. High Volt. Appar. 2015, 51, 46–55. [Google Scholar]
- Duan, D.; Wang, Y.; Jiang, Y.; Sheng, G.; Li, W. Research on Partial Discharge Development Patterns and Diagnostic Methods for Typical Insulation Defects in SF6 Gas-Insulated Switchgear. Electr. Meas. Instrum. 2017, 54, 114–122. [Google Scholar]
- Zhao, X.; Yao, X.; Guo, Z.; Li, J.; Si, W.; Li, Y. Characteristics and Development Mechanisms of Partial Discharge in SF6 Gas Under Impulse Voltages. IEEE Trans. Plasma Sci. 2011, 39, 668–674. [Google Scholar] [CrossRef]
- Hoshino, T.; Nojima, K.; Hanai, M. Real-Time PD Identification in Diagnosis of GIS Using Symmetric and Asymmetric UHF Sensors. IEEE Trans. Power Deliv. 2004, 19, 1072–1077. [Google Scholar] [CrossRef]
- Liu, J.; Yao, M.; Huang, C.; Guo, C.; Yao, L.; Jiang, C. Experimental Study on Partial Discharge Localization in GIS Using Acoustic-Electric Combined Method. High Volt. Eng. 2009, 35, 2458–2463. [Google Scholar]
- Hayakawa, N.; Hatta, K.; Okabe, S.; Okubo, H. Streamer and leader discharge propagation characteristics leading to breakdown in electronegative gases. IEEE Trans. Dielectr. Electr. Insul. 2006, 13, 842–849. [Google Scholar] [CrossRef]
- Judd, M.D.; Farish, O.; Hampton, B. The excitation of UHF signals by partial discharges in GIS. IEEE Trans. Dielectr. Electr. Insul. 1996, 3, 213–228. [Google Scholar] [CrossRef]
Disclaimer/Publisher’s Note: The statements, opinions and data contained in all publications are solely those of the individual author(s) and contributor(s) and not of MDPI and/or the editor(s). MDPI and/or the editor(s) disclaim responsibility for any injury to people or property resulting from any ideas, methods, instructions or products referred to in the content. |
© 2025 by the authors. Licensee MDPI, Basel, Switzerland. This article is an open access article distributed under the terms and conditions of the Creative Commons Attribution (CC BY) license (https://creativecommons.org/licenses/by/4.0/).