Article

Dynamic Analysis of an Offshore Knuckle-Boom Crane Under Different Load Applications Laws

DIMI Department, University of Brescia, Via Branze 38, 25123 Brescia, Italy
*
Author to whom correspondence should be addressed.
These authors contributed equally to this work.
Appl. Sci. 2025, 15(14), 8100; https://doi.org/10.3390/app15148100
Submission received: 12 June 2025 / Revised: 7 July 2025 / Accepted: 18 July 2025 / Published: 21 July 2025

Abstract

This study investigates the dynamic behavior of an articulated boom offshore crane under various load application laws. The following steps were taken to perform numerical simulations using the finite-element method (FEM): Definition of the model’s geometry, materials, and boundary conditions. The modal analyses reveal significant resonance frequencies in the direction of load application (payload). The crane’s displacement, velocity, and acceleration responses are closely related to load application laws, specifically the time required to reach the structure’s full payload (epsilon). It is highly correlated with the dynamic factor (maximum acceleration multiplied by payload), which has a wide range of effects on the structure, including the effects of overstress, overturning, buckling, and so on. The main findings reveal a very strong exponential correlation, allowing the dynamic effect to be estimated as a function of epsilon time. This is a useful tool for increasing the safety and reliability of offshore lifting operations.

1. Introduction

Hoisting machines are structures subjected to various loads, including wind forces [1,2], seismic activity [3,4], and the weight being lifted [5,6]. These forces can produce vibrations, leading to overloads that, if not assessed, may compromise the structure due to excessive stress, buckling, and fatigue.
High-performance cranes have been a primary focus for increasing efficiency, emphasizing compact designs and large capacities. Nonetheless, due to reduced production volumes and limited opportunities for prototype development, designers must develop and use simulation models that cover all possible real-world scenarios. During crane design, consider standards (e.g., [7,8,9]) that take into account various load conditions, such as self-weight, payload effects, and wind effects, treating them as constant forces acting on the crane structures. Nonetheless, these behaviors are not temporally consistent. Several studies have examined the dynamic analysis of load conditions and their temporal variations [10], abrupt release of a portion of the hoist load [11], and the impact of load motion [12,13]. Other aspects taken into consideration are the crane’s fatigue behavior [14,15], buckling phenomena [16,17], or particular components of the crane [18,19,20]. These factors must be considered when designing high-performance cranes. The knuckle-boom crane, also known as an articulating crane, is an example of a hoisting machine that cannot be economically prototyped, necessitating a thorough examination of its design. These cranes have two booms connected by a knuckle, which increases versatility and functionality.
The literature has already examined the dynamic behavior of these structures: Bak and Hansen [21] introduced a model of a knuckle-boom crane as a two-dimensional multi-body system incorporating structural flexibility and damping. They created a reliable model using the finite segment method to check flexibility and a method to measure structural damping. These methods are not optimal for modelling flexibility; nonetheless, they are more effective in minimizing the workload required for modelling and computation. Utilizing experimental data, they successfully validate the proposed model in three phases: verifying the steady-state specifications of the mechanical system model, validating the steady-state characteristics of the motion control system model, and assessing the dynamic behavior of the crane model.
Adamiec-Wójcik et al. [22] established a three-dimensional mathematical model of a knuckle-boom crane, which was validated by many dynamic analyses to assess the dynamic coefficient and compare it with the values specified by the standards. The primary benefit of this model is the capability to incorporate lumped masses and stresses at any location on rigid parts, excluding the joints. Testing several crane configurations with specified parameters significantly reduces the time needed for intricate construction analysis.
Regarding the methodology for modelling the dynamics of these systems, there is an increasing amount of literature. Moi et al. [23] employed a digital twin methodology for the condition monitoring of a small-scale knuckle-boom crane; the utilization of a non-linear finite-element program facilitated real-time condition assessment, hence improving predictive maintenance and safety.
Landsverk et al. [24] devised a control methodology to mitigate payload swing in offshore knuckle-boom cranes utilizing an iterative learning algorithm while also demonstrating adaptation and experimental implementation via a manipulator to encapsulate the fundamental dynamics of a conventional offshore knuckle-boom crane. It was found that although simulated movements often show inconsistencies, adding a round joint between the crane’s end and the wire is expected to provide nearly the best anti-swing performance for real loads, too.
Cibicik et al. [25] modelled the dynamics of the crane, specifically the luffing motion driven by hydraulic cylinders, as a planar multi-body system. This methodology utilizes screw transformations and bond graph techniques to integrate crane dynamics with hydraulic cylinder mass balancing, corroborated by finite-element analysis conducted with ANSYS®.
All work on this crane focused on variations in the selected models or methodology used, with the goal of reducing calculation time or improving result accuracy, which was occasionally supported by experimental data. The research studies do not look into the impact of load condition variables, such as the duration of load application, which could be critical to the crane’s safety.
The objective of this research is to examine the dynamic behavior of an offshore knuckle-boom crane, focusing on finding a correlation between the time of load application and the crane’s dynamic behavior. This research study implies modal and dynamic analysis through FEM on a simplified model adopted to reduce the computational time. Since various positions of the crane can be studied, here the two most dangerous configurations are analyzed, which are critical for the structure itself. It must be highlighted that complex phenomena, such as the effect of blast loading on the properties of the material [26] or the damage of the ground due to the operation [27], are left out. The relevance of this work stems from the potential applications that become feasible upon a comprehensive understanding of its dynamic behavior. Moreover, since both the resonance frequencies and the consequences given by the time of load’s application (e.g., the accelerations) depend on the stiffness of the crane, this result can be implemented for other cranes with a similar dynamic behavior and natural frequencies. In particular, once this aspect is fully elucidated (considering also other load conditions such as the wind loads [28] or the earthquake vibrations [29,30]), a range of materials can be suitably employed with the aim of lightweighting the structure as already done by the authors [31] and in the literature [32,33].
The ensuing portions of the research article are structured as follows: Section 2 specifies the materials and model utilized, as well as the configurations analyzed. Section 3 delineates the outcomes obtained from the dynamic analysis, which are further examined in Section 4. Section 5 eventually provides a summary and assessment of the findings.

2. Materials and Methods

2.1. Description of the Analyzed Crane

The offshore knuckle-boom crane studied consists mainly of three main areas that compose the entire structure:
  • loading section, composed of the movable parts that allow the uplift;
  • translation and rotation module, which are the moving parts that allow relative movement between the loading and handling module;
  • movement module, composed of the moving parts that allow relative motion between the ground and the structure.
Figure 1 shows the 3D model of the analyzed crane.
Specifically, the loading section is composed of different elements: the stick, which is the beam where the load is applied; the boom, the beam that links the stick to the main frame of the loading section; the counterweight arm; the tie rods, connecting pins, the main frame, and the control cabin. The moving parts facilitate the relative motion between the ground and the structure. To understand the dimensions, the length of the stick is 14 m, and the length of the boom is 17.5 m. The following components define the translation and rotation module:
  • the translation cart (needed for the translation movement);
  • the cylinder;
  • the fifth wheel (needed for the rotation movement, an example [34]);
  • the anti-tilting system.
The movement module basically consists of a portal structure that can be moved by four handling carts. To comprehend the size, this structure is 10 m tall and 30 m long. The following are the project specifications:
  • liftable load with the boom in horizontal position: 300,000 N;
  • spreader weight: 100,000 N;
  • maximum outreach: 30 m;
  • maximum height to take the container: 20 m;
  • maximum depth reached below the ground level: 20 m.
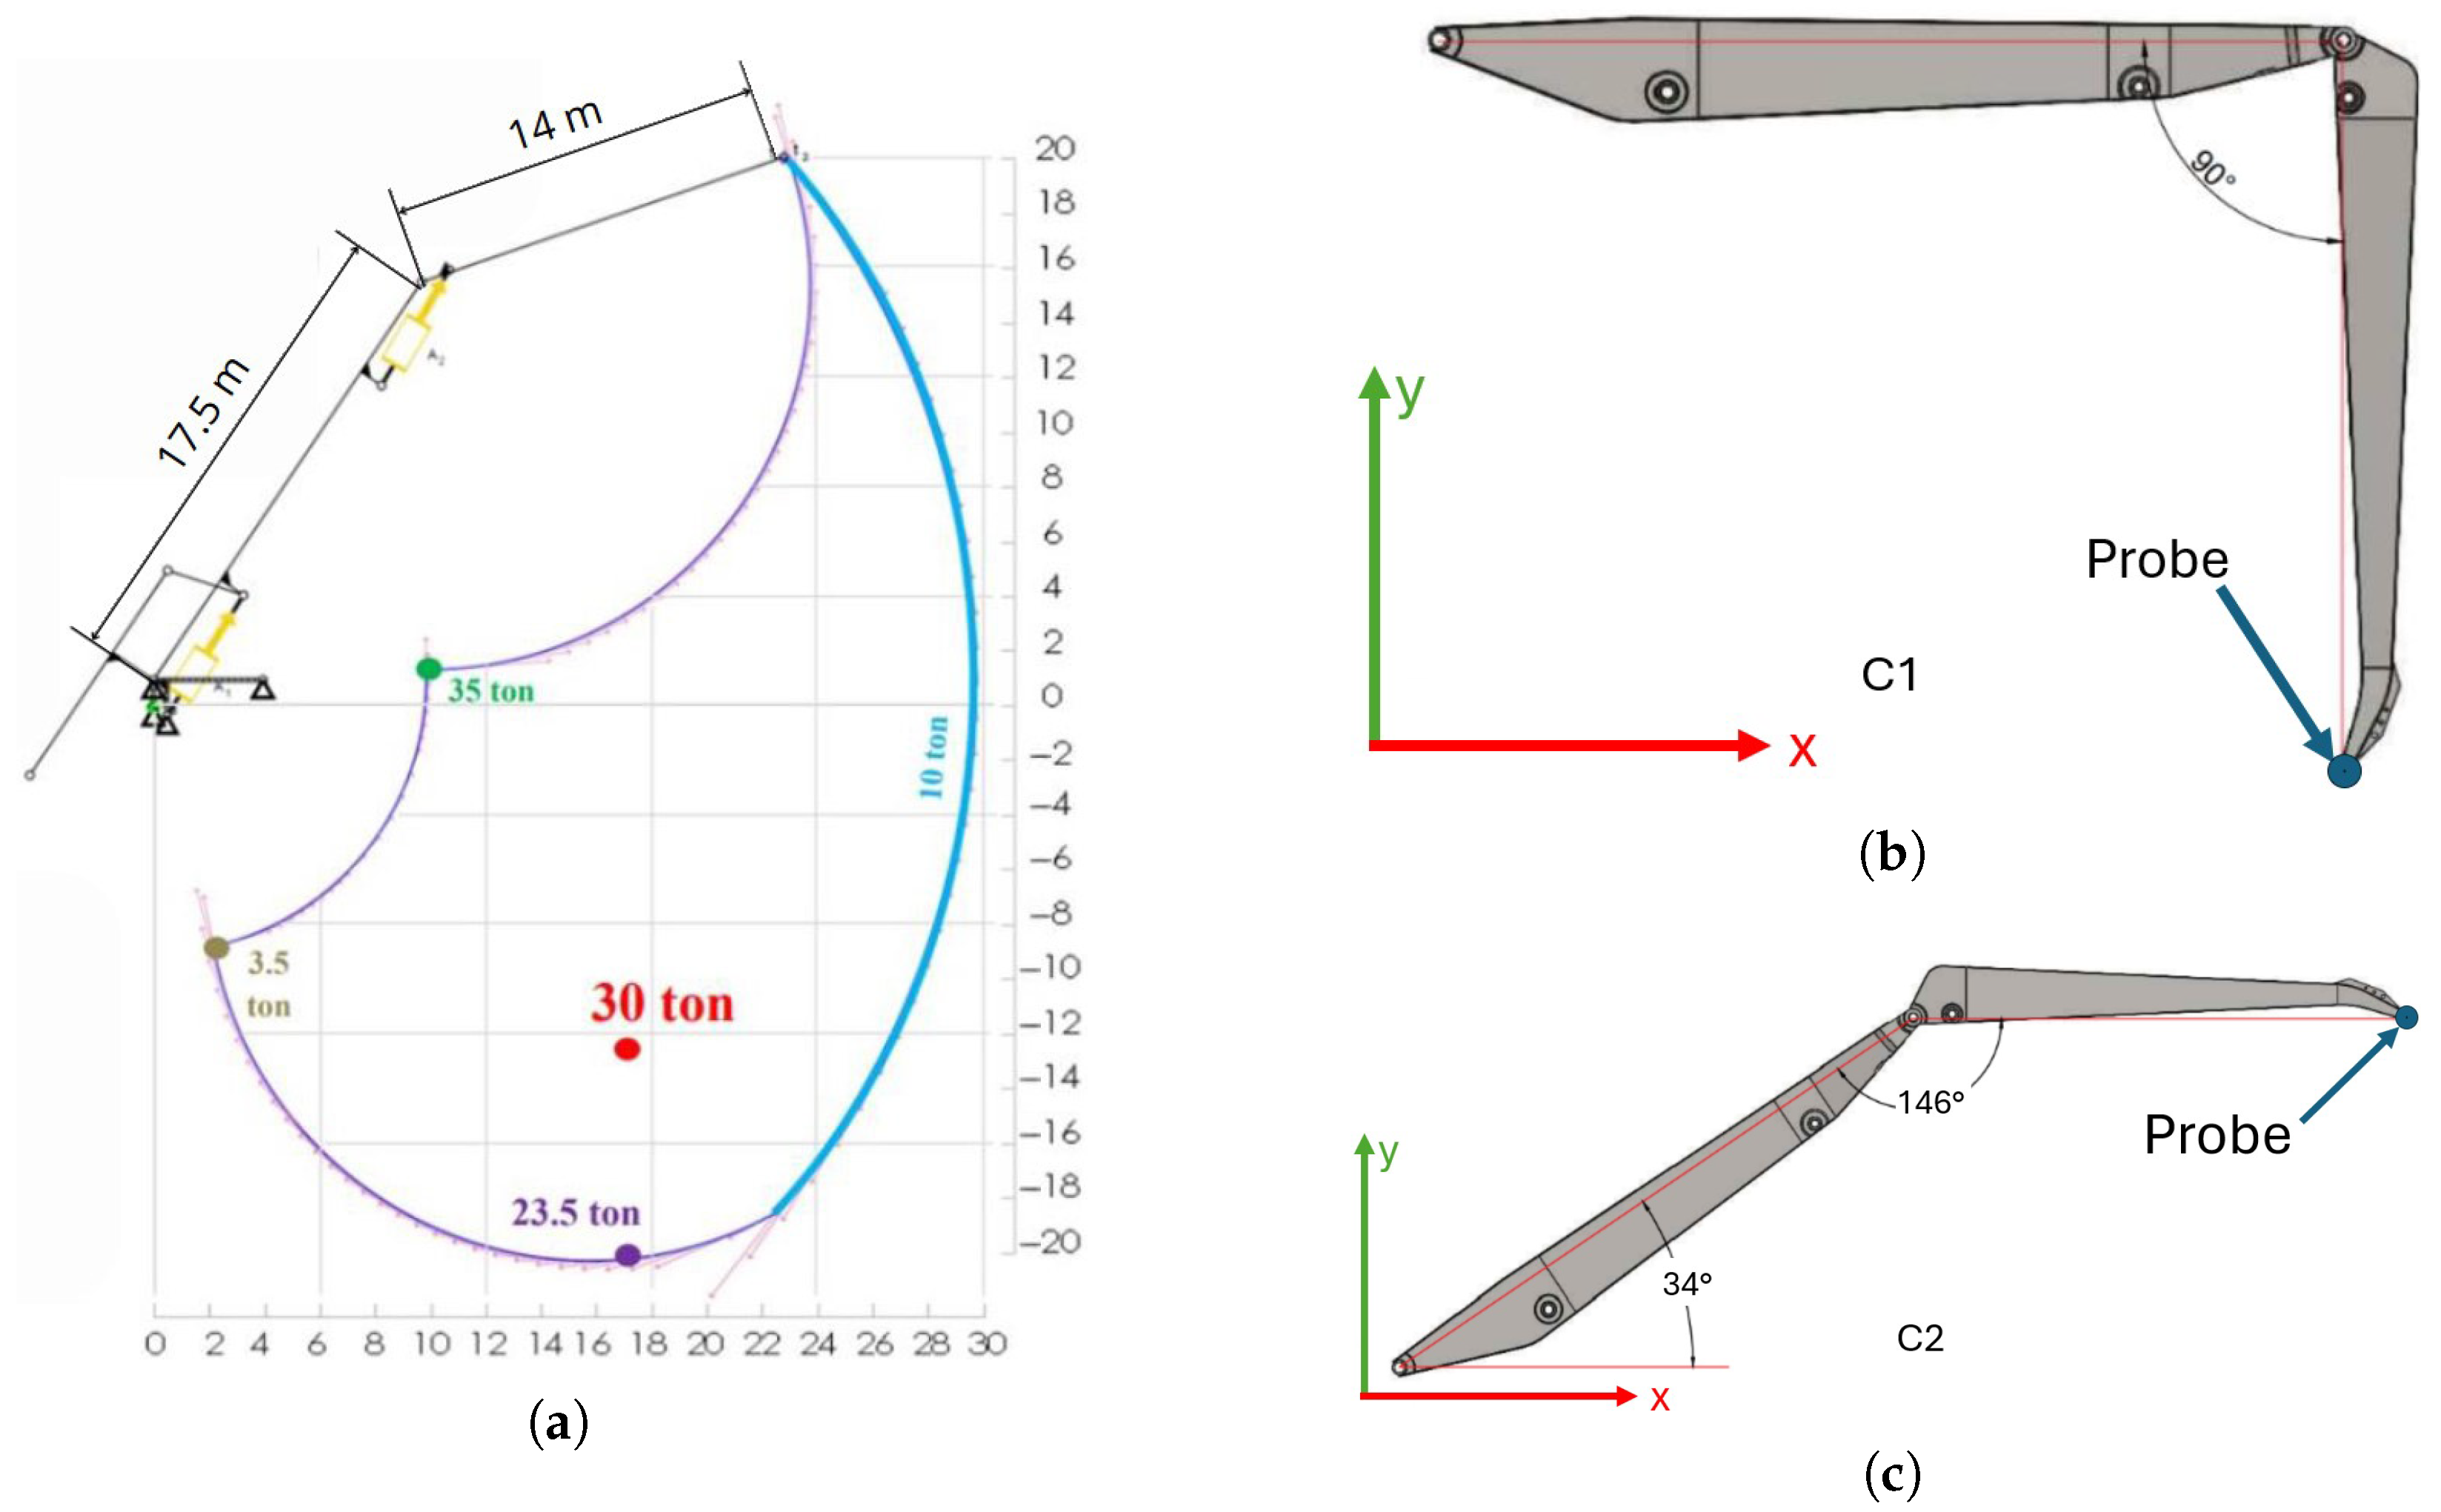
Structural steel S355JR (EN 10025-2 [35]) (steel alloy with σ y = 355 MPa for thickness t 16 mm; σ y = 345 MPa for thickness 16 mm t 40 mm; σ r = 510 MPa and elastic modulus E = 206,000 MPa) was adopted for the construction of the crane, being a common material for big structures such as earth-moving machinery [36,37] and even for marine applications [38]. The main parameters implemented for the crane design are defined according to the series of standards EN 13001 [7]; in Figure 2a, it is possible to see the operating range of the crane. Analytical evaluation identified two configurations as critical for the crane, which were named C1 and C2 in this research study. The main criteria for the two configurations of the crane stands in the highest stress for its components, as already shown in a previous research work [39]. The first position is critical mainly for the boom: with this component horizontal and the stick perpendicular to the ground, as can be observed in Figure 2b, the bending moment for the boom here is higher than every other configuration, considering also that the liftable load here can reach 300,000 N. The second position, where the position of the boom and stick is shown in Figure 2c, is perilous for the component called stick, with an upper value of the liftable load equal to 100,000 N. Here, it is also possible to notice where the displacement is analyzed in Section 3: a probe at the end of the stick is placed to extrapolate the displacement along the Y-axis.

2.2. Simplified Model

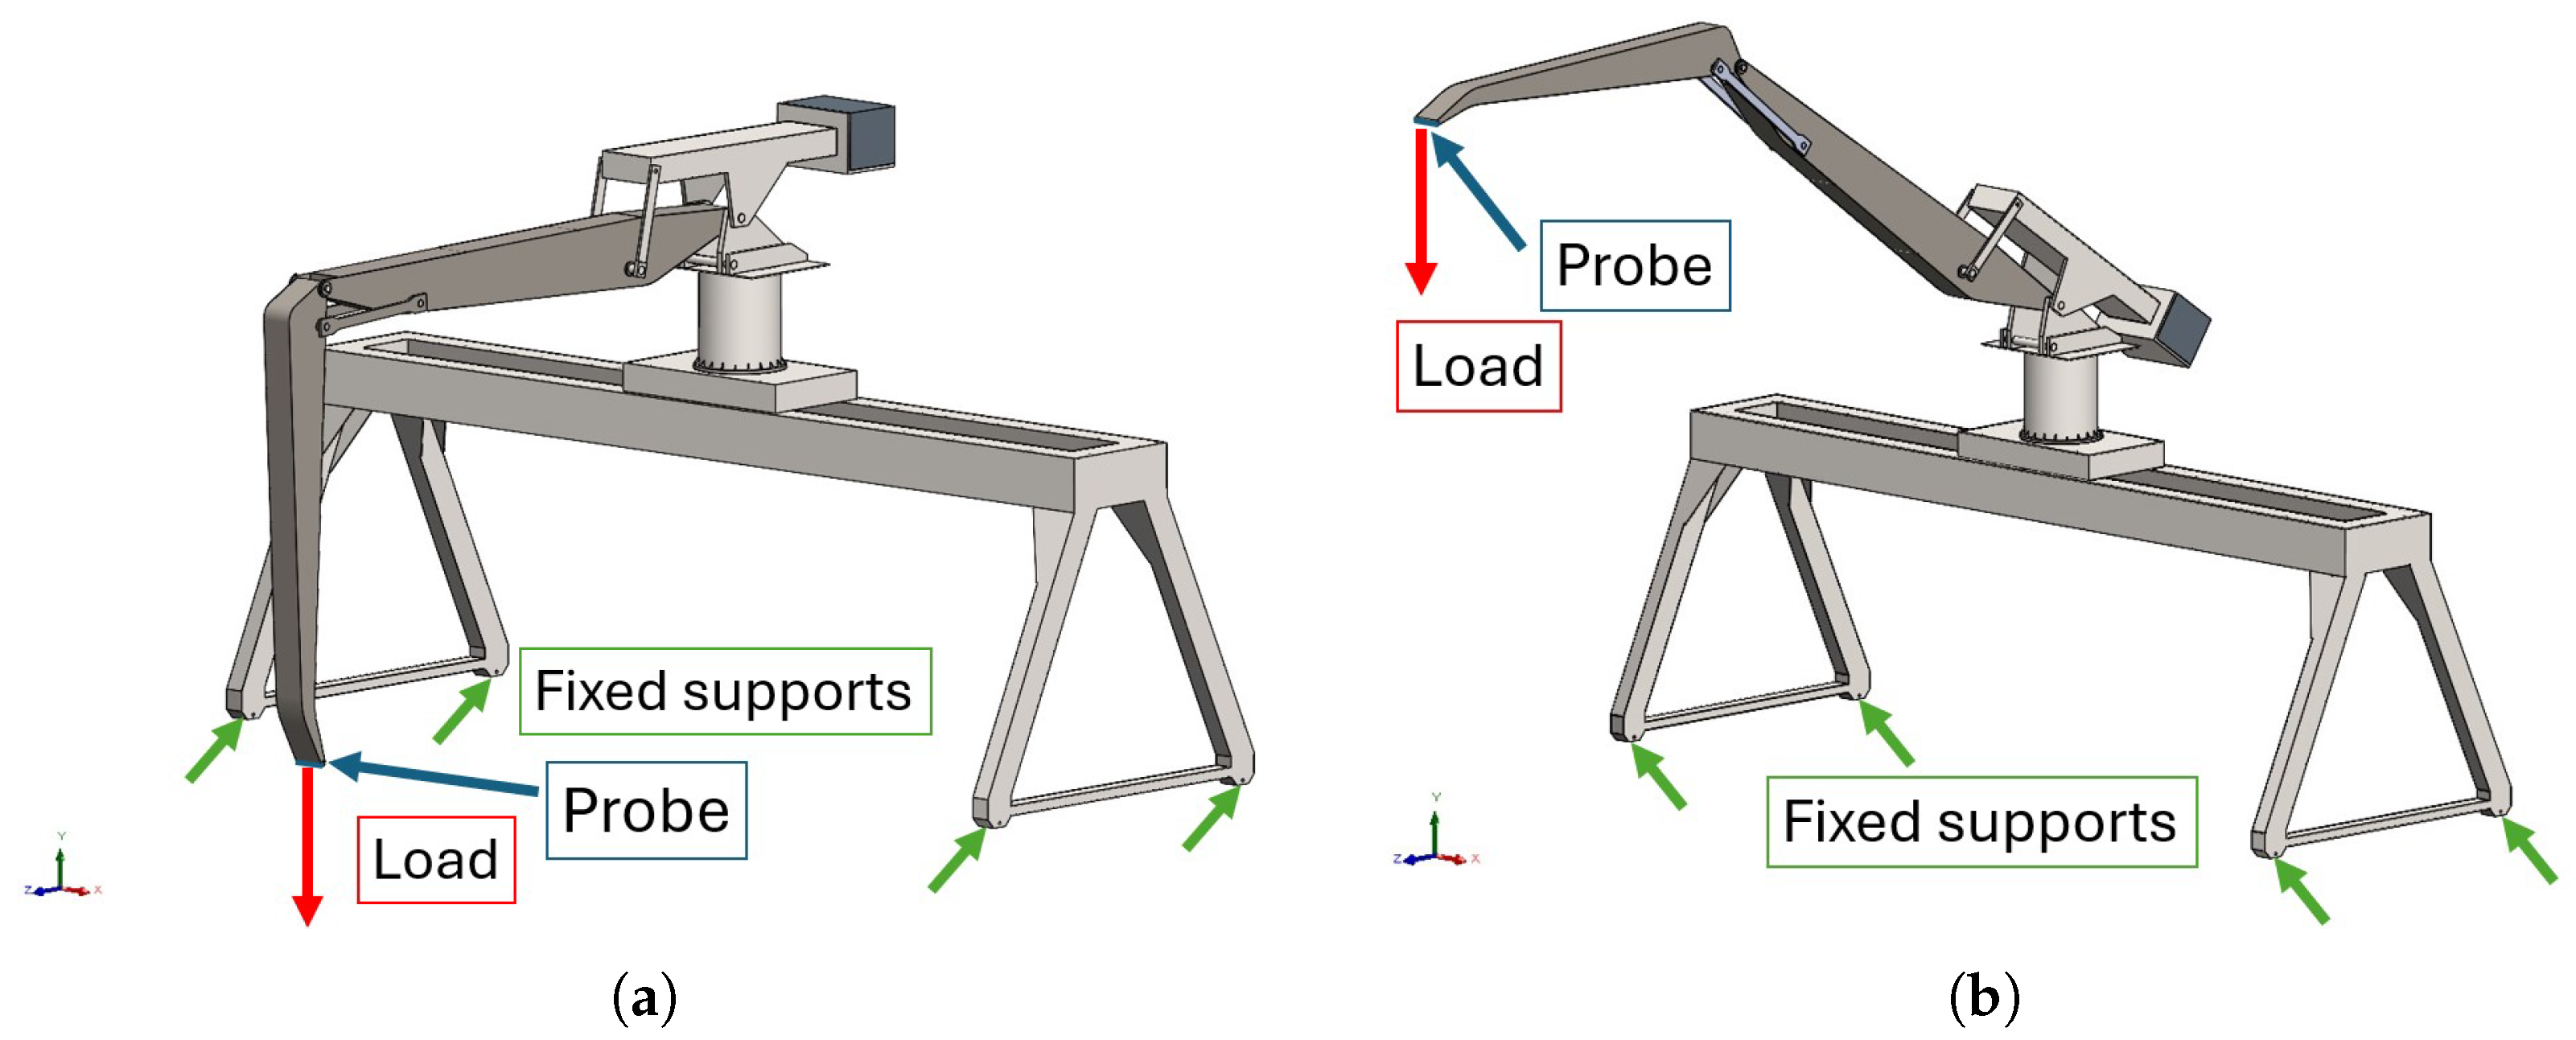
In this research study, a simplified model was implemented to run the FE analysis, with the aim of reducing computational time. This model is characterized by the same stiffness as the detailed one, as well as a similar mass. In Figure 3, it is possible to see the simplified model and the position of the crane in the different evaluated configurations. Even here, the position of the probe where the displacement is extrapolated for both configurations is shown.
The FEM was composed of 72,000 quadratic solid elements and 130,000 nodes. This model was the result of an iterative process of numerical simulations, aiming for convergence in the displacements. The analyses were performed on SolidWorks® (2024) software through the direct integration method. This methodology can be defined through the Equation (1) [40,41]:
[ M ] { D ¨ } n + [ C ] { D ˙ } n + [ K ] { D } n = { R e x t } n
Here, the subscript n denotes the time instant, [ M ] represents the mass matrix, [ C ] signifies the damping matrix, [ K ] indicates the stiffness matrix, { D ¨ } , { D ˙ } , and { D } correspond to the nodal acceleration, nodal velocity, and nodal displacement vectors, respectively, while { R e x t } denotes the external action vector. Specifically, Solidworks® employs the Newmark method, a technique that presumes the material properties and structural geometry remain constant throughout the time interval Δ t , utilizing two parameters ( γ and ϕ ) to facilitate the solution update at each iteration. The Equations (2) and (3) delineate the updates for the displacement and velocity of the numerical solution:
{ D } n + 1 = u n + Δ t { D ˙ } n + Δ t 2 2 ( 1 2 ϕ ) { D ¨ } n + 2 ϕ { D ¨ } n + 1
{ D ˙ } n + 1 = { D ˙ } n + Δ t ( 1 γ ) { D ¨ } n + γ { D ¨ } n + 1
About the damping matrix, Equation (4) shows how it is obtained in these analyses:
[ C ] = α [ M ] + β [ K ]
where α and β are the Rayleigh damping variables, set to 1.5 and 0.001, respectively, for this structure [42]. These values are the results of numerical evaluation on a step load law: here, the logarithmic decrement was calculated in order to observe the damping of the structure, as already discussed in the literature [43,44].
Regarding constraints and loads, Figure 3 also shows the boundary conditions imposed: the model was defined with four fixed supports to simulate its attachment to the ground at the ends of the legs of the portal structure. For the applied load, a force equal to 300,000 N for configuration C1 and 100,000 N for configuration C2 is applied to the end of the component called the “stick”. The reason behind different loads for different configurations is the result of an analytical evaluation described by Figure 2a.
To understand the process of modification of the model, Figure 4 shows an example of the simplification process: here it is possible to see that most of the components were removed to lighten the computational effort. The main goal in this phase was to obtain similar stiffness and mass of the whole structure, since our goal is to analyze the dynamic behavior of the whole structure and not just the single component. This process was already implemented in previous research works [39,45].

3. Results

Many different modal analyses were conducted in order to evaluate the fundamental natural frequencies of the crane. The first goal is to assess the structural response under time-variable actions using the principle of modal superposition. The second one is to study the dynamic behavior of the structure in relation to load conditions.
The analyses were performed for both configurations, examining the first four modes of vibration along the Y-axis, as illustrated in Figure 5 for configuration C1 and in Figure 6 for configuration C2. These figures denote the relative displacement at a specific frequency, with the reference for these displacements being the stationary components of the crane. The modal analyses were conducted without considering the mass to be lifted, as this mass does not substantially affect the behavior. The frequency values of the initial vibration modes range from 1 to 5 Hz, which is characteristic of hoisting machines [45,46].
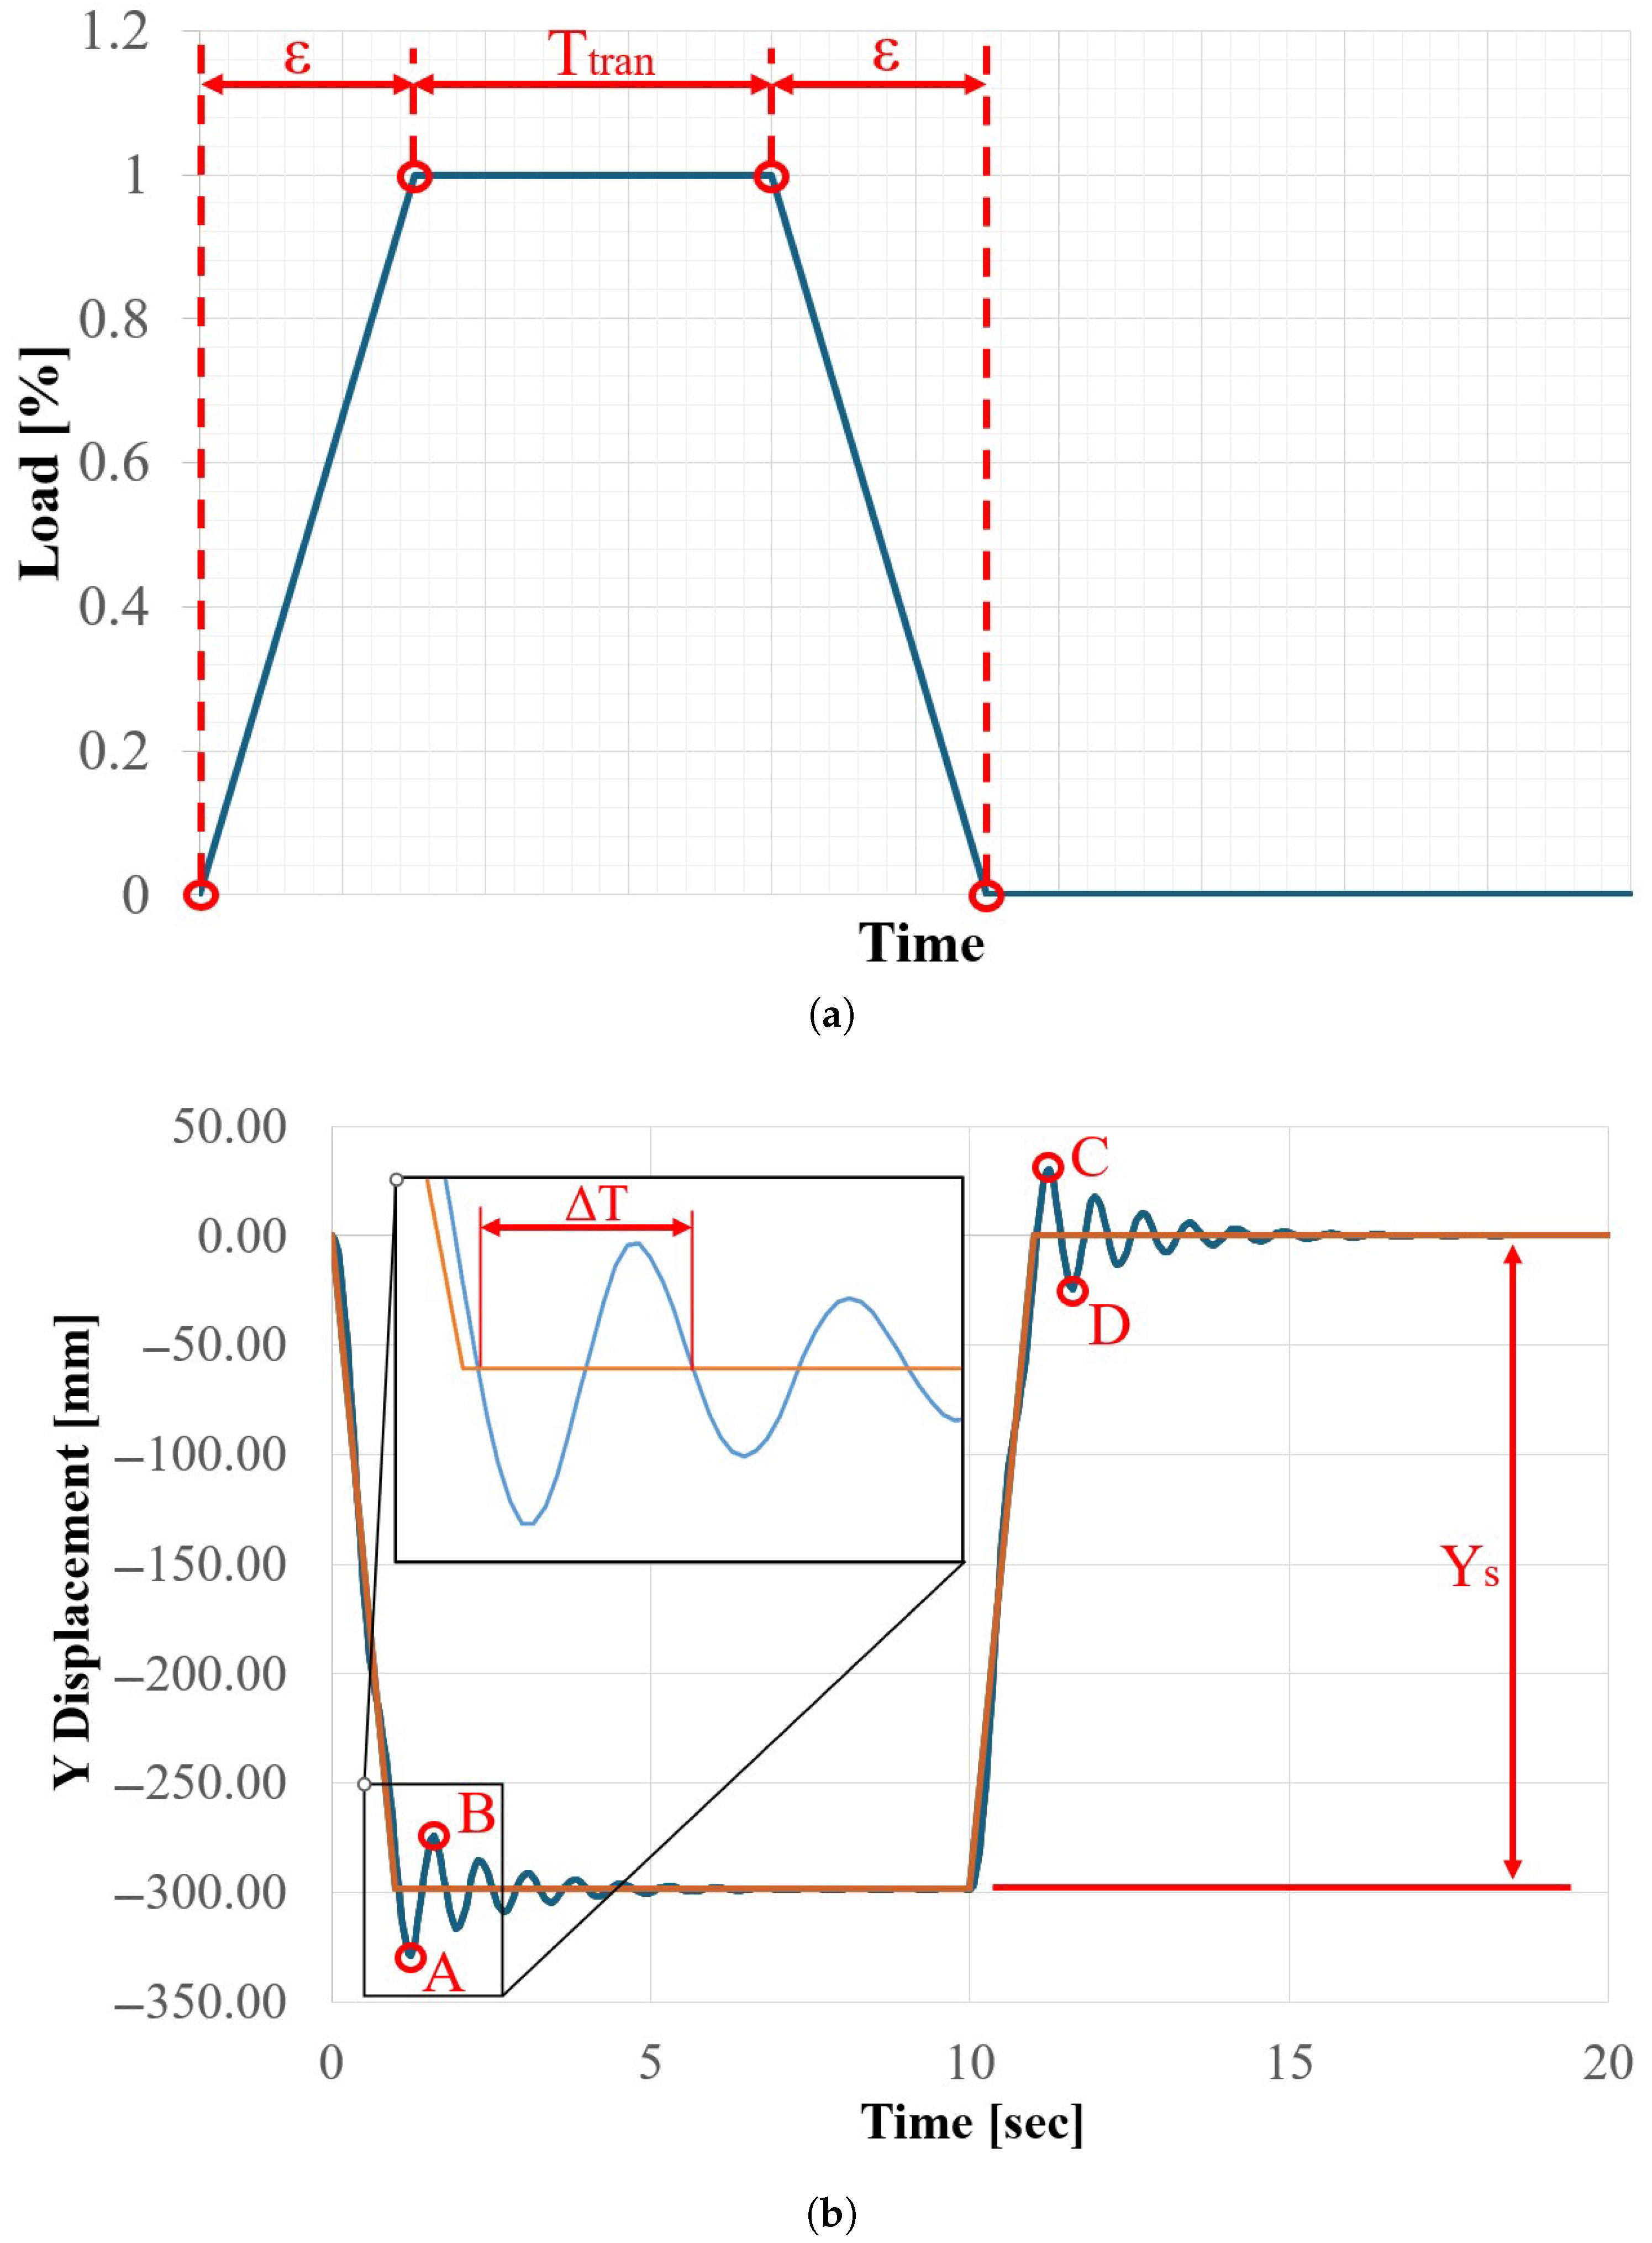
About the application of the load, Figure 7a shows the laws of load applied to the end of the stick component. This pattern was chosen because it has a constant segment that checks how much the accelerations have slowed down and a descending segment that can mean either a load release or, if the time for this segment grows close to zero seconds, a failure of the secure system. Here, we can see two different time periods: ϵ , which is the time needed to apply the maximum liftable load completely, and T t r a n , which is the time set to be longer than the settling time, the time required to reach the final value within a tolerance of ± 5 % . In particular, ϵ is related to the crane’s stiffness and the load’s movement system. As an example, the presence of a magnet or a grab at the end of the component called stick can modify the law of load applied: a magnet defines the release and the application of the load almost instantaneously, meaning a lower value of ϵ and higher accelerations, while the presence of a grab can give a longer time of application and release of the load, therefore lower stress. Figure 7b shows an example of the displacement result which can be obtained by the probe (its position is previously shown in Figure 3). This first result must be observed because it is noted that if the displacement and therefore the relative oscillations are not negligible values, this can induce overstress conditions in the structure that can lead to the collapse of the same [47].
Through this image, it is possible to extrapolate several values, which can be summarized as:
  • point A, which is the lowest peak of the load step;
  • point B, which is the highest peak of the application of the load;
  • point C, which is the highest peak of the load step;
  • point D, which is the lowest peak after the release of the load;
  • the settling value after the application of the load Y s .
These values can be compared with each other; in particular, points A and B can be compared with the settling value after the application of the load, while points C and D can be compared with the settling value after the release of the load, which is the starting displacement (equal to 0 mm). To understand these considerations, Equation (5) shows how the value of the displacement in A, called Y A , was compared with the value after the application of the load, called Y s :
Δ Y A = | Y A Y s | Δ Y A % = | Y A Y s | Y s · 100
Here, the value called Δ Y A is the absolute difference between the first local minimum displacement Y A along the Y-axis described by point A and the expected static displacement Y s . The quantity Δ Y A % represents the percentage deviation of the dynamic response from the expected static displacement at the first local minimum. The same logic can be applied to the other three points previously cited (B,C,D), and changing the time imposed to reach 100% of the application of the maximum liftable load (the so-called ϵ ), it is possible to notice the dynamic response of the structure and predict its behavior with different values.
For a clearer understanding of the results, the following example can be considered: Figure 7b shows the displacement of the stick’s end along the Y-axis, which is the same direction as the load’s application. The value of ϵ chosen is equal to 1 s, and the configuration here studied is the C2 position, meaning a value of the load equal to 100,000 N. Table 1 shows the values extrapolated with the methodology explained previously for both configurations; it is already noticeable the similarity of the values between points A and C and between points B and D, which are different only for orders of magnitude lower than 10 2 . This means that the study of the application and the release of the load are similar. Therefore, to reduce the computational time, only the first load step could be taken into consideration. Furthermore, the obtained values confirm the small deformations hypothesis, considering that the height of the crane reaches 18 m for configuration C1 and 27 m for configuration C2. Confirming even the linear elasticity assumption, the calculated stress remains below the material’s yield strength, also due to the fact that the load is intended to be applied cyclically rather than statically.
Moreover, the evaluation of the velocity and the acceleration of the end of the stick was considered to also analyze the contribution of the inertia forces. Figure 8 shows the trend of the velocity and Figure 9 the acceleration for both configurations evaluated by the probe, whose position is already described in Figure 3, considering only the first second and observing what happens if the variable ϵ is changed.
Another analyzed aspect is the amount of time described in Figure 7b as Δ T : this is the period of a complete oscillation. To understand the results, Table 2 is shown.

4. Discussion

The procedure previously described was applied for both configurations and varying the cited ϵ time, already described in Figure 7a. Since during this crane’s action the overshoot of the Y displacement is critical for the structure, the trend of the values Δ Y A % and Δ Y B % was further investigated and evaluated as demonstrated in Equation (5). In Figure 10, it is possible to see the trend of points A and B related to the settling value after the application of the load. Both of the points have a power trend line with respect to the ϵ time, where the values of point B are always lower due to the damping of the structure. It shows that as the time called ϵ (explained in Section 3) grows shorter, the difference between the highest points and the flat part of the Y displacement curves % Δ Y grows bigger, with a determination coefficient over 0.95. The curve was described by four points obtained from four different analyses with different values of ϵ and another analysis to check the reliability of the curve with ϵ = 0.2 s. This trend line is in both configurations, so it depends on the structure, not the crane’s position. The only difference is the coefficient of determination’s variation when the value with ϵ = 0.2 s is taken or not.
Considering also the value of % Δ Y with ϵ = 0.2 s, as it is possible to see in Table 3, for the configuration C1 the coefficient of determination remains unaffected, but for the configuration C2 it decreased very slightly.
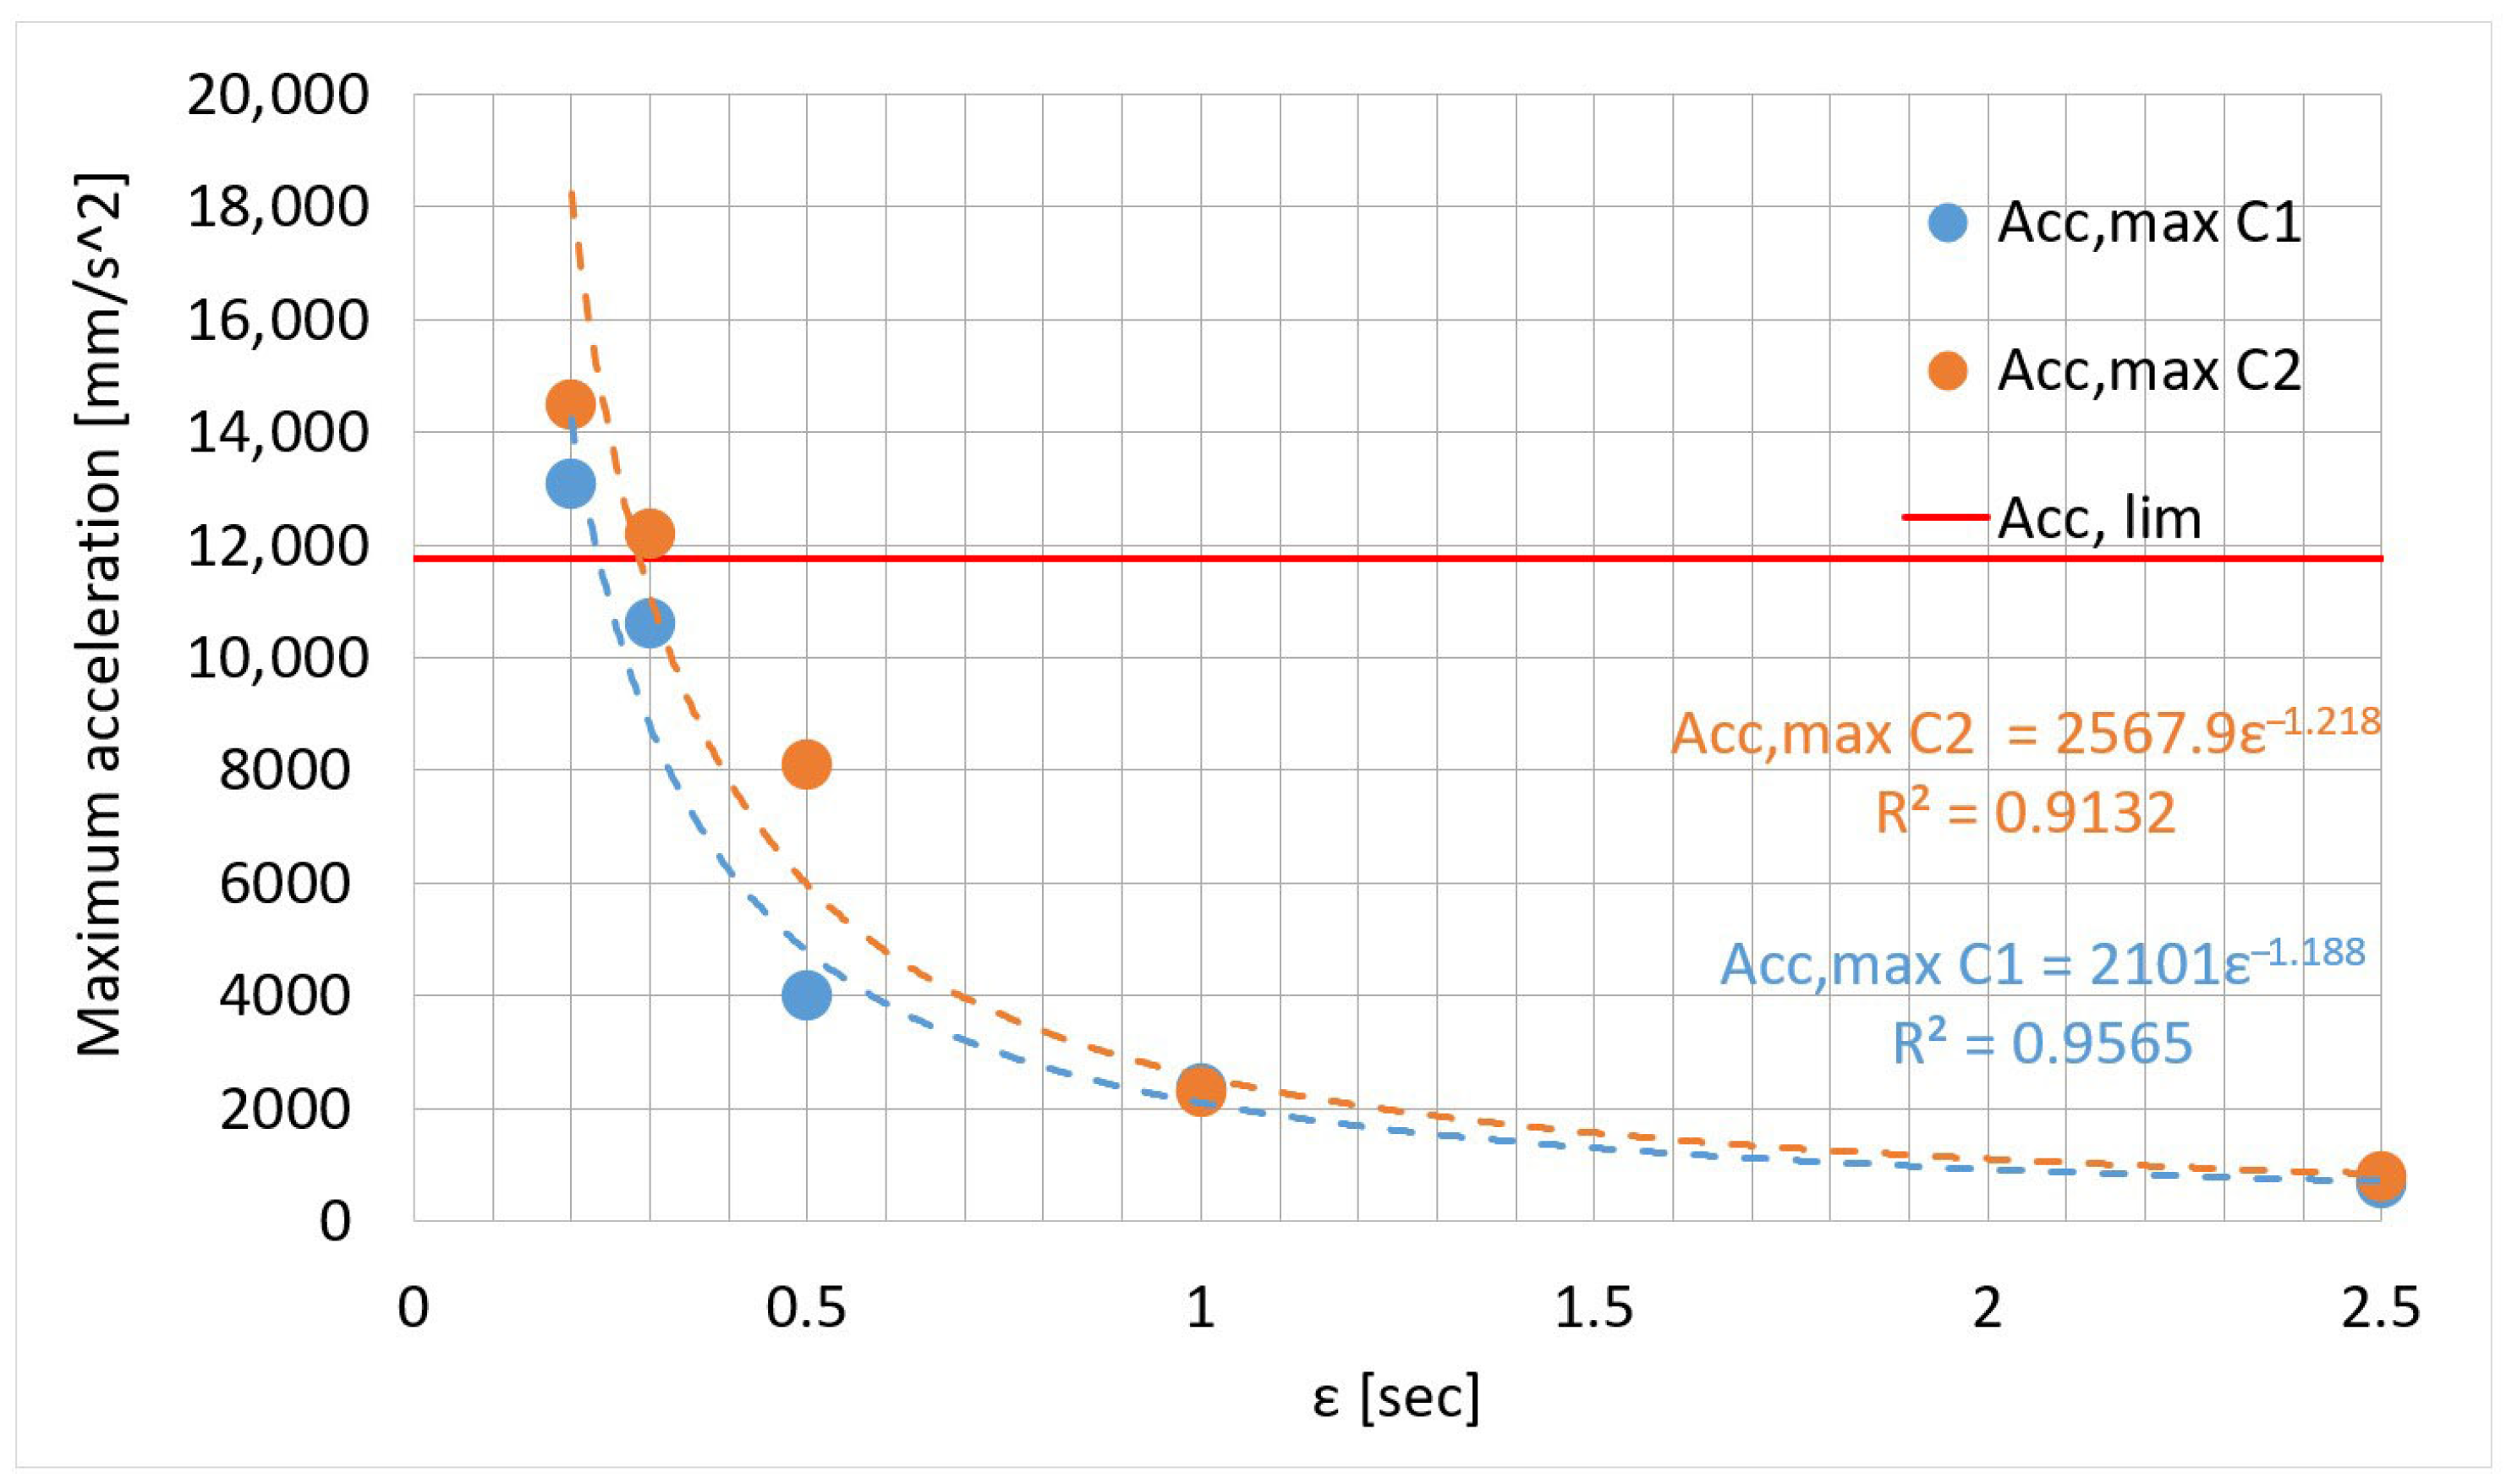
Looking at the velocity in Figure 8a,b, we can see that as ϵ increases, the highest values of the peaks go down and the peaks shift to the right in both setups. For the acceleration, there is also a change in the highest values, reaching up to about 15 m/s2. From Figure 9a,b, we can tell that configuration C2 has the highest accelerations. For the acceleration, a change of the absolute values is seen even here, with maximum values around 15 m/s2. It can be seen from Figure 9a,b that the most critical configuration in terms of higher accelerations is the configuration C2. These high accelerations can have a critical effect on stress and buckling phenomena due to the inertial forces, which can influence the overturning moment (which can be an important cause of accidents, as already seen in other types of cranes [48,49]) and even the loads acting on the ground, with a possibility of injury regarding the operators [43]. To avoid these possible events, a limit on the maximum acceleration must be imposed, considered to be the product between the acceleration of gravity and a parameter Ψ . Here, the value of Ψ is defined as 1.2 [44,45], which means that the limit on the maximum acceleration is set to 11.77 m/s2. Considering the absolute value of the maximum acceleration for each load condition, it is possible to find a value of ϵ that can make the accelerations within the limits. As shown in Figure 11, it is possible to understand that the optimal value of ϵ exceeds 0.3 s. If the value of ϵ (take-up and release time) is about 2.5 s, there are no dynamic effects on the structure in both cases. In contrast, the applied forces match the effective load without any induced effects from the acceleration.
To check the results obtained, these numerical computations were compared to a similar structure that presents similar loads and geometry [50]. The accelerations were in line with the experimental results evaluated in the previous research, giving feedback on the numerical computations conducted here.

5. Conclusions

This research investigates the dynamical behavior of an offshore knuckle-boom crane, observed through modal analyses, and investigates the effect of different laws of load application.
After having defined the model adopted, the material, and the most critical configurations, different modal analyses have been performed to discover the resonance frequencies of the structure in both positions analyzed. Furthermore, dynamic analyses on the load’s application were carried out, considering the main variable, the amount of time needed to reach the complete application of the load, here defined as ϵ .
We can summarize the key findings as follows:
  • Regarding the Y-axis displacement, the decrease of the value of ϵ implies an increase of the overshoot related to the settling value, following a power trend line. Both the analyzed configurations display the same curve.
  • Regarding the accelerations along the Y-axis, even here the decrease of the value of ϵ implies an increase of the maximum accelerations evaluated on the structure, following a power trend line.
  • Taking into consideration also the acceleration limit related to the gravity acceleration, it is possible to suggest a boundary condition on the so-called ϵ time to avoid possible critical effects caused by inertial forces.
Through the extrapolation of the data, it was possible to estimate the influence of the ϵ parameter on the results, allowing for the optimization of the structure and the timing of the application and release of the load.
The comprehension of accelerations’ influence in these structures is crucial during the design phase, as they can result in significant effects such as inertial forces that effectively increase the payload, causing higher stresses on the crane and potentially inducing buckling. Furthermore, accelerations may cause overturning or fatigue effects due to prolonged oscillations.
It must be said that this research is a preliminary study of the effect of different loading conditions on lifting equipment; therefore, it is acceptable to leave out complex phenomena that can affect the properties of the materials or the ground beneath them.
Regarding the future developments, different materials are going to be adopted with the aim of lightweighting the structure, and the dynamic behavior of these new configurations is going to be studied and compared with each other. Moreover, other laws of load application can be observed, or even different load conditions, such as the wind loads or the earthquake vibrations.

Author Contributions

Conceptualization, L.S.; methodology, L.S.; software, I.T.; validation, L.S. and I.T.; formal analysis, I.T.; investigation, L.S.; resources, L.S.; data curation, I.T.; writing—original draft preparation, I.T.; writing—review and editing, I.T. and L.S.; visualization, I.T.; supervision, L.S.; project administration, L.S.; funding acquisition, L.S. All authors have read and agreed to the published version of the manuscript.

Funding

This research received no external funding.

Institutional Review Board Statement

Not applicable.

Informed Consent Statement

Not applicable.

Data Availability Statement

The original contributions presented in the study are included in the article; further inquiries can be directed to the corresponding author.

Conflicts of Interest

The authors declare no conflicts of interest.

References

  1. Chen, W.; Qin, X.; Yang, Z. Effects of installation location on the in-service wind load of a tower crane. Proc. Inst. Civ. Eng. Struct. Build. 2020, 173, 141–156. [Google Scholar] [CrossRef]
  2. Wu, X.; Sun, Y.; Wu, Y.; Su, N.; Peng, S. The interference effects of wind load and wind-induced dynamic response of quayside container cranes. Appl. Sci. 2022, 12, 10969. [Google Scholar] [CrossRef]
  3. Nguyen, V.B.; Huh, J.; Meisuh, B.K. Evaluation of the effect of the vertical component of an earthquake on the seismic response of container cranes using the shake table test. Structures 2023, 58, 105590. [Google Scholar] [CrossRef]
  4. Li, S.; Brun, M.; Gravouil, A.; Fekak, F.E. Explicit/implicit multi-time step simulation of bridge crane under earthquake with frictional contacts and high-frequency Rayleigh damping. Finite Elem. Anal. Des. 2023, 220, 103946. [Google Scholar] [CrossRef]
  5. Nyezhentsev, O.; Kravchenko, O.; Gerlici, J.; Lovska, A. Mathematical modeling energy losses and dynamic loads during operation of the crane lifting mechanism. Transp. Res. Procedia 2023, 74, 791–798. [Google Scholar] [CrossRef]
  6. Shahnavaz, F.; Taghaddos, H.; Najafabadi, R.S.; Hermann, U. Multi crane lift simulation using Building Information Modeling. Autom. Constr. 2020, 118, 103305. [Google Scholar] [CrossRef]
  7. EN 13001; Cranes–General Design. CEN: Brussels, Belgium, 2021.
  8. EN 15001; Gas infrastructure—Gas Installation Pipework with an Operating Pressure Greater than 0.5 bar. CEN: Brussels, Belgium, 2021.
  9. European Parliament and Council. Directive 2006/42/EC on machinery, and amending Directive 95/16/EC (recast). Off. J. Eur. Union 2006, L 157, 24–86. [Google Scholar]
  10. Antipas, I.R. Modeling the Dynamic Loads Affecting a Bridge Crane during Start-Up. Adv. Eng. Res. 2024, 24, 190–197. [Google Scholar] [CrossRef]
  11. Haniszewski, T. Preliminary modeling studies of sudden release of a part of the hoist load with using experimental miniature test crane. Vibroeng. Procedia 2017, 13, 193–198. [Google Scholar] [CrossRef]
  12. Yang, S.; Fang, X.; Zhang, J.; Wang, D. Dynamic behavior of bridge-erecting machine subjected to moving mass suspended by wire ropes. Appl. Math. Mech. 2016, 37, 741–748. [Google Scholar] [CrossRef]
  13. Yıldırım, Ş.; Esim, E. Investigation of dynamic response of multi-carriages double bridge overhead type crane system subjected to the moving load. J. Braz. Soc. Mech. Sci. Eng. 2022, 44, 108. [Google Scholar] [CrossRef]
  14. Buczkowski, R.; Żyliński, B. Finite Element Fatigue Analysis of Unsupported Crane; Polish Maritime Research: Gdańsk, Poland, 2021. [Google Scholar]
  15. Guo, H.; Chen, K. Modal and fatigue characteristics analysis of key components of tower crane. Vibroeng. Procedia 2024, 54, 72–77. [Google Scholar] [CrossRef]
  16. Georgiev, C. Enhancing Tower Crane Stability through Mast Bracing and Finite Element Analysis. Proc. Tech. Univ. Sofia 2024, 74, 8–14. [Google Scholar] [CrossRef]
  17. Gu, J.; Qin, Y.; Gao, H.; Yan, Y.; Yang, J.; Yang, K.; Mi, C. Nonlinear buckling analysis of tower crane structure based on movable boundaries. Adv. Mech. Eng. 2022, 14, 16878132221138308. [Google Scholar] [CrossRef]
  18. Guan, B.; Cheng, K.; Zhao, E. Experimental and Numerical Study of the Jib Connection Frame of a Wheeled Crane. Appl. Sci. 2025, 15, 4872. [Google Scholar] [CrossRef]
  19. Dipu, M.N.H.; Apu, M.H.; Chowdhury, P.P. Identification of the effective crane hook’s cross-section by incorporating finite element method and programming language. Heliyon 2024, 10, e29918. [Google Scholar] [CrossRef]
  20. Bing, L.; Xidong, H.; Jianguo, L.; Yulan, W.; Xing, L.; Siqi, L.; Yongli, W. Finite element analysis of the chassis in telescopic crawler crane. J. Phys. Conf. Ser. 2021, 1939, 012034. [Google Scholar] [CrossRef]
  21. Bak, M.K.; Hansen, M.R. Analysis of offshore knuckle boom crane-part one: Modeling and parameter identification. Model. Identication Control 2013, 34, 157–174. [Google Scholar] [CrossRef]
  22. Adamiec-Wójcik, I.; Drąg, Ł.; Metelski, M.; Nadratowski, K.; Wojciech, S. A 3D model for static and dynamic analysis of an offshore knuckle boom crane. Appl. Math. Model. 2019, 66, 256–274. [Google Scholar] [CrossRef]
  23. Moi, T.; Cibicik, A.; Rølvåg, T. Digital twin based condition monitoring of a knuckle boom crane: An experimental study. Eng. Fail. Anal. 2020, 112, 104517. [Google Scholar] [CrossRef]
  24. Landsverk, R.; Zhou, J.; Hagen, D. Antiswing control and trajectory planning for offshore cranes. In Proceedings of the IECON 2023—49th Annual Conference of the IEEE Industrial Electronics Society, Singapore, 16–19 October 2023; IEEE: Piscataway, NJ, USA, 2023. [Google Scholar]
  25. Cibicik, A.; Pedersen, E.; Egeland, O. Dynamics of luffing motion of a flexible knuckle boom crane actuated by hydraulic cylinders. Mech. Mach. Theory 2020, 143, 103616. [Google Scholar] [CrossRef]
  26. Ling, Q.; He, Y.; He, Y.; Pang, C. Dynamic response of multibody structure subjected to blast loading. Eur. J. Mech. A Solids 2017, 64, 46–57. [Google Scholar] [CrossRef]
  27. Kulka, J.; Mantic, M.; Fedorko, G.; Molnar, V. Analysis of crane track degradation due to operation. Eng. Fail. Anal. 2016, 59, 384–395. [Google Scholar] [CrossRef]
  28. Augustyn, M.; Barski, M. Estimation of the wind load required to cause the overturning of a gantry crane, comparing different structures of the main horizontal girder. Appl. Sci. 2024, 14, 1092. [Google Scholar] [CrossRef]
  29. Huh, J.; Nguyen, V.B.; Tran, Q.H.; Ahn, J.H.; Kang, C. Effects of boundary condition models on the seismic responses of a container crane. Appl. Sci. 2019, 9, 241. [Google Scholar] [CrossRef]
  30. Wang, Z.; Li, S.; Yu, S. Numerical Analysis for Earthquake Response of Polar Crane. IOP Conf. Ser. Earth Environ. Sci. 2021, 719, 042001. [Google Scholar] [CrossRef]
  31. Solazzi, L.; Tomasi, I. Design of an Overhead Crane in Steel, Aluminium and Composite Material Using the Prestress Method. J. Compos. Sci. 2024, 8, 380. [Google Scholar] [CrossRef]
  32. Suvorov, V.; Vasilyev, R.; Melnikov, B.; Kuznetsov, I.; Bahrami, M.R. Weight Reduction of a Ship Crane Truss Structure Made of Composites. Appl. Sci. 2023, 13, 8916. [Google Scholar] [CrossRef]
  33. Gąska, D.; Haniszewski, T. Modelling studies on the use of aluminium alloys in lightweight load-carrying crane structures. Transp. Probl. 2016, 11, 13–20. [Google Scholar] [CrossRef]
  34. Xiao, J.; Wu, Y.; Long, W.; Xu, C. Failure Analysis of Gantry Crane Slewing Bearing Based on Gear Position Accuracy Error. Appl. Sci. 2022, 12, 11907. [Google Scholar] [CrossRef]
  35. EN 10025-2; Hot Rolled Products of Structural Steels—Part 2: Technical Delivery Conditions for Non-Alloy Structural Steels. CEN: Brussels, Belgium, 2004.
  36. Petrović, A.; Ignjatović, D.; Sedmak, S.; Milošević-Mitić, V.; Momčilović, N.; Trišović, N.; Jeremić, L. Model analysis of bucket wheel excavator SchRs 630 strength. Eng. Fail. Anal. 2021, 126, 105451. [Google Scholar] [CrossRef]
  37. Petrović, A.; Momčilović, N.; Sedmak, A.; Đorđević, B.; Radu, D.; Milošević-Mitić, V.; Bogojević, A. Reliability-based approach for structural integrity assessment of a bucket wheel excavator. Theor. Appl. Fract. Mech. 2025, 136, 104849. [Google Scholar] [CrossRef]
  38. Popescu, A.M.; Demidenko, O.; Yanushkevich, K.; Donath, C.; Neacsu, E.I.; Constantin, V. Influence of seawater corrosion on structure and magnetic properties of the SR355JR and S355J2 carbon steels. J. Mex. Chem. Soc. 2022, 66, 300–311. [Google Scholar] [CrossRef]
  39. Solazzi, L.; Zrnić, N. Modal Analysis of Gantry Crane and Superstrucutre Made by Steel and Alluminium Alloy. FME Trans. 2025, 53, 225–232. [Google Scholar] [CrossRef]
  40. Géradin, M.; Rixen, D.J. Mechanical Vibrations: Theory and Application to Structural Dynamics; John Wiley & Sons: Hoboken, NJ, USA, 2015. [Google Scholar]
  41. Girard, A.; Roy, N. Structural Dynamics in Industry; John Wiley & Sons: Hoboken, NJ, USA, 2010; Volume 7. [Google Scholar]
  42. Solazzi, L.; Danzi, N. Dynamic effects on the lattice boom crane due to the wind, moving load and earthquake events. U. Porto J. Eng. 2023, 9, 109–124. [Google Scholar] [CrossRef]
  43. Solazzi, L. Experimental and analytical study on elevating working platform. Procedia Eng. 2017, 199, 2597–2602. [Google Scholar] [CrossRef]
  44. Solazzi, L.; Incerti, G.; Petrogalli, C. Estimation of the Dynamic Effect in the Lifting Operations of a Boom Crane. In Proceedings of the 28th European Conference on Modelling and Simulation ©ECMS, Brescia, Italy, 27–30 May 2014. [Google Scholar]
  45. Solazzi, L.; Zrnic, N. Design of a high capacity derrick crane considering the effects induced by the application and the release of the load. J. Appl. Eng. Sci. 2017, 15, 15–24. [Google Scholar] [CrossRef]
  46. Hu, S.C.; Zou, N.B.; Ouyang, S.; Zhang, W.Y. Simulation Analysis about Dynamic Characteristics of Crane’s Jib System Based on the Lifting Loads. Adv. Mater. Res. 2014, 910, 304–307. [Google Scholar] [CrossRef]
  47. Solazzi, L.; Cima, M. Structural dynamics of big gantry crane subjected to different trolley move laws. J. Phys. Conf. Ser. 2019, 1264, 012046. [Google Scholar] [CrossRef]
  48. Yoon, B.-J.; Lee, K.-S.; Lee, J.-H. Study on overturn proof monitoring system of mobile crane. Appl. Sci. 2021, 11, 6819. [Google Scholar] [CrossRef]
  49. Toma, S.; Chen, W.F. A Study on Safety Criteria for Toppling of Pile Drivers and Cranes Based on Structural Stability. Arch. Adv. Eng. Sci. 2025, 3, 93–99. [Google Scholar] [CrossRef]
  50. Solazzi, L.; Assi, A.; Ceresoli, F. Excavator arms: Numerical, experimental and new concept design. Compos. Struct. 2019, 217, 60–74. [Google Scholar] [CrossRef]
Figure 1. 3D model of the offshore knuckle-boom crane studied.
Applsci 15 08100 g001
Figure 2. Position of the analyzed configurations: (a) Operating range of the crane and values of liftable weight in different configurations; (b) Angles of the configuration C1; (c) Angles of the configuration C2.
Applsci 15 08100 g002
Figure 3. 3D of the simplified model. (a) Configuration C1. (b) Configuration C2.
Applsci 15 08100 g003
Figure 4. Geometry simplification process of the translation cart: (a) Original translation cart. (b) Simplified translation cart. (c) Section of the original translation cart. (d) Section of the simplified translation cart.
Applsci 15 08100 g004
Figure 5. First four modes of vibration for the configuration C1 along the Y-axis, which corresponds to the direction of the load force. For each mode, natural frequency and mass participation factor ( % m p f ) are shown: (a) f 1 = 1.61 [Hz] % m p f 1 = 3.31 % . (b) f 2 = 3.04 [Hz] % m p f 2 = 5.22 % . (c) f 3 = 3.92 [Hz] % m p f 3 = 62.47 % . (d) f 4 = 5.62 [Hz] % m p f 4 = 1.04 % .
Applsci 15 08100 g005
Figure 6. First four modes of vibration for the configuration C2 along the Y-axis, which corresponds to the direction of the load. For each mode, natural frequency and mass participation factor ( % m p f ) are shown: (a) f 1 = 1.38 [Hz] % m p f 1 = 2.18 % . (b) f 2 = 3.29 [Hz] % m p f 2 = 9.60 % . (c) f 3 = 3.94 [Hz] % m p f 3 = 58.91 % . (d) f 4 = 5.55 [Hz] % m p f 4 = 1.87 % .
Applsci 15 08100 g006
Figure 7. Application’s law of the load and the main values of the results. (a) Chart of the load application law. (b) Example of displacement result graph.
Applsci 15 08100 g007
Figure 8. Trend of velocity of both configuration C1 and C2, taken the first second of lifting and considering ϵ as a variable (in the charts it is called “eps”): (a) Velocity for configuration C1. (b) Velocity for configuration C2.
Applsci 15 08100 g008
Figure 9. Trend of acceleration of both configuration C1 and C2, taken the first second of lifting and considering ϵ as a variable (in the charts it is called “eps”): (a) Acceleration for configuration C1. (b) Acceleration for configuration C2.
Applsci 15 08100 g009
Figure 10. Percentage variation of the displacement for points A and B. (a) Configuration C1. (b) Configuration C2.
Applsci 15 08100 g010
Figure 11. Variation of the maximum value of acceleration (absolute value) related to the time needed to reach the complete application of the load ( ϵ ), for both configurations.
Applsci 15 08100 g011
Table 1. Values of the displacement along the Y-axis of the stick’s end with ϵ equal to 1 s for the configurations C1 and C2. The value of Y s is equal to 206.71 mm for the configuration C1 and 298.55 mm for the configuration C2.
Configuration C1
PointY [mm] Δ Y [mm] % Δ Y [%]
A−231.4424.7311.96
B−187.4418.979.18
C24.7124.7111.97
D−18.9618.969.17
Configuration C2
PointY [mm] Δ Y [mm] % Δ Y [%]
A−329.1130.5610.24
B−274.0324.528.21
C30.5630.5610.24
D−24.5424.548.22
Table 2. Average values of Δ T for the configuration C1 and C2.
Configuration Δ T f r = 1 Δ T [Hz] f 1 [Hz]
C10.721.391.38
C20.621.611.61
Table 3. Function of the regression trendline: comparison between the function without and with the value of % Δ Y observed with ϵ = 0.2 s.
ConfigurationWithout Value of ϵ = 0.2 sWith Value of ϵ = 0.2 s
C1 % Δ Y A = 9.4975 ϵ 1.297 % Δ Y A = 9.4378 ϵ 1.268
R A 2 = 0.9744 R A 2 = 0.9828
% Δ Y B = 7.4995 ϵ 1.255 % Δ Y B = 7.4161 ϵ 1.204
R B 2 = 0.9591 R 2 = 0.9526
C2 % Δ Y A = 10.025 ϵ 1.223 % Δ Y A = 9.8359 ϵ 1.136
R A 2 = 0.9985 R A 2 = 0.9493
% Δ Y B = 8.2008 ϵ 1.142 % Δ Y B = 8.0549 ϵ 1.06
R B 2 = 0.9999 R 2 = 0.9553
Disclaimer/Publisher’s Note: The statements, opinions and data contained in all publications are solely those of the individual author(s) and contributor(s) and not of MDPI and/or the editor(s). MDPI and/or the editor(s) disclaim responsibility for any injury to people or property resulting from any ideas, methods, instructions or products referred to in the content.