Article

Motivation of University Students to Use LLMs to Assist with Online Consumption of Sustainable Products: An Analysis Based on a Hybrid SEM–ANN Approach

1
International Design School for Advanced Studies, Hongik University, Seoul 04068, Republic of Korea
2
School of Design, Jiangnan University, Wuxi 214122, China
*
Author to whom correspondence should be addressed.
Appl. Sci. 2025, 15(14), 8088; https://doi.org/10.3390/app15148088
Submission received: 25 June 2025 / Revised: 17 July 2025 / Accepted: 18 July 2025 / Published: 21 July 2025

Abstract

This study investigates how university students adopt large language models (LLMs) for online consumption of sustainable products, integrating perceived value theory with the technology acceptance model (TAM). Cross-sectional survey data were analyzed using structural equation modeling (SEM) and artificial neural networks (ANNs). SEM results reveal partial mediation. Performance expectancy value (PEV) and information quality value (IQV) directly shape continue using intention (CUI). They also influence CUI indirectly through perceived ease of use (PEU) and perceived usefulness (PU). Green self-identity value (GSV) influences CUI both directly and via PEU, while trust transfer value (TTV) and green perceived value (GPV) affect CUI only via PEU. ANN findings confirm this hierarchy, as PU (86.7%) and PEU (85.7%) are the strongest predictors of CUI, followed by GSV (73.7%). Convergent evidence from both methods indicates that instrumental utility, effortless interaction, and sustainability identity congruence drive sustained LLM use in the context of online consumption of green products, whereas credibility cues and sustainability incentives play secondary roles. This study extends TAM by incorporating multidimensional value constructs and offers design recommendations for engaging and high-utility AI shopping platforms.

1. Introduction

Promoting green purchasing behavior has become a crucial step in a country’s sustainable development [1]. In the past decade, consumers’ demand for green products has increased significantly [2]. The widespread popularity of online shopping in various countries has provided a broad development platform for the online purchase of sustainable products [3]. Empirical studies indicate that social media [4,5] and social e-commerce platforms with integrated e-commerce functions are widely utilized to promote green consumption behavior [6]. Although e-commerce has reduced the geographical barriers to green products and met consumers’ needs for ecological protection [7], it has also exacerbated information overload and choice complexity. As a result, most consumers still have doubts about purchasing sustainable products online, which may lead consumers to miss the opportunity to make more sustainable choices [8].
Notably, the latest advancements in large language models (LLMs) present a potential solution. LLMs demonstrate excellence in consumer demand response capabilities and operational efficiency and are increasingly emerging as a key enabling tool in the field of online shopping [9]. Specifically, new technologies, such as LLMs, can present product attribute summaries, alternative comparisons, and personalized services in real time in a conversational format, assisting users in narrowing the cognitive gap and reducing search costs [10]. This empowers them to acquire more information about online sustainable products and access more environmentally friendly options [1,11]. Existing research indicates that LLMs can effectively change participants’ consumption intentions and pre-existing beliefs [12]. However, Askari et al. [13] pointed out that the influence of LLMs may have certain limitations. These controversial findings further highlight the need to deeply explore the influence mechanism of LLM technology acceptance. Furthermore, although LLM technology has great recommendation potential [14], the acceptance mechanism of sustainable consumers regarding this new method of obtaining shopping information remains under-researched.
Therefore, understanding the key factors shaping users’ adoption of LLMs in online purchasing holds significant theoretical and practical implications [15]. There exist substantial disparities in the motivation for technology adoption and purchasing behavior between two distinct user groups: the LLM user group and the green consumption user group [16,17]. The university student group is not only a large user group of LLM tools [18] but also tends to be more active in environmental protection [19]. However, existing research on university students’ use of LLM assistance mainly focuses on the educational field [20], and there is a significant lack of research on its influence mechanism in online green consumption decisions. In particular, there are still many unsolved questions about how LLMs reshape the green consumption experience. Therefore, this study focuses on this group, aiming to bridge the knowledge gap regarding how LLM technology influences young consumers’ environmentally friendly shopping decisions and technology utility.
The most prominent model utilized to explain an individual’s technology adoption and utilization is the technology acceptance model (TAM) [21]. This model postulates that the influence of all external variables on behavior is mediated by perceived usefulness (PU) and perceived ease of use (PEU) [22]. Although the explanatory power of TAM has been well-established, its over-emphasis on functional value may lead to overlooking broader evaluation criteria. Users also assess the overall benefits and cost sacrifices associated with a technology, namely, its perceived value. Prior research has indicated that perceived value is a decisive driving factor for the adoption of the technology in diverse fields [23]. Consequently, to address this gap, this study puts forward and empirically examines an integrated model that incorporates perceived value into TAM. This model is anticipated to offer a more comprehensive explanation of the adoption of this new technology, LLMs, in green product consumption, particularly with regard to continue using intention (CUI), where the continuous balance of benefits and costs users derive from LLMs is of crucial importance.
Methodologically, this study uses a two-stage analysis method to survey university students participating in online green shopping. First, structural equation modeling (SEM) is used to verify linear relationships, and an artificial neural network (ANN) is used to capture potential non-linear relationships and rank the importance of predictors. This mixed method approach can enhance the robustness of the results [24].
This study primarily contributes to two aspects. First, it proposes an extended model integrating perceived value with TAM. This model expands the utilitarian boundaries of the traditional TAM, is more suitable for research on the adoption and continuous use of novel technologies, and captures the significant trade-offs between benefits and costs in sustainable online shopping. Second, through the rigorous analysis method of combining SEM and an ANN, it demonstrates how PU, PEU, and green self-identity value (GSV) significantly and positively influence CUI. In conclusion, this study provides actionable guidance for designers of LLMs and policymakers seeking to accelerate sustainable consumption. By clarifying the utilitarian and value-based acceptance levers, this study helps explain the diverse findings reported thus far and indicates the direction for leveraging advanced artificial intelligence to further a country’s green procurement goals.
Subsequently, this study consists of three major parts. The first part involves modeling the specific application of the perceived value theory and TAM in the context of this study, and hypotheses are proposed accordingly. The second part presents the quantitative research methodology and provides a detailed explanation of the data collection results using SEM and an ANN. The third part discusses the research results and further summarizes them.

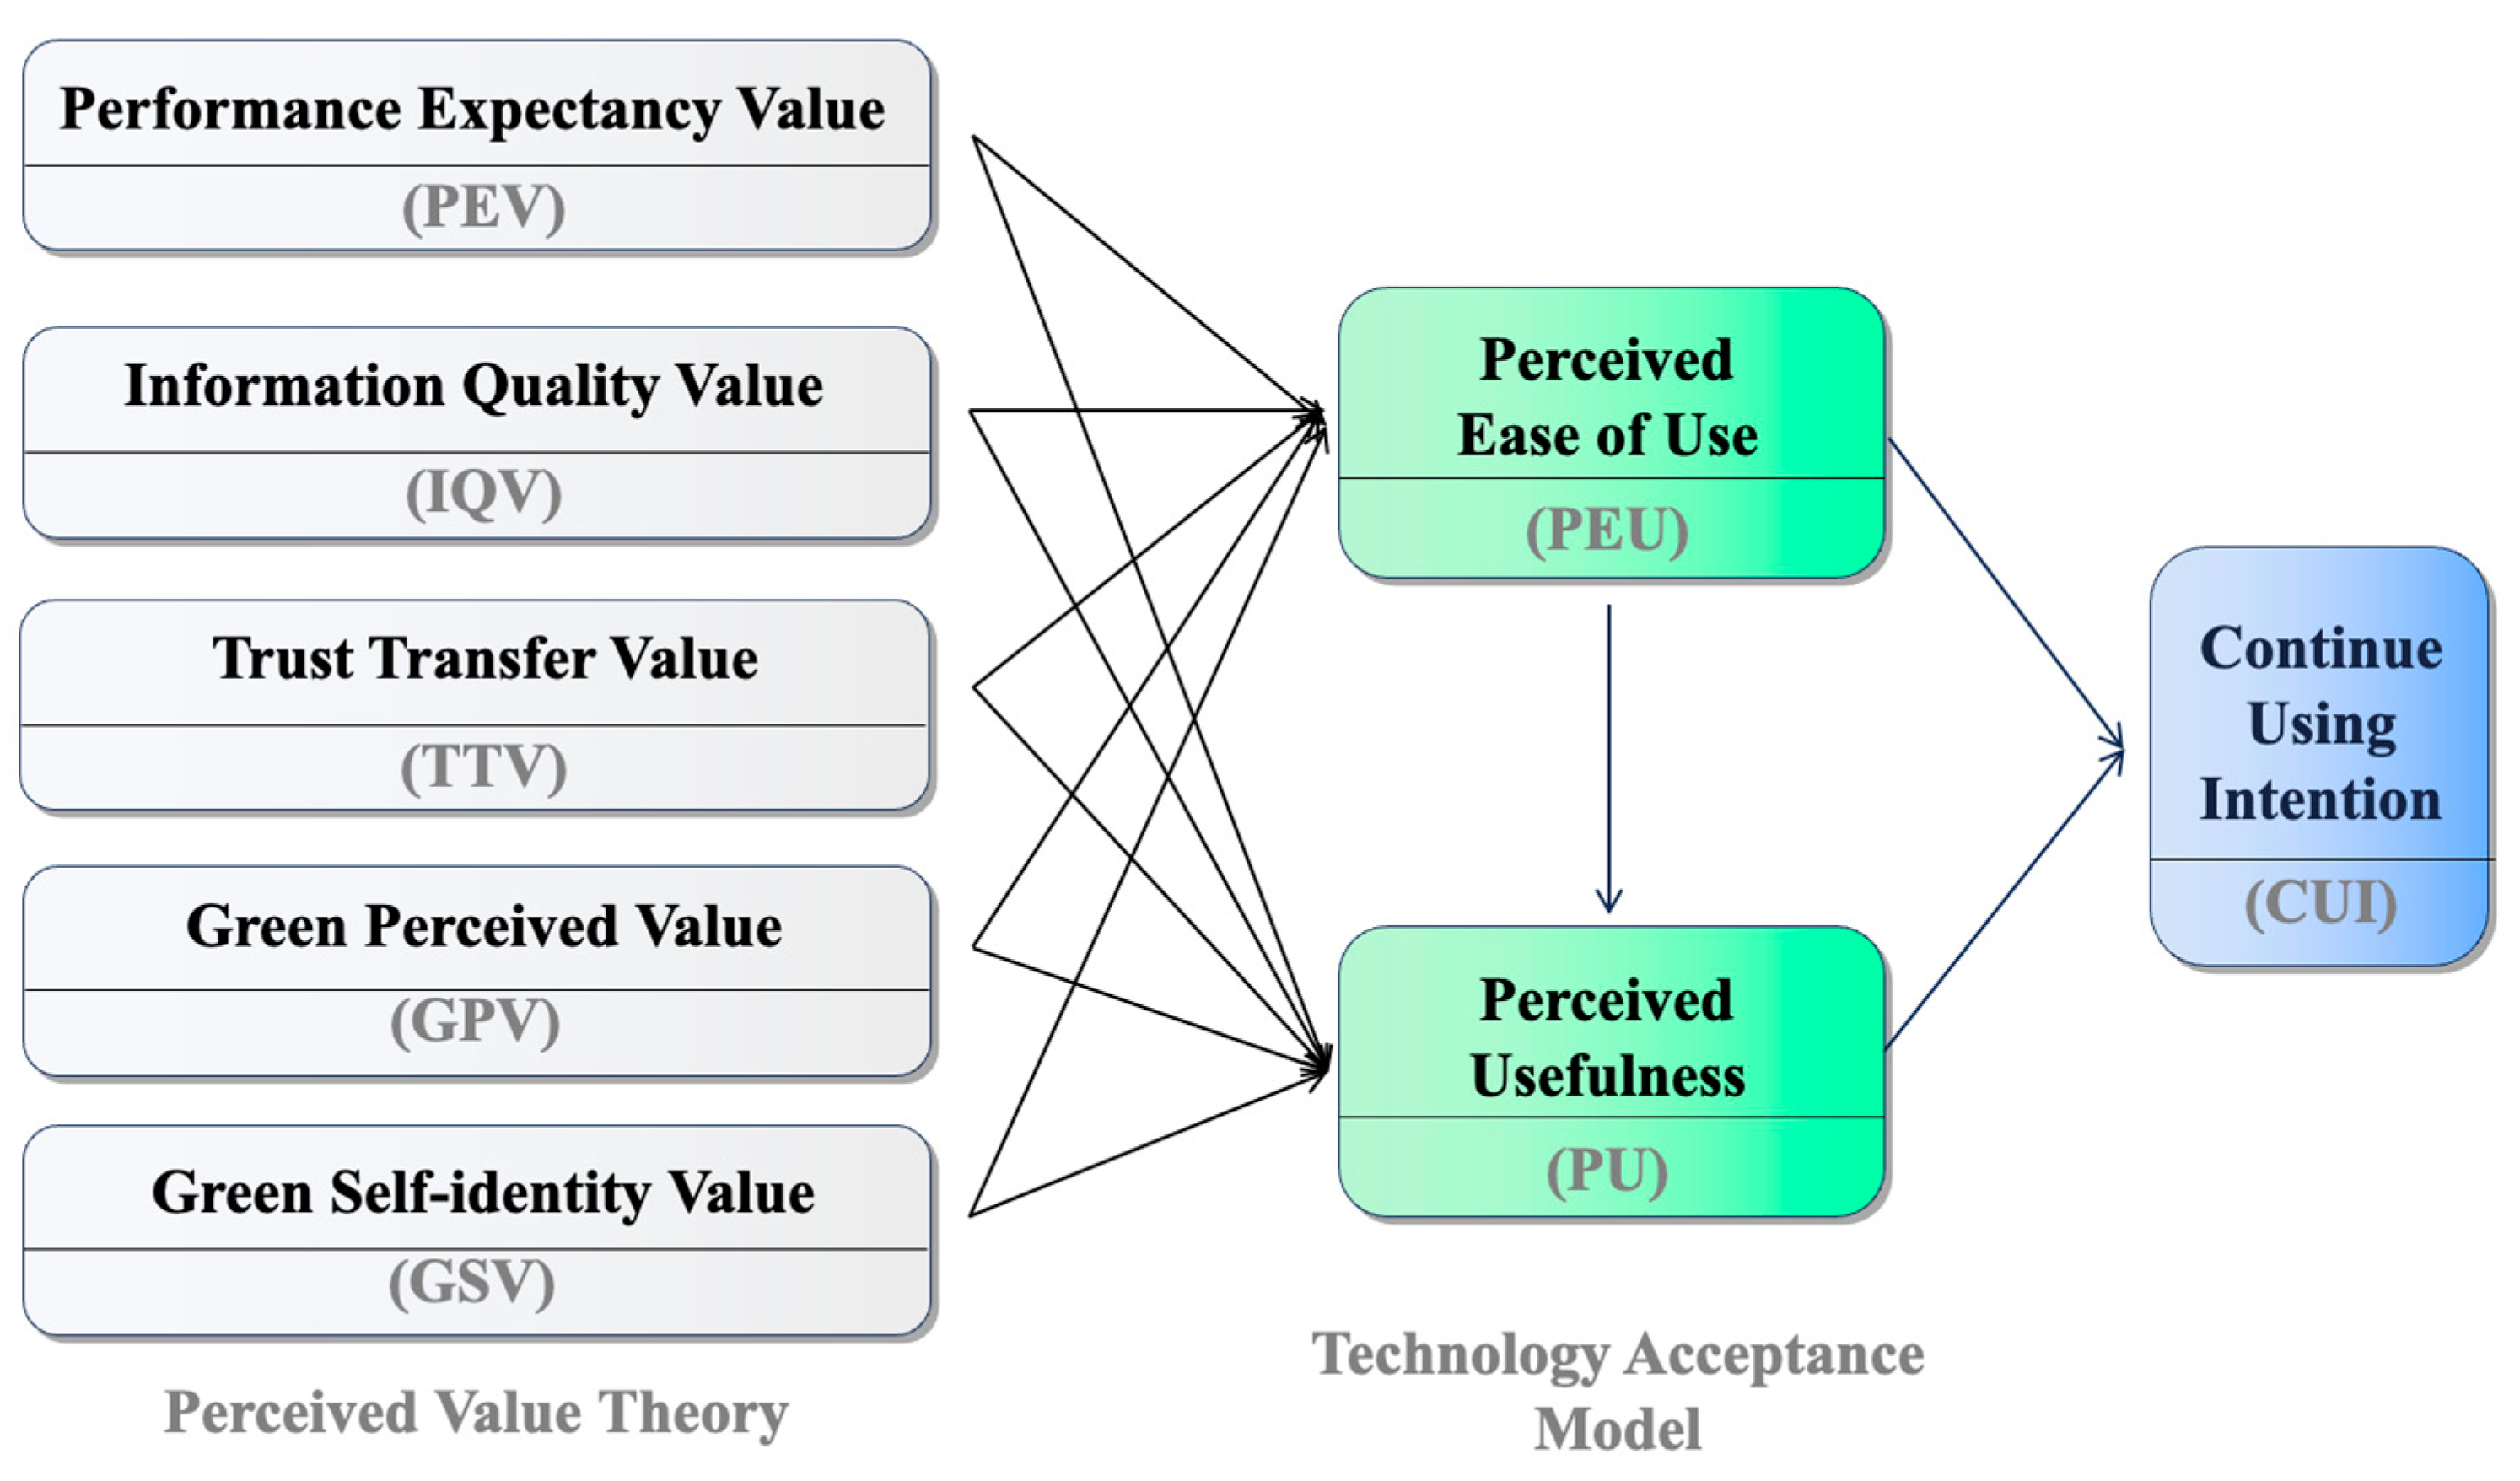
2. Theoretical Foundations

This study establishes a novel theoretical framework based on perceived value theory and the technology acceptance model (TAM), focusing specifically on university students’ intentions to use LLMs for sustainable online consumption.
Initially, Zeithaml [25] defined perceived value theory as the consumer’s overall assessment of a product’s utility based on a trade-off between gains and losses. The theory is composed of three core dimensions: perceived quality, perceived price, and perceived value. According to the theory, university users’ usage decisions are based on a systematic weighing of benefits and costs [26]. Grounded in the affordances of LLMs and the context of sustainable e-commerce, the perceived value is defined as a user’s personal appraisal of how effectively LLMs support their own sustainable purchasing behavior. In other words, it measures the extent to which users believe that interacting with LLMs helps them achieve their green consumption goals [22]. Because initial theories are commonly used to evaluate traditional consumer domains, this study constructs a new theoretical framework of perceived technology value. This framework includes performance expectancy value, information quality value, trust transfer value, green perceived value, and green self-identity value. This methodological choice is consistent with the characteristics of the research object.
The current study employs the TAM proposed by Davis [21] as the theoretical foundation, which has been proven to have stronger explanatory power in predicting the continue using intention of technology compared to other theoretical models [27]. The core concepts of the model include perceived usefulness (PU) and perceived ease of use (PEU). In particular, the TAM has been found to effectively explain users’ attitudes and behavioral intentions toward LLMs [28,29]. Especially when university students are the research subjects, TAM is particularly effective in explaining the use behavior of LLMs [30]. Based on the above-mentioned theoretical basis, this study uses the two core variables of TAM (PU and PEU) as mediating variables. The aim is to systematically examine how university student users’ perceptions of the value of LLMs influence the continued intention to use LLMs through perceived usefulness and perceived ease of use when the LLMs act as green communicators.
In summary, the present study adopts an integrated framework combining the theory of perceived value and the theory of planned behavior. This phenomenon can be attributed to the dual role university students play as both technology users and consumers in the context of LLMs being applied to online eco-friendly product purchasing decisions. The theoretical underpinnings of perceived value theory and the technology acceptance model (TAM) complement each other in terms of model structure, thereby facilitating a more comprehensive understanding of the behavioral mechanisms underlying university students’ adoption of large language models (LLMs) to assist in eco-friendly shopping. This enhanced understanding emerges from a more holistic consumer decision making perspective as opposed to a technologically focused viewpoint. By combining theories, this study constructs a theoretical model using a conceptual model [31]. It is a theoretical model that breaks through the limitations of traditional technology adoption research (Figure 1). This provides a more comprehensive theoretical perspective for understanding user usage and adoption motivations of LLMs in sustainable electronic consumption.

3. Hypothesis Development and Research Model

This study constructs a theoretical model based on the aforementioned theories to explore the driving mechanisms behind university students’ continued use of LLMs in online green shopping. By integrating five dimensions of perceived value—performance expectancy value, information quality value, trust transfer value, green perceived value, and green self-identity value—and introducing perceived ease of use and perceived usefulness as mediating variables, the model forms direct and indirect paths to analyze the intention to continue using LLMs. Hypotheses are proposed to validate their influence.
In this study, performance expectancy value (PEV) is defined as the extent to which university student consumers expect the use of LLMs to enhance the efficiency and accuracy of their online selection of green products [32,33]. PEV is a critical factor in technology adoption intention [34]. In the domain of sustainability, Shahzad et al. [35] have demonstrated that PEV has a positive influence on users’ adoption of innovative technologies. This suggests that positive PEV can enhance users’ perceived validity of LLMs’ technological capabilities in sustainable decision making and promote their continued adoption of the technology. Therefore, this study considers PEV as one of the important motivating factors, and the following hypothesis is proposed.
H1. 
Performance expectancy value positively influences university students’ continue using intention of LLMs in the context of online consumption of sustainable products.
Information quality value (IQV) is defined as the ability of LLMs to provide personalized, precise information tailored to the background and needs of environmentally conscious consumers [36]. Due to consumers’ preference for green products, many companies have adopted green marketing strategies in order to create competitive advertising [37,38]. In the context of an environment inundated with green marketing information, users’ capacity to screen and process information is constrained [39]. At this juncture, the IQV of LLMs assumes particular significance. Specifically, the technical characteristics of LLMs enable them to understand users’ needs for sustainable development through language interaction [14,39], and their algorithms can filter out redundant and false advertising information to simplify the screening of products or services [40], thereby significantly reducing the cognitive load of university students’ green consumption decisions. Consequently, the following hypothesis is proposed.
H2. 
Information quality value positively influences university students’ continue using intention of LLMs in the context of online consumption of sustainable products.
Trust transfer value (TTV) is defined as the psychological mechanism through which university students adopt sustainable products recommended by familiar LLMs when those LLMs suggest unfamiliar green products based on their initial trust in the LLMs’ system [41]. This perspective originates from the supposition that TTV signifies the extent to which an individual’s trust in a familiar object is transferred to related unknown targets [42]. Specifically, consumers’ initial trust in LLMs may effectively alleviate their doubts and uncertainties about the recommended green products [43,44]. Furthermore, LLMs recommend green products that align with users’ environmental values, thereby fostering a personalized experience that deepens university students’ trust in the green products recommended by LLMs [45,46]. This transfer of trust exerts a significant influence on users’ cognitive processes, resulting in a series of positive outcomes, including the increased adoption of LLMs [47]. However, as Brandtzaeg and Følstad [48] have observed, TTV may be subject to variation depending on the extent to which different user groups utilize LLMs. This variation necessitates further exploration based on the subjects of this study, and thus the following hypotheses are proposed.
H3. 
Trust transfer value positively influences university students’ continue using intention of LLMs in the context of online consumption of sustainable products.
Green perceived value (GPV) emanates from the perceived value theories of Bolton and Drew [49] and Patterson and Spreng [50]. Subsequently, Chen and Chang [51] defined it as the overall assessment of a product’s or service’s net benefits by users based on sustainable expectations and green demands. In traditional sustainable consumption, GPV is established through external certifications, such as green certifications and awards [52]. With LLM technology, university students can more accurately perceive the performance advantages of green products and reduce the time and money costs of information searching. Consequently, their perceived value of green products increases [53]. It is worth noting that LLMs internalize the functions of traditional green certifications during conversational interactions and realize the immediate perceived value of green products. Moreover, when this value perception corresponds with the sustainable values of university student users and continuously enhances green benefits in their online consumption, it may engender a greater intention to continue using LLMs for the interaction itself [46]. Based on the aforementioned theory, the following hypothesis is put forward.
H4. 
Green perceived value positively influences university students’ continue using intention of LLMs in the context of online consumption of sustainable products.
Green self-identity value (GSV) is defined as the sense of identity university students acquire through the use of language models (LMs) to facilitate the purchase of green products online [54]. Self-identity is a significant aspect of an individual’s self that is associated with specific behaviors [55]. This aspect is particularly important for green consumers, as they often prioritize environmental sustainability and social responsibility [46]. Previous research has shown that green product descriptions generated by LLMs have the capacity to evoke self-identity among university student users [56]. Moreover, psychologists and sociologists posit that there is a close relationship between self-identity and behavioral intentions [55,57]. In summary, GSV emerges as a critical psychological mechanism in this context. Specifically, users may show eagerness to use LLMs because they can acquire GSV via LLMs [58]. Hence, the following hypothesis is put forward.
H5. 
Green self-identity value positively influences university students’ continue using intention of LLMs in the context of online consumption of sustainable products.
In the context of sustainable product online consumption assisted by LLMs, perceived ease of use (PEU) specifically refers to the cognitive effort required to use the system. When users perceive LLMs as easy to operate, their technological acceptance significantly increases [59]. For instance, Ma et al. [60] also confirmed that users’ perceptions of LLMs usability are significantly positively correlated with their intention to use them, primarily due to intuitive design and simplified operational processes that reduce users’ usage costs. Within the PEU framework, perceived value assumes an additional promotional function in promoting continued use. Therefore, the corresponding hypotheses are put forward.
H6. 
Performance expectancy value indirectly but positively influences university students’ continue using intention of LLMs through perceived ease of use in the context of online consumption of sustainable products.
H7. 
Information quality value indirectly but positively influences university students’ continue using intention of LLMs through perceived ease of use in the context of online consumption of sustainable products.
H8. 
Trust transfer value indirectly but positively influences university students’ continue using intention of LLMs through perceived ease of use in the context of online consumption of sustainable products.
H9. 
Green perceived value indirectly but positively influences university students’ continue using intention of LLMs through perceived ease of use in the context of online consumption of sustainable products.
H10. 
Green self-identity value indirectly but positively influences university students’ continue using intention of LLMs through perceived ease of use in the context of online consumption of sustainable products.
This study delineates perceived usefulness (PU) as university students’ positive perception of the functionality of LLMs in green online consumption experiences. This belief is expected to promote the continued use of the technology [61]. Meanwhile, Davis [21] argues that perceived ease of use (PEU) can directly affect PU as a leading variable because the easier LLMs are to use, the more easily their functional utility can be perceived. Among the factors influencing individual technology usage intentions, both PU and PEU exhibit significant explanatory power, with PU’s influence being more pronounced [59]. This finding has been further validated in LLM-related research [62]. Furthermore, perceived value has been shown to encourage continued usage within the context of PU. Consequently, this study puts forward corresponding hypotheses.
H11. 
Performance expectancy value indirectly but positively influences university students’ continue using intention of LLMs through perceived usefulness in the context of online consumption of sustainable products.
H12. 
Information motivation value indirectly but positively influences university students’ continue using intention of LLMs through perceived usefulness in the context of online consumption of sustainable products.
H13. 
Trust transfer value indirectly but positively influences university students’ continue using intention of LLMs through perceived usefulness in the context of online consumption of sustainable products.
H14. 
Green perceived value indirectly but positively influences university students’ continue using intention of LLMs through perceived usefulness in the context of online consumption of sustainable products.
H15. 
Green self-identity value indirectly but positively influences university students’ continue using intention of LLMs through perceived usefulness in the context of online consumption of sustainable products.
H16. 
University students’ perceived ease of use positively influences university students’ perceived usefulness in the context of online consumption of sustainable products.
Continue using intention (CUI) refers to a decision by a user to use a new technology in the long term after adopting and accepting it. Analyzing the factors that drive this decision can be useful in facilitating the design of technologies with practical applications [63,64]. Meanwhile, users’ intention to continue using at a later period can be effectively predicted by the initial adoption or decision to use behavioral intention [65,66]. Therefore, this study proposes the following hypotheses based on the theoretical model of this study, which is commonly constructed from perceived value and the TAM logical framework.
H17. 
Perceived ease of use positively influences university students’ continue using intention of LLMs in the context of online consumption of sustainable products.
H18. 
Perceived usefulness positively influences university students’ continue using intention of LLMs in the context of online consumption of sustainable products.

4. Methodology

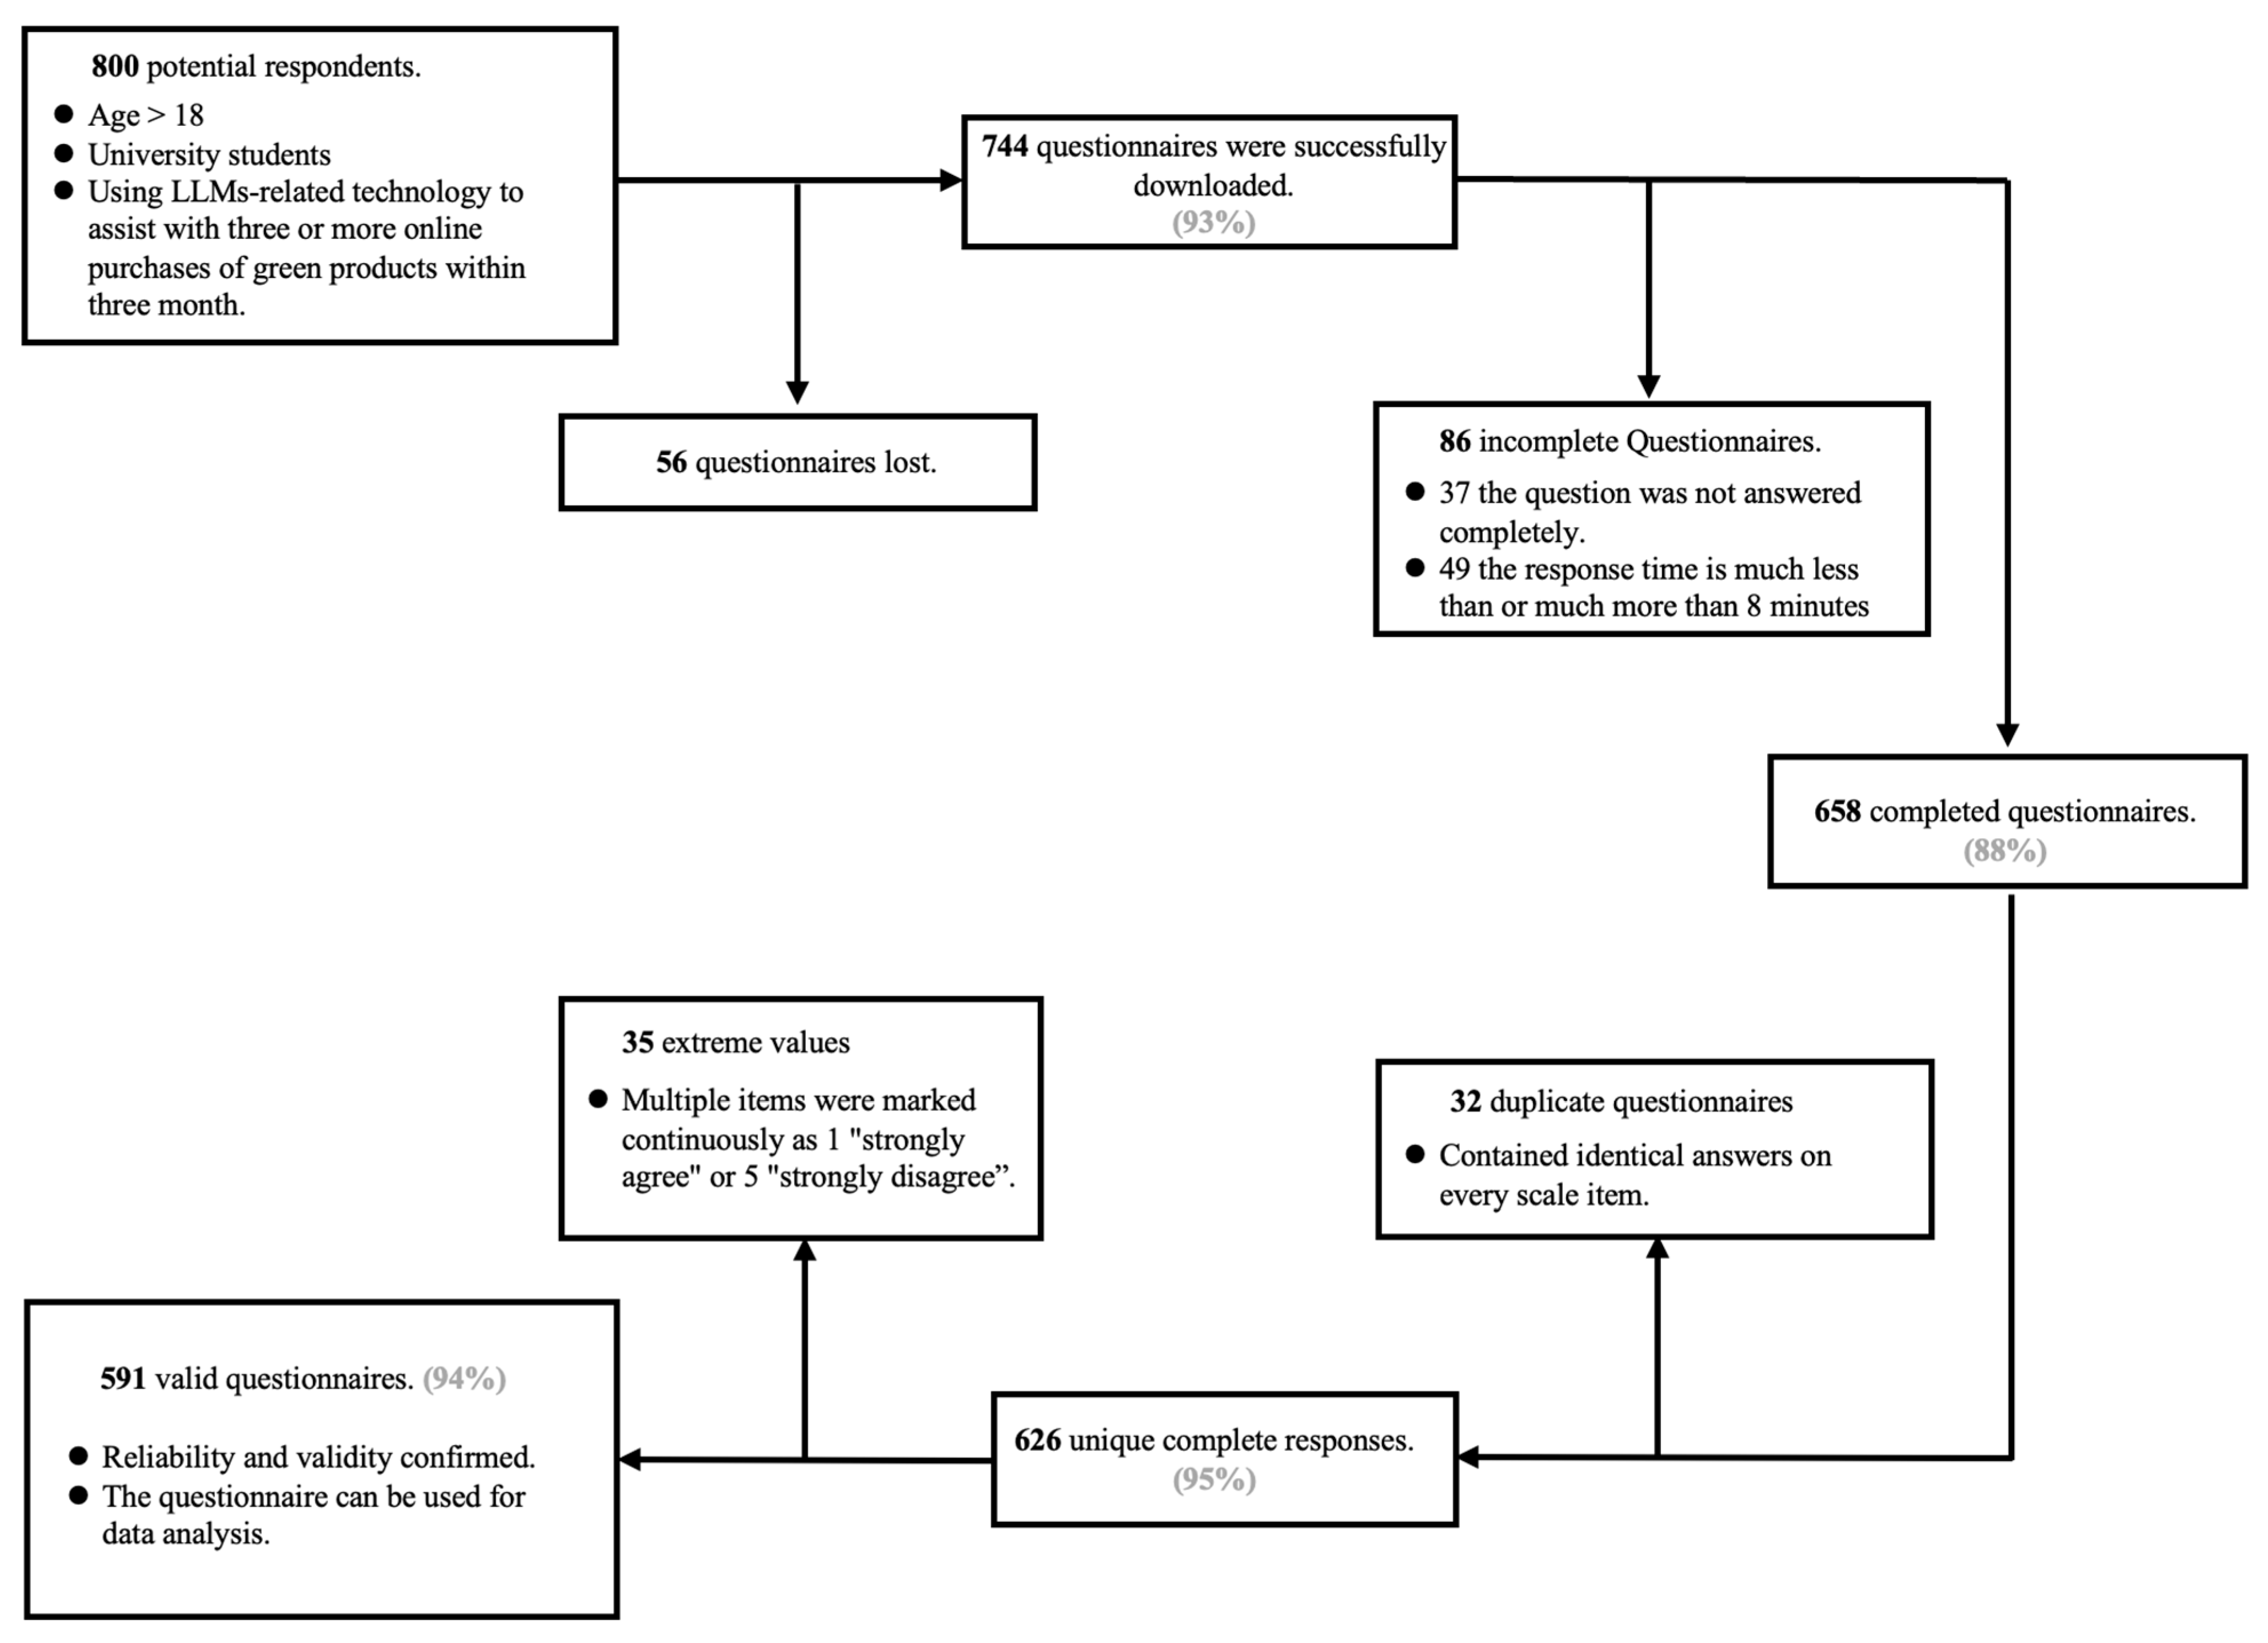
4.1. Questionnaire Design

This study adopted quantitative research methods and collected data through questionnaires for testing theoretical models. The questionnaire survey method was chosen based on three considerations. First, the study needs to obtain subjective perception data from university students regarding their online consumption experience assisted by LLMs. This psychological measurement indicator is suitable for assessment through standardized questionnaires. Secondly, this survey method can enhance the meaning of the research results [67]. Finally, this study focuses on perceived data, and these data are not available from any public source, resulting in the need to obtain them through original data collection.
The questionnaire is grounded in the existing literature, systematically organizing measurement items related to relevant constructs (Table 1). It adjusts existing established scales based on the research subjects and context of this study, forming an initial measurement tool for assessing university students’ perceptions and willingness to continue using LLMs to assist with online consumption. The survey questionnaire is composed of three sections. The initial segment of the study encompasses an informed consent form and confirmation that all respondents have attained a minimum age of 18 years and have utilized LLM-related technology to facilitate online purchases of sustainable products a minimum of three times within the past three months. In the event that the subjects do not consent to the collection of their anonymous data for the purposes of this study, or in the event that they do not meet the established requirements, they will be excluded from the survey. The second part of the survey collects demographic information about the respondents. The third part of the study involves the collection of data concerning the respondents’ user experience. The assessment of all items in this section is conducted using a Likert scale, ranging from 1, indicating “Strongly Disagree,” to 5, indicating “Strongly Agree.”
This study implemented a rigorous questionnaire localization process to ensure cross-cultural validity. The questionnaire was translated using a back-translation method. First, a researcher who is not a native English speaker translated the content into another language. And then, another researcher independently back-translated it into English. The two versions were then compared to ensure semantic consistency. In the end, three equivalent versions of the questionnaire were produced in English, Chinese, and Korean. In addition, we invited three experts in computer technology and three experts in marketing research to form a review panel. This panel conducted multiple preliminary tests on the questionnaire items and optimized the clarity of the wording based on professional advice. The original translation team then checked the revised questionnaire and completed the final version. The results of the pre-test conducted on 30 participants with experience using LLMs to assist with online consumption of sustainable products confirmed that the entire development process ensured that the measurement tools met the research requirements.
To ensure the diversity and representativeness of the sample, researchers distributed the questionnaire via various channels during the data collection process. These channels included relevant sections of mainstream social media platforms, sustainable product purchasing community forums, and related interest groups. Furthermore, measures were implemented to improve data quality. Firstly, the concept of LLMs was clearly defined in the introductory section of the questionnaire, with a specific mention that ChatGPT is a typical application of this technology [74]. Secondly, a demonstration video was attached to visually showcase the specific application scenarios of ChatGPT (for example, ChatGPT 4o) in obtaining product information and assisting with shopping decisions, ensuring all participants had a unified understanding of the research context.

4.2. Basic Information About Respondents

The subjects of this study were university student consumers who were 18 years old or above. This ensured that the participants were legally recognized as adults and capable of making independent purchasing decisions. This approach is in line with the commonly used adult age threshold in consumer behavior and technology adoption research [75,76]. A total of 800 respondents completed the survey. To ensure data validity, a series of screening processes were carried out during answer collection (Figure 2). Eventually, 591 valid responses (73.9%) were incorporated into the sample for structural validation and hypothesis testing. Kline and Santor [77] suggested that the sample size be at least 10 times the number of items. As this study involves 40 items, the sample size should be at least 400 to meet the requirements. The current sample size available for analysis exceeds this threshold, ensuring the statistical power of subsequent analyses.
Next, the characteristics of the respondents based on this study are listed. Men (47%) were slightly fewer than women (53%). The age of the respondents was mainly concentrated between 18 and 21 (32.1%), followed by 26 to 29 (29.1%), reflecting a generally young demographic. Furthermore, 42% of respondents were undergraduate students who had just begun to gain some financial autonomy. More than half of users spent at least 40% of their total monthly expenditure online, suggesting that most university students frequently shop online. Furthermore, half of the respondents used LLMs to assist in decision making 40% of the time during online consumption, which shows that university students currently use LLMs to a certain extent, but there is still room for improvement. In addition, non-response bias was evaluated using the extrapolation method by comparing late and early respondents [78]. No differences were found in either demographic or substantive variables, indicating that there was no substantive non-response bias.

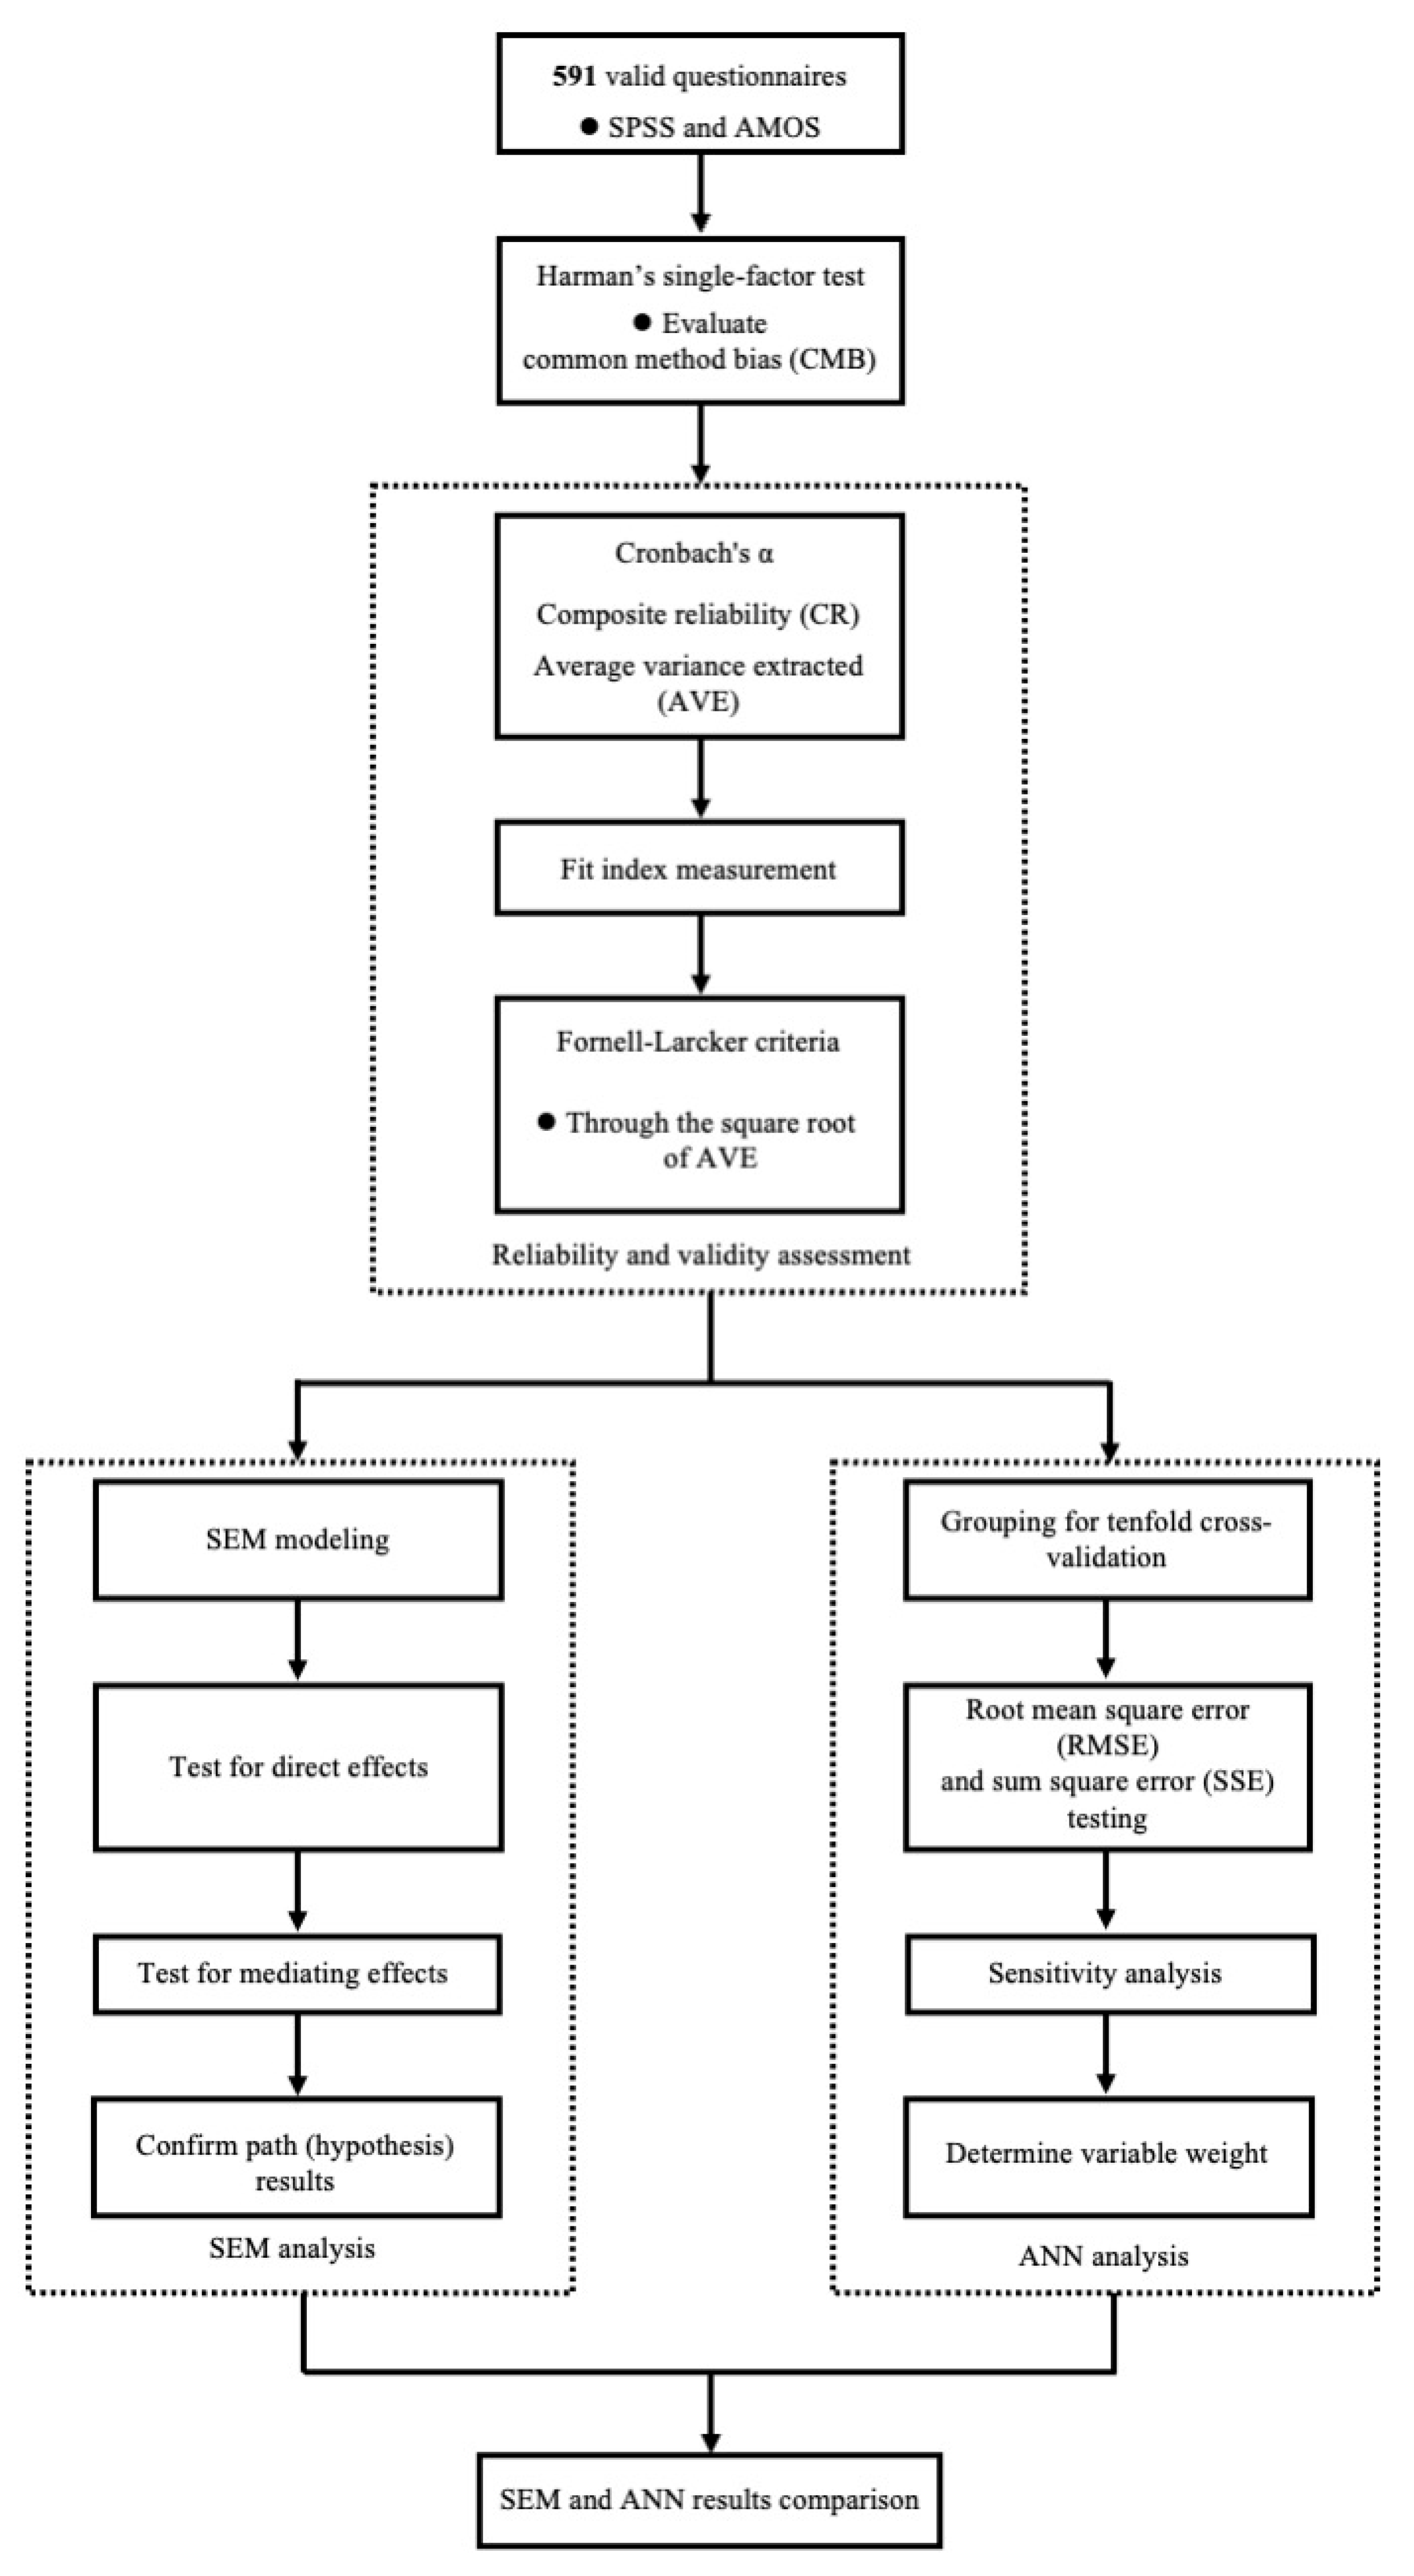
4.3. Analytical Method

This study used a two-stage approach to test hypotheses and construct predictive models. First, SPSS 30.0 and AMOS 24.0 were used to conduct the measurement analysis, and structural equation modeling (SEM) was employed to identify the linear relationships between the exogenous and endogenous variables. SEM is a validation technique used to test conceptual models from previous studies and assess the consistency of these theoretical frameworks with the collected data [79]. Compared with multiple regression and other methods, SEM can estimate the measurement errors of independent and dependent variables while simultaneously analyzing all path relationships in the proposed model.
However, SEM has limitations in capturing non-linear and non-compensatory relationships, which are crucial for understanding the complex dynamics in technology diffusion and e-commerce contexts. Therefore, researchers recommend combining SEM and ANN studies to balance and generate more comprehensive data analysis by utilizing the unique advantages of both [80]. To address the limitations of SEM, the second phase of this study integrated an artificial neural network (ANN).
ANNs can capture both linear and non-linear relationships that do not follow a normal distribution [81], thereby improving predictive accuracy. The latest research by Okewu et al. [82] emphasizes the robustness of ANNs in handling complex data patterns and their applicability in predictive tasks. Moreover, ANNs demonstrate robustness to outliers and small sample sizes and are well-suited for non-compensatory models. The ANN analysis was performed with the Neural Network module in SPSS. This algorithm learns through iterative training and employs the feed-forward back-propagation (FFBP) approach for predictive analysis [83]. Both the input and hidden layers employed a multilayer perceptron architecture with a sigmoid activation function [84]. Through multiple learning iterations, the prediction error was minimized, thereby enhancing predictive accuracy [85].
Furthermore, the specific measurement process is presented in Figure 3. First, the model was measured. Then, SEM and the ANN were examined separately. Finally, the results of the two methods were compared. By combining SEM and an ANN, this study enhanced the depth and accuracy of data analysis, thus comprehensively understanding the predictive factors that influence university students’ behavior in using LLMs to assist with purchasing sustainable products online.

5. Results’ Analysis

5.1. Model Measurement

The data analysis was conducted using the two-step method developed by Anderson and Gerbing [86]. Initially, an assessment was conducted to ascertain the convergent validity and discriminant validity of the measurement model. Subsequently, the research hypotheses and structural model framework were tested.
Firstly, given the data collection method used in this study, Harman’s single-factor test was implemented to evaluate the likelihood of common method bias (CMB) in the self-reported survey data [87]. The model measurement performed a non-rotational exploratory factor analysis on all measurement items and found that the first latent factor explained 33.846% of the total variance, which was far below the conservative benchmark of 40–50% representing the critical CMB. In addition, the total variance extracted by all factors reached 72.253%, indicating that the explanatory power of the remaining constructs was evenly distributed. These findings support the absence of a single factor dominating the covariance structure of the data, which represents current diagnostic evidence supporting the validity of subsequent structural analysis.
Secondly, as illustrated in Appendix A, the measurement model demonstrates notable robustness with regard to its quality. The reliability of the internal consistency is demonstrated by Cronbach’s α values, ranging from 0.856 (CUI) to 0.929 (PU), which exceed the standard of 0.70, indicating good internal consistency. The composite reliability (CR) also ranged from 0.864 to 0.935, thereby reinforcing the evaluation of reliability based on Cronbach’s alpha values and confirming the consistency and reliability of the variables. Meanwhile, convergent validity was further confirmed by the average variance extracted (AVE) values, which range from 0.562 (CUI) to 0.743 (PU) and all exceed the 0.50 standard. The elevated loadings in the data results suggest a strong indication of validity for these items [88].
Thirdly, the structural model demonstrates an exceptional overall fit to the data (Table 2) [89]. The normed chi-square statistic (CMIN/DF = 1.378) is significantly below the conservative critical value of three, suggesting that the difference in degrees of freedom is acceptable. The absolute fit indices (root mean square residual (RMR) and goodness-of-fit index (GFI)) and incremental fit indices (Tucker–Lewis index (TLI) and comparative fit index (CFI)) all met the recommended standards. Furthermore, the parabolic correction fit was substantiated by the root mean square error of approximation (RMSEA = 0.025), which is below the strict 0.05 threshold, thereby confirming the model’s fit.
Finally, Appendix A presents the descriptive statistics and inter-structural correlation matrices. The square root of the average variance extracted (AVE) is displayed on the diagonal. For each latent variable, the diagonal coefficients exceed all off-diagonal correlation coefficients with other constructs, thereby meeting the Fornell–Larcker criteria and confirming the discriminant validity of all theoretical dimensions [90]. Additionally, the correlation between structures was moderate (|r| ≤ 0.531) and only statistically significant in the theoretical prediction case, indicating that multicollinearity is unlikely to interfere with parameter estimation. The association between demographic covariates and core structures was negligible (|r| ≤ 0.096), suggesting that structural relationships are not spuriously driven by respondents’ background characteristics. These diagnostic results confirm that each potential structure captures the unique experience of university students using LLMs to assist in online consumption of sustainable products, thereby laying a solid foundation for subsequent hypothesis testing of structural models.

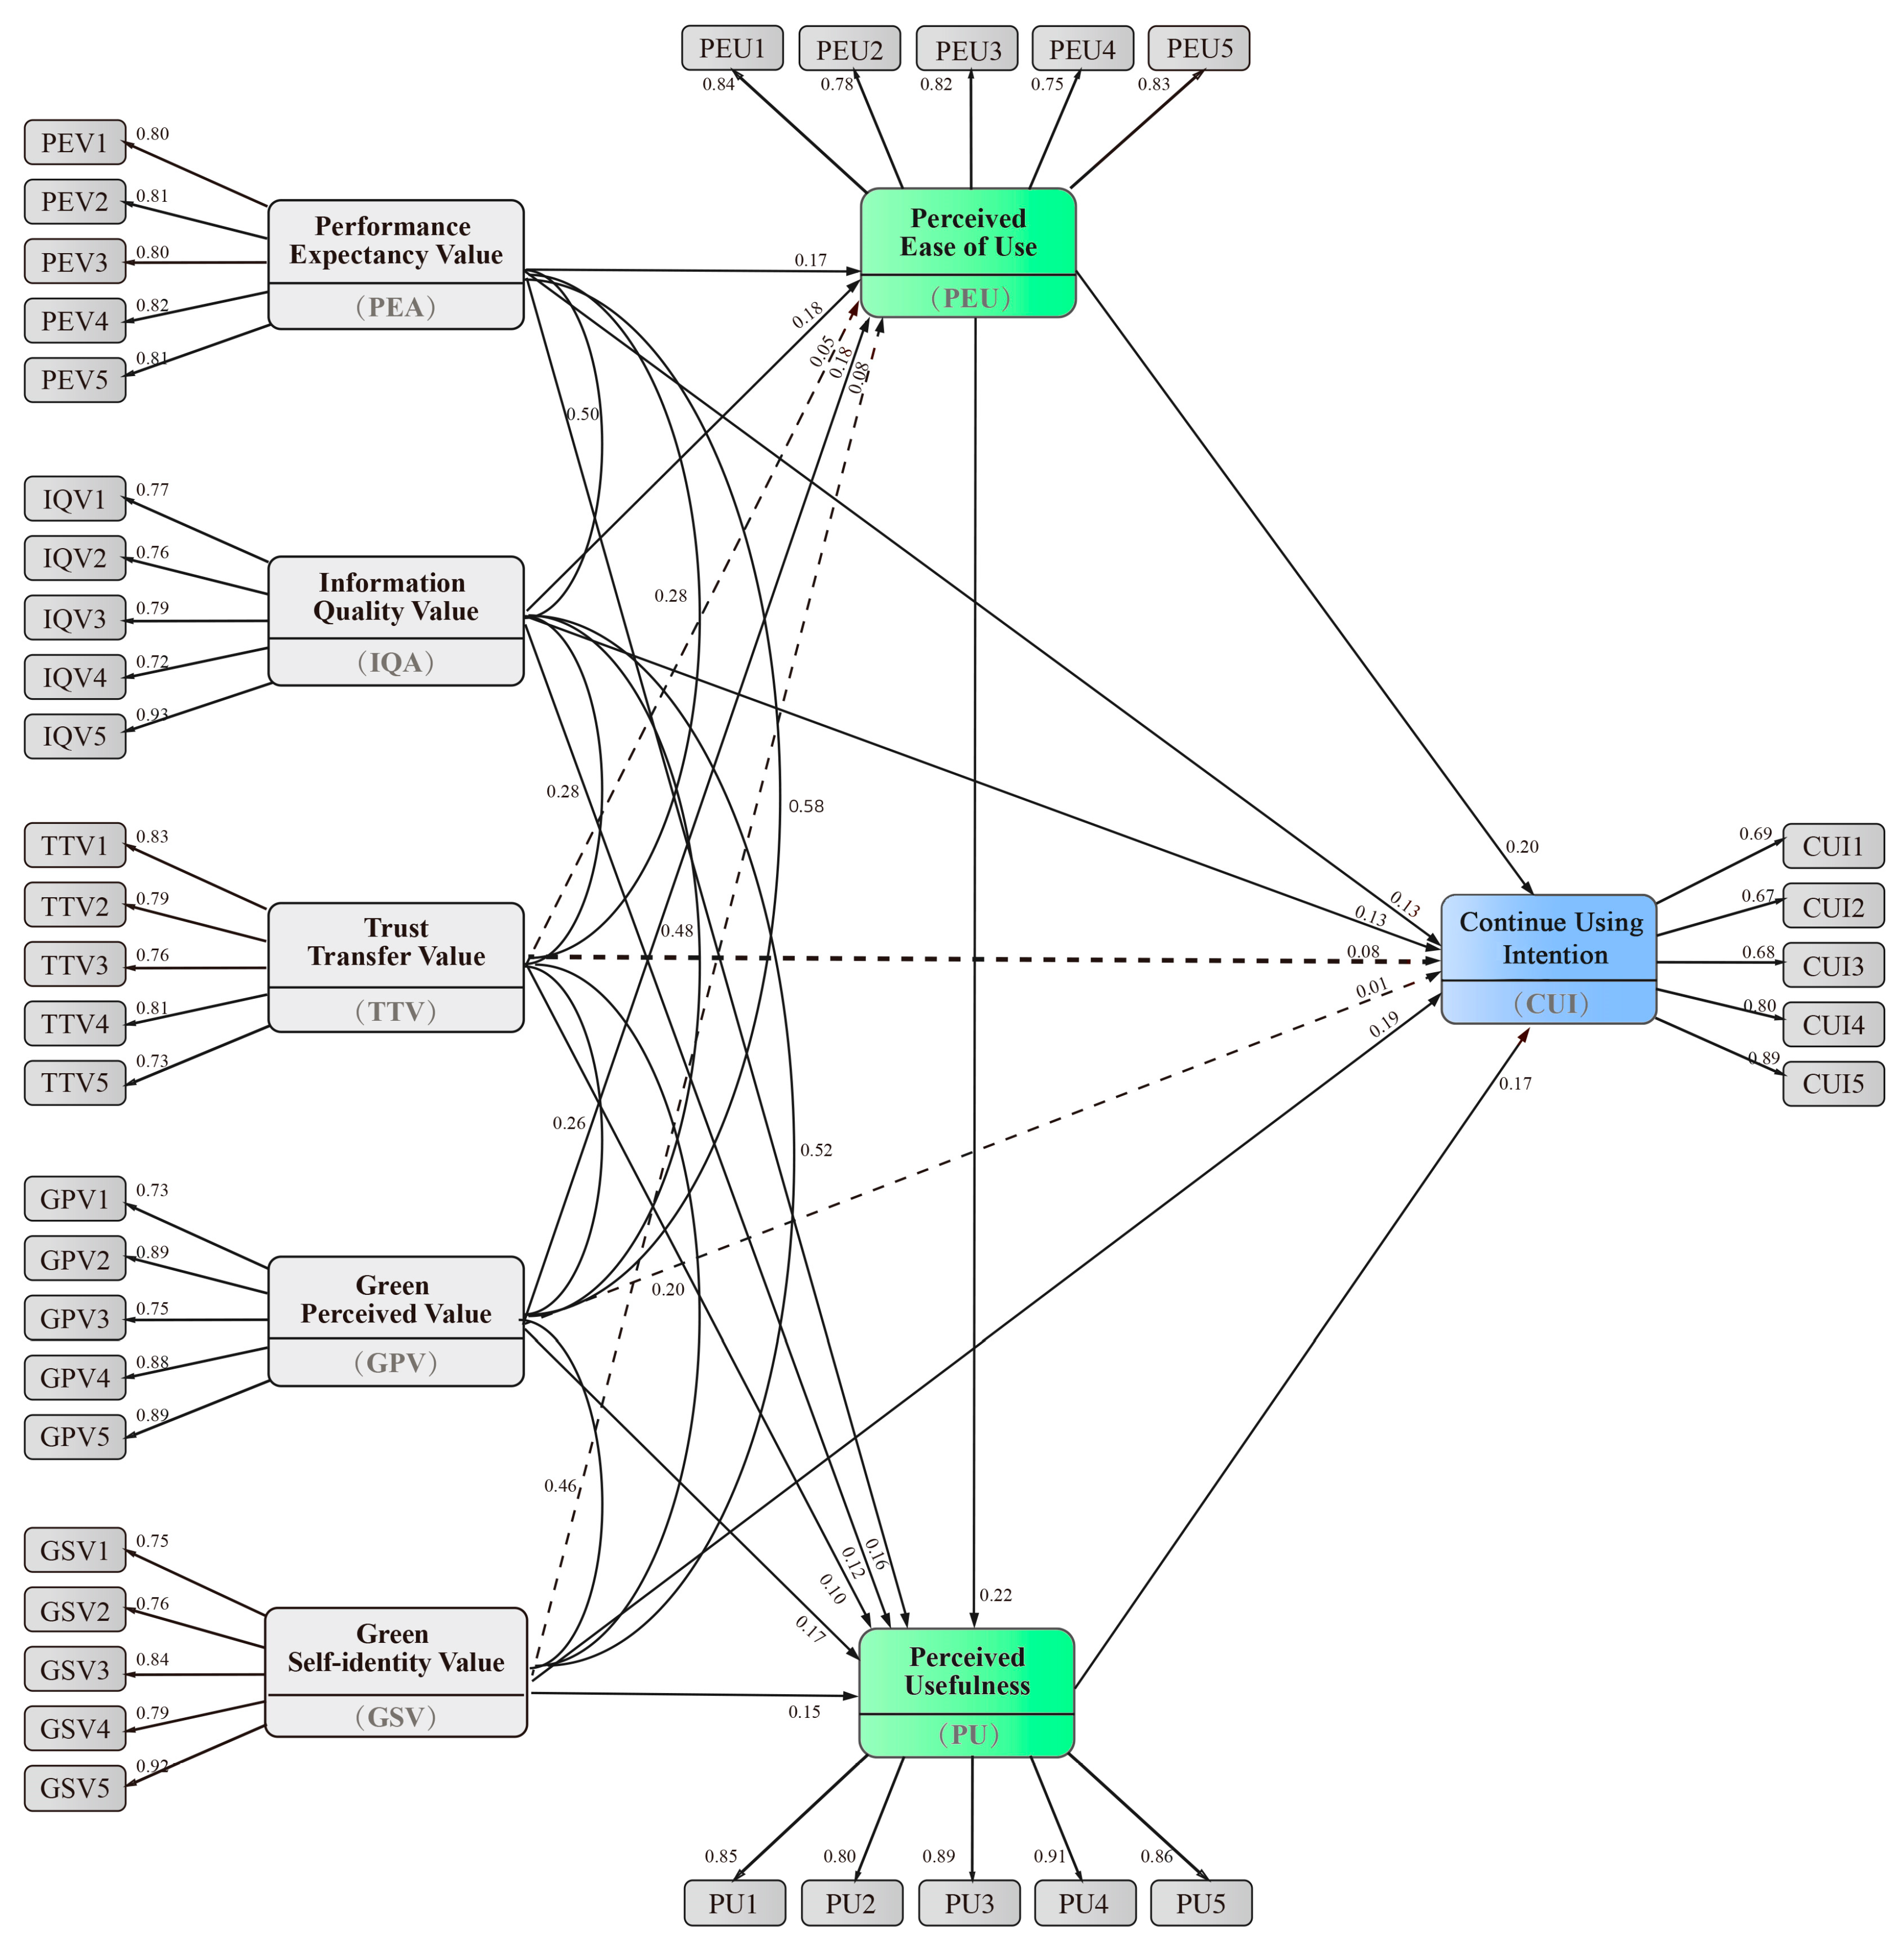
5.2. Structural Equation Modeling and Hypothesis Testing

The structural model encompasses the evaluation of path coefficients and model fit. The SEM employed in this study is fully saturated, indicating that all direct effects between latent constructs have been freely estimated. Specifically, the covariance matrix generated through SEM is found to be entirely consistent with the observed covariance matrix, thereby eliminating the need for any additional tests beyond those already incorporated within the CFA measurement model. This robust model fit lends credence to the conclusions derived from the model parameters and the overarching theoretical framework.
The factors under consideration in this study encompass five independent variables, two mediating variables, and one dependent variable. The final structural model was obtained by applying the modeling section’s refinement criteria and comprises 40 items. Moreover, the study was subjected to 5000 iterations of bootstrapping to ascertain the significance of each path. As illustrated in Figure 4, as well as in Table 3 and Table 4, the measured variables demonstrate clear relationships.
First, each path’s standardized coefficients and significance were analyzed [91], as illustrated in Figure 4 and Table 3. Regarding the antecedent variables of perceived ease of use (PEU), among the perceived value variables, performance expectancy value (PEV) (β = 0.167, p < 0.05), information quality value (IQV) (β = 0.184, p < 0.05), and green perceived value (GPV) (β = 0.184, p < 0.05) all had positive and significant effects. In contrast, trust transfer value (TTV) (β = 0.051, p = 0.238) and green self-identity value (GSV) (β = 0.081, p = 0.107) were not significant.
Moreover, perceived usefulness (PU) is shaped by a range of broader drivers. In particular, all perceived value factors made significant contributions, including PEV (β = 0.164, p < 0.05), IQV (β = 0.121, p < 0.05), TTV (β = 0.099, p < 0.05), GPV (β = 0.174, p < 0.05), and GSV (β = 0.148, p < 0.05). The results of H16 also demonstrated a positive effect of PEU (β = 0.216, p < 0.05).
Subsequently, the present study examined the effects of direct paths. The continue using intention (CUI) was found to be significantly influenced by GSV (β = 0.192, p < 0.05), PEU (β = 0.199, p < 0.05), PU (β = 0.166, p < 0.05), IQV (β = 0.132, p < 0.05), and PEV (β = 0.130, p < 0.05). Consequently, H1, H2, H5, H17, and H18 are supported. The findings indicated that TTV (β = 0.077, p = 0.058) and GPV (β = −0.008, p = 0.877) were not significant, thereby leading to the rejection of H3 and H4. The standardized coefficients’ relative magnitudes confirm the role of perceived value cues in enhancing university students’ expectations regarding the use and functionality of LLM-assisted consumption.
Lastly, Table 4 presents the indirect effect analysis between perceived value variables and university students’ intention to continue using LLM-assisted sustainable product consumption, emphasizing the mediating role of TAM variables. As demonstrated in research by Mallinckrodt et al. [92], deviance correction-guided mediation tests confirmed that the majority of antecedent structures exerted significant indirect effects on university students’ intentions to continue using LLM-assisted online consumption. These indirect effects were observed through the two mediating variables of PEU and PU.
Specifically, for the PEU pathway, PEV (β = 0.033, 95% CI = 0.011–0.072, p < 0.05), IQV (β = 0.037, CI = 0.013–0.076, p < 0.05), and GPV (β = 0.037, CI = 0.012–0.075, p < 0.05) were statistically significant, thus supporting H6, H7, and H9. However, the indirect effects of TTV (β = 0.010) and GSV (β = 0.016) cross zero within their confidence intervals, rendering H8 and H10 non-significant. This pattern suggests that functional and information quality cues primarily enhance continued use by reducing the effort expectations associated with interacting with LLMs, while emotional identification and trust transfer do not significantly alter effort perceptions.
In contrast, the estimated values of the mediating effect of the PU path were similar to those of the PEU (0.020–0.037), but their significance characteristics differed. All perceived value factors exhibited significant mediating effects, including PEV (β = 0.027, CI = 0.007–0.063, p = 0.004), IQV (β = 0.020, CI = 0.005–0.046, p < 0.05), TTV (β = 0.016, CI = 0.004–0.041, p < 0.05), GPV (β = 0.029, CI = 0.009–0.063, p < 0.05), and GSV (β = 0.025, CI = 0.007–0.055, p < 0.05). Therefore, H11–H15 are all supported. These coefficients underscore the notion that LLMs have the potential to enhance consumption outcomes, thereby constituting a pivotal conduit through which perceived value is converted into LLMs’ sustained usage intention, facilitated by PU.
The collective impact of direct and indirect channels substantiates a partial mediation framework. Specifically, perceived core technology acceptance antecedents (PE, IQ) have been shown to maintain a moderate yet significant direct effect while concurrently exerting an indirect effect through PEU and PU. Concurrently, GSV exerts a direct and indirect influence on CUI, albeit solely through PU, underscoring the significance of augmenting the perception of green identity through usability. Furthermore, GPV and TTV primarily influence university students’ CUI for LLM-assisted online consumption by affecting PU. The direct and indirect pathways have made significant contributions to elucidating the dynamic relationships posited in the hypothesis, underscoring the pivotal role of perceived value and TAM in university students’ sustained utilization of LLMs to facilitate sustainable product consumption.

5.3. ANN Results

Similarly to the study by Liébana-Cabanillas et al. [93], the significant factors determined through SEM were used as the input neurons of the ANN model. To reduce the risk of overfitting, a highly consistent estimation accuracy was obtained in Table 5, and the model demonstrated consistently strong predictive performance. Consistent with recent SEM–ANN research [94], the relative importance of the predictors was evaluated through ten-fold cross-validation, where 90% of the data was used for training and 10% for testing prediction accuracy. This division maximizes the learning data while retaining an external subset for unbiased validation, and it has proven to be effective even in moderately sized samples. The sum squared error (SSE) of the training (N = 521–534) was 165.85 (SD = 6.50), and the root mean square error (RMSE) was 1.79 (SD = 0.04) [95]. The coefficients of variation for SSE and RMSE were 3.9% and 2.0%, respectively, indicating that the model learning process is stable and highly insensitive to random divisions of the observed values. The model displays consistent predictive capabilities across various test components [96], thus showcasing its robust and reproducible explanatory power. Although the test RMSE is significantly lower than the training RMSE, the narrow dispersion of the two metrics suggests that this difference is not a symptom of overfitting but rather reflects moderate distribution differences between partitions [95]. These insights can clarify the non-linear interactions of the antecedent factors driving the continued application of LLMs.
As shown in Table 6, the results of the sensitivity analysis indicate the predictive ability of each input neuron. This study adopted the “normalized importance” procedure embedded in IBM SPSS 30.0 Neural Networks software, which is a connection weight method proposed by Olden and Jackson [97]. For each fold of the 10-fold cross-validation, this algorithm decomposes the input–hidden-output weights, converts them into absolute values, and then readjusts the resulting contributions so that the most influential input reaches 100%. The standardized importance of the remaining neurons is obtained by dividing their original importance by this maximum value and expressing the quotient as a percentage [98]. Among the ten resampled ANN models, PU consistently emerged as the most significant predictor of university students’ intention to continue using LLM-assisted online consumption tools (mean importance = 0.202, 86.7% of the maximum weight), followed by PEU (0.194, 85.7%). GSV (0.167, 73.7%) indicates that experiential satisfaction reinforces core technology acceptance cognition but does not completely replace its role. The findings indicate that PEV (0.142, 61.5%) and IQV (0.123, 54.5%) contributed moderately to incremental power. However, TTV (0.090, 40.3%) and GPV (0.083, 34.5%) exhibited the lowest rankings, suggesting that their direct influence on network prediction outcomes is comparatively negligible. The low inter-run variability of PU and PEU underscores the stability of their dominant position. Conversely, the high variability of TTV and GPV signifies that their relevance is context-dependent.
As illustrated in Table 7, an evidence-based analysis is presented, utilizing both SEM and ANN methodologies. This comprehensive approach facilitates a nuanced evaluation of the factors motivating university students’ sustained utilization of LLMs for the procurement of sustainable products. The extant literature on the subject indicates that both methods consistently agree that technology acceptance cognition holds a primary position. The strong consistency in ranking, particularly the joint dominance of PU, PEU, and GSV, validates the effectiveness of the theoretical model across various analytical paradigms. Subtle changes in ranking underscore capacity of ANN capacity to unveil potential non-linear or synergistic contributions, such as the heightened significance of PU. This complementarity with SEM’s hypothesis-driven clarity regarding directional effects is noteworthy. This can complement SEM based on clear assumptions about directional effects. The alignment of SEM path coefficients and ANN importance scores indicates that instrumental value and ease of interaction, supplemented by the emotional value derived from green identity, are key drivers for the long-term adoption of LLMs in sustainable product consumption behavior.

6. Discussion

This study develops and tests a conceptual model to examine how the two core constructs of the TAM interact with a set of perceived values that relate to cognitive and emotional factors to influence university students’ intention to continue using LLMs to assist in purchasing sustainable products online. Conceptually, university students’ assessments of tool value and ease of interaction are key for continued participation. The strong performance of experiential green self-identity confirms that experiential satisfaction reinforces these cognitions rather than replacing them. In contrast, green perceived value and trust transfer value seem to only indirectly boost continue using intention by influencing utility, which echoes their weakened direct paths in the structural equation model. Overall, the evidence from ANN is consistent with the results based on covariance, delineating a hierarchical decision making structure. One layer comprises utilitarian efficacy and self-identity, which jointly drive behavior. Another layer comprises credibility cues and material incentives, which operate as context-dependent supporting factors.
In the first place, the research results confirm the central role of perceived value in the LLM context again. Performance expectancy value (PEV) and information quality value (IQV) have a significant direct impact on continue using intention (CUI), consistent with existing research [99,100]. Perceived ease of use (PEU) and perceived usefulness (PU) both play a partial mediating role [101,102]. These dual pathways collectively confirm its multidimensional nature as a core driving factor.
University students simultaneously weigh performance outcomes and information credibility when evaluating LLMs as consumer tools. On the one hand, LLMs can support users in effectively completing green information searches and queries [103]. This technical feature gives users a sense of security and confidence when making green purchasing decisions, making them more inclined to view LLMs as effective tools for meeting their online green consumption needs and ultimately enhancing their long-term intention to use them. On the other hand, LLMs effectively reduce the information screening costs of university students by providing high-quality information content about online green consumption. Thus, they significantly improve students’ perception of the practicality and convenience of LLMs in the current environment of information overload. This not only strengthens users’ perceived value of green information provided by LLMs but also ultimately enhances their continuing intention to use LLMs as an online consumption aid.
Secondly, green self-identity value (GSV) directly influences university students’ intention to use LLMs to assist with online consumption, which is in line with existing research [104,105]. However, in the mediating effect, only perceived usefulness produces an indirect influence. A possible explanation is that the GSV derived from LLMs can satisfy their self-esteem and have a positive influence on their overall well-being [106] and further stimulates CUI through the usefulness of LLMs. Specifically, university students who grew up in an exploration-oriented digital cultural environment display unique patterns of technology adoption. They directly convert self-identity emotional satisfaction into loyalty without relying on operational convenience as a necessary antecedent condition. By linking green self-identity with practical purposes, the continue using intention is ultimately strengthened.
Then, only PU fully mediates the relationship between trust transfer value (TTV) and CUI, and the impact weight of TTV is low. This diverges from the existing research findings of Chang and Park [39]. Kuen et al. [107] contend that the transfer of trust from technology to a product hinges on the close link between the technology and the product itself. This means that university students need to confirm the practical value of LLMs through actual green shopping experiences; that is, they need to confirm that LLMs are indeed closely related to excellent green products. Only then will the trust transfer value ultimately affect their continued using intention through the key path of enhancing perceived usefulness [108]. Another possible explanation is the limitation brought by the sample characteristics. University students themselves have high basic trust in LLMs, but students reported that their intention to use this tool is mainly driven by personalized practicality and meeting their needs, rather than additional trust cues [109]. This reveals the special conditional characteristics of the role of TTV in the application scenario of LLMs.
Subsequently, through the mediating effect analysis, it was found that PEU and PU play a complete mediating role between green perceived value (GPV) and CUI, and this result is consistent with the findings of Chen and Lu [110]. In addition, the research of Shang et al. [111] also indicates that the impact of GPV on the intention to adopt intelligent technology needs to be exerted through mediating variables. This means that although GPV cannot directly affect CUI, when university students consider LLMs to be convenient, efficient, and easy to use during the process of purchasing green products, their evaluation will indirectly affect CUI. This phenomenon may stem from the fact that the main reasons for university students to use LLMs may be convenience or curiosity, and green value is just a nice added value, not a decisive factor. In this context, university student users tend to indirectly judge the possibility of achieving green value. This finding reveals the mechanism of LLMs in the green online shopping application scenario, where users’ acceptance of future green advantages and benefits needs to be transformed through the perception of system practicality.
Finally, as in previous studies, PEU can predict PU. Furthermore, PEU and PU are key factors influencing whether university students continue to use LLMs for green online consumption [112,113]. Specifically, when university students can obtain green products that meet sustainable needs with less time and financial cost with the help of LLMs without having to study too much, they are more willing to use LLMs in subsequent purchases.
Overall, perceived ease of use (PEU) and perceived usefulness (PU) play complementary mediating roles, although their relationships differ across antecedent categories. PEV, IQV, and GPV exert their effects via PEU and PU, emphasizing that ease of interaction and functional value are necessary conditions for these cues to translate into sustained behavioral commitment. In contrast, only PU drives the mediating effect of TTV and GSV on CUI. These findings illustrate that TTV and GSV primarily enhance CUI by reinforcing the belief that LLMs can truly raise task completion rates rather than by making the system feel easier to operate. This dual process deepens researchers’ understanding of how to strengthen university students’ intention to use LLMs in the long term for green online consumption.

7. Conclusions

In summary, this study explored the motivations of university students to use LLMs to assist with online green product consumption and analyzed the technology acceptance and continue using intention of university students towards LLMs in the context of assisting online sustainable consumption. The empirical results show that key technological and psychological factors significantly influence users’ acceptance of shopping assistants driven by LLMs. Notably, when consumers consider LLMs to be practical, trustworthy, and in line with their own needs, they are more inclined to adopt them. This adoption is also related to the strong green experience brought by LLMs, indicating that integrating tools driven by LLMs into online retail can encourage more environmentally friendly consumer behavior. These findings enrich our understanding of digital interventions for sustainable development and pave the way for further research on how to utilize advanced artificial intelligence to support consumer choices of sustainable products.
Theoretically, this study broadens the explanatory boundaries of the technology acceptance framework. More significantly, it furnishes a more nuanced theoretical perspective for comprehending the evaluation mechanism of emerging artificial intelligence services and the factors influencing their continued use. This research situates green self-identity value (GSV) as an extension of perceived value in a specific domain, providing a reference for subsequent research to explore the longitudinal changes of GSV in this context. Practically, the research findings offer actionable insights for e-commerce platforms and policymakers. Specifically, enhancing the perceived practicality and credibility of services based on LLMs can increase user utilization rates and effectively guide consumers to make shopping choices that better suit their personalized needs. Developers could consider embedding verifiable ecological impact data in the conversational output, adopting adaptive conversations focused on users’ sustainability goals, and leveraging feedback in real time to reinforce sustainable decisions. These implications highlight the strategic value of LLM innovation in promoting sustainable consumption and improving the online shopping experience.
Despite the contributions of this study, several limitations should be acknowledged. One limitation lies in the fact that the research was carried out within a specific context and with a particular sample, which may impede the generalizability of the findings to other settings. Another concern is the rapid evolution of LLM technology. This implies that users’ perceptions and behaviors might change over time, necessitating continuous research to capture such dynamics. Moreover, this study centered on intended behavior rather than actual behavior. Consequently, future research ought to investigate the actual usage patterns of LLMs and their long-term impact on sustainable development outcomes. To tackle these issues, future research could adopt a longitudinal design, explore diverse contexts, and integrate emerging LLM features to validate and extend the current research findings. This would enhance our understanding of how to optimally utilize LLM technology for sustainable online consumption on a broader scale.

Author Contributions

Conceptualization, J.Y., W.Y. and W.C.; methodology, J.Y.; software, J.Y. and S.W.; validation, J.Y., W.Y. and J.G.; formal analysis, J.Y.; investigation, J.Y. and J.G.; resources, J.Y. and K.N.; data curation, J.Y.; writing—original draft preparation, J.Y.; writing—review and editing, J.Y. and S.W.; visualization, J.Y., W.Y. and W.C.; supervision, S.W. and K.N.; project administration, S.W. and K.N.; funding acquisition, J.G. and W.C. All authors have read and agreed to the published version of the manuscript.

Funding

This research received no external funding.

Institutional Review Board Statement

This study was conducted in accordance with the Declaration of Helsinki. Following Chapter III Ethical Review—Article 32 of the Implementation of Ethical Review Measures for Human-Related Life Science and Medical Research issued by Chinese government, this study was exempt from ethical review and approval because it used anonymized information data for research purposes, which do not pose any harm to human subjects and do not involve the use of sensitive personal information or commercial interests.

Informed Consent Statement

Not applicable.

Data Availability Statement

The raw data supporting the conclusions of this article will be made available by the authors on request.

Conflicts of Interest

The authors declare no conflicts of interest.

Appendix A

Table A1. Scale Items and Confirmatory Factor Analysis.
VariableItemScale ItemFactor LoadingCRAVECronbach’s Alpha
Performance
Expectancy Value
(PEV)
PEV1LLMs is able to reduce my workload when I select and purchase green products in unfamiliar categories online.0.7960.903 0.651 0.903
PEV2I think using LLMs will make my consumption more efficient.0.809
PEV3I think LLMs will improve the accuracy of my consumption decisions.0.799
PEV4My consumption operation process has become more convenient with the assistance of LLMs.0.820
PEV5I save time spent consumption with the assistance of LLMs.0.811
Information
Quality
Value
(IQV)
IQV1The green product information I get from LLMs fits my needs.0.7690.897 0.637 0.893
IQV2The green product information I get from LLMs is accurate.0.762
IQV3LLMs can provide product information based on my preferences during the online consumption process.0.787
IQV4The information provided by LLMs helps me to understand the green product specifics.0.722
IQV5I believe using LLMs help me compare different green products.0.934
Trust
Transfer
Value
(TTV)
TTV1The search results for green products that I obtain from LLMs is trustworthy.0.8280.889 0.617 0.888
TTV2LLMs enable me to discover and be willing to try unknown or unfamiliar green products.0.791
TT3LLMs can enhance my confidence in unfamiliar or unknown green products.0.763
TTV4I am willing to pay a price premium for green products recommended by LLMs.0.809
TTV5My trust in LLMs leads me to trust any green product they recommend.0.733
Green
Perceived
Value
(GPV)
GPV1The green products offered by LLMs align with my sustainability values.0.7310.917 0.690 0.915
GPV2LLMs can help me find more sustainable products.0.886
GPV3The green attributes of products recommended by LLMs is worth what I pay.0.752
GPV4With the assistance of LLMs, I can buy more sustainable products at the same price.0.879
GPV5LLMs can recommend products that better align with my green consumption values.0.891
Green
Self-Identity
Value
(GSV)
GSV1Recommendations from LLMs help me confirm that my consumption decisions are sustainable.0.7480.906 0.661 0.905
GSV2Green feedback from LLMs make me feel like an environmentally responsible person.0.760
GSV3I feel my sustainability beliefs are understood when my preferences align with LLMs’ recommendations.0.839
GSV4I consider myself a green consumer when LLMs recommend products based on my green preferences.0.786
GSV5LLMs’ feedback convinces me that buying green products is the right thing to do.0.919
Perceived
Ease of Use
(PEU)
PEU1Learning how to use LLMs to aid my online consumption was very easy.0.8350.902 0.648 0.900
PEU2Using LLMs to aid my online consumption does not require much effort.0.779
PEU3I find LLMs very user-friendly when I use it to assist with online consumption.0.820
PEU4LLMs is smooth and timely when I use them to assist with online consumption.0.751
PEU5Using LLMs make my online consumption easy.0.835
Perceived
Usefulness
(PU)
PU1I think LLMs recommendations are more useful than other recommendations (search engines, shopping lists, shopping review sites, etc.).0.8520.935 0.743 0.929
PU2LLMs help me make better online consumption decisions.0.799
PU3LLMs make my online consumption experience better.0.887
PU4LLMs can give me satisfactory recommendations during the online consumption process.0.909
PU5I think LLMs is useful for my online consumption.0.859
Continue
Using
Intention
(CUI)
CUI1My continued intention to use LLMs is not affected by other factors during the online consumption process.0.6900.864 0.562 0.856
CUI2I’m going to continue to use LLMs to assist with online consumption.0.671
CUI3I plan to use LLMs often to assist with online consumption.0.677
CUI4I am willing to recommend others to use LLMs to assist with online consumption.0.798
CUI5 0.889

References

  1. Ahmad, W.; Zhang, Q. Green purchase intention: Effects of electronic service quality and customer green psychology. J. Clean. Prod. 2020, 267, 122053. [Google Scholar] [CrossRef]
  2. Qi, X.; Yu, H.; Ploeger, A. Exploring influential factors including COVID-19 on green food purchase intentions and the intention–behaviour gap: A qualitative study among consumers in a Chinese context. Int. J. Environ. Res. Public Health 2020, 17, 7106. [Google Scholar] [CrossRef] [PubMed]
  3. Ghosal, I.; Prasad, B.; Gupta, B. Restructuring the green consumerism through e-commerce portals: A behavioural congruence during post-COVID-19. In Future of Work and Business in COVID-19 Era: Proceedings of IMC-2021; Springer Nature: Singapore, 2022; pp. 89–99. [Google Scholar]
  4. Panopoulos, A.; Poulis, A.; Theodoridis, P.; Kalampakas, A. Influencing green purchase intention through eco labels and user-generated content. Sustainability 2022, 15, 764. [Google Scholar] [CrossRef]
  5. Ali, M.; Ullah, S.; Ahmad, M.S.; Cheok, M.Y.; Alenezi, H. Assessing the impact of green consumption behavior and green purchase intention among millennials toward sustainable environment. Environ. Sci. Pollut. Res. 2023, 30, 23335–23347. [Google Scholar] [CrossRef] [PubMed]
  6. Lam, H.K.; Yeung, A.C.; Lo, C.K.; Cheng, T.C.E. Should firms invest in social commerce? An integrative perspective. Inf. Manag. 2019, 56, 103164. [Google Scholar] [CrossRef]
  7. He, H.; Zhang, S.; Zhu, L. Green product quality supervision strategy in online shopping with consumer evaluation and complaint. Front. Environ. Sci. 2021, 9, 702151. [Google Scholar] [CrossRef]
  8. Sadiq, M.W.; Akhtar, M.W.; Huo, C.; Zulfiqar, S. ChatGPT-powered chatbot as a green evangelist: An innovative path toward sustainable consumerism in E-commerce. Serv. Ind. J. 2024, 44, 173–217. [Google Scholar] [CrossRef]
  9. Nagy, S.; Hajdú, N. Consumer acceptance of the use of artificial intelligence in online shopping: Evidence from Hungary. Amfiteatru Econ. 2021, 23, 155–173. [Google Scholar] [CrossRef]
  10. Harrer, S. Attention is not all you need: The complicated case of ethically using large language models in healthcare and medicine. EBioMedicine 2023, 90, 104512. [Google Scholar] [CrossRef] [PubMed]
  11. Forgas-Coll, S.; Huertas-Garcia, R.; Andriella, A.; Alenyà, G. Social robot-delivered customer-facing services: An assessment of the experience. Serv. Ind. J. 2023, 43, 154–184. [Google Scholar] [CrossRef]
  12. Karakaş, N.; Jaeger, B. Changes in attitudes toward meat consumption after chatting with a large language model. Soc. Influ. 2025, 20, 2475802. [Google Scholar] [CrossRef]
  13. Askari, H.; Chhabra, A.; von Hohenberg, B.C.; Heseltine, M.; Wojcieszak, M. Incentivizing news consumption on social media platforms using large language models and realistic bot accounts. PNAS Nexus 2024, 3, 368. [Google Scholar] [CrossRef] [PubMed]
  14. Iranmanesh, M.; Senali, M.G.; Ghobakhloo, M.; Foroughi, B.; Yadegaridehkordi, E.; Annamalai, N. Determinants of intention to use ChatGPT for obtaining shopping information. J. Mark. Theory Pract. 2024, 1–18. [Google Scholar] [CrossRef]
  15. Foroughi, B.; Iranmanesh, M.; Yadegaridehkordi, E.; Wen, J.; Ghobakhloo, M.; Senali, M.G.; Annamalai, N. Factors Affecting the Use of ChatGPT for Obtaining Shopping Information. Int. J. Consum. Stud. 2025, 49, e70008. [Google Scholar] [CrossRef]
  16. Xia, Y.; Liu, Z.; Wang, S.; Huang, C.; Zhao, W. Unlocking the impact of user experience on AI-powered mobile advertising engagement. J. Knowl. Econ. 2024, 16, 4818–4854. [Google Scholar] [CrossRef]
  17. Prieto-Sandoval, V.; Torres-Guevara, L.E.; García-Díaz, C. Green marketing innovation: Opportunities from an environmental education analysis in young consumers. J. Clean. Prod. 2022, 363, 132509. [Google Scholar] [CrossRef]
  18. Rahman, M.S.; Sabbir, M.M.; Zhang, J.; Moral, I.H.; Hossain, G.M.S. Examining students’ intention to use ChatGPT: Does trust matter? Australas. J. Educ. Technol. 2023, 39, 51–71. [Google Scholar] [CrossRef]
  19. Jansson, J.; Marell, A.; Nordlund, A. Green consumer behavior: Determinants of curtailment and eco-innovation adoption. J. Consum. Mark. 2010, 27, 358–370. [Google Scholar] [CrossRef]
  20. Alizadeh, H.; Nazarpour Kashani, H. The impact of perceived experience with ChatGPT on online consumers’ information searching behavior: An empirical study of Iranian college students. Asia Pac. J. Mark. Logist. 2025, 37, 1007–1028. [Google Scholar] [CrossRef]
  21. Davis, F.D. Perceived usefulness, perceived ease of use, and user acceptance of information technology. MIS Q. 1989, 13, 319–340. [Google Scholar] [CrossRef]
  22. Kim, H.W.; Chan, H.C.; Gupta, S. Value-based adoption of mobile internet: An empirical investigation. Decis. Support Syst. 2007, 43, 111–126. [Google Scholar] [CrossRef]
  23. Yang, H.; Yu, J.; Zo, H.; Choi, M. User acceptance of wearable devices: An extended perspective of perceived value. Telemat. Inform. 2016, 33, 256–269. [Google Scholar] [CrossRef]
  24. Soomro, R.B.; Al-Rahmi, W.M.; Dahri, N.A.; Almuqren, L.; Al-Mogren, A.S.; Aldaijy, A. A SEM–ANN analysis to examine impact of artificial intelligence technologies on sustainable performance of SMEs. Sci. Rep. 2025, 15, 5438. [Google Scholar] [CrossRef] [PubMed]
  25. Zeithaml, V.A. Consumer perceptions of price, quality, and value: A means-end model and synthesis of evidence. J. Mark. 1988, 52, 2–22. [Google Scholar] [CrossRef]
  26. Al-Abdullatif, A.M.; Alsubaie, M.A. ChatGPT in learning: Assessing students’ use intentions through the lens of perceived value and the influence of AI literacy. Behav. Sci. 2024, 14, 845. [Google Scholar] [CrossRef] [PubMed]
  27. Hong, S.; Thong, J.Y.; Tam, K.Y. Understanding continued information technology usage behavior: A comparison of three models in the context of mobile internet. Decis. Support Syst. 2006, 42, 1819–1834. [Google Scholar] [CrossRef]
  28. Richad, R.; Vivensius, V.; Sfenrianto, S.; Kaburuan, E.R. Analysis of factors influencing millennial’s technology acceptance of chatbot in the banking industry in Indonesia. Int. J. Manag. 2019, 10, 2428–2439. [Google Scholar] [CrossRef]
  29. Belda-Medina, J.; Kokošková, V. ChatGPT for language learning: Assessing teacher candidates’ skills and perceptions using the Technology Acceptance Model (TAM). Innov. Lang. Learn. Teach. 2024, 1–16. [Google Scholar] [CrossRef]
  30. Jo, H. Decoding the ChatGPT mystery: A comprehensive exploration of factors driving AI language model adoption. Inf. Dev. 2023, 02666669231202764. [Google Scholar] [CrossRef]
  31. Li, C.; Zhao, Z.; Chen, Y.; Zhu, W.; Qiu, J.; Jiang, S.; Guo, R. Modeling the Urban Low-Altitude Traffic Space Based on the Land Administration Domain Model—Case Studies in Shenzhen, China. Land 2024, 13, 2062. [Google Scholar] [CrossRef]
  32. Zhang, C.; Pan, S.; Zhao, Y. More is not always better: Examining the drivers of livestream sales from an information overload perspective. J. Retail. Consum. Serv. 2024, 77, 103651. [Google Scholar] [CrossRef]
  33. Venkatesh, V.; Morris, M.G.; Davis, G.B.; Davis, F.D. User acceptance of information technology: Toward a unified view. MIS Q. 2003, 27, 425–478. [Google Scholar] [CrossRef]
  34. Shahsavar, Y.; Choudhury, A. User intentions to use ChatGPT for self-diagnosis and health-related purposes: Cross-sectional survey study. JMIR Hum. Factors 2023, 10, e47564. [Google Scholar] [CrossRef] [PubMed]
  35. Shahzad, M.; Qu, Y.; Rehman, S.U.; Zafar, A.U. Adoption of green innovation technology to accelerate sustainable development among manufacturing industry. J. Innov. Knowl. 2022, 7, 100231. [Google Scholar] [CrossRef]
  36. Mun, I.B. A study of the impact of ChatGPT self-efficacy on the information seeking behaviors in ChatGPT: The mediating roles of ChatGPT characteristics and utility. Online Inf. Rev. 2025, 49, 373–394. [Google Scholar] [CrossRef]
  37. Lee, H.J.; Park, S.Y. Environmental orientation in going green: A qualitative approach to consumer psychology and sociocultural factors of green consumption. J. Glob. Sch. Mark. Sci. 2013, 23, 245–262. [Google Scholar] [CrossRef]
  38. Pickett-Baker, J.; Ozaki, R. Pro-environmental products: Marketing influence on consumer purchase decision. J. Consum. Mark. 2008, 25, 281–293. [Google Scholar] [CrossRef]
  39. Chang, W.; Park, J. A comparative study on the effect of ChatGPT recommendation and AI recommender systems on the formation of a consideration set. J. Retail. Consum. Serv. 2024, 78, 103743. [Google Scholar] [CrossRef]
  40. Kim, J.; Kim, J.H.; Kim, C.; Park, J. Decisions with ChatGPT: Reexamining choice overload in ChatGPT recommendations. J. Retail. Consum. Serv. 2023, 75, 103494. [Google Scholar] [CrossRef]
  41. Yen, C.; Chiang, M.C. Trust me, if you can: A study on the factors that influence consumers’ purchase intention triggered by chatbots based on brain image evidence and self-reported assessments. Behav. Inf. Technol. 2021, 40, 1177–1194. [Google Scholar] [CrossRef]
  42. Stewart, K.J. Trust transfer on the world wide web. Organ. Sci. 2003, 14, 5–17. [Google Scholar] [CrossRef]
  43. Langer, M.; König, C.J.; Back, C.; Hemsing, V. Trust in artificial intelligence: Comparing trust processes between human and automated trustees in light of unfair bias. J. Bus. Psychol. 2023, 38, 493–508. [Google Scholar] [CrossRef]
  44. Choudhury, A.; Shamszare, H. Investigating the impact of user trust on the adoption and use of ChatGPT: Survey analysis. J. Med. Internet Res. 2023, 25, e47184. [Google Scholar] [CrossRef] [PubMed]
  45. Zhu, Y.; Zhang, J.; Wu, J.; Liu, Y. AI is better when I’m sure: The influence of certainty of needs on consumers’ acceptance of AI chatbots. J. Bus. Res. 2022, 150, 642–652. [Google Scholar] [CrossRef]
  46. Nguyen, M.T.; Thach, K.T.D.; Nguyen, C.N.L.; Nguyen, A.C.; Doan, H.K. The Influence of AI Chatbots on Green Satisfaction and Loyalty: Evidence from Sustainability-Driven Consumer Behavior. J. Glob. Mark. 2025, 1–30. [Google Scholar] [CrossRef]
  47. Chakraborty, D. From algorithms to adoption of AI-based online food delivery platforms: The role of technology fit and emotional trust in adoption. Br. Food J. 2025, 127, 2586–2607. [Google Scholar] [CrossRef]
  48. Brandtzaeg, P.B.; Følstad, A. Why people use chatbots. In Proceedings of the Internet Science: 4th International Conference, INSCI 2017, Thessaloniki, Greece, 22–24 November 2017; Proceedings 4. Springer International Publishing: Berlin/Heidelberg, Germany, 2017; pp. 377–392. [Google Scholar]
  49. Bolton, R.N.; Drew, J.H. A multistage model of customers’ assessments of service quality and value. J. Consum. Res. 1991, 17, 375–384. [Google Scholar] [CrossRef]
  50. Patterson, P.G.; Spreng, R.A. Modelling the relationship between perceived value, satisfaction and repurchase intentions in a business-to-business, services context: An empirical examination. Int. J. Serv. Ind. Manag. 1997, 8, 414–434. [Google Scholar] [CrossRef]
  51. Chen, Y.S.; Chang, C.H. Enhance green purchase intentions: The roles of green perceived value, green perceived risk, and green trust. Manag. Decis. 2012, 50, 502–520. [Google Scholar] [CrossRef]
  52. Lee, K.H.; Lee, M.; Gunarathne, N. Do green awards and certifications matter? Consumers’ perceptions, green behavioral intentions, and economic implications for the hotel industry: A Sri Lankan perspective. Tour. Econ. 2019, 25, 593–612. [Google Scholar] [CrossRef]
  53. Han, H. Consumer behavior and environmental sustainability in tourism and hospitality: A review of theories, concepts, and latest research. Sustain. Consum. Behav. Environ. 2021, 29, 1–22. [Google Scholar]
  54. Chen, Q.; Lu, Y.; Gong, Y.; Xiong, J. Can AI chatbots help retain customers? Impact of AI service quality on customer loyalty. Internet Res. 2023, 33, 2205–2243. [Google Scholar] [CrossRef]
  55. Conner, M.; Armitage, C.J. Extending the theory of planned behavior: A review and avenues for further research. J. Appl. Soc. Psychol. 1998, 28, 1429–1464. [Google Scholar] [CrossRef]
  56. Wasilewski, A.; Chawla, Y.; Pralat, E. Enhanced E-commerce Personalization Through AI-Powered Content Generation Tools. IEEE Access 2025, 13, 48083–48095. [Google Scholar] [CrossRef]
  57. Wang, S.; Ahn, S. Exploring user behavior based on metaverse: A modeling study of user experience factors. In International Conference on Human-Computer Interaction; Springer Nature: Cham, Switzerland, 2024; pp. 99–118. [Google Scholar]
  58. Arbore, A.; Soscia, I.; Bagozzi, R.P. The role of signaling identity in the adoption of personal technologies. J. Assoc. Inf. Syst. 2014, 15, 1. [Google Scholar] [CrossRef]
  59. Guo, C.; Zhang, X. The impact of AR online shopping experience on customer purchase intention: An empirical study based on the TAM model. PLoS ONE 2024, 19, e0309468. [Google Scholar] [CrossRef] [PubMed]
  60. Ma, J.; Wang, P.; Li, B.; Wang, T.; Pang, X.S.; Wang, D. Exploring user adoption of ChatGPT: A technology acceptance model perspective. Int. J. Hum.–Comput. Interact. 2025, 41, 1431–1445. [Google Scholar] [CrossRef]
  61. Venkatesh, V.; Davis, F.D. A theoretical extension of the technology acceptance model: Four longitudinal field studies. Manag. Sci. 2000, 46, 186–204. [Google Scholar] [CrossRef]
  62. Choudhury, A.; Shahsavar, Y.; Shamszare, H. User Intent to Use DeepSeek for Health Care Purposes and Their Trust in the Large Language Model: Multinational Survey Study. JMIR Hum. Factors 2025, 12, e72867. [Google Scholar] [CrossRef] [PubMed]
  63. Wang, S.; Nah, K. Exploring Sustainable Learning Intentions of Employees Using Online Learning Modules of Office Apps Based on User Experience Factors: Using the Adapted UTAUT Model. Appl. Sci. 2024, 14, 4746. [Google Scholar] [CrossRef]
  64. Mehrolia, S.; Alagarsamy, S.; Moorthy, V.; Jeevananda, S. Will users continue using banking chatbots? The moderating role of perceived risk. FIIB Bus. Rev. 2023, 23197145231169900. [Google Scholar] [CrossRef]
  65. Wang, S.; Yu, J.; Yang, W.; Yan, W.; Nah, K. The Impact of Role-Playing Game Experience on the Sustainable Development of Ancient Architectural Cultural Heritage Tourism: A Mediation Modeling Study Based on SOR Theory. Buildings 2025, 15, 2032. [Google Scholar] [CrossRef]
  66. Ajzen, I.; Fishbein, M. Attitude-behavior relations: A theoretical analysis and review of empirical research. Psychol. Bull. 1977, 84, 888. [Google Scholar] [CrossRef]
  67. Kerlinger, F.N. Foundations of Behavioral Research; Holt, Rinehart and Winston: New York, NY, USA, 1966. [Google Scholar]
  68. Strzelecki, A. To use or not to use ChatGPT in higher education? A study of students’ acceptance and use of technology. Interact. Learn. Environ. 2024, 32, 5142–5155. [Google Scholar] [CrossRef]
  69. Yin, J.; Qiu, X. AI technology and online purchase intention: Structural equation model based on perceived value. Sustainability 2021, 13, 5671. [Google Scholar] [CrossRef]
  70. Riva, F.; Magrizos, S.; Rubel, M.R.B.; Rizomyliotis, I. Green consumerism, green perceived value, and restaurant revisit intention: Millennials’ sustainable consumption with moderating effect of green perceived quality. Bus. Strategy Environ. 2022, 31, 2807–2819. [Google Scholar] [CrossRef]
  71. Sharma, N.; Saha, R.; Sreedharan, V.R.; Paul, J. Relating the role of green self-concepts and identity on green purchasing behaviour: An empirical analysis. Bus. Strategy Environ. 2020, 29, 3203–3219. [Google Scholar] [CrossRef]
  72. Grębosz-Krawczyk, M.; Zakrzewska-Bielawska, A.; Flaszewska, S. From words to deeds: The impact of pro-environmental self-identity on green energy purchase intention. Energies 2021, 14, 5732. [Google Scholar] [CrossRef]
  73. Mun, I.B.; Hwang, K.H. Exploring the Influence of Prompt Self-Efficacy: Accurate and Customized Information, Perceived Ease of Use, Satisfaction, and Continuance Intention to Use ChatGPT. Int. J. Hum.–Comput. Interact. 2025, 1–12. [Google Scholar] [CrossRef]
  74. Meyer, J.G.; Urbanowicz, R.J.; Martin, P.C.; O’Connor, K.; Li, R.; Peng, P.C.; Bright, T.J.; Tatonetti, N.; Won, K.J.; Gonzalez-Hernandez, G.; et al. ChatGPT and large language models in academia: Opportunities and challenges. BioData Min. 2023, 16, 20. [Google Scholar] [CrossRef] [PubMed]
  75. Goodarzi, S.; Masini, A.; Aflaki, S.; Fahimnia, B. Right information at the right time: Reevaluating the attitude–behavior gap in environmental technology adoption. Int. J. Prod. Econ. 2021, 242, 108278. [Google Scholar] [CrossRef]
  76. Zhao, L.; Xu, Y.; Xu, X. The effects of trust and platform innovation characteristics on consumer behaviors in social commerce: A social influence perspective. Electron. Commer. Res. Appl. 2023, 60, 101284. [Google Scholar] [CrossRef]
  77. Kline, R.B.; Santor, D.A. Principles & practice of structural equation modelling. Can. Psychol. 1999, 40, 381. [Google Scholar]
  78. Armstrong, J.S.; Overton, T.S. Estimating nonresponse bias in mail surveys. J. Mark. Res. 1977, 14, 396–402. [Google Scholar] [CrossRef]
  79. Hair, J.F.; Hult, G.T.M.; Ringle, C.M.; Sarstedt, M.; Thiele, K.O. Mirror, mirror on the wall: A comparative evaluation of composite-based structural equation modeling methods. J. Acad. Mark. Sci. 2017, 45, 616–632. [Google Scholar] [CrossRef]
  80. Mustafa, S.; Zhang, W. Predicting users knowledge contribution behaviour in technical vs. non-technical online Q&A communities: SEM-Neural Network approach. Behav. Inf. Technol. 2023, 42, 2521–2544. [Google Scholar]
  81. Teo, A.C.; Tan, G.W.H.; Ooi, K.B.; Hew, T.S.; Yew, K.T. The effects of convenience and speed in m-payment. Ind. Manag. Data Syst. 2015, 115, 311–331. [Google Scholar] [CrossRef]
  82. Okewu, E.; Adewole, P.; Misra, S.; Maskeliunas, R.; Damasevicius, R. Artificial neural networks for educational data mining in higher education: A systematic literature review. Appl. Artif. Intell. 2021, 35, 983–1021. [Google Scholar] [CrossRef]
  83. Taneja, A.; Arora, A. Modeling user preferences using neural networks and tensor factorization model. Int. J. Inf. Manag. 2019, 45, 132–148. [Google Scholar] [CrossRef]
  84. Sharma, S.K.; Sharma, H.; Dwivedi, Y.K. A hybrid SEM-neural network model for predicting determinants of mobile payment services. Inf. Syst. Manag. 2019, 36, 243–261. [Google Scholar] [CrossRef]
  85. Idrissi, T.E.; Idri, A.; Bakkoury, Z. Systematic map and review of predictive techniques in diabetes self-management. Int. J. Inf. Manag. 2019, 46, 263–277. [Google Scholar] [CrossRef]
  86. Anderson, J.C.; Gerbing, D.W. Structural equation modeling in practice: A review and recommended two-step approach. Psychol. Bull. 1988, 103, 411. [Google Scholar] [CrossRef]
  87. Chin, W.W.; Thatcher, J.B.; Wright, R.T. Assessing common method bias: Problems with the ULMC technique. MIS Q. 2012, 36, 1003–1019. [Google Scholar] [CrossRef]
  88. Cheung, G.W.; Cooper-Thomas, H.D.; Lau, R.S.; Wang, L.C. Reporting reliability, convergent and discriminant validity with structural equation modeling: A review and best-practice recommendations. Asia Pac. J. Manag. 2024, 41, 745–783. [Google Scholar] [CrossRef]
  89. Bentler, P.M.; Bonett, D.G. Significance tests and goodness of fit in the analysis of covariance structures. Psychol. Bull. 1980, 88, 588. [Google Scholar] [CrossRef]
  90. Rönkkö, M.; Cho, E. An updated guideline for assessing discriminant validity. Organ. Res. Methods 2022, 25, 6–14. [Google Scholar] [CrossRef]
  91. Wright, S. Path coefficients and path regressions: Alternative or complementary concepts? Biometrics 1960, 16, 189–202. [Google Scholar] [CrossRef]
  92. Mallinckrodt, B.; Abraham, W.T.; Wei, M.; Russell, D.W. Advances in testing the statistical significance of mediation effects. J. Couns. Psychol. 2006, 53, 372. [Google Scholar] [CrossRef]
  93. Liébana-Cabanillas, F.; Marinković, V.; Kalinić, Z. A SEM-neural network approach for predicting antecedents of m-commerce acceptance. Int. J. Inf. Manag. 2017, 37, 14–24. [Google Scholar] [CrossRef]
  94. Hew, T.S.; Leong, L.Y.; Ooi, K.B.; Chong, A.Y.L. Predicting drivers of mobile entertainment adoption: A two-stage SEM-artificial-neural-network analysis. J. Comput. Inf. Syst. 2016, 56, 352–370. [Google Scholar] [CrossRef]
  95. Leong, L.Y.; Jaafar, N.I.; Ainin, S. Understanding facebook commerce (f-commerce) actual purchase from an artificial neural network perspective. J. Electron. Commer. Res. 2018, 19, 75–103. [Google Scholar]
  96. Ooi, K.B.; Tan, G.W.H. Mobile technology acceptance model: An investigation using mobile users to explore smartphone credit card. Expert Syst. Appl. 2016, 59, 33–46. [Google Scholar] [CrossRef]
  97. Olden, J.D.; Jackson, D.A. Illuminating the “black box”: A randomization approach for understanding variable contributions in artificial neural networks. Ecol. Model. 2002, 154, 135–150. [Google Scholar] [CrossRef]
  98. Karaca, Y.; Moonis, M.; Zhang, Y.D.; Gezgez, C. Mobile cloud computing based stroke healthcare system. Int. J. Inf. Manag. 2019, 45, 250–261. [Google Scholar] [CrossRef]
  99. Ashfaq, M.; Yun, J.; Yu, S.; Loureiro, S.M.C. I, Chatbot: Modeling the determinants of users’ satisfaction and continuance intention of AI-powered service agents. Telemat. Inform. 2020, 54, 101473. [Google Scholar] [CrossRef]
  100. Cheng, Y.; Jiang, H. How do AI-driven chatbots impact user experience? Examining gratifications, perceived privacy risk, satisfaction, loyalty, and continued use. J. Broadcast. Electron. Media 2020, 64, 592–614. [Google Scholar] [CrossRef]
  101. Jasrai, L. Extending UTAUT model to examine the usages of ChatGPT among Indian students in higher education: A structural equation modelling approach. TQM J. 2025. ahead-of-print. [Google Scholar] [CrossRef]
  102. Rahaman, M.A.; Hassan, H.K.; Asheq, A.A.; Islam, K.A. The interplay between eWOM information and purchase intention on social media: Through the lens of IAM and TAM theory. PLoS ONE 2022, 17, e0272926. [Google Scholar] [CrossRef] [PubMed]
  103. Chung, M.; Ko, E.; Joung, H.; Kim, S.J. Chatbot e-service and customer satisfaction regarding luxury brands. J. Bus. Res. 2020, 117, 587–595. [Google Scholar] [CrossRef]
  104. Westjohn, S.A.; Arnold, M.J.; Magnusson, P.; Zdravkovic, S.; Zhou, J.X. Technology readiness and usage: A global-identity perspective. J. Acad. Mark. Sci. 2009, 37, 250–265. [Google Scholar] [CrossRef]
  105. Cao, J.; Qiu, H.; Morrison, A.M. Self-identity matters: An extended theory of planned behavior to decode tourists’ waste sorting intentions. Int. J. Environ. Res. Public Health 2023, 20, 5099. [Google Scholar] [CrossRef] [PubMed]
  106. Liu, J. ChatGPT: Perspectives from human–computer interaction and psychology. Front. Artif. Intell. 2024, 7, 1418869. [Google Scholar] [CrossRef] [PubMed]
  107. Kuen, L.; Westmattelmann, D.; Bruckes, M.; Schewe, G. Who earns trust in online environments? A meta-analysis of trust in technology and trust in provider for technology acceptance. Electron. Mark. 2023, 33, 61. [Google Scholar] [CrossRef]
  108. Gefen, D.; Karahanna, E.; Straub, D.W. Trust and TAM in online shopping: An integrated model. MIS Q. 2003, 27, 51–90. [Google Scholar] [CrossRef]
  109. Chan, C.K.Y.; Hu, W. Students’ voices on generative AI: Perceptions, benefits, and challenges in higher education. Int. J. Educ. Technol. High. Educ. 2023, 20, 43. [Google Scholar] [CrossRef]
  110. Chen, S.Y.; Lu, C.C. Exploring the relationships of green perceived value, the diffusion of innovations, and the technology acceptance model of green transportation. Transp. J. 2016, 55, 51–77. [Google Scholar] [CrossRef]
  111. Shang, D.; Wu, W.; Schroeder, D. Exploring determinants of the green smart technology product adoption from a sustainability adapted value-belief-norm perspective. J. Retail. Consum. Serv. 2023, 70, 103169. [Google Scholar] [CrossRef]
  112. Solomovich, L.; Abraham, V. Exploring the influence of ChatGPT on tourism behavior using the technology acceptance model. Tour. Rev. 2024. ahead-of-print. [Google Scholar] [CrossRef]
  113. Bhaskar, P.; Misra, P.; Chopra, G. Shall I use ChatGPT? A study on perceived trust and perceived risk towards ChatGPT usage by teachers at higher education institutions. Int. J. Inf. Learn. Technol. 2024, 41, 428–447. [Google Scholar] [CrossRef]
Figure 1. Research theoretical model.
Applsci 15 08088 g001
Figure 2. Questionnaire screening process.
Applsci 15 08088 g002
Figure 3. Analytical method process.
Applsci 15 08088 g003
Figure 4. SEM testing results.
Applsci 15 08088 g004
Table 1. Modified scale measures.
MeasureReference Scale
Performance Expectancy Value
(PEV)
Shahsavar and Choudhury [34]
Strzelecki [68]
Information Quality Value
(IQV)
Iranmanesh et al. [14]
Yin and Qiu [69]
Trust Transfer Value
(TTV)
Chang and Park [39]
Iranmanesh et al. [14]
Green Perceived Value
(GPV)
Riva et al. [70]
Green Self-Identity Value
(GSV)
Sharma et al. [71]
Grębosz-Krawczyk et al. [72]
Perceived Ease of Use
(PEU)
Mun and Hwang [73]
Iranmanesh et al. [14]
Perceived Usefulness
(PU)
Iranmanesh et al. [14]
Continue Using Intention
(CUI)
Mun and Hwang [73]
Table 2. Fit index measurements.
Measurement IndicatorsCMINDFCMIN/DFRMRGFITLICFIRMSEA
Reference Standard--<3<0.05>0.9>0.9>0.9<0.05
Measured Value980.9387121.3780.0390.9260.9820.9830.025
Table 3. Test for direct effects.
HypothesisDirect Effect PathSTD. EstimateS.E.C.R.p-ValueResult
_PEU<---PEV0.1670.0472.8940.004Supported
_PEU<---IQV0.1840.0453.616***Supported
_PEU<---TTV0.0510.0401.1800.238Not Supported
_PEU<---GPV0.1840.0663.414***Supported
_PEU<---GSV0.0810.0471.6120.107Not Supported
_PU<---PEV0.1640.0513.2330.001Supported
_PU<---IQV0.1210.0482.7160.007Supported
_PU<---TTV0.0990.0432.6200.009Supported
_PU<---GPV0.1740.0713.647***Supported
_PU<---GSV0.1480.0503.369***Supported
H1CUI<---PEV0.1300.0492.3780.017Supported
H2CUI<---IQV0.1320.0462.7340.006Supported
H3CUI<---TTV0.0770.0411.8950.058Not Supported
H4CUI<---GPV−0.0080.068−0.1550.877Not Supported
H5CUI<---GSV0.1920.0493.979***Supported
H16PU<---PEU0.2160.0515.144***Supported
H17CUI<---PEU0.1990.0514.261***Supported
H18CUI<---PU0.1660.0453.2870.001Supported
Note: *** indicates p < 0.01.
Table 4. Test for mediating effects.
HypothesisIndirect Effect PathEstimateBias-Corrected 95% CIp-ValueResult
LowerUpper
H6PEV-PEU-CUI0.0330.0110.0720.003Supported
H7IQV-PEU-CUI0.0370.0130.0760.002Supported
H8TTV-PEU-CUI0.010−0.0050.0320.171Not Supported
H9GPV-PEU-CUI0.0370.0120.0750.002Supported
H10GSV-PEU-CUI0.016−0.0020.0470.083Not Supported
H11PEV-PU-CUI0.0270.0070.0630.004Supported
H12IQV-PU-CUI0.0200.0050.0460.005Supported
H13TTV-PU-CUI0.0160.0040.0410.008Supported
H14GPV-PU-CUI0.0290.0090.0630.002Supported
H15GSV-PU-CUI0.0250.0070.0550.002Supported
Table 5. Root mean square of error values.
TrainingTestingTotal Samples
NSSERMSENSSERMSE
521172.359 1.7386 7019.794 0.5318 591
525168.255 1.7664 6614.576 0.4699 591
531157.924 1.8337 6021.942 0.6047 591
531172.425 1.7549 6013.815 0.4798 591
532164.818 1.7966 5920.620 0.5912 591
528155.263 1.8441 6327.289 0.6581 591
526167.652 1.7713 6524.139 0.6094 591
530170.517 1.7630 6117.875 0.5413 591
521156.677 1.8235 7023.428 0.5785 591
534172.623 1.7588 5714.520 0.5047 591
Mean165.851 1.7851 19.800 0.5570
SD6.499 0.0350 4.336 0.0583
Table 6. Sensitivity analysis.
Neural Network (NN)PEVIQVTTVGPVGSVPEUPU
NN (i)0.2100.1150.0360.1550.1190.0640.301
NN (ii)0.1510.1470.0560.0910.2100.1920.154
NN (iii)0.1720.1110.1100.0470.1300.2300.199
NN (ix)0.1560.1250.0660.0490.1890.2270.189
NN (v)0.1360.1360.0510.0890.1970.2520.139
NN (vi)0.1380.1120.1010.0750.1700.2290.175
NN (vii)0.1670.1940.0900.0250.1770.1490.198
NN (viii)0.0630.1260.1710.0860.1640.2000.190
NN (ix)0.1390.1000.1090.0470.1800.2150.211
NN (x)0.0900.0620.1090.1660.1310.1790.263
Average importance0.1420.1230.0900.0830.1670.1940.202
Normalized importance (%)0.615 0.545 0.403 0.345 0.737 0.857 0.867
Table 7. SEM and ANN results comparison.
Predictor (SEM Path to CUI)SEM
Standardized Path
Coefficient
ANN
Normalized Relative
Importance
SEM RankANN RankRemark
PEU → CUI0.19985.7%12Dominant in both models; very strong convergent evidence
GSV → CUI0.19273.7%23Consistently high; confirms critical role of enjoyment
PU → CUI0.16686.7%31Highest in ANN, top three in SEM; instrumental value decisive
IQV → CUI0.13254.5%45Moderate, significant in SEM and ANN; informational reliability matters
PEV → CUI0.13061.5%54Mid-tier in both analyses; functional efficacy remains important
TTV → CUI0.07740.3%66Low importance; non-significant in SEM, minor in ANN
GPV → CUI–0.00834.5%77Lowest and non-significant across methods; limited direct influence
Note: Ranks are based on the absolute magnitude of the standardized path coefficients.
Disclaimer/Publisher’s Note: The statements, opinions and data contained in all publications are solely those of the individual author(s) and contributor(s) and not of MDPI and/or the editor(s). MDPI and/or the editor(s) disclaim responsibility for any injury to people or property resulting from any ideas, methods, instructions or products referred to in the content.

