1. Introduction
Increasing the level of road safety and reducing the impact of traffic accidents is currently one of the top priorities for action by many countries around the world. Among the main areas of activity are modern technologies [
1,
2,
3,
4,
5,
6] as well as driver education and training.
Advanced Driver Assistance Systems (ADASs) are advanced technologies used in today’s vehicles, designed to enhance road safety, improve driving comfort, and make driving in diverse conditions easier. They represent one of the key steps on the road to full vehicle autonomy. ADAS uses a set of state-of-the-art sensors—such as cameras, radar, lidar, or ultrasonic sensors—combined with sophisticated software that analyzes data in real time. As a result, these systems are able to monitor the vehicle’s surroundings, identify potential hazards, and take appropriate actions to support the driver. Key ADAS features include adaptive cruise control, which automatically adjusts speed to that of the vehicle ahead; lane keep assist, which warns or corrects the vehicle’s path if it inadvertently leaves the lane; and automatic emergency braking, which responds to sudden obstacles such as pedestrians, cyclists, and other vehicles to minimize the risk of a collision. Additional features, such as traffic sign recognition, parking assist, and blind spot monitoring, increase the driver’s situational awareness and make it easier to maneuver the vehicle. ADAS are constantly being developed, and their effectiveness depends on the quality of sensors and algorithms that process data. Today’s vehicles increasingly combine multiple ADAS functions to create comprehensive systems that operate in an integrated manner. For example, in difficult weather conditions such as rain or fog, these systems can support the driver by compensating for reduced visibility. However, despite its sophistication, ADAS does not fully replace the driver—it requires their attention and readiness to take control at any time. As technology evolves, these systems are becoming more intuitive and reliable, predicting that they will be the foundation for fully autonomous vehicles in the future. Their prevalence in new car models demonstrates the growing importance of safety and innovation in the automotive industry.
Despite the growing number of vehicles equipped with such systems, studies show that most drivers lack the proper knowledge and skills to use ADAS. They often learn how to use them only while driving, and not always correctly. There is also a lack of adequate and reliable training materials. Drivers sometimes overestimate their competence or misinterpret the operation of the systems, which can reduce the effectiveness of ADAS and jeopardize road safety.
In response to these problems, the authors developed a model for evaluating the effectiveness of practical training using the Advanced Driving Simulator AS1200-6 at the Motor Transport Institute. The aim of the study was to objectively measure drivers’ progress in operating safety systems after receiving professional training. The study showed that the use of modern training tools—such as simulators and data models—combined with trainer evaluation can significantly improve the quality of ADAS operation training and increase actual safety on the road. This points to the need to include hands-on, interactive forms of learning in educational processes related to new automotive technologies.
2. Literature Review
The effective integration of Advanced Driver Assistance Systems (ADASs) into modern vehicles presents a dual challenge: developing robust technology and ensuring that drivers can use it effectively. The literature reveals significant advancements in ADAS technology itself, yet also highlights persistent issues in driver training and performance assessment. To build a case for our study, this review will first examine recent technological solutions for vehicle and driver monitoring, then explore studies on evaluating driver behavior and training, which will ultimately lead to identifying a critical gap in objective assessment methods.
The article [
7] presents a state-of-the-art pedestrian detection system at night for autonomous vehicles and driver assistance systems (ADASs). It uses a fusion of RGB and thermal imaging camera data to effectively detect pedestrians in difficult lighting conditions. Images from both cameras are automatically matched using an algorithm that compensates for differences in resolution and field of view, eliminating the parallax effect. The data is combined using a late-fusion method, which provides the best compromise between accuracy and speed. Using the YOLOv5 algorithm and transfer learning, the system generates accurate pedestrian detection frames. Optimization using TensorRT has increased performance to 33 frames per second on an NVIDIA Jetson Orin device, enabling real-time processing.
The article [
8] presents a system that enables automatic detection and classification of critical traffic situations on highways, which supports the safety assessment of driver assistance systems (ADASs) at level 3 autonomy according to SAE classification. At this level, the system can take full control of the vehicle under certain conditions, such as when driving on a highway, without the need for constant driver supervision. The system relies on data from radar, lidar, and cameras, recording longitudinal and transverse distances at 50 Hz. It compares two approaches to scenario classification: a traditional rule-based model (decision tree) and a modern approach using machine learning—Time Series Forest (TSF). The TSF model was trained on so-called idealized vehicle maneuvers, generated using Hermite-spline regression, which reflect typical traffic scenarios. The TSF-based solution showed higher precision and sensitivity in identifying critical events compared to the rule-based model, also performing better in the presence of data noise. The use of such methods enables more effective evaluation of ADAS and supports the development of safer autonomous driving technologies. These studies [
7,
8] exemplify the technological sophistication of modern ADAS, but their real-world effectiveness hinges on the driver’s interaction with these systems, particularly under challenging conditions.
To that end, other research focuses on monitoring the driver directly. The article [
9,
10] describes the on-board unit (OBU) system integrated with the vehicle, supporting the driver through warnings about speeding and dangerous curves, as part of Vehicle-to-Infrastructure (V2I) communication. The system was tested in the SimEASY driving simulator on a virtual version of the winding country road SS113 (Messina, Italy) with a width of 7 m. The described system is aimed at improving safety in dangerous road conditions, such as passing groups of cyclists. The experiment involved 14 drivers, analyzing their visual behavior (using the Tobii Glass eye tracker) and workload (NASA TLX) in four scenarios. NASA TLX is a method for assessing the subjective workload of a user during the performance of an assigned task, developed by NASA scientists. The system displays visual warnings on a screen divided into four zones, signaling inappropriate behavior or key elements of the route, and remains inactive when the driver behaves correctly. This ADAS (OBU) system helps drivers in moderate driving situations, such as when driving on a winding road with cyclists, by reducing speeding, but loses effectiveness in simple or extremely difficult conditions when drivers bypass the device to concentrate on the road.
The article [
11] presents a deep learning-based driver drowsiness detection technique (DLID3-ADAS) aimed at increasing road safety through integration with Advanced Driver Assistance Systems (ADASs). The presented DLID3-ADAS technique is based on a multi-stage process of detecting driver drowsiness, using deep machine learning along with hyperparameter optimization. Initially, images from the vehicle’s on-board cameras are pre-processed using a filter that reduces noise and artifacts by replacing the pixel intensity values with the median values in their local vicinity, improving the quality of input data for further analysis. For optimal selection of ShuffleNet hyperparameters, such as learning rate and lot size, the Northern Goshawk Optimization (NGO) algorithm is used, inspired by the hunting behavior of the Northern Hawk. The NGO algorithm systematically searches the parameter space, improving the accuracy of the model, reducing overfitting, and increasing its ability to generalize. In the final stage, the Extreme Learning Machine (ELM) model, based on single-layer feedforward networks, classifies the driver’s state as “sleepy” or “alert”, offering fast and precise predictions thanks to simplicity and low computational requirements. Feedforward networks are networks in which information flows in one direction from the input layer, through a single hidden layer, to the output layer, without feedback loops or cycles. As a result, the system generates alerts, such as audible or visual signals, when drowsiness is detected, allowing the driver to take action to prevent accidents. The entire process is optimized for real-time operation, making it suitable for Advanced Driver Assistance Systems (ADASs).
The article [
12] presents a methodology for evaluating the effectiveness of an on-board unit (OBU) in improving road safety by analyzing its effect on driver behavior under simulated conditions. A study of 14 young drivers showed that OBU does not increase psychophysical load, as confirmed by telemetry data and NASA TLX survey results. The presence of cyclists does affect driving parameters, but OBU does not worsen these responses, and in some cases, promotes more stable driving. The authors emphasize the need for different measures of load and dynamic adjustment of support systems to road conditions and driver characteristics. A limitation of the study is the small sample size and specific route. The results can support road managers in identifying dangerous sections and planning measures to improve safety.
While these technological systems provide crucial support, the literature underscores a fundamental gap between system availability and driver proficiency. Despite the widespread use of driver assistance systems, potential users have very little knowledge about them. About 180 people from the group of drivers and fleet managers took part in the survey conducted by the Motor Transport Institute. As many as 52.3% of participants asked about the source of their knowledge about ADAS admitted that they learned by trial and error. At the same time, participants admitted that they did not take part in the training, but would gladly do so if it were available [
13,
14,
15]. Currently, there is a lack of reliable materials from which drivers could draw their knowledge. Instructions, although often containing errors, are still the main source of information. Drivers and dealers are not aware of the benefits and risks of using ADAS. So far, no requirements have been introduced as to drivers’ skills in the field of their proper use. There is also a lack of a clear approach to assessing the quality and effectiveness of training [
16]. Training drivers in the proper use of ADAS seems to be crucial for road safety [
15,
16,
17].
Driving simulators are an attractive alternative for training novice drivers, due to the ability to control key aspects of the road environment, which ensures the safety of both the student and the instructor [
18,
19].
In the Netherlands, simulators are used to train candidate drivers before driving on the road [
18]. The literature on evaluating the effectiveness of this type of training indicates an improvement in participants’ skills in a simulated environment [
19,
20], especially when the scenarios represent possible real-life traffic situations [
21]. The indicated studies clearly confirm that simulators are useful for training specific skills [
22,
23,
24,
25,
26].
Studies conducted so far confirm that drivers tend to overestimate their skills and underestimate their deficits [
27,
28,
29,
30,
31,
32]. It has been shown in many studies that the majority of drivers assess themselves as more qualified than the average driver [
33,
34,
35,
36,
37].
The surveyed drivers also believed that they drove slower [
38] and were less likely to be involved in a car accident than the average driver [
39,
40,
41].
According to the results, the problem of overestimating one’s skills may affect anywhere from 70% to 90% of drivers [
42,
43,
44].
Publication [
45] examined the overconfidence of novice drivers from the Netherlands and Finland, comparing the self-assessment of their competence with the assessments made by examiners. The results of the survey showed that as many as about 40% of the Dutch and 30% of candidates from Finland overestimated their competences. It is also worth noting that on the five-point scale used for self-assessment, candidates’ grades were considered realistic only if they were at exactly the same point on the scale as the examiner’s score. If the assessments could differ by one point on the scale and were still considered realistic, around 80% of Dutch candidates and around 90% of Finnish candidates would make a realistic assessment of their own competences.
The results suggest that self-esteem may be determined by the scale used to measure it. A detailed self-assessment based on a detailed scale is more realistic than a rating based on a relative scale.
In summary, the reviewed literature reveals a significant paradox: while ADAS technology is rapidly advancing, its real-world safety benefits are being undermined by inadequate driver training and a prevalent overestimation of driver competency. Driving simulators have been identified as a potent tool for addressing this training deficit. However, the methods for evaluating the outcomes of such training often rely on subjective assessments, which lack the precision and objectivity required for rigorous performance evaluation. This synthesis of the literature points to a distinct research gap: the absence of a standardized, data-driven model capable of objectively and repeatably quantifying the effectiveness of practical ADAS training. The development of such a model is crucial for bridging the divide between training delivery and empirical skill assessment. Accordingly, the present study aims to address this gap by proposing and validating a novel fuzzy logic-based model designed to objectively measure improvements in driver skills following simulator-based ADAS training, thereby providing a robust alternative to traditional evaluation methods.
3. Research Group
A total of 41 women and 40 men took part in the study. The first iteration involved 31 women and 30 men; the second iteration involved 10 women and 10 men. Drivers were divided into two age groups: 27–39 years old and 40–65 years old. This study analyzes the results for 16 people who underwent practical training using high-end driving simulators in the first iteration of the research. Due to the extensive analysis, the remaining data will be presented in subsequent publications.
This study includes only the results from the first iteration of the study, which involved 61 participants. The results from the second iteration (20 participants) were used exclusively for model validation. Participants were divided into three training groups, each receiving a different type of instruction. In the first iteration, 20 individuals completed practical training. The remaining four participants were excluded based on the trainer’s expert assessment, which indicated that these individuals had not attained an adequate level of proficiency in operating the driving simulator.
The respondents had to have a category B driving license and at least one year of experience in driving a motor vehicle. No or little experience in driving with driver assistance systems, in particular with active cruise control and lane keeping systems, was also required.
In a pre-ride survey, most of the survey participants described themselves as above-average drivers. No one rated their skills as low; only 11% of the respondents described their skills as average. It should be noted, however, that despite positive self-reporting, nearly 20% of the study participants had previously caused an accident or collision, which reflects the actual capabilities of drivers [
46].
4. Testing Equipment—Passenger Vehicle Simulator AS1200-6
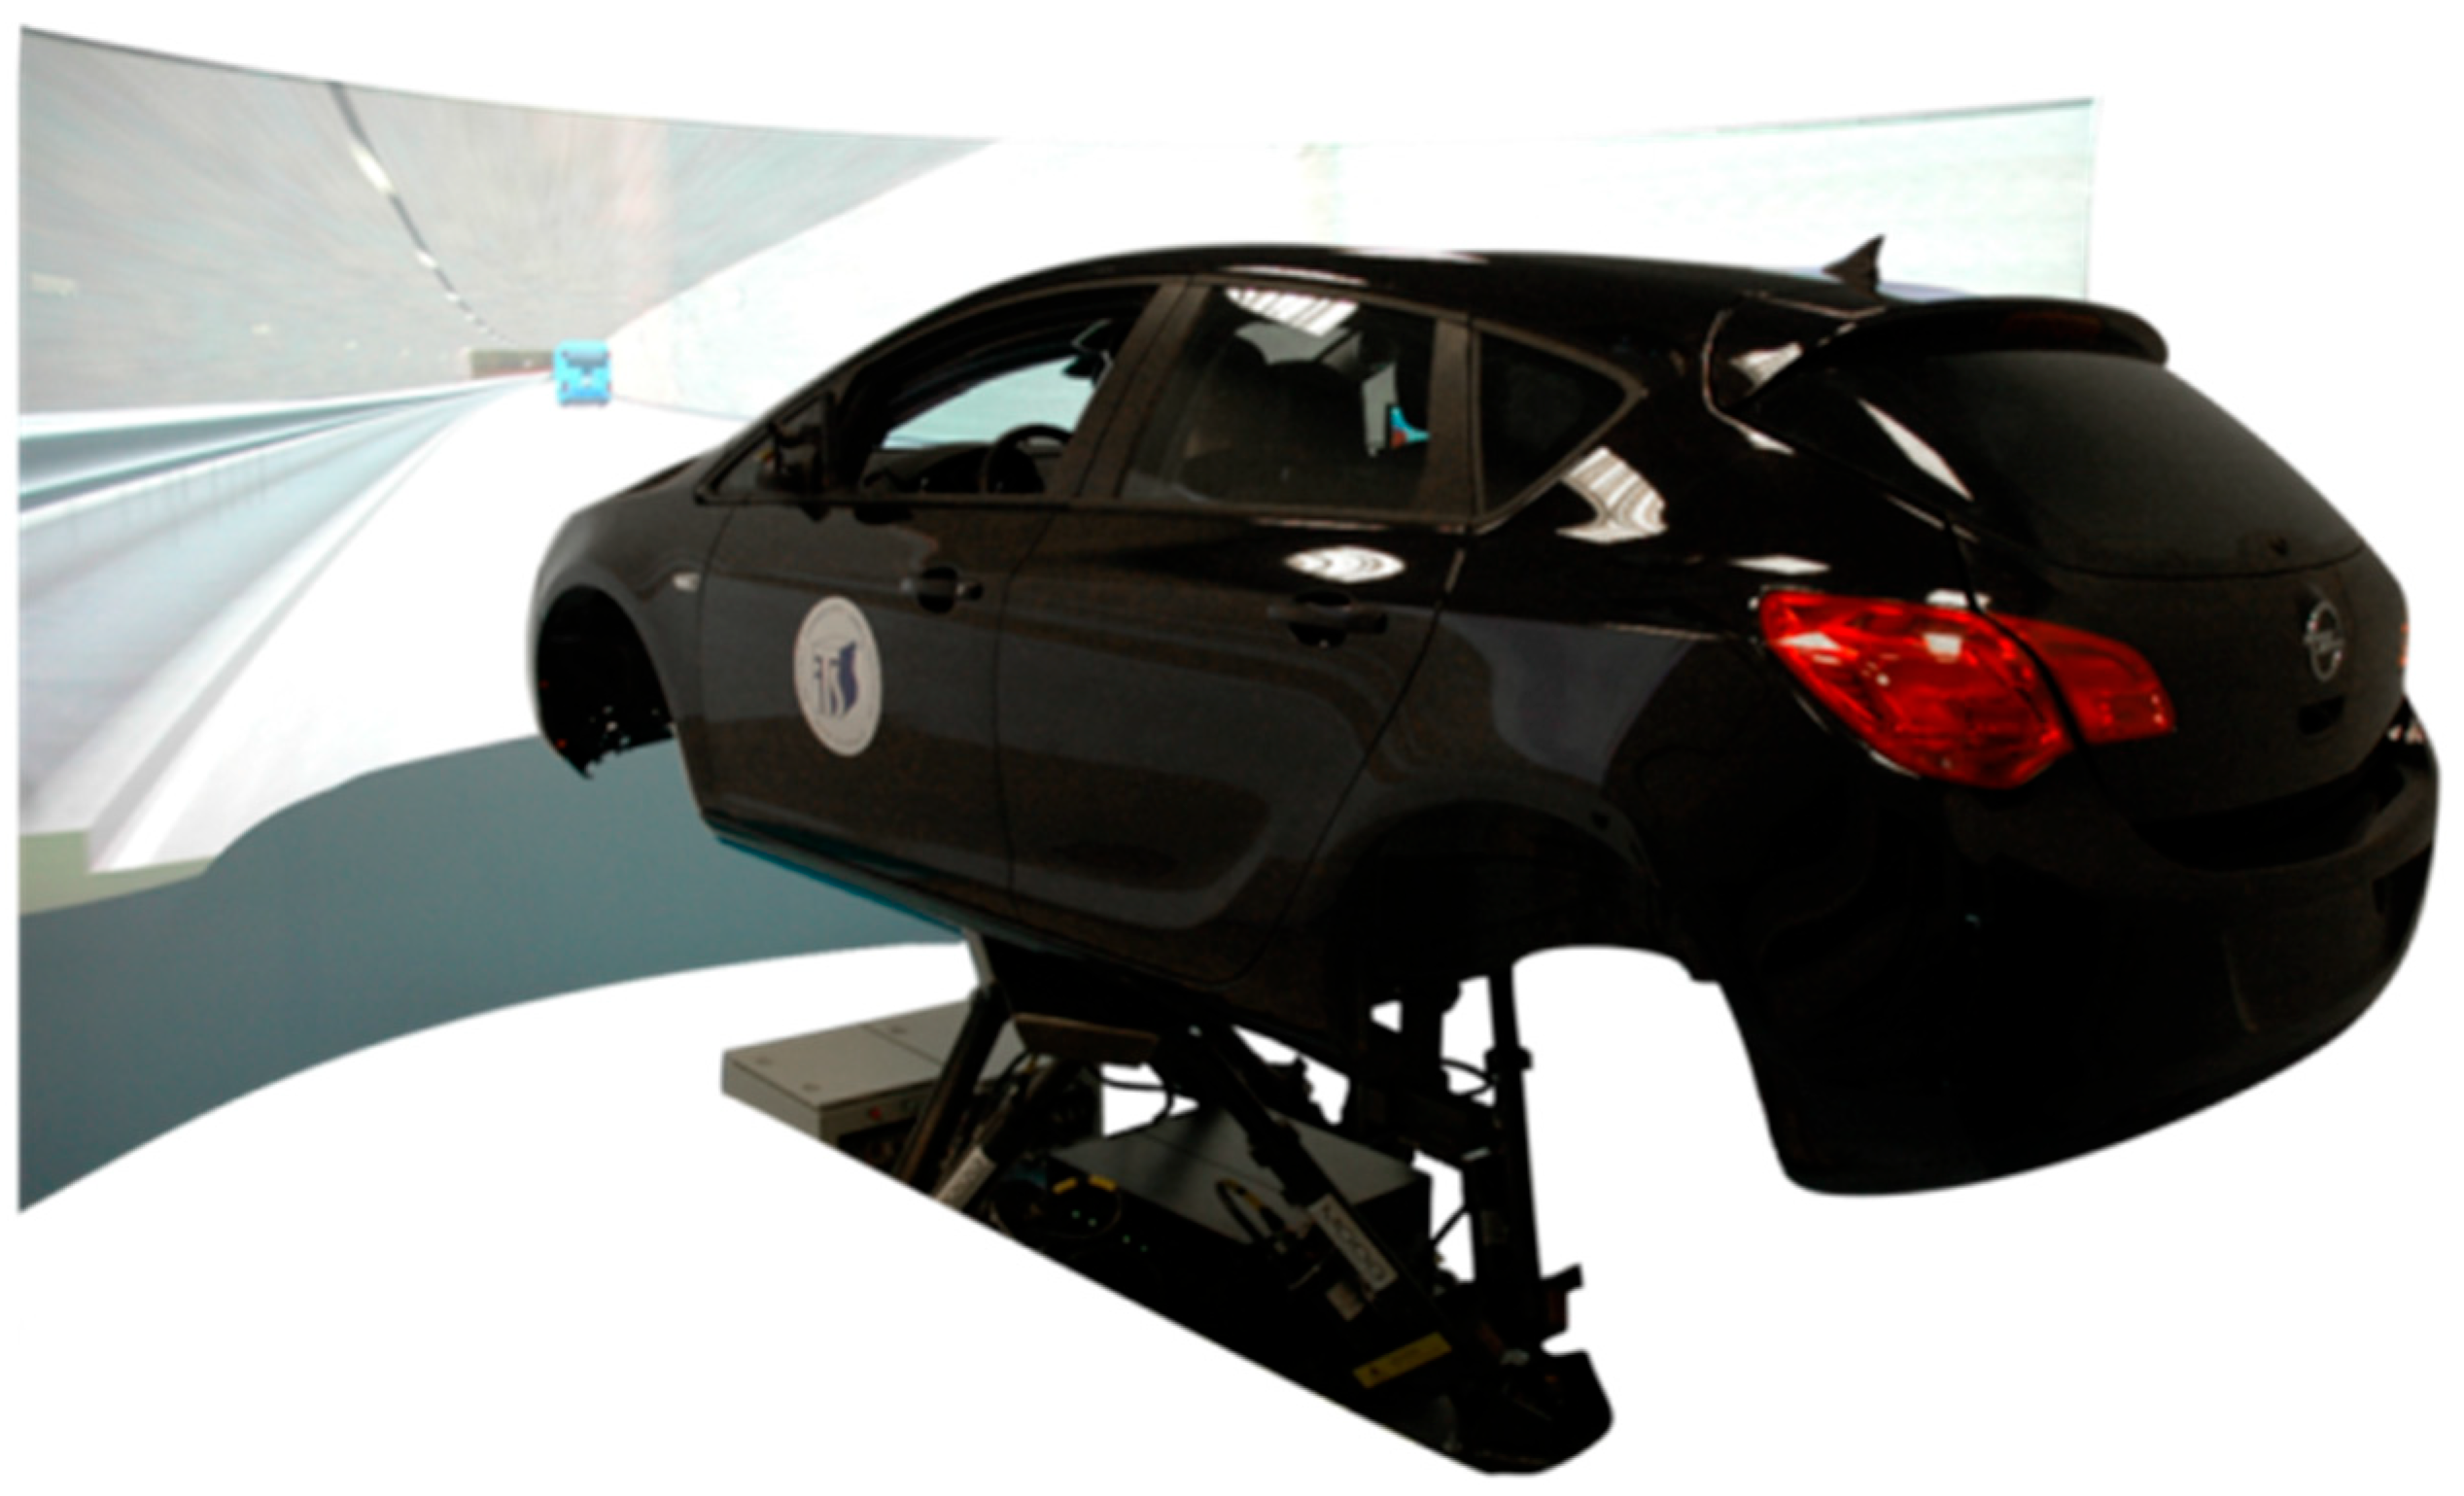
Both for practical training and for conducting research to determine the effects of the training, a high-class AS 1200-6 passenger car driving simulator, which is part of the equipment of the Motor Transport Institute, was used (
Figure 1, Passenger Car Simulator AS1200-6, (AutoSim, Tromsø, Norway). The simulator is built from a full-size, fully functional cabin of the Opel Astra IV vehicle, placed on a movable platform with six degrees of freedom. In front of the cabin of the vehicle, there is a cylindrical screen on which the image is displayed.
Dedicated software enables the construction of scenarios covering various weather and road conditions. The time of day, the condition of the surface (e.g., icy, slippery), and precipitation (snow, rain) may change. It is also possible to implement fog or wind. The software makes it possible to develop a scenario depending on the needs of a given experiment. They can include sections of any road, from extra-urban roads to expressways. The degree of traffic and the driving style of other vehicles may also be modified.
The highway driving assistant was used in the research. Its operation includes the following subsystems: adaptive cruise control, lane keeping assist, automatic overtaking system, and minimum risk maneuvering system. When the autonomous driving mode is selected, ACC automatically allows you to adjust the speed depending on the current traffic situation. The speed set by the driver is adjusted to the vehicles in front, maintaining a safe distance. The system reduces speed if the vehicle in front slows down. If it detects a clear space in front of the vehicle, the system accelerates to the set speed. LKA keeps the vehicle in the selected lane. If the turn signal is on, the vehicle will automatically change lanes (if the maneuver is safe). If the driver does not respond to a request to take control, the system may perform a minimum risk maneuver.
Practical training took place in the simulator cabin under the supervision of an instructor. The participant had the opportunity to drive the vehicle in a simulation environment, imitating driving on an expressway. During the ride, the participant gained knowledge on the proper use of the system, including its start-up, changing settings, and taking control properly.
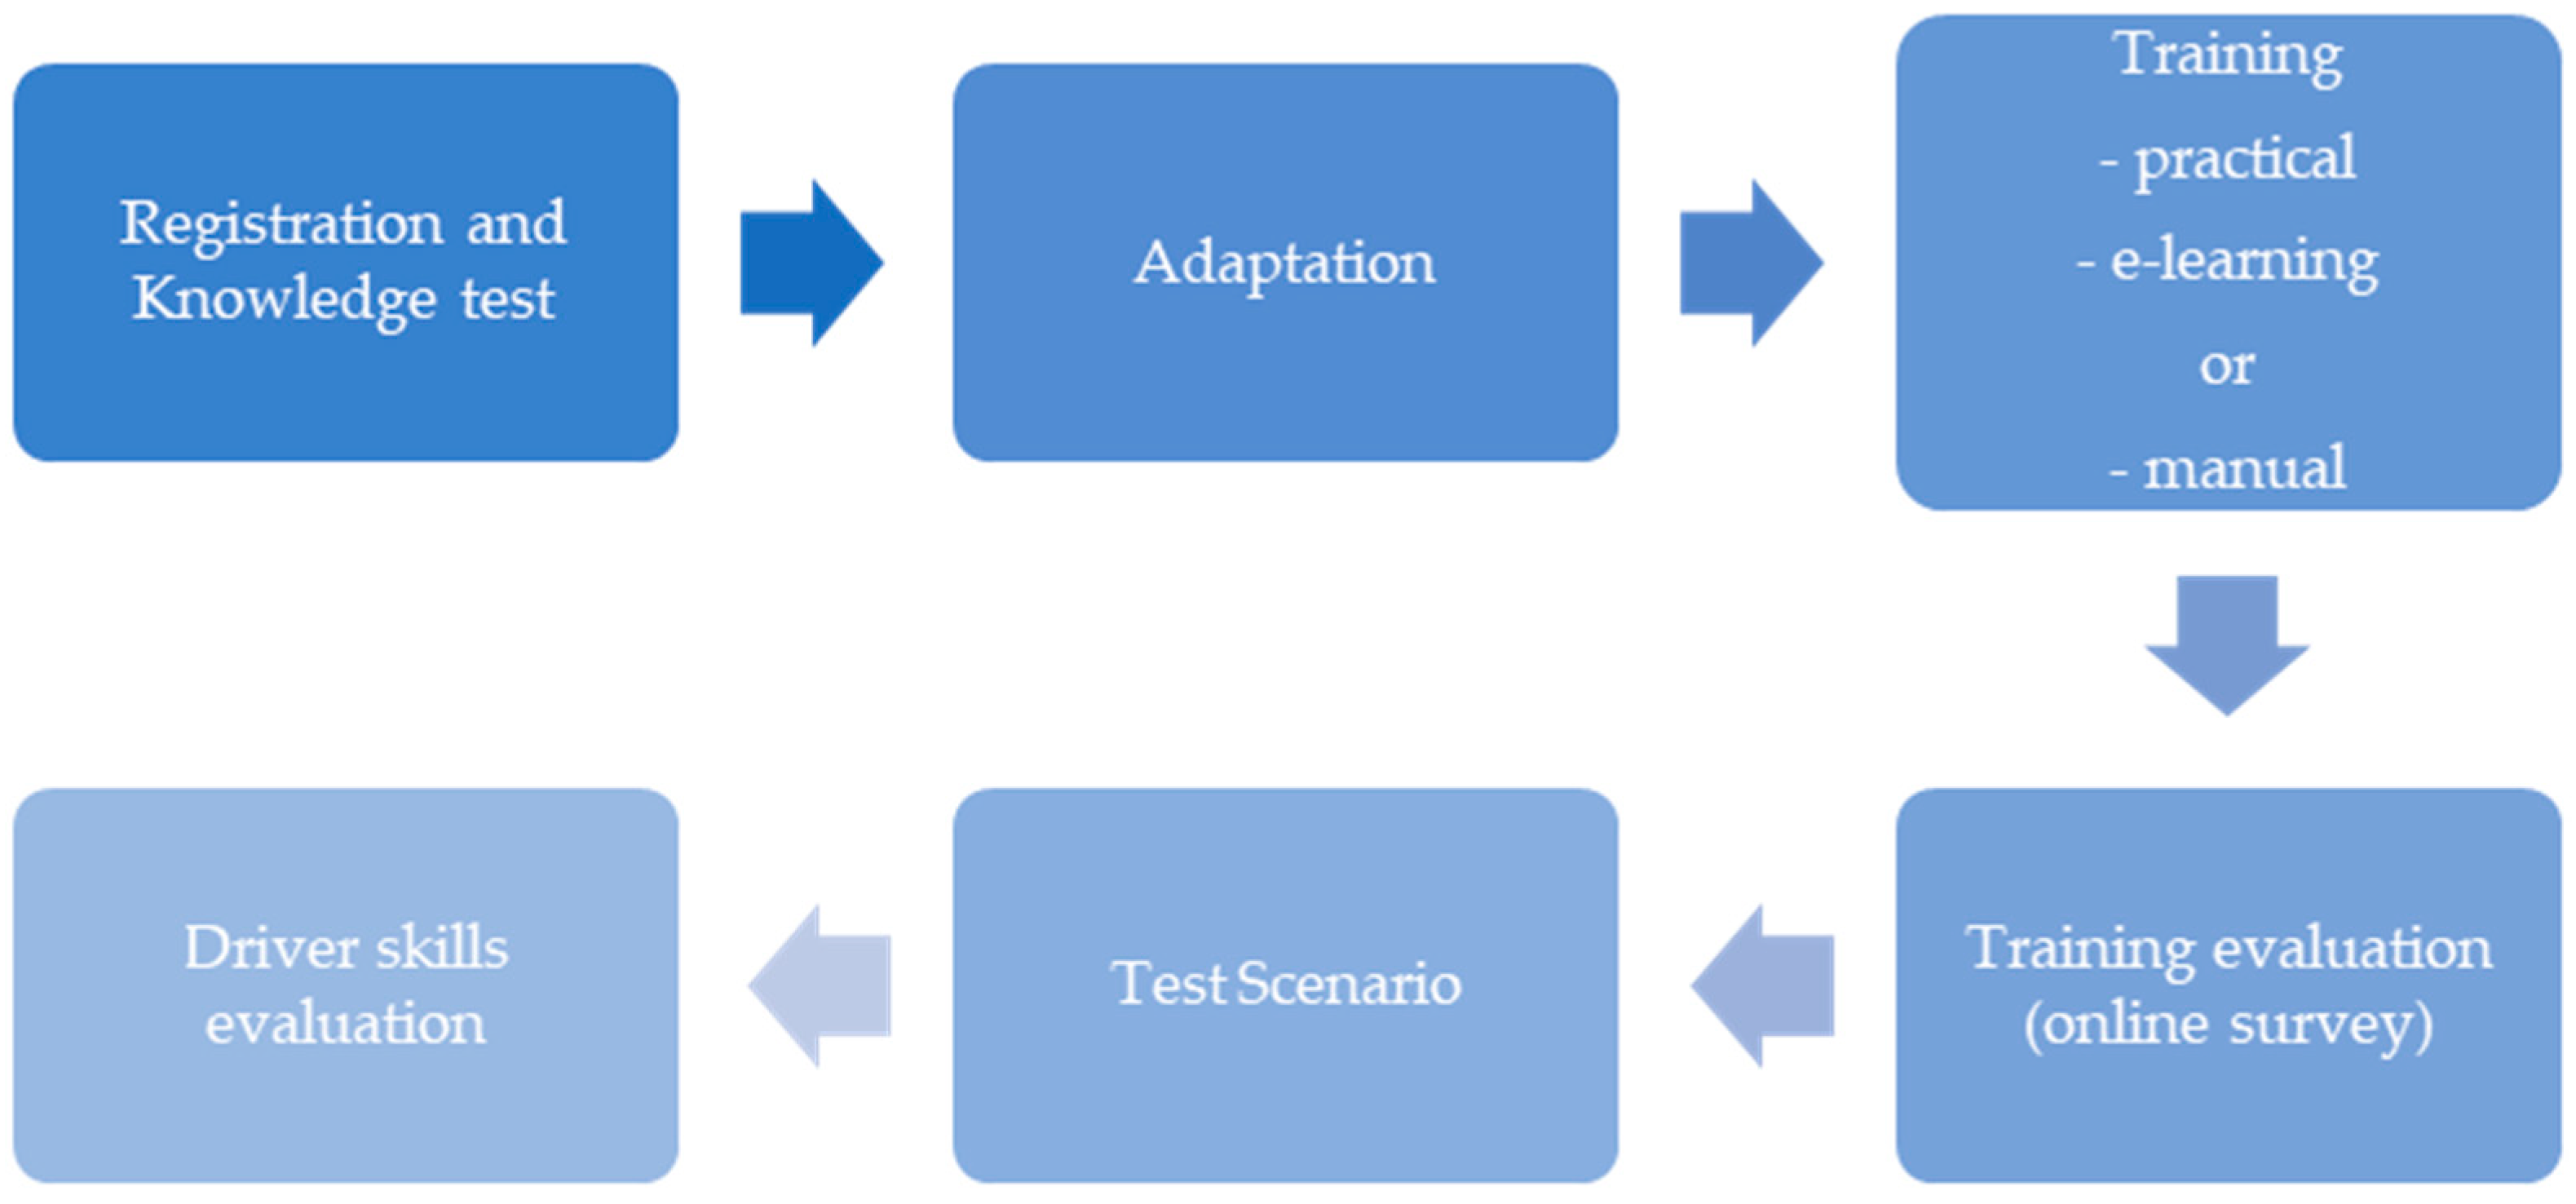
5. Methodology
The research procedure consisted of six main steps. The entire procedure is illustrated in
Figure 2.
In the first step, in a properly prepared room, the participants were registered and familiarized with the study regulations. The participant then completed a test to test their knowledge of automation and Advanced Driver Assistance Systems. Before starting the first ride on the simulator, it was necessary to conduct a revised simulator disease questionnaire (RSSQ) and exclude people whose psychophysical condition did not allow for the test. The survey was conducted before the adaptation and after each simulator ride.
If the trainee felt well, an adaptive drive in the driving simulator was started. Thanks to this, the participant could get acquainted with the operation of the simulator and the implemented system. The adaptation scenario lasted about 7 min and included driving on an expressway using the motorway driving assistant.
The next stage of the research was a test drive. During the ride, data was collected to assess the results of the training and identify driver behaviors that need improvement. The scenario predicts the movement of other vehicles, changing weather conditions, and three emergencies requiring the driver to take control. The last stage of testing the knowledge of drivers was the change in weather conditions and the appearance of fog, without a message informing about the need to take control. During the training, the drivers were informed that the system would not work properly in such conditions, and the driver’s task was to immediately take over the control activities, even in the absence of information from the system. The research scenario had a total length of 9350 m. The obstacles were placed approximately every 2000 m, which made it possible to avoid the hazard, stabilize the driving path, and safely activate the system. After the test drive, the coach assessed the driver’s skills. Then the trainee completed a knowledge test summarizing the knowledge after the training. Thanks to the use of electronic tools, the student could check his result and correct answers at the end of the test.
The last step was the assessment of their skills by the student. As in the case of the questionnaire for the trainer, the questionnaire was sent in electronic form, which allowed for a quick analysis of the results, as well as a comparison of the trainer’s and the student’s ratings.
Method for Evaluating the Effectiveness of Driver Training
This study evaluates the effectiveness of training methods on the basis of selected parameters collected during simulator tests. Due to the large number of input data, as well as their nonlinear nature, an assessment using heuristic methods was proposed [
41,
42,
47]. The fuzzy model was built in the MATLAB environment (Version R2023a, The MathWorks, Inc., Natick, MA, USA) using the Fuzzy Logic Designer tool [
48]. The Mamdani system was used in the study due to the ease of application of systems in which rules are created on the basis of expert knowledge [
49,
50,
51,
52,
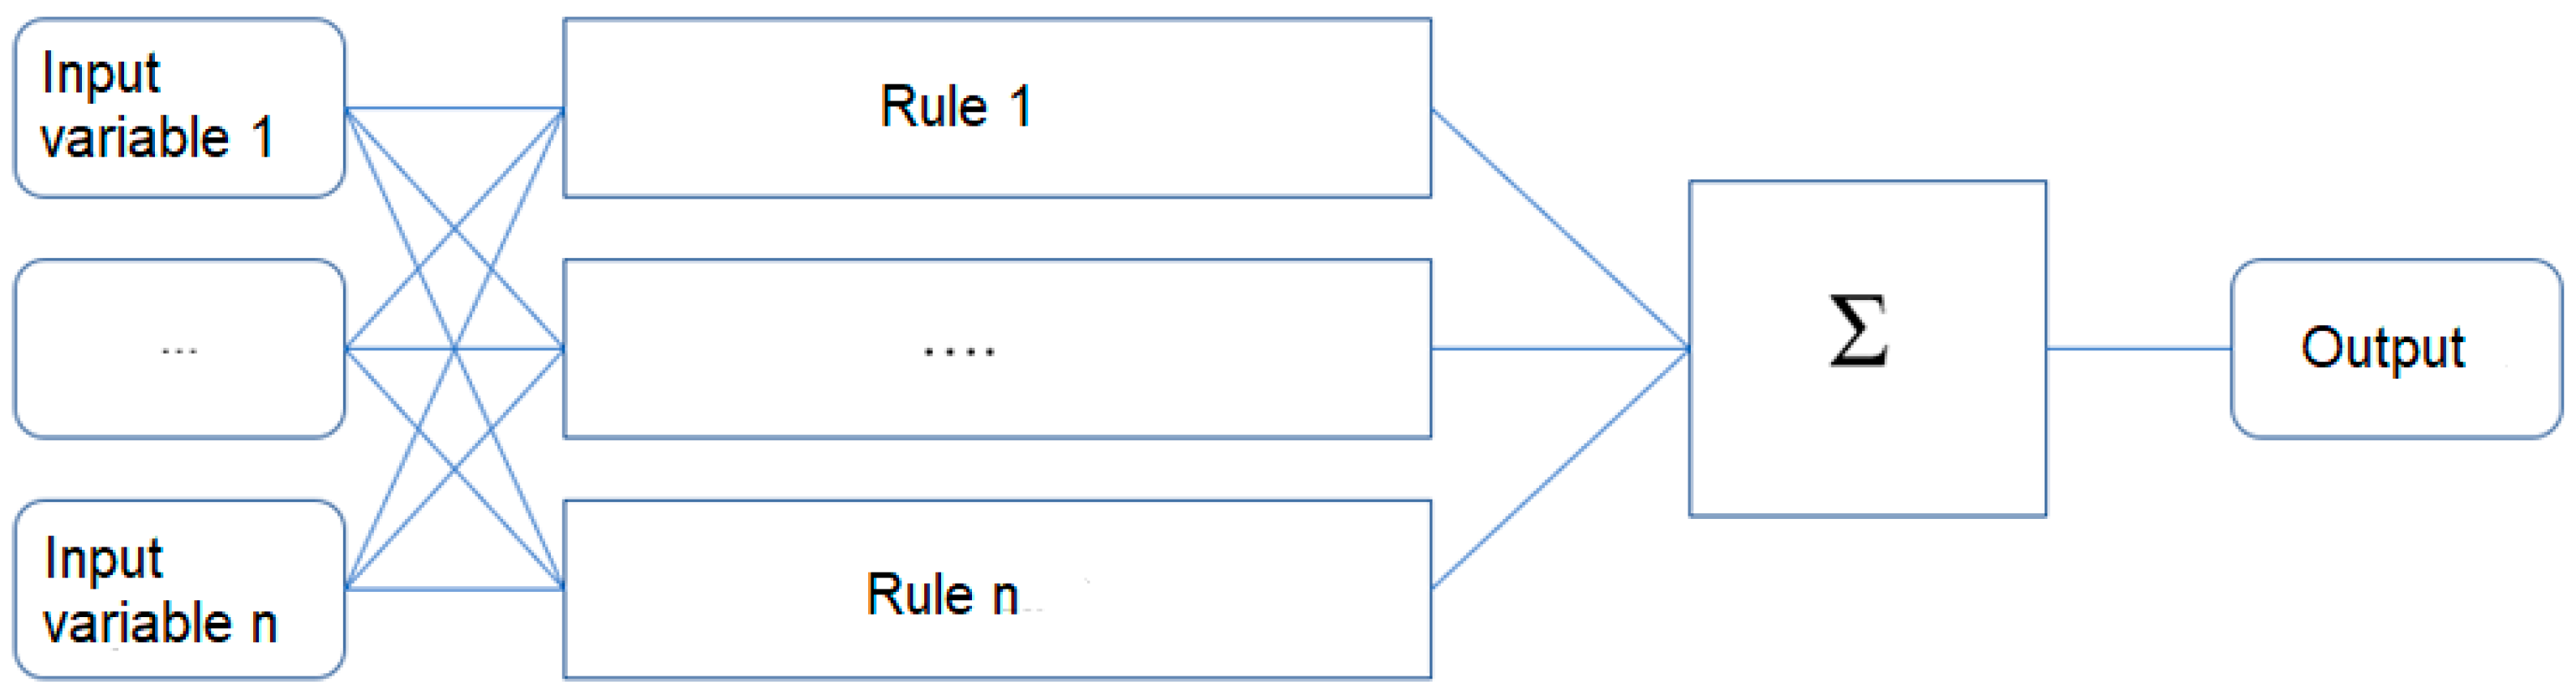
53]. This approach was chosen specifically for its ability to handle the inherent imprecision of human assessment, translating linguistic variables like “acceptable” or “too long” into a formal mathematical model. Unlike traditional statistical methods that require sharp, binary classifications, fuzzy logic allows for a more nuanced and human-like reasoning process. The output of each rule is also a fuzzy set. Fuzzy inference in the model occurs in five steps:
Fuzzification of input variables;
Use of fuzzy operator—defining rules;
Logical implication;
Aggregation of successors according to rules;
Defuzzification.
Figure 3 presents the process of fuzzy inference in the Mamdani model.
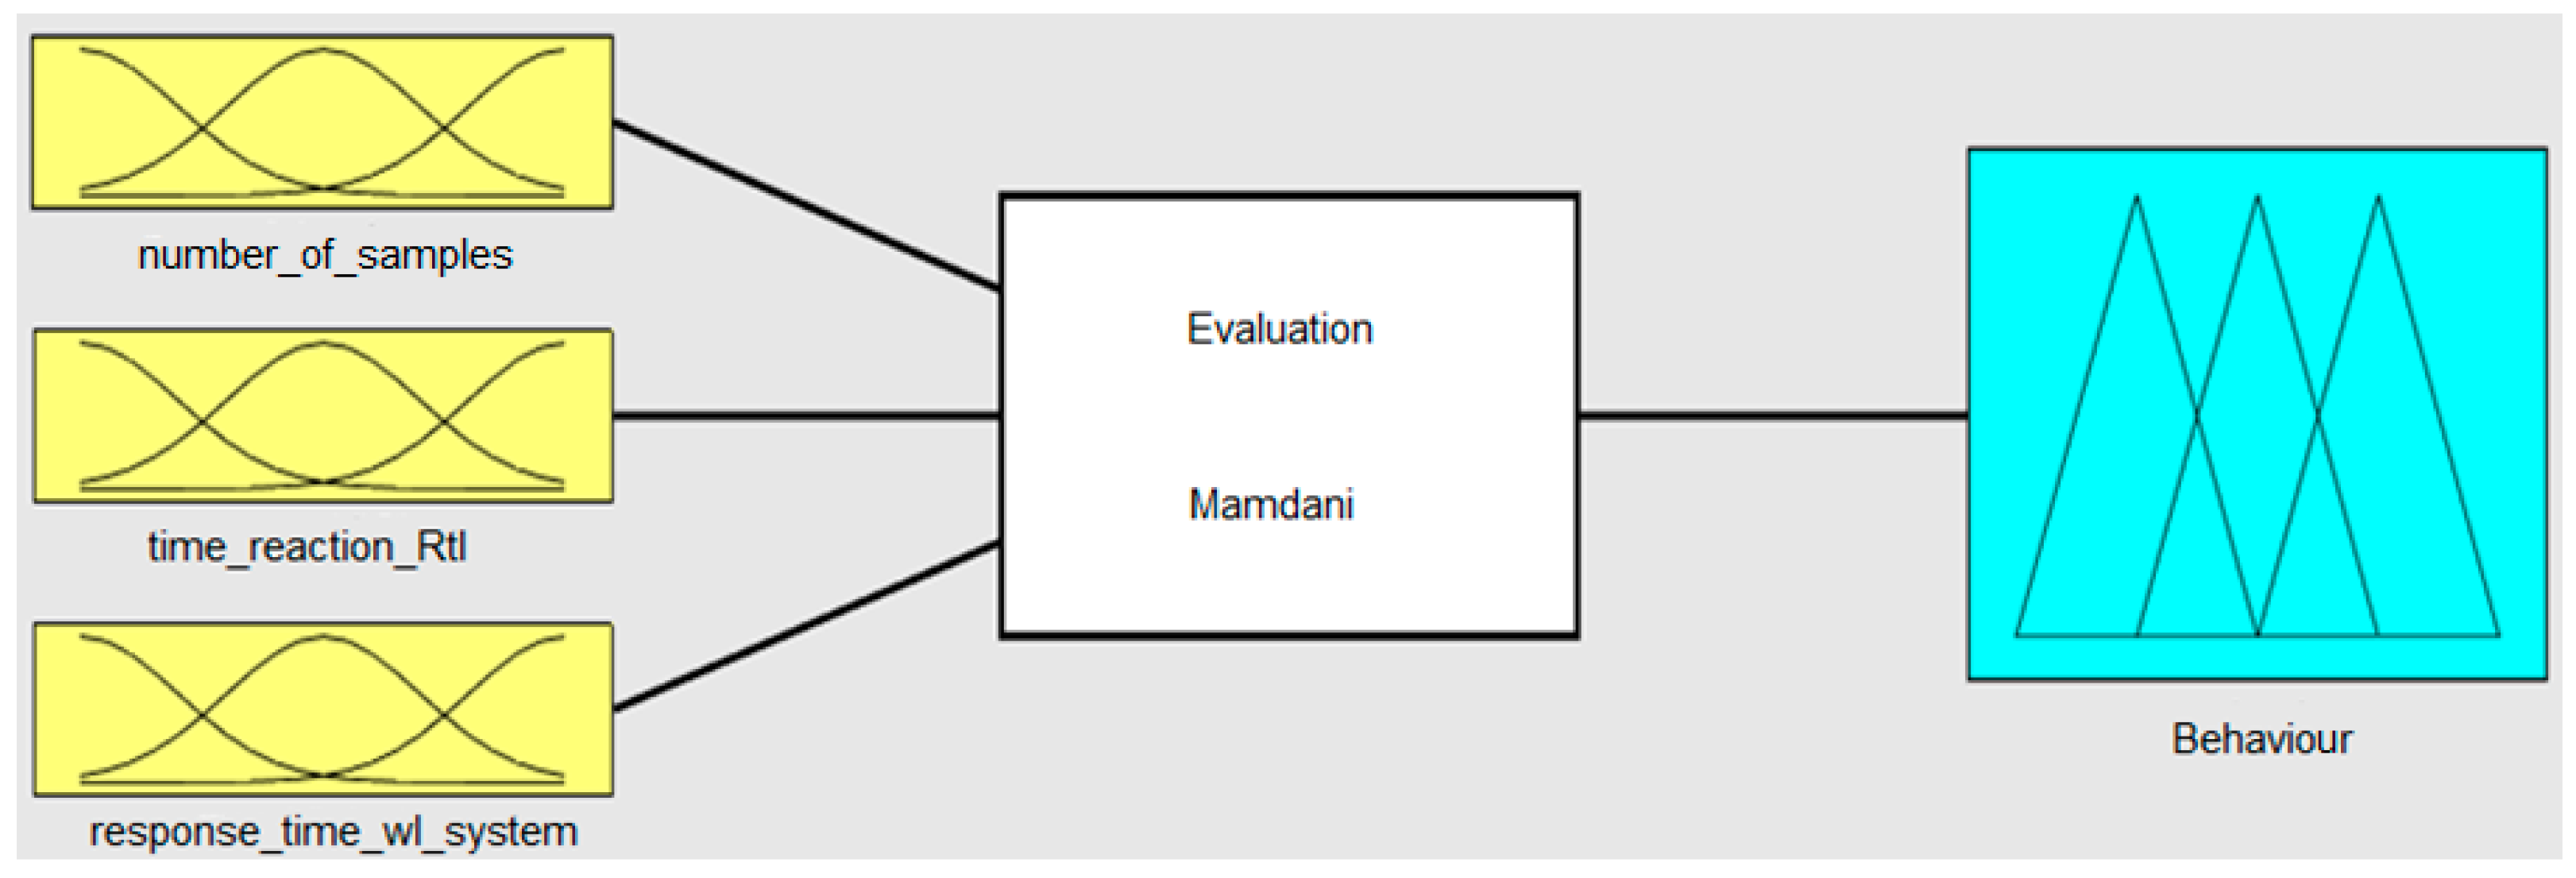
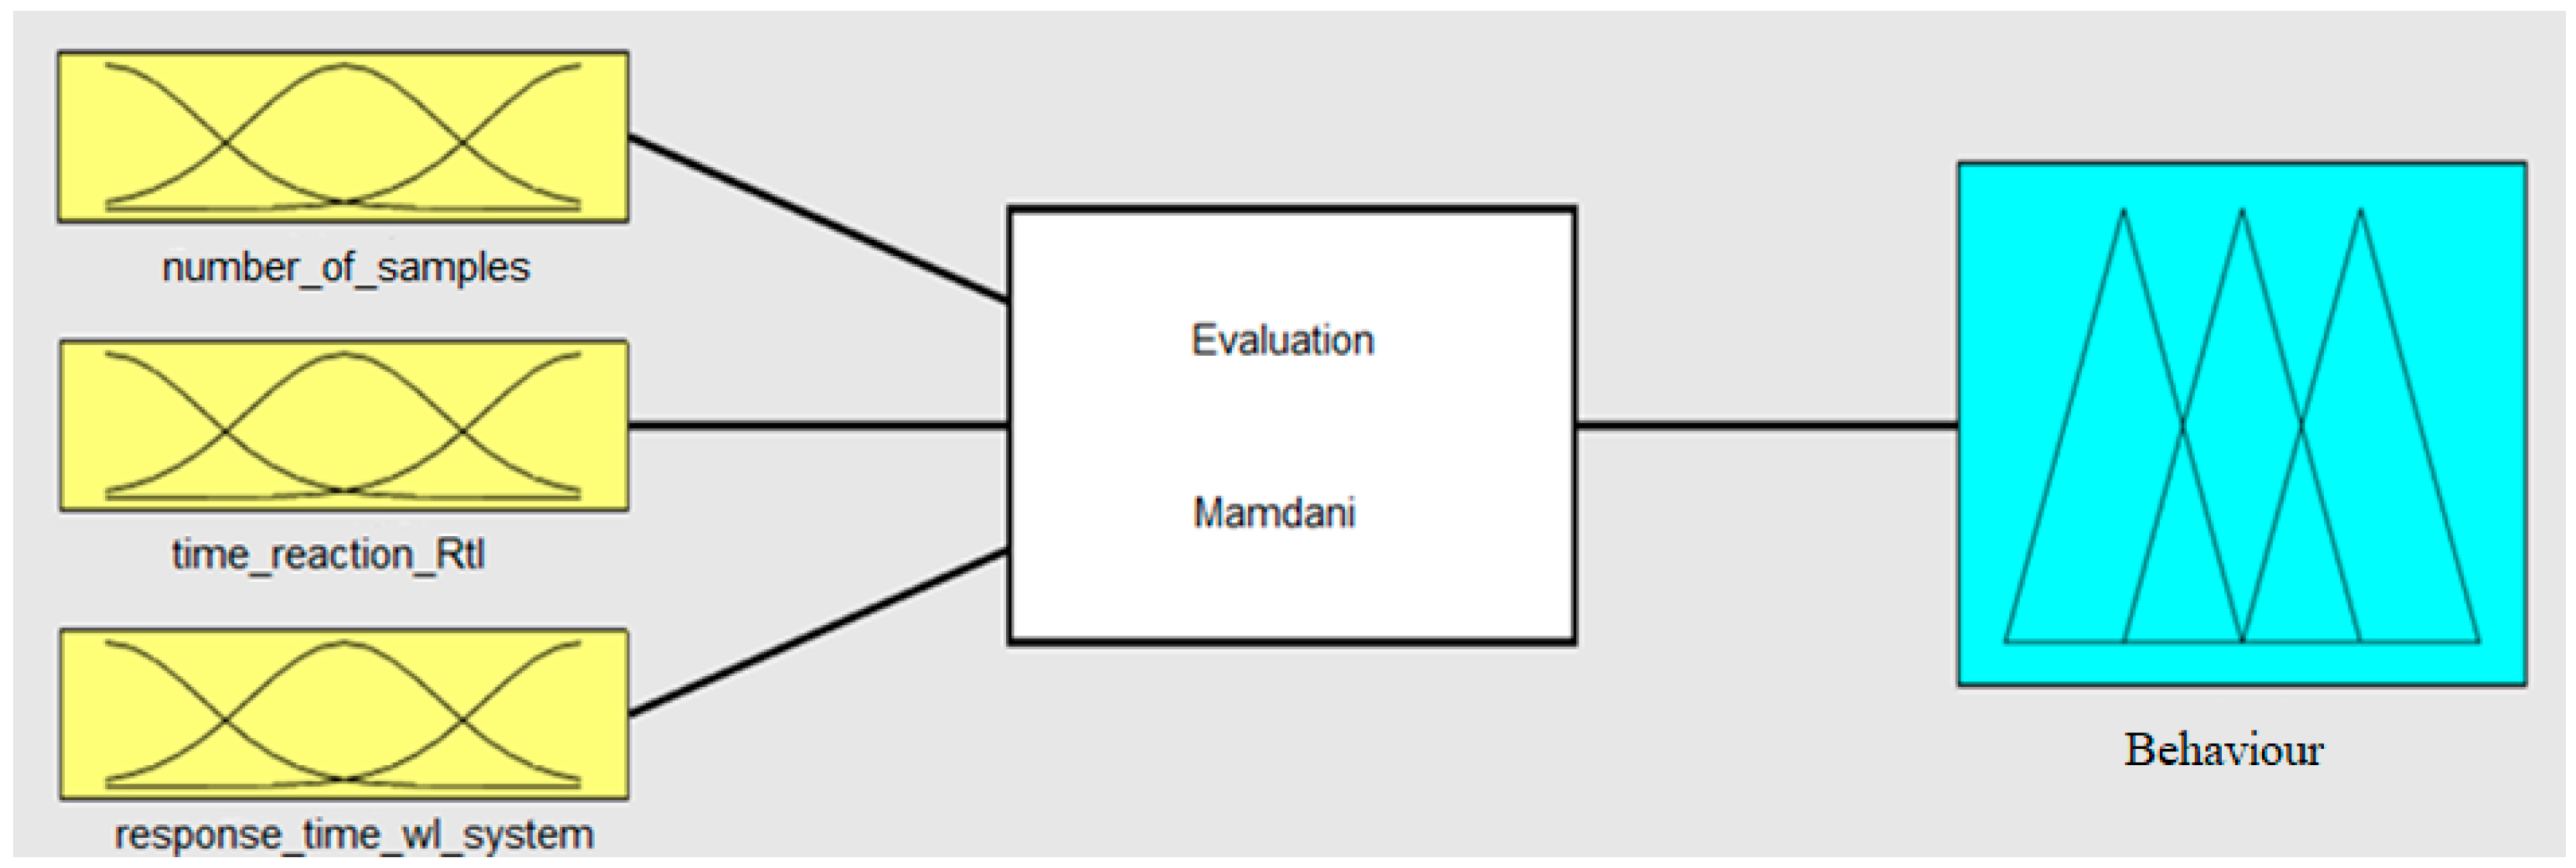
The developed model has 3 inputs and one output.
Figure 4 shows the view of the developed model.
The inputs show the total number of attempts to turn on the system in the test scenario, the response time to the request to take control, and the total response time from the message to the full surrender of control (taking the legs off the pedals and hands off the steering wheel).
Affiliation functions are specified for both all inputs and outputs of the controller. The curve parameters for each parameter were determined on the basis of the results of experimental tests carried out with the use of high-end driving simulators.
To describe the function of belonging to each of the inputs, the function y = gauss2mf (x,params), which returns fuzzy affiliation values calculated using a combination of two computed Gaussian affiliation functions. Each Gaussian function defines the shape of one side of the belonging function and is defined by
where
σ—standard deviation
c—average
For example, for the number_of_samples input, three functions of affiliation have been defined: exemplary, permissible, and too large. An exemplary number of trials meant that the subject successfully turned on the system on the first try, which means that it coped with the task perfectly. The acceptable number means that the subject needed more attempts but coped with the task. Too many attempts meant that the subject did not know how to behave after turning on the system and unknowingly turned it off the system, so he had to start it repeatedly.
Output behavior determines the evaluation of driver behavior in a research scenario. For the output, three functions of belonging were defined: unacceptable, acceptable, and very good. Unacceptable behavior meant that the driver did not have the knowledge and skills to use the system efficiently and safely (“too_long” on
Figure 5). The acceptable level meant that the driver did not pose a threat to other road users, but required additional time for training and polishing skills (“allowed” on
Figure 5). A very good level meant that the driver coped very well with the tasks and was able to use the system in a safe way for himself and other road users (“short” on
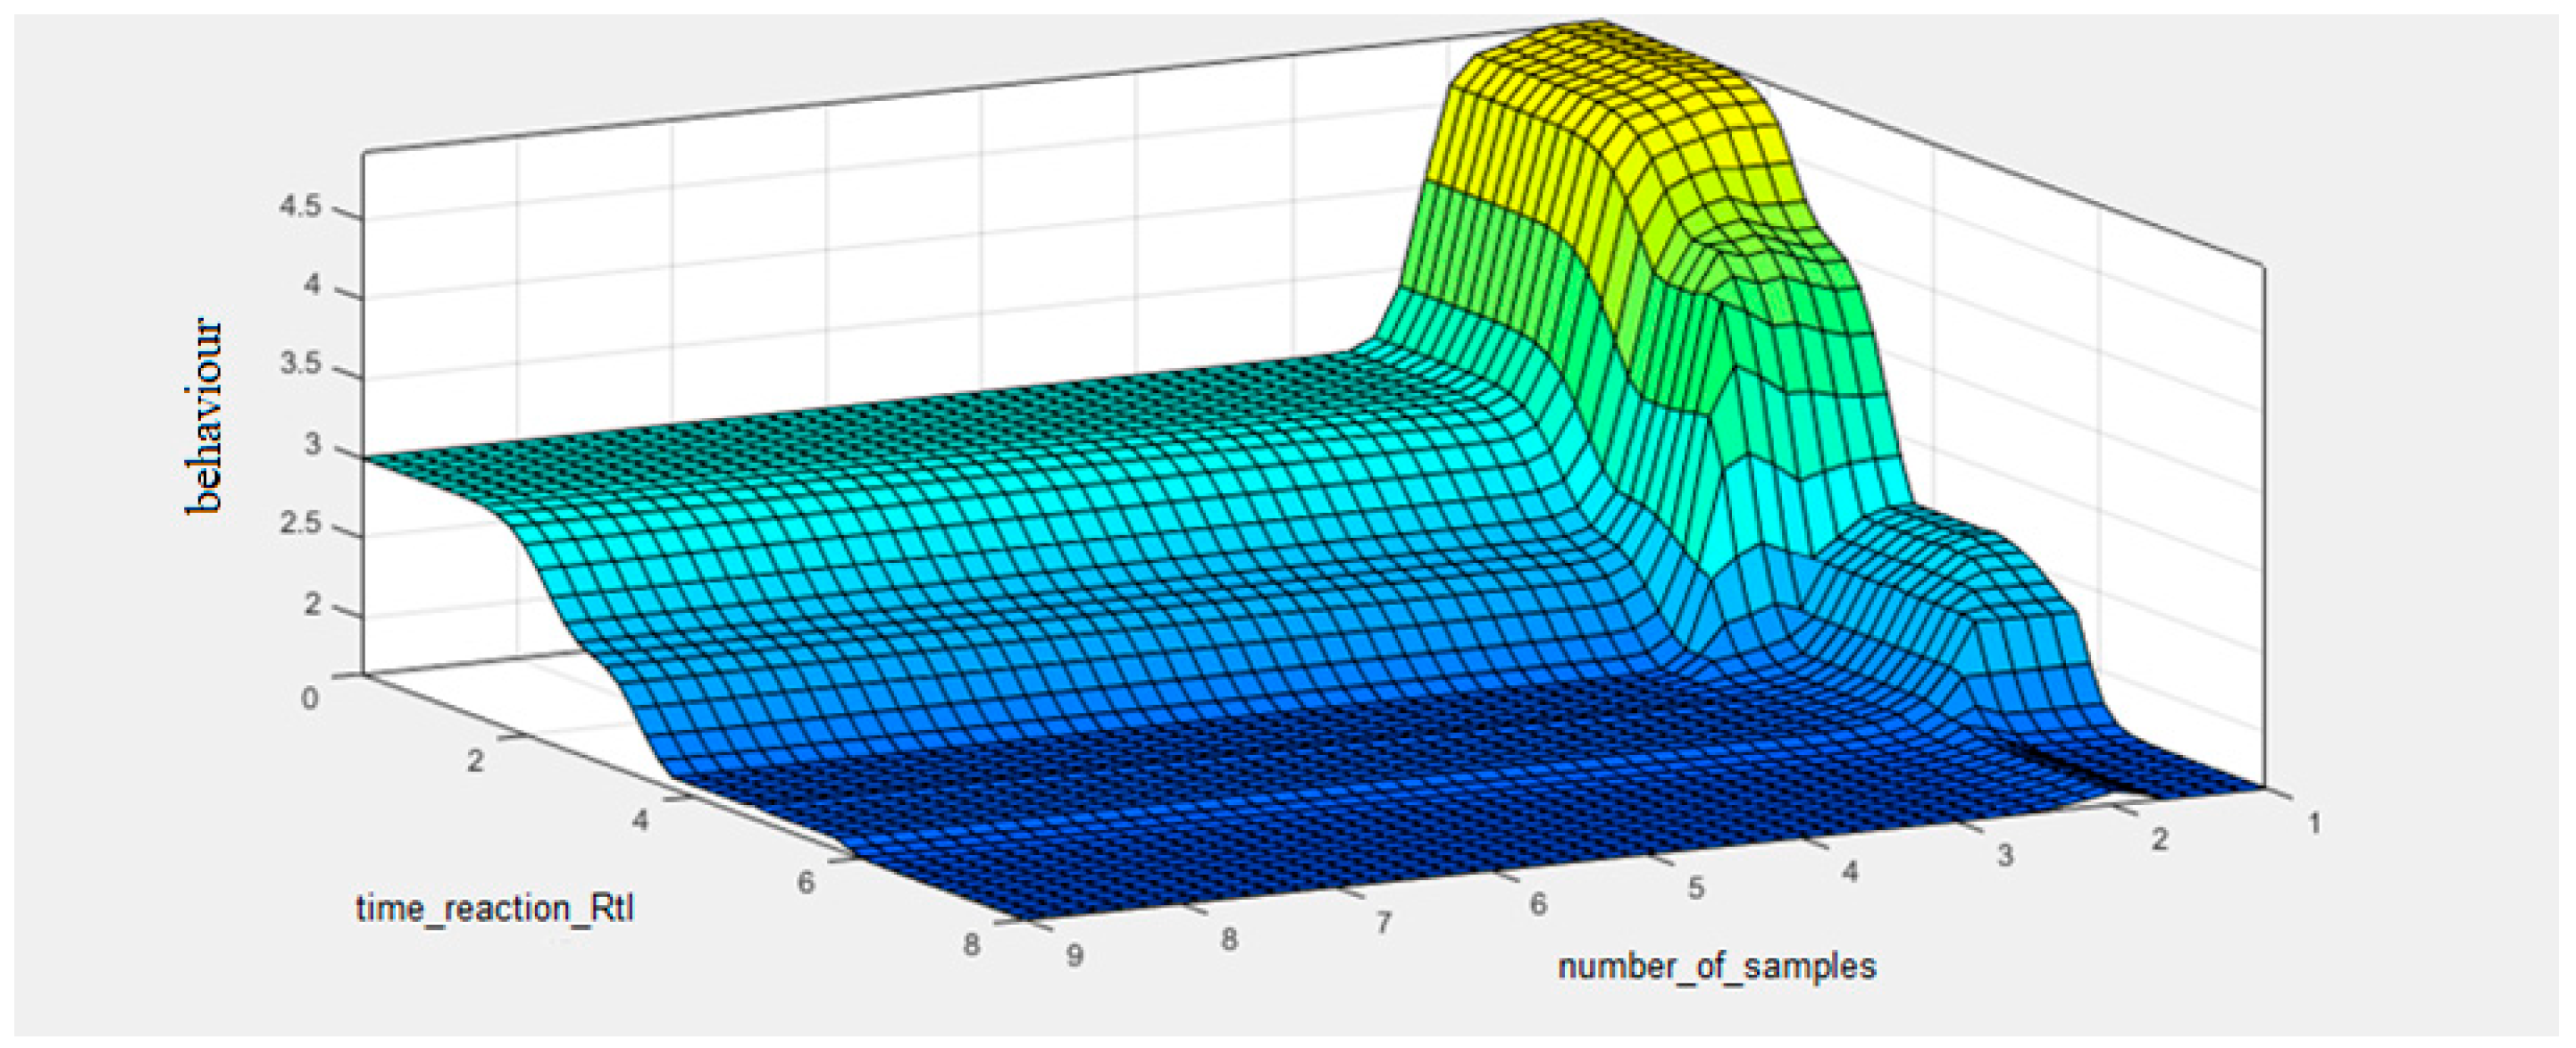
Figure 5). The function of the dependence of the output on the time_reaction_RtI inputs and the number of attempts is shown in
Figure 6.
6. Results
To rigorously assess the differences between the three training modalities (practical, e-learning, manual), non-parametric statistical tests were employed, as the data for some variables were not normally distributed. Specifically, the Kruskal–Wallis H test was used to compare the group medians for key performance indicators.
The analysis revealed a statistically significant difference in the model-generated performance scores across the training groups (H(2) = 7.85, p = 0.02). Post hoc tests using Dunn’s procedure with Bonferroni correction showed that the practical training group (Mean Rank = 31.5) performed significantly better than both the e-learning group (Mean Rank = 21.8, p = 0.041) and the manual instruction group (Mean Rank = 20.1, p = 0.015).
Furthermore, a significant difference was observed in the number of system activation attempts (H(2) = 8.27, p = 0.016), where the practical group required fewer attempts than the manual instruction group (p = 0.016) and the e-learning group (p = 0.010). These results provide robust, quantitative evidence that the training method has a direct and significant impact on driver competence.
Table 1 and
Table 2 compare the results of the model for practical training broken down by the age of the respondents. The ‘Model Output Score’ column in
Table 1 and
Table 2 presents the continuous numerical output generated by the fuzzy logic model for each participant. This score is the final, defuzzified value, which is subsequently interpreted into one of three performance classes: ‘unacceptable’ (score ≤ 2.7), ‘acceptable’ (2.7 < score ≤ 3.7), or ‘very good’ (score > 3.7). Presenting the raw numerical score, rather than the categorical label, allows for a more granular and detailed statistical comparison of performance between the groups.
Table 1 and
Table 2 illustrate the ratings of the respondents who have undergone practical training. The results indicate that, regardless of age, this form of training was highly effective. As many as 81% of the respondents achieved acceptable and very good grades. None of these people posed a threat to other road users. The behavior of just one person in the 25–39 age group was judged unacceptable. In the group of people aged 40–65, there were two people. These subjects were not able to use the system safely on their own.
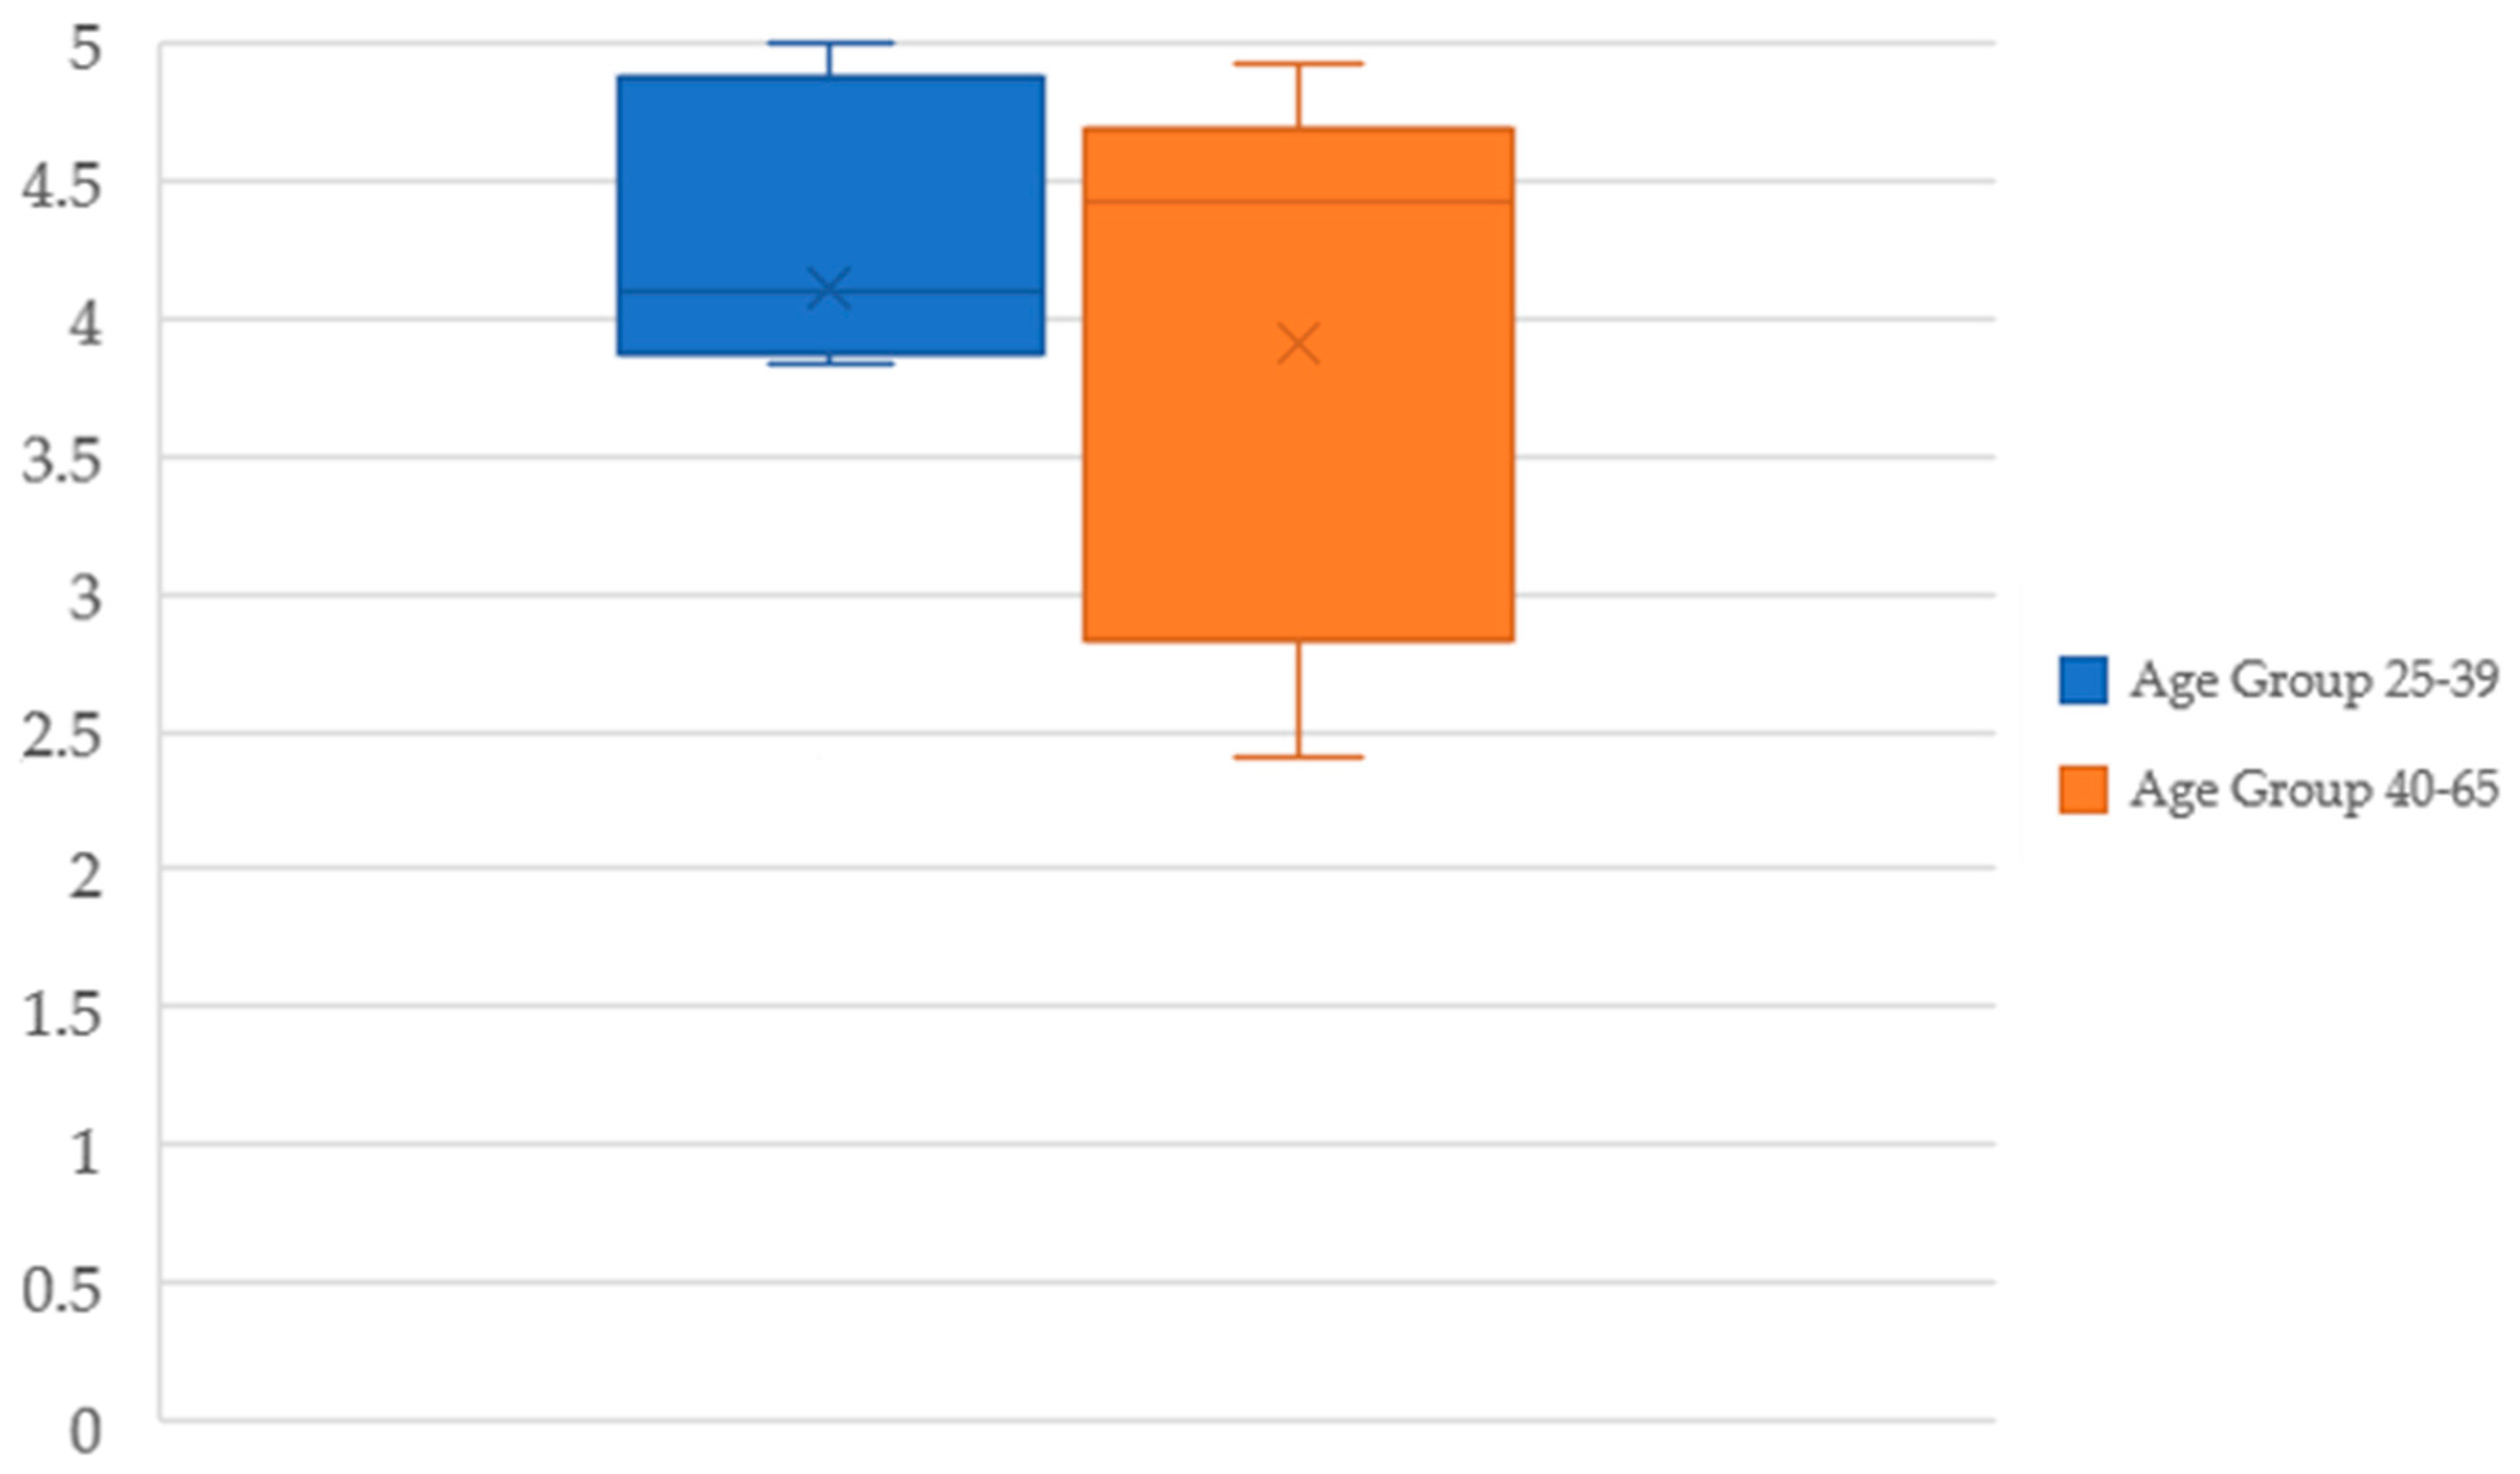
A descriptive statistical analysis was conducted to compare the performance outcomes of the practical training between the two age groups (25–39 and 40–65). Key metrics, including measures of central tendency and variability, were calculated to identify any age-related performance trends.
The results indicate that while the mean scores were comparable between the younger (M = 4.11, SD = 0.88) and older (M = 3.91, SD = 0.92) cohorts, the median scores suggest a different trend. The older group achieved a higher median score (Mdn = 4.42) compared to the younger group (Mdn = 4.07), indicating that the typical performance of an older driver who successfully completed the training was very high. This is further supported by the narrower performance range (Max–Min = 2.51) in the older group compared to the younger group (2.63), despite slightly higher standard deviation.
Visual analysis using a box plot (
Figure 7) confirms this observation, showing that the interquartile range for the 40–65 age group is positioned slightly higher than for the 25–39 group. While the presence of lower-scoring individuals in both groups prevents a definitive conclusion of superior performance for either cohort, the data strongly suggest that the practical training was effective in enabling participants from both age groups to achieve a high level of proficiency. In the next step, the results of the assessment of drivers’ behavior were compared with the subjective assessment assigned to each person by the trainer, as well as the ratings awarded by the respondents themselves.
When analyzing subjective assessments, it should be noted that the respondents assessed their skills very similarly to the trainers. Only one person rated their skills significantly higher than the coach did. Its rating, on the other hand, was consistent with the rating given by the model. When comparing the ratings given by trainers to the ratings given by the model, it should be noted that in 6 out of 16 cases, the difference between the ratings assigned by the trainer and the model was greater than 1. Only one person was rated much lower than the model by the trainer.
To investigate the reasons for the discrepancies, comments left by coaches were analyzed. Unfortunately, in most of these cases, they confirmed that the subjective assessment was exaggerated. In addition, the comments suggested that the overall actions and behavior of the driver often influenced the rating, even though it was supposed to concern only the operation of the system. In the example mentioned above, the much lower score given by the trainer was justified by the fact that the first time the tested person did not take his hands off the handlebars and legs off the pedals. This analysis confirmed that subjective assessments were often influenced by factors beyond the defined parameters, such as the perceived overall progress of the driver during the session. Results of comparison are shown in the
Table 3.
Model Refinement for Discrepancy Analysis
This finding that trainers factored ‘visible progress’ into their scores necessitated a further analytical step. To quantitatively test this observation and better understand the source of the discrepancies, a second iteration of the model was subsequently developed. This refined model was specifically designed to evaluate performance in discrete scenarios by analyzing the parameters from the first and third hazard situations separately. The primary modification was to the number_of_samples input, which was adapted to reflect the attempt count for a single situation, rather than an aggregate sum. The developed model, therefore, has three inputs, the same as in the case of the model evaluating all research situations:
number_of_samples—the number of attempts to turn on the system in a given research situation;
time_reaction_RtI—response time to a request to take control in a given research situation;
response_time_wl_system—the total response time from message to taking your legs off the pedals and hands off the steering wheel (full surrender of control) (in seconds) in a given test situation;
Single output: A behavior that determines the evaluation of driver behavior in a scenario;
Figure 8 shows the view of the developed model. Changes were made only for the entry of number_of_samples.
Similarly to the model for assessing the general behavior of the driver, the assessment of individual situations for the input of the number of samples defines three functions of affiliation: exemplary, permissible, and excessive. An exemplary number of trials meant that the subject successfully switched on the system on the first try, which shows that it coped with the task perfectly. The acceptable number meant that the subject needed more attempts, but coped with the task. Too many attempts meant that the subject did not know how to behave after turning on the system and unknowingly turned off the system, so he had to start it repeatedly, which posed a danger on the road.
The affiliation functions for the other inputs have not changed, as well as the output.
The functions of the output dependence on the individual inputs of the controller are shown in
Figure 9.
The results presented in
Figure 10 illustrate the average increase in the assessment of people who underwent practical training by comparing the assessment in the third and first research samples. For the third attempt, the average score generated by the model was as high as 4.88, which proves that the drivers coped very well with the task in the last test. From the results presented in
Table 4, it can be concluded that the differences between the trainer’s assessment and the model’s assessment in the case of practical training in six out of nine cases were smaller than the difference in the result for all research situations. In addition, for two people, the difference between the trainer’s assessment in the third situation and the model was less than 1, so it should be considered correct. Only in the case of respondent no. 57 were there significant differences in the assessment of the model and the trainer. The justification for the lower grade was the following comment from the coach: “The first time you forgot to take your hands off the handlebars and your legs off the pedals.” This factor had an impact on the reduction in the rating given by the coach. According to the observations, coaches were more likely to give opinions based on the progress they observed. It also happened that some of these awarded grades did not reflect the partial grades obtained by the respondent. This illustrates the advantage of objective assessments over the subjective assessment of the coach. Despite the fact that individual aspects of riding were evaluated, the ratings issued by the trainers did not always seem to reflect the actual skills of the respondents.
7. Discussion
The empirical findings of this study establish that the training modality is a critical determinant of driver competency with ADAS. The superior performance of the practical training group, validated by statistical analysis, corroborates the pedagogical principle that hands-on, experiential learning is indispensable for mastering complex psychomotor skills in a simulated environment [
21,
26]. Conversely, the significantly poorer outcomes of the manual instruction group, particularly among older drivers, suggest that passive consumption of technical information is an inadequate method for ensuring the safe and effective operation of these systems.
A primary contribution of this research is the development and validation of an objective, data-driven model that serves as a reliable alternative to purely subjective assessments. While trainers provide invaluable observational context, their evaluations can be influenced by holistic impressions or perceived effort, leading to inconsistencies. Our fuzzy logic model, grounded in quantifiable metrics such as reaction time and activation attempts, offers a standardized and reproducible methodology for evaluation. This objectivity is paramount for both proficiency certification and the identification of specific skill deficits requiring remedial training.
While this study focused on establishing the fuzzy logic model, we acknowledge that a comparative analysis with other machine learning approaches, such as Support Vector Machines (SVMs) or decision trees, would be a valuable direction for future research to further validate its relative performance.
It should be emphasized that this paper presents a focused analysis of a single training modality, and its main goal was to validate the new evaluation method within that specific context. The complete study, involving a larger sample of 49 participants across three different training methods, is detailed in our publication, “Evaluation of the Effectiveness of Driver Training in the Use of Advanced Driver Assistance Systems.” Furthermore, the model was validated with an additional cohort of 20 drivers. However, we acknowledge that continuous validation on diverse and larger samples is crucial. To address this, the lead author (M. Pełka) is currently heading a research project to apply this model to a new, larger group of older drivers, which will further strengthen the model’s generalizability.
8. Conclusions
The presented analysis showed the high effectiveness of the developed proprietary model. Basing the performance assessment on objective data results in a high match of the assessment to the actual level of the driver’s skills. The advantage of the method is the reduction in the human factor and issuing more adequate assessments based on real data. Even if clear evaluation criteria are introduced, subjective feelings will always vary slightly depending on the evaluator and their aptitude.
The results presented in the paper show how many factors affect subjective assessment. The ratings given by the trainers often did not depend solely on the ability to operate the system or the response time to a given signal. An additional difficulty was the inability to determine the exact value of reaction time by a coach who was not even equipped with a stopwatch.
However, there are situations that can only be properly interpreted by a human observer. Therefore, the most advantageous method of assessment would be to use a combination of the objective method presented in this study with subjective verification carried out by the trainer. The model can therefore be used as an instrument to improve the evaluation process, provided that the subjective component is governed by precisely defined criteria to ensure reliability and consistency.
However, it should be remembered that in the case of using subjective assessment, even when using the commonly used scale of 1–5, it is necessary to define precise assessment criteria and ensure that each of the assessed persons is subject to the same requirements. The use of a scale containing a detailed description will increase the reliability of the grade.
While primarily focused on training assessment, this study’s findings offer salient implications for Advanced Driver Assistance Systems (ADASs) design. The objective metrics derived from our evaluation model, particularly those related to driver activation attempts (number_of_samples), reaction times to takeover requests (time_reaction_RtI), and full control handover (response_time_wl_system), can directly inform the refinement of Human–Machine Interfaces (HMIs). Such refinements should aim to enhance communication clarity and the seamlessness of control transitions, especially by providing unambiguous system status feedback. Ultimately, these insights can contribute to the development of more intuitive ADAS, fostering safer and more effective human–machine collaboration, and the model itself may serve as a benchmark for future ADAS interface development.


