Article

Comparative Life Cycle Assessment of Solar Thermal, Solar PV, and Biogas Energy Systems: Insights from Case Studies

1
Department of Building, Energy and Material Technology, Faculty of Engineering Science and Technology, UiT The Arctic University of Norway, 8515 Narvik, Norway
2
Department of Mechanical and Industrial Engineering, Indian Institute of Technology Roorkee, Roorkee 247667, India
3
Arctic Experts AS, 8006 Bodø, Norway
4
Department of Electrical Engineering, Indian Institute of Technology Roorkee, Roorkee 247667, India
*
Author to whom correspondence should be addressed.
Appl. Sci. 2025, 15(14), 8082; https://doi.org/10.3390/app15148082
Submission received: 20 June 2025 / Revised: 14 July 2025 / Accepted: 17 July 2025 / Published: 21 July 2025

Abstract

The growing imperative to mitigate climate change and accelerate the shift toward energy sustainability has called for a critical evaluation of heat and electricity generation methods. This article presents a comparative life cycle assessment (LCA) of solar and biogas energy systems on a common basis of 1 kWh of useful energy using SimaPro, the ReCiPe 2016 methodology (both midpoint and endpoint indicators), and cumulative energy demand (CED) analysis. This study is the first to evaluate co-located solar PV, solar thermal compound parabolic concentrator (CPC) and biogas combined heat and power (CHP) systems with in situ data collected under identical climatic and operational conditions. The project costs yield levelized costs of electricity (LCOE) of INR 2.4/kWh for PV, 3.3/kWh for the solar thermal dish and 4.1/kWh for biogas. However, the collaborated findings indicate that neither solar-based systems nor biogas technology uniformly outperform the others; rather, their effectiveness hinges on contextual factors, including resource availability and local policy incentives. These insights will prove critical for policymakers, industry stakeholders, and local communities seeking to develop effective, context-sensitive strategies for sustainable energy deployment, emissions reduction, and robust resource management.

1. Introduction

The transition from traditional fossil fuels to renewable alternatives requires consideration of efficiency, sustainability, and economic feasibility. For centuries, hydrocarbon fuels have been used for transport, lighting, heating, and electricity generation. However, it is widely accepted by the scientific community that emissions from the combustion of these fuels, including CO2, NOX, and SOX, have led to significant environmental degradation [1,2]. This deterioration not only affects the global climate through greenhouse gas (GHG) emissions but also impacts air quality, public health, and ecosystem balance. Consequently, a shift from fossil fuels to renewable sources has become imperative to reduce these harmful effects and mitigate climate change [3].
Despite this necessity, transitioning away from fossil fuels is not straightforward. A careful approach that considers sustainability, efficiency, and affordability is critical when choosing between different energy options. This implies aligning technology choices with regional resource availability (e.g., solar irradiation, biomass feedstock) and broader societal objectives, such as job creation and rural development [4]. Furthermore, economic compromises often arise for both energy providers and end-users, highlighting the complex interplay between market forces, infrastructure readiness, and policy frameworks.
These multi-dimensional considerations for choosing energy supplies are intrinsic to achieving sustainability goals. Importantly, sustainability extends beyond the prevention of environmental pollution; it also includes cost–benefit analyses, process efficiency, and natural resource management. The deployment of any energy technology ultimately depends on political decisions, country-specific energy policies, and public acceptance [5]. Thus, holistic analysis is essential to inform decisions and reconcile environmental and economic perspectives.
In the realm of renewable resources, solar energy stands out as the primary source that indirectly drives most other forms of sustainable energy such as wind, wave, and even the ancient biomass from which fossil fuels originate. It can be harnessed directly as heat or converted to electricity via photovoltaic (PV) cells [6]. Although solar technologies are now highly advanced, intermittency remains a challenge, demanding energy storage solutions and robust grid integration strategies [1,4]. For instance, during periods of excess solar production, energy can be stored in various forms, such as hydrogen or via thermal storage methods, to compensate for low production periods [7,8] and ensure a steady power supply even when solar generation is inadequate. Effective integration into the energy grid requires management strategies that maximize the utilization of available renewable resources while mitigating the environmental impacts associated with fossil fuels [9]. Moreover, innovative control mechanisms and forecasting technologies are essential to optimize power distribution and enhance the resilience of solar systems against unpredictable conditions [10].
Another promising avenue is biogas, which offers the added benefit of waste minimization transforming agricultural, municipal, or industrial waste into a usable fuel. Biogas can be employed as a thermal energy source for heating or used in gas engines for electricity [11]. Furthermore, it may be upgraded to purified biomethane or hydrogen, expanding its applications to fuel cells and transportation fuels [12]. Given its versatility, hybridizing solar and biogas systems holds considerable potential, addressing the intermittency of solar power while improving startup reliability and peak-load management [13]. The incorporation of solar systems with biogas can optimize energy delivery by ensuring reliability during peak demands and smooth transitions during periods of low solar irradiance. Additionally, utilizing biogas in combined heat and power (CHP) systems enhances overall energy efficiency, allowing for the simultaneous generation of electricity and thermal energy [14]. This synergy not only fosters greater energy independence but also supports the transition toward a sustainable energy future by reducing reliance on fossil fuels and improving the economic viability of renewable energy projects. This could further be beneficial in rural development goals by fostering local employment and waste utilization.
Taking this into consideration, the present paper covers a comprehensive analysis of selected energy generation methods to highlight their respective strengths and weaknesses. Most life cycle studies examine a single technology in isolation (e.g., rooftop PV arrays, concentrating solar dishes, or community biogas digesters. This study sets the three systems side by side and applies identical system boundaries. Specifically, it assesses the demand, environmental impacts, and economic implications of solar and biogas technologies to gather critical information spanning economy, environment, and efficiency. This holistic understanding can guide policymakers, industry stakeholders, and communities in making informed decisions for more sustainable energy practices. Such decisions are pivotal not only for meeting immediate energy needs but also for safeguarding the planet for future generations. Although the primary data come from India (humid subtropical), the LCA models use globally referenced unit-processes from ecoinvent. Therefore, only the operational-phase inputs (solar irradiance, feedstock logistics) are site-specific, while upstream manufacturing impacts remain globally averaged. This analysis aspires to support evidence-based strategies in our collective stride toward a low-carbon, resilient energy.

2. Methodology

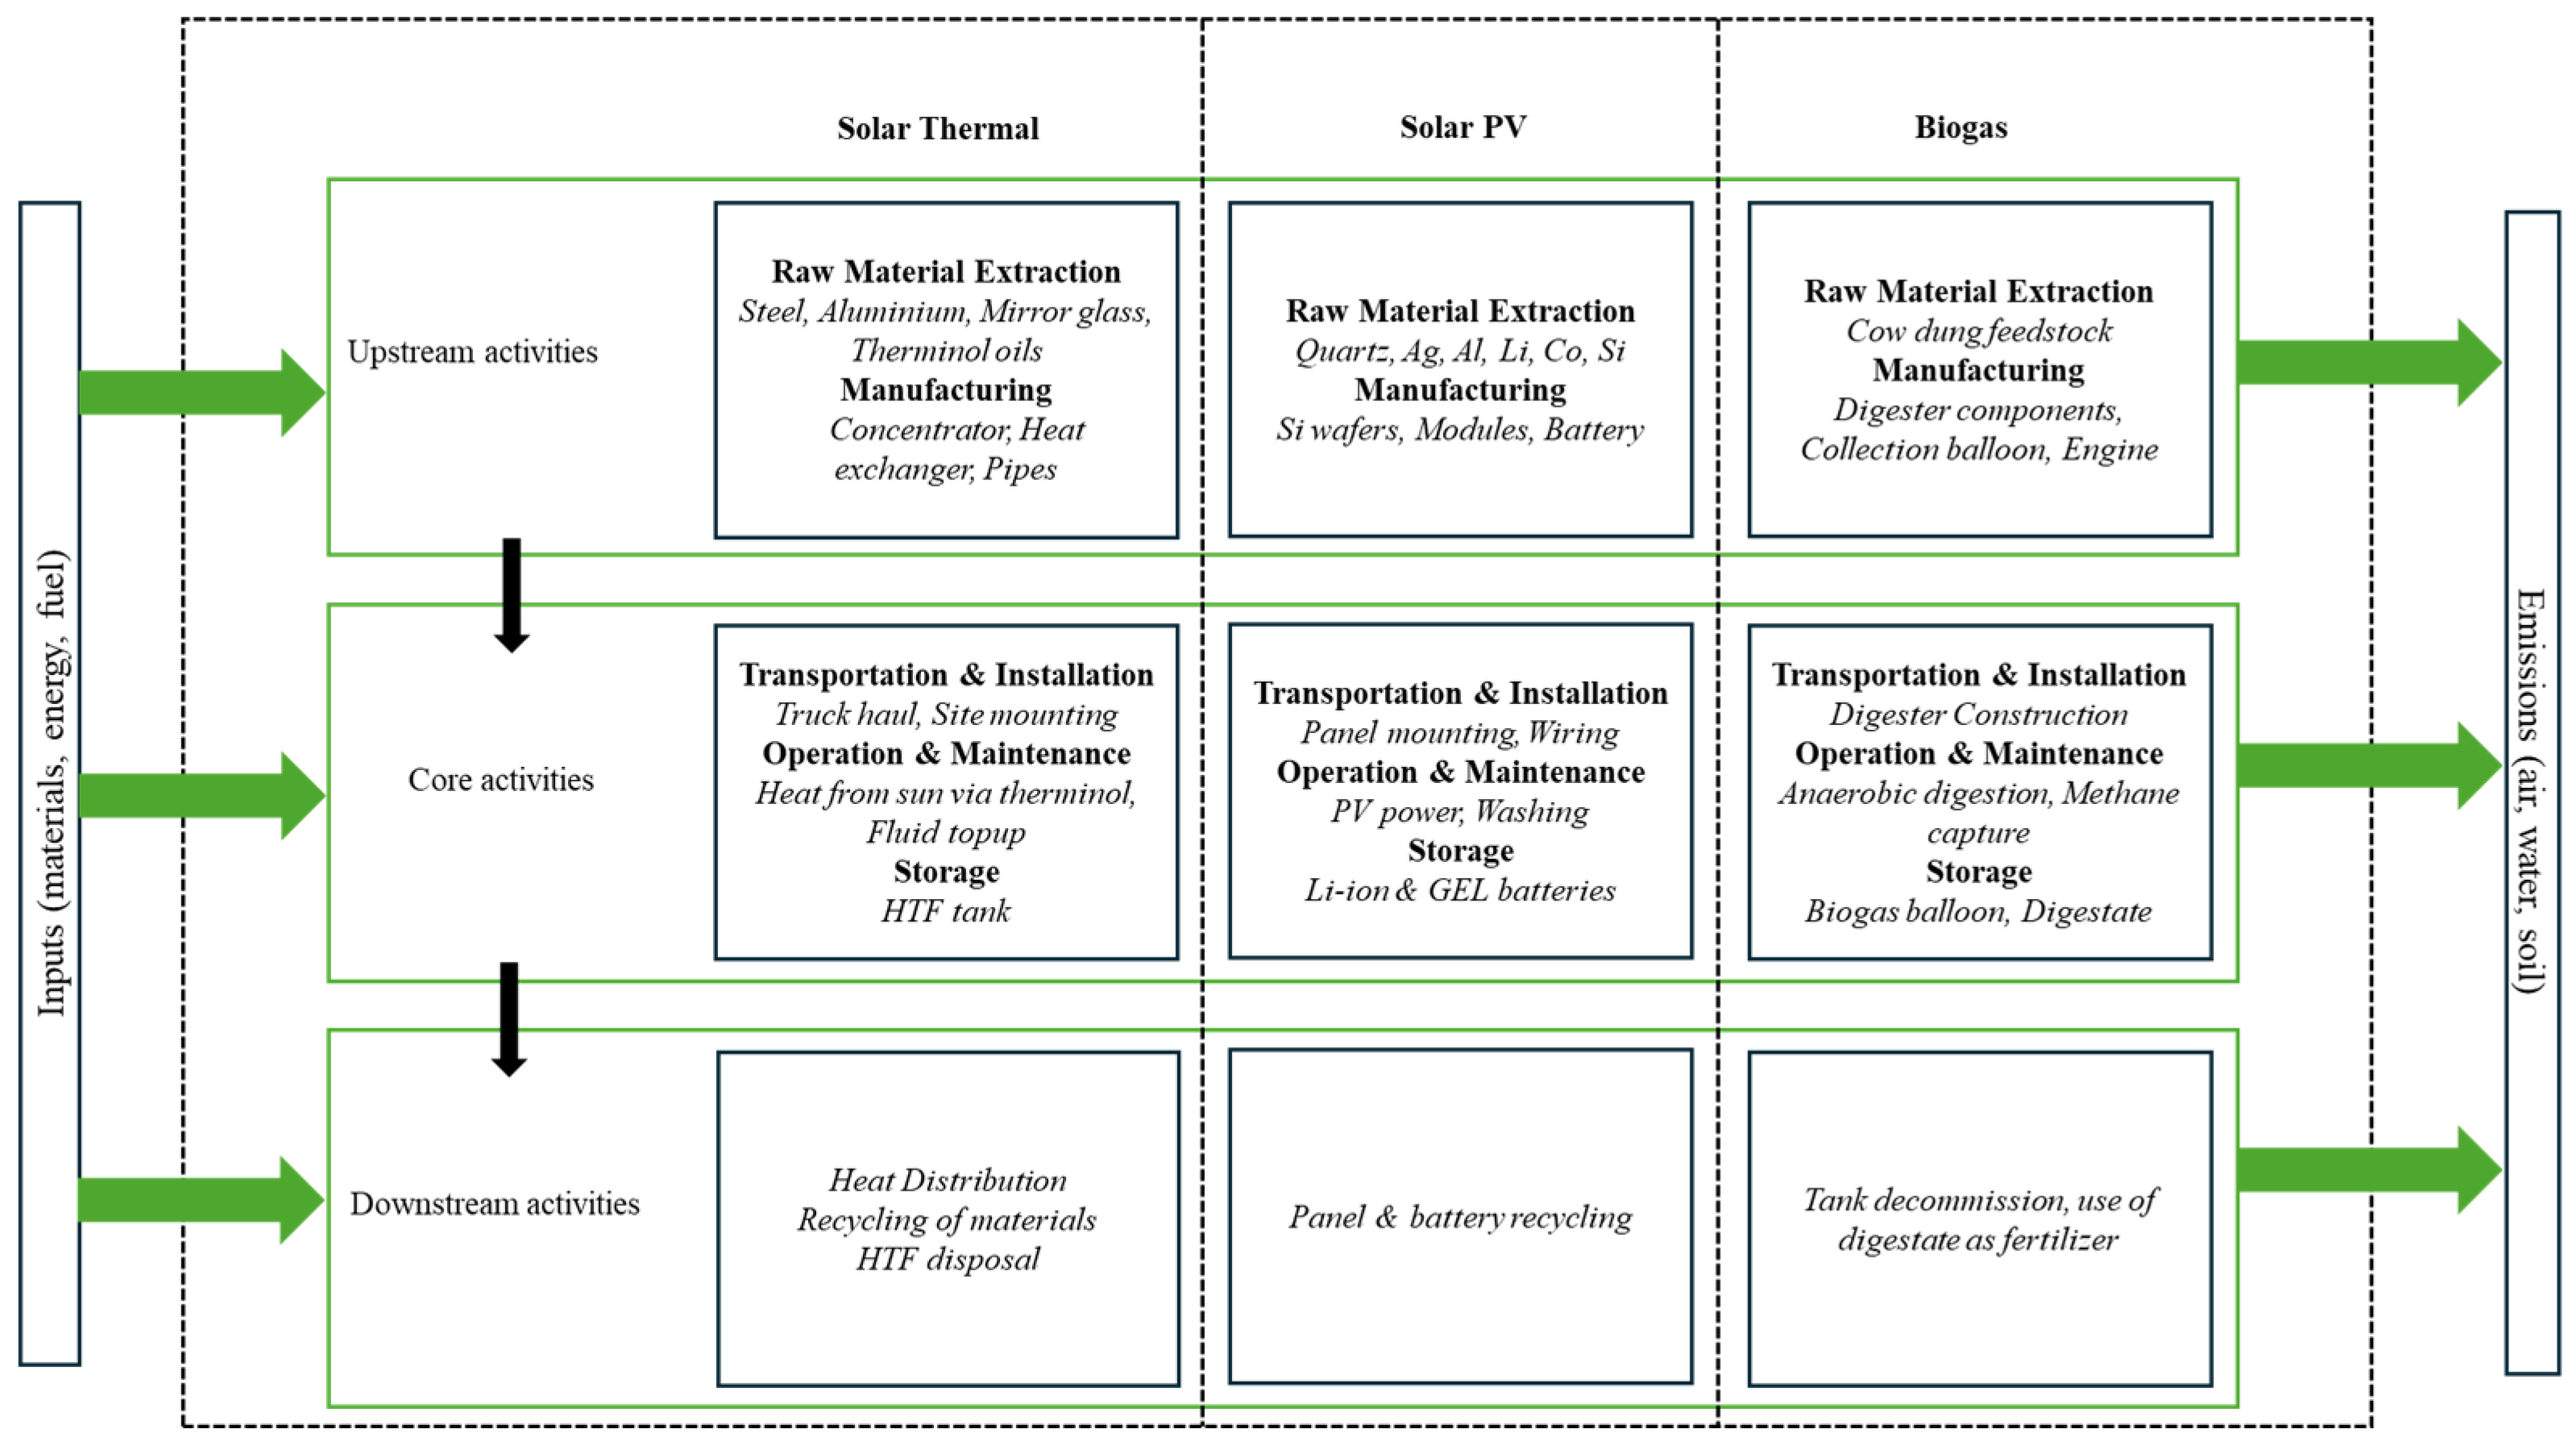
2.1. System Boundaries and Modeling

This study adopts a cradle-to-grave perspective to evaluate both solar (thermal and photovoltaic) and biogas energy systems using SimaPro software. The analysis encompasses raw material extraction, component manufacturing, operational phases, and end-of-life disposal (Figure 1).
The functional unit for every scenario is 1 kWh (3.6 MJ) of useful energy delivered at the point of use. By carefully delimiting the boundaries, the models capture energy and material flows from upstream processes (e.g., mining and refining raw materials) through downstream activities (e.g., equipment decommissioning and waste management). This approach enables a comprehensive view of the cumulative environmental impacts and resource requirements across the entire lifecycle of each energy technology. End-of-life collection, recycling and final disposal are included in every inventory; their contribution to the total impact is below 5% in all cases and therefore not discernible in the stacked bars.

2.2. Data Sources

Primary data were sourced from direct measurements and equipment specifications at installations in the Indian Institute of Technology (IIT) Roorkee and Dayalbagh Educational Institute (DEI) Agra, capturing site-specific details such as regional solar irradiance, feedstock availability, and actual operating conditions. These datasets were supplemented with secondary information from peer-reviewed literature and standardized LCA databases, including Ecoinvent, to fill any knowledge gaps and ensure comprehensive modeling of upstream and downstream processes. Where possible, all data were validated through cross-referencing multiple sources and consulting technical experts, thereby improving the reliability of the life cycle inventory used in SimaPro.
Table 1 summarizes the key LCA parameters including component lifetimes, conversion efficiencies, emission factors, and allocation methods along with associated uncertainty bounds and source types.

2.3. LCA Framework

All environmental impact calculations employ the ReCiPe 2016 impact assessment method, chosen for its dual emphasis on midpoint and endpoint indicators, which capture both detailed process-level environmental stressors and broader consequences for human health, ecosystem quality, and resource scarcity. ReCiPe 2016 was selected because (i) Indian normalization factors are available, (ii) its midpoint-to-endpoint linkage enables damage-oriented policy interpretation, and (iii) it is the method recommended by the UNEP/SETAC Life Cycle Initiative for emerging-economy LCAs. Following ISO 14044, only indicators that are materially influenced by at least one of the three energy systems reported in the results section were retained. The detailed indicators have been given in Appendix A.
Together, these 18 mid-point indicators cover the three protection areas, i.e., human health, ecosystem quality, and resource availability recommended by ISO 14044, while avoiding superfluous or duplicate metrics. Endpoint damage categories (Human Health, Ecosystems, Resource Scarcity) are also reported to aid interpretation.
By relying on ReCiPe 2016, this study offers a balanced, internationally recognized framework that clarifies the trade-offs among different impact categories, thus enabling robust comparisons and facilitating an understanding of how each energy technology performs relative to multiple sustainability metrics. All midpoint and endpoint impacts were computed as
Impact k = i = 1 n ( A i   ×   CF i , k )
where Ai is the life cycle inventory flow per functional unit (1 kWh of useful energy), CFi,k is the corresponding ReCiPe 2016 characterization factor for impact category k (midpoint or endpoint) [23].

2.4. Cumulative Energy Demand (CED)

To complement the LCA results, a CED analysis quantifies the total energy inputs, both renewable and non-renewable, across each system’s life cycle. Drawing on methodologies published by Ecoinvent and refined by PRé Consultants, CED breaks down energy consumption by source (e.g., fossil, nuclear, biomass) and highlights hotspots where energy usage is most intensive [24,25]. In turn, this illuminates areas where efficiency improvements, such as material selection or process optimization, may substantially reduce overall energy consumption. By combining the CED perspective with environmental indicators from ReCiPe 2016 [26], the study clarifies not only the ecological footprint but also the energy efficiency profile of each system.

2.5. End-of-Life Modeling

Three practical end-of-life (EoL) routes [landfill baseline (BAS), open-loop recycling (OLR) and closed-loop recycling (CLR)] were evaluated for PV modules and Li-ion batteries.
(i) BAS—disposal to an engineered Class-II landfill.
(ii) OLR—mechanical/thermal delamination with recovery of glass and aluminum.
(iii) CLR—hydrometallurgical recycling that also recovers silver paste (PV) and Li, Ni, Co salts (battery).
Open loop glass and aluminum recovery is already practiced at the RenewSys PV glass facility in Gujarat (5000 t/yr, commissioned in 2023) [27]. Closed-loop hydrometallurgical recycling of Li-ion cells is technically feasible as Attero CleanTech’s Karnataka plant reached 15,000 t/yr capacity in 2024 [28], and India’s draft E-Waste Rules [29] target a 30% panel-collection rate by 2026.

3. Case Studies

The sites chosen from this study have been developed under DEVISE project (Different Energy Vector Integration for Storage of Energy- Funded by ERA-Net Smart Energy Systems). The data obtained was our own and the objective of the installation of these integrated systems has been to study the integration of different energy vectors for optimal operation utilization of energy from a variety of sources such as solar thermal, solar PV, and biogas. Designed as a demonstration of integrating thermal energy storage. This site was chosen due to its ample solar irradiance and strong institutional support for renewable energy research.

3.1. Overview of Installation Sites

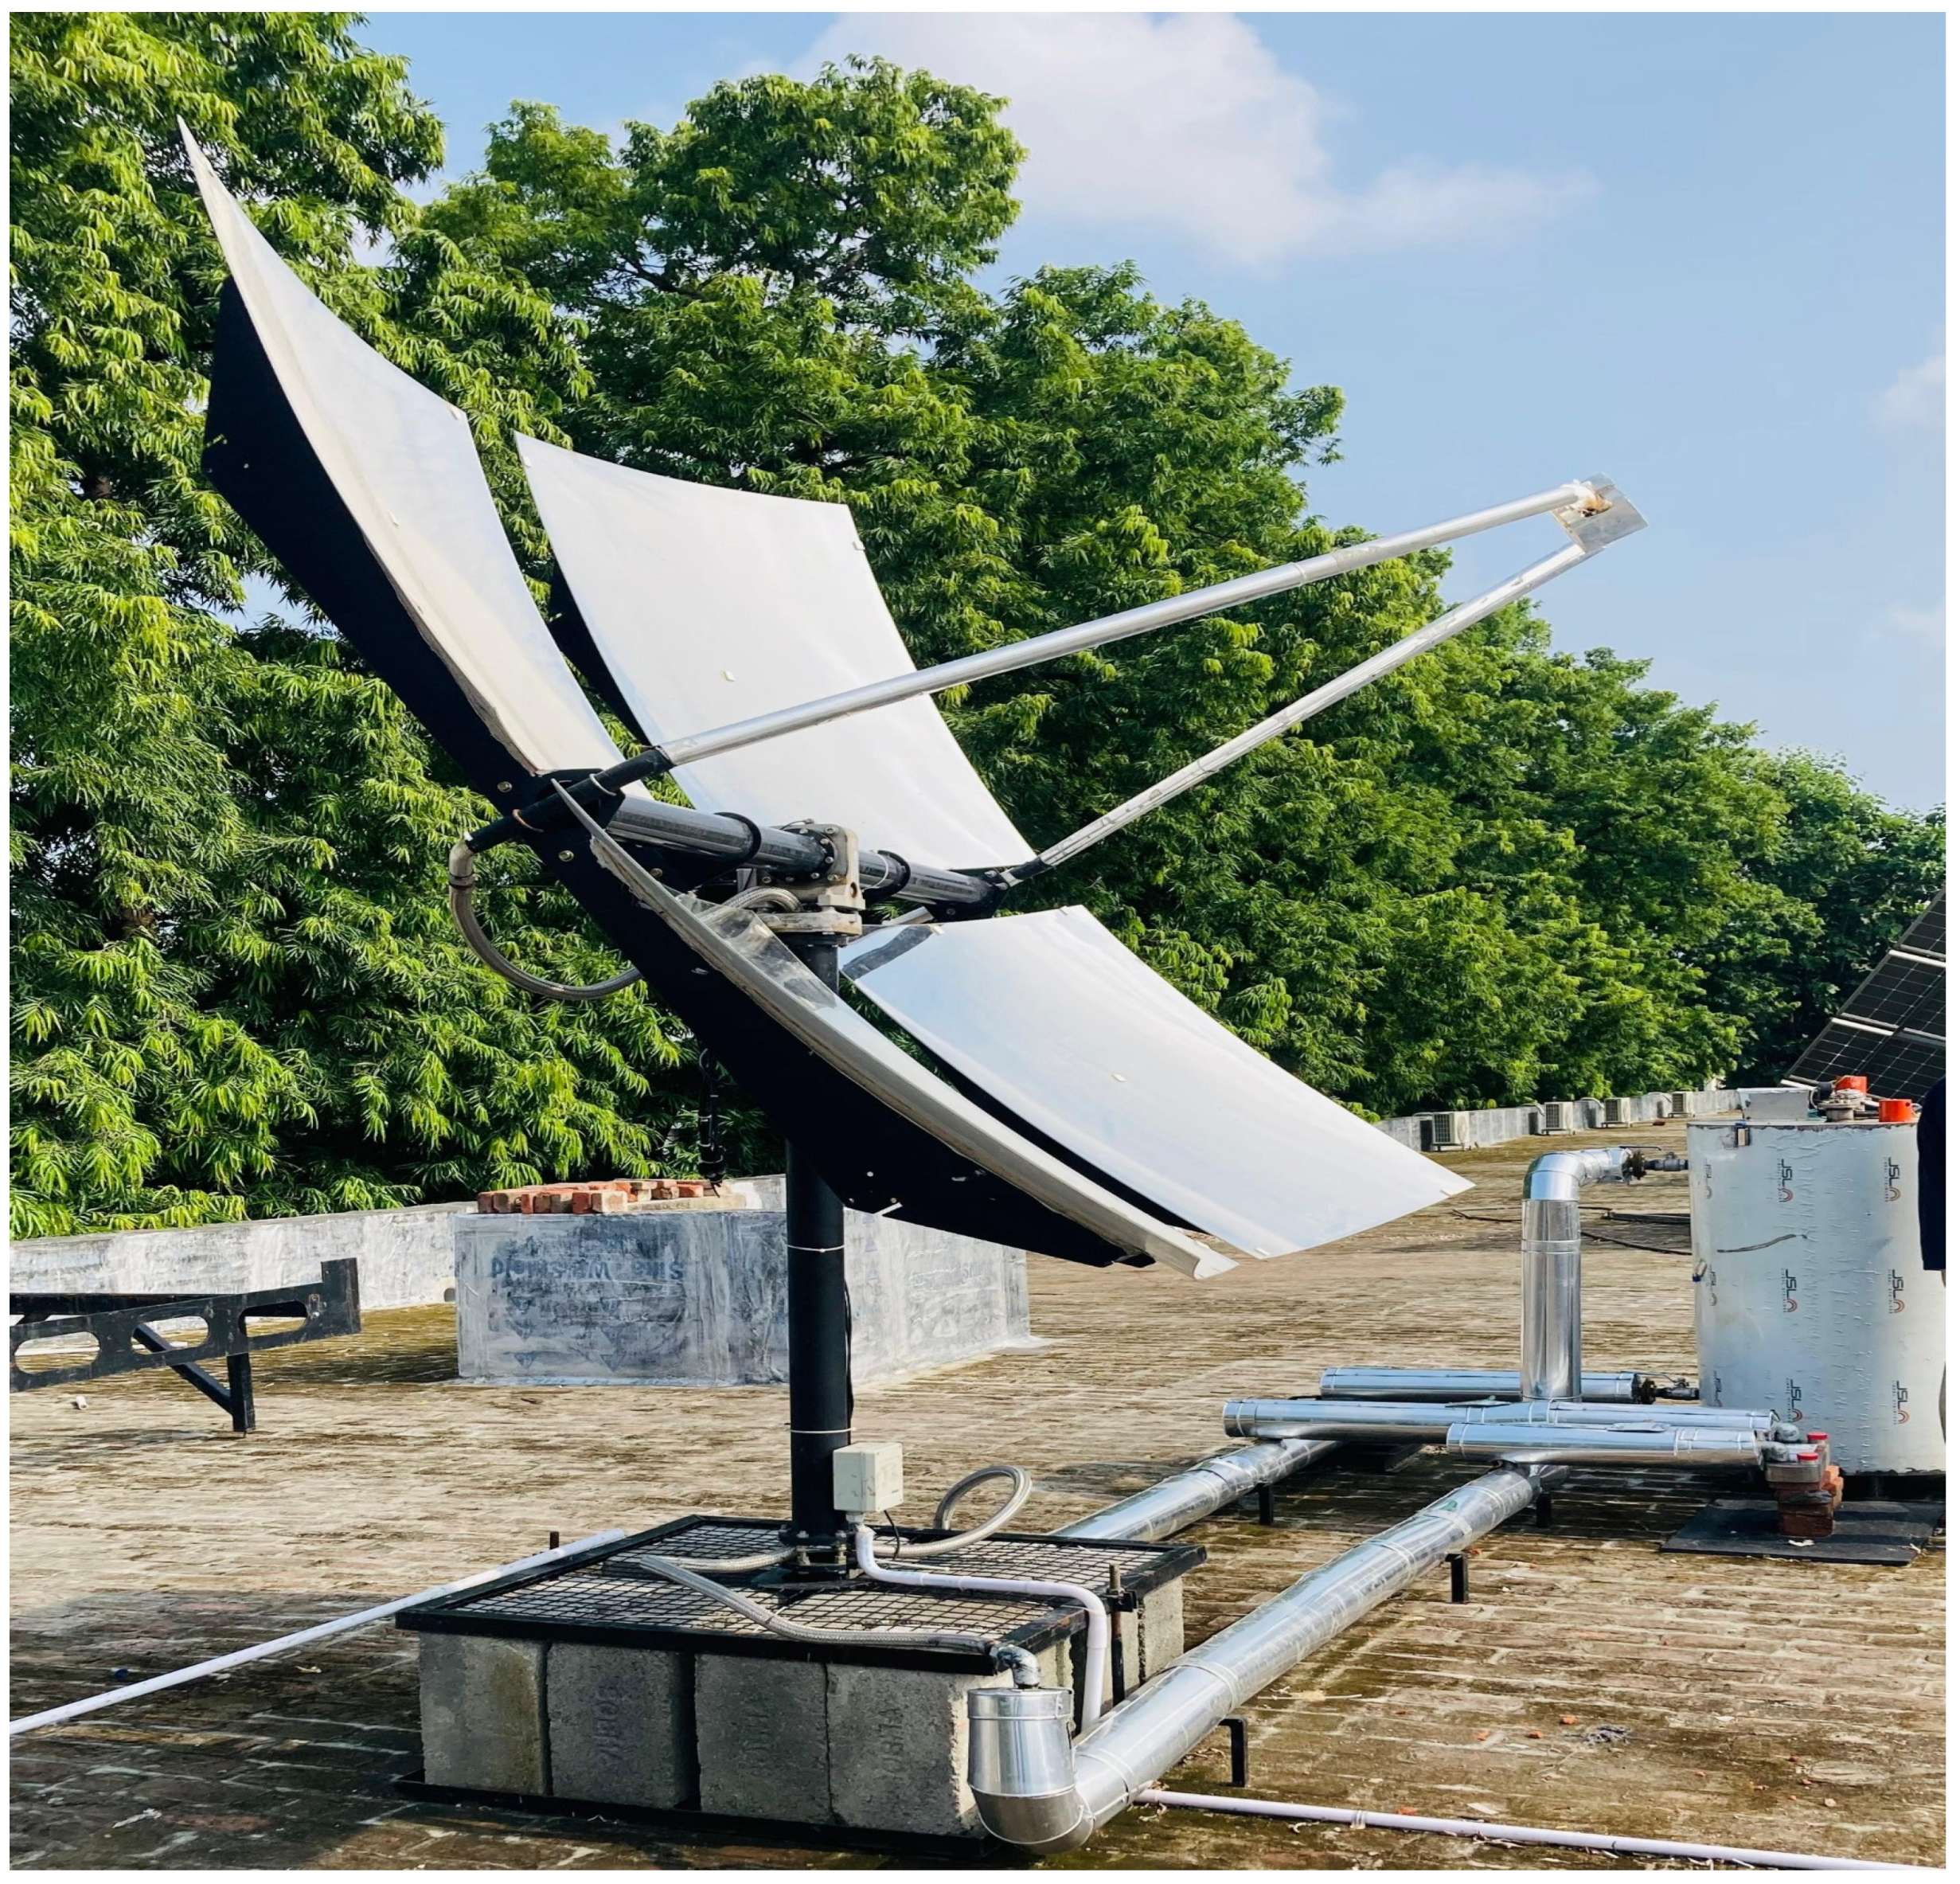
3.1.1. Solar Thermal System at IIT Roorkee

The solar thermal system (Figure 2) consists of a parabolic solar concentrator, a heat exchanger, and thermal fluid, which is innovatively designed to harness thermal energy during daylight hours and store it for heating purposes when needed.

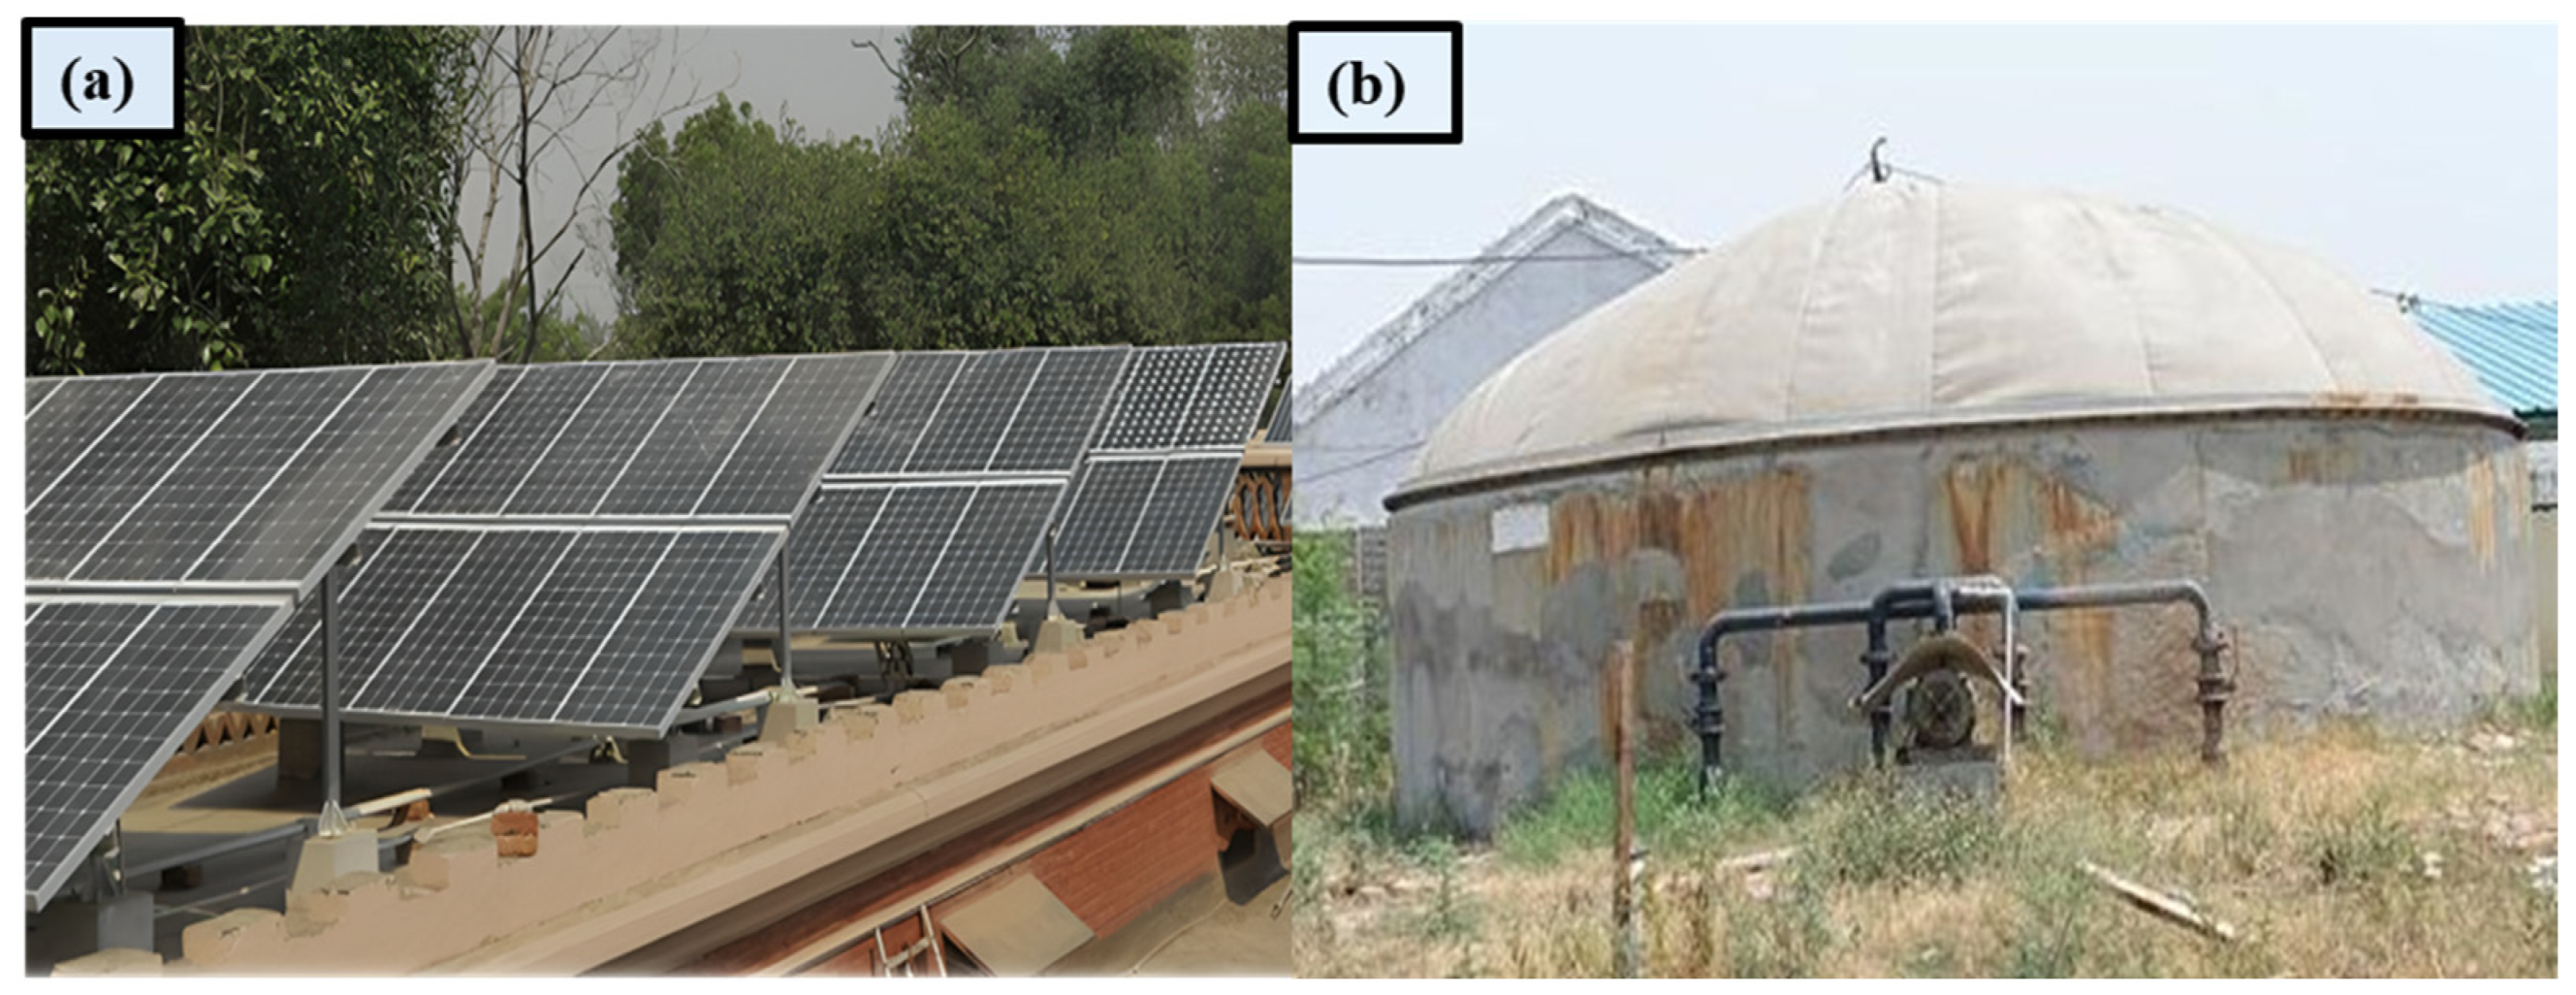
3.1.2. Solar PV and Biogas Power Plant at DEI Agra

The rooftop solar PV (Figure 3a) with battery backup and a pilot Biogas plant to harness agricultural and livestock waste at DEI Agra (Figure 3b). This region has significant solar irradiance as well as organic waste generation, creating conducive climatic conditions for anaerobic digestion. Solar power plant system comprises a photovoltaic slanted-roof setup with multi-Si panels, and lithium-ion (Li-ion) battery for energy storage, and an inverter, aiming to provide a sustainable electricity solution.

3.2. System Specifications

Table 2 summarizes the core technical specifications, capacities, and storage mechanisms for the solar and biogas setups. An integrated approach was used where possible: for instance, heat from solar concentrators was stored in Therminol 55 fluid for later use, while lithium-ion batteries provided short-term backup for electrical loads [30]. The choice of each component was made according to the local resource availability and cost considerations.

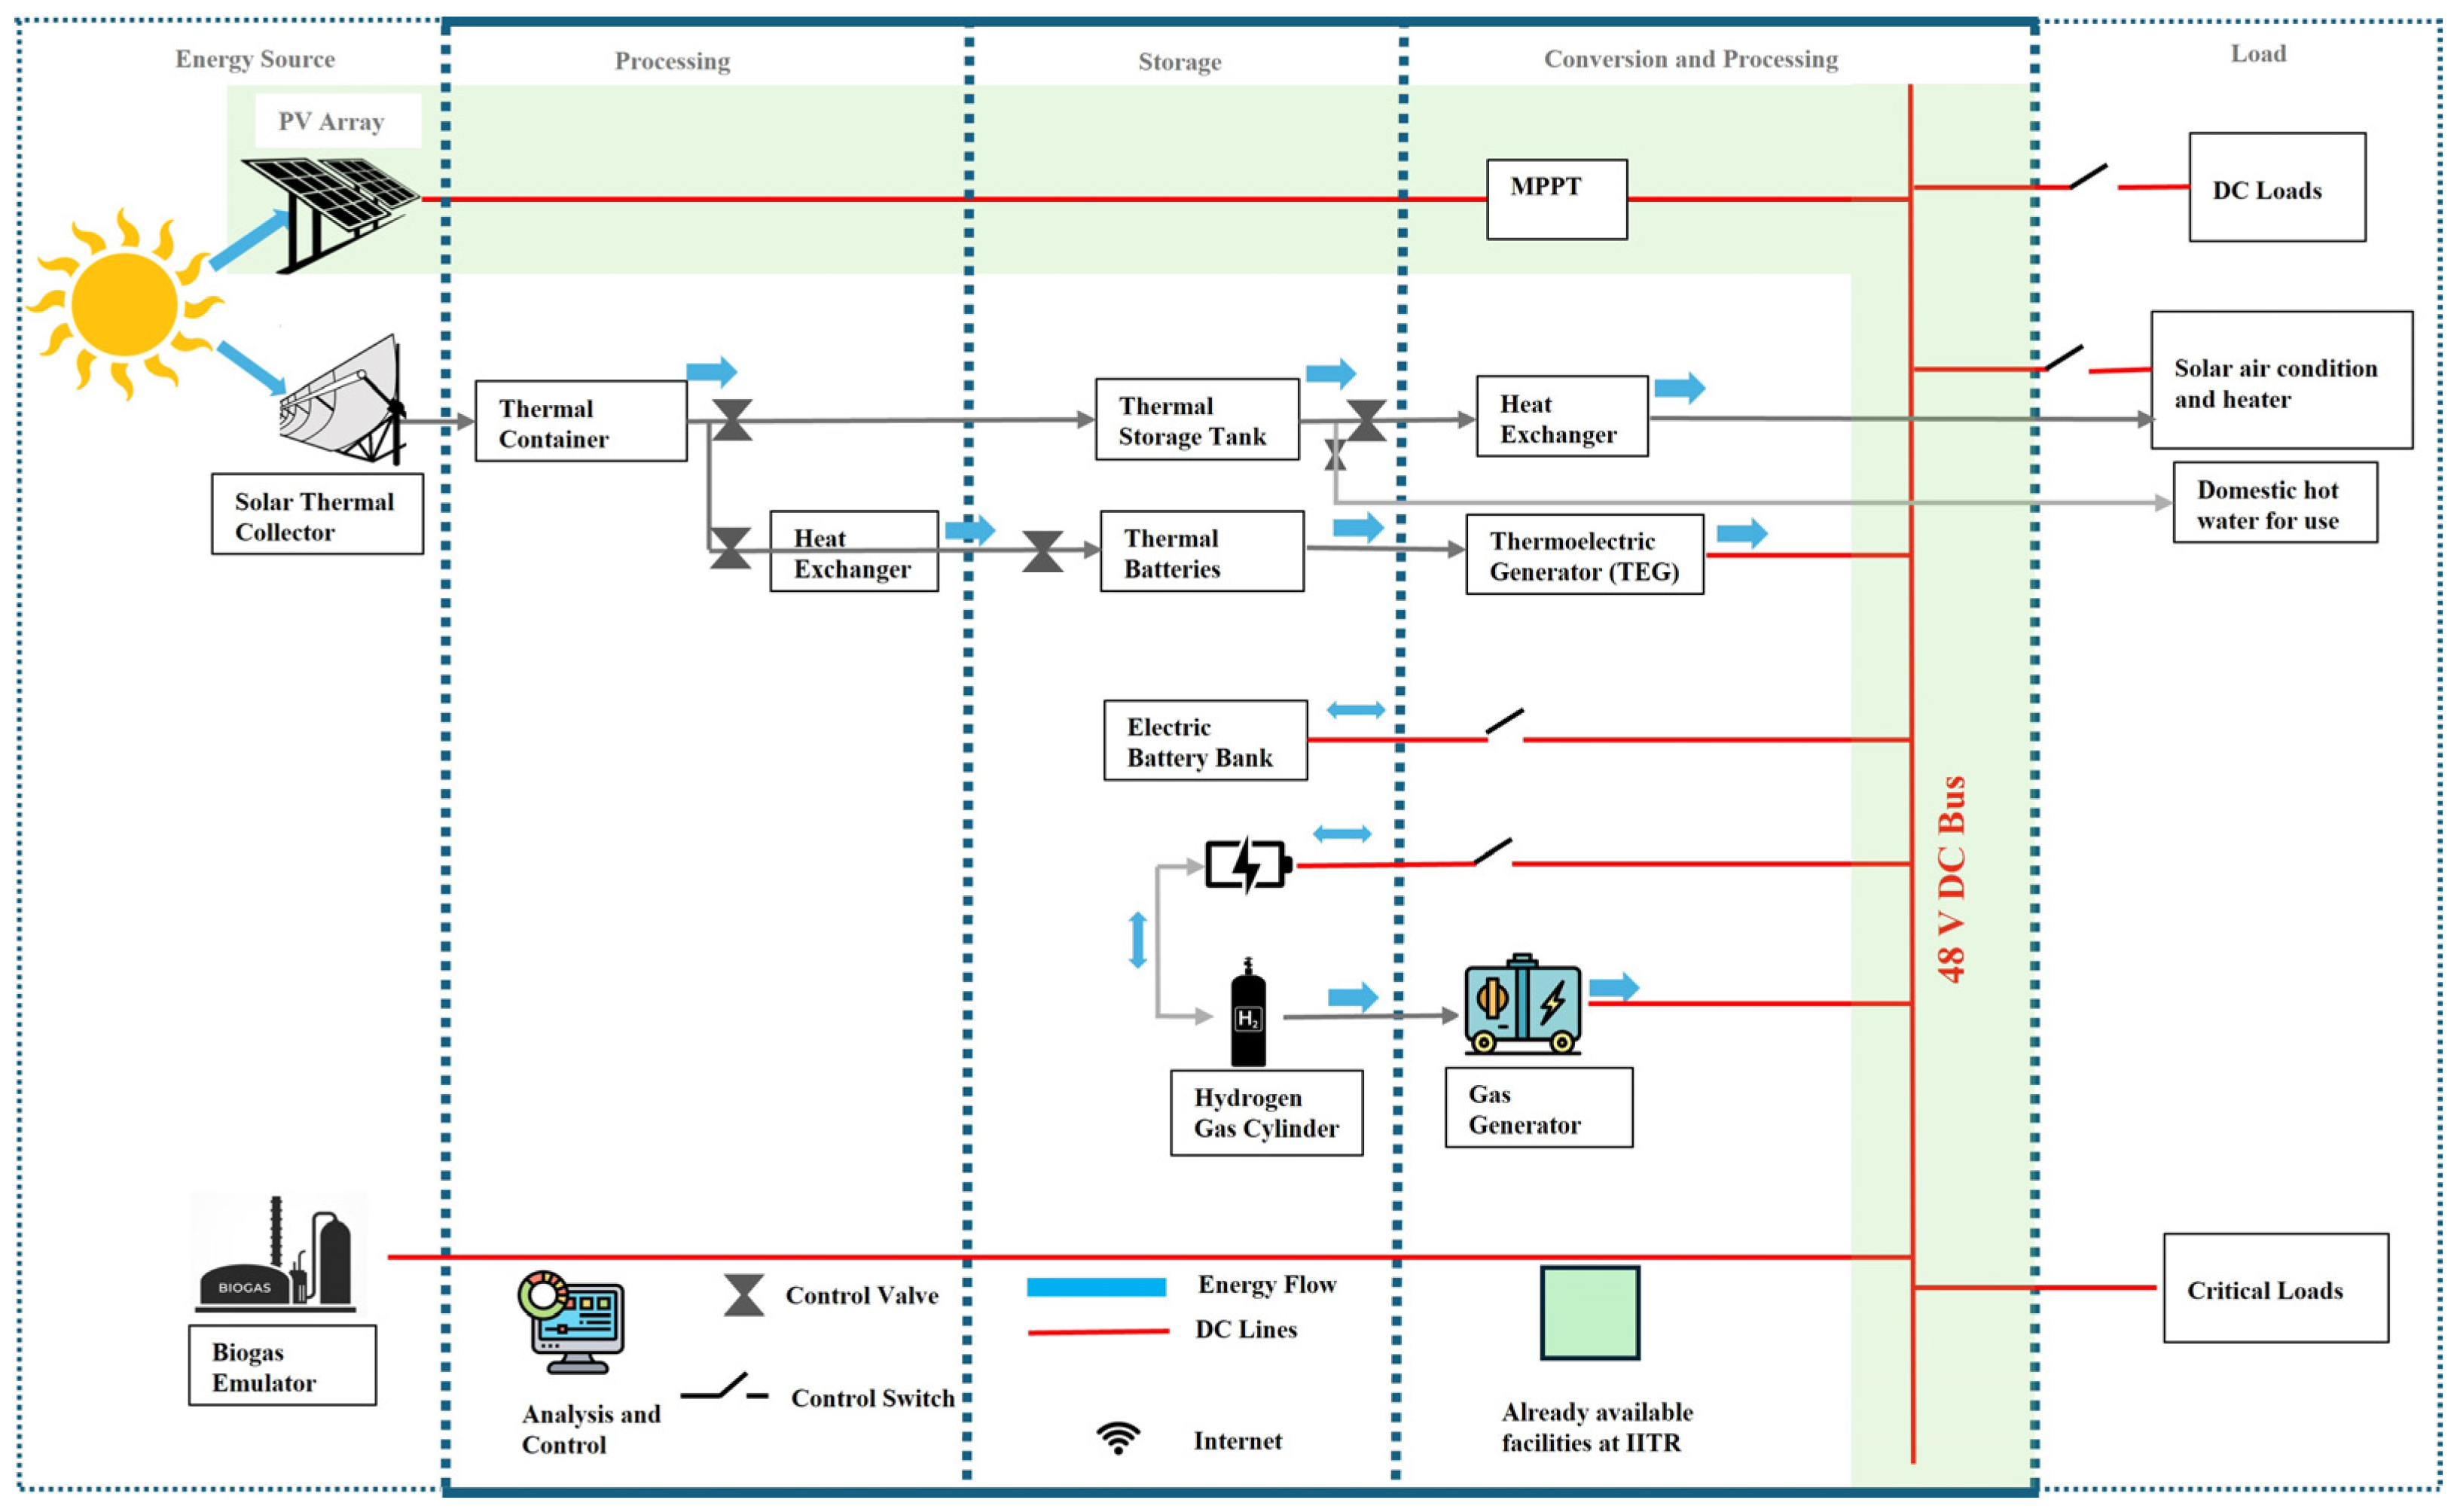
3.3. Integrated Energy Vectors

Figure 4 illustrates the conceptual layout of the different energy carriers (thermal, electrical, and gaseous, etc.) to enable system-level optimization. Specifically, the parabolic solar concentrator meets thermal loads during daytime, while surplus heat can be stored sensibly for off-peak usage. Biogas, produced from cow dung digestion, is similarly converted to electricity in a gas engine, with a portion possibly diverted for cooking or heating.

3.4. Economic Indicators

Levelised cost of electricity (LCOE) has been given in Table 3 and was calculated using:
L C O E = t = 0 N I t + O t 1 + r t t = 0 N E t 1 + r t
where It = investment, Ot = O&M, Et = electricity delivered, r = 6% discount rate, t = year.

4. Results and Discussion

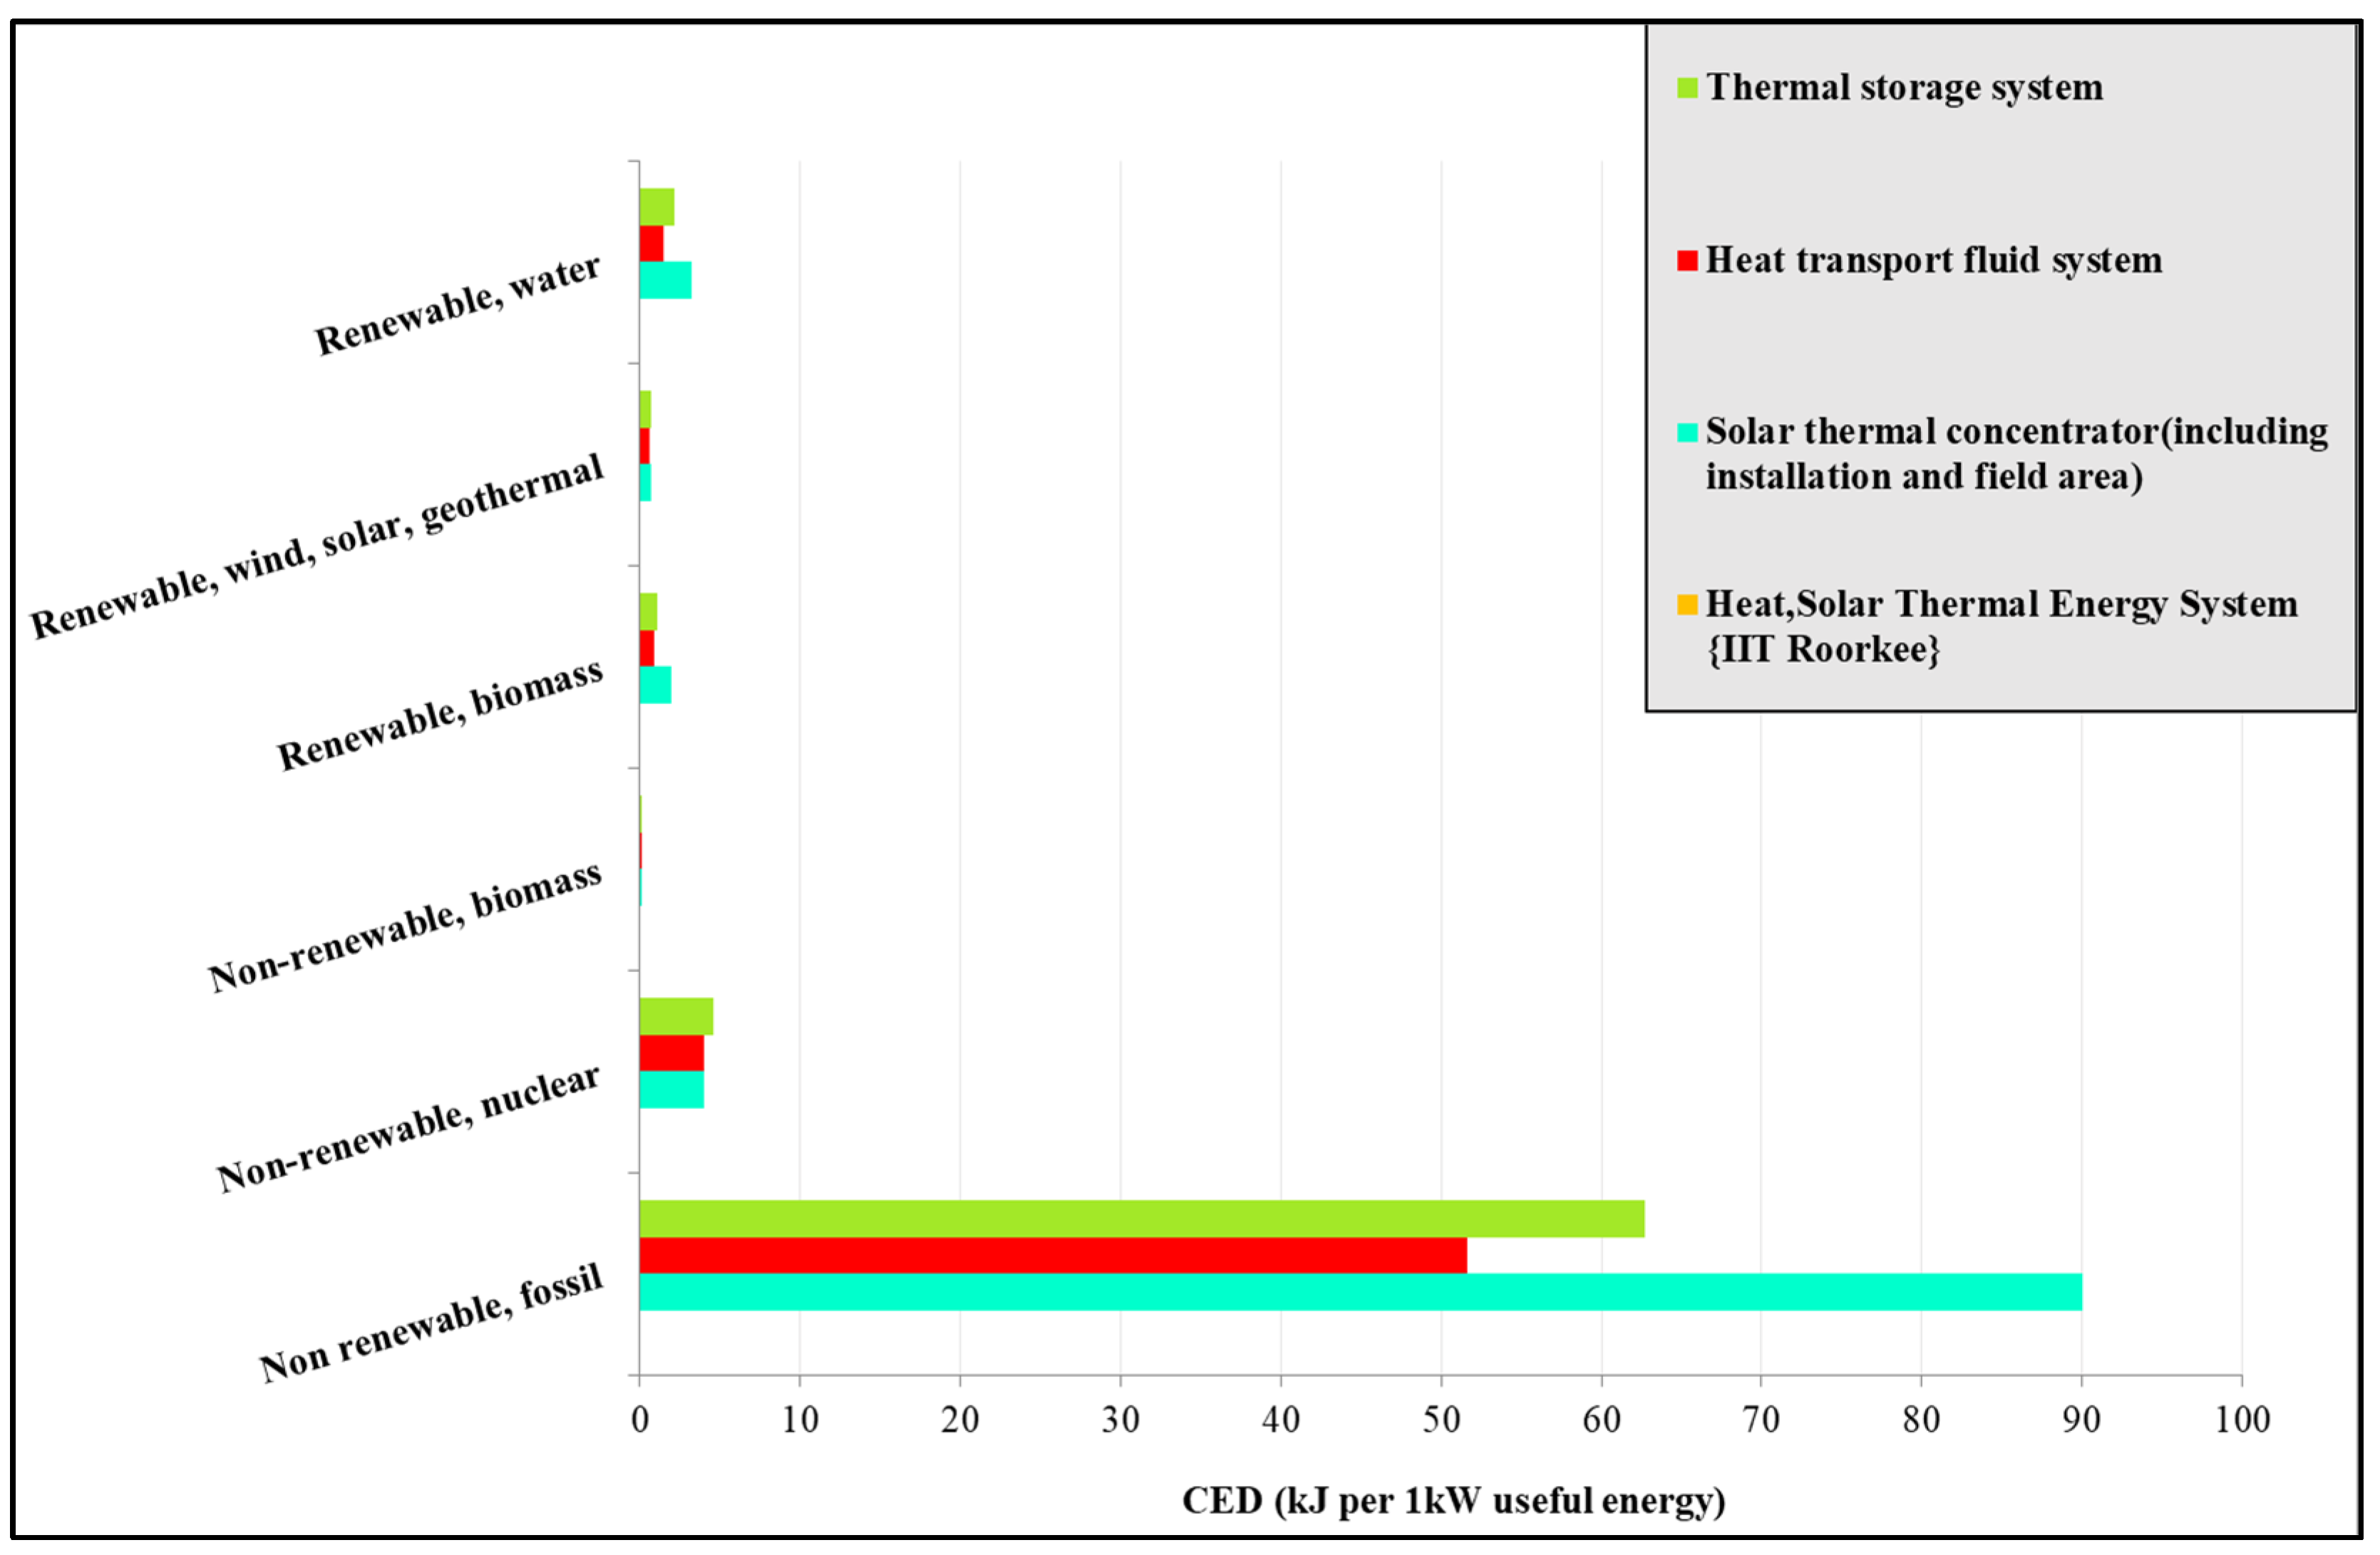
4.1. Thermal Energy System

4.1.1. System Advantages and Environmental Benefits

The deployment of a solar thermal system leverages renewable and abundant solar irradiation. The life cycle analysis shows that delivering 1 kWh of useful heat causes just 0.60 kg CO2-eq and requires 230 kJ of cumulative primary energy (Figure 5).
Endpoint damage aggregates to 1248 µPt/kWh or 1.25 mPt/kWh (Figure 6), and the energy-payback threshold is reached after approx. 3 MWh of heat, beyond which the collector delivers a clear net-positive balance for the remaining service life.
Moreover, solar–thermal operation consumes virtually no cooling water, aligning well with sustainability goals in arid regions [31]. Additionally, the supportive regulatory environment and widespread advocacy for solar thermal technologies align with global sustainability objectives, reinforcing their role as viable solutions in the quest for clean energy [32].

4.1.2. Challenges and Limitations

Despite these benefits, the system faces challenges tied to high initial and maintenance costs, reflecting the energy and resource-intensive manufacturing processes [33]. Two life cycle hotspots constrain the overall performance. First, fossil energy embedded in flat-glass and mirror fabrication accounts for 46% of the CED. Second, the Therminol-55 inventory dominates freshwater-eutrophication potential because of aromatic-solvent synthesis [30]. Another key limitation is space or land-area requirements, which may restrict large-scale deployment in high-density regions [34]. The land occupation was modest (5.8 m2 yr crop-eq/kWh) but remains higher than the PV alternative. These factors collectively limit scalability in dense urban scenarios indicating a need for future design improvements to lower the overall environmental footprint.

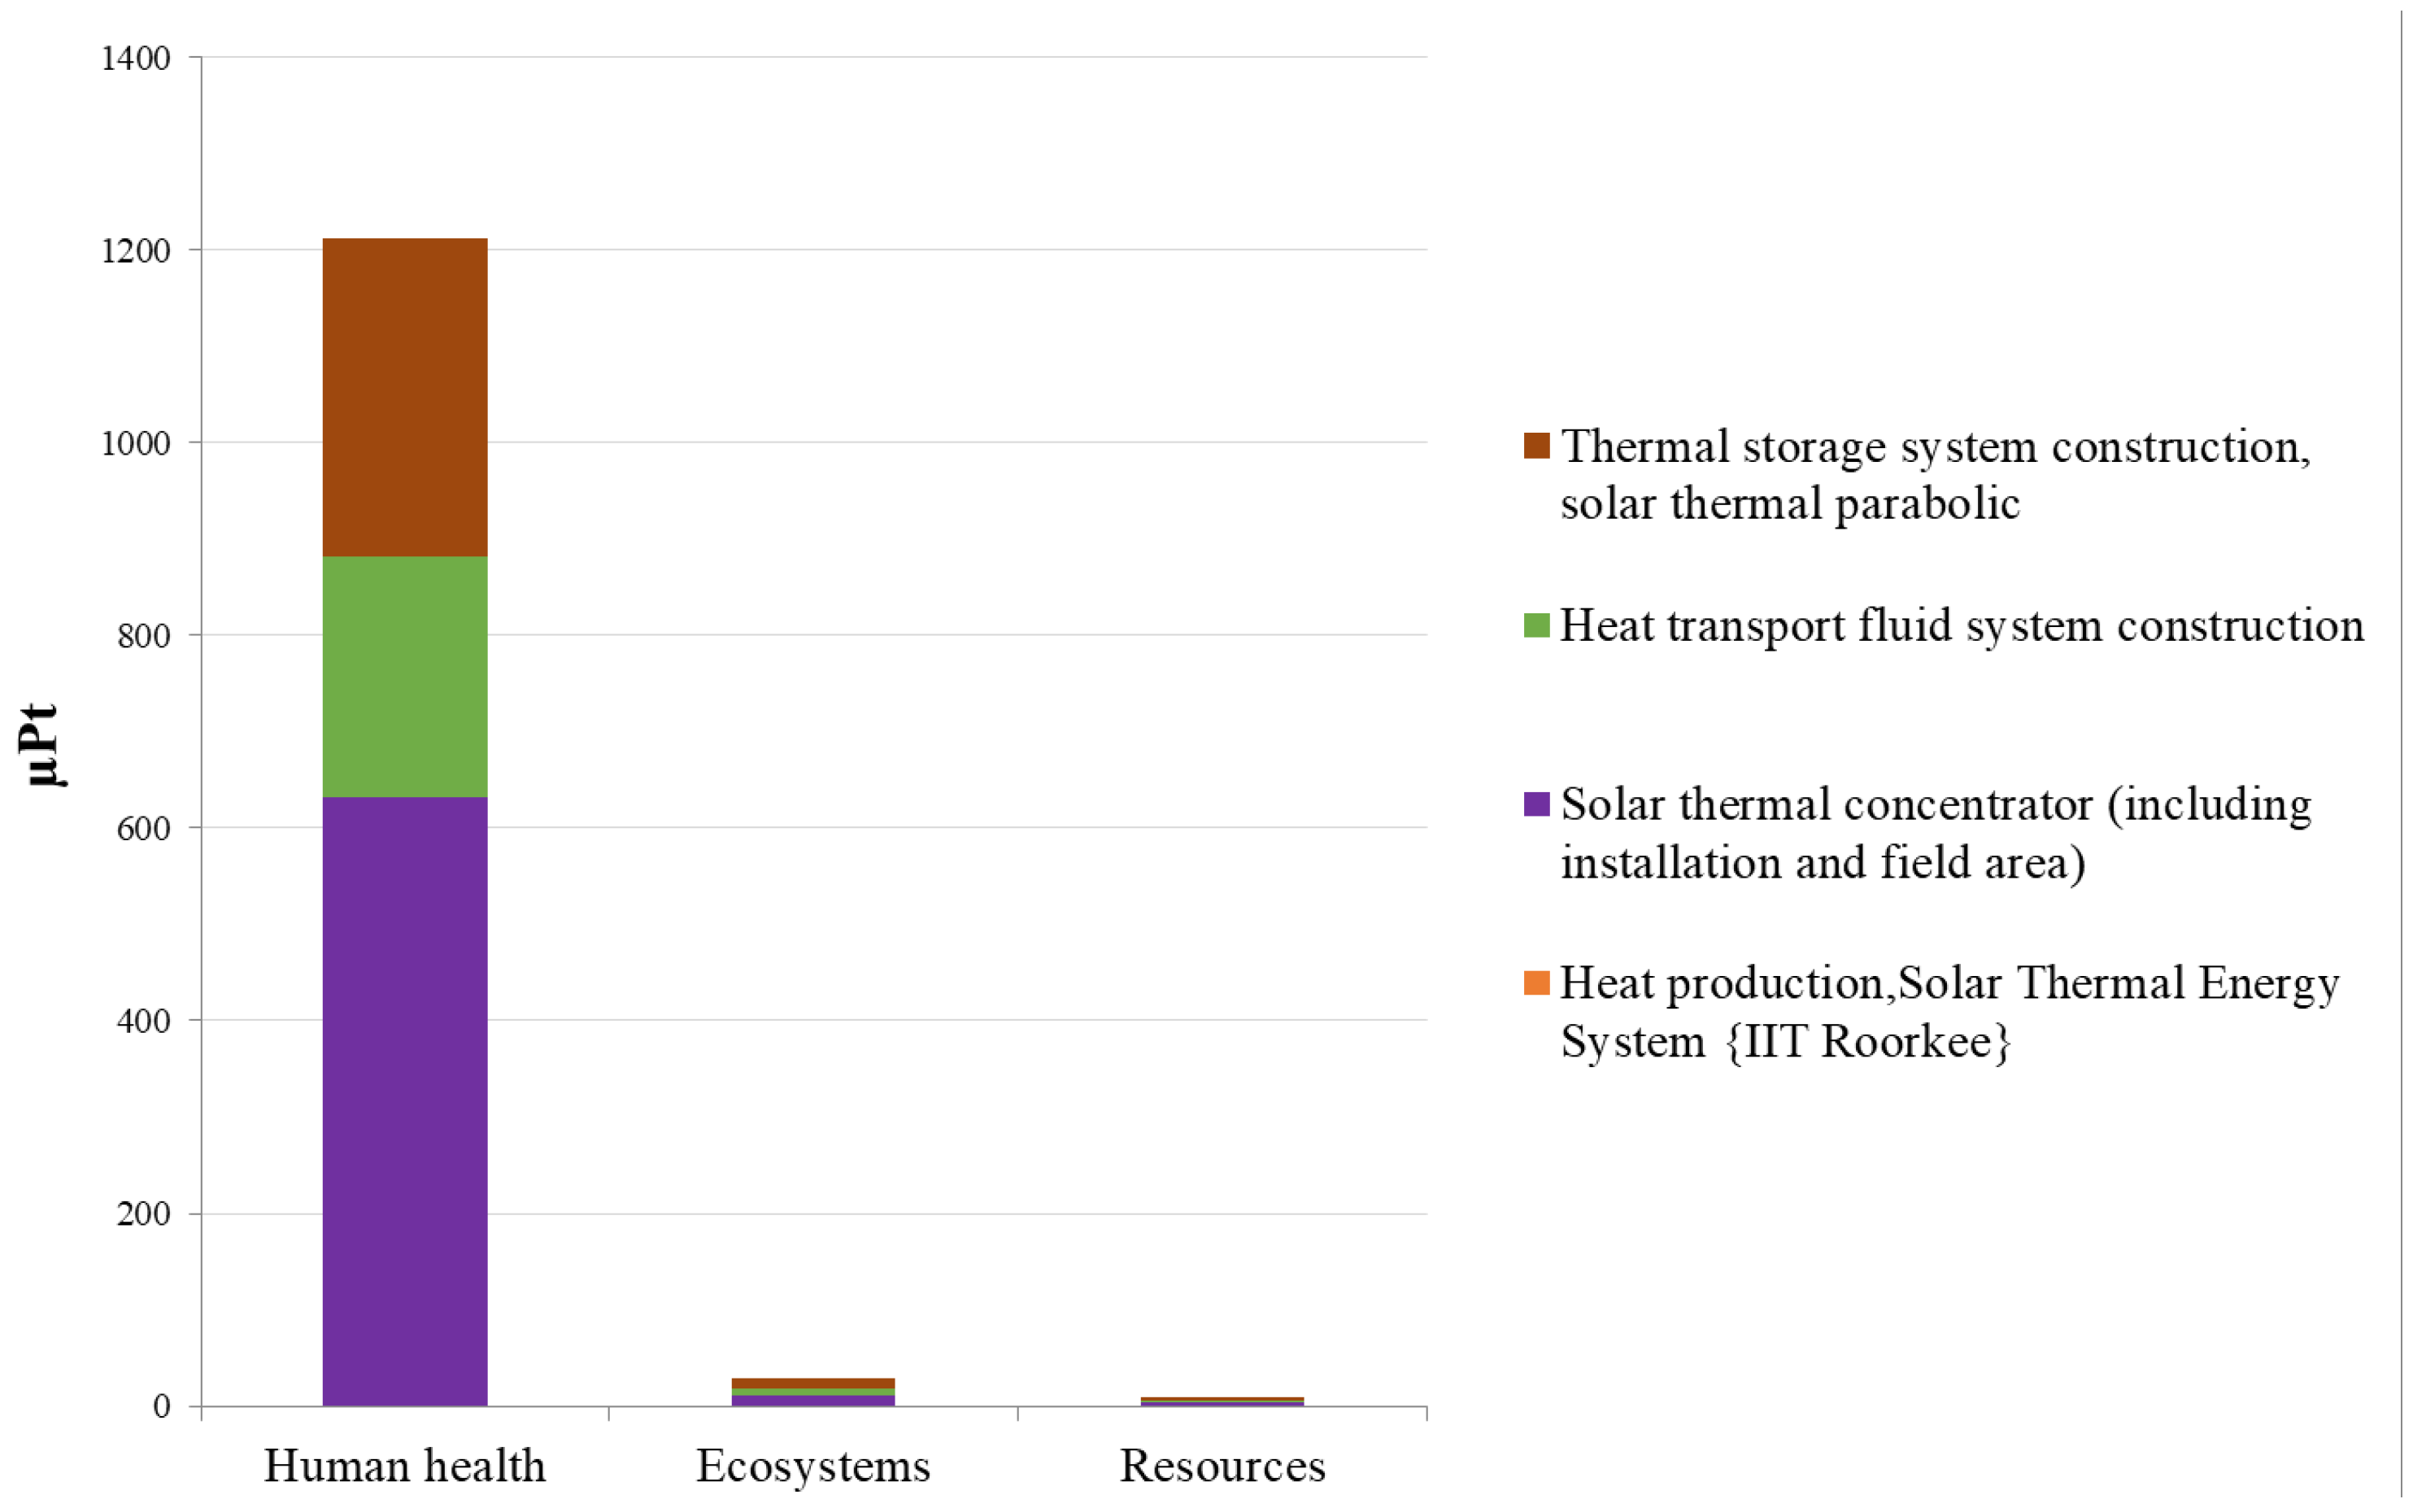
4.1.3. Environmental Impact Analysis

The environmental impact assessments for the solar thermal system are detailed in Figure 6 and Figure 7 using the ReCiPe 2016 method [26]. Figure 6, which presents an endpoint analysis, aggregates the broader impacts into categories like human health, ecosystem quality, and resource depletion. In the process level endpoint damage, solar thermal is driven by parabolic concentrator manufacture (0.63 mPt), heat transport fluid production (0.25 mPt) and thermal storage tank construction (0.32 mPt).
This shows that while solar thermal systems excel during operation, largely due to their reliance on renewable energy, the manufacturing stages raise potential risks, including those related to fine particulate matter formation.
In contrast, Figure 7 provides a midpoint analysis that dissects specific environmental stressors such as global warming potential, acidification, and particulate matter emissions. The insights suggest that although the operational benefits are clear, significant environmental improvements could be realized by targeting reductions in fossil energy consumption during upstream manufacturing processes.

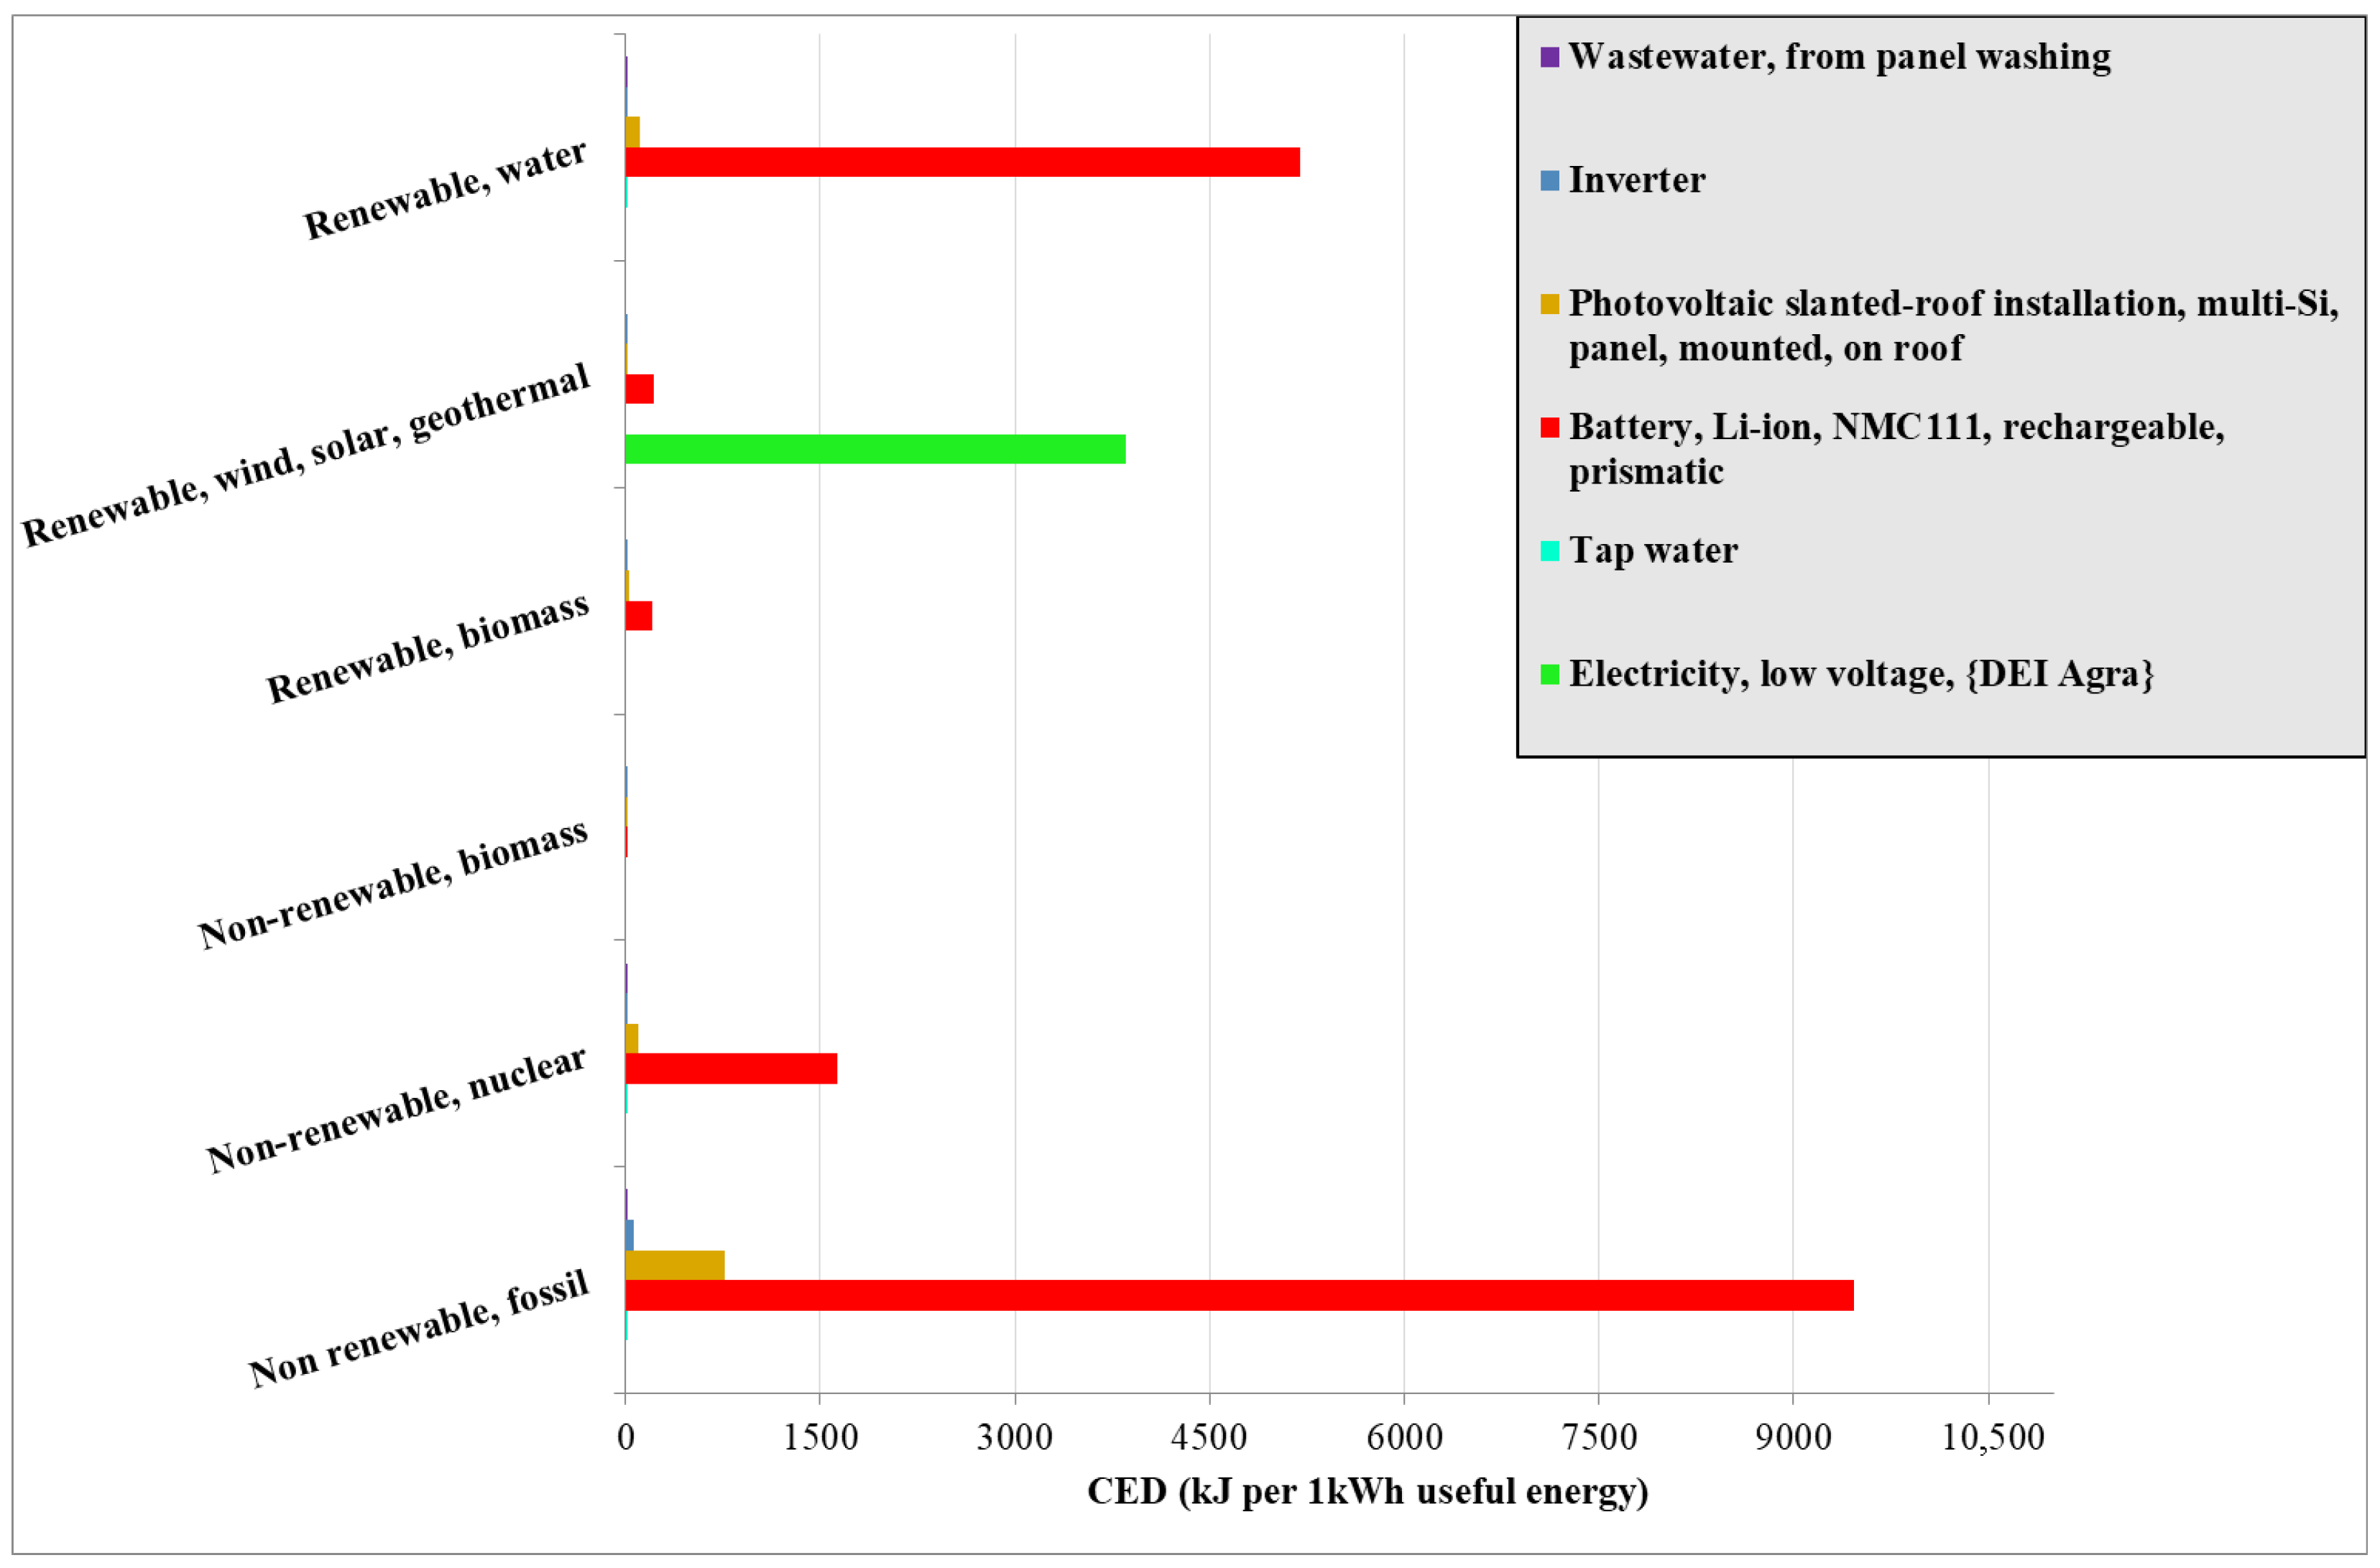
4.2. Electricity Energy System

4.2.1. System Advantages and Environmental Benefits

Solar PV systems represent a substantial advancement in our energy production framework, particularly due to their operational-phase near-zero emissions. By displacing fossil-fuel-based electricity, solar power plants contribute significantly to climate change mitigation, enhancing energy security, both of which are fundamental objectives highlighted in sustainability discourse [35,36]. For the 150 kW rooftop PV array at DEI-Agra, cradle-to-grave GHG emissions amount to only 0.05 kg CO2-eq/kWh, the lowest among the three options evaluated. At the endpoint level, total damage amounts to 72.45 mPt/kWh, driven overwhelmingly by manufacturing processes (steel, silicon, and battery production), while operational and end-of-life impacts remain negligible. Although the cumulative energy demand is high (21,700 kJ/kWh, Figure 8), 92% of this energy is front loaded during wafer growth and module lamination.
Furthermore, as highlighted by multiple studies, the cost of solar PV systems has seen significant reductions, with promising projections indicating that these technologies could supply up to 32% of global electricity by 2050 [36]. By continuing to innovate and improve the integration of renewable sources like solar PV with energy storage, it is possible to further enhance their contributions to sustainable energy production and climate change mitigation, marking a critical step toward a more sustainable future.

4.2.2. Challenges and Limitations

Despite these clear benefits, several challenges persist. The environmental footprint of panel and Li-ion battery production visible in Figure 8, Figure 9 and Figure 10 reveals substantial non-renewable energy inputs in the manufacturing, refining, and transportation of raw materials. Li-ion batteries, in particular, demand metals like lithium, cobalt, and nickel, whose extraction and processing can lead to resource depletion, particulate emissions, and environmental hazards [37,38]. Additionally, the challenge of end-of-life management adds another layer of complexity. As the number of PV systems increases, the volume of end-of-life solar panels will rise significantly, posing a waste management challenge [37,39]. Research indicates that improper disposal of these panels could lead to leaching of hazardous substances, undermining their environmental benefits and potentially causing soil and water contamination [39]. Effective recycling processes for PV panels are critical to mitigate these risks. In that regard, solvent-based delamination offers up to 95% material recovery under lab conditions, though scalability remains a challenge [32,40]. Emerging solvent systems may reduce environmental burden, but results vary by process. For Li-ion batteries, hydrometallurgical “direct recycling” can lower global warming potential by up to 60% and recover key materials like lithium and cobalt, contributing to circular economy goals [41,42]. However, the recycling of PV panels is hampered by the lack of widespread infrastructure and technologies capable of efficiently handling and processing these materials [43].

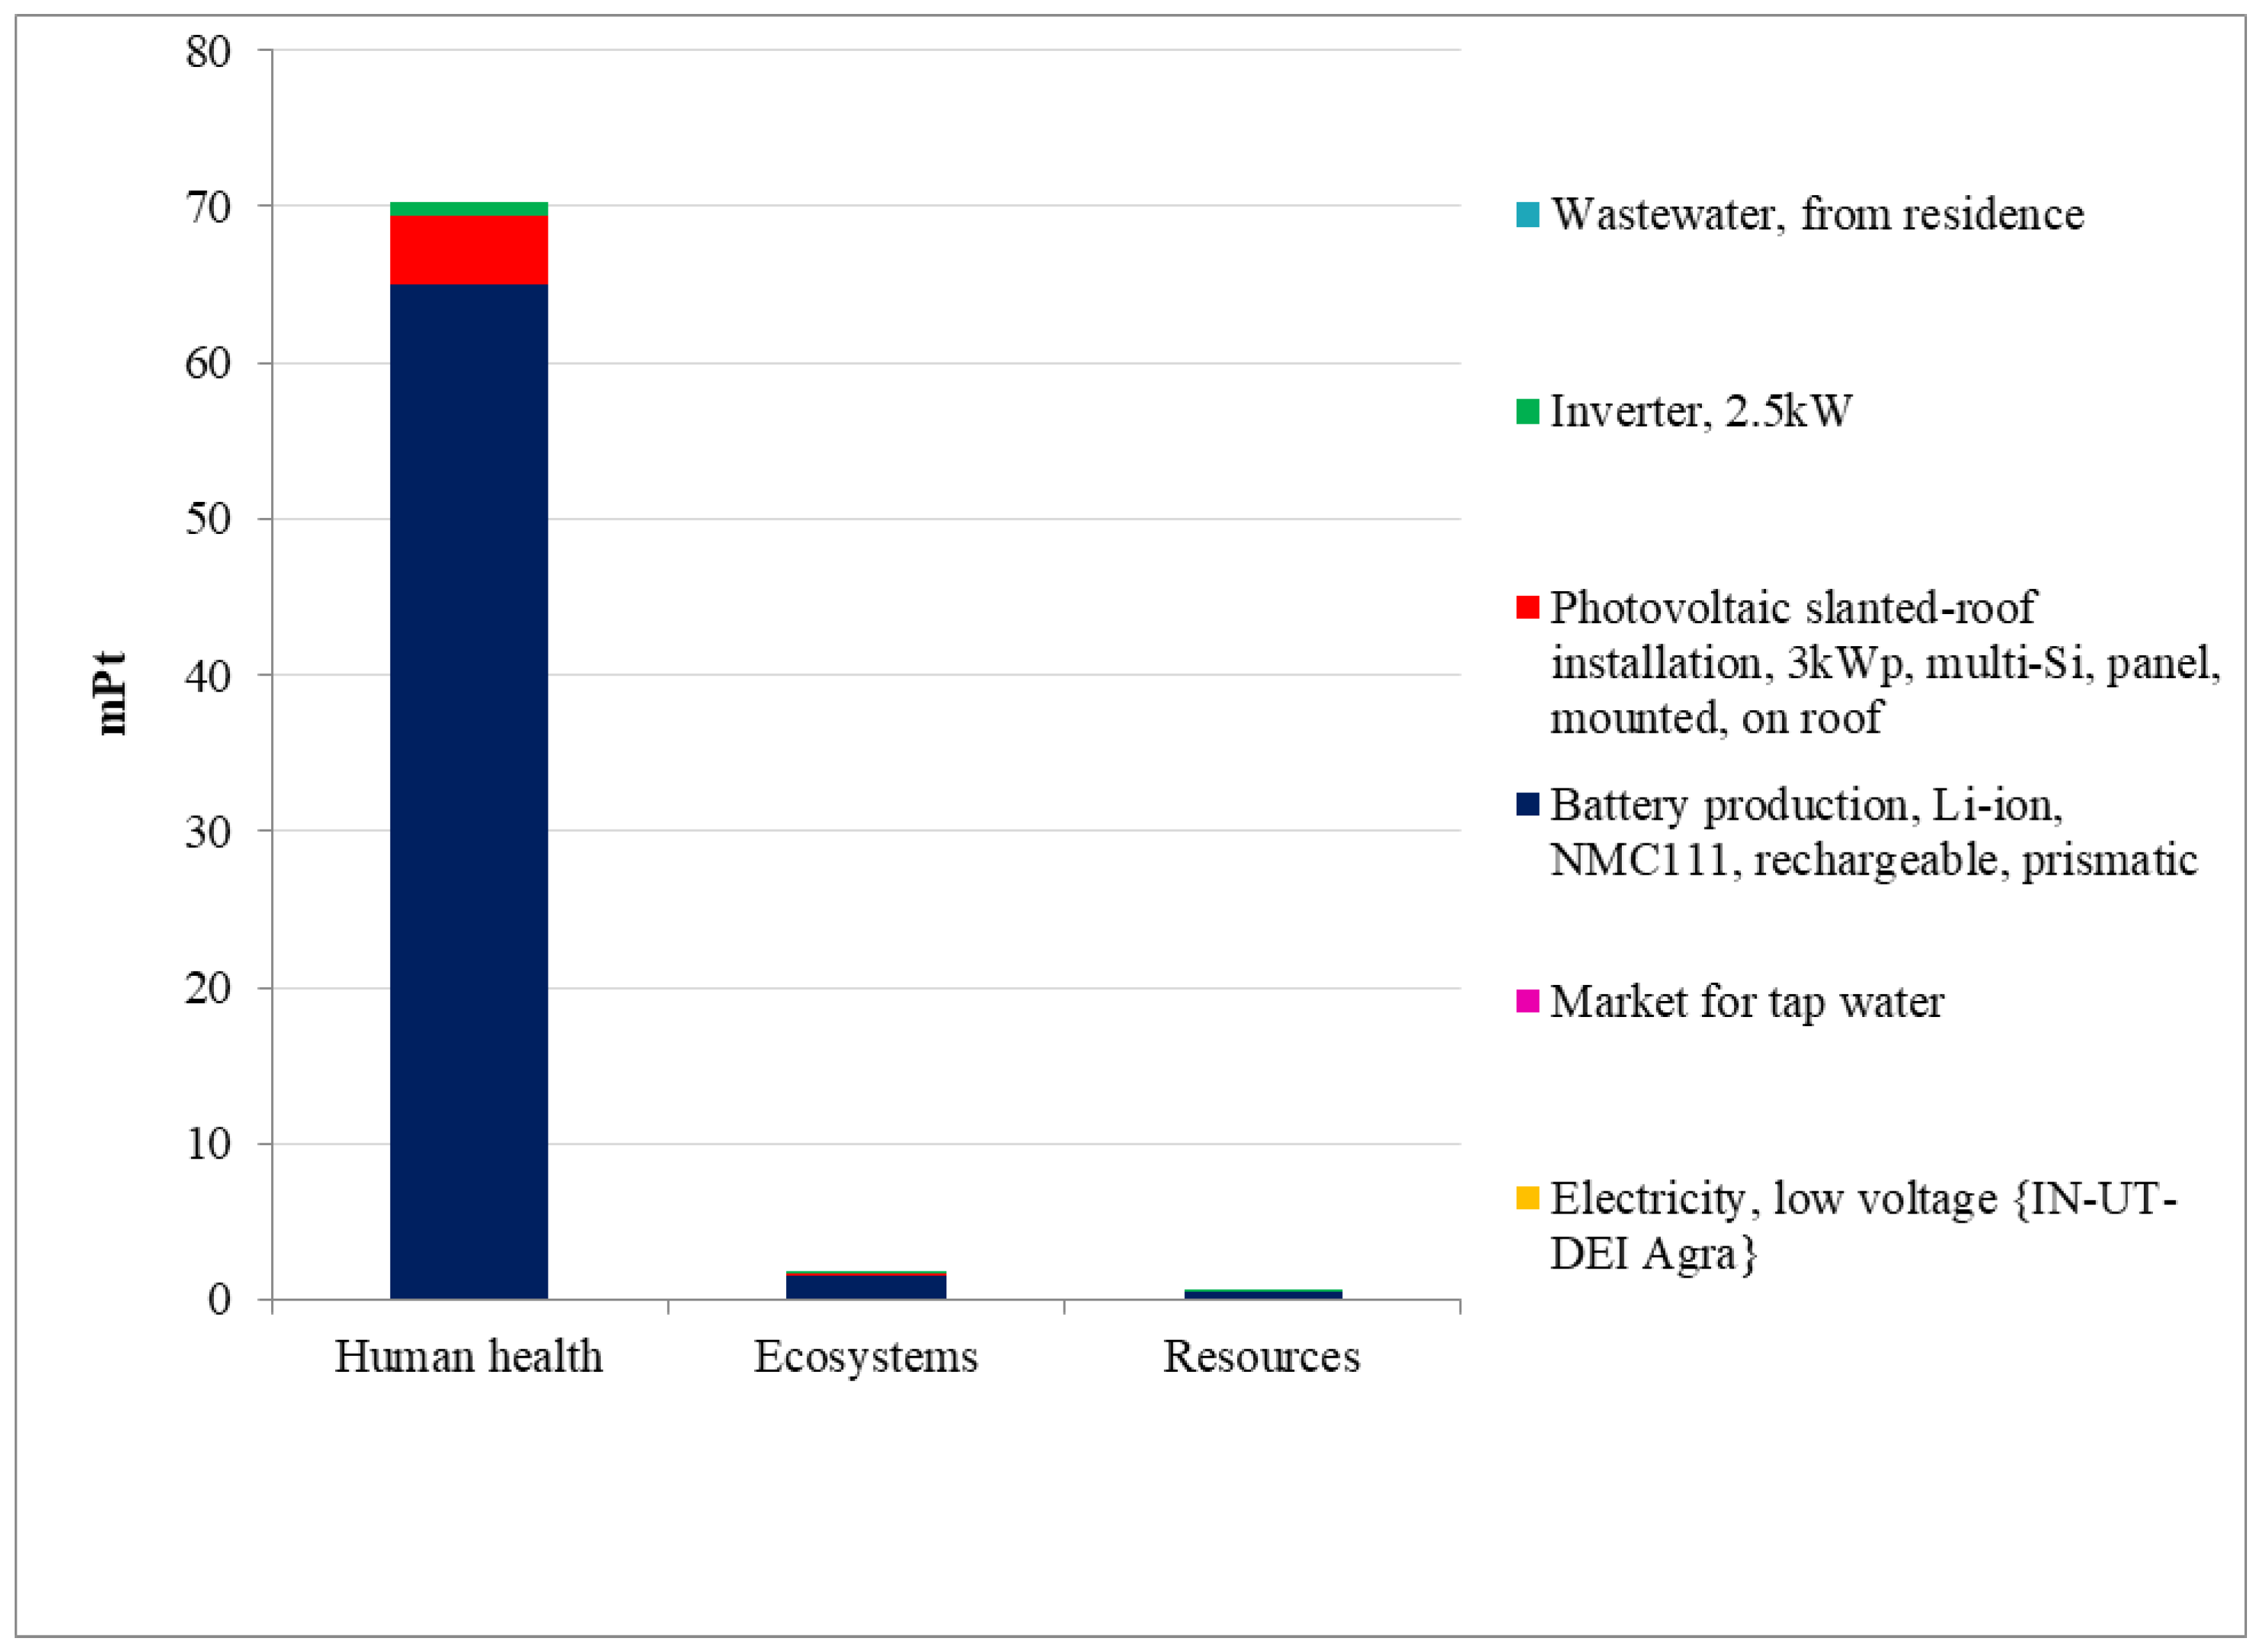
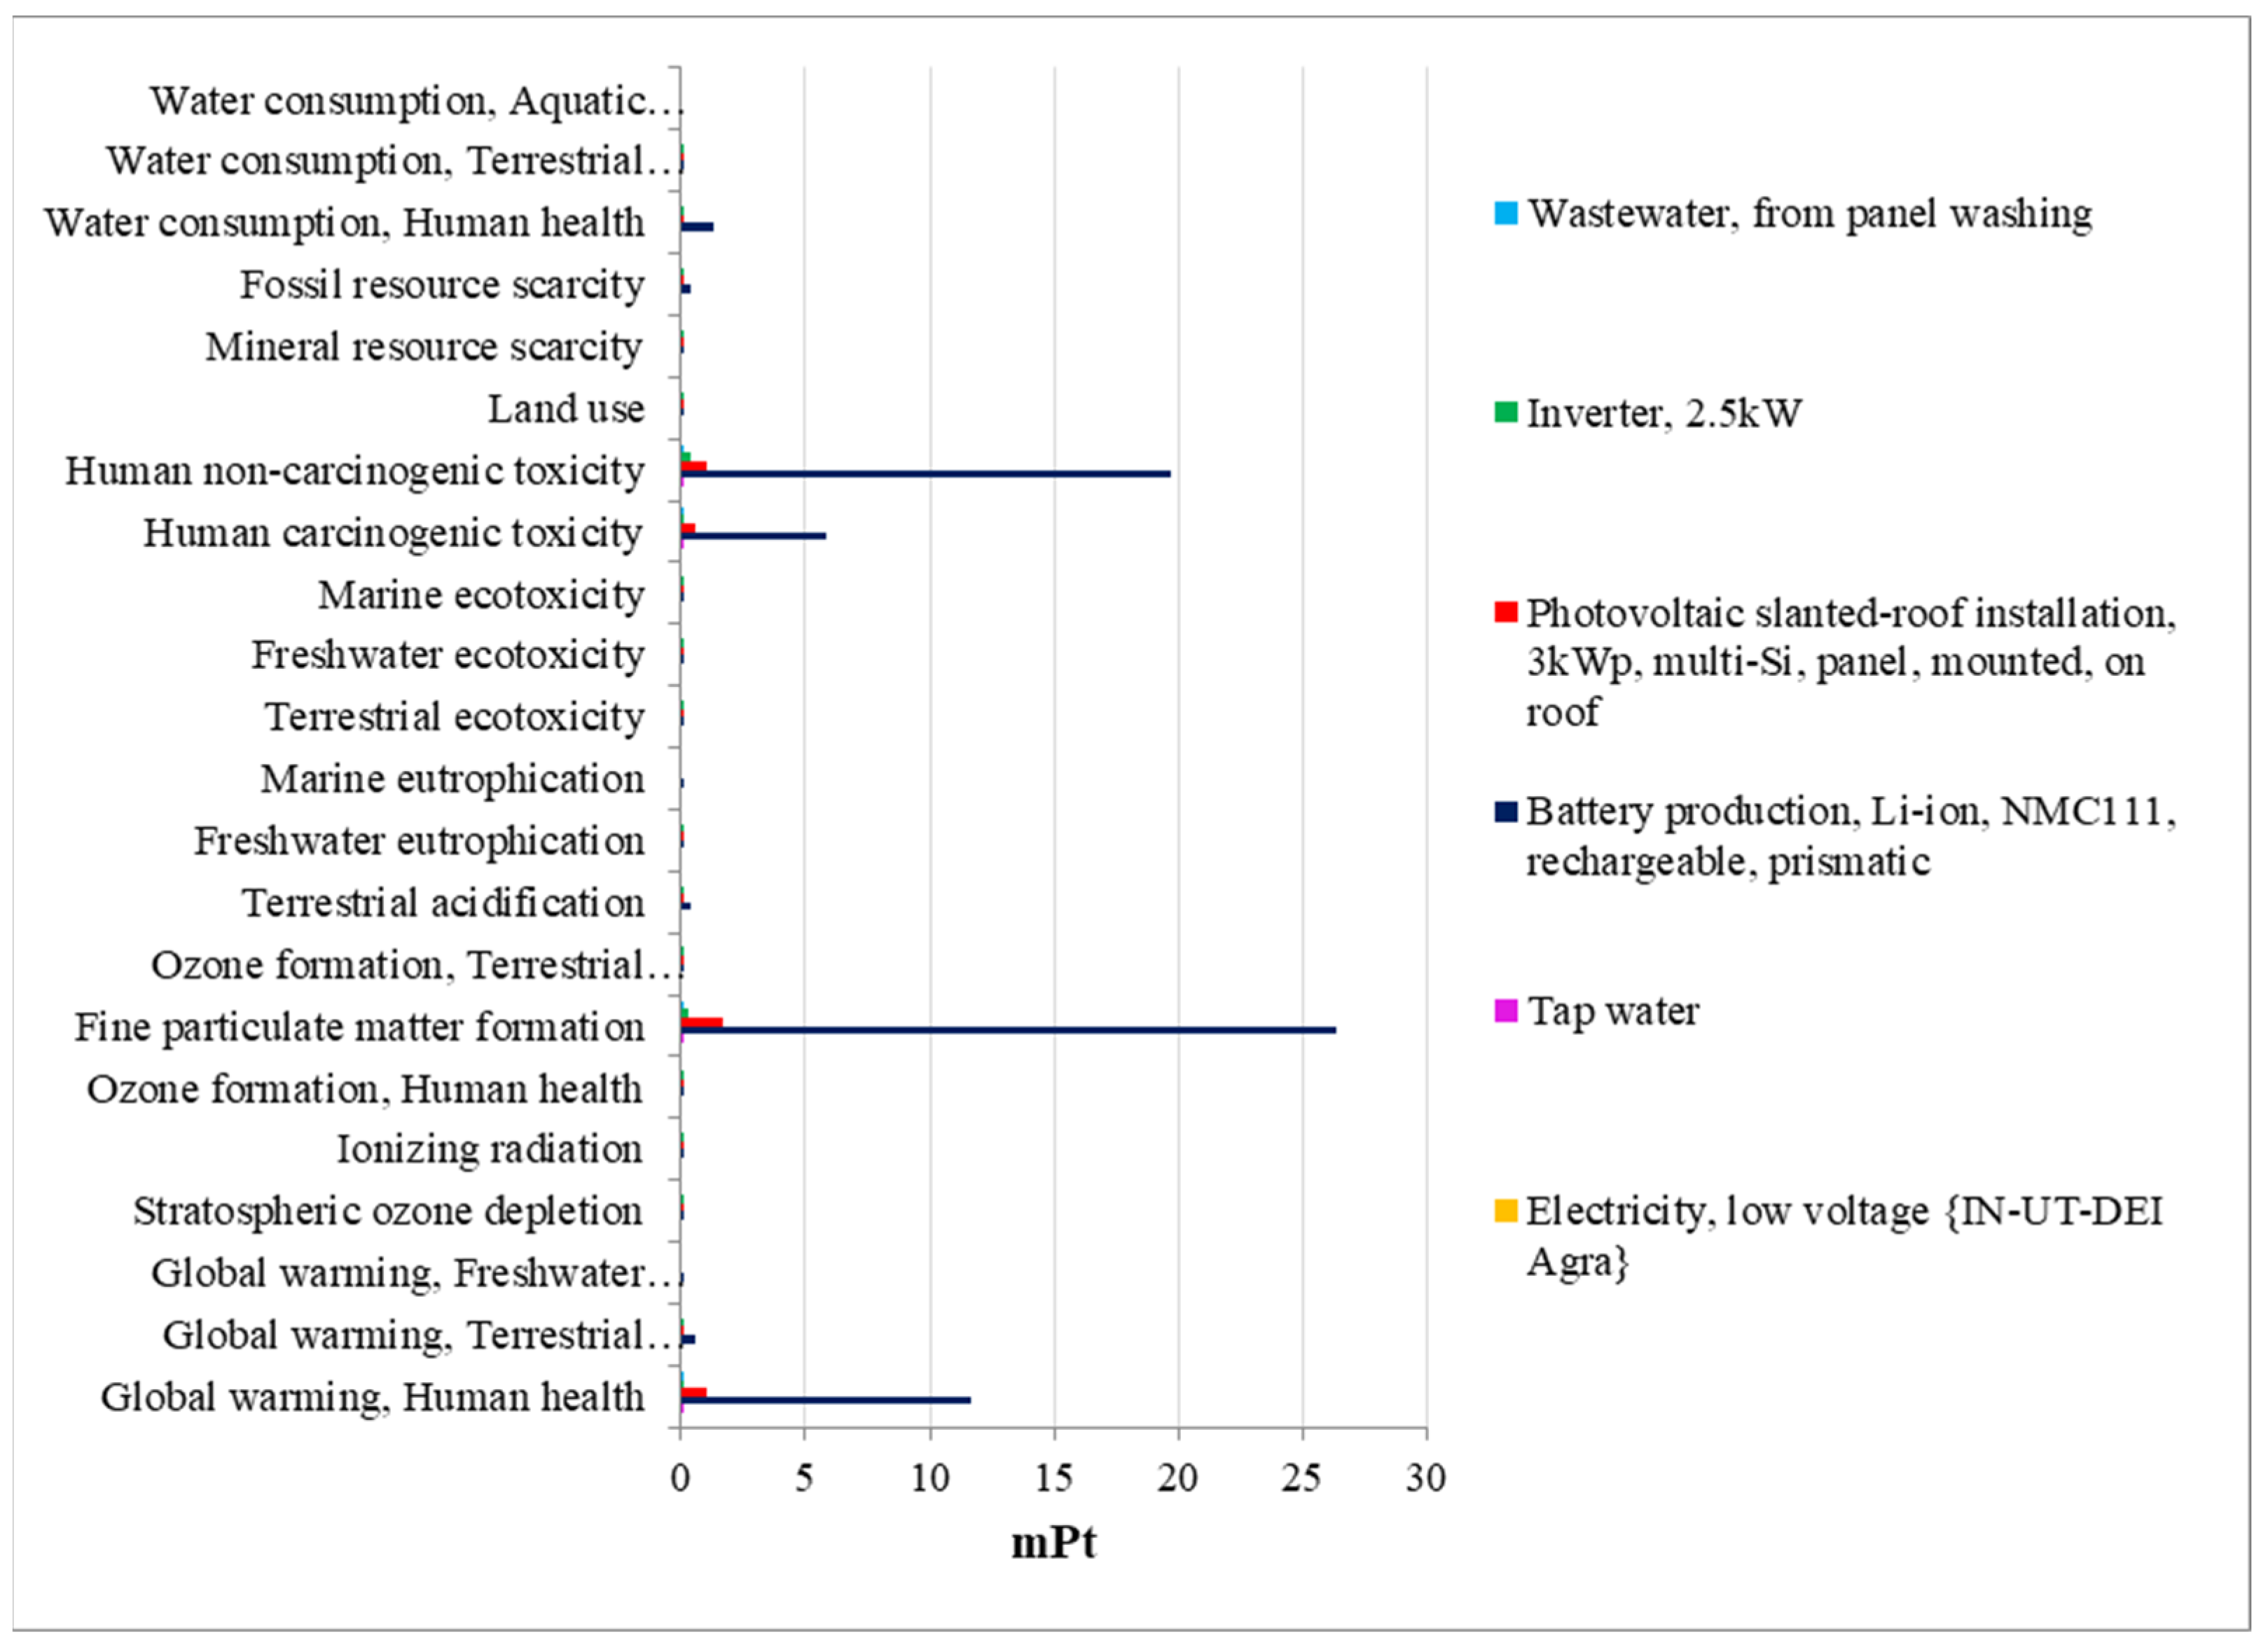
4.2.3. Environmental Impact Analysis

From the CED perspective, Figure 8 highlights notable fossil energy consumption to manufacture and transport system components. Figure 9 and Figure 10 further confirm that human health and ecosystems can be affected by particulate matter formation and toxic releases from upstream processes. In the process level endpoint damage, solar PV is overwhelmingly dominated by Li-ion battery production (65.06 mPt, 90% of the total), with PV module manufacture (4.32 mPt), inverter assembly (0.84 mPt), and minor water/waste streams making up the remainder.
This underscores the need for stringent environmental regulations, improved recycling programs, and extended product lifespans (e.g., battery second-life applications) to reduce life cycle impacts. While showcasing the system’s potential in harnessing renewable energy, they also highlight the environmental costs associated with non-renewable resource consumption and pollution. The impact on human health, driven by factors like particulate matter and toxin exposure, alongside implications for ecosystems and resource depletion, are critical considerations.

4.3. Bio-Based Electricity Energy System

4.3.1. System Advantages and Environmental Benefits

Biogas technology harnesses methane-rich gas from organic feedstocks (e.g., agricultural residue, livestock manure), thereby preventing methane release directly into the atmosphere. This process is crucial, as methane (CH4) is substantially more potent than carbon dioxide (CO2) as a GHG on a per-molecule basis, with a global warming potential that is approximately 25 times greater than that of CO2 over a 100 year period [44,45]. The fixed-dome digester at DEI-Agra delivers electricity at 0.20 kg CO2-eq/kWh and 1406 kJ/kWh of primary energy (Figure 11) and endpoint damage of 18.8 mPt/kWh (Figure 12).
In addition to its role in GHG reduction, biogas technology offers significant agronomic benefits through the production of digestate, a nutrient-rich by-product. Digestate substitution of synthetic fertilizer offsets an additional 12% of the acidification burden, while supplying critical plant nutrients like nitrogen, phosphorus, and potassium, thereby reinforcing a strong circular-economy benefit absent from the other technologies [46].

4.3.2. Challenges and Limitations

The total endpoint damage (18.8 mPt/kWh; Figure 12) is majorly driven by NOₓ and NH3 volatilization during digestate handling and particulate matter emitted from the gas engine.
Biogas production relies heavily on the availability and management of feedstocks, which can vary significantly in terms of quantity, quality, and price [11]. Figure 11 illustrates the dual nature of energy input for generating 1 kWh of electricity from biogas, highlighting the reliance on non-renewable fossil fuels for biomass conversion and the energy derived from biomass itself.
Infrastructural limitations also pose significant challenges. Current waste management practices and production facilities often lack integration with biogas technology, leading to inefficiencies [47]. The design and implementation of biogas systems may require advanced technology and knowledge, which might not be present in rural areas or developing regions. For instance, optimizing hybrid systems that combine biogas with other renewable sources can potentially enhance energy output; however, these require technical expertise and specific technological adaptations [48].

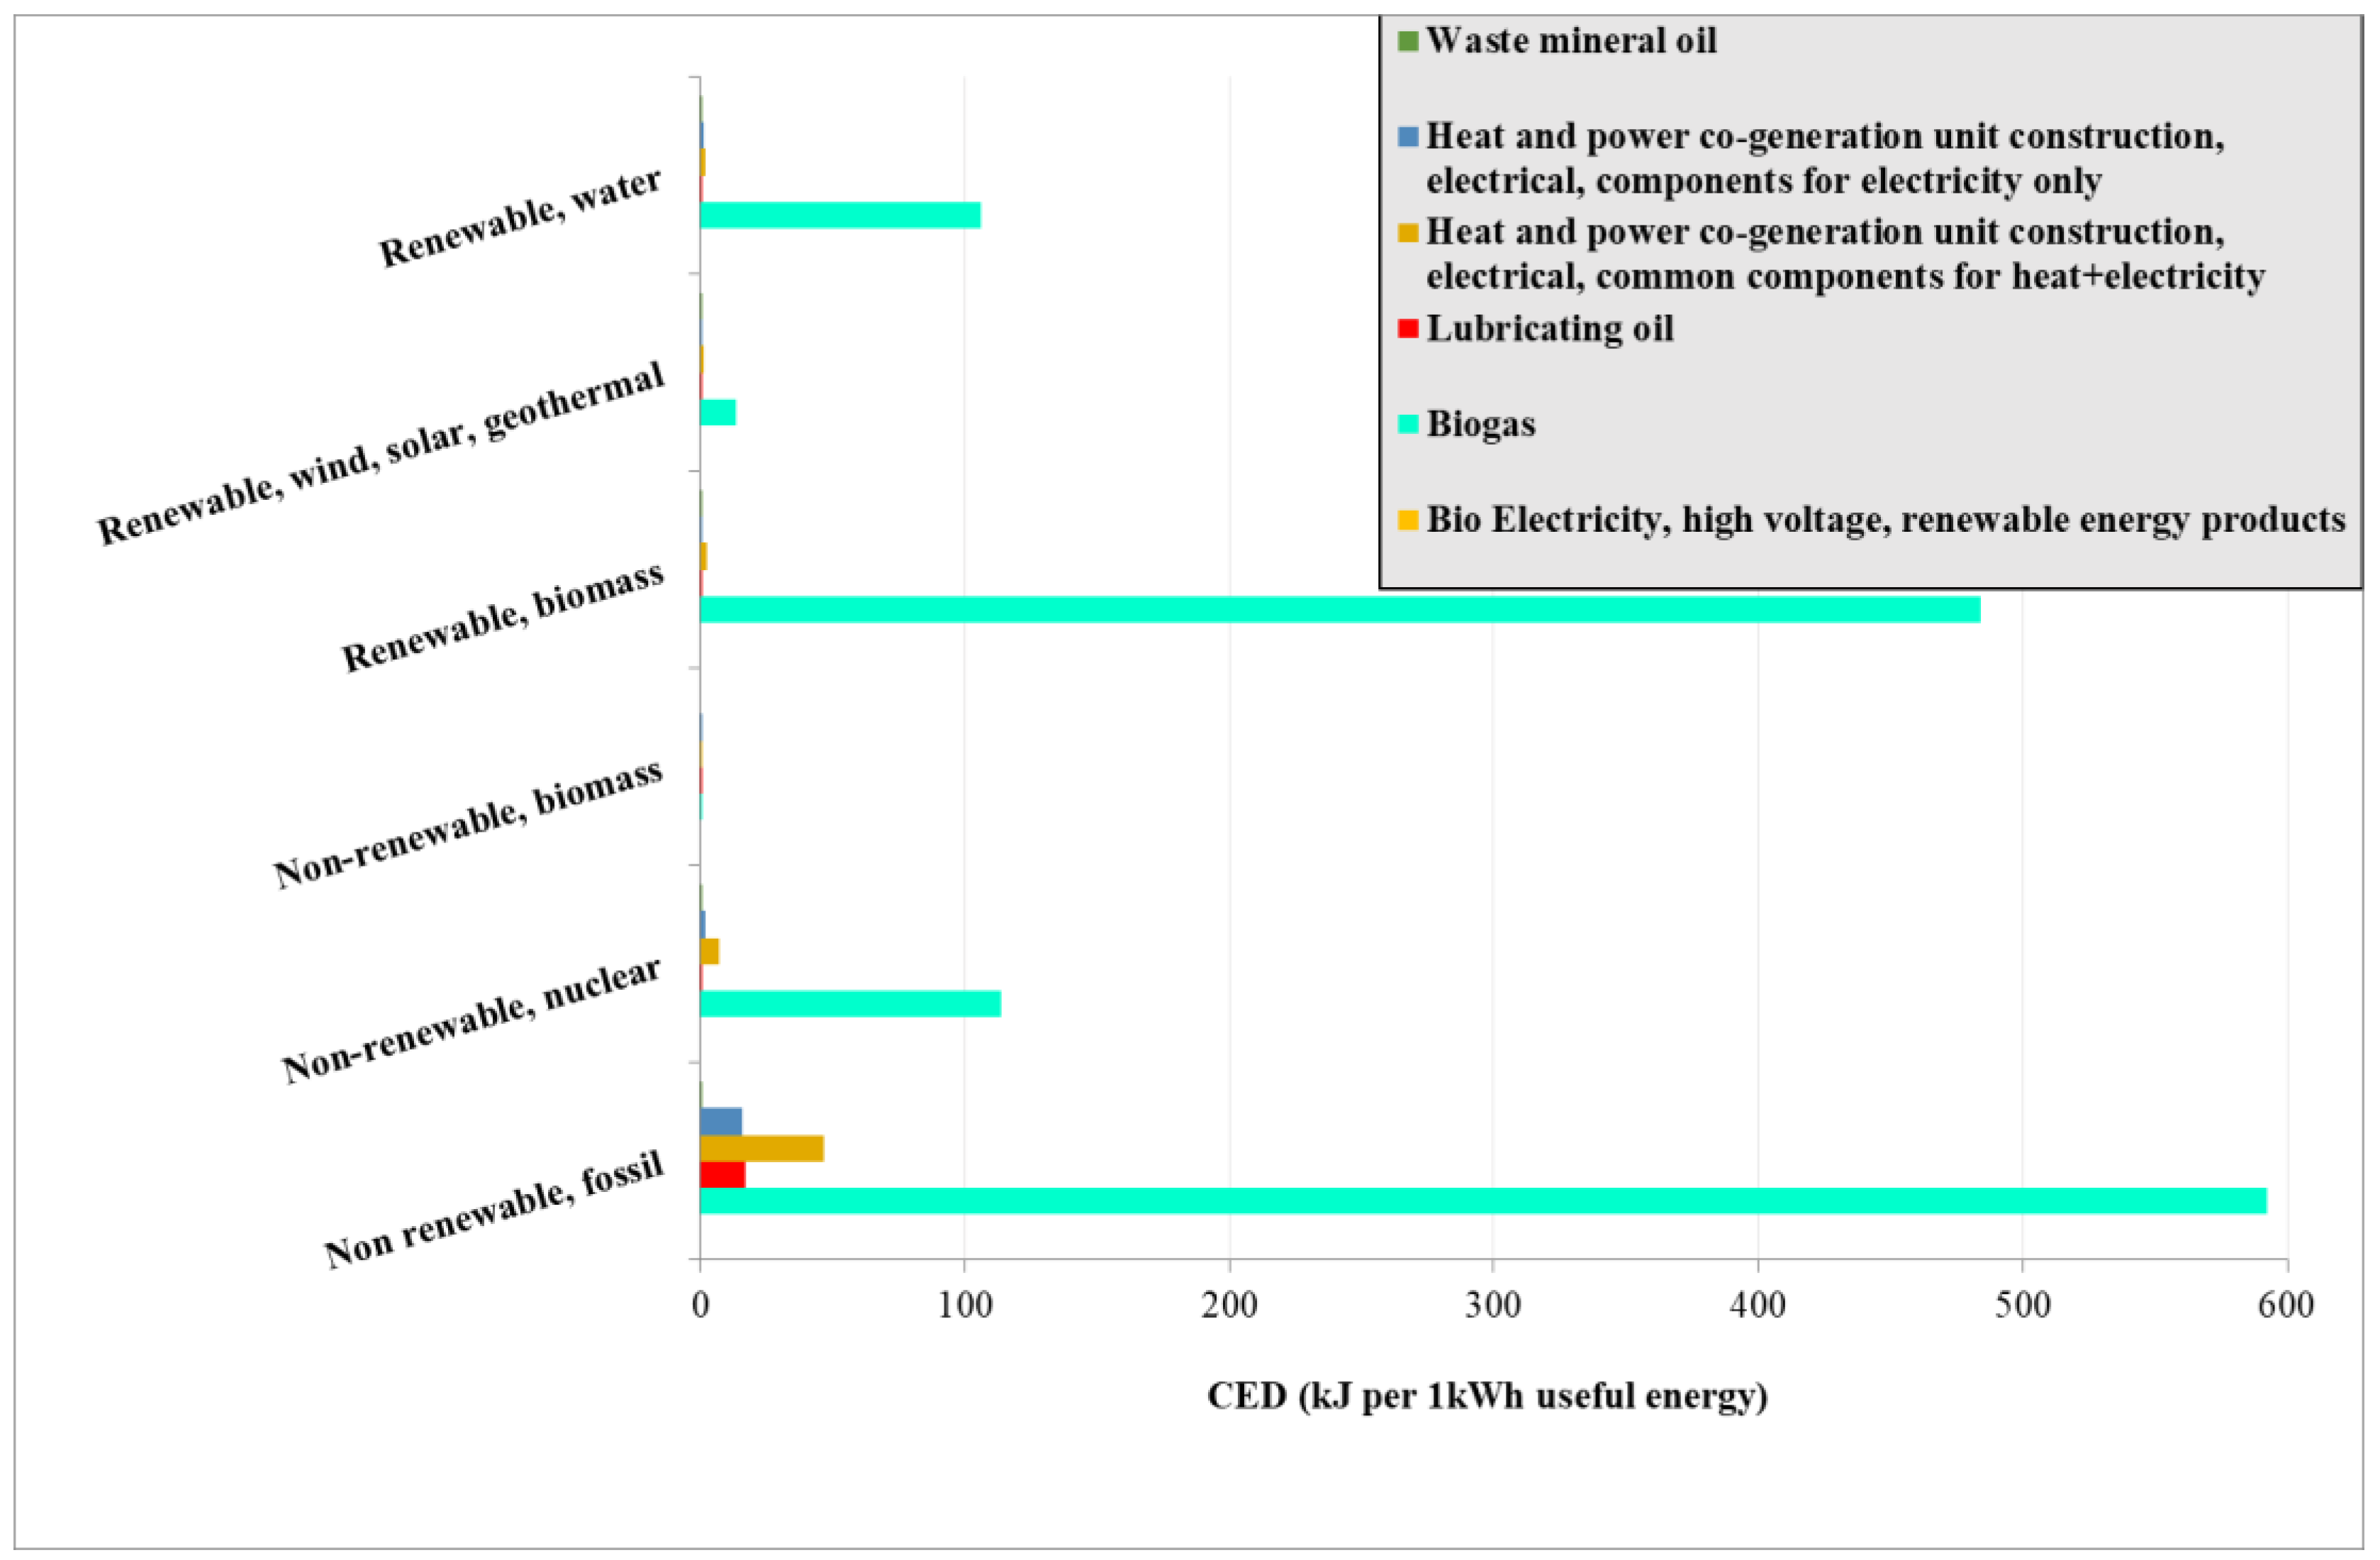
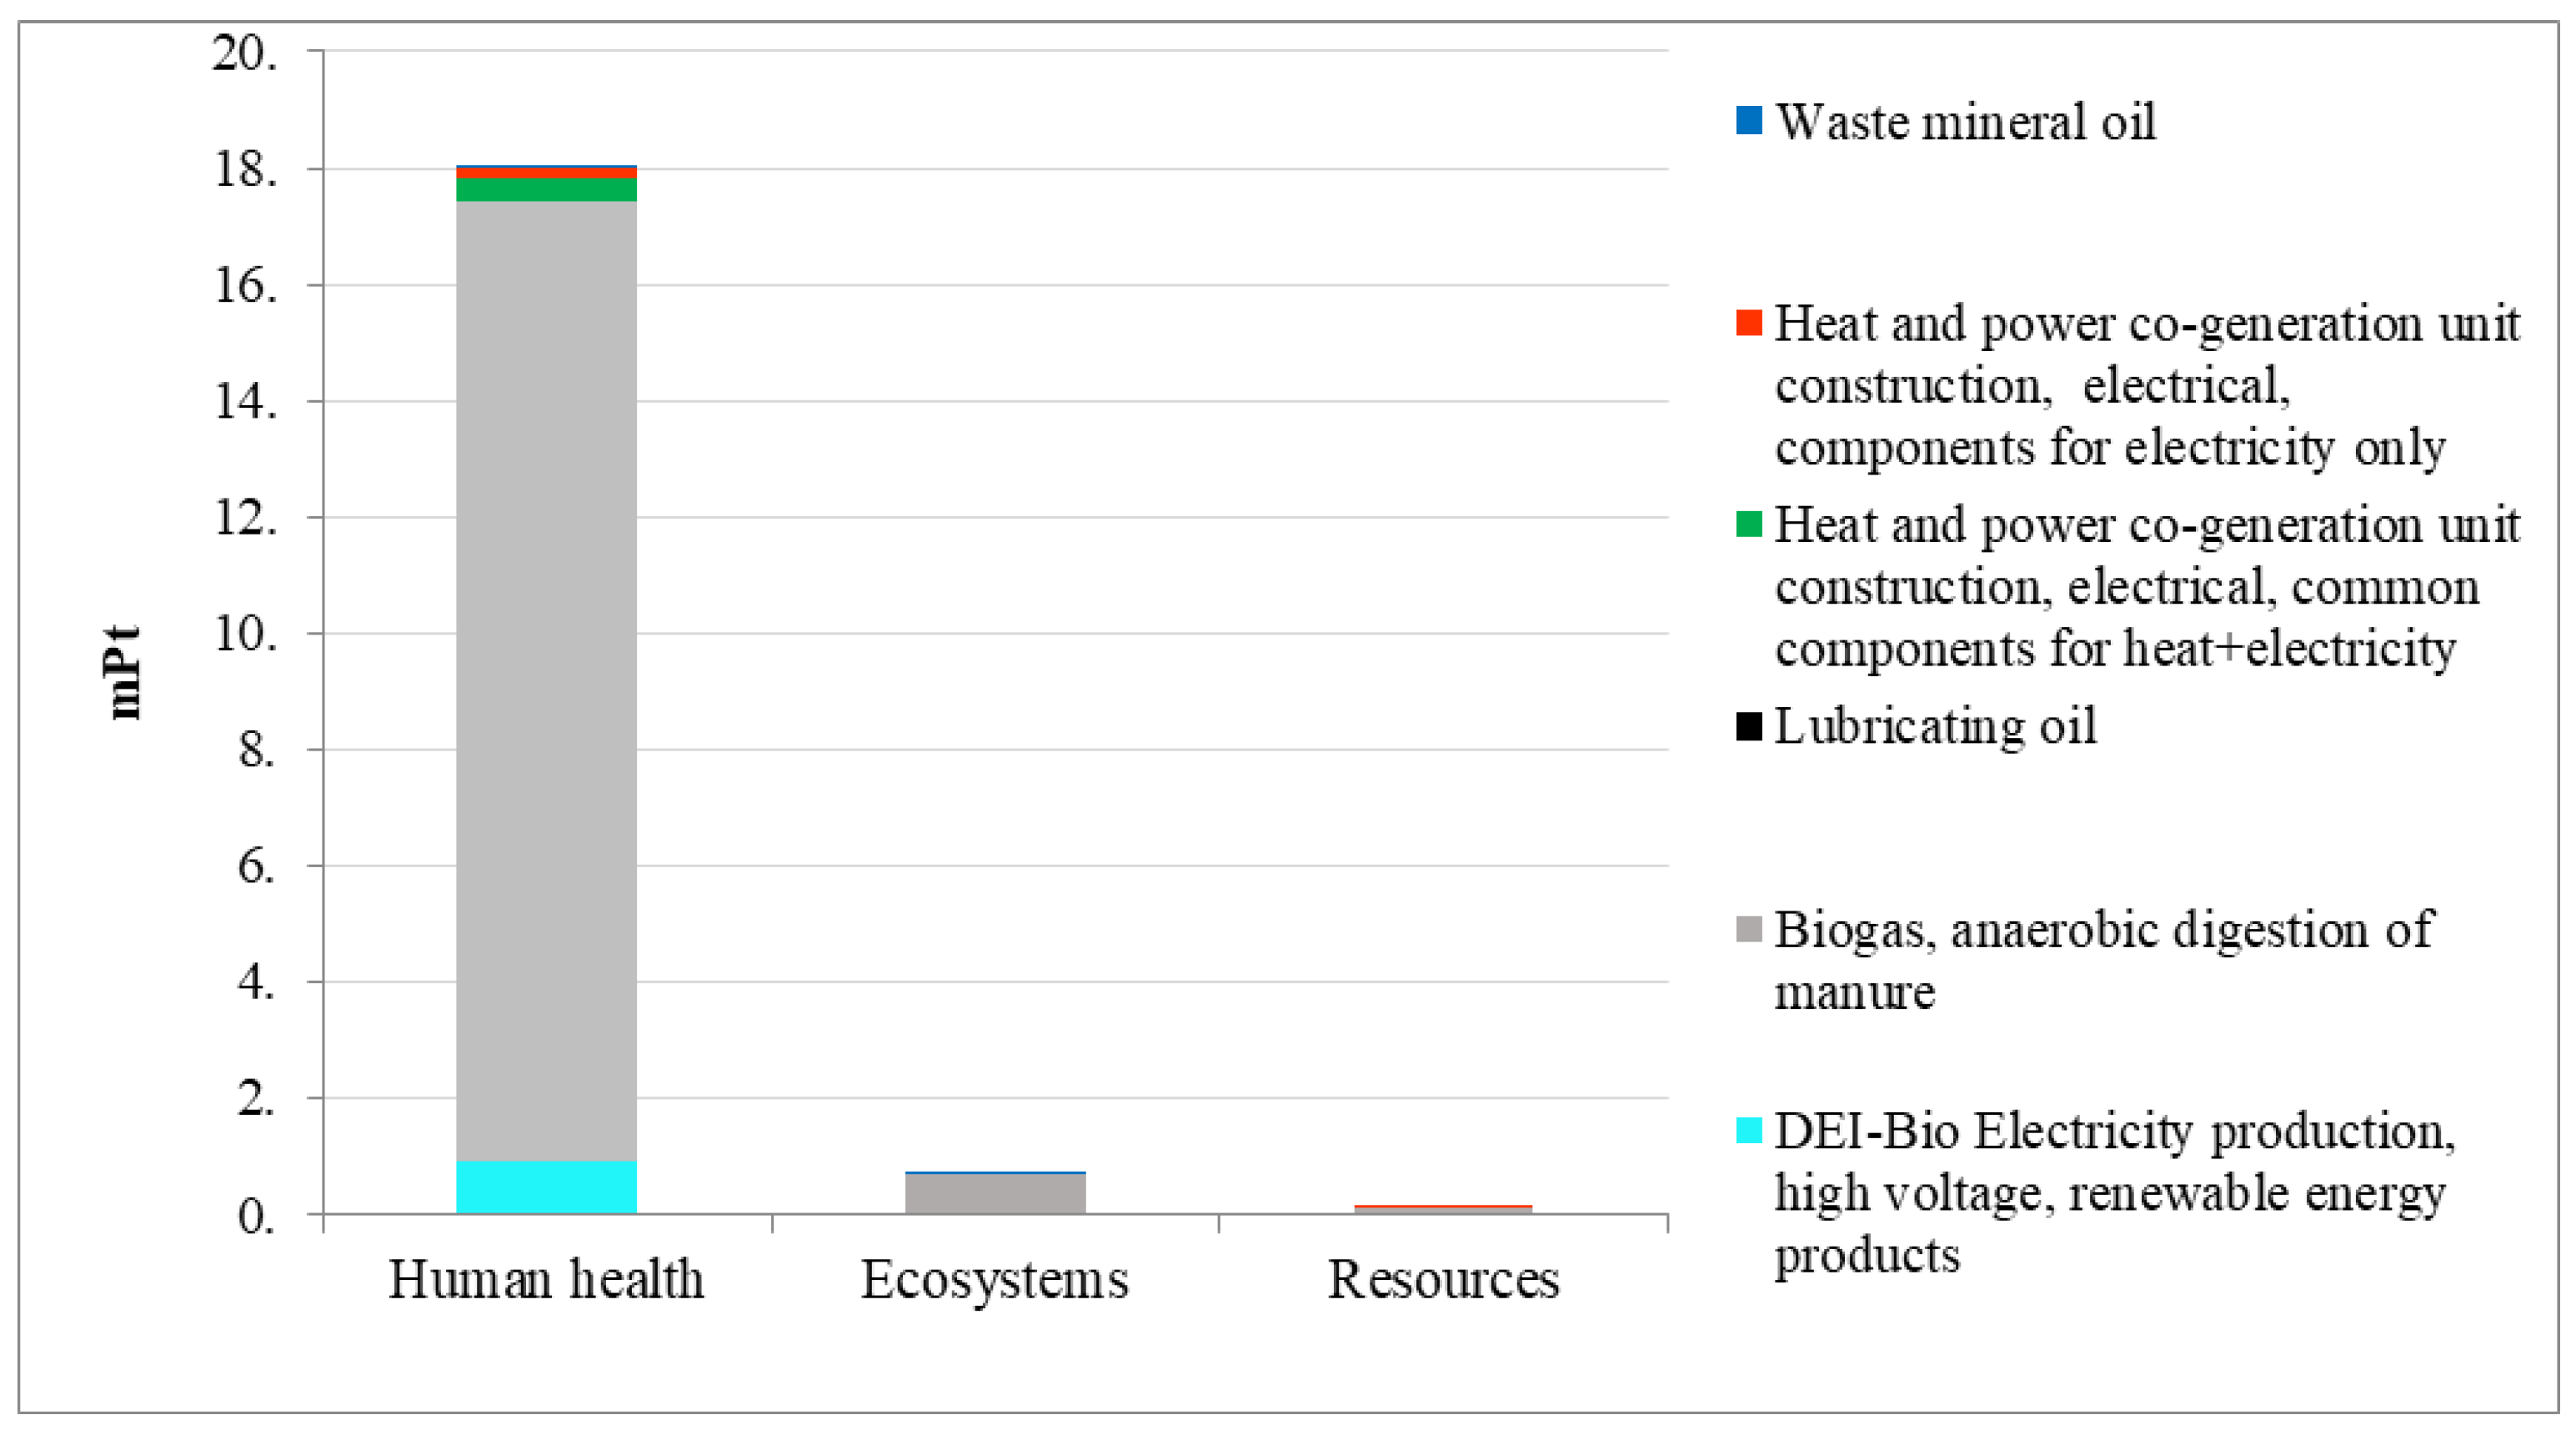
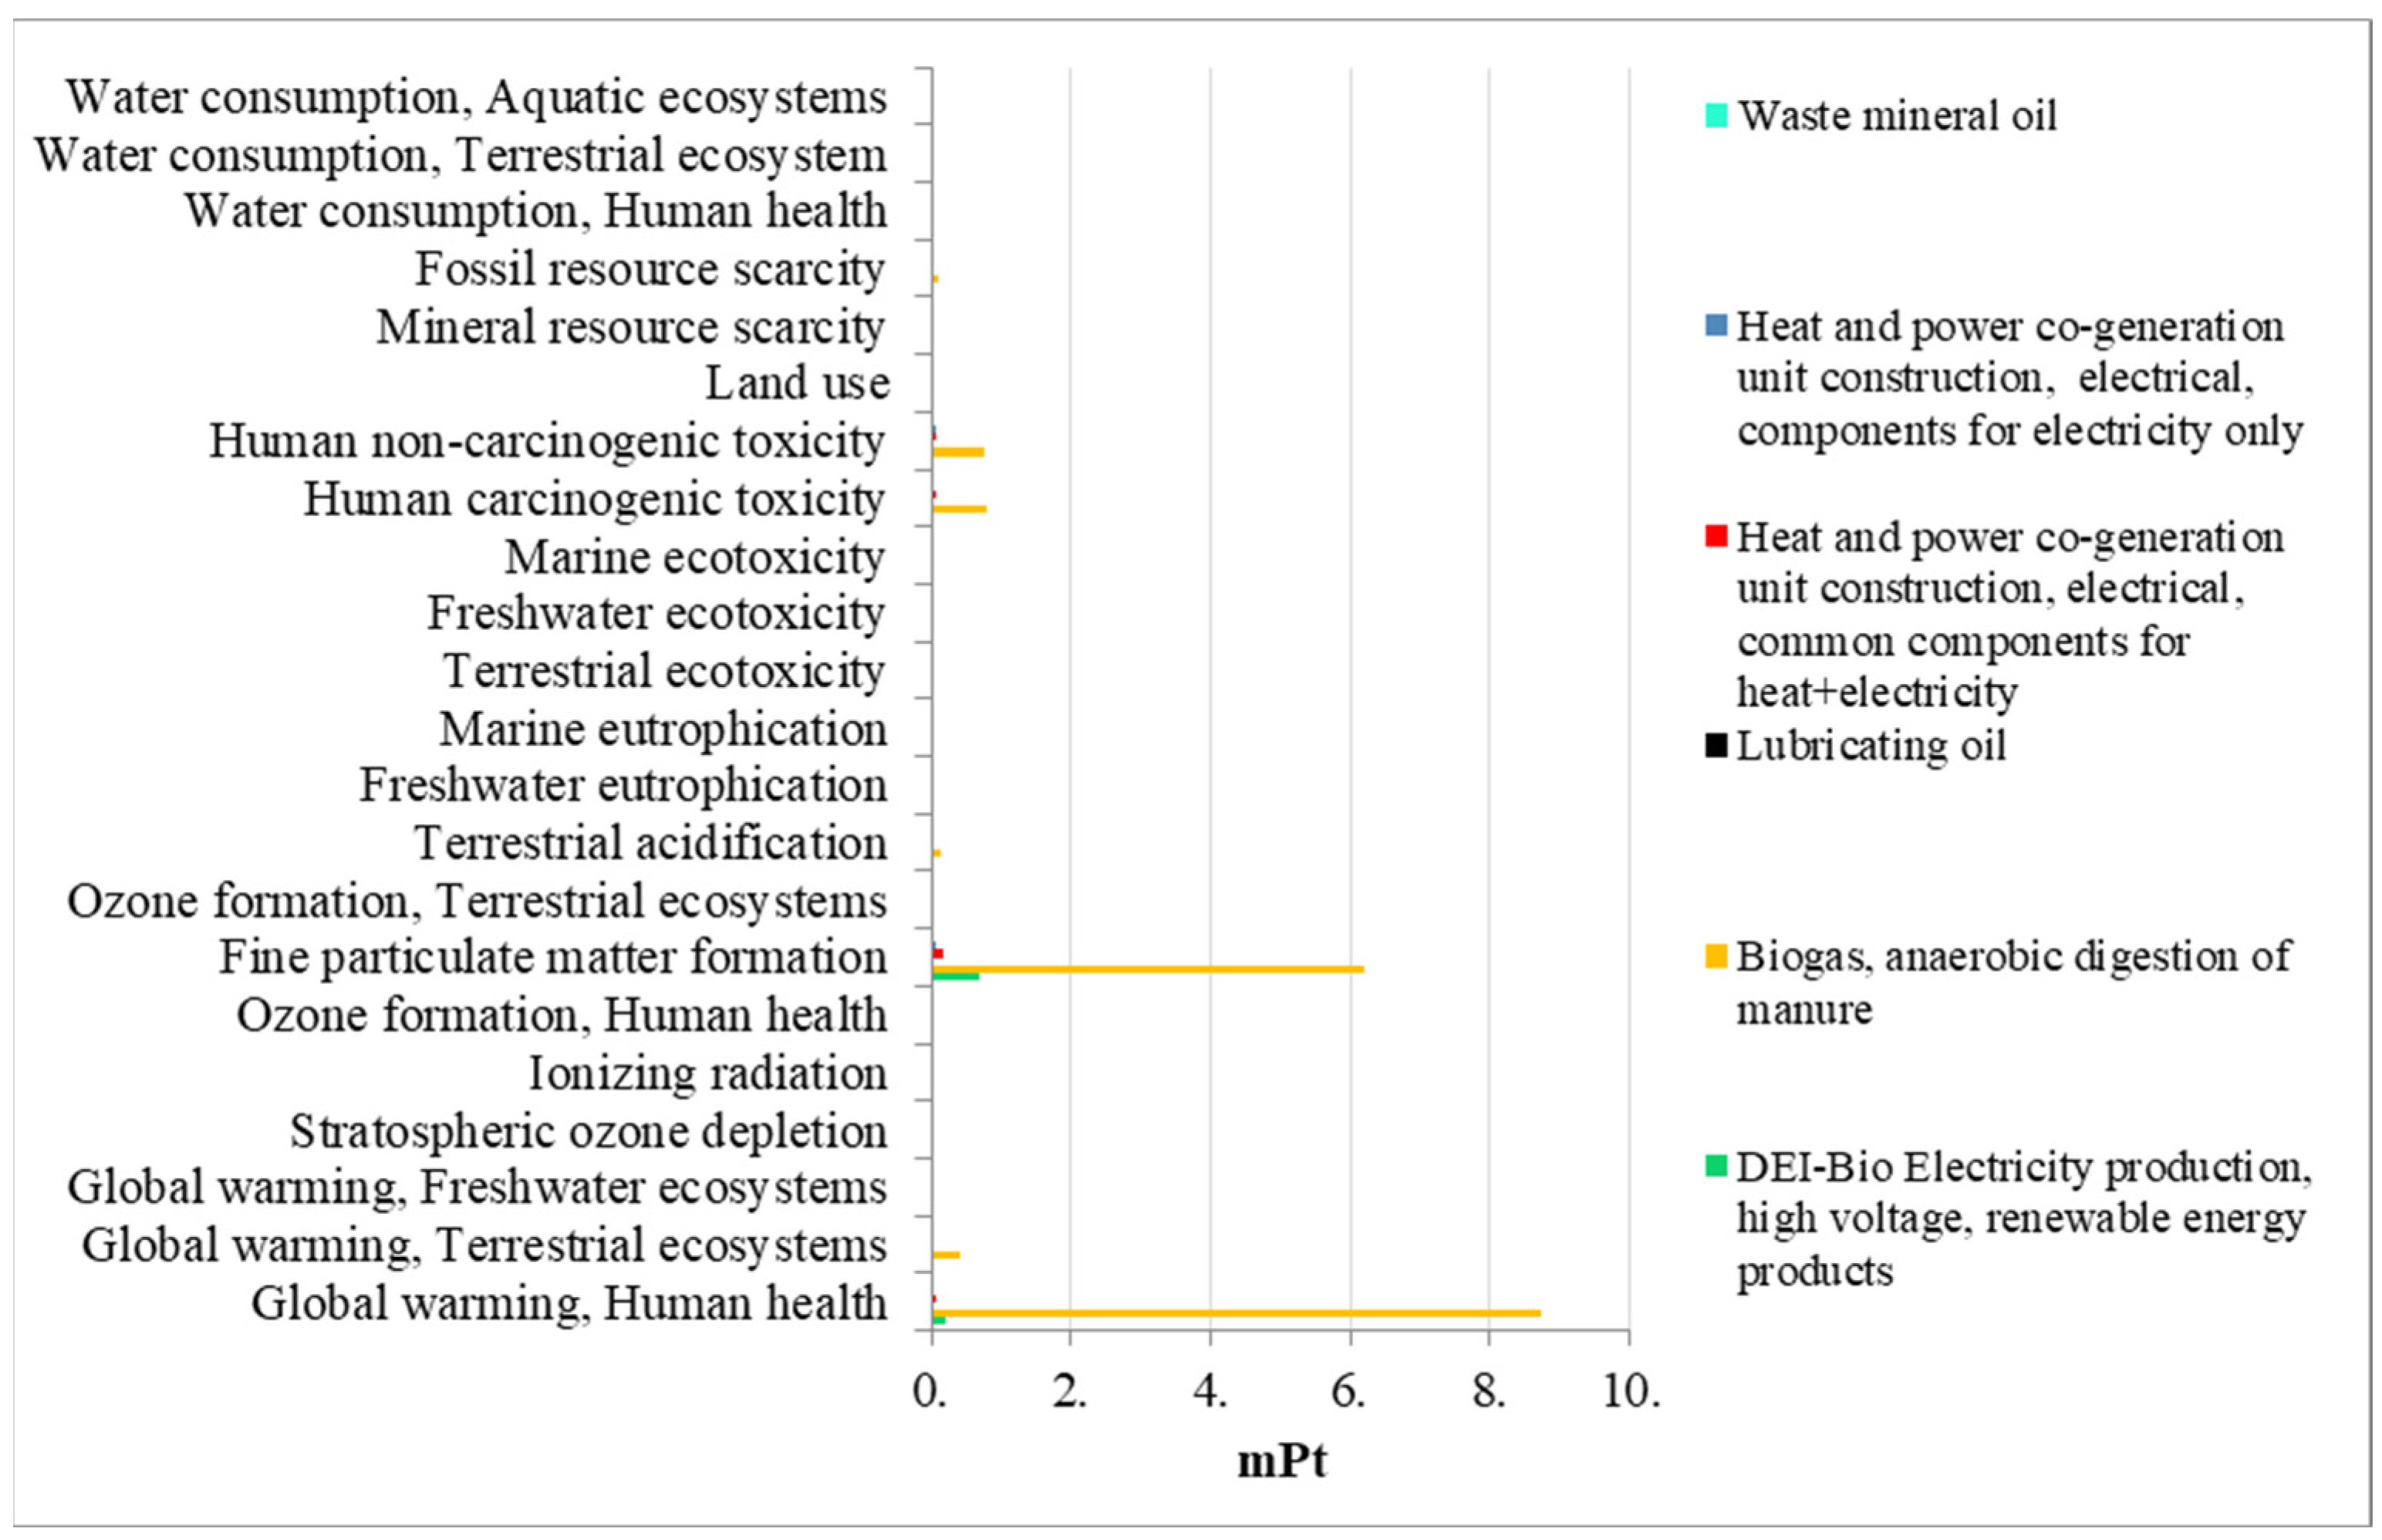
4.3.3. Environmental Impact Analysis

The environmental impact of biogas production can sometimes be underestimated. Figure 12 demonstrates the primary impact on human health through global warming, attributing significant environmental effects to the anaerobic digestion of manure and the release of GHG. In the process level endpoint damage, biogas splits almost evenly between the anaerobic digestion of manure (9 mPt) and biogas to electricity conversion (9 mPt), with very small contributions from feedstock handling or digestate processing. While biogas systems help reduce GHG emissions compared to traditional fossil fuels, they can also produce unwanted by-products such as hydrogen sulfide and ammonia, depending on the feedstock used [49], and can pose toxicity risks and pollution challenges if not adequately managed during the production process [50]. Figure 13 highlights the concerns regarding fine particulate matter and toxins, stressing their implications for air quality and public health.

4.4. Comparative Summary and Suitability

Each system demonstrates distinct advantages aligned with specific sustainability goals. Solar thermal and PV systems stand out for their extremely low GHG emissions during operation, although both require significant energy input during component manufacturing, particularly for batteries and heat exchangers, as discussed in previous sections. Biogas systems, while relying on consistent organic feedstock, offer the unique advantage of converting waste into usable energy and fertilizers, effectively contributing to a circular economy. However, the presence of gas impurities and the complexity of anaerobic digestion require careful design and operational controls.
Table 4 encapsulates the comparative summary with key environmental and technical characteristics of the three renewable energy systems.
It shows that solar thermal offers the lowest cradle-to-grave emissions and damage scores, making it ideal for rural/off-grid electrification. Solar thermal excels for steady heat supply but carries higher embodied energy and modest GHG. Biogas provides dispatchable power and waste valorization, with moderate CED and life cycle damage driven by methane and digestion emissions.
Based on the analysis and discussion, it can be recommended since the solar thermal systems are particularly well-suited for industrial or institutional facilities in high solar irradiance regions (e.g., Africa, Middle East, India, South America, etc.), where there is consistent sunlight and a significant demand for process heat or space heating. They are ideal for applications like solar cooking, water heating, and pre-heating boilers in industries.
Solar PV systems, on the other hand, are highly effective in off-grid rural areas or remote islands where extending the electricity grid is economically unfeasible (e.g., Sub-Saharan Africa or remote villages in Northeast India). Their modularity and decreasing costs make them attractive for home electrification and telecom towers. However, the results should be interpreted as typical technology baselines for sunny temperate regions. In extremely arid zones with high dust loads or in high-tech waste management economies, midpoint scores for water consumption and end of life processing may differ.
Biogas systems are most relevant in agrarian or livestock-dense regions (e.g., Denmark, Netherlands, rural Punjab, or the midwestern United States, etc.) where large quantities of organic waste are available. They can be used for cooking fuel, electricity generation, and organic fertilizer production, creating a circular economy around farm and municipal waste.

Impact of End-of-Life Options on Endpoint Score

Table 5 summarizes the results for the BAS, OLR, and CLR. Moving from BAS to CLR cuts the panel’s endpoint score by 55% and the battery’s endpoint score by 58%.
Regarding hybrid technologies and storage, for rooftop PV, the main commercial storage options are Li-ion batteries for day-night shifting and small PEM electrolyzer that turn surplus power into green H2 (65% electrolyzer efficiency, 50% fuel-cell round-trip [51]. For solar-thermal, the lowest cost is an 8 h two-tank molten salt loop [52]. Upgraded biogas fired in a 20 kWe micro turbine can cover PV shortfalls; trials in India and the UAE keep grid quality with <10% rise in LCOE [53]. Ongoing PEM advances, higher temperature operation, and dynamic start-up are pushing efficiencies upward [54], underscoring the promise of PV-hydrogen and PV-biogas hybrids for reliable low-carbon power.

5. Conclusions

This study provides the life cycle assessment of solar–thermal, solar PV, and biogas systems on a common basis of 1 kWh of useful energy, combining cumulative energy demand and ReCiPe single-score results. The study concludes that manufacturing steps mirrored in CED by high fossil and biomass shares dominate endpoint impacts for all three systems, but the scale differs from approx. 1 mPt for solar–thermal, 72 mPt for PV, and 18 mPt for biogas, highlighting that battery intensive PV carries the largest single score burden despite near-zero operational emissions. However, the selection of an optimal system for a various area still greatly depends on their local context, infrastructure, policy support, and discussed trade-offs. Solar thermal suits industrial use in sunny regions like Africa, India, or South America, etc., for heating and cooking needs. Solar PV fits off-grid rural or remote areas due to low cost and modularity. Biogas systems are best suited in agrarian or livestock dense regions, converting organic waste into cooking fuel, electricity, and fertilizer, supporting sustainability and circular economy.

Author Contributions

Conceptualization, S.T., U.N.M. and V.K.; Methodology, S.T. and R.K.C.; Validation, S.T. and D.S.; Formal analysis, S.T. and U.N.M.; Investigation, S.T., D.S. and U.N.M.; Resources, D.S. and R.K.C.; Data curation, U.N.M.; Writing—original draft, S.T. and U.N.M.; Writing—review and editing, S.T., D.S., V.K. and R.K.C.; Visualization, U.N.M.; Supervision, V.K. and R.K.C.; Project administration, V.K. and R.K.C. All authors have read and agreed to the published version of the manuscript.

Funding

The publication charges for this article have been funded by a grant from the publication fund of UiT the Arctic University of Norway.

Institutional Review Board Statement

Not applicable.

Informed Consent Statement

Not applicable.

Data Availability Statement

The raw data supporting the conclusions of this article will be made available by the authors on request.

Acknowledgments

This research acknowledges the support by the DEVISE (ERA-Net_SES/106231) and PEERS (UTF 2020/10131) at UiT the Arctic University of Norway. The authors also acknowledge the support of G. S. Sailesh Babu, DEI Agra and IIT Roorkee for providing the study facilities.

Conflicts of Interest

Umair Najeeb Mughal was employed by Arctic Experts AS and was a part of DEVISE project. The remaining authors declare that the research was conducted in the absence of any commercial or financial relationships that could be construed as a potential conflict of interest.

Abbreviations

The following abbreviations are used in this manuscript:
CEDCumulative Energy Demand
LCALife Cycle Assessment
GHGGreenhouse Gas
CHPCombined Heat and Power
PVPhotovoltaic

Appendix A

Table A1. Selected Impact categories/Indicators and their relevance.
Impact Categories/Indicators Relevance
Global-warming potential—human health, freshwater, terrestrial (kg CO2-eq)Dominant climate-forcing emissions from component manufacture and biogas combustion.
Stratospheric ozone depletion (kg CFC-11-eq)Halocarbon use in inverter/BOS cooling and battery-pack HVAC.
Ionizing radiation (kBq Co-60-eq)Nuclear share in background electricity used for upstream silicon, steel and battery production.
Ozone formation—human health, terrestrial ecosystems (kg NOX-eq)NOX/VOC releases from high-temperature glass, steel and silicon processing.
Fine particulate-matter formation (kg PM2.5-eq)Combustion-related PM2.5 from metallurgical energy inputs; key driver of health damage scores.
Terrestrial acidification (kg SO2-eq)SO2 from coal- and oil-fired power that supplies metal smelting and module manufacture.
Freshwater eutrophication (kg P-eq)Phosphorus releases in mining tailings and potential digestate runoff.
Marine eutrophication (kg N-eq)Nitrogen emissions from upstream ammonia production and fertilizer manufacturing chains.
Terrestrial, freshwater, marine ecotoxicity (kg 1,4-DCB-eq)Metal leaching and solvent use in PV, battery and digester construction.
Human carcinogenic/non-carcinogenic toxicity (kg 1,4-DCB-eq)Exposure risks from Co, Ni, Pb and solvent residues in batteries and electronics.
Land use (m2·yr crop-eq)Ground-mount PV area and biomass cropping for digester feedstock.
Mineral resource scarcity (kg Cu-eq)Depletion of Al, Si, Li, Co, Ni, Cu and rare metals in concentrators, modules and batteries.
Fossil resource scarcity (kg oil-eq)Non-renewable primary energy still required for all upstream manufacturing stages.
Water consumption—human health, aquatic, terrestrial (m3)Cooling water for silicon/steel production and periodic panel-washing.

References

  1. Saleh, H.M.; Hassan, A.I. The Challenges of Sustainable Energy Transition: A Focus on Renewable Energy. Appl. Chem. Eng. 2024, 7, 2084. [Google Scholar] [CrossRef]
  2. Yasmeen, H.; Zameer, H. Dynamics of Energy Transition and Climate Actions on Sustainable Cities: A Cross Country Comparison of East Asia and Pacific. Rev. Dev. Econ. 2024, 28, 1319–1344. [Google Scholar] [CrossRef]
  3. Doļģe, K.; Blumberga, D. From Targets to Action: Analyzing the Viability of REPowerEU in Achieving Energy Sustainability. E3S Web Conf. 2023, 433, 03003. [Google Scholar] [CrossRef]
  4. Kodirov, D.; Muratov, K.; Tursunov, O.; Ugwu, E.I.; Durmanov, A. The Use of Renewable Energy Sources in Integrated Energy Supply Systems for Agriculture. Iop Conf. Ser. Earth Environ. Sci. 2020, 614, 012007. [Google Scholar] [CrossRef]
  5. Pappas, C.; Karakosta, C.; Marinakis, V.; Psarras, J. A comparison of electricity production technologies in terms of sustainable development. Energy Convers. Manag. 2012, 64, 626–632. [Google Scholar] [CrossRef]
  6. Sharma, V.K.; Singh, R.; Gehlot, A.; Buddhi, D.; Braccio, S.; Priyadarshi, N.; Khan, B. Imperative Role of Photovoltaic and Concentrating Solar Power Technologies Towards Renewable Energy Generation. Int. J. Photoenergy 2022, 2022, 3852484. [Google Scholar] [CrossRef]
  7. Islam, S.M.; Ferdous, S.A.; Bhuyan, A.; Sultana, S.M.; Sarker, S.; Jamal, T. A Techno-Economic Investigation on Hydrogen Utilization as a Long-Term Energy Storage Solution for Microgrids. In Proceedings of the 2021 6th International Conference on Development in Renewable Energy Technology (ICDRET), Dhaka, Bangladesh, 28–30 December 2021. [Google Scholar] [CrossRef]
  8. Dawood, F.; Shafiullah, G.M.; Anda, M. Stand-Alone Microgrid With 100% Renewable Energy: A Case Study with Hybrid Solar PV-Battery-Hydrogen. Sustainability 2020, 12, 2047. [Google Scholar] [CrossRef]
  9. Saad, N.M.; Sujod, M.Z.; Ming, L.H.; Abas, M.F.; Jadin, M.S.; Ishak, M.R.; Abdullah, N.R.H. Impacts of Photovoltaic Distributed Generation Location and Size on Distribution Power System Network. Int. J. Power Electron. Drive Syst. 2018, 9, 905. [Google Scholar] [CrossRef]
  10. Lim, S.-C.; Huh, J.H.; Hong, S.-H.; Park, C.-Y.; Kim, J.-C. Solar Power Forecasting Using CNN-LSTM Hybrid Model. Energies 2022, 15, 8233. [Google Scholar] [CrossRef]
  11. Kabeyi, M.J.B.; Olanrewaju, O.A. Biogas Production and Applications in the Sustainable Energy Transition. J. Energy 2022, 2022, 1–43. [Google Scholar] [CrossRef]
  12. Kurşun, B. Production and Utilization Stage Analysis of Biogas: Case of IZAYDAS Plant. Marmara Fen Bilim. Derg. 2018, 30, 111–118. [Google Scholar] [CrossRef]
  13. Zhou, B.; Xu, D.; Li, C.; Chung, C.Y.; Cao, Y.; Chan, K.W.; Wu, Q. Optimal Scheduling of Biogas–Solar–Wind Renewable Portfolio for Multicarrier Energy Supplies. IEEE Trans. Power Syst. 2018, 33, 6229–6239. [Google Scholar] [CrossRef]
  14. Chang, C.C.; Do, M.V.; Hsu, W.L.; Liu, B.-L.; Chang, C.Y.; Chen, Y.H.; Yuan, M.-H.; Lin, C.F.; Yu, C.-P.; Chen, Y.H.; et al. A Case Study on the Electricity Generation Using a Micro Gas Turbine Fuelled by Biogas from a Sewage Treatment Plant. Energies 2019, 12, 2424. [Google Scholar] [CrossRef]
  15. IEA-PVPS. Life-Cycle Assessment of Photovoltaic Systems: 2024 Update; IEA-PVPS Secretariat: Paris, France, 2024. [Google Scholar]
  16. International Renewable Energy Agency. Solar Thermal Energy—Technology Brief 2023; IRENA: Abu Dhabi, United Arab Emirates, 2023.
  17. MNRE. Biogas Power Generation and Thermal Application Programme—Revised Guidelines 2024; Government of India: New Delhi, India, 2024.
  18. Philipps, S.; Warmuth, W. Photovoltaics Report; Fraunhofer-Institut für Solare Energiesysteme ISE & PSE Projects GmbH: Freiburg, Germany, 2024. [Google Scholar]
  19. Cummins, I. QSK19G Series Biogas Generator Set—Technical Datasheet; Cummins Inc.: Columbus, IN, USA, 2023. [Google Scholar]
  20. ISO 14044: 2006 + A1:2020; Environmental Management—Life-Cycle Assessment—Requirements and Guidelines. International Organization for Standardization: Geneva, Switzerland, 2020.
  21. Fraunhofer ISE. Battery Lifetime Analysis Under Real-World Cycling: 2024 Update; Fraunhofer ISE: Freiburg, Germany, 2024. [Google Scholar]
  22. BYD. B-Box LV Battery System—Installation and User Manual, Rev. 2024-03; BYD: Shenzhen, China, 2024. [Google Scholar]
  23. ISO 14044: 2006; Environmental Management—Life Cycle Assessment—Principles and Framework. ISO: Geneva, Switzerland, 2006.
  24. SimaPro. SimaPro Database Manual—Methods Library; PRé Sustainability: Amersfoort, The Netherlands, 2020. [Google Scholar]
  25. Ecoinvent, A. Ecoinvent Database, version 3.9.1; Ecoinvent Association: Zurich, Switzerland, 2022. [Google Scholar]
  26. Huijbregts, M.A.J.; Steinmann, Z.J.N.; Elshout, P.M.F.; Stam, G.; Verones, F.; Vieira, M.D.M.; Hollander, A.; Zijp, M.; van Zelm, R. ReCiPe 2016 v1.08: A Harmonized Life Cycle Impact Assessment Method at Midpoint and Endpoint Level; RIVM Report 2016-0104a; National Institute for Public Health and the Environment (RIVM): Bilthoven, The Netherlands, 2016.
  27. RenewSys India Pvt. Ltd. PV-Glass Recycling Plant: Press Release and Technical Overview; RenewSys: Hyderabad, India, 2023. [Google Scholar]
  28. Attero CleanTech Pvt. Ltd. Li-Ion Battery Hydrometallurgical Recycling Facility—Capacity Statement; Attero CleanTech: Noida, India, 2024. [Google Scholar]
  29. MoEfcc. Draft E-Waste (Management) Rules, 2024; MoEfcc: New Delhi, India, 2024.
  30. Kalidoss, P.; Venkatachalapathy, S.; Suresh, S. Optical and Thermal Properties of Therminol 55-TiO2 Nanofluids for Solar Energy Storage. Int. J. Photoenergy 2020, 2020, 7085497. [Google Scholar] [CrossRef]
  31. Attar, I.; Naïli, N.; Farhat, A. A Heating System Using Flat Plate Collectors to Control the Inside Greenhouse Microclimate in Tunisia. J. Renew. Energ. 2023, 15, 547–559. [Google Scholar] [CrossRef]
  32. Crespo, B.; Cavanaugh, C.; Potter, A.; Yaniger, S.; Gaustad, G.; Wilkinson, C.J. Technoeconomic Feasibility of Photovoltaic Recycling. Int. J. Appl. Glass Sci. 2024, 15, 381–390. [Google Scholar] [CrossRef]
  33. Zeng, Q.; Lai, Y.; Jiang, L.; Liu, F.; Hao, X.; Wang, L.; Green, M.A. Integrated Photorechargeable Energy Storage System: Next-Generation Power Source Driving the Future. Adv. Energy Mater. 2020, 10, 1903930. [Google Scholar] [CrossRef]
  34. Essak, L.; Ghosh, A. Floating Photovoltaics: A Review. Clean Technol. 2022, 4, 752–769. [Google Scholar] [CrossRef]
  35. Urbina, A. Sustainability of Photovoltaic Technologies in Future Net-zero Emissions Scenarios. Prog. Photovolt. Res. Appl. 2022, 31, 1255–1269. [Google Scholar] [CrossRef]
  36. Lennon, A.; Lunardi, M.M.; Hallam, B.; Dias, P. The Aluminium Demand Risk of Terawatt Photovoltaics for Net Zero Emissions by 2050. Nat. Sustain. 2022, 5, 357–363. [Google Scholar] [CrossRef]
  37. Shrestha, N.; Zaman, A. Decommissioning and Recycling of End-of-Life Photovoltaic Solar Panels in Western Australia. Sustainability 2024, 16, 526. [Google Scholar] [CrossRef]
  38. Aichberger, C.; Jungmeier, G. Environmental Life Cycle Impacts of Automotive Batteries Based on a Literature Review. Energies 2020, 13, 6345. [Google Scholar] [CrossRef]
  39. Boussaa, S.A.; Benkrid, A.; Boutarek, N.; Ayachi, M. End of Life Silicon Based Photovoltaic Panels: A Review. J. Renew. Energ. 2020, 23, 201–216. [Google Scholar] [CrossRef]
  40. Akhter, M.S.; Mansur, A.A.; Islam, M.I.; Lipu, M.S.H.; Karim, T.F.; Abdolrasol, M.G.M.; Alghamdi, T.A.H. Sustainable Strategies for Crystalline Solar Cell Recycling: A Review on Recycling Techniques, Companies, and Environmental Impact Analysis. Sustainability 2024, 16, 5785. [Google Scholar] [CrossRef]
  41. Omar, A.; Seilkhan, Z.; Bissembayeva, G.; González-Rodríguez, O.; Rojas–Solórzano, L. The Circular Economy Approach to Evaluating End-of-life Cost Alternatives of Solar PV Panels: The Case of Burnoye-1, Kazakhstan. Environ. Prog. Sustain. Energy 2022, 42, e13948. [Google Scholar] [CrossRef]
  42. Madrigal, A.N.; Iyer-Raniga, U.; Yang, R.L. Exploring Design Thinking Processes in Circular Economy Strategies for PV Waste Management in Australia. Iop Conf. Ser. Earth Environ. Sci. 2024, 1363, 012051. [Google Scholar] [CrossRef]
  43. Lunardi, M.M.; Alvarez–Gaitan, J.P.; Bilbao, J.I.; Corkish, R. Comparative Life Cycle Assessment of End-of-Life Silicon Solar Photovoltaic Modules. Appl. Sci. 2018, 8, 1396. [Google Scholar] [CrossRef]
  44. Farghali, M.; Osman, A.I.; Umetsu, K.; Rooney, D.W. Integration of biogas systems into a carbon zero and hydrogen economy: A review. Environ. Chem. Lett. 2022, 20, 2853–2927. [Google Scholar] [CrossRef]
  45. Kamiluddin, M.M.; Budianto, E.; Frimawaty, E. The Financial Analysis for the Advisability of the Biogas Project from Cattle Manure in Household Scale. E3S Web Conf. 2018, 74, 03004. [Google Scholar] [CrossRef]
  46. Barbosa, D.B.P.; Nabel, M.; Jablonowski, N.D. Biogas-Digestate as Nutrient Source for Biomass Production of Sida Hermaphrodita, Zea mays L. and Medicago sativa L. Energy Procedia 2014, 59, 120–126. [Google Scholar] [CrossRef]
  47. Dasí-Crespo, D.; Carcerller-Toselli, A.; Blay, C.R.; Escrivá-Escrivà, G.; Porta, C.R. Design and Implementation of a Biogas Pilot Plant for Bioaugmentation Strategies in a Rural Municipality. Renew. Energy Power Qual. J. 2024, 22, 17–22. [Google Scholar] [CrossRef] [PubMed]
  48. Porta, C.R.; Blay, C.R.; Dasí-Crespo, D.; Escrivá-Escrivà, G. Optimising a Biogas and Photovoltaic Hybrid System for Sustainable Power Supply in Rural Areas. Appl. Sci. 2023, 13, 2155. [Google Scholar] [CrossRef]
  49. Li, Y.; Alaimo, C.P.; Kim, M.; Kado, N.Y.; Peppers, J.; Xue, J.; Wan, C.; Green, P.G.; Zhang, R.; Jenkins, B.M.; et al. Composition and Toxicity of Biogas Produced from Different Feedstocks in California. Environ. Sci. Technol. 2019, 53, 11569–11579. [Google Scholar] [CrossRef] [PubMed]
  50. Paolini, V.; Petracchini, F.; Segreto, M.; Tomassetti, L.; Naja, N.; Cecinato, A. Environmental Impact of Biogas: A Short Review of Current Knowledge. J. Environ. Sci. Health Part A 2018, 53, 899–906. [Google Scholar] [CrossRef] [PubMed]
  51. Wang, T.; Cao, X.; Jiao, L. PEM Water Electrolysis for Hydrogen Production: Fundamentals, Advances, and Prospects. Carbon Neutrality 2022, 1, 21. [Google Scholar] [CrossRef]
  52. Gantenbein, A.; Kröcher, O.; Biollaz, S.M.; Schildhauer, T.J. Techno-Economic Evaluation of Biological and Fluidised-Bed Based Methanation Process Chains for Grid-Ready Biomethane Production. Front. Energy Res. 2022, 9, 775259. [Google Scholar] [CrossRef]
  53. Uday, V.; Jogwar, S.S. Optimal Design of an Integrated Biogas-Based Fuel Cell System. Ind. Eng. Chem. Res. 2024, 63, 4496–4508. [Google Scholar] [CrossRef]
  54. Liu, J.; Huang, L.; Leveneur, J.; Fiedler, H.; Clarke, S.; Larsen, T.; Kennedy, J.; Taylor, M.P. Experimental Investigation of PEM Water Electrolyser Stack Performance Under Dynamic Operation Conditions. J. Electrochem. Soc. 2024, 171, 054521. [Google Scholar] [CrossRef]
Figure 1. System boundaries and processes.
Applsci 15 08082 g001
Figure 2. Solar thermal units @ IIT Roorkee.
Applsci 15 08082 g002
Figure 3. (a) Solar PV system, (b) fixed dome biogas plant @ DEI Agra.
Applsci 15 08082 g003
Figure 4. Integrated energy vector layout for renewable systems at IIT Roorkee and DEI Agra.
Applsci 15 08082 g004
Figure 5. CED of solar thermal energy system at IIT Roorkee.
Applsci 15 08082 g005
Figure 6. Endpoint environmental impact analysis (ReCiPe 2016) for solar thermal energy system at IIT Roorkee.
Applsci 15 08082 g006
Figure 7. Midpoint environmental impact analysis (ReCiPe 2016) for solar thermal energy system at IIT Roorkee.
Applsci 15 08082 g007
Figure 8. CED of solar photovoltaic electricity at DEI Agra.
Applsci 15 08082 g008
Figure 9. Endpoint environmental impact analysis (ReCiPe 2016) for solar photovoltaic electricity at DEI Agra.
Applsci 15 08082 g009
Figure 10. Midpoint environmental impact analysis (ReCiPe 2016) for solar photovoltaic electricity at DEI Agra.
Applsci 15 08082 g010
Figure 11. CED of biogas-based electricity generation at DEI Agra.
Applsci 15 08082 g011
Figure 12. Endpoint environmental impact analysis (ReCiPe 2016) for biogas-based electricity generation at DEI Agra.
Applsci 15 08082 g012
Figure 13. Midpoint environmental impact analysis (ReCiPe 2016) for biogas-based electricity generation at DEI Agra.
Applsci 15 08082 g013
Table 1. Inventory parameters and uncertainty ranges.
ParameterSolar PV (150 kWp, BHEL 300 W)Solar-Thermal CPC (3.5 kW Dish)Biogas CHP (4 kWe)Data Source
Component lifetime (yr)252015O&M logs; [15,16,17]
Conversion efficiency17%42%32%On-site; [18,19]
Emission factor (g CO2-eq/kWh)60050200SimaPro Model Output
Allocation methodMass-based (mounting steel)Energy contentEnergy content[20]
Battery depth-of-discharge80%[21,22]
Table 2. Specifications of energy systems.
MetricElectricalThermal Storage SystemBiogas
SourceSolar Panel (300 W rated (BHEL))
A total of 150 kW generation is achieved according to operating conditions.
One Solar thermal Concentrator: 3.5 kW per Dish @1000 W/m2 Irradiation and 25 °C Ambient, Dish area: 4.4 m2
Base material: Steel
Receiver material: Aluminum (90 mm dia)
Cow dung 25 ton
Intermediate systems
a.
Hybrid inverter capacity—20 kW

Input
Grid—190–270v at 50 Hz
Solar maximum PV voltage (VOC)—600 v
Output
230 v @ 50 Hz
b.
150 kVA capacity

Input
3 phase 415 AC volts at 50 Hz
DC 240 volts, PV charger of 100 kW capacity,
Output
Peak load capacity—200 kW
Heat Exchanger: Liquid evaporator
Type: Plate heat exchanger
Fluid 1: Water
Fluid 2: Therminol
Efficiency: 90%
Insulated Intermediate pipe: Cast iron
Pressure drop: 1.25 kPa
The total weight (no connections): 4 kg
Biogas digester
150 m3 capacity
StorageBattery—
(i) Lithium-ion battery bank-
Rated power—20 kW
Rated voltage—240 VDC
Rated energy—48 kWh + 3%
(ii) Exide SG500 LM Tubular GEL Batteries of 2 Volts 250 AH
Thermal Energy storage
Type: Sensible thermalstorage system
Size: 2 m3 (200 L)
MOC: SS
Insulation material: glass wool
Capacity:32 MJ or 8.8 kWh (max storage temperature 200 °C
Min storage temp 110 °C
Storage media: Thermic Fluid Therminol 55

Portable Thermal Energy storage
Size: 04 m3 (40 L)
Insulation material: Aerogel (max storage temperature 180 °C
Min storage temp 40 °C
Storage media: Thermic Fluid Therminol 55
Biogas balloon
Max Volume—100 m3
Plan capacity of 50 m3
Total storage is 150 m3
Load100 kW for all classroomsSteam Cooking: Total steam required for cooking 8.5 kg (100 people per meal)
1 kwh = 1 kg steam Approx
Space heating: 3 kWh
5 kVA (4 kW) biogas generator
Rated current/phase at 100% load—18.50 Amp
1 m3 Biogas generates around 1.4 kWh
Table 3. CAPEX, O&M, and LCOE.
SystemCAPEX Items Amount (INR)LCOE (INR/kWh)
Solar PV (rooftop, 150 kWp, 300 W BHEL modules)500 × 300 W modules—3 × 50 kVA DSP Grid-Support Conditioners (inverters/UPS)—3 × 240 V, 150 Ah OPzS battery strings≈44.1 million (≈2.94 lakh/kWp)2.4
Solar-thermal CPC dish (3.5 kW, 4.4 m2 aperture)Steel paraboloid structure, aluminum receiver tube Ø 90 mm single-axis tracker and mount37,400 per dish (MNRE benchmark) to ≈2.8 lakh (hostel cooking system analogue)3.3
Biogas CHP set (pilot, 4 kWe)5 kVA biogas genset (Indo Engineering Works)90,0004.1
Digester balloon replacement (Ø: 7 m, H: 2 m)Thermoplastic membrane + fittings179,000
Table 4. Comparative summary of solar thermal, solar PV, and biogas systems.
MetricSolar ThermalSolar PVBiogas
GHG EmissionsModerate (0.6 kg CO2-eq/kWh)Very low (0.05 kg CO2-eq/kWh)Low-to-moderate (0.2 kg CO2-eq/kWh)
CED230 kJ primary/kWh21,700 kJ primary/kWh1406 kJ primary/kWh
Life cycle damage1.25 mPt/kWh72.45 mPt/kWh18.8 mPt/kWh
ReliabilityDependent on solar irradiance,
Storage needed for night or low sun.
Weather-dependent,
Battery backup helps, but adds cost.
Feedstock-dependent,
Consistent supply of organic waste required.
Pollutants and WasteMinimal direct emissions in operation,
Used Therminol fluid disposal.
Minimal direct emissions, E-waste from panel disposal.Methane leakage (high global warming potential),
H2S, NH3 in digestate; digestate reuse.
Table 5. Endpoint impact of three end-of-life scenarios.
ScenarioTreatment RoutePV Modules (mPt/kWh)Li-Ion Batteries (mPt/kWh)
BASEngineered landfill0.0310.012
OLRGlass- and aluminum-only recovery0.018 (−41%)
CLRFull hydrometallurgical recycling0.014 (−55%)0.005 (−58%)
Disclaimer/Publisher’s Note: The statements, opinions and data contained in all publications are solely those of the individual author(s) and contributor(s) and not of MDPI and/or the editor(s). MDPI and/or the editor(s) disclaim responsibility for any injury to people or property resulting from any ideas, methods, instructions or products referred to in the content.

