Featured Application
The presented approach may be applied in manufacturing firms that use superplastic materials to have information on the adopted materials.
Abstract
Superplastic materials are characterised by extreme lightness and remarkable ductility. Instead of a punch, a gas is used to push the sheet into the die cavity, and it is precisely regulated to control the material’s strain rate. Forming a superplastic material while maintaining a high strain rate sensitivity index requires the forming gas to follow a precise pressure–time loading curve. This can be excellently predicted with the aid of the finite element method (FEM). Therefore, for the superplastic material to exhibit its best formability throughout the entire process, it is necessary to control the strain rate step by step to keep the maximum strain rate within the material’s optimal superplastic range. In this work, the results of a superplastic-forming process used to create a hemispherical shell are presented. This was carried out using both a circular blank of uniform thickness and a blank with a conical cross-section. The analysis was performed using finite element modelling. Specifically, the results obtained using 3D analysis were compared with those obtained using axisymmetric analysis for conditions of axial symmetry. Using the conical cross-section blank helped achieve a more uniform thickness distribution in the produced hemispherical shell. The success of the numerical activity was validated through results from appropriate experimental work conducted on the magnesium alloy AZ31. The results show that, by employing a blank characterised by a conical section profile, the thickness distribution appears more uniform than that of a constant-thickness blank.
1. Introduction
This work contributes to advancements in manufacturing hemispherical shells by using lightweight metal sheets subjected to the superplastic-forming process. Generally, superplastic sheets are known to be formed under the action of a forming gas using the blow forming technique after the material has reached a high and constant temperature during the forming process [1].
Superplastic metal sheets are characterised by extreme lightness (typically, sheets made of titanium, aluminium or magnesium alloys with grain sizes on the order of 10 µm are used) and remarkable ductility (when subjected to specific forming conditions). Instead of a punch, a gas is used to push the sheet into the die cavity, and it is precisely regulated to control the material’s strain rate. The optimal strain rate for superplastic materials is generally very low, ranging between 10−3 and 10−5 s−1 [1]. At the same time, the sheet’s temperature must be high, reaching values above 0.5 Tm (where Tm is the material’s melting temperature in Kelvin). This temperature must be kept constant throughout the forming process [1].
In [2], concerning producing a component for the aerospace industry, two hemispherical shells were welded together from circular blanks of constant thickness, made of superplastic titanium alloy, to obtain a spherical product. The two half-shells, produced by superplastic forming, showed a non-uniform final thickness distribution. Specifically, the thickness distribution decreased from the edge to the pole of the two produced hemispherical shells. This distribution strongly depends on the material’s properties (particularly, on the material’s strain rate sensitivity index (m)). Therefore, to reduce thickness non-uniformity, operating with the highest values of m is necessary [1].
Forming a superplastic material while maintaining a high strain rate sensitivity index requires the forming gas to follow a precise pressure–time loading curve. This can be excellently predicted with the aid of the finite element method (FEM). Therefore, for the superplastic material to exhibit its best formability throughout the entire process, it is necessary to control the strain rate step by step to keep the maximum strain rate within the material’s optimal superplastic range.
Over time, several authors have highlighted the need to propose predictive or a posteriori techniques to determine the pressure–time curve. A method for calculating the pressure cycle that can be associated with a finite element code to simulate superplastic forming processes was considered in [3]. A method using a predictor–corrector algorithm that predicts/corrects a new pressure value based on a previously known value and on the material constitutive equation was presented in [4]. The optimal pressure–time curve was calculated by a simple linear interpolation of the pressure value obtained in the previous iteration steps [5]. To optimise the pressure–time curve, a microstructure-based constitutive model was used in [6]. The aim of the work was to proceed at an optimal strain rate to ensure uniform deformation and reduce the forming time. In [7], the finite element model developed to predict the optimal pressure–time curve was used to compare the performances of the 2D and 3D approaches. In [8], an original predictor–corrector algorithm interfaced to the finite element calculation code was presented to determine the optimal pressure–time curve. The employed algorithm allows for keeping the maximum strain rate as close as possible to the optimal strain rate value while reducing the forming times. In [9], an automatic pressure calculation algorithm was presented both to avoid sheet metal necking and to reduce the forming times.
It was shown in the literature that it is still possible to control the thickness of the formed product in an SPF process using the multi-phase forming technique; it requires that the process occurs in multiple phases: 1—pre-forming phase (using a pressurised gas or the action of a punch) of the blank at constant thickness with the task of preparing the sheet metal; 2—subsequent forming phases (the last phase occurs through the action of a pressurised gas). In [10], a two-stage approach was adopted that made the thickness distribution of cylindrical parts more uniform.
In [11,12,13,14], the influence of the pre-forming phase on the final thickness distribution of superplastic domes was analysed. In this case, different superplastic materials were used. In [15], it was shown that the multi-phase process does not bring improvements to the uniformity of the thicknesses if there is no contact between the sheet metal and the die.
The effect of the geometry of the pre-forming dies was analysed in [16]. In [17,18,19], the pre-forming process consisted of a hot drawing. Due to this process, the draw-in material feeds the material into the die cavity, making the subsequent superplastic-forming phase less aggressive. In [20], by means of a two-stage process, it was possible to reduce the thinning in the finished product, but the process was too long.
The long times required by the use of the multi-stage forming technique have shifted the research towards the use of blanks characterised by a variable thickness profile.
Some papers in the literature demonstrated that circular blanks with a variable thickness profile can achieve greater thickness uniformity in the half-shell. An analytical procedure characterised by simplified assumptions was proposed to make the thicknesses of a hemispherical dome uniform in [21]. On the contrary, in [22], numerical simulation coupled with an optimisation technique was used. The cases examined are related to both a hemispherical and a conical product. The optimal blank presented a thickness profile varying in a non-linear way. Similarly, in [23], the thickness profile of the blank presented a sigmoidal shape and was discontinuous. Also, in [24], by applying a reverse simulation approach, the thickness profile of the optimal blank resulted in varying in a non-linear way. In [25], the authors employed finite element modelling included in an automatic procedure guided by the multi-objective genetic algorithm MOGA-11. The case studies analysed are represented by a hemispherical dome and a frustum of a cone. The thickness profile of the optimal blank was found to vary according to a second-order polynomial function. In any case, however, the calculation times were very long (in the order of tens of hours). Based on some simplifying hypotheses, an optimal blank, in which the thickness profile varies linearly (conical thickness profile), was proposed in [2]. In [26,27], the authors showed that the sole reduction in the thickness of the blank in the peripheral region allowed for reaching greater breaking heights in a free forming test. The same authors, using a circular blank with thickness varying linearly between the pole and the edge of the sheet metal, were able to create a hemispherical product [28] and a product with a more complex geometry [29] characterised by a more uniform thickness distribution. They reduced both the forming time and the weight of the component.
A review on thickness control techniques in superplastic forming is reported in [30].
This work highlights that the finite element simulation results are independent of using a 3D scheme versus an axisymmetric 2D scheme. Furthermore, it suggests the opportunity to uniform the thickness distribution of the produced hemispherical shell by using a circular blank characterised by an initial conical thickness profile.
2. Materials and Methods
This work deals with superplastic materials that can undergo extremely large plastic deformation without breaking, typically elongating more than 200% (or twice their original length) at elevated temperatures. Their key characteristics are as follows: high ductility, fine, stable grain structure, slow strain rates, and low flow stress; they typically operate at high temperatures.
2.1. Forming Process of a Hemispherical Shell: 3D and 2D FEM Analysis
The superplastic forming process of a hemispherical shell was analysed using numerical simulation based on the finite element method. The analysis was carried out with reference to both shell elements (3D analysis) and axisymmetric elements (2D analysis) available in the commercial software MSC-MARC 2005. Using a 2D axisymmetric model allows for simplifying the finite element approach by reducing the involved elements of the mesh and the required simulation time. They are interchangeable for axisymmetric parts. The parameter used to compare the obtained results was the thickness distribution of the formed hemispherical shell.
In performing the comparison, the scheme shown in Figure 1 was used. Specifically, the blank consisted of a circular disc with a radius of 55 mm and an initial thickness of 1.0 mm. Since the forming process is assumed to occur at constant temperature, the problem addressed is simply mechanical in nature. The properties of the material to be deformed are related to the forming temperature.
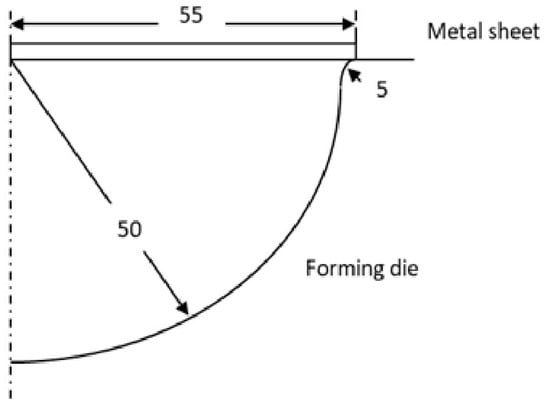
Figure 1.
Scheme of the superplastic forming process to obtain a hemispherical shell.
The analysis of superplastic forming problems requires the use of the rigid–plastic flow formulation. In this way, the material assumes a perfectly plastic behaviour.
The material’s constitutive equation was characterised by a power law of the following type [1]:
In this equation, σ represents the equivalent stress, and δ the equivalent strain rate, while the strength coefficient K and the strain rate sensitivity index m are material constants. This power law is representative of the behaviour of ideal superplastic materials without strain hardening [1]. As mentioned previously, the material constant that most influences the final thicknesses of the manufactured part is the strain rate sensitivity index, m. It influences both the formability of the superplastic materials and the uniformity of the distribution of the thicknesses in the formed hemispherical shell. Increasing the m value involves a better formability and a more uniform thickness. A typical superplastic material is characterised by an m value ranging from 0.4 to 0.8; an intermediate value, i.e., m = 0.5 [1], was chosen.
For the FEM analysis, no automatic mesh adaptation was used, but the mesh remained static, i.e., the number of finite elements did not change during the simulation.
In the 3D simulation, only a quarter of the circular blank was represented using four-node thick shell elements (see Figure 2a). In particular, 1000 elements were used, arranged along 10 radial sectors (see Figure 2b). The element thickness was set equal to 1 mm.
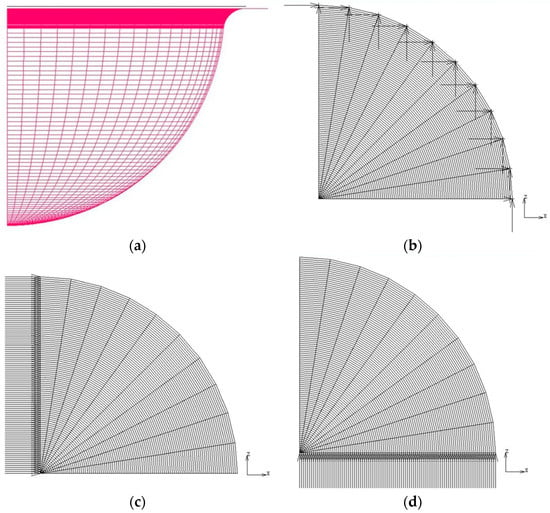
Figure 2.
(a) Hemispherical shell schematised using 3D shell elements; (b) boundary conditions at the nodes of the blank’s edge; (c) boundary conditions at the nodes of x-axis; (d) boundary conditions at the nodes of the z-axis.
The die, which was considered a rigid body, consists of a spherical surface, with a radius of 50 mm, connected to a flat surface via a fillet with a radius of 5 mm. The circular blank is constrained so it does not slide within the die (see Figure 2b). For symmetry reasons, the nodes along the x-z axes were constrained from moving along the x-z directions (see Figure 2c,d). A constant pressure load was applied to the upper face of the elements. The convergence took into account the displacements, and the condition of perfect lubrication was considered.
In the 2D simulation, due to the problem’s axisymmetry, four-node axisymmetric elements were used to discretise only half of the circular blank’s cross-section (see Figure 3). In this case, four-node, isoparametric, quadrilateral elements adapted for axisymmetric applications, present in the calculation code library, were used. A total of 100 elements are used, distributed uniformly along the radius of the blank. The used elements are therefore rectangular with dimensions of 1 mm × 0.55 mm. The die consists of a circular curve with a radius of 50 mm connected to a straight line through a fillet with a radius of 5 mm. In this case, too, the circular blank is constrained to prevent it from sliding within the die. A constant pressure was applied to the upper edge of the elements.
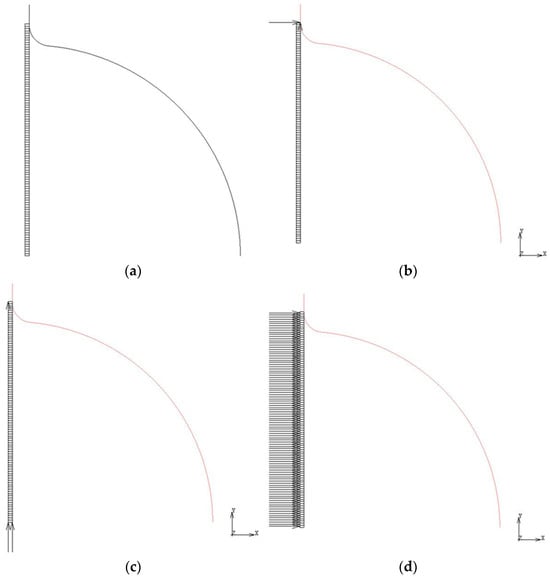
Figure 3.
(a) Hemispherical shell schematised using 2D four-node axisymmetric elements; (b) boundary conditions on the outer node in direct contact with the die; (c) boundary conditions on the nodes located along the axis of axisymmetry; (d) application of a constant pressure at the top edge of the elements.
2.2. Optimised Forming of a Superplastic Hemispherical Shell Using a Conical Blank
In order to make the thickness distribution of the manufactured hemispherical shell uniform, superplastic forming is carried out on a circular blank with a conical thickness profile. This profile has a maximum thickness, smax, on the circular blank axis of symmetry and decreases linearly along a radius of 50 mm to reach a minimum thickness, smin, at the edge of the disc. Because the volume constancy of the forming processes requires that the volume of the circular blank with the conical thickness profile be equal to the final volume of the manufactured hemispherical shell (supposed ideally with a constant thickness savg), the parameters smax and smin were linked to the final thickness of the manufactured shell, considered constant, savg. The volume of the initial blank was calculated as the sum of the volume of the disc and the truncated cone. Therefore, by equating the initial and final volumes, it is possible to obtain the following relationship:
From this equation, it is possible to obtain, in the case of a circular blank with a constant thickness, s0 = smax = smin.
Therefore, once s0 (for example, s0 = 1 mm) and savg (for example, savg = 0.5 mm) are fixed, it is easy to choose different couples of values of smax and smin through Equation (2) to have the conical thickness profile of the circular blank to form.
Five simulations were performed by varying the value of smin between 0.8 and 1 mm. smin values lower than 0.8 mm produce thinnings in the sheet metal. smin = 1 means that smax = 1, and therefore, the blank has a constant thickness.
Therefore, once the average thickness savg = 0.5 mm was set, 5 values of smin were chosen (0.8, 0.85, 0.9, 0.95 and 1 mm) in the range of existence. Equation (2) allows us to determine smax.
3. Experimental Tests
The laboratory tests were performed using the superplastic magnesium-based alloy AZ31 at 440 °C, whose chemical composition by weight is Mg-3%Al-1%Zn. In general, magnesium-based alloys are not very ductile at room temperature, but it has been demonstrated that, at high temperatures, some of them can achieve superplastic conditions, thus increasing their ductility [1]. Some magnesium alloys applied industrially are presented in [1].
The constitutive equation of the magnesium-based alloy AZ31 is reported in [31]. The optimised superplastic behaviour was found at a temperature of 440 °C and a strain rate of 3.5 × 10⁻⁴ s−1. The constitutive equation used is of the following type:
In this equation, is the stress, ε the strain, and δ the strain rate, while the constants K, n and m assume the following values: K = 289.9, m = 0.407 and n = 0.12.
The material constants were determined by free forming tests. The tests were conducted at constant pressure (using the pressure p = 0.275 MPa once and p = 0.4 MPa once). The output of the tests is represented by a curve of displacement at the apex of the dome versus the forming time.
Therefore, the material constants were obtained through the free forming test, i.e., a test conducted at constant pressure that does not involve contact between the sheet and the forming die. To determine the material constants, an inverse analysis technique associates the results of an experimental free forming activity conducted at constant pressure with those from a numerical simulation of the forming process itself [29,31]. Unlike a monoaxial tensile test, the free forming test submits the material to be tested to a state of biaxial stress that is closer to what happens during a real superplastic-forming process. The experimental free forming activity was conducted at two different pressure levels (p1 = 0.275 MPa and p2 = 0.4 MPa) with the aim of acquiring the thicknesses and forming times necessary to reach well-defined geometric configurations.
The constant-pressure superplastic-forming tests consisted of the creation of a hemispherical shell (characterised by a radius of 30 mm) starting from:
- A constant-thickness blank with s0 = 0.94 mm;
- A conical section blank with smax = 1 mm and smin = 0.9 mm.
The experimental tests involved the use of a prototype of equipment located at the University of Cassino Laboratory. The scheme of the equipment is shown in Figure 4, while all the details of the equipment can be found in [27,28,29].
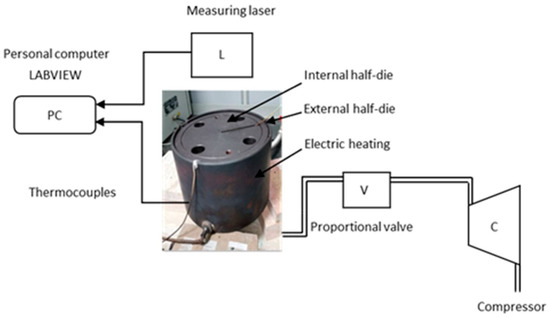
Figure 4.
Scheme of the equipment used for the experimental tests.
In brief, the sheet to be formed is placed between a circular lower die (or blank holder), which contains the die cavity, and an outer upper die wrapped by an electric heating band. This band’s purpose is to maintain the sheet at a constant and uniform temperature. Furthermore, to prevent the sheet from sliding within the die cavity, the two dies are clamped. The sheet’s temperature (approximately 440 °C) is achieved using the electric heating band and maintained at the required value by a temperature control system. A hole in the outer die allows pressurised air from an external compressor to be conveyed, which is controlled by a proportional valve.
During the forming test, a measuring laser monitors the displacement at the apex of the forming dome, creating a graph as a function of forming time. All signals from the thermocouples connected to the dies and the blank to be formed, as well as from the measuring laser, are managed together on a PC using a Labview® (National Instrument Corporation, Milan, Italy) virtual instrument.
Finally, the thicknesses of the hemispherical shell are measured using a Prismo Vast MPS coordinate measuring machine from Zeiss® (Oberkochen, Gemany), as reported in [27,28,29].
For each type of test, three replicates were carried out.
4. Results and Discussion
4.1. Numerical Results and Comparison Between 2D and 3D Analyses
Once the 3D and 2D FEM analyses of the superplastic-forming process to manufacture a hemispherical shell were performed, the distribution of the thicknesses in the manufactured shell was achieved. Figure 5 and Figure 6 show some sequences involved in the simulations.
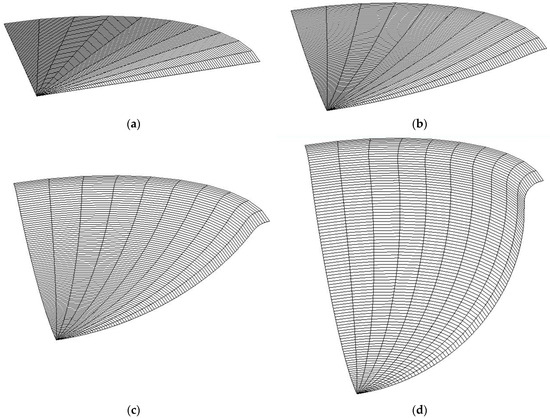
Figure 5.
Selected steps of the 3D FEM simulation of the hemispherical-shell-forming process. (a) starting forming; (b) first shaping; (c) subsequent formation; (d) final shape.
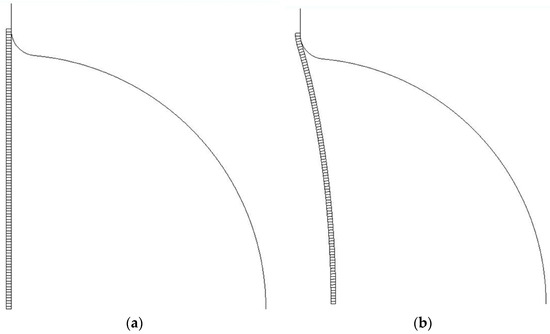
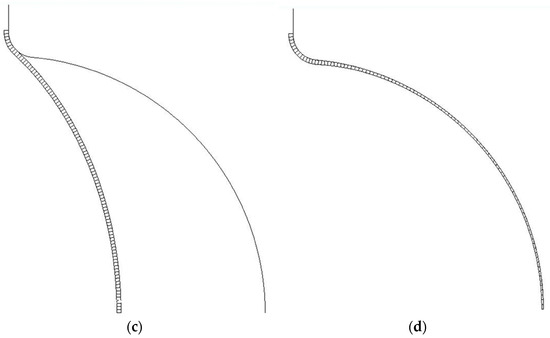
Figure 6.
Selected steps of the 2D FEM simulation of the hemispherical-shell-forming process. (a) plane disc and die; (b) start forming of the disc; (c) subsequent formation; (d) final shape.
The obtained results are shown in Figure 7, where the thickness of the manufactured hemispherical shell is reported versus the distance from the axis of symmetry of the hemispherical shell itself. The results highlight how the thickness distribution is non-uniform and increases from the pole (where there is the y-axis in the graph) to the outer edge of the manufactured shell. The pole area of the hemispherical shell represents a critical zone as the sheet thins by approximately 66%. Conversely, at the edge, the thinning is contained and amounts to about 13%. Those percentage variations were measured as the difference between the thickness of the manufactured hemispherical shell at the pole or edge and that of the initial blank.
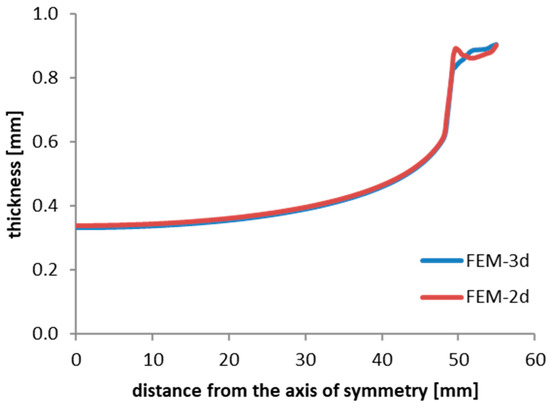
Figure 7.
Thickness distribution in the hemispherical shell obtained via both 3D and 2D FEM analyses.
The same graph of Figure 7 shows that the results obtained through 3D and 2D analyses are substantially overlapping, and the maximum difference is approximately 2%. Therefore, this result allows us to consider the two adopted schemes (3D analysis and 2D analysis) to simulate the superplastic-forming process interchangeably. The numerical–experimental validation is addressed below.
4.2. Numerical Results Connected with a Conical Section Blank
Once the five simulations were performed, the values at the pole, sp, and at the edge, se, of the thicknesses of the manufactured hemispherical shell were determined. These values were fitted through a straight line and represented in the sp-smin and se-smin graphs (see Figure 8). From Figure 8, it can be seen that sp = se for a single value of smin (smin = 0.903 mm). This value represents the optimal minimum thickness if a blank characterised by a conical section profile is used. Equation (2) allows for the determination of the optimal value of smax (smax = 1.193 mm).
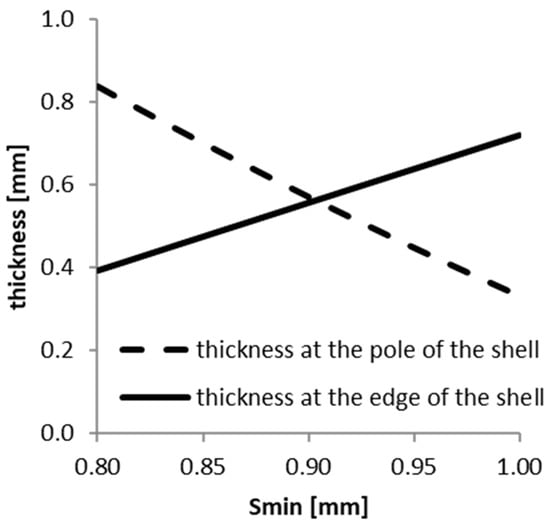
Figure 8.
Thickness values obtained, though finite element analysis, at the pole and edge of the hemispherical shell using a conical blank section characterised by different smin values.
Using the blank characterised by the optimal values of smin and smax, a numerical simulation that highlights the thickness distribution of the hemispherical shell in the optimal conditions is performed. Figure 9 shows the comparison between the thickness distribution obtained using a blank with a conical section profile and that obtained with a constant thickness blank. From Figure 9, it is evident that the thicknesses of the shell obtained with a blank with a conical section profile are distributed more uniformly than in the case in which a blank with a constant thickness is used.
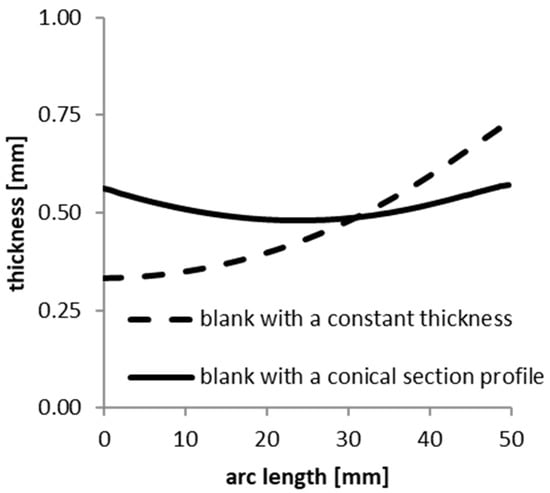
Figure 9.
Thickness trend of the hemispherical shell obtained using a constant-thickness blank and a blank characterised by a conical section.
This means that the thickness distribution is more uniform when moving from the constant-thickness blank to the conical blank. The uniformity of the thicknesses in the hemispherical shell can be measured using the following expression:
In Equation (5), se is the maximum thickness value, and sp is the minimum thickness value at the edge and at the pole of the manufactured hemispherical shell, respectively. If the two values are the same, A% tends to zero, making the distribution of the shell thicknesses uniform. The value of A% decreased from ≈55% when using a constant-thickness blank to ≈16% with a conical blank; so, the final distribution of the thicknesses of the hemispherical shell for a conical blank is more uniform than that of a constant-thickness blank.
4.3. Experimental Results
To make the thickness distribution of a hemispherical shell more uniform and to demonstrate the reliability of the method proposed in the second paragraph, the experimental results obtained using both a constant-thickness blank and a conical section profile blank were compared.
At the end of the forming, the thicknesses of the shell were measured and reported in the graph of Figure 10 in the form of black (Figure 10a) and white (Figure 10b) dots. The black dots represent the results obtained using a constant-thickness blank. The white dots are associated with a conical section blank. The thickness distribution shows a different trend in the two cases:
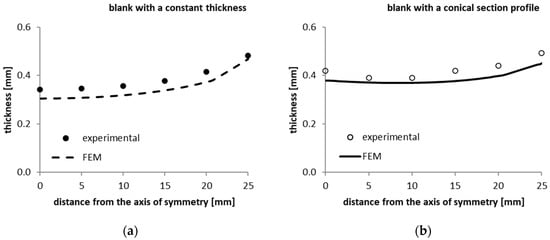
Figure 10.
Comparison between the results obtained through FEM and those from the experimental tests for (a) a constant-thickness blank and (b) a conical section profile blank.
- An increasing trend from the pole to the edge of the shell in the case of a constant-thickness blank;
- A flatter trend from the pole to the edge in the case of a conical section blank.
The comparison between the results highlights the success of the conducted numerical activity, as the differences found in terms of thickness were approximately 10%.
Figure 11 shows the comparison between the experimental results obtained from a blank with a constant thickness and a blank with a conical section profile. It underlines how the thickness trend of the hemispherical shell is indeed more uniform if a conical section profile blank is used instead of a constant-thickness blank. In particular, the thickness uniformity, represented by the A% parameter, decreases from ≈29% when using a constant-thickness blank, to ≈20% with a conical section profile blank. This means that a conical section involves a more uniform distribution of thickness in the hemispherical shell.
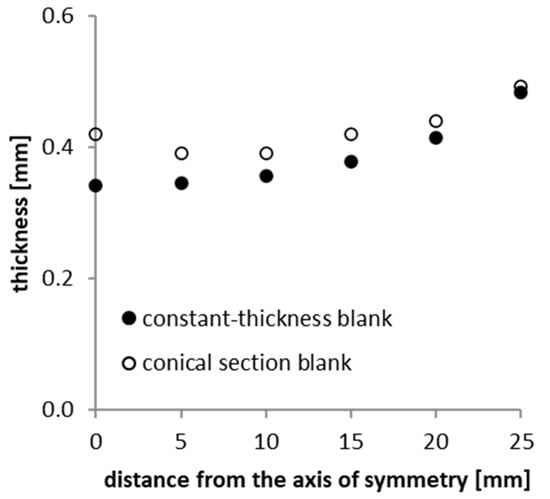
Figure 11.
Comparison between experimental results obtained from a constant thickness blank and a conical section blank.
5. Conclusions
This work, through numerical and experimental activities, aimed to design the superplastic-forming process to manufacture a hemispherical shell characterised by an almost uniform final thickness distribution. The experimental activity was conducted using the superplastic magnesium-based alloy AZ31.
Therefore, this work aimed to:
- Model, through finite element analysis, the superplastic-forming process, conducted at a constant forming temperature and pressure, for the production of a hemispherical shell, both through a 3D scheme and a simplified 2D scheme;
- Verify, through a numerical–experimental comparison, the quality of the results achieved in the numerical simulation in terms of the final thickness distribution of the hemispherical shell;
- Show, starting from a blank with a conical section profile, an original procedure, based on a series of appropriately conducted numerical simulations; it allows for obtaining a more uniform final thickness distribution of the hemispherical shell.
At the end of the work, the following conclusions were obtained:
- The 2D scheme, which requires less computational time and a greater ease of preparation, can replace the 3D scheme. This comparison was made in terms of the thickness distribution of the formed hemispherical shell; the maximum deviation was of less than 2%;
- The results of the numerical analysis were compared with the results from the experimental activity conducted on the superplastic magnesium-based alloy AZ31. The FEM results underestimate the final thickness distribution of the hemispherical shell, even if the maximum deviation from the experimental results was of less than 10%;
- It is possible to produce a hemispherical shell characterised by an almost uniform thickness distribution. In this work, parameter A% was defined to measure the uniformity of the thicknesses of the manufactured hemispherical shell. In particular, this parameter tends to zero as the uniformity of the thicknesses increases. The uniformity of the thicknesses of the hemispherical shell is reduced if a constant thickness blank is used (it corresponds to a value of A% equal to 29%) and increases (A% = 20%) if a blank with a conical section profile is used.
Future research is related to the study of blanks with sections shaped differently to make the thickness of the final product more uniform.
Author Contributions
Conceptualisation, G.G.; methodology, G.G.; validation, G.G. and W.P.; formal analysis, G.G.; writing—original draft preparation, W.P.; writing—review and editing, G.G. and W.P. All authors have read and agreed to the published version of the manuscript.
Funding
This research received no external funding.
Institutional Review Board Statement
Not applicable.
Informed Consent Statement
Not applicable.
Data Availability Statement
The raw data supporting the conclusions of this article will be made available by the authors on request.
Conflicts of Interest
The authors declare no conflicts of interest.
References
- Ridley, N. Metals for superplastic forming. In Superplastic Forming of Advanced Metallic Materials: Methods and Applications, 1st ed.; Giuliano, G., Ed.; Woodhead Publishing Ltd.: Cambridge, UK, 2011; pp. 3–33. [Google Scholar]
- Murzina, G.R.; Ganieva, V.R.; Kruglov, A.A.; Enikeev, F.U. Modelling of the process of superplastic forming of hemispherical shells from blanks of different profiles. Lett. Mater. 2021, 11, 548–552. [Google Scholar] [CrossRef]
- Bonet, J.; Wood, R.D.; Collins, R. Pressure control algorithms for the numerical simulation of superplastic forming. Int. J. Mech. Sci. 1994, 36, 297–309. [Google Scholar] [CrossRef]
- Rama, S.C.; Chandra, N. Development of a pressure prediction method for superplastic forming processes. Int. J. Non-Linear Mech. 1991, 26, 711–725. [Google Scholar] [CrossRef]
- Yong, H.; Kim Hong, S.S.; Lee, J.S.; Wagoner, R.H. Analysis of superplastic forming processes using a finite-element method. J. Mater. Process Technol. 1996, 62, 90–99. [Google Scholar]
- Ding, X.D.; Zbib, H.M.; Hamilton, C.H.; Bayoumi, A.E. On the optimization of superplastic blow-forming processes. J. Mater. Eng. Perform. 1995, 4, 474–485. [Google Scholar] [CrossRef]
- Hambli, R.; Potiron, A. Comparison between 2D and 3D numerical modeling of superplastic forming processes. Comput. Methods Appl. Mech. Eng. 2001, 190, 4871–4880. [Google Scholar] [CrossRef]
- Carrino, L.; Giuliano, G.; Palmieri, C. On the optimisation of superplastic forming processes by the finite-element method. In Proceedings of the International Conference on Advances in Materials and Processing Technologies AMPT’01, Leganes, Madrid, Spain, 18–21 September 2001; pp. 18–21. [Google Scholar]
- Bellet, M.; Chenot, J.L. Numerical modeling of 3-dimensional superplastic forming of titanium sheet. In Proceedings of the International Conference on Titanium Products and Applications, San Francisco, CA, USA, 19–22 October 1986; Volume 2, pp. 1175–1184. [Google Scholar]
- Li, L.Q.; Wang, Q.; Chi, C.Z.; Li, Z.S.; Yan, A.M. A study of structures and dimensions of superplastic up-down blow bulging formation dies. Mater. Sci. Forum 1994, 170–172, 645–650. [Google Scholar] [CrossRef]
- Akkus, N.; Suzuki, K.; Kawahara, M.; Nishimura, H. Influence of preforming on the final thickness distribution of the superplastically deformed domes. Mater. Sci. Forum 1999, 304–306, 759–764. [Google Scholar] [CrossRef]
- Xu, H.Y.; Zhang, R.X.; Zeng, Y.S.; Liu, J.J. Improving thickness uniformity of Ti3AI sheet metal SPF by preforming. Mater. Sci. Forum 2013, 735, 130–135. [Google Scholar] [CrossRef]
- Suzuki, N.; Kohzu, M.; Jinishi, T.; Tanabe, S.; Higashi, K. Two stage superplastic forming of 7475 aluminium alloy sheet into a hemispherical dome with uniform thickness. J. Jpn. Inst. Light Met. 2001, 51, 14–17. [Google Scholar] [CrossRef][Green Version]
- Luckey, G.; Friedman, P.; Weinmann, K. Design and experimental validation of a two-stage superplastic forming die. J. Mater. Proc. Technol. 2009, 209, 2152–2160. [Google Scholar] [CrossRef]
- Jafar, R.A.; Jarrar, F.S.; Al-Huniti, N.S. Two-stage approach for improving the thickness distribution in superplastic forming. J. Mater. Sci. Res. 2015, 4, 12–27. [Google Scholar] [CrossRef]
- Yi, L.; Li, X.; Li, Y.; Yu, G.; Tang, Z.; Gu, Z. Investigation of the two-stage SPF process of aluminium alloy door frames. J. Mater. Res. Technol. 2021, 15, 2873–2882. [Google Scholar] [CrossRef]
- Luo, Y.; Luckey, S.G.; Friedman, P.A.; Peng, Y. Development of an advanced superplastic forming process utilizing a mechanical pre-forming operation. Int. J. Mach. Tools Manuf. 2008, 48, 1509–1518. [Google Scholar] [CrossRef]
- Liu, J.; Tan, M.; Aue-u-lan, Y.; Jarfors, A.E.W.; Fong, S.K.; Castagne, S. Superplastic-like forming of non-superplastic AA5083 combined with mechanical pre-forming. Int. J. Adv. Manuf. Technol. 2011, 52, 123–129. [Google Scholar] [CrossRef]
- Du, Z.; Wang, G.; Wang, H. The process design and rapid superplastic forming of industrial AA5083 for a fender with a negative angle in a small batch. Metals 2021, 11, 497. [Google Scholar] [CrossRef]
- Giuliano, G.; Corrado, A.; Polini, W. Influence of multiphase forming approach on the thickness uniformity of components from superplastic PbSn60 alloy. Manuf. Lett. 2018, 18, 16–19. [Google Scholar] [CrossRef]
- Cheng, J.H. A procedure for designing initial thickness variation for superplastic free inflation. Int. J. Mech. Sci. 1994, 36, 981–1000. [Google Scholar] [CrossRef]
- Kim, Y.H.; Lee, J.-M.; Hong, S.S. Optimal design of superplastic forming processes. J. Mater. Proc. Technol. 2001, 112, 166–173. [Google Scholar] [CrossRef]
- Huang, A.; Lowe, A.; Cardew-Hall, M.J. Experimental validation of sheet thickness optimisation for superplastic forming of engineering structures. J. Mater. Proc. Technol. 2001, 112, 136–143. [Google Scholar] [CrossRef]
- Dutta, A. Thickness-profiling of initial blank for superplastic forming of uniformly thick domes. Mater. Sci. Eng. A 2004, 371, 79–81. [Google Scholar] [CrossRef]
- Piccininni, A.; Sorgente, D.; Palumbo, G. GA-based optimization to control the thickness distribution in components manufactured via superplastic forming. J. Manuf. Proc. 2023, 86, 126–135. [Google Scholar] [CrossRef]
- Giuliano, G.; Polini, W. Influence of blank variable thickness on the material formability in hot gas sheet metal forming process. Manuf. Lett. 2020, 24, 72–76. [Google Scholar] [CrossRef]
- Giuliano, G.; Polini, W. Weight reduction in an AA2027 aluminium alloy part through the gas forming process of a blank with a variable thickness. Manuf. Technol. 2021, 21, 192–198. [Google Scholar]
- Giuliano, G.; Polini, W. Influence of the initial blank geometry on the final thickness distribution of the hemispheres in superplastic AZ31 alloy. Appl. Sci. 2022, 12, 1912. [Google Scholar] [CrossRef]
- Giuliano, G.; Polini, W. Optimal design of blank thickness in superplastic AZ31 alloy to decrease forming time and product weight. Int. J. Adv. Manuf. Technol. 2022, 118, 2153–2162. [Google Scholar] [CrossRef]
- Giuliano, G.; Polini, W. On the control of thickness in gas blow metal sheet forming processes: A review. J. Proc. Mech. Eng. 2024, in press. [Google Scholar] [CrossRef]
- Giuliano, G. AZ31 magnesium alloy parameters identification through inverse analysis at 713 K. Key Eng. Mater. 2012, 504–506, 643–646. [Google Scholar] [CrossRef]
Disclaimer/Publisher’s Note: The statements, opinions and data contained in all publications are solely those of the individual author(s) and contributor(s) and not of MDPI and/or the editor(s). MDPI and/or the editor(s) disclaim responsibility for any injury to people or property resulting from any ideas, methods, instructions or products referred to in the content. |
© 2025 by the authors. Licensee MDPI, Basel, Switzerland. This article is an open access article distributed under the terms and conditions of the Creative Commons Attribution (CC BY) license (https://creativecommons.org/licenses/by/4.0/).