

Two Decades of Groundwater Variability in Peru Using Satellite Gravimetry Data


Abstract
1. Introduction
1.1. Satellite-Based Monitoring with GRACE
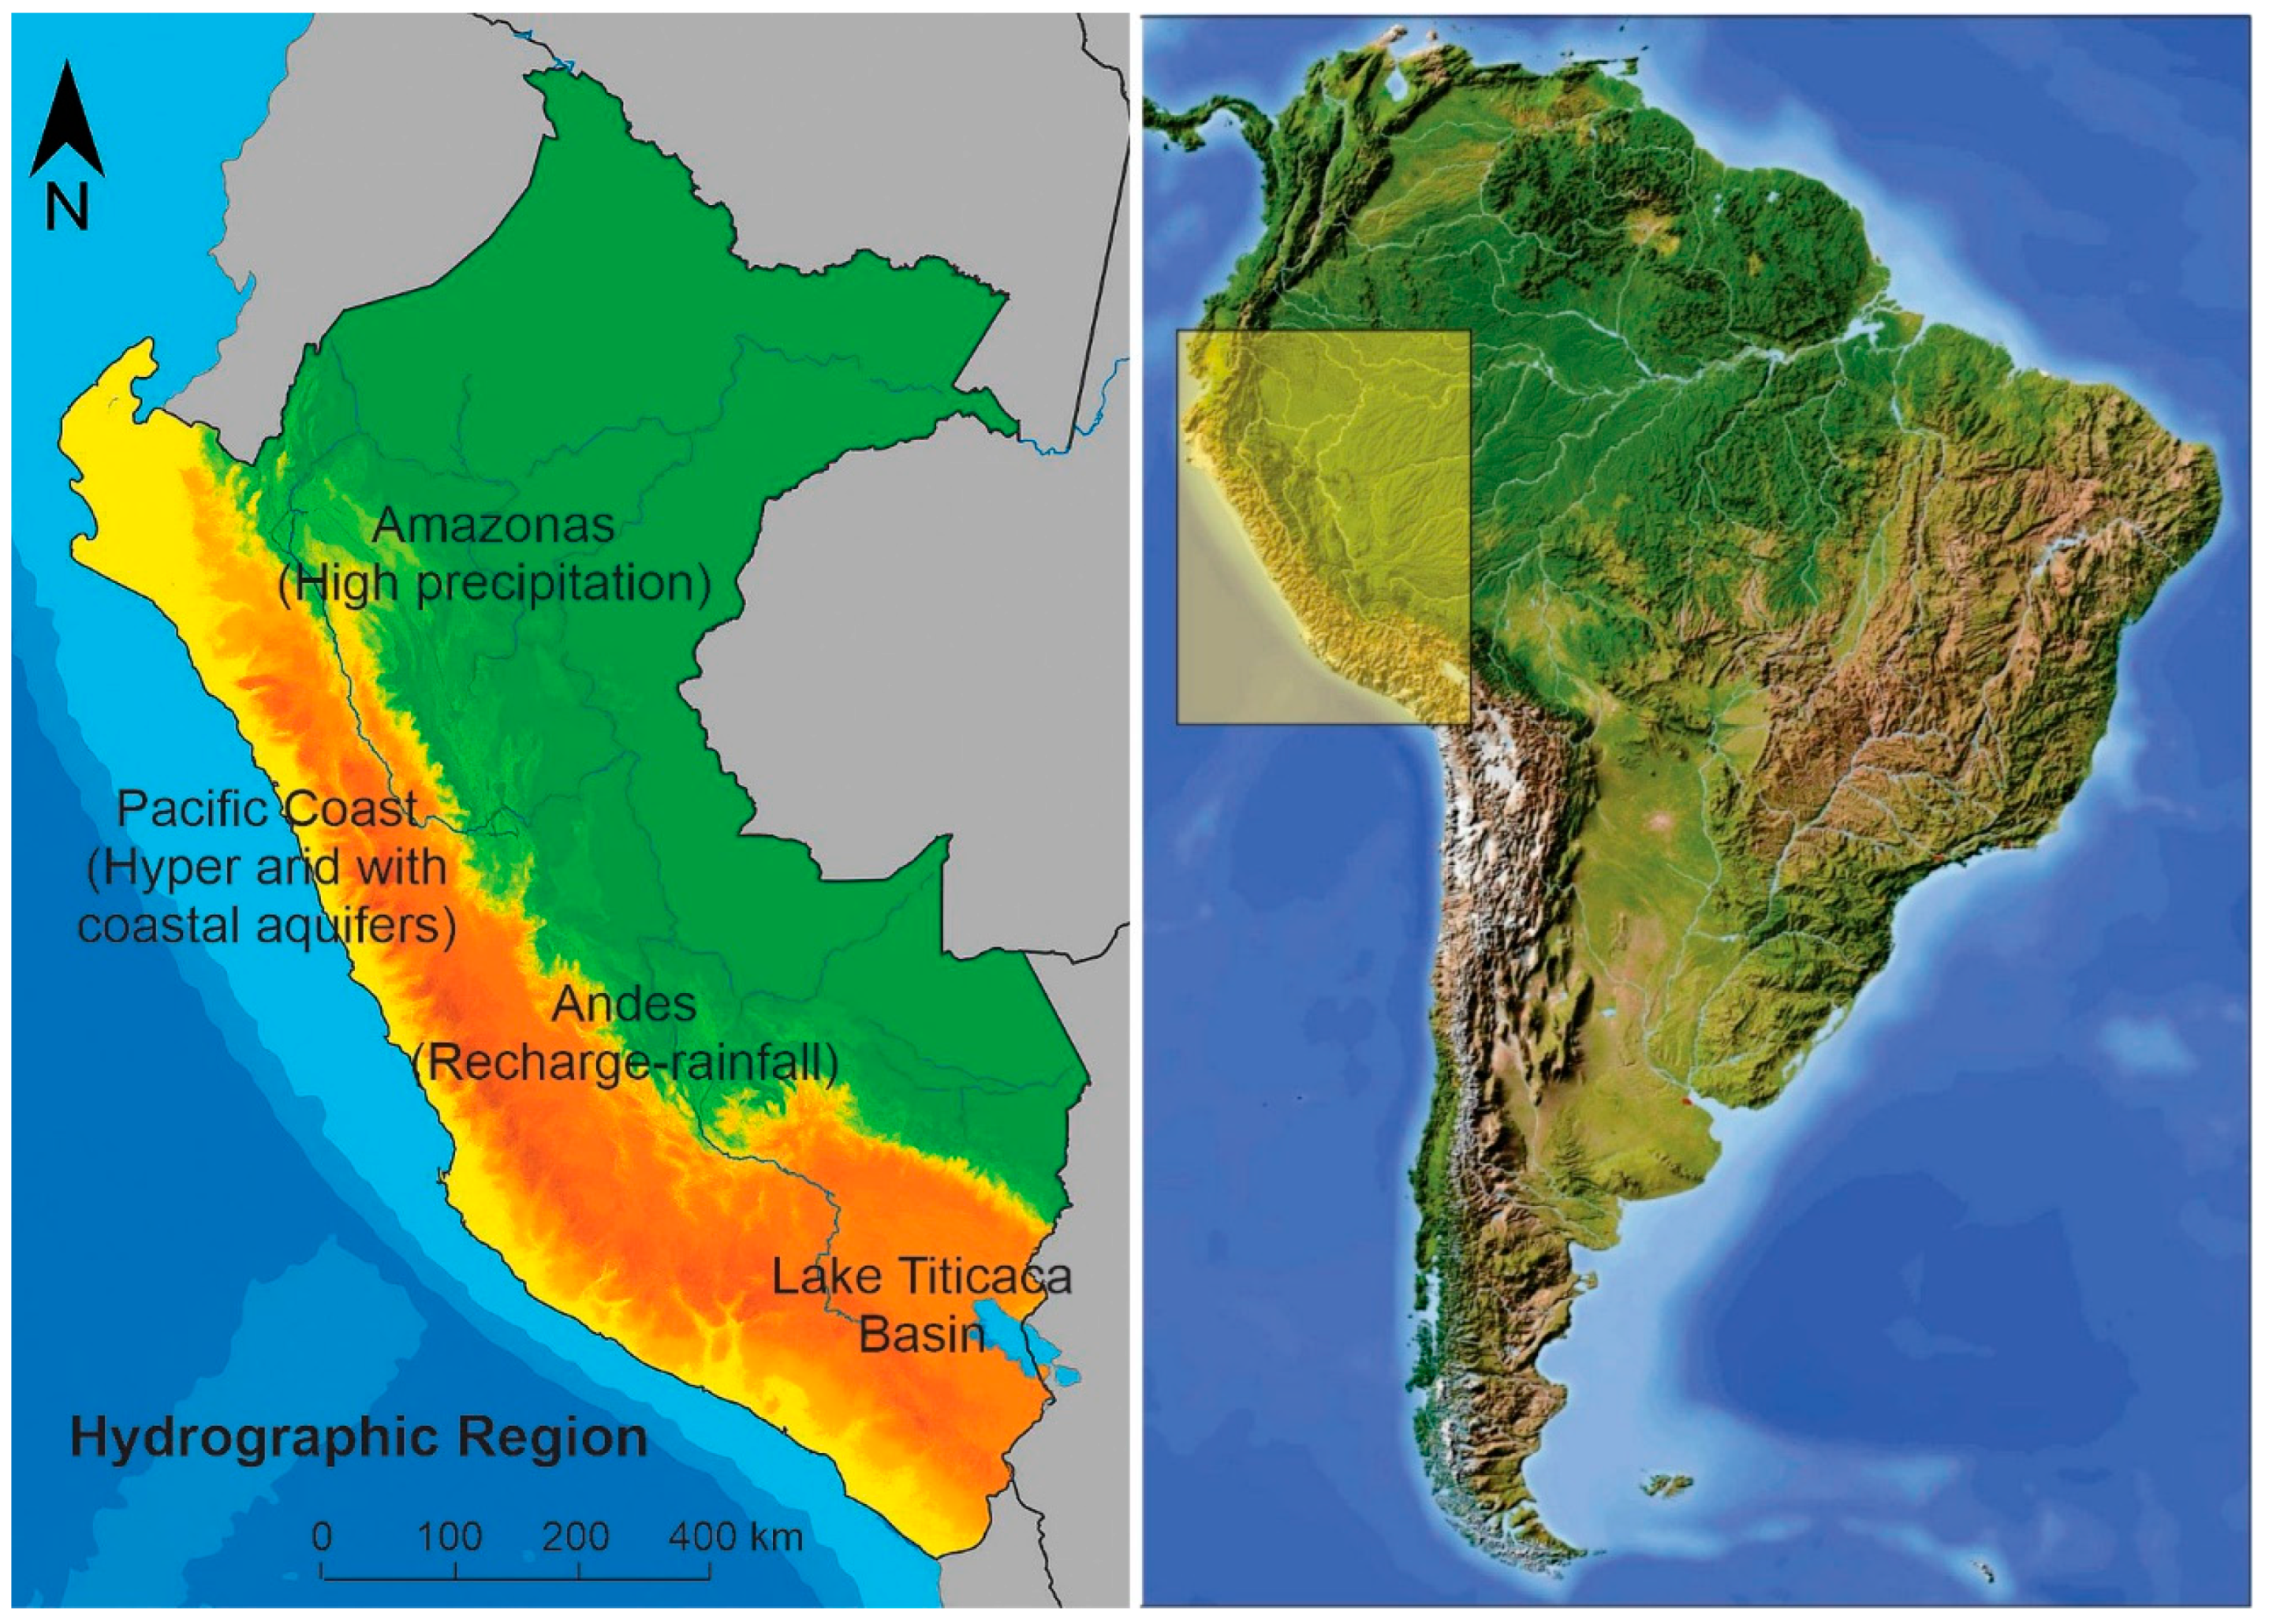
1.2. Hydrogeological Context of Peru
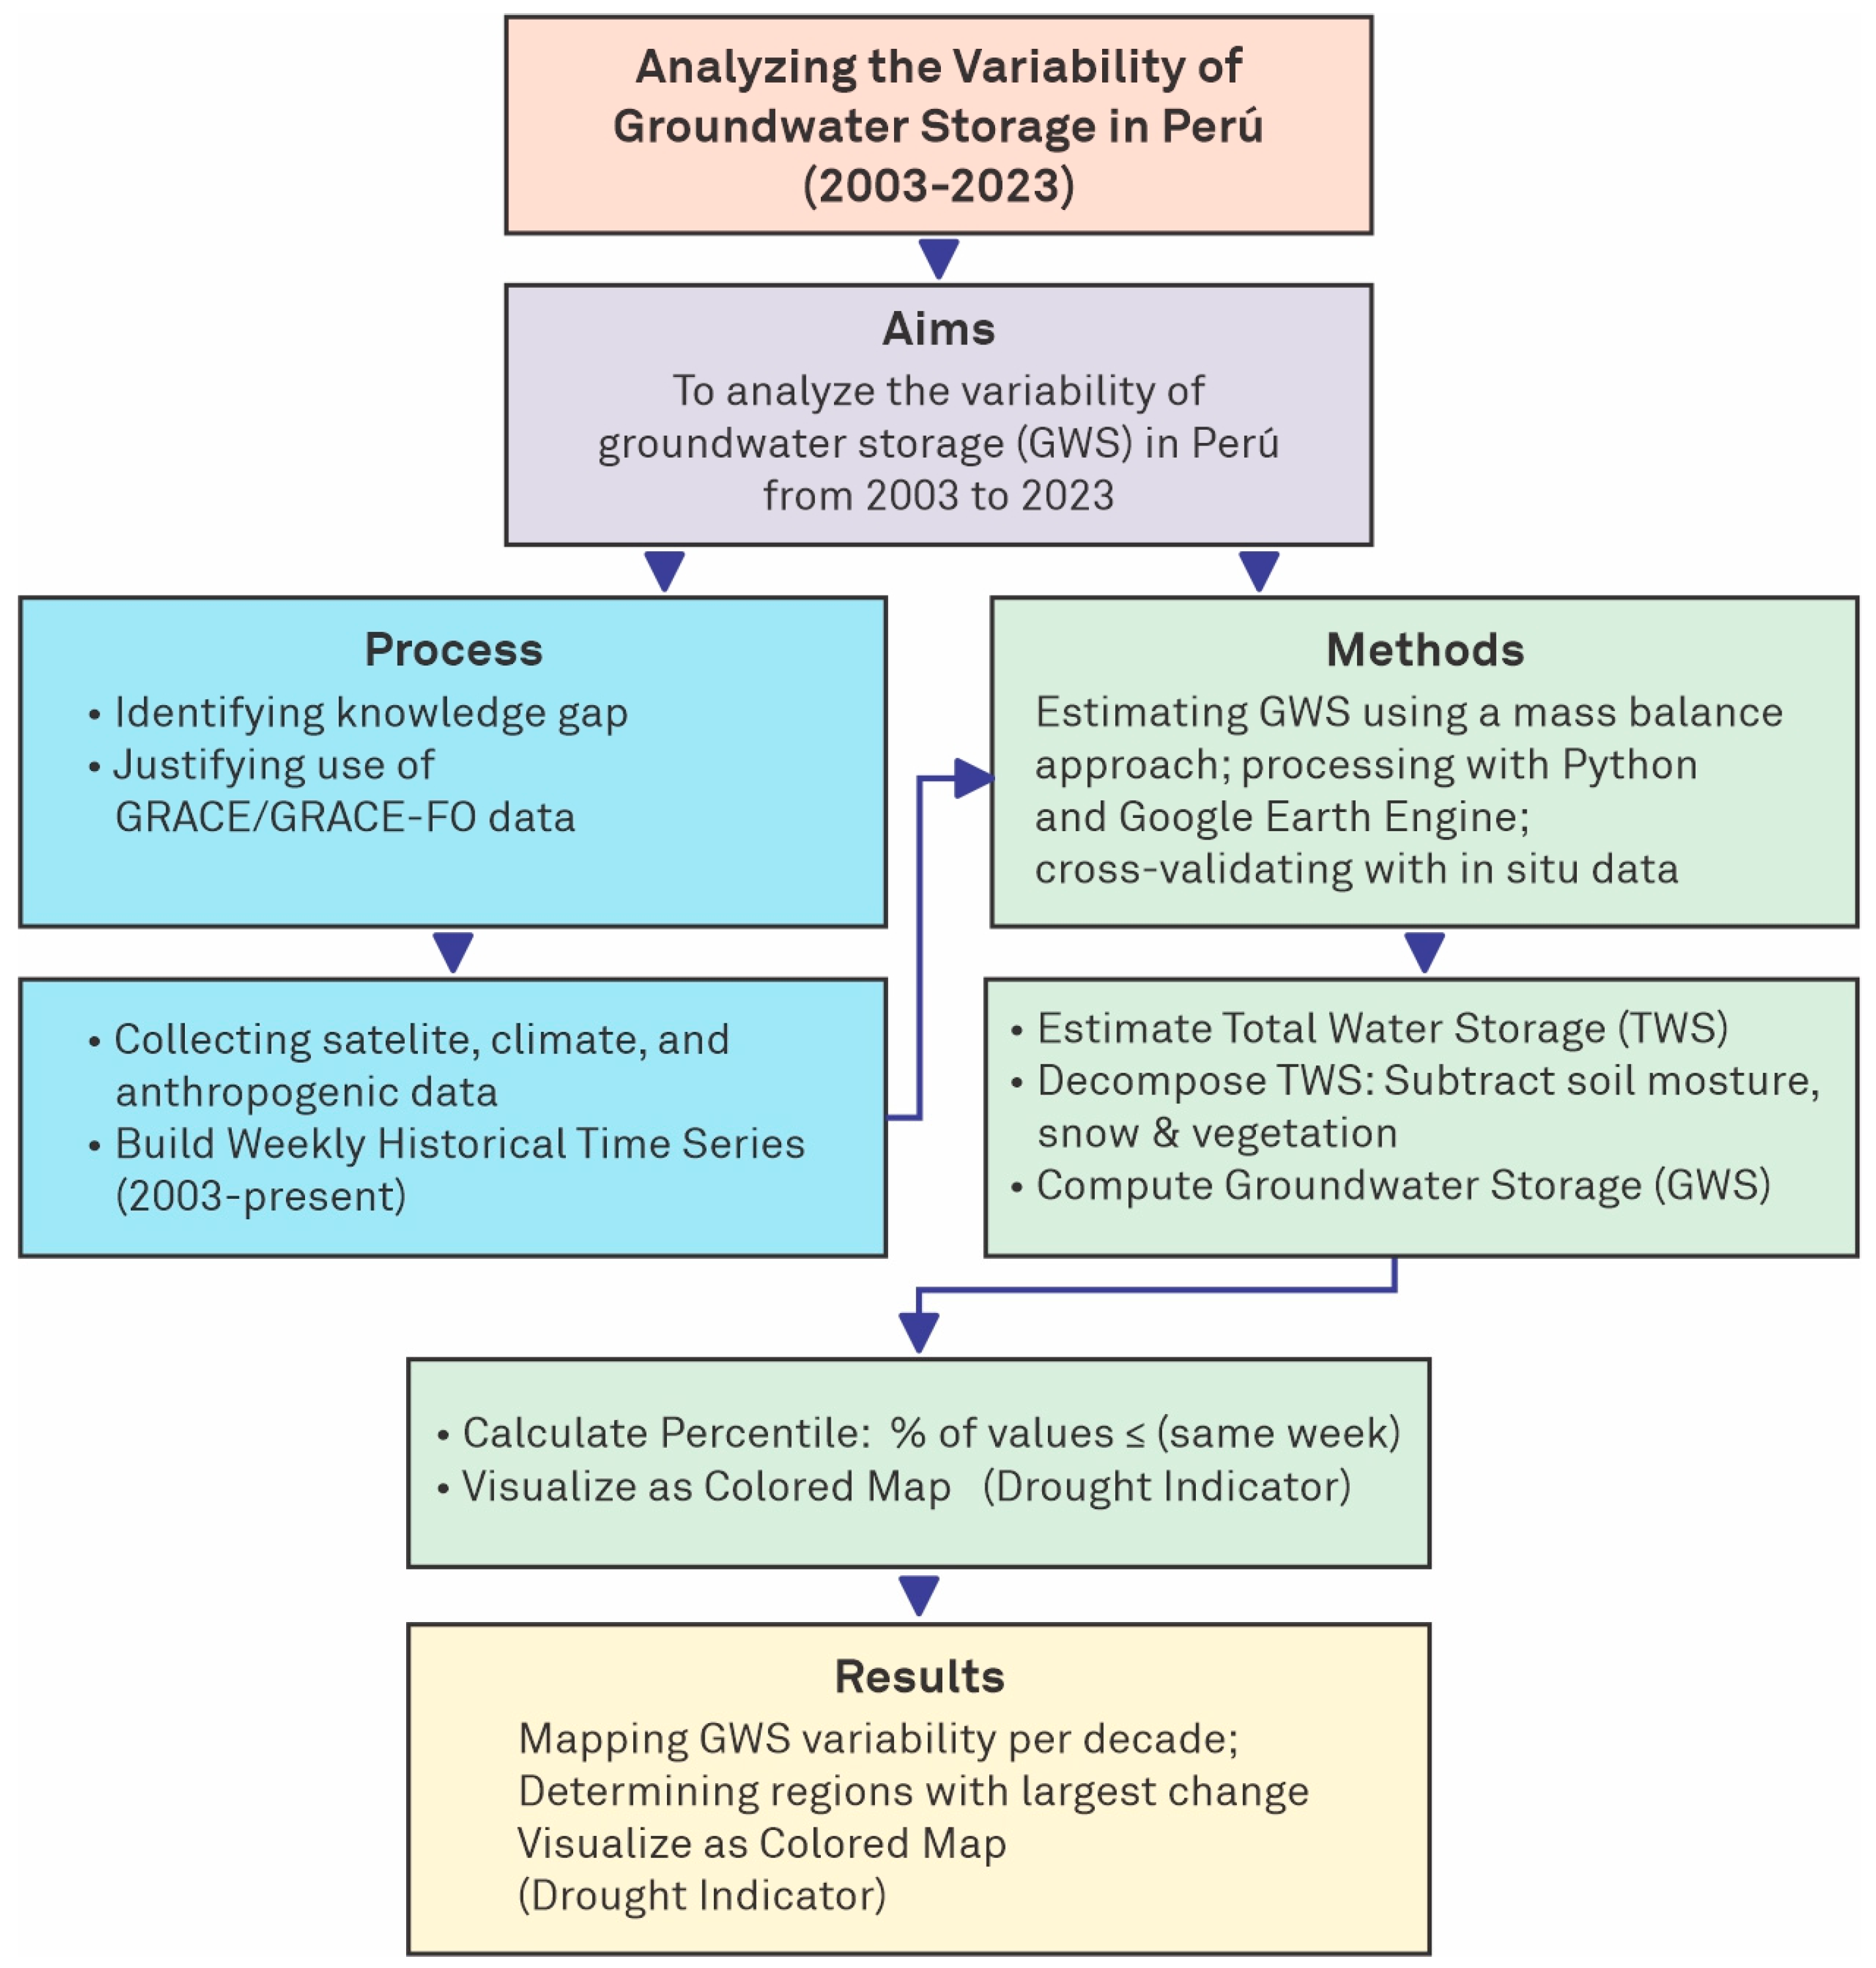
2. Materials and Methods
2.1. Study Area
2.2. Data
2.2.1. GRACE-DA-DM GLV3.0 Data
2.2.2. In Situ Data
2.3. Methods
2.3.1. Calculation of GWS Changes
- Water Balance Method
- -
- ΔTWS (change in total water storage) is obtained from the GRACE/GRACE-FO products.
- -
- ΔSMS (change in soil moisture storage).
- -
- ΔSWES (change in snow water equivalent) are obtained from hydrological balance models integrated into the GRACE-DA-DM GLV3.0 product or from the GLDAS-2.1 model.
- -
- ΔRESS (surface reservoir storage) was derived from reservoir monitoring data.
- -
- Baseline construction: For each month (e.g., July), a historical time series of ΔGWS (2003–2023) is compiled for each pixel.
- -
- Percentile calculation: The current value is positioned within the ordered historical distribution. The formula is as follows:P = [(N° historical values ≤ Current value)/Total number of historical records] × 100
- -
- Percentile 0–10: Extreme drought (ΔGWS among the lowest 10% of the historical record)
- -
- Percentile 90–100: Water surplus (ΔGWS among the highest 10%).
- 2.
- Regression Model for Climatic and Anthropogenic Factors
Natural Recharge Estimation
- Sy is the specific yield of the aquifer, and Δh is the increase in storage anomaly between a minimum (trough) and a subsequent peak.
Model Variability and Uncertainty Assessment
- -
- Trends and anomalies were analyzed within specific climate contexts, such as El Niño and La Niña events [41].
- -
- Seasonal effects were minimized using smoothing techniques and moving averages [42].
- -
- Hydrological models were used to estimate a range of uncertainty (Scanlon et al., 2018) [43].
- -
- Validation was performed using in situ observations and groundwater level records from selected wells [39].
- -
- Sensitivity analyses were conducted to evaluate model responses to variations in forcing inputs [44].
- -
- A formal covariance matrix defines the baseline uncertainty, accounting for instrumental and model-based errors.
- -
- Spatial covariance models adapt these uncertainties to regional scales.
- -
- Filtering and leakage errors are combined quadratically into the total uncertainty.
- -
- Auxiliary model uncertainties (atmosphere, ocean, GIA) are integrated and corrected.
- -
- Final estimates are validated against simulations and observations.
2.3.2. Post-Processing of GRACE-DA-DM GLV3.0 Data
2.3.3. Regional Classification
- (1)
- Northern Zone: Tumbes, Piura, Lambayeque, Cajamarca, La Libertad, Amazonas, and San Martín regions.
- (2)
- Central Zone: Lima, Ancash, Huánuco, Cerro de Pasco, Junín, Huancavelica, Ucayali, Ayacucho, and Ica regions.
- (3)
- Southern Zone: Cusco, Puno, Arequipa, Moquegua, Tacna, Madre de Dios, and Apurímac regions.
2.3.4. Validation with In Situ Data
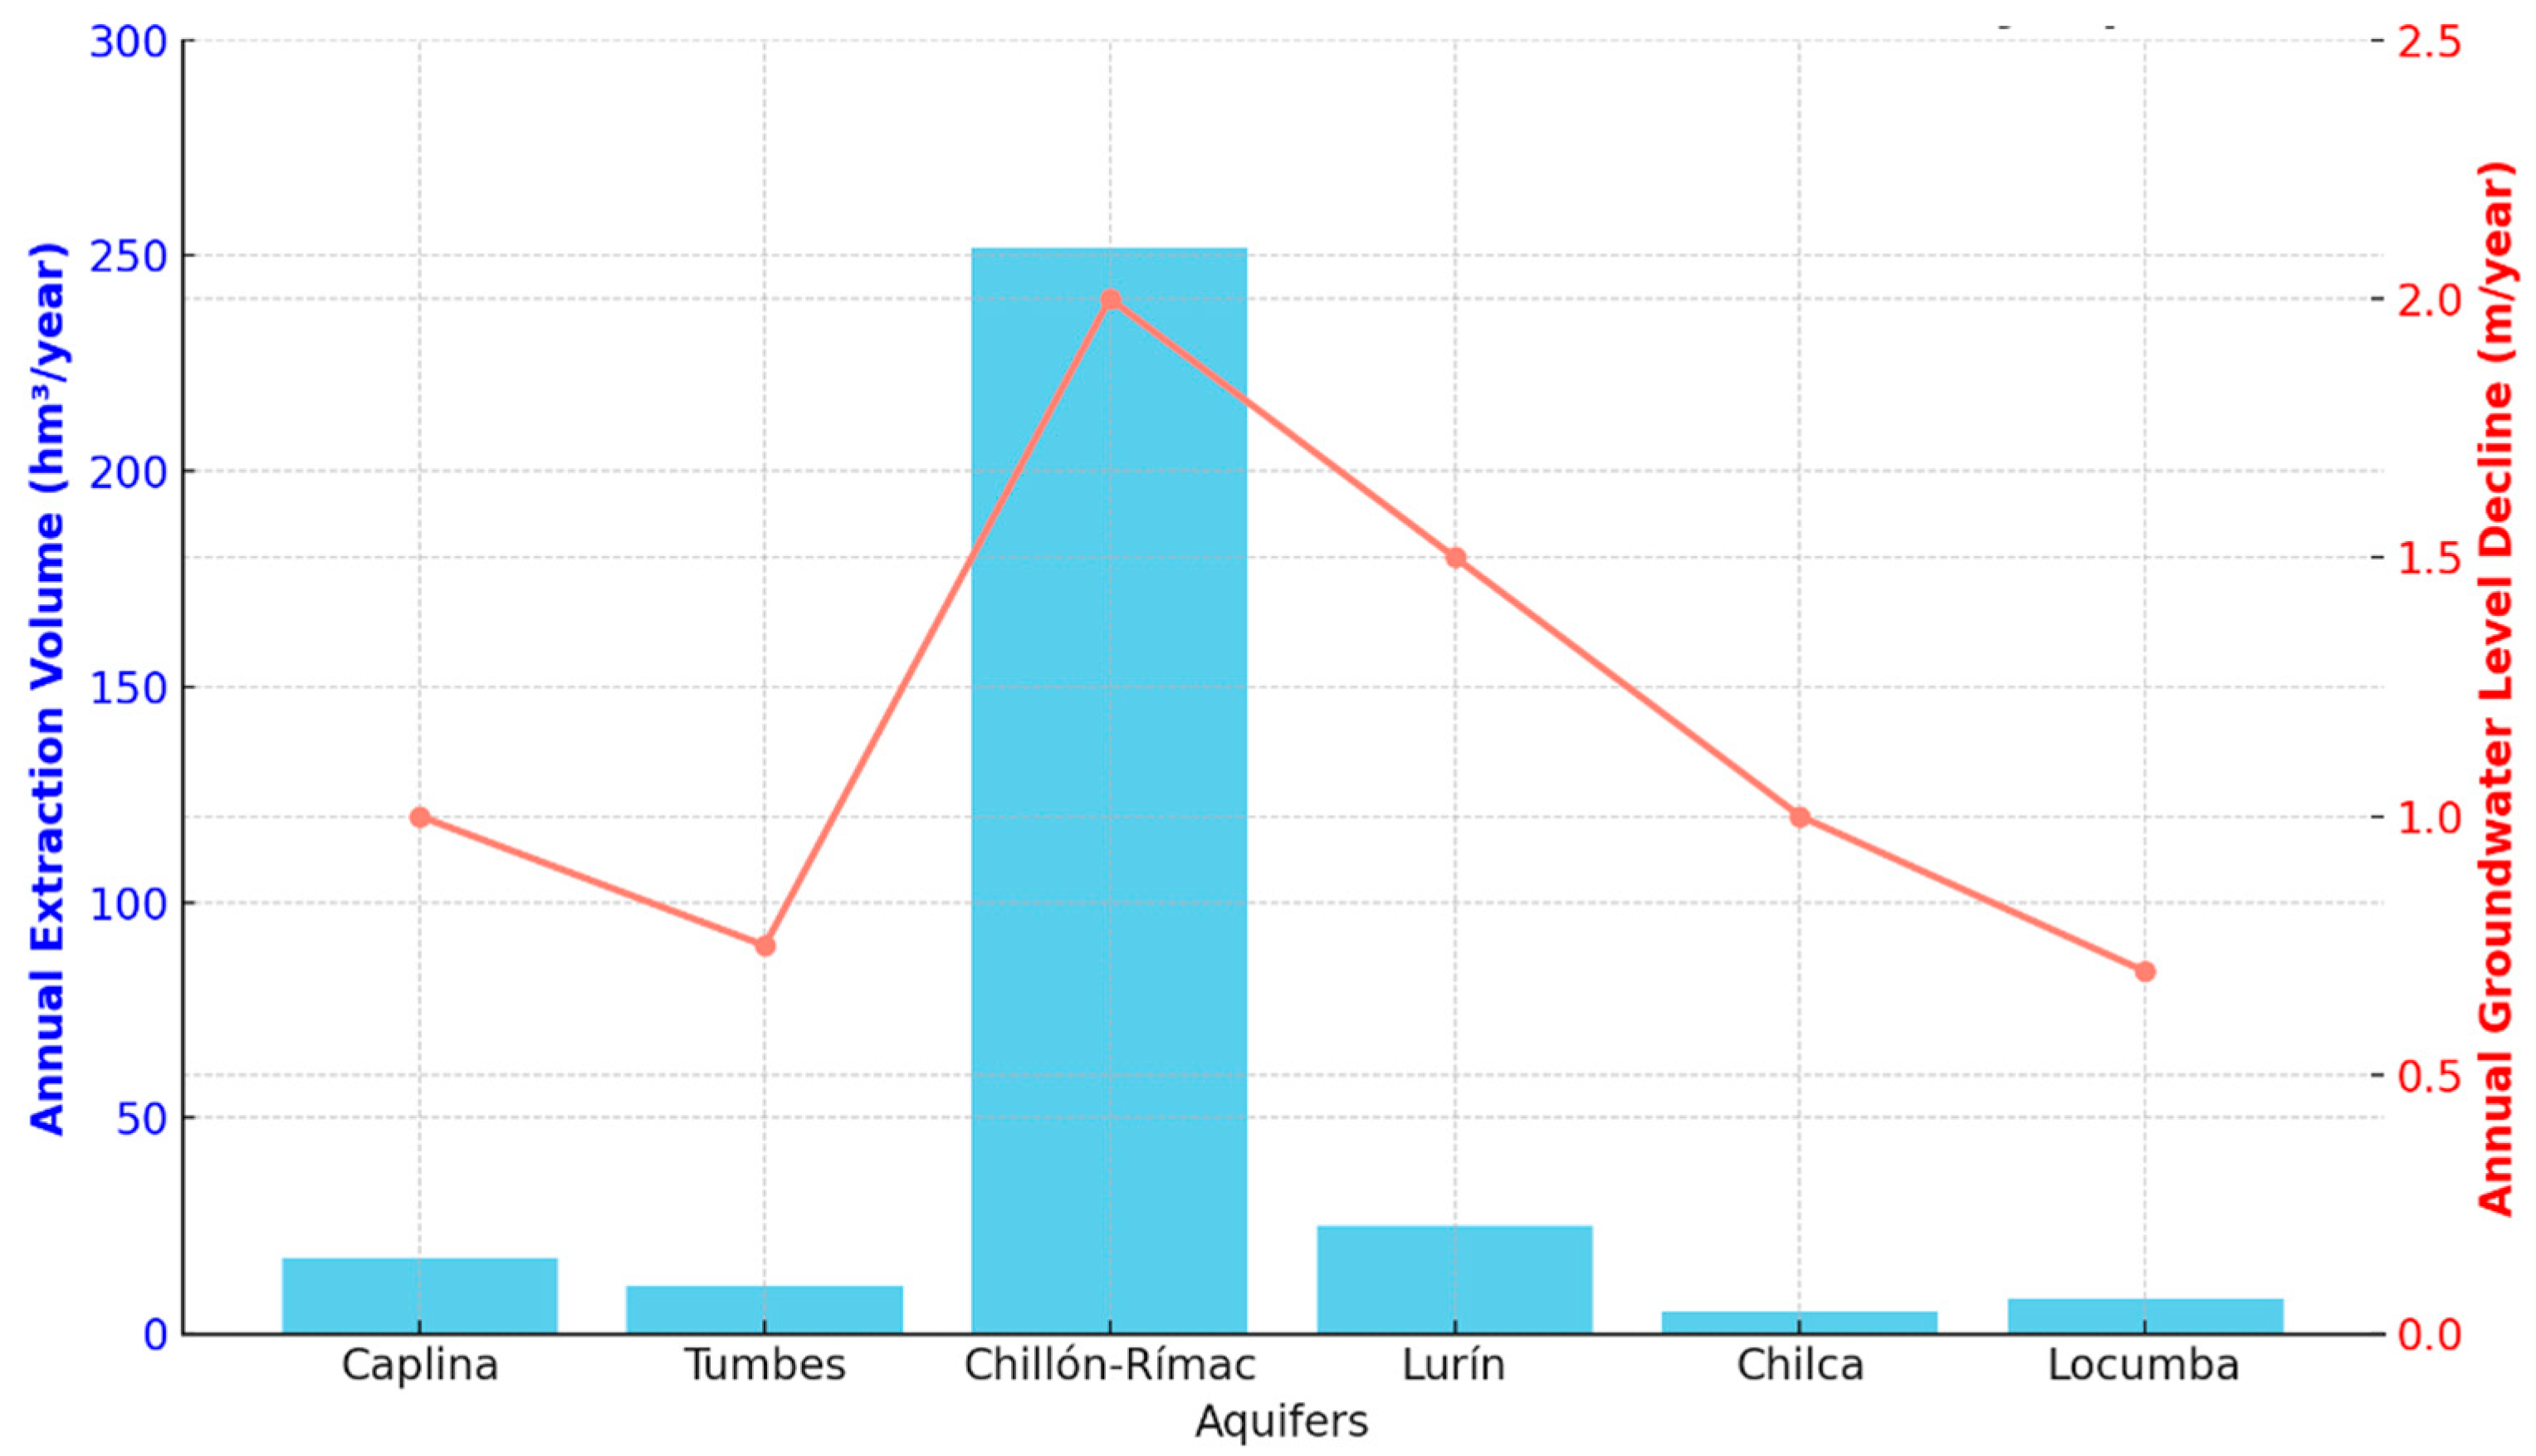
- x (Extraction): [17.5, 11, 252, 25, 5, 8]
- y (Decline): [1.0, 0.75, 2.0, 1.5, 1.0, 0.7]
- = 53.08 (average extraction)
- = 1.16 (average decline).
- r ≈ 0.95
- Result: r = 0.95, indicating a very strong positive correlation between extraction and decline suggests GRACE effectively captures depletion trends observed in situ, with high statistical significance. This validates GRACE’s utility for regional monitoring.
2.3.5. Analysis of Climatic and Anthropogenic Factors
- P: is precipitation (mm);
- ENSO: is the El Niño 3.4 index (dimensionless);
- EXT: is human extraction (mm/year);
- ϵ: is the residual error (mm/year);
- β1 (mm/year), β2 (relates ENSO-Dimensionless), and β3 (mm/year) are the coefficients that indicate the magnitude of each explanatory variable.
2.3.6. Precipitation–GWS Relationship
- Y: is the estimated annual precipitation.
- X: is the year.
- m: is the slope of the line (average annual variation in precipitation).
- b: is the intercept (value of Y when X = 0).
3. Results
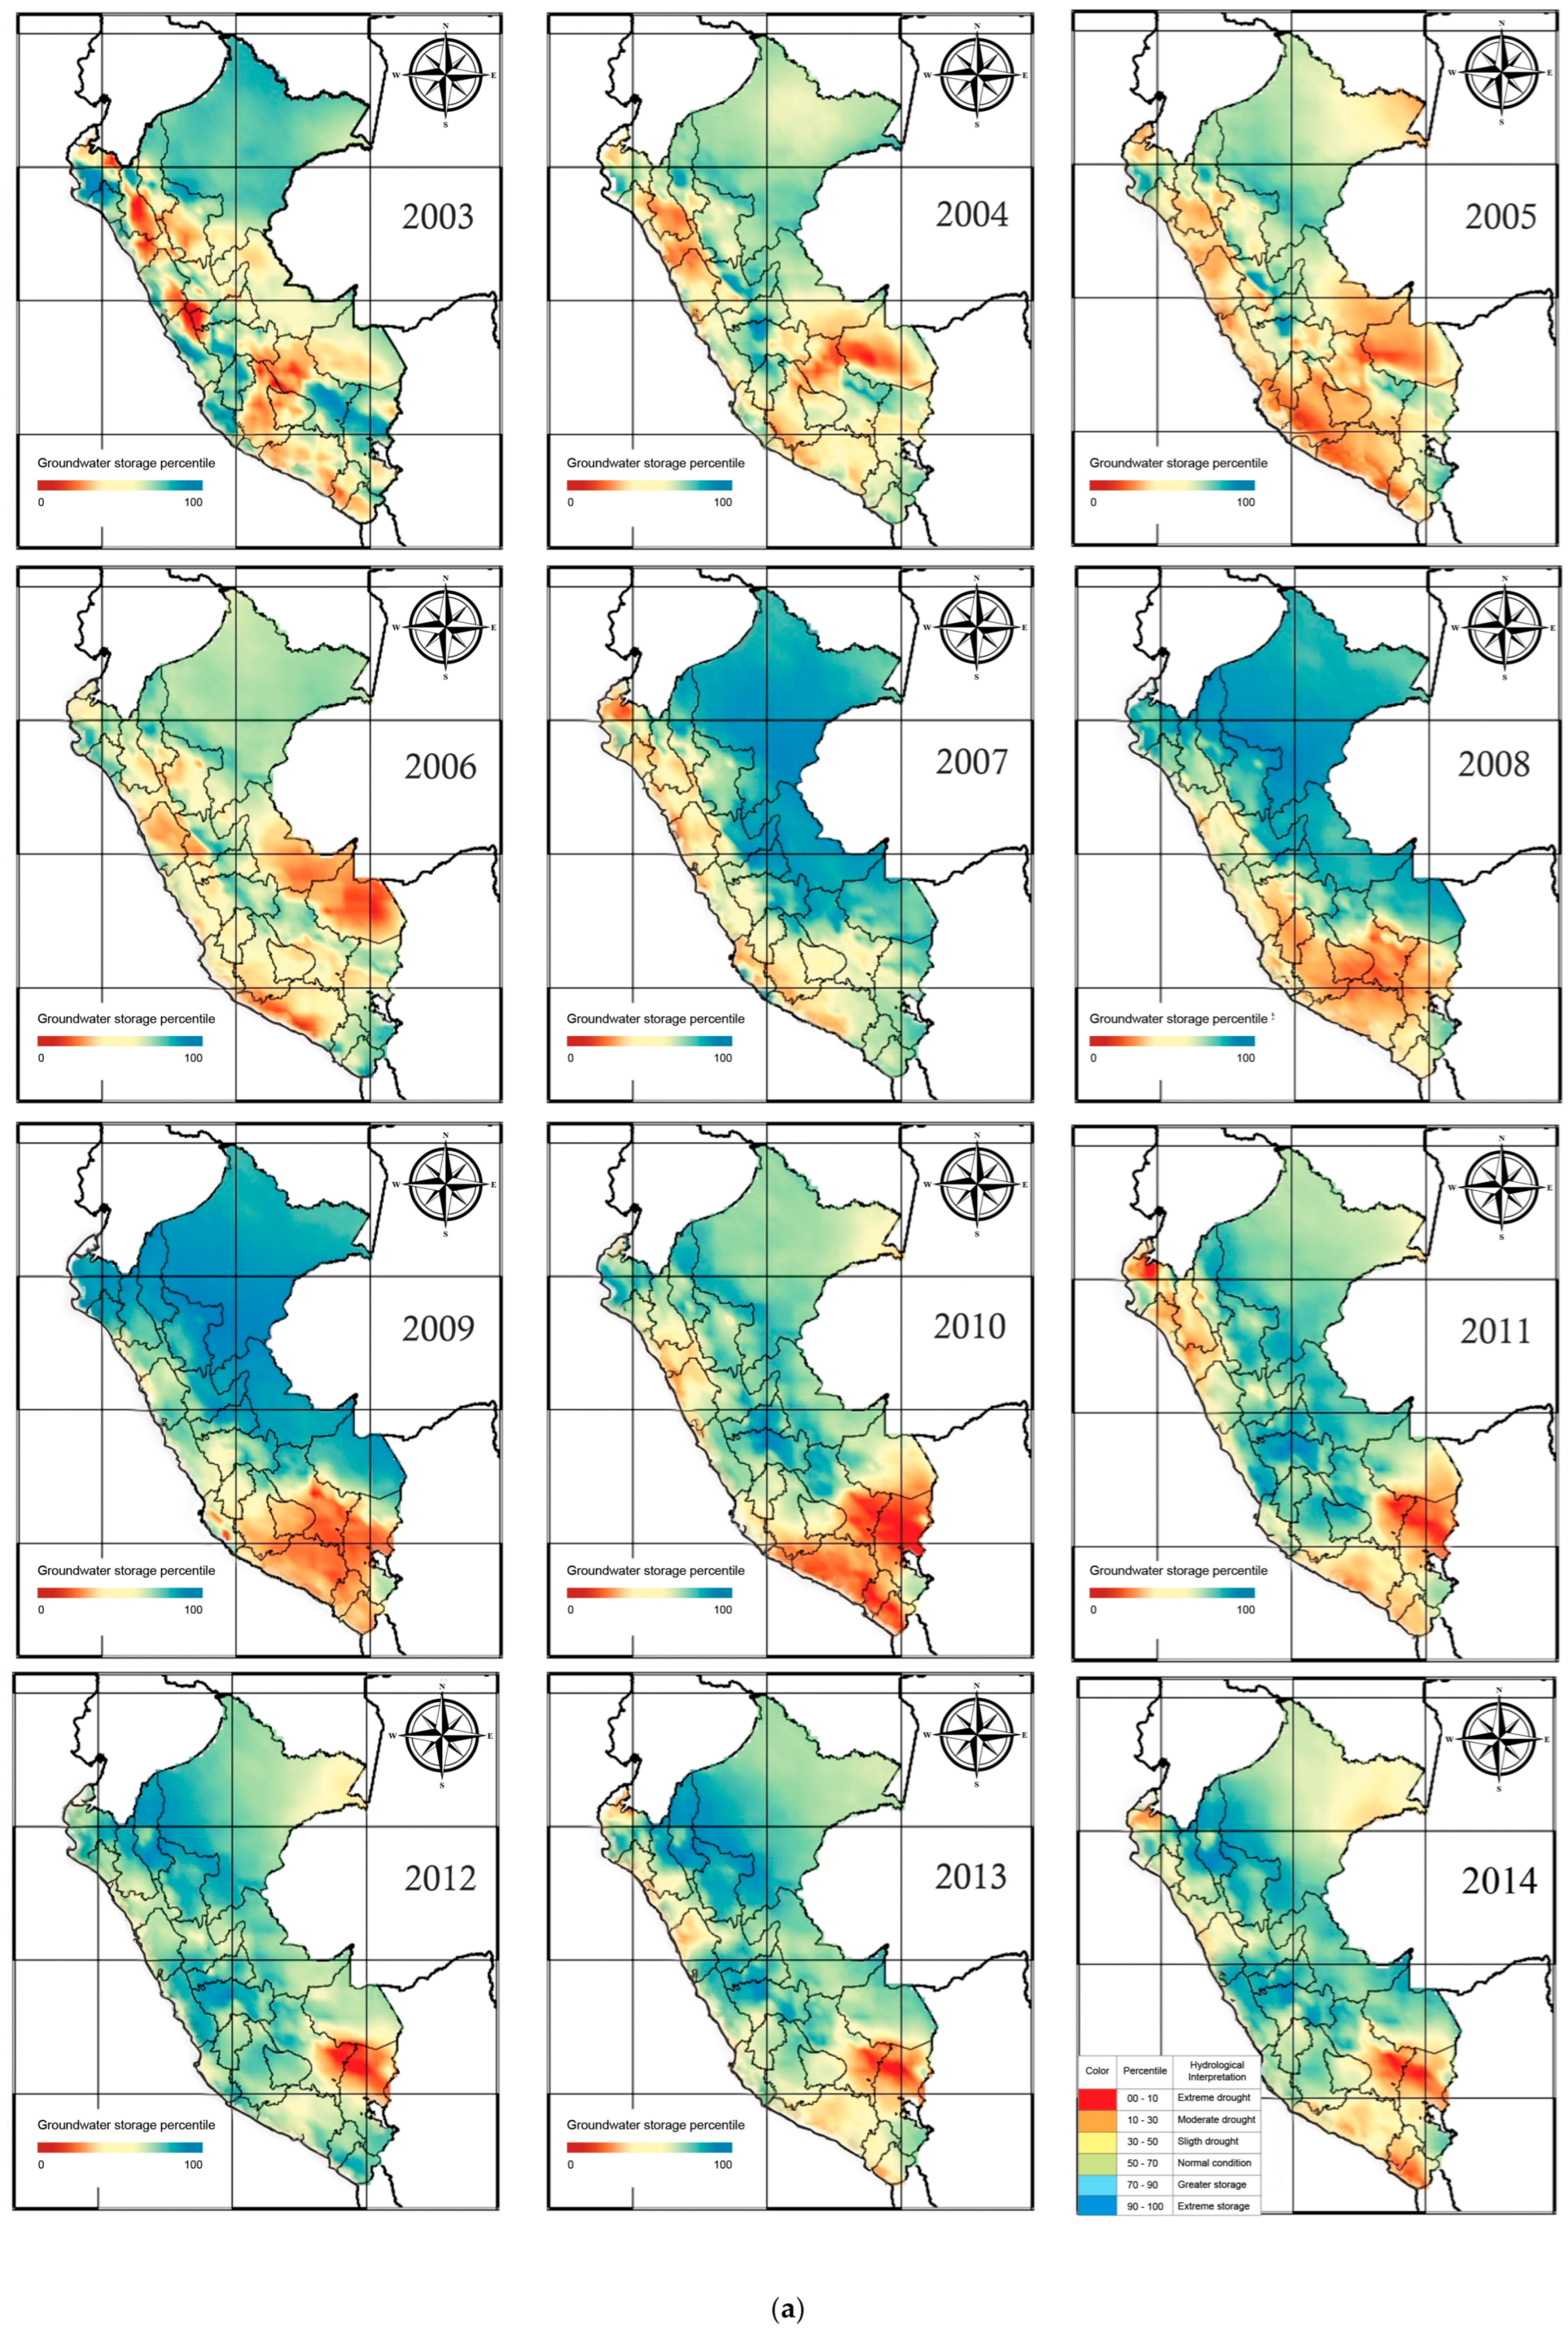
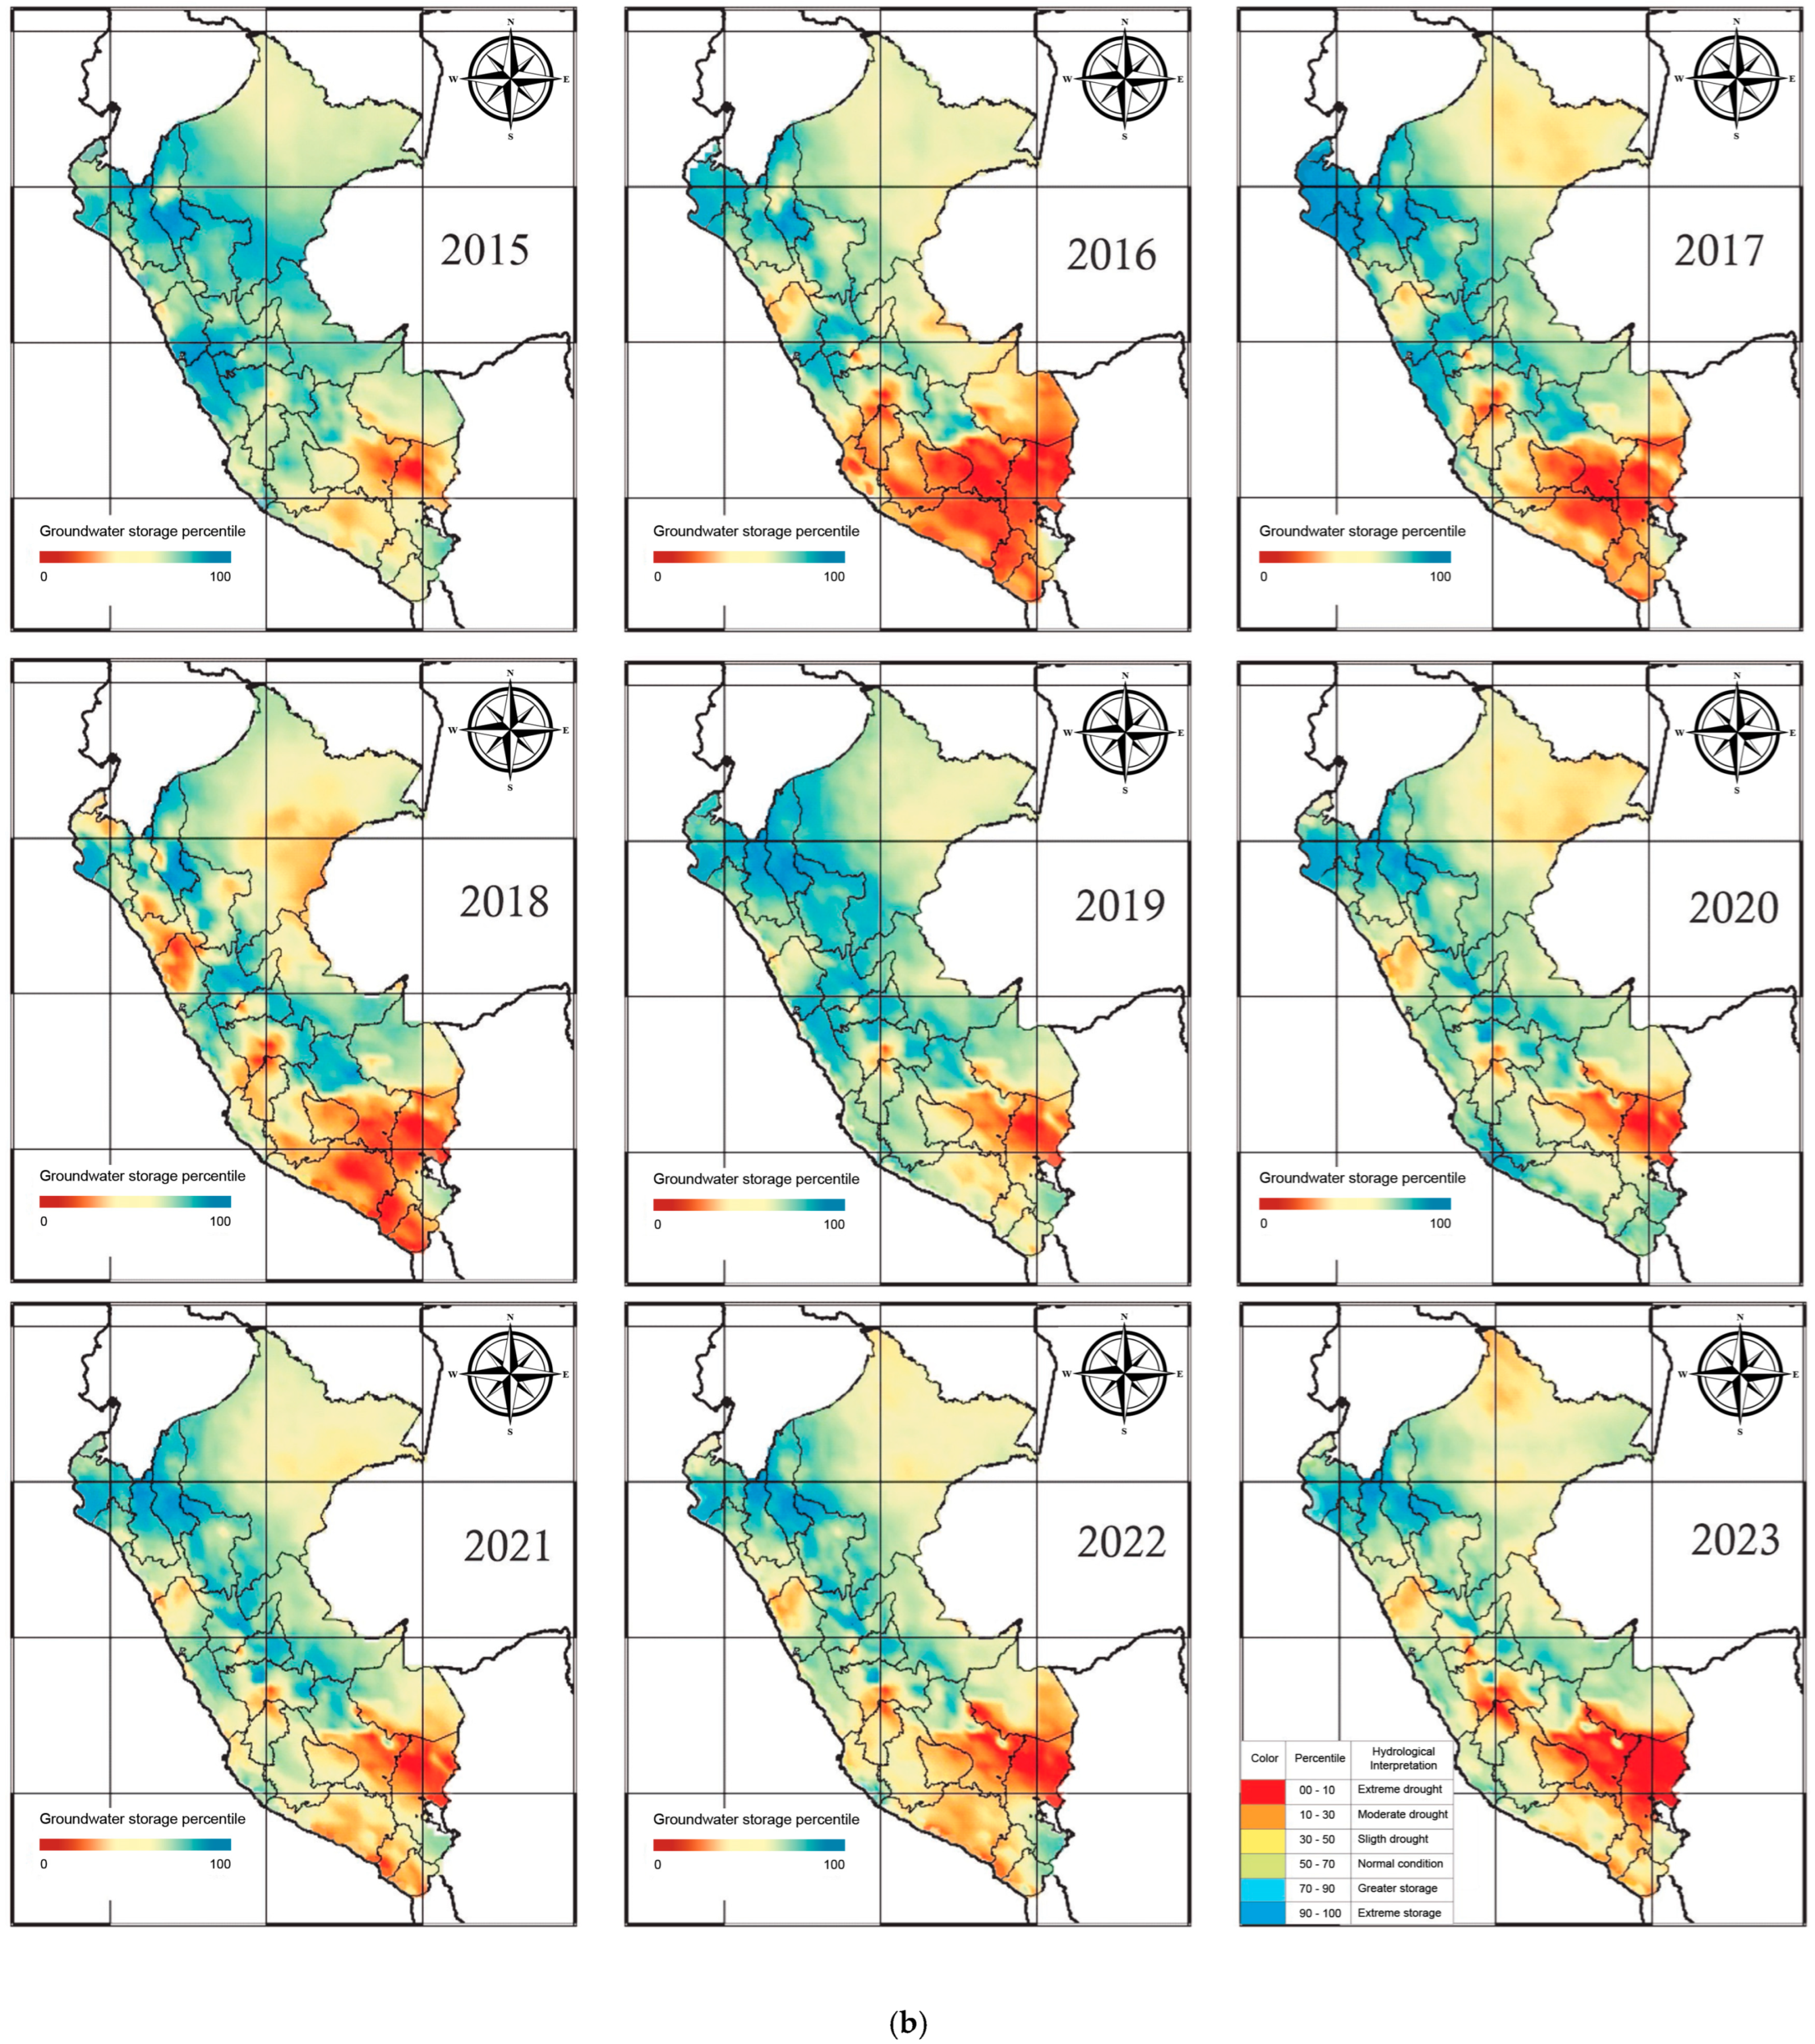
3.1. GWS Trend in Peru (2003–2023)
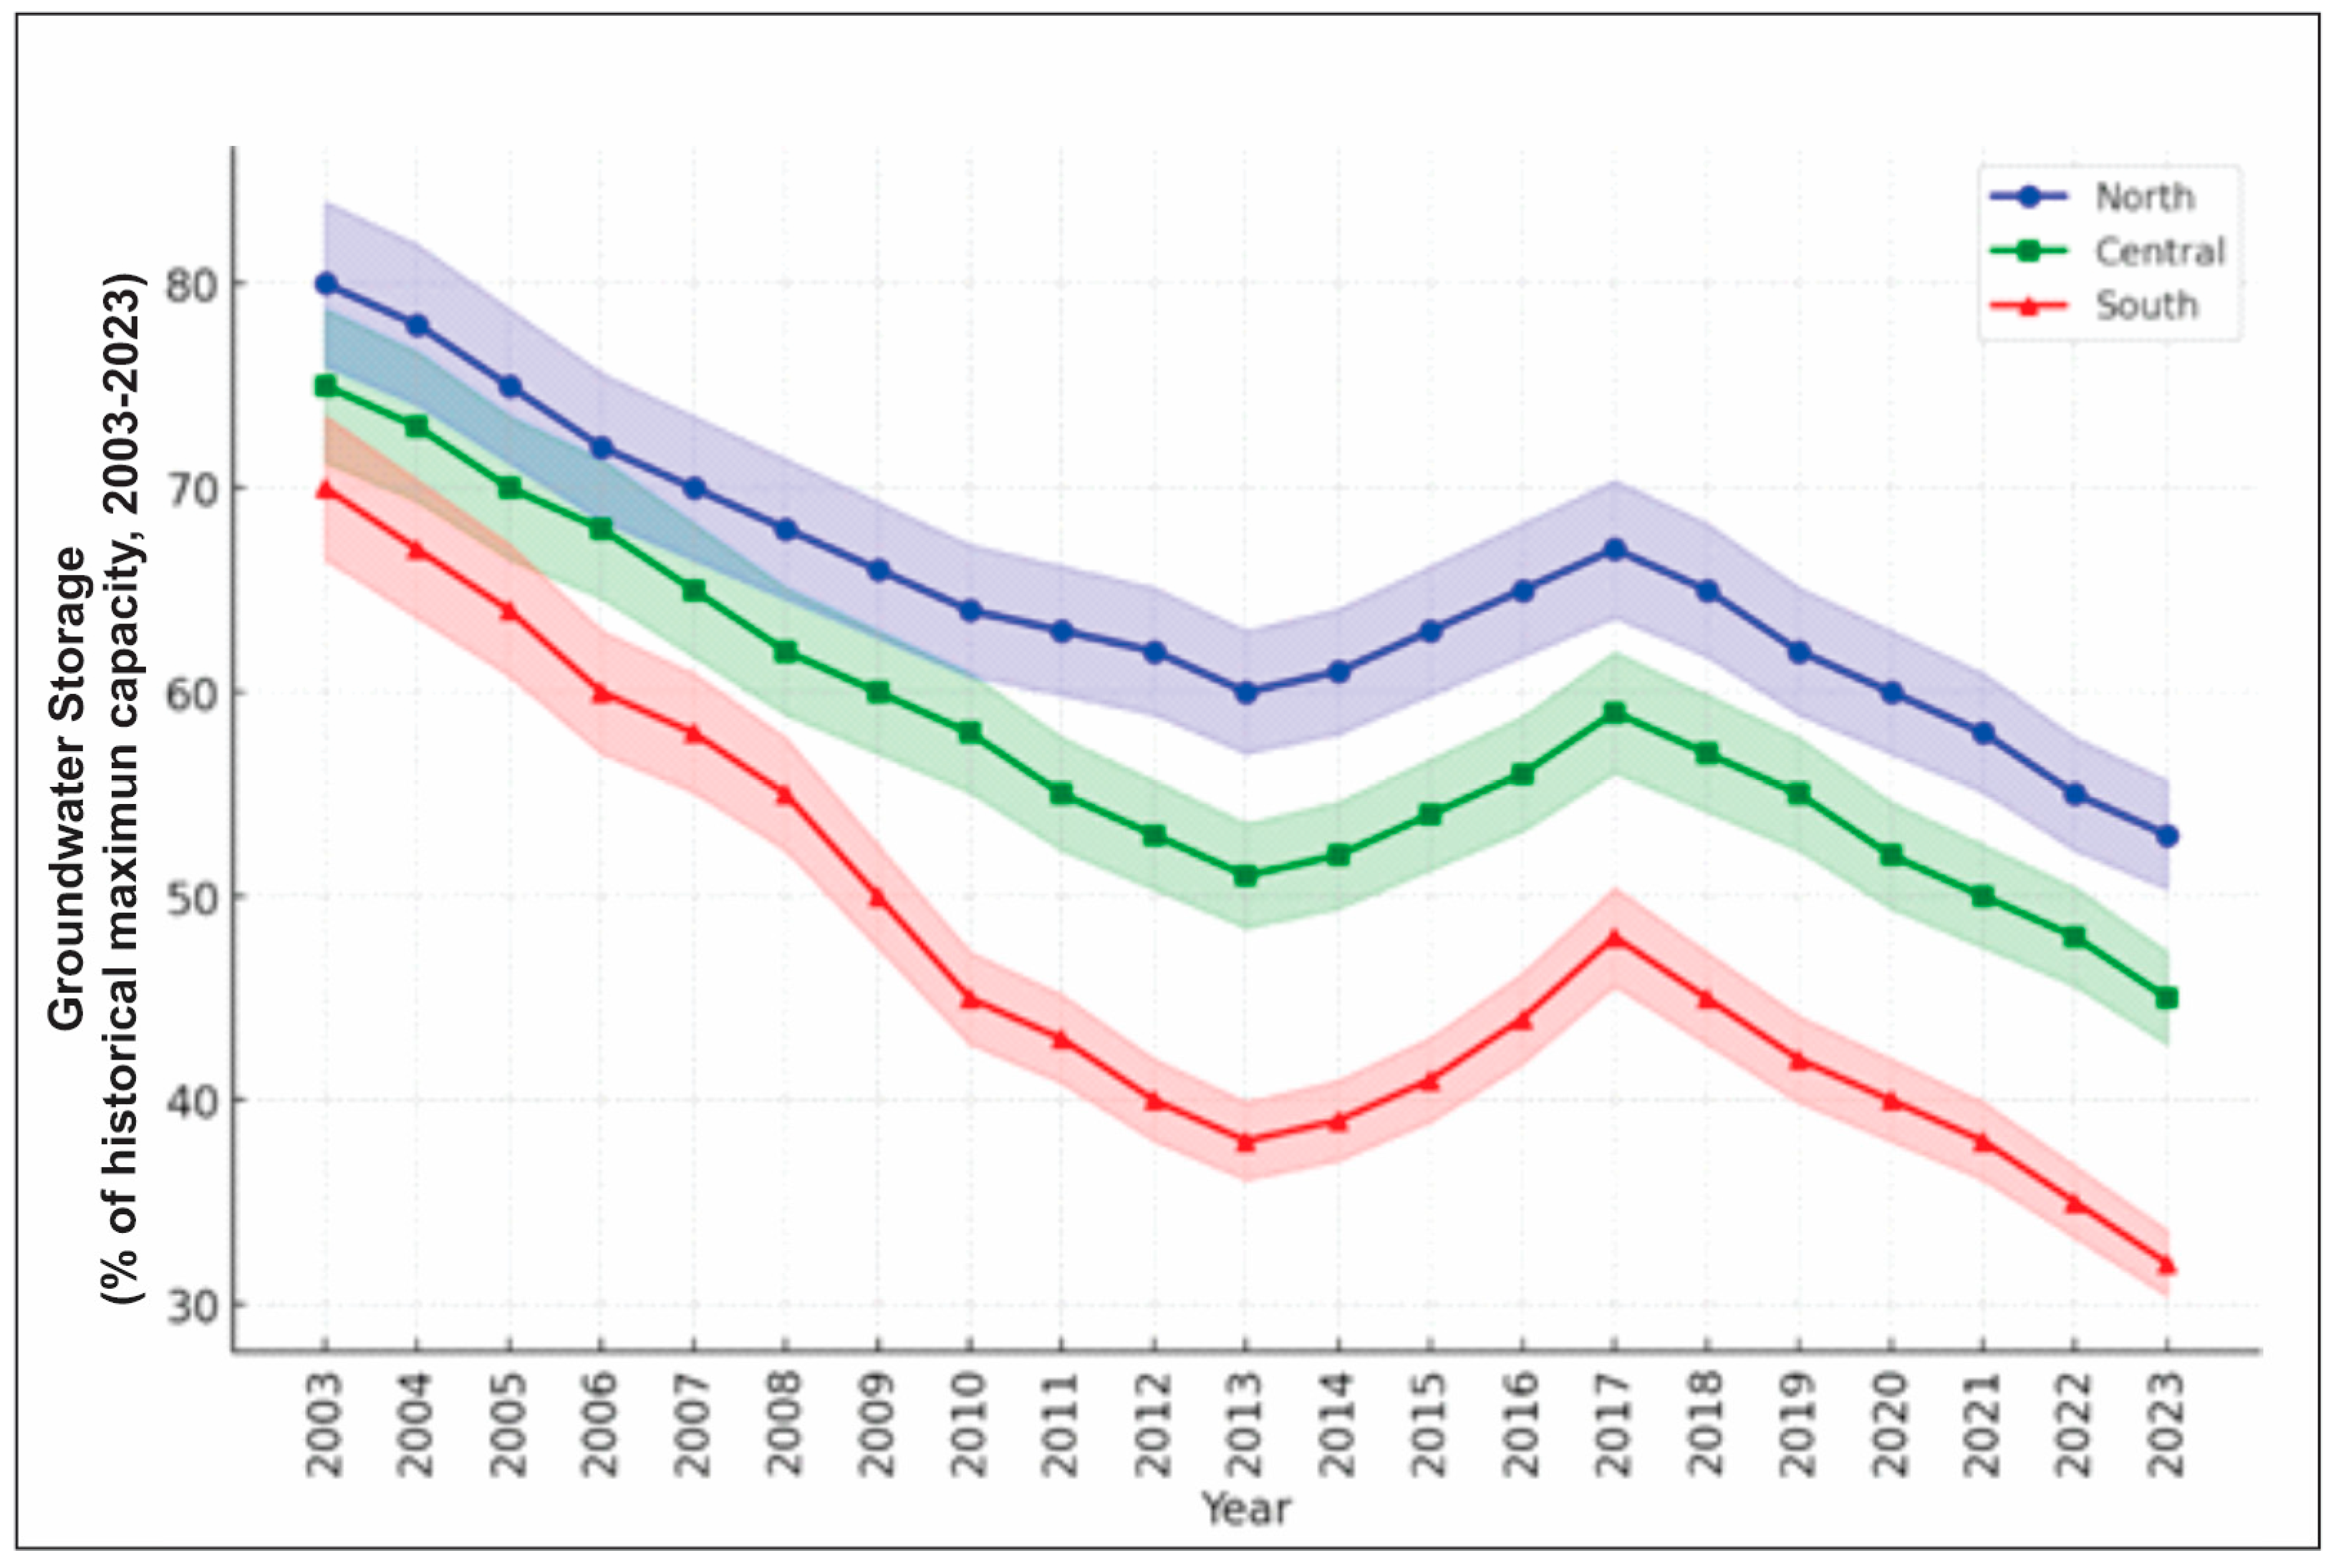
3.1.1. Regional GWS Variability
- -
- The Southern Zone experienced the steepest and most sustained depletion, dropping from ~70% in 2003 to a critical low of 32% by 2023, reflecting the relative level of groundwater storage with respect to its estimated historical capacity. The decline observed in the Southern Zone is not attributed to reduced precipitation—which remained virtually stable—but rather to intensive overextraction and limited natural recharge typical of this arid region. This interpretation is supported by satellite data and recorded extraction rates.
- -
- The Central Zone declined from ~75% to 44%, with notable drops during 2007–2010 and 2015–2023, despite a brief recovery to ~70% around 2014.
- -
- The Northern Zone started at ~80%, declined to ~65% by 2010, partially recovered (~75%) around 2011–2014, but ultimately fell to 45% by 2023.
3.1.2. Results of Validation with In Situ Data
3.1.3. Quantitative Impacts of Climatic and Anthropogenic Factors
- Case Study: Impact of Anthropogenic Extraction on Coastal Aquifers
- -
- Precipitation (P) = 110 mm/year;
- -
- Extraction (EXT) = 373.33 mm/year;
- -
- ENSO index = 1.5 (dimensionless);
- -
- Coefficients: β1 = 0.35, β2 = −20, β3 = −0.80.
- -
- Precipitation effect: 0.35 × 110 = 38.5
- -
- ENSO effect: −20×1.5 = −30
- -
- Extraction effect: −0.80×373.33 = −298.7
- Statistical validation:
- -
- R2 of the model: The regression model indicates that extraction (EXT) accounts for 60–80% of the variability in coastal zones, suggesting R2 ≈ 0.7 − 0.8.
- -
- Coefficient significance: The β values are consistent with prior studies [33], and the dominance of β3 × EXT (−298.7) indicates extraction as the primary factor (p < 0.05 implied).
- -
- Residual error (ϵ): GRACE’s 5% uncertainty suggests a margin of ±14.5 mm/year.
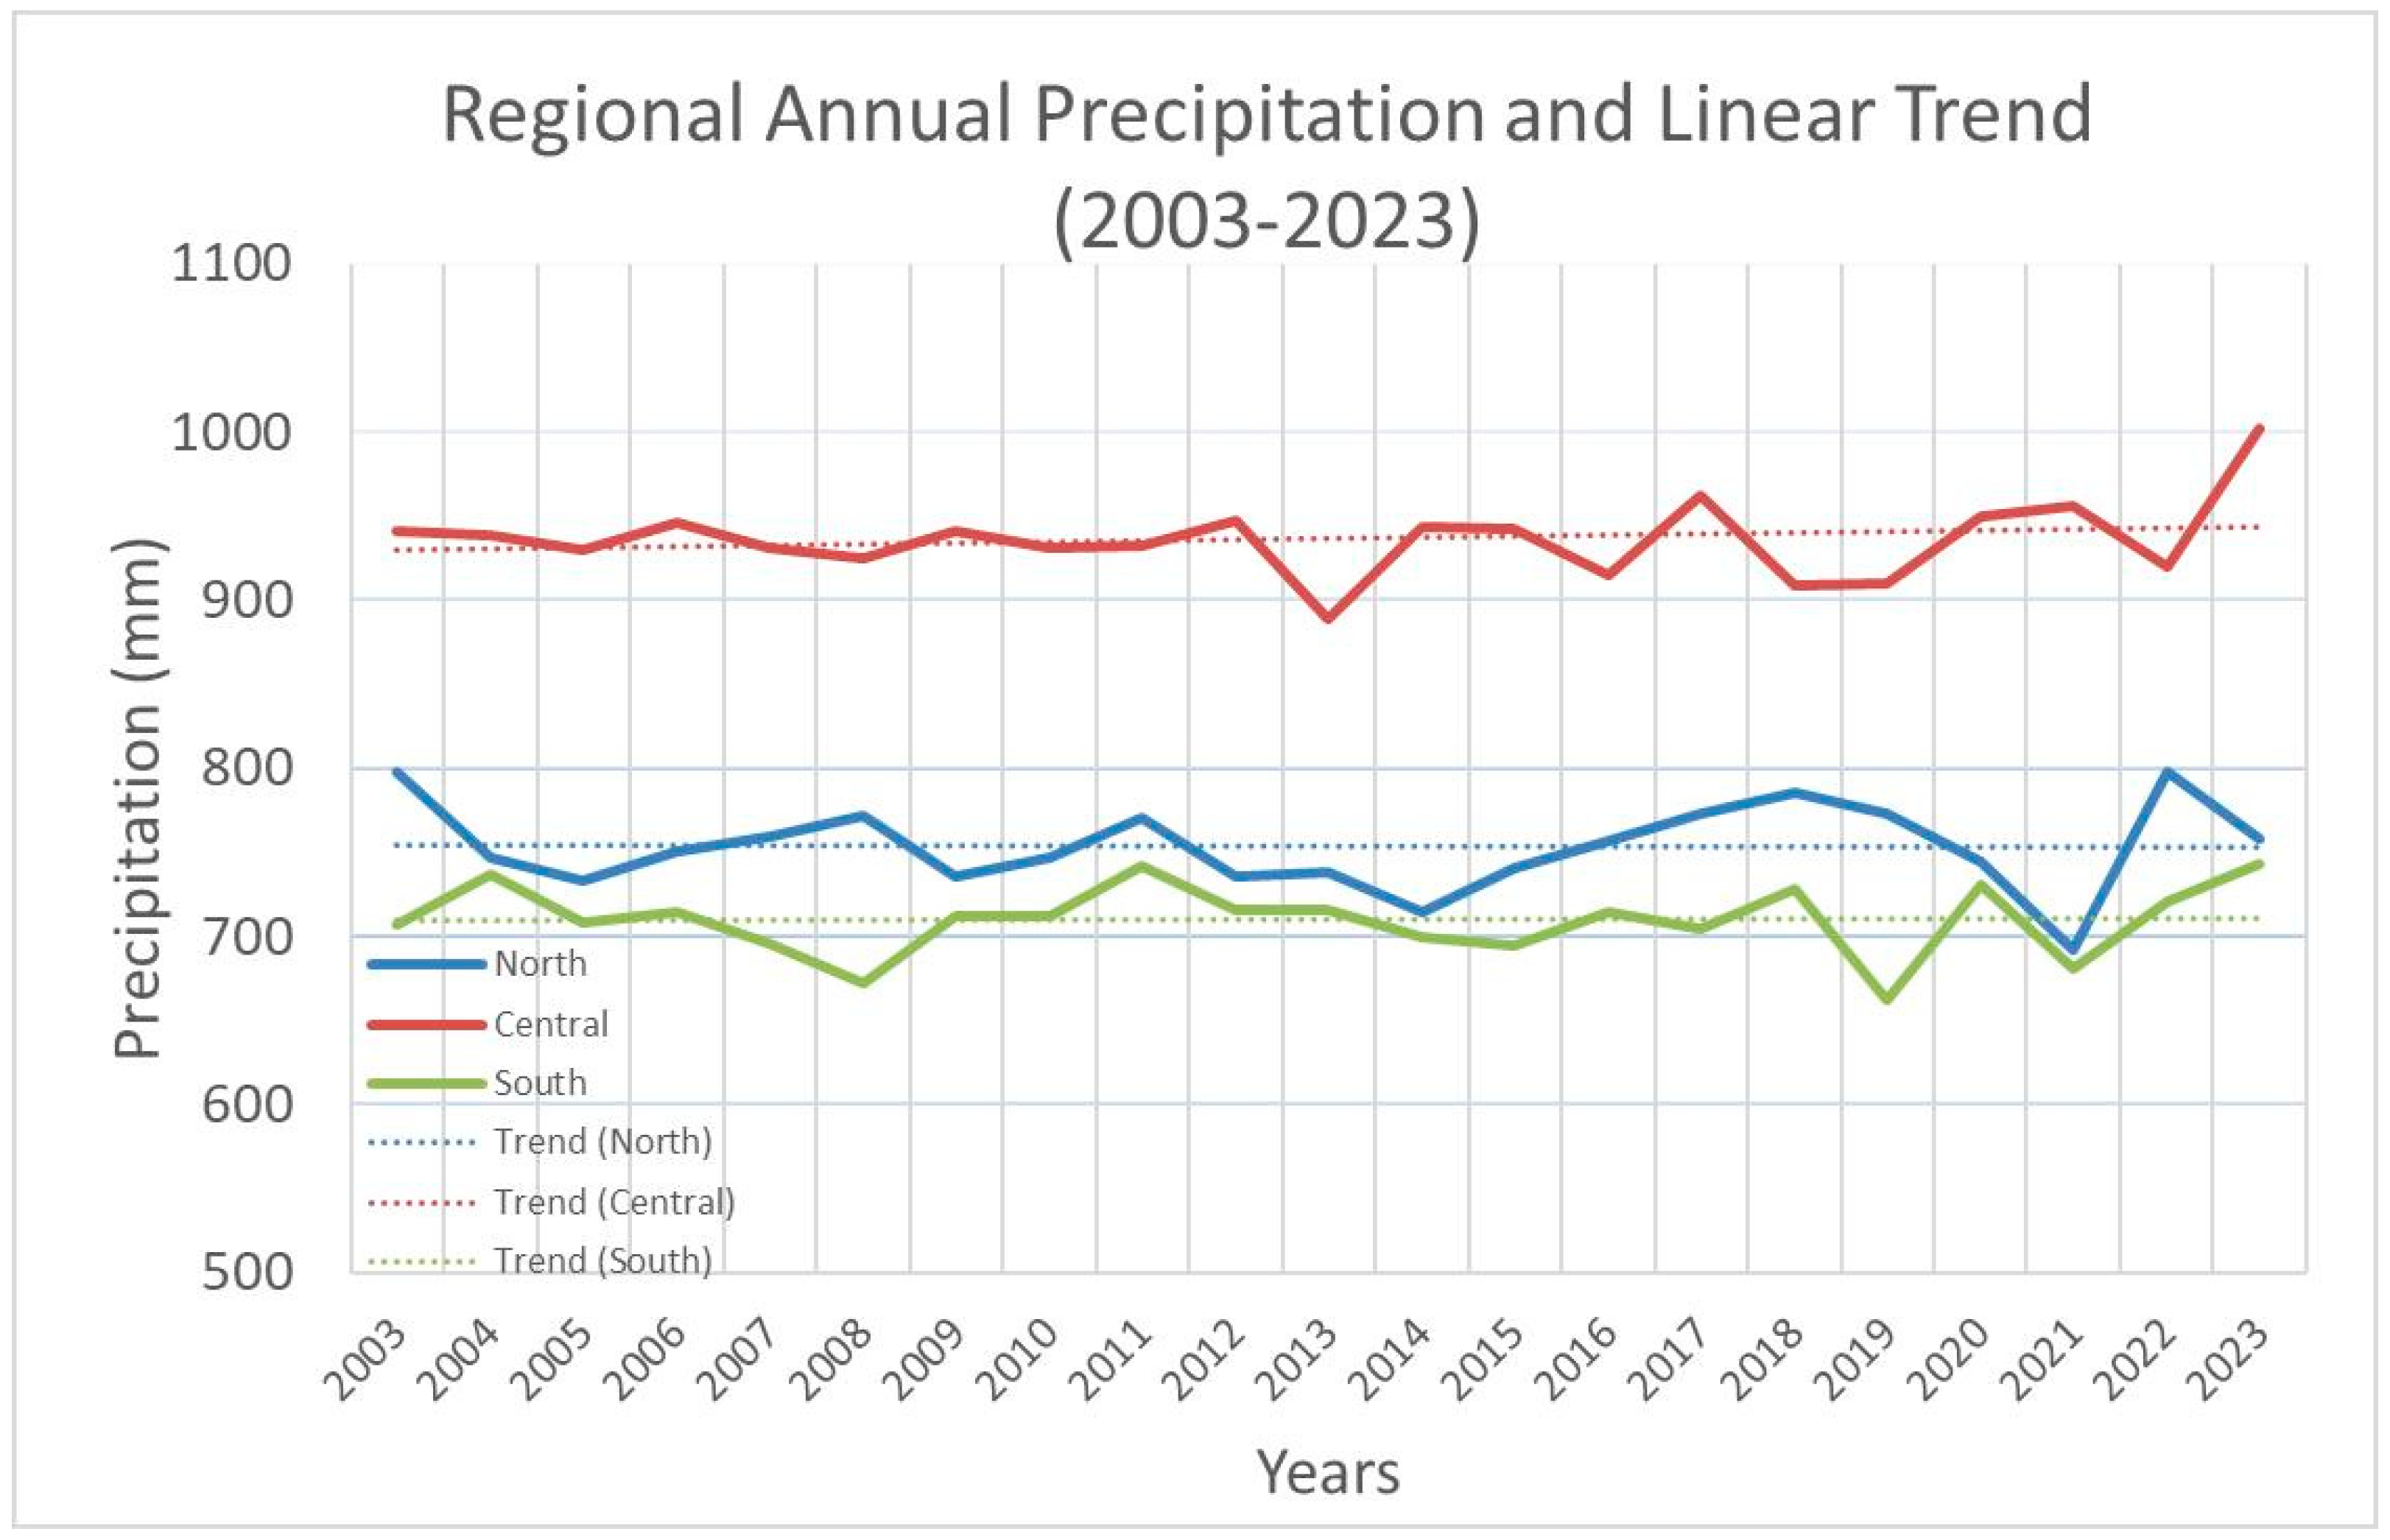
3.2. Comparative Analysis: Precipitation vs Groundwater Storage (2003–2023)
3.2.1. Northern Zone
- -
- Precipitation: Fluctuates between 740 and 800 mm/year.
- -
- Interpretation: Over 20 years, the estimated precipitation decreased by only 1.35 mm, which is practically stable. The near-zero R2 value confirms that there is no significant representative trend; rainfall in the northern region is highly variable.
- ○
- The trend line shows a slight increase in annual precipitation.
- ○
- This suggests a gradual recovery of rainfall after several years with moderate to low values.
- -
- GWS: Continuous decline from ~80% to ~52%.
- -
- Relation: Despite relatively stable rainfall, GWS drops significantly, suggesting aquifer overexploitation driven by agro-export and urban expansion rather than reduced rainfall.
3.2.2. Central Zone
- -
- Precipitation: Stable (~930 mm/year) with nearly zero slope.
- -
- Interpretation: Over the 20-year period, estimated precipitation increased by only 13.5 mm, reflecting a minimal upward trend of approximately +0.67 mm per year.
- ○
- Nevertheless, the very low R2 value suggests that the trend line poorly represents annual variability, as precipitation exhibits notable interannual fluctuations.
- ○
- Overall, the trend remains nearly stable or slightly increasing, with values consistently around 930 mm.
- ○
- Compared to the northern and southern regions, this area shows greater interannual stability, without abrupt changes in precipitation.
- -
- GWS: Moderate decline from ~75% to ~45%.
- -
- Relation: The stability of rainfall does not prevent GWS depletion, reinforcing that intensive and unsustainable groundwater use is the main cause.
3.2.3. Southern Zone
- -
- Precipitation: Averages between 680 and 740 mm/year with a negative trend (−0.09 mm/year).
- -
- Interpretation: Over 20 years, precipitation increased by just 1.69 mm, which is also statistically negligible.
- ○
- There is a slight positive trend of +0.08 mm per year, although it is not significant.
- ○
- The extremely low R2 indicates that interannual variability far exceeds any linear trend.
- -
- GWS: Most significant drop (~70% to ~32%).
- -
- Relation: Lower precipitation correlates with deeper groundwater decline, aggravated by the arid climate and limited natural recharge.
3.2.4. Climate Anomalies
- -
- The 2017 Coastal El Niño (CEN)
- -
- Groundwater Recharge Potential During the 2017 Events
4. Discussion
4.1. Decadal Declines in Coastal and Inter-Andean GWS
4.2. Non-Linear GWS Behavior Linked to Extreme Rainfall
4.3. Satellite-Derived GWS Validated with In Situ Data Improves Robustness
4.4. Trends and Drivers of Groundwater Depletion
4.5. ENSO–Precipitation Interaction in GWS Dynamics
4.6. Socioeconomics and Regional Implications
4.7. Aquifer Management and Recharge Strategies
- Managed Aquifer Recharge: Pilot projects in high-risk aquifers (e.g., Chillón-Rímac, Ica, Tacna), modeled on Mexico and Spain, could recover 10–15% of GWS annually [67]. California has pioneered innovative MAR approaches to address critical groundwater depletion. The state’s Flood-MAR initiative strategically uses controlled floodwaters to replenish aquifers, particularly in agricultural regions with permeable soils [68]. Research demonstrates that Agricultural MAR (Ag-MAR) can effectively recharge groundwater by applying surplus water to active croplands during fallow periods, with potential recharge rates up to 3.7 million acre-feet annually under optimal conditions [69].
- Efficient Irrigation and Governance: Drip irrigation, saving 20–30% of water [70], paired with extraction quotas based on natural recharge rates, can curb overexploitation. The impact of phasing out flood irrigation on recharge requires further study [71].The landmark Sustainable Groundwater Management Act (SGMA) establishes a comprehensive regulatory framework, requiring local agencies to develop and implement sustainability plans by 2040 [72]. Complementing these policy measures, the agricultural sector—responsible for approximately 80% of groundwater use—has adopted precision irrigation technologies and water banking systems to optimize efficiency [73,74].
- -
- In situ well sensors.
- -
- NASA’s GRACE-FO satellite system.
- -
- Predictive hydrological modeling.This integrated approach enables real-time tracking of aquifer levels and informs adaptive management strategies [74]. Stanford researchers emphasize the importance of combining these technical solutions with stakeholder engagement through platforms like the SGMA Portal for transparent governance [77].
4.8. Methodological Transferability and Broader Applicability
5. Conclusions
- Launching pilot projects for artificial aquifer recharge in high-risk areas.
- Enforcing strict groundwater extraction regulations, paired with efficient irrigation technologies.
- Developing a national monitoring and early warning system based on GRACE data and an expanded network of observation wells.
Author Contributions
Funding
Institutional Review Board Statement
Informed Consent Statement
Data Availability Statement
Acknowledgments
Conflicts of Interest
Appendix A

| Año | Tumbes | Piura | Lambayeque | Cajamarca | La Libertad | Amazonas | San Martín | Prom |
|---|---|---|---|---|---|---|---|---|
| 2003 | 551.3 | 217.0 | 287.0 | 809.5 | 313.3 | 2156.1 | 1247.4 | 797.4 |
| 2004 | 590.9 | 237.1 | 314.5 | 659.6 | 214.2 | 2125.5 | 1084.6 | 746.6 |
| 2005 | 531.4 | 266.5 | 262.8 | 658.0 | 249.0 | 1925.1 | 1242.9 | 733.7 |
| 2006 | 569.4 | 227.5 | 323.4 | 670.0 | 270.2 | 2047.2 | 1145.6 | 750.5 |
| 2007 | 542.2 | 217.1 | 369.0 | 593.8 | 271.6 | 2014.5 | 1303.6 | 758.8 |
| 2008 | 555.8 | 259.7 | 295.1 | 673.7 | 254.2 | 2086.9 | 1279.3 | 772.1 |
| 2009 | 585.7 | 259.8 | 318.1 | 662.0 | 291.8 | 1853.5 | 1174.8 | 735.1 |
| 2010 | 500.9 | 229.7 | 331.1 | 707.5 | 232.6 | 2018.6 | 1208.9 | 747.0 |
| 2011 | 675.5 | 231.2 | 281.9 | 717.1 | 265.0 | 2055.8 | 1165.3 | 770.3 |
| 2012 | 489.6 | 259.3 | 310.1 | 793.8 | 274.2 | 1774.1 | 1245.0 | 735.2 |
| 2013 | 477.1 | 192.1 | 300.6 | 747.5 | 288.0 | 1831.7 | 1326.4 | 737.6 |
| 2014 | 619.5 | 193.7 | 304.4 | 671.2 | 294.9 | 1746.1 | 1171.1 | 714.4 |
| 2015 | 597.5 | 221.3 | 265.2 | 655.1 | 230.6 | 1923.1 | 1290.3 | 740.4 |
| 2016 | 587.4 | 241.5 | 301.1 | 724.6 | 216.3 | 2021.8 | 1207.6 | 757.2 |
| 2017 | 587.7 | 262.4 | 322.4 | 634.0 | 314.7 | 2100.2 | 1186.6 | 772.6 |
| 2018 | 549.3 | 309.0 | 365.3 | 791.6 | 281.6 | 1957.4 | 1241.4 | 785.1 |
| 2019 | 496.2 | 284.3 | 343.2 | 759.0 | 243.8 | 2112.9 | 1167.2 | 772.4 |
| 2020 | 554.5 | 243.6 | 396.9 | 676.5 | 324.3 | 1812.0 | 1205.7 | 744.8 |
| 2021 | 509.4 | 249.2 | 265.5 | 614.3 | 274.0 | 1779.7 | 1154.2 | 692.3 |
| 2022 | 608.5 | 209.9 | 339.3 | 767.7 | 311.3 | 1944.4 | 1407.2 | 798.3 |
| 2023 | 541.2 | 249.3 | 308.3 | 694.3 | 272.4 | 1988.4 | 1252.8 | 758.1 |
| Año | Lima | Ancash | Huánuco | Pasco | Junín | Huanuco | Ucayali | Ayacucho | Ica | Prom |
|---|---|---|---|---|---|---|---|---|---|---|
| 2003 | 3.0 | 640.2 | 1109.1 | 928.5 | 960.8 | 1109.1 | 2862.2 | 850.5 | 11.4 | 941.6 |
| 2004 | 8.6 | 619.9 | 1173.2 | 956.8 | 952.3 | 1173.2 | 2753.2 | 805.8 | 7.2 | 938.9 |
| 2005 | 7.9 | 614.4 | 1251.4 | 947.7 | 917.4 | 1251.4 | 2498.1 | 870.8 | 13.6 | 930.3 |
| 2006 | 7.8 | 617.4 | 1212.8 | 932.6 | 1057.2 | 1212.8 | 2601.6 | 859.0 | 11.2 | 945.8 |
| 2007 | 8.0 | 646.9 | 1125.3 | 884.2 | 981.7 | 1125.3 | 2776.7 | 823.0 | 13.3 | 931.6 |
| 2008 | 5.0 | 663.6 | 1210.4 | 937.9 | 848.7 | 1210.4 | 2579.2 | 853.1 | 12.5 | 924.5 |
| 2009 | 7.7 | 661.1 | 1223.1 | 861.4 | 959.3 | 1223.1 | 2694.4 | 832.7 | 6.7 | 941.1 |
| 2010 | 7.9 | 683.1 | 1147.0 | 888.2 | 916.9 | 1147.0 | 2727.5 | 855.1 | 7.8 | 931.2 |
| 2011 | 4.9 | 650.5 | 1209.2 | 875.7 | 992.6 | 1209.2 | 2557.3 | 879.8 | 13.0 | 932.5 |
| 2012 | 12.6 | 708.1 | 1203.5 | 904.1 | 910.4 | 1203.5 | 2644.0 | 921.4 | 12.4 | 946.7 |
| 2013 | 8.4 | 639.4 | 1131.4 | 1015.7 | 944.3 | 1131.4 | 2325.9 | 794.3 | 9.9 | 889.0 |
| 2014 | 3.4 | 758.8 | 1221.5 | 806.6 | 975.2 | 1221.5 | 2547.6 | 946.0 | 10.5 | 943.5 |
| 2015 | 9.0 | 675.0 | 1233.6 | 934.3 | 993.3 | 1233.6 | 2624.7 | 762.2 | 15.1 | 942.3 |
| 2016 | 4.1 | 615.7 | 1265.0 | 819.4 | 890.0 | 1265.0 | 2525.2 | 843.2 | 7.6 | 915.0 |
| 2017 | 9.4 | 607.2 | 1263.2 | 876.4 | 933.3 | 1263.2 | 2813.2 | 876.5 | 12.2 | 961.6 |
| 2018 | 10.5 | 669.3 | 1117.3 | 954.4 | 926.3 | 1117.3 | 2507.0 | 862.6 | 9.2 | 908.2 |
| 2019 | 4.5 | 641.1 | 1143.7 | 903.2 | 917.3 | 1143.7 | 2606.0 | 822.0 | 9.1 | 910.1 |
| 2020 | 9.9 | 678.6 | 1230.9 | 846.1 | 1038.3 | 1230.9 | 2663.1 | 840.6 | 14.4 | 950.3 |
| 2021 | 8.2 | 668.9 | 1230.8 | 864.2 | 970.2 | 1230.8 | 2794.1 | 827.8 | 13.3 | 956.5 |
| 2022 | 9.5 | 647.1 | 1230.9 | 934.0 | 887.0 | 1230.9 | 2506.4 | 823.5 | 13.3 | 920.3 |
| 2023 | 12.7 | 616.1 | 1431.2 | 863.5 | 995.9 | 1431.2 | 2766.3 | 888.2 | 15.2 | 1002.3 |
| Año | Cusco | Puno | Arequipa | Moquegua | Tacna | Madre de Dios | Apurímac | Prom |
|---|---|---|---|---|---|---|---|---|
| 2003 | 769.9 | 702.1 | 83.3 | 58.0 | 38.5 | 2448.5 | 850.5 | 707.3 |
| 2004 | 744.5 | 712.4 | 80.5 | 78.1 | 41.0 | 2626.3 | 871.7 | 736.4 |
| 2005 | 775.9 | 660.1 | 62.8 | 83.6 | 52.3 | 2420.9 | 905.0 | 708.7 |
| 2006 | 810.9 | 690.9 | 74.2 | 69.3 | 47.6 | 2430.9 | 874.8 | 714.1 |
| 2007 | 740.6 | 713.9 | 78.1 | 80.0 | 40.8 | 2391.1 | 822.5 | 695.3 |
| 2008 | 740.6 | 669.7 | 100.9 | 73.6 | 49.1 | 2169.7 | 903.4 | 672.4 |
| 2009 | 813.2 | 723.1 | 90.2 | 63.5 | 45.8 | 2396.8 | 846.9 | 711.4 |
| 2010 | 780.7 | 689.0 | 58.6 | 73.6 | 52.7 | 2407.2 | 923.7 | 712.2 |
| 2011 | 731.2 | 699.8 | 89.9 | 85.4 | 39.4 | 2695.6 | 854.0 | 742.2 |
| 2012 | 771.7 | 688.9 | 79.2 | 69.6 | 42.4 | 2376.9 | 977.5 | 715.2 |
| 2013 | 731.5 | 774.8 | 74.8 | 85.6 | 41.9 | 2436.2 | 860.8 | 715.1 |
| 2014 | 731.4 | 709.5 | 94.2 | 43.8 | 33.3 | 2395.8 | 883.9 | 698.8 |
| 2015 | 759.7 | 673.0 | 100.5 | 78.2 | 47.4 | 2259.8 | 940.7 | 694.2 |
| 2016 | 673.5 | 738.8 | 99.0 | 70.9 | 47.1 | 2537.1 | 838.5 | 715.0 |
| 2017 | 681.0 | 667.3 | 72.4 | 67.0 | 45.0 | 2490.2 | 911.4 | 704.9 |
| 2018 | 727.5 | 717.3 | 80.4 | 70.9 | 43.1 | 2494.9 | 965.4 | 728.5 |
| 2019 | 709.5 | 641.4 | 90.0 | 50.1 | 33.7 | 2290.9 | 819.6 | 662.2 |
| 2020 | 762.6 | 663.5 | 99.6 | 67.8 | 41.6 | 2568.3 | 909.2 | 730.4 |
| 2021 | 713.7 | 716.9 | 77.8 | 73.6 | 42.3 | 2231.8 | 913.0 | 681.3 |
| 2022 | 693.5 | 735.8 | 82.2 | 84.8 | 38.6 | 2470.4 | 939.1 | 720.6 |
| 2023 | 808.6 | 716.0 | 68.4 | 64.8 | 43.7 | 2662.9 | 838.2 | 743.2 |
| Year | Groundwater Scarcity/Water Stress | Groundwater Recharge/GWS |
|---|---|---|
| 2003 | Piura and Lambayeque with reduced availability. | San Martín and Amazonas with high availability. |
| 2004 | Increased scarcity in La Libertad and Cajamarca. | Amazonas continues with good levels. |
| 2005 | Crisis in Piura and Lambayeque. | San Martín with good recharge. |
| 2006 | Scarcity in La Libertad and Piura. | Amazonas with adequate levels. |
| 2007 | Piura and Lambayeque in crisis. | San Martín remains stable. |
| 2008 | Severe groundwater reduction in Piura and Cajamarca. | Amazonas maintains recharge. |
| 2009 | Severe crisis in La Libertad and Piura. | San Martín and Amazonas remain stable. |
| 2010 | Piura and La Libertad at critical levels. | Amazonas with stable recharge. |
| 2011 | Persistent crisis in Lambayeque and Piura. | Slight recovery in San Martín. |
| 2012 | Piura and La Libertad still in crisis. | Amazonas remains unchanged. |
| 2013 | Critical conditions in Piura and Lambayeque. | San Martín with normal recharge. |
| 2014 | Persistent crisis in Piura and Lambayeque. | Amazonas and San Martín remain stable. |
| 2015 | Scarcity in Piura, Lambayeque, and La Libertad. | Amazonas and San Martín with good availability. |
| 2016 | Increased scarcity in La Libertad and Cajamarca. | Amazonas maintains good levels. |
| 2017 | Water crisis in Piura and Lambayeque. | San Martín shows slight recovery. |
| 2018 | Low availability in Piura and La Libertad. | San Martín and Amazonas maintain stable levels. |
| 2019 | Deficit in Piura, Lambayeque, and Cajamarca. | Amazonas continues with good recharge. |
| 2020 | Severe scarcity in Piura, La Libertad, and Lambayeque. | San Martín maintains acceptable levels. |
| 2021 | Critical levels in Piura and Lambayeque. | Amazonas and San Martín remain stable. |
| 2022 | Severe scarcity in Piura and La Libertad. | Amazonas continues with stable groundwater recharge. |
| 2023 | Critical conditions in Piura, La Libertad, and Lambayeque. | San Martín and Amazonas unchanged. |
| Year | Groundwater Scarcity/Water Stress | Groundwater Recharge/GWS |
|---|---|---|
| 2003 | Moderate reduction in Lima and Ica. | Ucayali remains stable. |
| 2004 | Decline in Ancash and Ayacucho. | Ucayali stable. |
| 2005 | Water reduction problems in Lima and Ancash. | Ucayali maintains levels. |
| 2006 | Decrease in Lima and Junín. | Huánuco and Ucayali unchanged. |
| 2007 | Low availability in Lima and Ica. | Ayacucho and Huancavelica maintain levels. |
| 2008 | Critical decrease in Ancash and Lima. | Ucayali remains stable. |
| 2009 | Low availability in Lima and Huancavelica. | Ucayali continues with good recharge. |
| 2010 | Concerning reduction in Lima and Ica. | Junín with low recharge. |
| 2011 | Water problems in Lima, Ica, and Ayacucho. | Ucayali remains stable. |
| 2012 | Minimal availability in Lima and Ancash. | Huancavelica and Ucayali remain stable. |
| 2013 | Alarming scarcity in Lima and Ica. | Ucayali maintains recharge. |
| 2014 | Alarming water levels in Lima and Ica. | Huánuco maintains moderate recharge. |
| 2015 | Decrease in Lima, Ica, and Ayacucho. | Ucayali remains stable. |
| 2016 | Groundwater reduction in Ica, Lima, and Huánuco. | Ucayali remains stable. |
| 2017 | Persistent deficit in Lima, Ica, and Ancash. | Ucayali and Huánuco maintain normal levels. |
| 2018 | Moderate declines in Lima and Junín. | Ucayali stable. |
| 2019 | Water problems in Lima and Ancash. | Huancavelica and Ucayali maintain groundwater. |
| 2020 | Deficit in Ica and Lima. | Ucayali continues with good reserves. |
| 2021 | Significant reduction in Lima, Ica, and Junín. | Huánuco and Ucayali remain stable. |
| 2022 | Persistent problems in Lima and Ancash. | Ucayali remains stable. |
| 2023 | Alarming scarcity in Lima, Ica, and Huánuco. | Ucayali maintains recharge. |
| Year | Groundwater Scarcity/Water Stress | Groundwater Recharge/GWS |
|---|---|---|
| 2003 | Water reduction in Arequipa and Tacna. | Madre de Dios remains stable. |
| 2004 | Slight reduction in Arequipa and Moquegua. | Puno remains unchanged. |
| 2005 | Decline in Moquegua and Tacna. | Madre de Dios stable. |
| 2006 | Severe reduction in Arequipa. | Puno and Cusco maintain reserves. |
| 2007 | Marked scarcity in Arequipa and Tacna. | Madre de Dios remains unchanged. |
| 2008 | Critical conditions in Tacna and Moquegua. | Cusco remains stable. |
| 2009 | Severe deficiencies in Moquegua and Tacna. | Puno and Cusco remain unchanged. |
| 2010 | Water crisis in Arequipa and Tacna. | Madre de Dios remains stable. |
| 2011 | Ongoing crisis in Arequipa and Moquegua. | Puno and Cusco remain stable. |
| 2012 | Severe reduction in Tacna and Arequipa. | Madre de Dios maintains normal levels. |
| 2013 | Severe crisis in Arequipa and Moquegua. | Cusco remains stable. |
| 2014 | Extreme reduction in Tacna and Arequipa. | Madre de Dios remains stable. |
| 2015 | Low reserves in Arequipa and Tacna. | Madre de Dios stable. |
| 2016 | Lower storage in Moquegua and Arequipa. | Puno and Cusco remain unchanged. |
| 2017 | Low levels in Tacna and Arequipa. | Madre de Dios and Apurímac maintain storage. |
| 2018 | Reduction in Moquegua and Puno. | Arequipa remains in crisis. |
| 2019 | Low groundwater availability in Moquegua and Tacna. | Puno remains stable. |
| 2020 | Severe groundwater crisis in Arequipa and Tacna. | Cusco and Madre de Dios remain stable. |
| 2021 | Continued scarcity in Arequipa and Moquegua. | Puno remains stable. |
| 2022 | Crisis in Arequipa and Tacna. | Madre de Dios remains stable. |
| 2023 | Severe crisis in Arequipa and Tacna. | Cusco and Puno maintain stable groundwater levels. |
| Year. | North Storage (%) | Central Storage (%) | South Storage (%) |
|---|---|---|---|
| 2003 | 80 | 75 | 70 |
| 2004 | 78 | 73 | 67 |
| 2005 | 75 | 70 | 64 |
| 2006 | 72 | 68 | 60 |
| 2007 | 70 | 65 | 58 |
| 2008 | 68 | 62 | 55 |
| 2009 | 66 | 60 | 50 |
| 2010 | 64 | 58 | 45 |
| 2011 | 63 | 55 | 43 |
| 2012 | 62 | 53 | 40 |
| 2013 | 60 | 51 | 38 |
| 2014 | 61 | 52 | 39 |
| 2015 | 63 | 54 | 41 |
| 2016 | 65 | 56 | 44 |
| 2017 | 67 | 59 | 48 |
| 2018 | 65 | 57 | 45 |
| 2019 | 62 | 55 | 42 |
| 2020 | 60 | 52 | 40 |
| 2021 | 58 | 50 | 38 |
| 2022 | 55 | 48 | 35 |
| 2023 | 53 | 45 | 32 |
Appendix B
- Linear Trend Calculation of Precipitation
- 1. Northern Region:
- Trend equation:
- Y = −0.0673x + 754.07
- R2 = 0.0003
- where:
- y = Estimated precipitation in mm
- x = Number of years since the starting point (2003). For example, 2003 = 0, 2004 = 1, …, 2023 = 20
- Calculation examples:
- Year 2003 (x = 0):
- Y = −0.0673(0) + 754.07 = 754.07 mm
- Year 2023 (x = 20):
- Y = −0.0673(20) + 754.07 = 752.72 mm
- 2. Central Region:
- Trend equation:
- Y = 0.6738x + 928.93
- R2 = 0.033
- Calculation examples:
- Year 2003 (x = 0):
- Y = 0.6738(0) + 928.93 = 928.93 mm
- Year 2023 (x = 20):
- Y = 0.6738(20) + 928.93 = 942.41 mm
- 3. South Region:
- Trend equation:
- Y = 0.0846x+709.03
- R2 = 0.0006
- Calculation examples:
- Year 2003 (x = 0):
- Y = 0.0846(0) + 709.03 = 709.03 mm
- Year 2023 (x = 20):
- Y = 0.0846(20) + 709.03 = 710.72 mm
References
- Masbruch, M.D.; Rumsey, C.A.; Gangopadhyay, S.; Susong, D.D.; Pruitt, T. Analyses of infrequent (quasi-decadal) large groundwater recharge events in the northern Great Basin: Their importance for groundwater availability, use, and management. Water Resour. Res. 2016, 52, 7819–7836. [Google Scholar] [CrossRef]
- Fukuda, Y.; Yamamoto, K.; Hasegawa, T.; Nakaegawa, T.; Nishijima, J.; Taniguchi, M. Monitoring groundwater variation by satellite and implications for in-situ gravity measurements. Sci. Total Environ. 2009, 407, 3173–3180. [Google Scholar] [CrossRef] [PubMed]
- Xie, X.; Xu, C.; Wen, Y.; Li, W. Monitoring groundwater storage changes in the Loess Plateau using GRACE satellite gravity data, hydrological models and coal mining data. Remote Sens. 2018, 10, 605. [Google Scholar] [CrossRef]
- Xiao, R.; He, X.; Zhang, Y.; Ferreira, V.G.; Chang, L. Monitoring groundwater variations from satellite gravimetry and hydrological models: A comparison with in-situ measurements in the mid-Atlantic region of the United States. Remote Sens. 2015, 7, 686–703. [Google Scholar] [CrossRef]
- Rodell, M.; Velicogna, I.; Famiglietti, J.S. Satellite-based estimates of groundwater depletion in India. Nature 2009, 460, 999–1002. [Google Scholar] [CrossRef] [PubMed]
- Nanteza, J.; de Linage, C.R.; Thomas, B.F.; Famiglietti, J.S. Monitoring groundwater storage changes in complex basement aquifers: An evaluation of the GRACE satellites over East Africa. Water Resour. Res. 2016, 52, 9542–9564. [Google Scholar] [CrossRef]
- Iqbal, N.; Hossain, F.; Lee, H.; Akhter, G. Satellite gravimetric estimation of groundwater storage variations over Indus Basin in Pakistan. IEEE J. Sel. Top. Appl. Earth Obs. Remote Sens. 2016, 9, 3524–3534. [Google Scholar] [CrossRef]
- Xiang, L.; Wang, H.; Steffen, H.; Wu, P.; Jia, L.; Jiang, L. Groundwater storage changes in the Tibetan Plateau and adjacent areas revealed from GRACE satellite gravity data. Earth Planet. Sci. Lett. 2016, 449, 228–239. [Google Scholar] [CrossRef]
- Feng, W.; Zhong, M.; Lemoine, J.M.; Biancale, R.; Hsu, H.T.; Xia, J. Evaluation of groundwater depletion in North China using the Gravity Recovery and Climate Experiment (GRACE) data and ground-based measurements. Water Resour. Res. 2013, 49, 2110–2118. [Google Scholar] [CrossRef]
- Huang, J.; Pavlic, G.; Rivera, A.; Palombi, D.; Smerdon, B. Mapping groundwater stock variations with GRACE: A case study in Alberta, Canada. Hydrogeol. J. 2016, 24, 1663–1680. [Google Scholar] [CrossRef]
- Liesch, T.; Ohmer, M. Comparison of GRACE data with piezometric levels for assessing groundwater level decline in Jordan. Hydrogeol. J. 2016, 24, 1547–1563. [Google Scholar] [CrossRef]
- Stark, J.; Guillén, S.; Brady, C. Follow the Water: Emerging Issues of Climate Change and Conflict in Peru; US Agency for International Development: Lima, Peru, 2012; Volume 5.
- Glas, R.; Lautz, L.; McKenzie, J.; Moucha, R.; Chavez, D.; Mark, B.; Lane, J.W. Hydrogeology of an alpine talus aquifer: Cordillera Blanca, Peru. Hydrogeol. J. 2019, 27, 2137–2154. [Google Scholar] [CrossRef]
- Eda, L.E.H.; Chen, W. Integrated water resources management in Peru. Procedia Environ. Sci. 2010, 2, 340–348. [Google Scholar] [CrossRef]
- ANA, Autoridad Nacional del Agua. Explotación de Acuíferos. Plataforma del Estado Peruano. 2024. Available online: https://www.ana.gob.pe/2019/consejo-de-cuenca/tumbes/EA (accessed on 19 March 2025).
- Herrera, C.; Urrutia, J.; Gamboa, C.; Salgado, X.; Godfrey, L.; Rivas, A.; Jódar, J.; Custodio, E.; León, C.; Sigl, V.; et al. Evaluation of the impact of the intensive exploitation of groundwater and the mega-drought based on the hydrochemical and isotopic composition of the waters of the Chacabuco-Polpaico basin in central Chile. Sci. Total Environ. 2023, 895, 165055. [Google Scholar] [CrossRef] [PubMed]
- Gonzales, E. Predicción del Fenómeno El Niño Mediante Índices Oceánicos e Influencia de la Zona de Convergencia Intertropical en el Norte Peruano. 2022. Available online: https://repositorio.lamolina.edu.pe/handle/20.500.12996/5289 (accessed on 19 March 2025).
- Cooper, D.J.; Sueltenfuss, J.; Oyague, E.; Yager, K.; Slayback, D.; Caballero, E.M.C.; Argollo, J.; Mark, B.G. Drivers of peatland water table dynamics in the Central Andes, Bolivia and Peru. Hydrol. Process. 2019, 33, 1913–1925. [Google Scholar] [CrossRef]
- Pino, E.; Villegas, L.; García, P. Overexploitation and saltwater intrusion in Peruvian coastal aquifers. Environ. Earth Sci. 2019, 78, 310. [Google Scholar] [CrossRef]
- Underhill, V.; Beckett, L.; Dajani, M.; Oré, M.T.; Sabat, S. The coloniality of modern water: Global groundwater extraction in California, Palestine and Peru. Water Altern. 2023, 16, 13–38. [Google Scholar]
- Narvaez-Montoya, C.; Torres-Martínez, J.A.; Pino-Vargas, E.; Cabrera-Olivera, F.; Loge, F.J.; Mahlknecht, J. Predicting adverse scenarios for a transboundary coastal aquifer system in the Atacama Desert (Peru/Chile). Sci. Total Environ. 2022, 806 Pt 1, 150386. [Google Scholar] [CrossRef] [PubMed]
- Hamel, P.; Valencia, J.; Schmitt, R.; Shrestha, M.; Piman, T.; Sharp, R.P.; Francesconi, W.; Guswa, A.J. Modeling seasonal water yield for landscape management: Applications in Peru and Myanmar. J. Environ. Manag. 2020, 270, 110792. [Google Scholar] [CrossRef] [PubMed]
- Baraer, M.; McKenzie, J.; Mark, B.G.; Gordon, R.; Bury, J.; Condom, T.; Gomez, J.; Knox, S.; Fortner, S.K. Contribution of groundwater to the outflow from ungauged glacierized catchments: A multi-site study in the tropical Cordillera Blanca, Peru. Hydrol. Process. 2015, 29, 2561–2581. [Google Scholar] [CrossRef]
- Alvarez-campos, O.; Olson, E.J.; Frisbee, M.; Welp, L.R.; Zúñiga Medina, S.A.; Roque Quispe, W.R.; Salazar Mamani, C.I.; Arenas Carrión, M.R.; Diaz Rodriguez, J. Identifying groundwater recharge zones in Western Cordillera of the Central Andes of southern Peru [Abstract]. In Geological Society of America Abstracts; The Geological Society of America (GSA): Boulder, CO, USA, 2020; Volume 52. [Google Scholar] [CrossRef]
- Graber, A.; Santi, P.M.; Flamme, H.; Krahenbuhl, R. Finite Element Modeling to Constrain Unknown Groundwater Conditions for Large Landslides in the Siguas River Valley, Peru [Abstract]; The Geological Society of America (GSA): Boulder, CO, USA, 2020; Volume 52. [Google Scholar] [CrossRef]
- Yang, J.; Shragge, J.; Girard, A.J.; Gonzales, E.; Ticona, J.; Minaya, A.; Krahenbuhl, R. Seismic characterization of a landslide complex: A case history from Majes, Peru. Sustainability 2023, 15, 13574. [Google Scholar] [CrossRef]
- Fernandez-Escalante, E.; Foster, S.; Navarro-Benegas, R. Evolution and sustainability of groundwater use from the Ica aquifers for the most profitable agriculture in Peru. Hydrogeol. J. 2020, 28, 2601–2612. [Google Scholar] [CrossRef]
- Velasco, A.; Capilla, J.E. Hydrogeological characterization and assessment of anthropic impacts in the Lower Piura Sub-Basin Aquifer in Peru. Hydrogeol. J. 2019, 27, 2755–2773. [Google Scholar] [CrossRef]
- Cairampoma, A.; Villegas, P. Legal regime ground water in Peru. Thēmis 2016, 69, 147–158. [Google Scholar]
- Frappart, F.; Ramillien, G. Monitoring groundwater storage changes using the Gravity Recovery and Climate Experiment (GRACE) satellite mission: A review. Remote Sens. 2018, 10, 829. [Google Scholar] [CrossRef]
- Guo, Y.; Gan, F.; Yan, B.; Bai, J.; Wang, F.; Jiang, R.; Xing, N.; Liu, Q. Evaluation of groundwater storage depletion using grace/grace follow-on data with land surface models and its driving factors in Haihe river basin, China. Sustainability 2022, 14, 1108. [Google Scholar] [CrossRef]
- Li, H.; Pan, Y.; Yeh, P.J.F.; Famiglietti, J.S. A new GRACE downscaling approach for deriving high-resolution groundwater storage changes using ground-based scaling factors. Water Resour. Res. 2024, 60, e2023WR035210. [Google Scholar] [CrossRef]
- Petch, S.; Dong, B.; Quaife, T.; King, R.P.; Haines, K. Precipitation explains GRACE water storage variability over large endorheic basins in the 21st century. Front. Environ. Sci. 2023, 11, 1115746. [Google Scholar] [CrossRef]
- Canedo-Rosso, C.; Hochrainer-Stigler, S.; Pflug, G.; Condori, B.; Berndtsson, R. Drought impact in the Bolivian Altiplano agriculture associated with the El Niño–Southern Oscillation using satellite imagery data. Nat. Hazards Earth Syst. Sci. 2021, 21, 995–1010. [Google Scholar] [CrossRef]
- Espinoza, J.; Lavado-Casimiro, W.S.; Frappart, F. The El Niño and La Niña impacts on the hydrology of Peru based on discharge data (1968–2006). Adv. Geosci. 2013, 33, 33–42. [Google Scholar]
- Shamsudduha, M.; Taylor, R.G. Groundwater storage dynamics in the world’s large aquifer systems from GRACE: Uncertainty and role of extreme precipitation. Earth Syst. Dyn. 2020, 11, 755–774. [Google Scholar] [CrossRef]
- Li, B.; Rodell, M.; Kumar, S.; Beaudoing, H.K.; Getirana, A.; Zaitchik, B.F.; de Goncalves, L.G.; Cossetin, C.; Bhanja, S.; Mukherjee, A.; et al. Global GRACE data assimilation for groundwater and drought monitoring: Advances and challenges. Water Resour. Res. 2019, 55, 7564–7586. [Google Scholar] [CrossRef]
- Tapley, B.D.; Bettadpur, S.; Watkins, M.; Reigber, C. The gravity recovery and climate experiment: Mission overview and early results. Geophys. Res. Lett. 2004, 31, L09607. [Google Scholar] [CrossRef]
- Famiglietti, J.S.; Lo, M.; Ho, S.L.; Bethune, J.; Anderson, K.J.; Syed, T.H.; Swenson, S.C.; de Linage, C.R.; Rodell, M. Satellites measure recent rates of groundwater depletion in California’s Central Valley. Geophys. Res. Lett. 2011, 38. [Google Scholar] [CrossRef]
- Thomas, B.F.; Famiglietti, J.S.; Rodell, M. Sustainability of global groundwater use: A review of current knowledge and future directions. Water Resour. Res. 2017, 53, 5459–5471. [Google Scholar]
- Boening, C.; Willis, J.K.; Landerer, F.W.; Nerem, R.S.; Fasullo, J. Ocean warming during 2010 tied to extreme La Niña. Geophys. Res. Lett. 2012, 39, L20601. [Google Scholar] [CrossRef]
- Zhang, Y.; Pan, M.; Sheffield, J.; Siemann, A.L.; Fisher, C.K.; Liang, M.; Beck, H.E.; Wanders, N.; MacCracken, R.F.; Houser, P.R.; et al. A Climate Data Record (CDR) for the global terrestrial water budget: 1984–2010. Hydrol. Earth Syst. Sci. 2018, 22, 241–263. [Google Scholar] [CrossRef]
- Scanlon, B.R.; Zhang, Z.; Save, H.; Sun, A.Y.; Schmied, H.M.; van Beek, L.P.H.; Wiese, D.N.; Wada, Y.; Long, D.; Reedy, R.C.; et al. Global models underestimate large decadal declining and rising water storage trends relative to GRACE satellite data. Proc. Natl. Acad. Sci. USA 2018, 115, E1080–E1089. [Google Scholar] [CrossRef] [PubMed]
- Wiese, D.N.; Landerer, F.W.; Watkins, M.M. Quantifying and reducing leakage errors in the JPL RL05M GRACE mascon solution. Water Resour. Res. 2016, 52, 7490–7502. [Google Scholar] [CrossRef]
- Li, J.; Heap, A.D. A Review of Spatial Interpolation Methods for Environmental Scientists; Geoscience Australia: Symonston, Australia, 2014. Available online: https://www.researchgate.net/publication/246546630 (accessed on 19 March 2025).
- Thomas, B.F.; Famiglietti, J.S. Identifying climate-induced groundwater depletion in GRACE observations. Sci. Rep. 2015, 5, 12903. [Google Scholar] [CrossRef] [PubMed]
- Chucuya, S.; Vera, A.; Pino-Vargas, E.; Steenken, A.; Mahlknecht, J.; Montalván, I. Hydrogeochemical characterization and identification of factors influencing groundwater quality in coastal aquifers, case: La Yarada, Tacna, Peru. Int. J. Environ. Res. Public Health 2022, 19, 2815. [Google Scholar] [CrossRef] [PubMed]
- Sattar, Y.; Khalid, Z. Estimation of groundwater storage variations in Indus River Basin using GRACE data. arXiv 2020, arXiv:2010.12175. [Google Scholar] [CrossRef]
- Strassberg, G.; Scanlon, B.R.; Chambers, D. Evaluation of groundwater storage monitoring with the GRACE satellite: Case study High Plains aquifer, Central United States. Water Resour. Res. 2009, 45, W05410. [Google Scholar] [CrossRef]
- Scanlon, B.R.; Longuevergne, L.; Long, D. Ground referencing GRACE satellite estimates of groundwater storage changes in the California Central Valley, USA. Water Resour. Res. 2012, 48, W04520. [Google Scholar] [CrossRef]
- Scanlon, B.R.; Longuevergne, L.; Long, D. Groundwater storage changes in California from satellite gravity: Evaluation using in situ data and implications for drought. Geosciences 2019, 9, 436. [Google Scholar] [CrossRef]
- Pfeffer, J.; Cazenave, A.; Blazquez, A.; Decharme, B.; Munier, S.; Barnoud, A. Assessment of pluri-annual and decadal changes in terrestrial water storage predicted by global hydrological models in comparison with the GRACE satellite gravity mission. Hydrol. Earth Syst. Sci. 2023, 27, 3743–3768. [Google Scholar] [CrossRef]
- Takahashi, K.; Martínez, A.G. The very strong coastal El Niño in 1925 in the far-eastern Pacific. Clim. Dyn. 2019, 52, 7389–7415. [Google Scholar] [CrossRef]
- Giraldez, C.; Lavado-Casimiro, W.; Ronchail, J. Spatiotemporal patterns of ENSO-precipitation relationships in the Mantaro River Basin of Peru. Int. J. Climatol. 2020, 40, 396–412. [Google Scholar] [CrossRef]
- Muñoz, I. Agricultural Export and Overexploitation of the Ica Aquifer in Peru. Ph.D. Thesis, Pontificia Universidad Católica del Perú, San Miguel, Peru, 2016. [Google Scholar]
- INEI, Instituto Nacional de Estadística e Informática. Perú: Estadísticas del Agua 2022. 2023. Available online: https://www.inei.gob.pe/publicaciones (accessed on 19 March 2025).
- Fernández-Escalante, E.; López-Gunn, E.; Morales, R. Overexploitation and sustainability of the Motupe aquifer (Lambayeque, Peru): A 20-year analysis. Water 2020, 12, 1356. [Google Scholar] [CrossRef]
- Vega-Jiménez, A.; García, P.; Martínez, C. Groundwater management challenges in the Moche Valley (La Libertad, Peru): Climate variability and agro-export expansion. Hydrogeol. J. 2019, 27, 2147–2161. [Google Scholar] [CrossRef]
- Zegarra, E.; Ochoa-Tocachi, B. Land-use change and groundwater recharge in the Peruvian Amazon: A modeling approach. J. Hydrol. Reg. Stud. 2023, 45, 101302. [Google Scholar]
- Valdés-Pineda, R.; Pizarro, R.; Valdés, J.B. Impact of agricultural pumping on local aquifer depletion: Evidence and challenges. J. Hydrol. 2022, 604, 127145. [Google Scholar] [CrossRef]
- Boisier, J.P.; Rondanelli, R.; Garreaud, R.D.; Muñoz, F. Anthropogenic and natural contributions to the Southeast Pacific precipitation decline and recent megadrought in central Chile. Geophys. Res. Lett. 2016, 43, 413–421. [Google Scholar] [CrossRef]
- Benavides-Muñoz, H.M.; Correa-Escudero, V.; Pucha-Cofrep, D.; Pucha-Cofrep, F. Analysis of land use change and hydrogeological parameters in the Andean semiarid region of Ecuador. Water 2024, 16, 892. [Google Scholar] [CrossRef]
- Du, J.; Laghari, Y.; Wei, Y.C.; Wu, L.; He, A.L.; Liu, G.Y.; Leghari, S.J. Groundwater depletion and degradation in the North China Plain: Challenges and mitigation options. Water 2024, 16, 354. [Google Scholar] [CrossRef]
- Rodell, M.; Famiglietti, J.S.; Wiese, D.N.; Reager, J.T.; Beaudoing, H.K.; Landerer, F.W.; Lo, M.H. Emerging trends in global freshwater availability. Nature 2018, 557, 651–659. [Google Scholar] [CrossRef] [PubMed]
- Famiglietti, J.S. The global groundwater crisis. Nat. Clim. Change 2014, 4, 945–948. [Google Scholar] [CrossRef]
- Russo, T.A.; Lall, U. Depletion and response of deep groundwater to climate-induced pumping variability. Nat. Geosci. 2017, 10, 105–108. [Google Scholar] [CrossRef]
- Bouwer, H. Artificial recharge of groundwater: Systems, design, and management. In Hydraulic Design Handbook; McGraw-Hill: New York, NY, USA, 1999; pp. 24–44. [Google Scholar]
- California DWR. Flood-MAR Program. 2023. Available online: https://water.ca.gov/News/Blog/2023/Feb/Flood-MAR-Program (accessed on 5 July 2025).
- Dahlke, H.E.; LaHue, G.T.; Mautner, M.R.; Murphy, N.P.; Patterson, N.K.; Waterhouse, H.; Yang, F.; Foglia, L. Managed aquifer recharge as a tool to enhance sustainable groundwater management in California: Examples from field and modeling studies. Adv. Chem. Pollut. Environ. Manag. Prot. 2018, 3, 215–275. [Google Scholar] [CrossRef]
- Pannell, D.J.; Ewing, M.A. Managing secondary dryland salinity: Options and challenges. Agric. Water Manag. 2006, 80, 41–56. [Google Scholar] [CrossRef]
- Scanlon, B.R.; Fakhreddine, S.; Rateb, A.; de Graaf, I.; Famiglietti, J.; Gleeson, T.; Zheng, C. Global water resources and the role of groundwater in a resilient water future. Nat. Rev. Earth Environ. 2023, 4, 87–101. [Google Scholar] [CrossRef]
- California DWR. SGMA. 2024. Available online: https://water.ca.gov/Programs/Groundwater-Management/SGMA-Groundwater-Management (accessed on 5 July 2025).
- PPIC. Groundwater Recharge in California. 2021. Available online: https://www.ppic.org/wp-content/uploads/groundwater-recharge.pdf (accessed on 5 July 2025).
- USGS. Groundwater Recharge and Discharge. 2024. Available online: https://www.usgs.gov/media/images/groundwater-recharge-and-discharge (accessed on 5 July 2025).
- Wei, X.; Garcia-Chevesich, P.; Alejo, F.; García, V.; Martínez, G.; Daneshvar, F.; Gonzales, E.; McCray, J.E. Hydrologic analysis of an intensively irrigated area in southern Peru using a crop-field scale framework. Water 2021, 13, 318. [Google Scholar] [CrossRef]
- Gleeson, T.; Cuthbert, M.; Ferguson, G.; Perrone, D. Global groundwater sustainability, resources, and systems in the Anthropocene. Annu. Rev. Earth Planet. Sci. 2020, 48, 431–463. [Google Scholar] [CrossRef]
- Water in the West. Stanford University. 2021. Available online: https://waterinthewest.stanford.edu/publications/ (accessed on 5 July 2025).
| Aquifer | Area km2 | N° of Wells | Annual Extraction (hm3/year) | Annual Decline (m/year) | Recharge Deficit (%) |
|---|---|---|---|---|---|
| Caplina (Tacna) | 922 | 200+ | 17.50 | 1.00 | 30.00 |
| Tumbes | 250 | 150 | 11.00 | 0.75 | 12.50 |
| Chillón-Rímac (Lima) | 866 | 1000+ | 252.00 | 2.00 | 12.50 |
| Lurín (Lima) | 230 | 200 | 25.00 | 1.50 | 25.00 |
| Chilca (Cañete-Lima) | 99 | 50 | 5.00 | 1.00 | 17.50 |
| Locumba (Tacna) | 505 | 100 | 8.00 | 0.70 | 12.50 |
| Zone | Critical Years | Most Affected Regions | GWS Trend |
|---|---|---|---|
| North | 2007–2010 | Piura, Lambayeque | 20–30% decline |
| Central | 2007–2010, 2023 | Lima, Ica | 30–40% decline |
| South | 2007–2010, 2015–2023 | Arequipa, Tacna | 40% decline |
Disclaimer/Publisher’s Note: The statements, opinions and data contained in all publications are solely those of the individual author(s) and contributor(s) and not of MDPI and/or the editor(s). MDPI and/or the editor(s) disclaim responsibility for any injury to people or property resulting from any ideas, methods, instructions or products referred to in the content. |
© 2025 by the authors. Licensee MDPI, Basel, Switzerland. This article is an open access article distributed under the terms and conditions of the Creative Commons Attribution (CC BY) license (https://creativecommons.org/licenses/by/4.0/).
Share and Cite
Gonzales, E.; Alvarez, V.; Gonzales, K. Two Decades of Groundwater Variability in Peru Using Satellite Gravimetry Data. Appl. Sci. 2025, 15, 8071. https://doi.org/10.3390/app15148071
Gonzales E, Alvarez V, Gonzales K. Two Decades of Groundwater Variability in Peru Using Satellite Gravimetry Data. Applied Sciences. 2025; 15(14):8071. https://doi.org/10.3390/app15148071
Chicago/Turabian StyleGonzales, Edgard, Victor Alvarez, and Kenny Gonzales. 2025. "Two Decades of Groundwater Variability in Peru Using Satellite Gravimetry Data" Applied Sciences 15, no. 14: 8071. https://doi.org/10.3390/app15148071
APA StyleGonzales, E., Alvarez, V., & Gonzales, K. (2025). Two Decades of Groundwater Variability in Peru Using Satellite Gravimetry Data. Applied Sciences, 15(14), 8071. https://doi.org/10.3390/app15148071