
Geochemical Characteristics and Thermal Evolution History of Jurassic Tamulangou Formation Source Rocks in the Hongqi Depression, Hailar Basin


Abstract
1. Introduction
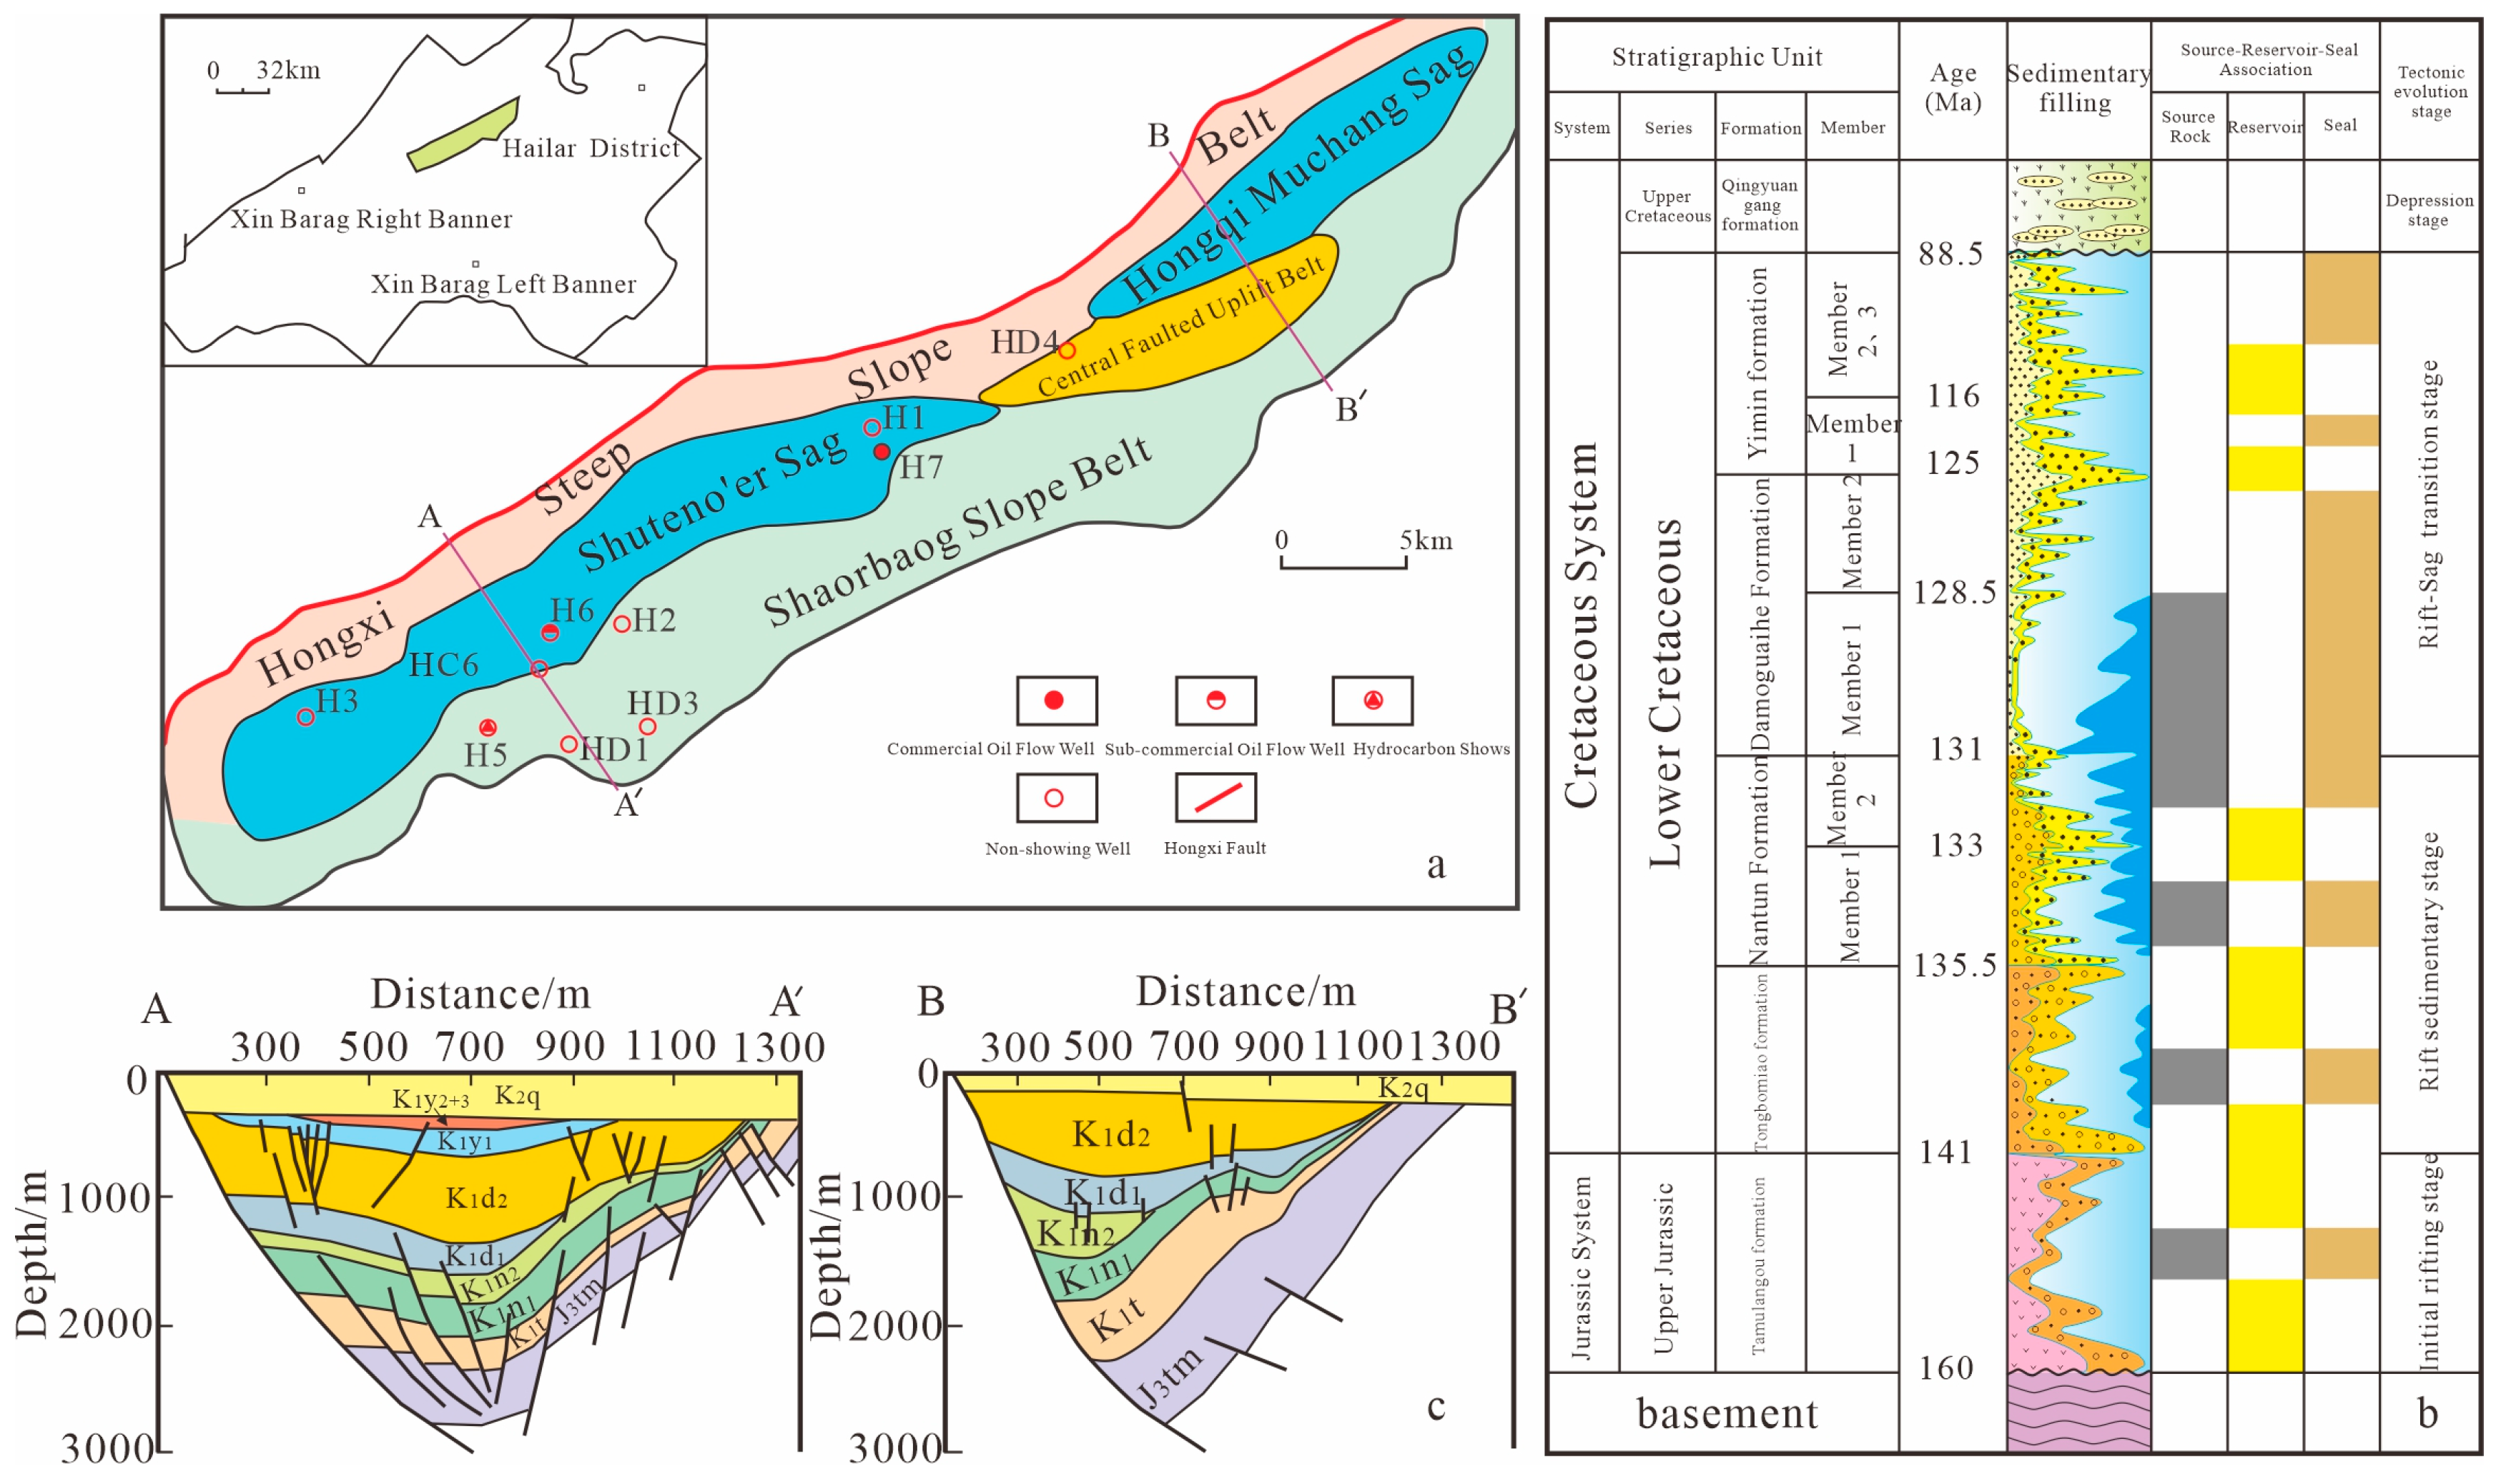
2. Regional Geological Background
3. Data and Methods
4. Results and Discussion
4.1. Organic Matter Content
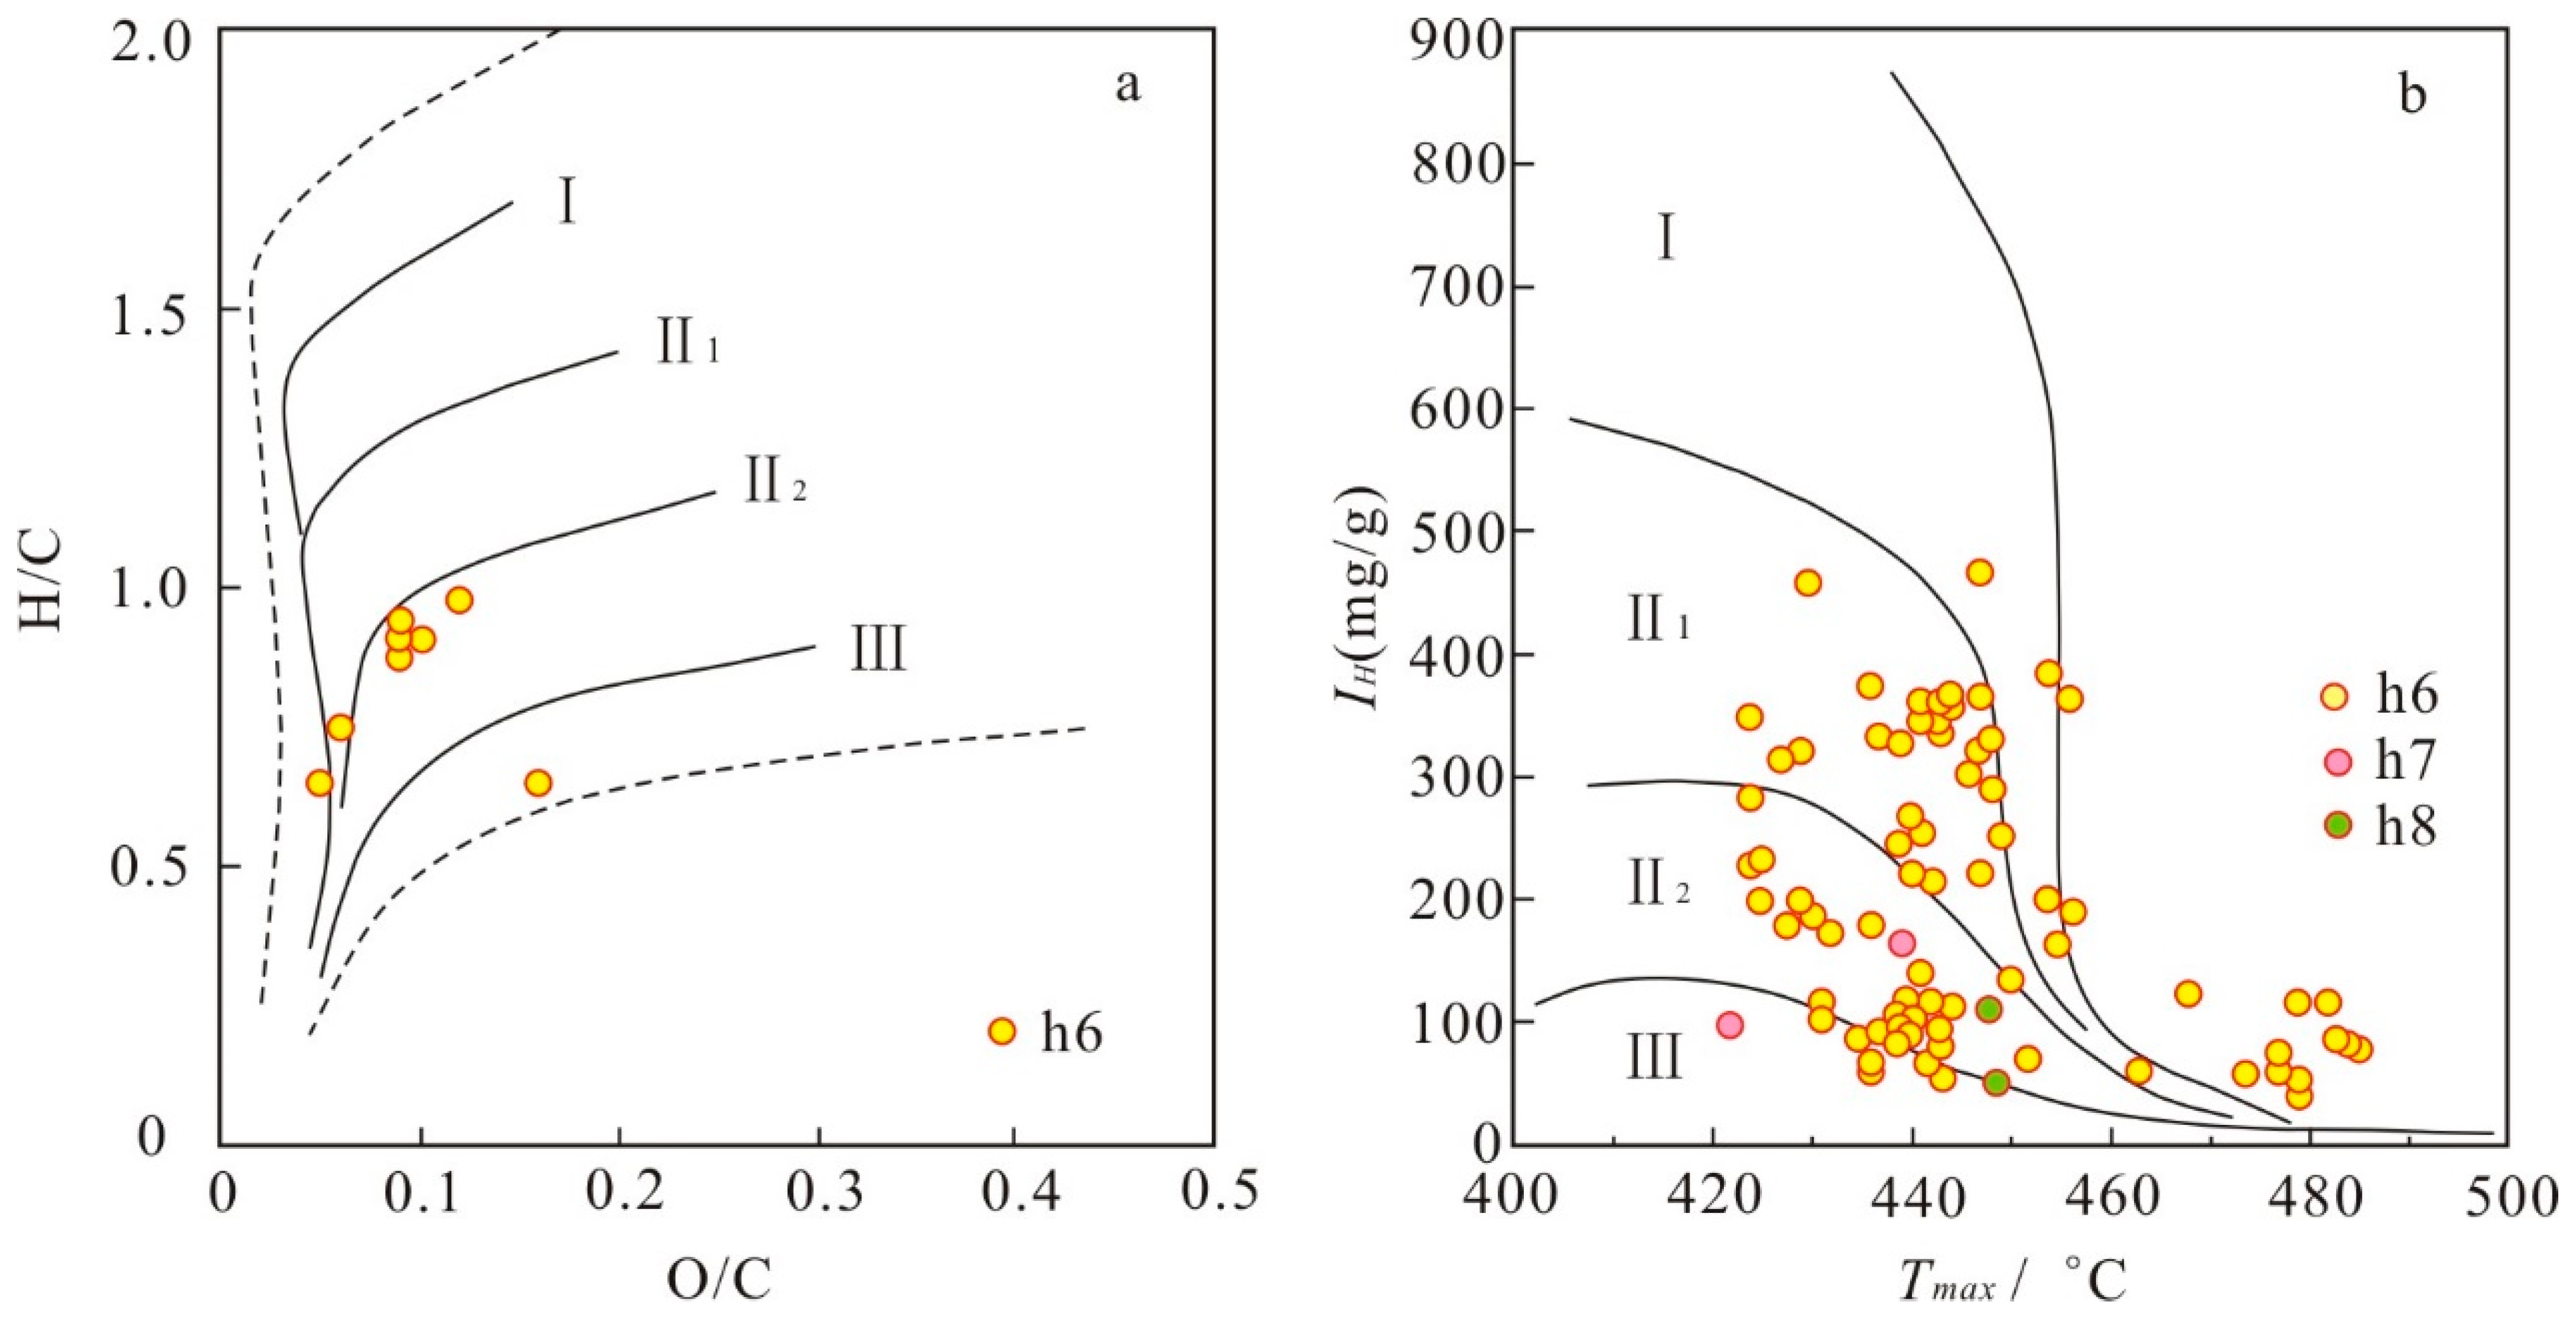
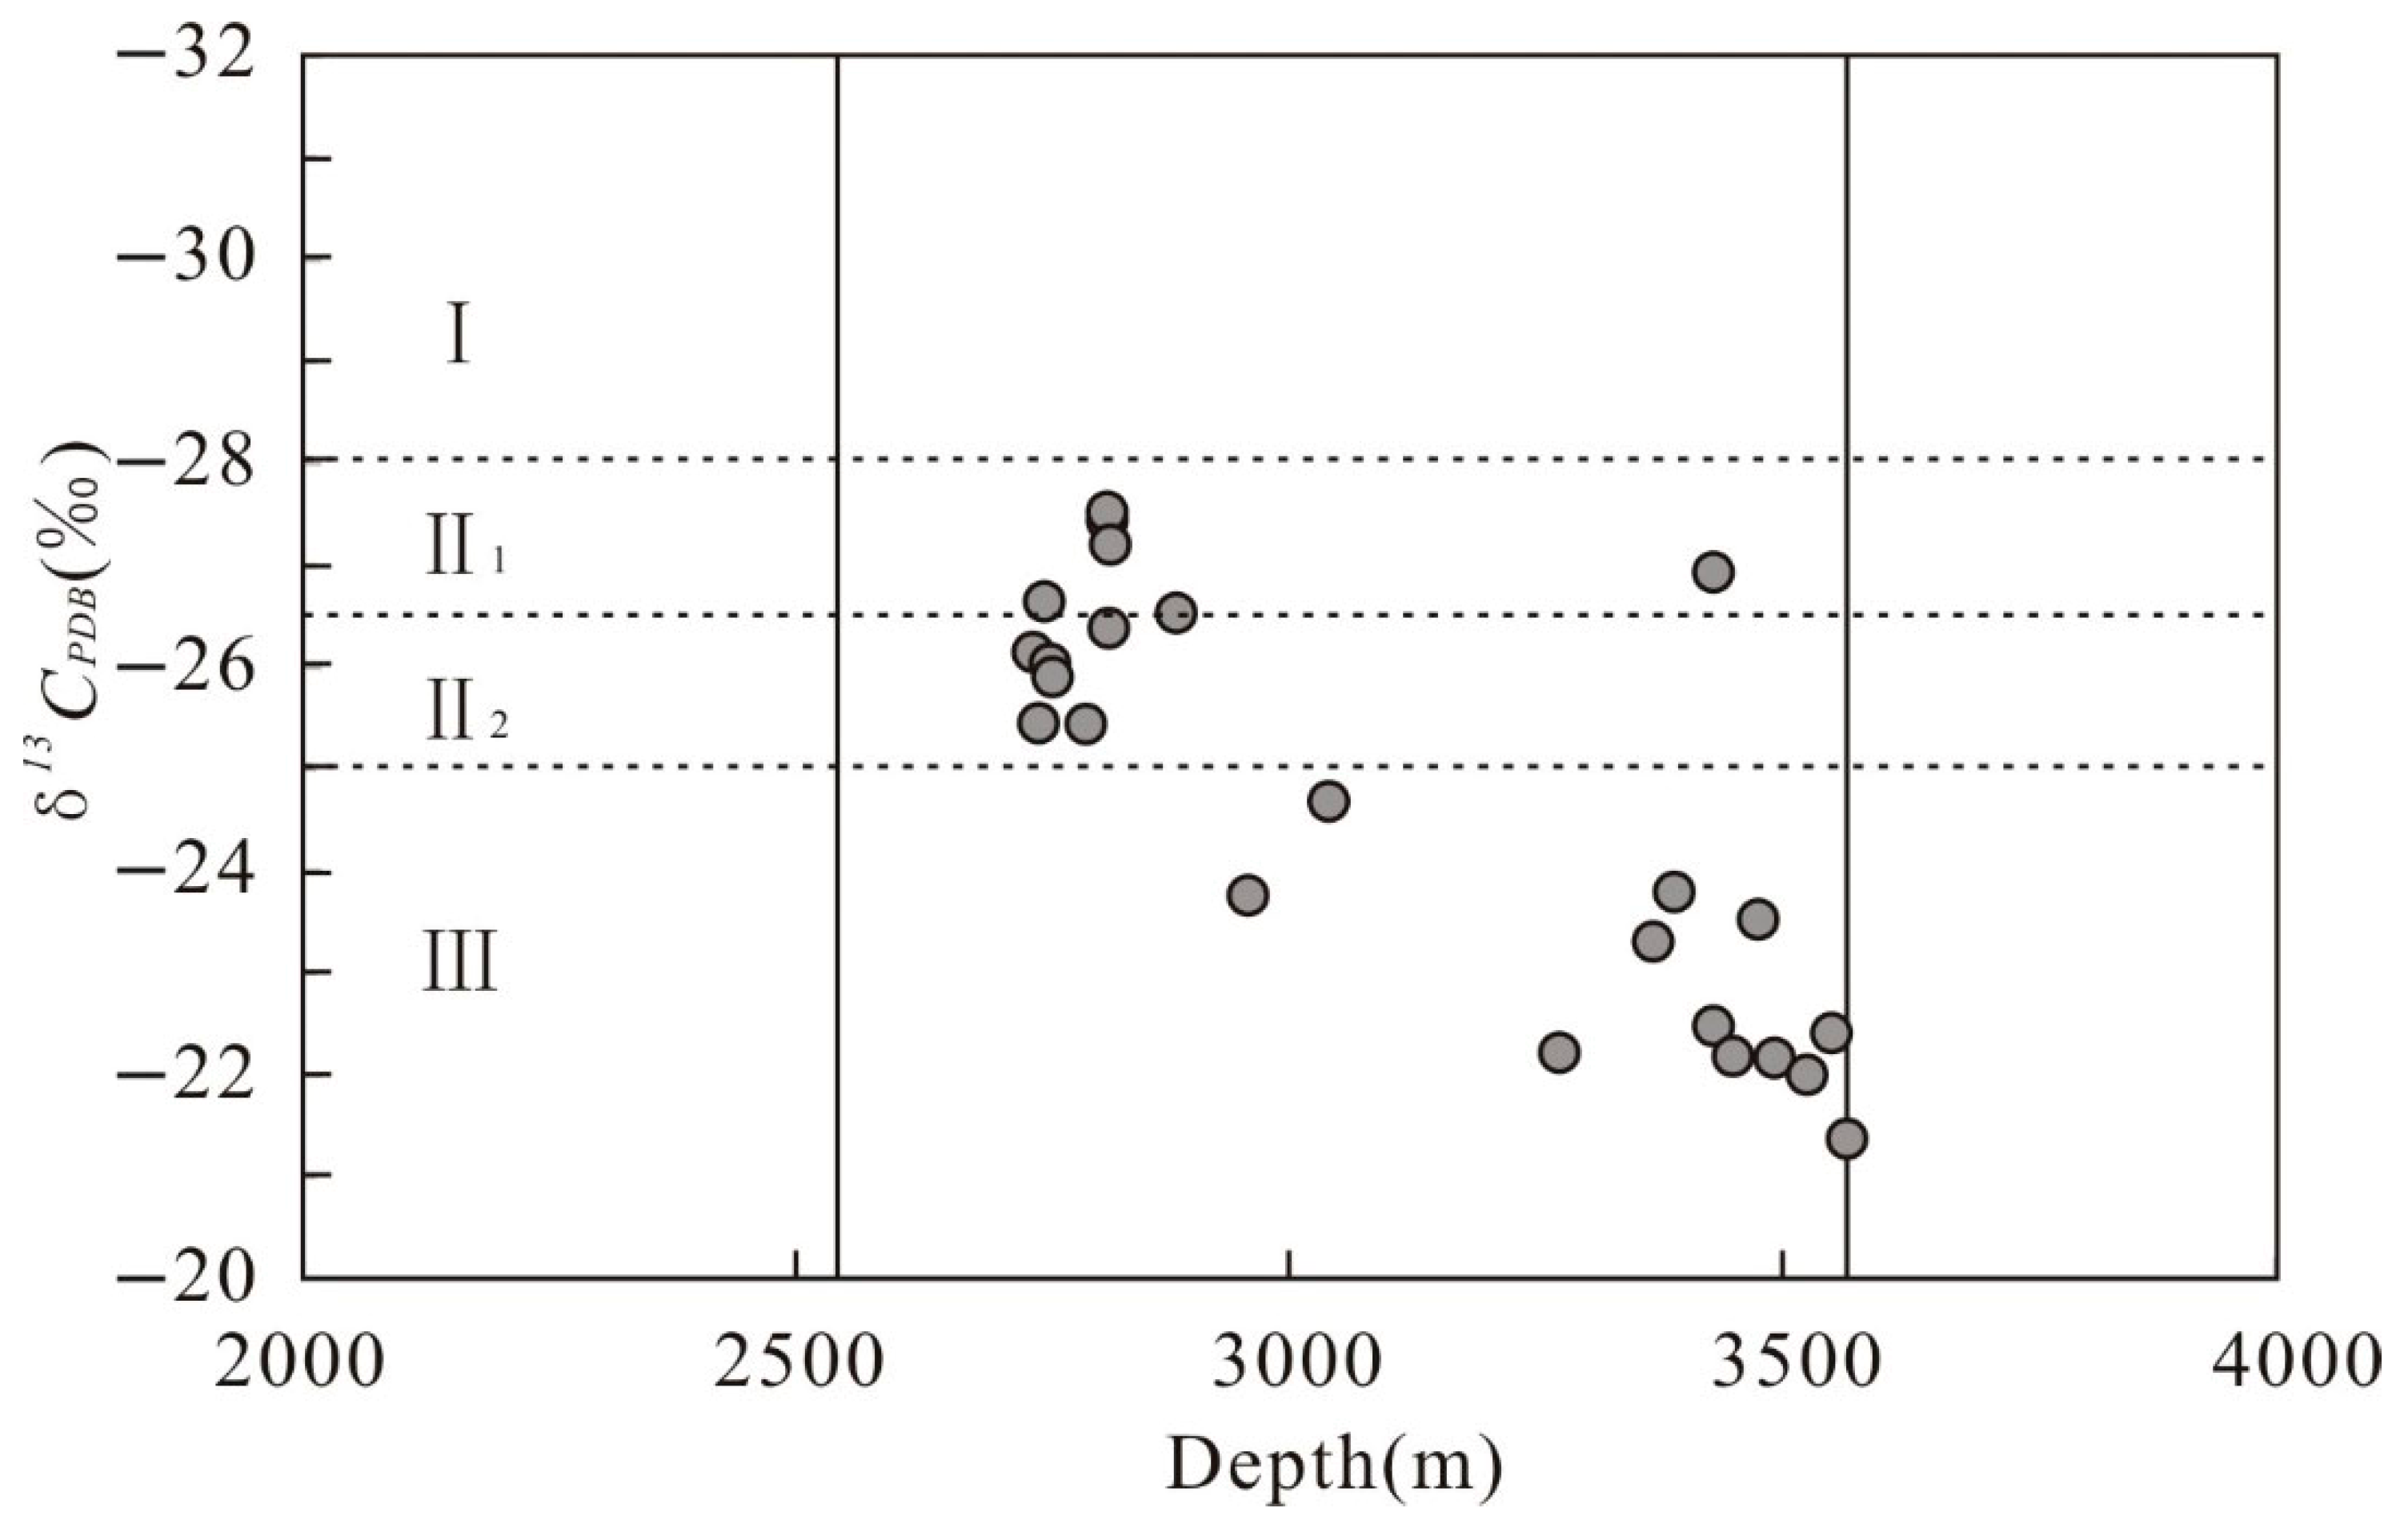
4.2. Organic Matter Type
4.3. Organic Matter Maturity
4.4. The Composition Characteristics of Soluble Organic Matter
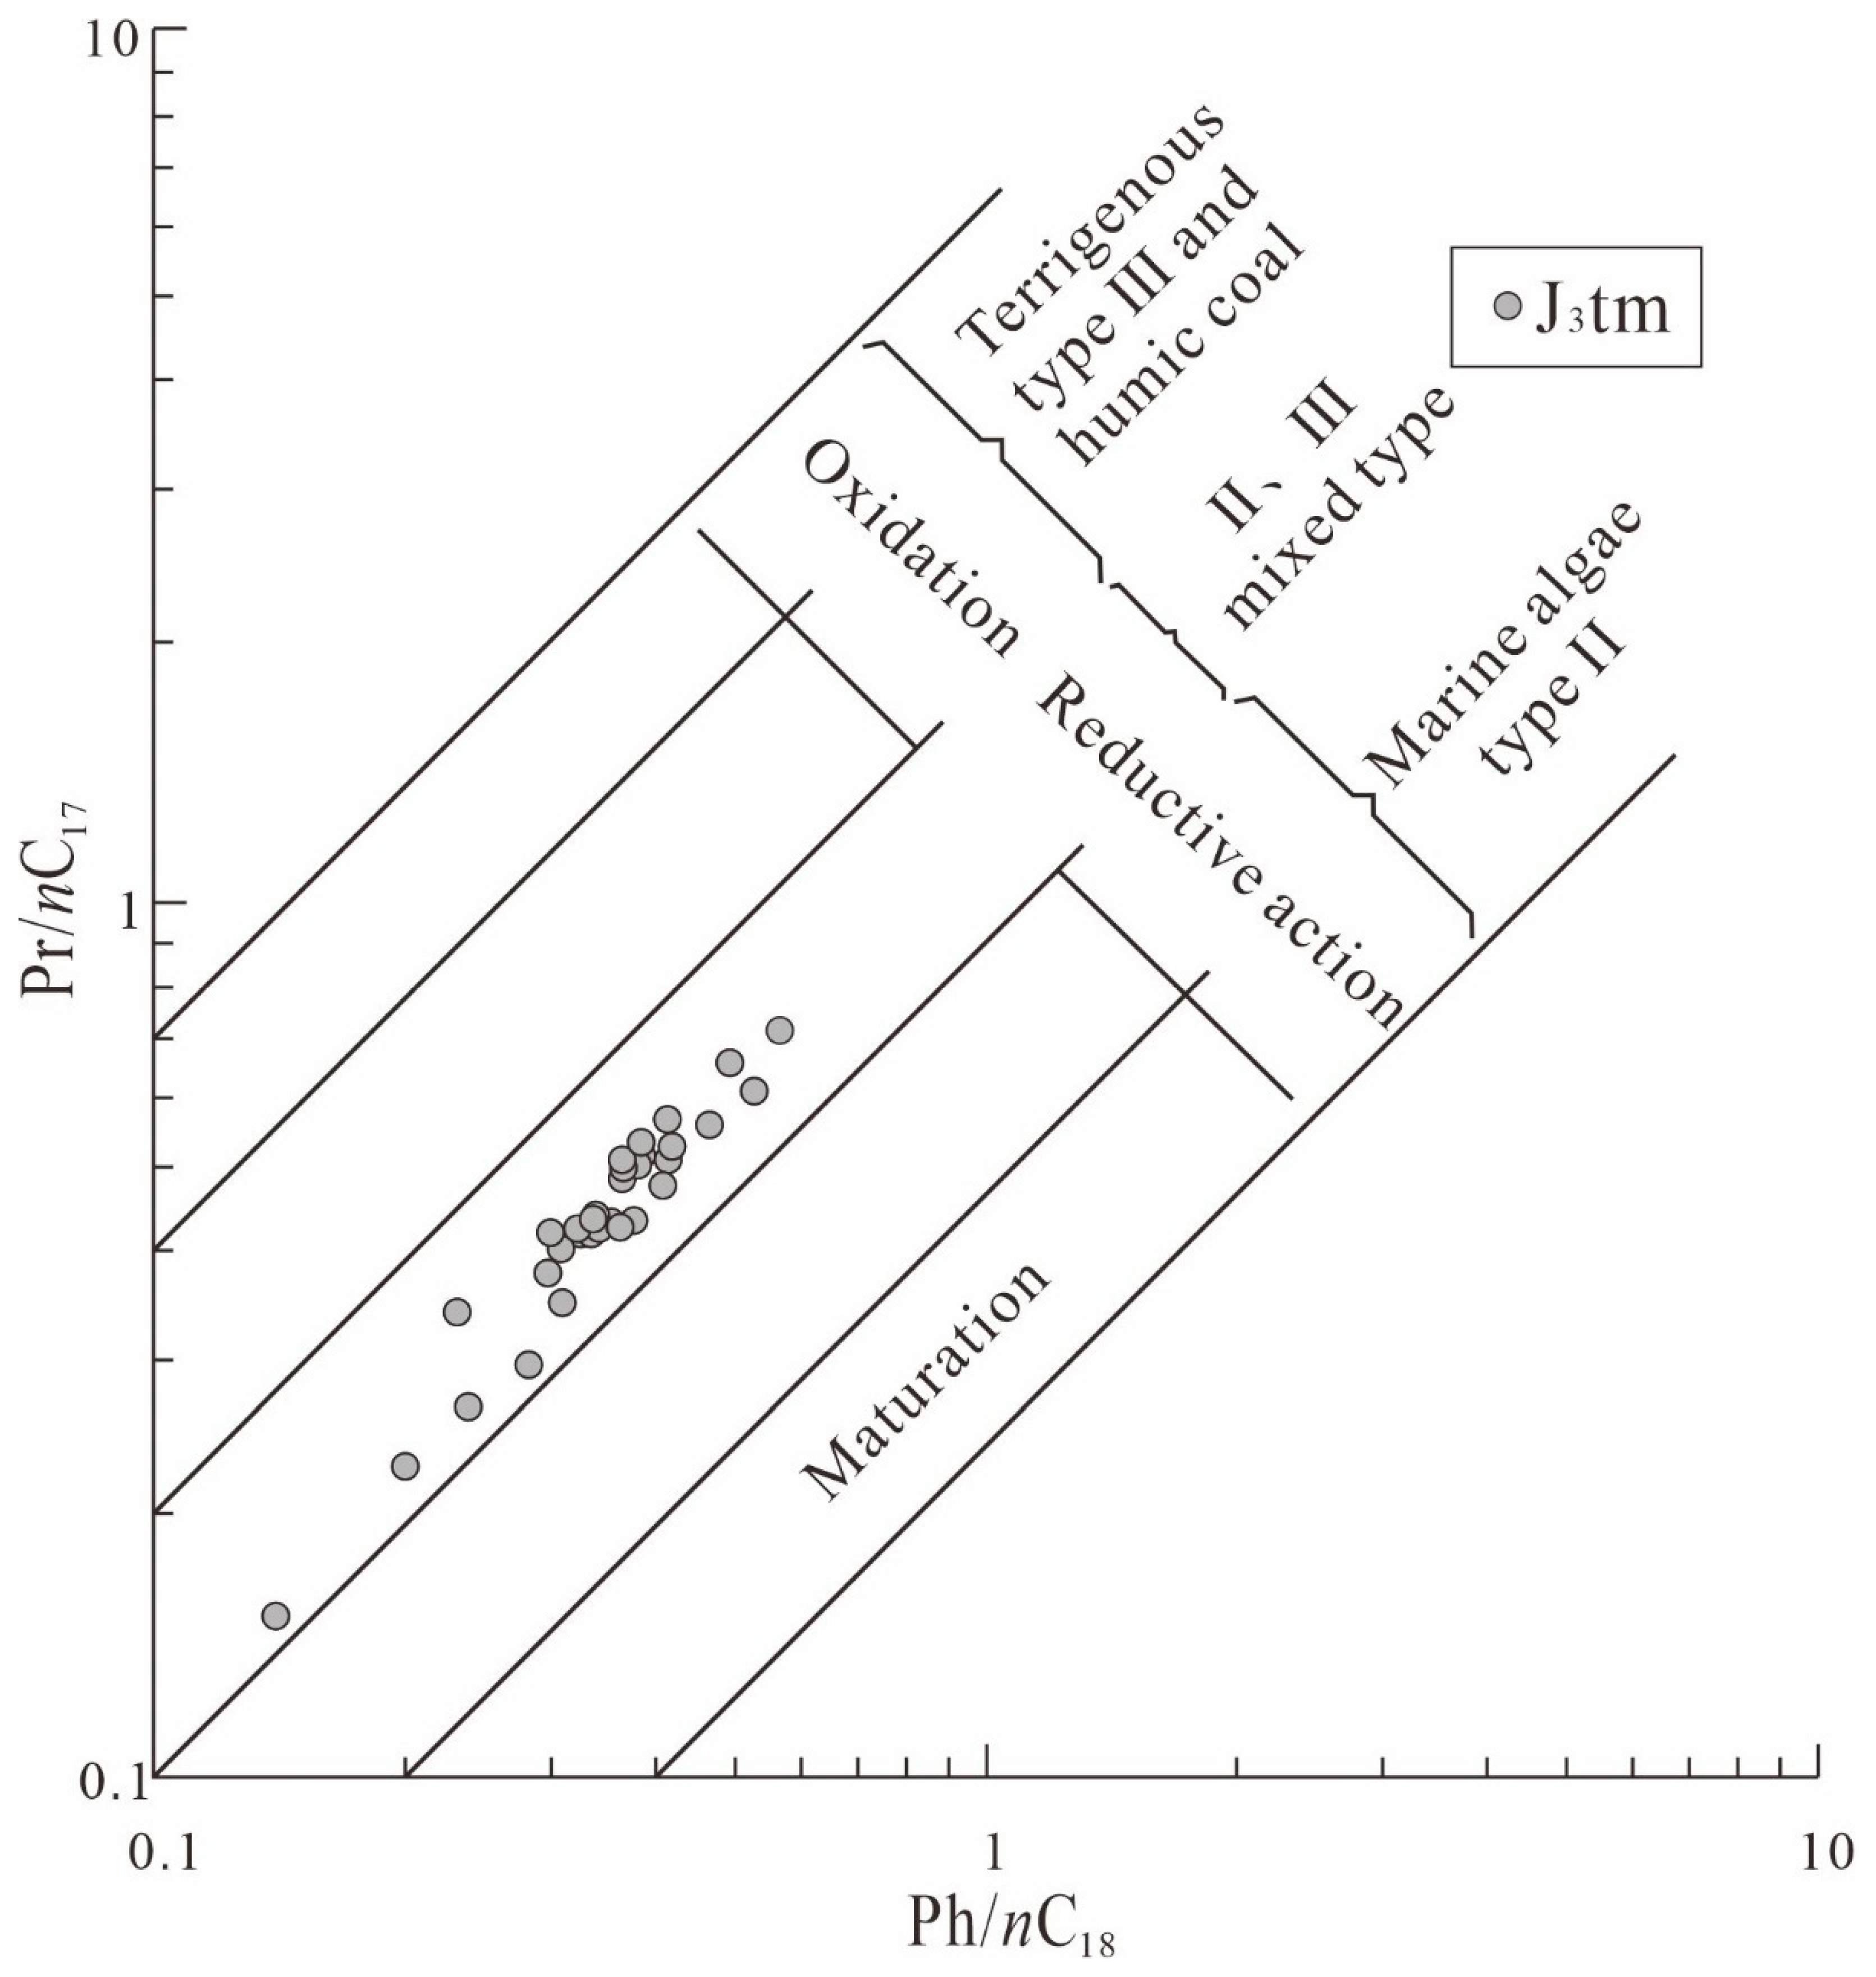
4.5. Biomarker Characteristics
4.6. Thermal Evolution History
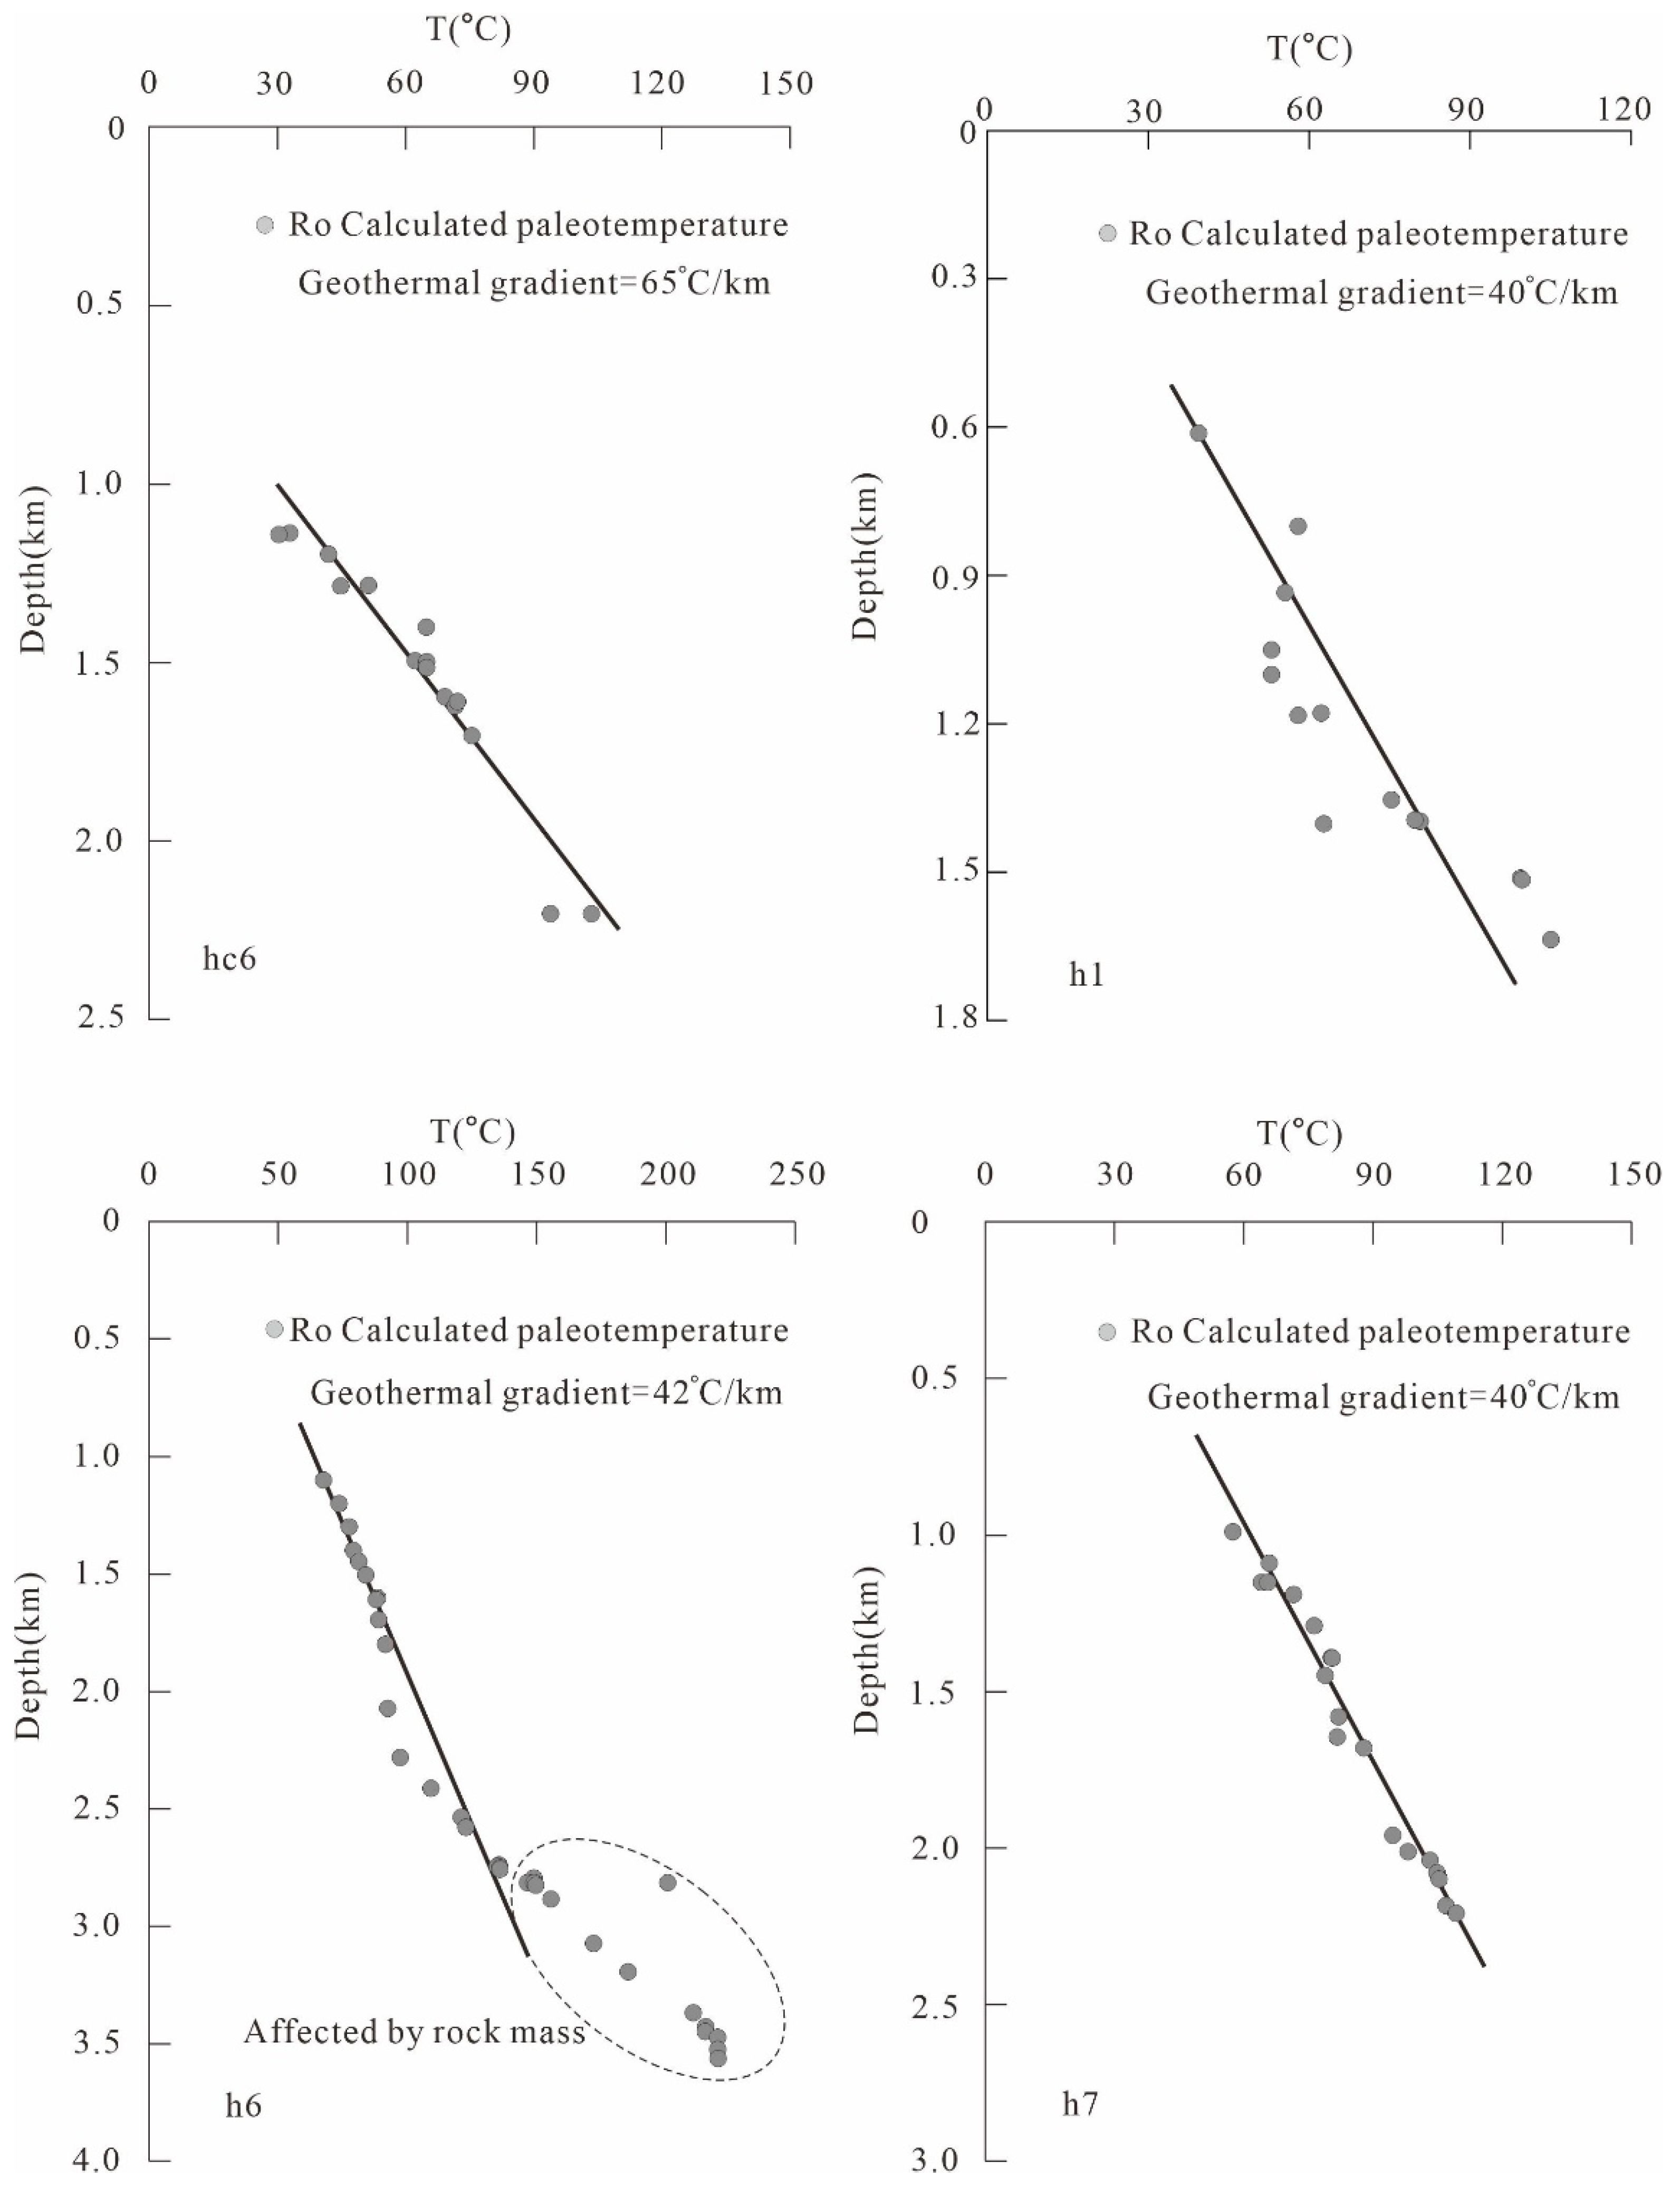
4.6.1. Geothermal Gradient
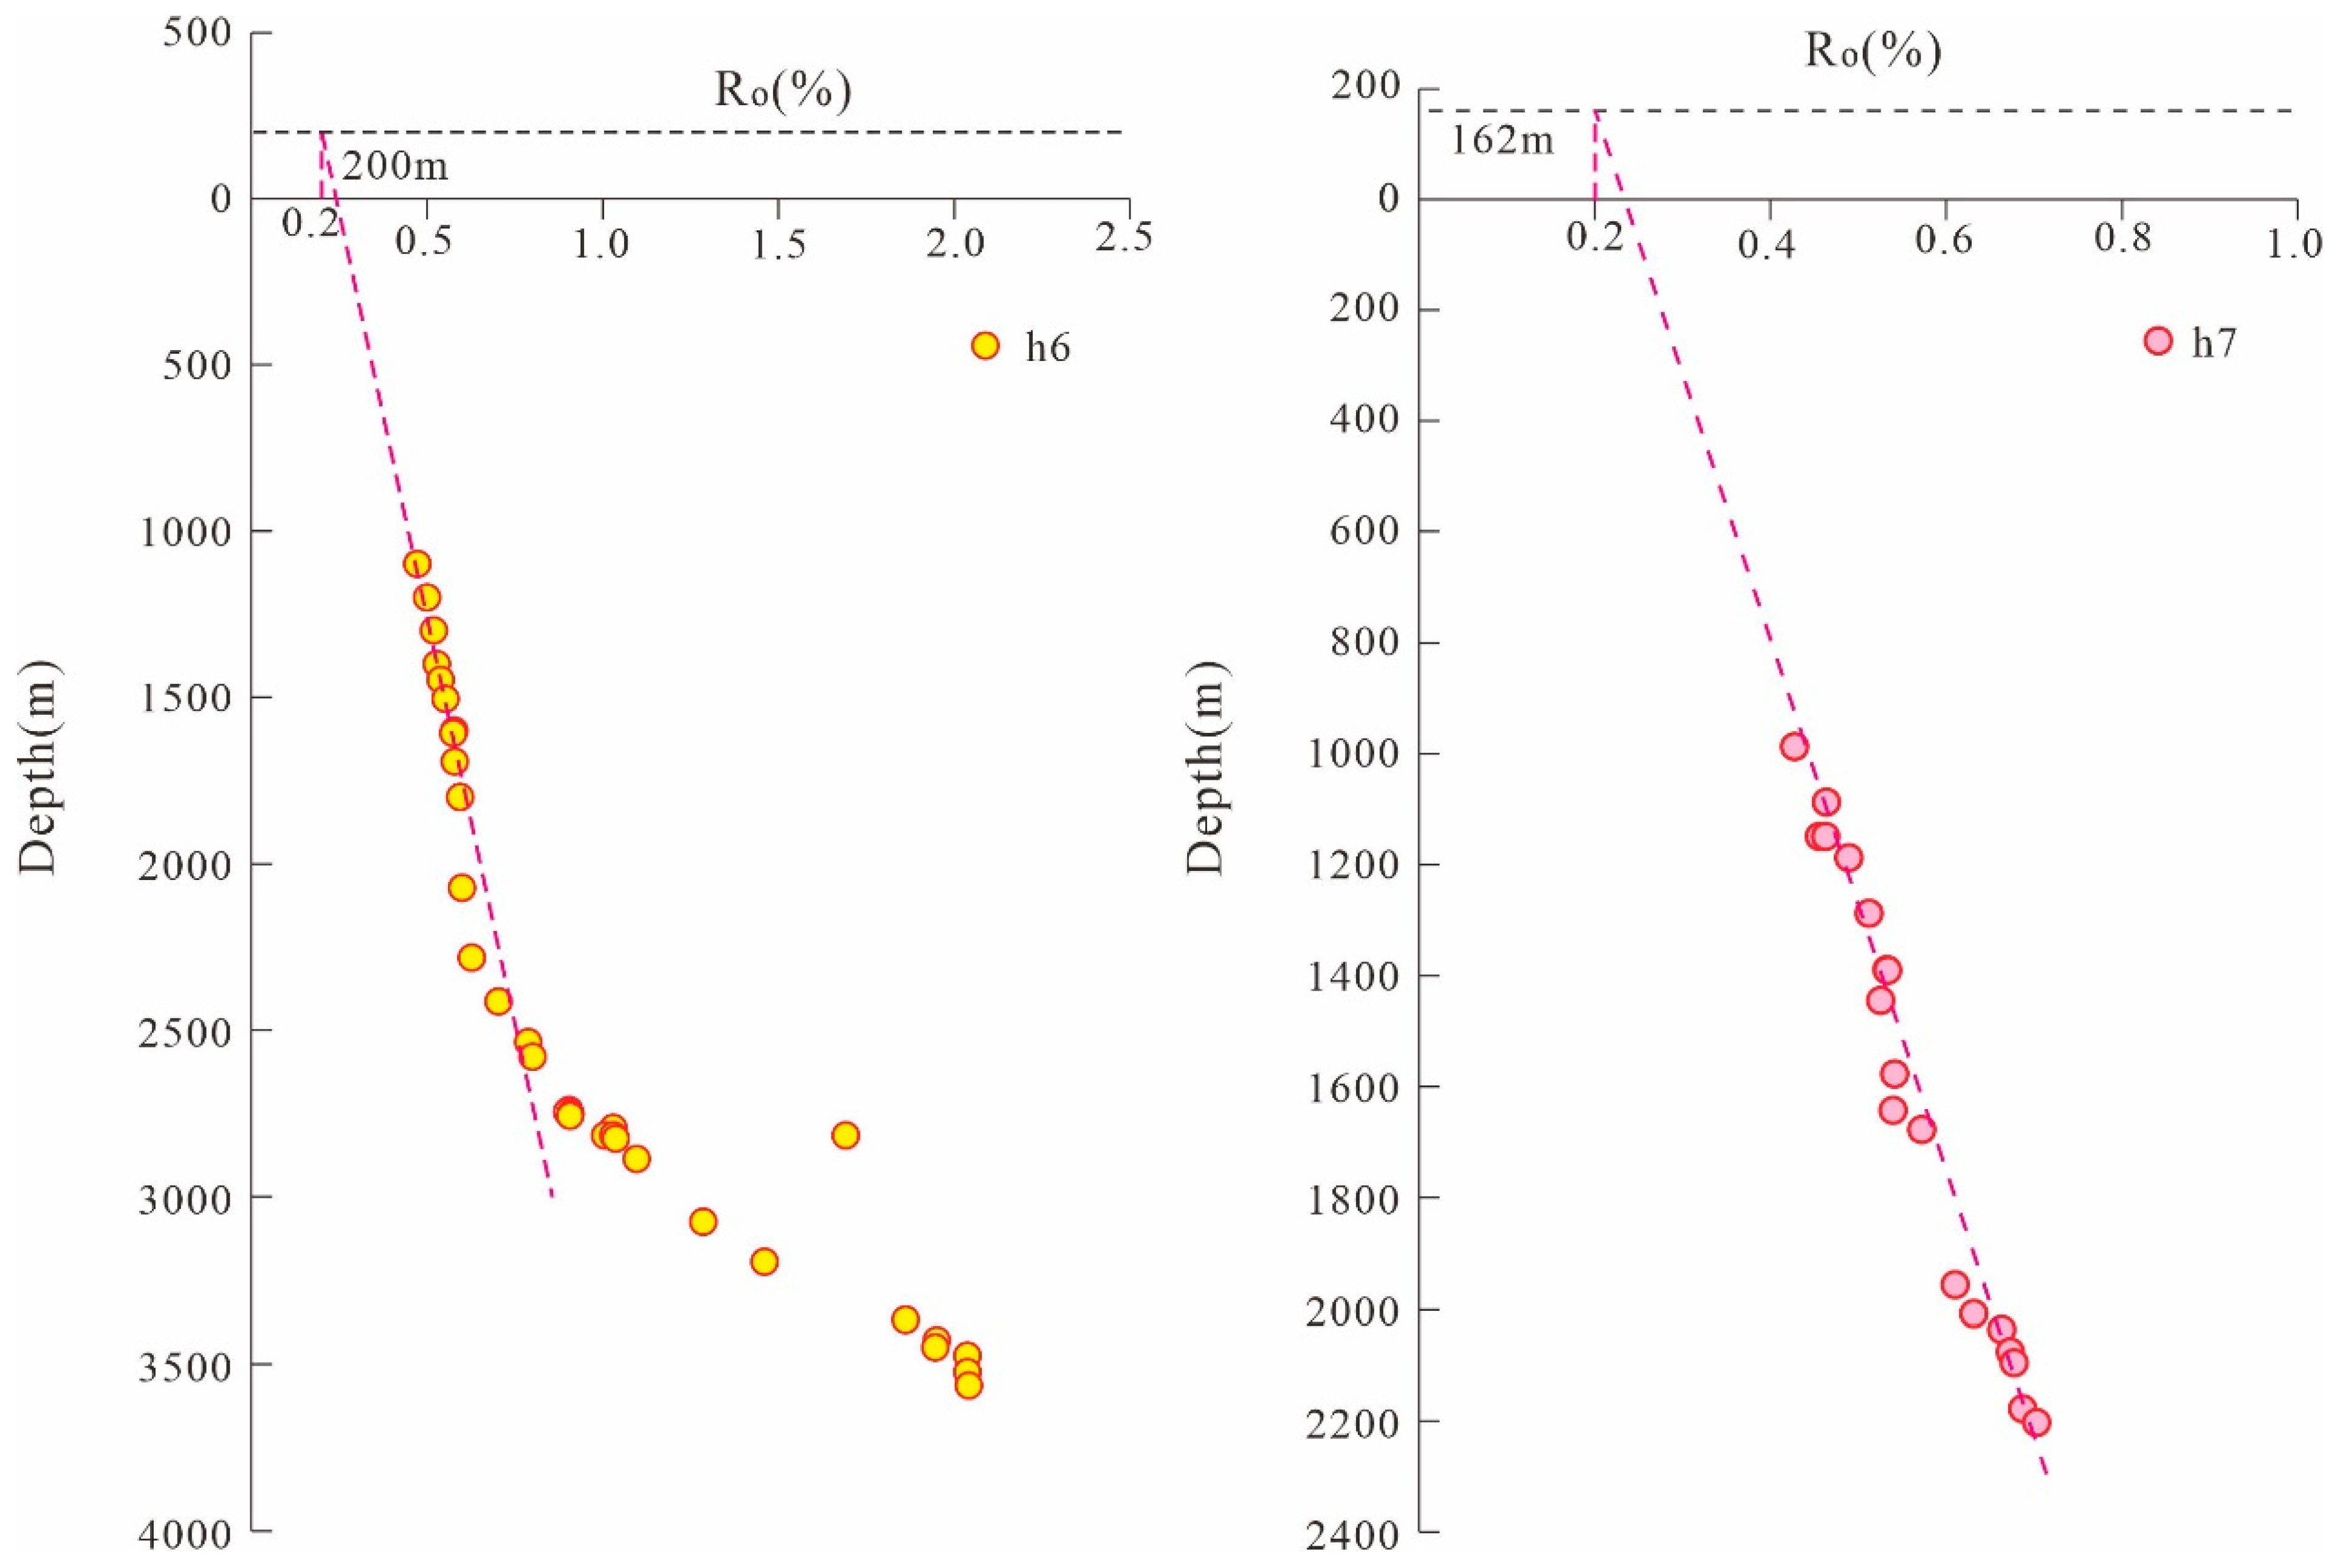
4.6.2. Erosion Thickness
4.6.3. Thermal History Simulation
5. Discussion
6. Conclusions
- (1)
- The dark mudstone of the Jurassic Tamulangou Formation in the Hongqi Depression has a thickness ranging from 50 to 200 m. The total organic carbon (TOC) content varies between an average of 0.14% to 2.91%. The chloroform bitumen “A” content averages 0.168%, and the hydrocarbon generation potential (S1 + S2) averages between 0.13 to 3.71 mg/g. The kerogen carbon isotope values range from −27.52‰ to −21.37‰. The organic matter type is mainly Type II and Type III, with the source material coming from both low-level aquatic organisms like algae and higher terrestrial plants. The vitrinite reflectance (Ro) averages between 0.71% and 1.36%. Overall, the source rocks have entered the mature oil generation stage, and the source rock is evaluated as being of medium quality.
- (2)
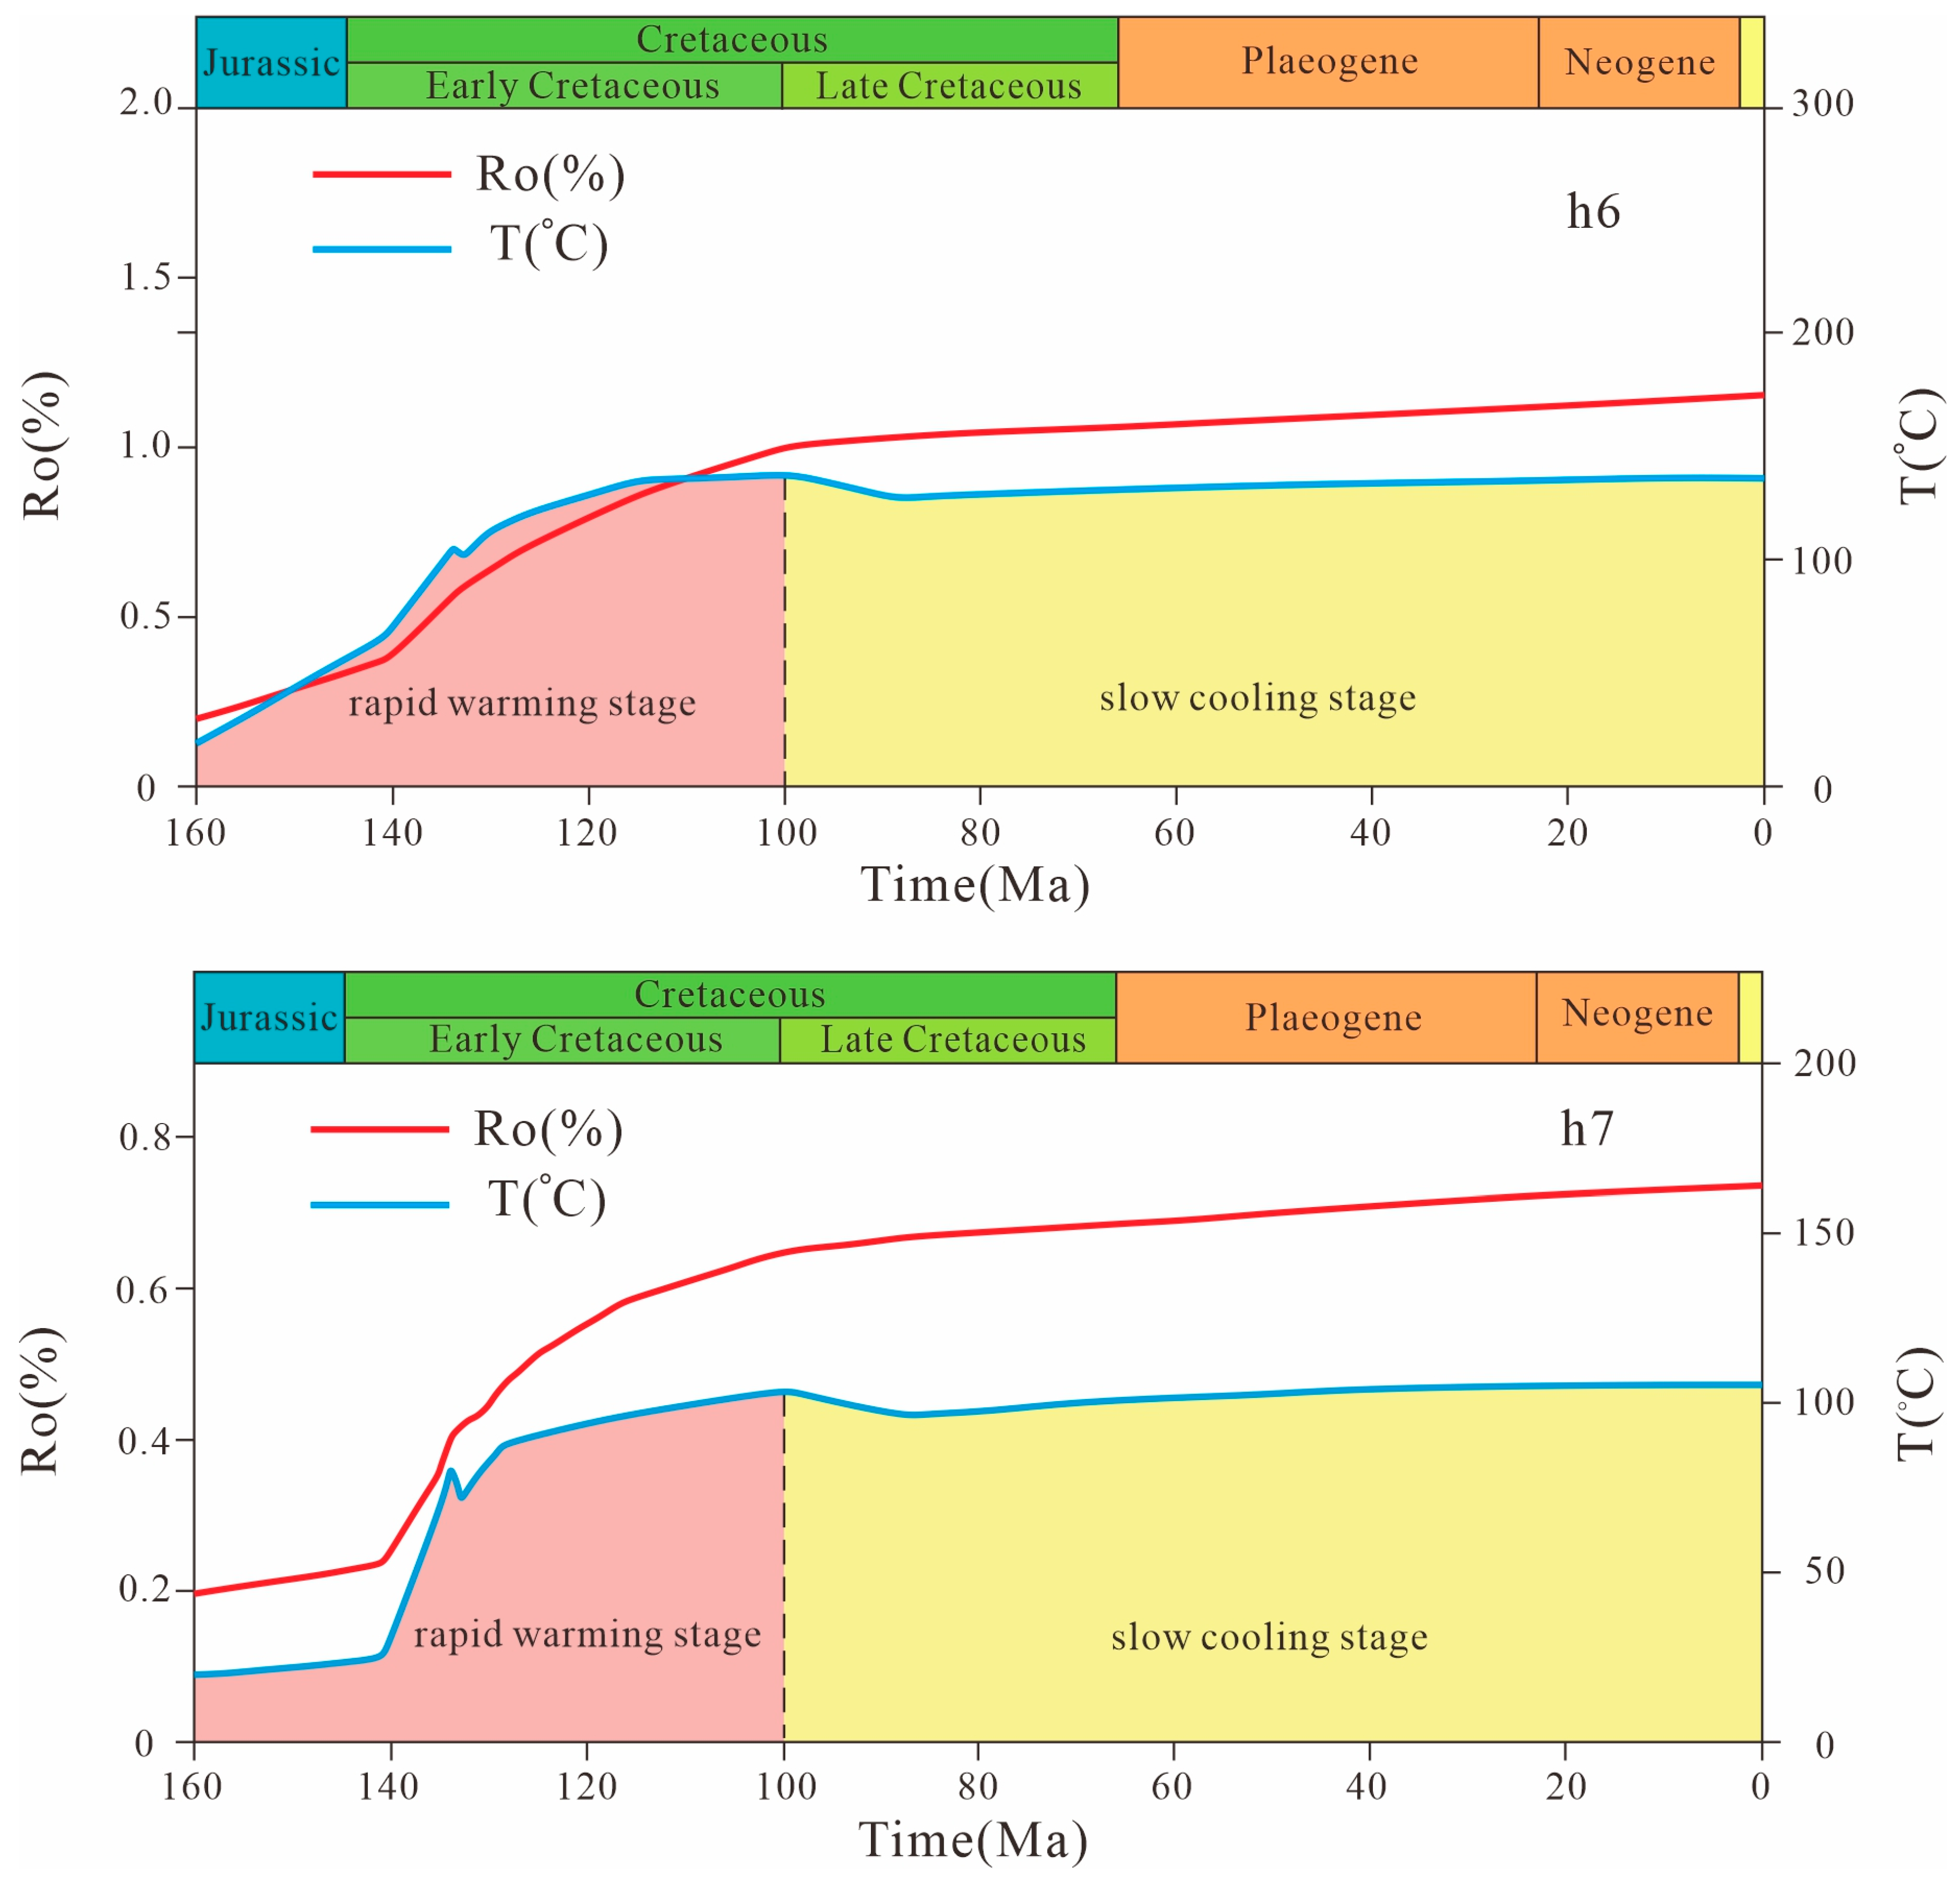
- The thermal history simulation results show that the Hongqi Depression’s Tamulangou Formation source rock has undergone two main thermal evolution stages since its deposition: a rapid warming stage during the Late Jurassic to Early Cretaceous and a slow cooling stage from the Late Cretaceous to the present. The thermal evolution history varies across different locations. In the southern part of the sag, the thermal evolution is more advanced. The Jurassic Tamulangou Formation source rock reached the hydrocarbon generation threshold at 138 Ma, peaked around 119 Ma with Ro reaching 1.0%, and the maximum paleo-temperature exceeded 140 °C. It is currently in the high-maturity oil generation stage. In the central part of the sag, the thermal evolution is less advanced. The source rock reached the hydrocarbon generation threshold at 128 Ma, entered the medium-maturity stage around 74 Ma, and has remained in this stage ever since.
- (3)
- During the Late Jurassic to Early Cretaceous, the Hailar Basin was in a stable rifting stage, characterized by significant and rapid subsidence and sedimentation. The maximum sedimentation rate reached 340 m/Ma, accompanied by intense volcanic activity, which created a high geothermal field. The geothermal gradient reached 40–65 °C/km, with paleo-temperatures exceeding 140 °C, and the warming rate was 1.38–2.02 °C/Ma. The source rock reached its maximum thermal evolution stage, which is consistent with the relatively high thermal background during the late Early Cretaceous in northern China basins. Afterward, the basin uplifted and cooled, with a decrease in subsidence and a gradual reduction in the formation temperature. The temperature evolution showed a pattern of first increasing and then decreasing.
Author Contributions
Funding
Institutional Review Board Statement
Informed Consent Statement
Data Availability Statement
Conflicts of Interest
References
- Li, C.B. Petroleum Exploration History and Enlightenment in Hailar Basin. Xinjiang Pet. Geol. 2021, 42, 374–380. [Google Scholar]
- Wang, X.J.; Meng, Q.A.; Li, Y.; Wu, H.B.; Li, J.H.; Deng, H.; Shen, W.J.; Chen, F.J.; Hou, S.Y.; Zhang, S.Q. New fields, new types and resource potentials of oil-gas exploration and development in Hailaer Basin. Acta Pet. Sin. 2024, 45, 99–114. [Google Scholar]
- Zhang, J.G.; Zhang, B.X.; Chen, P. Surrenurrenurren system in the Hailar Basin. Pet. Explor. Dev. 1998, 1, 41–44. [Google Scholar]
- Feng, Z.Q.; Zhang, X.D.; Ren, Y.G.; Wu, H.Y.; Li, C.B.; Dong, B.W. Hydrocarbon reservoir forming characteristics and distribution rule of Hailar Basin. Pet. Geol. Oilfield Dev. Daqing 2004, 5, 16–19. [Google Scholar]
- Chen, J.L.; Wu, H.Y.; Zhu, D.F.; Lin, C.H.; Yu, D.S. Tectonic evolution and prospects for hydrocarbon exploration in the Hailar Basin. Sci. Geol. Sin. 2007, 1, 147–159. [Google Scholar]
- Fu, X.F.; Dong, J.; Lv, Y.F.; Sun, Y.H. Fault Structural Characteristics of Wuerxun-Beier Depression in the Hailar Basin and Their Reservoir-Controlling Mechanism. Acta Geol. Sin. 2012, 86, 877–889. [Google Scholar]
- Cui, X.; Li, J.H.; Jiang, H.F.; Xu, L.; Zhang, H.W.; Wang, H. Characteristics of the volcanic basement reservoirs and its hydrocarbon accumulation mode in Sudeert structural belt, Hailar Basin, China. Nat. Gas Geosci. 2016, 27, 1466–1476. [Google Scholar]
- Cui, J.P.; Zhao, J.; Ren, Z.L.; Jin, W.; Xing, L.; Wang, Y.Q. Geochemical Characteristics of Lower Cretaceous Source Rocks and Thermal History in the Huhehu Depression, Hailar Basin. Earth Sci. 2020, 45, 238–250. [Google Scholar]
- Jia, J.H.; Tao, S.Z.; Fang, X.; Hou, Y.P. Deep Jurassic volcano-sedimentary succession, reservoir-seal assemblage and their exploration significance in Northeast China: A case study of Jurassic in the Hailar basin. Acta Geol. Sin. 2021, 95, 377–395. [Google Scholar]
- Wu, H.B.; Hou, Y.P.; Wang, P.J.; Chen, H.P.; Shen, W.J.; Peng, W.; Chen, C.Y. Hydrocarbon source in Jurassic and its exploration significance in Hongqi Depression, Hailar Basin. World Geol. 2023, 42, 676–690. [Google Scholar]
- Liu, Z.H.; Huang, C.Y.; Wang, P.; Wu, X.M.; Mei, M.; Zhou, F. Structural Features and Determination of Deformation Stages of Hongqi Depression in Hailar Basin During the Early Cretaceous. J. Jilin Univ. Earth Sci. Ed. 2011, 41, 327–334. [Google Scholar]
- Liu, H.L.; Li, Z.Q.; Peng, Y.; Meng, Q.A.; Li, J.S.; Chen, J.L.; Zhong, R.Q.; Li, Q.Q. Structural physical simulation and structural evolution characteristics of typical profile in Hongqi Depression, hailaer basin. Mineral. Petrol. 2020, 40, 92–106. [Google Scholar]
- Yang, X.; Shen, W.J. Characteristics and evolution of the structural formations in Hongqi Depression, Hailar Basin. Pet. Geol. Oilfield Dev. Daqing 2021, 40, 20–27. [Google Scholar]
- Xie, M.X.; Chen, G.P.; Su, Y.P. Characteristics and Development Model of Jurassic Source Rocks of Hailar Basin: Case Study in Hongqi Depression. J. Jilin Univ. Earth Sci. Ed. 2022, 52, 1065–1077. [Google Scholar]
- Yalcin, M.N.; Welte, D.H. The thermal evolution of sedimentary basins and significance for hydrocarbon generation. Geophys. J. Int. 1988, 1, 12–26. [Google Scholar]
- Qiu, N.S.; Wang, J.Y.; Zhou, L.C.; Zhang, Q.M.; Chen, G.Y.; Cai, S.X. Thermal evolution of organic matter in source rocks of sedimentary basins using electron paramagnetic resonance methods. Chin. Sci. Bull. 1995, 11, 1013–1015. [Google Scholar]
- Zhu, Y.M.; Qin, Y.; Fan, B.H.; Jiang, B.; Li, T.Z. Hydrocarbon-generation evolution of Paleozoic source rocks in the deep zone of Huanghua Depression. Chin. J. Geol. 2001, 36, 435–443. [Google Scholar]
- Wang, F.Y.; Shui-chang, Z.; Zhang, B.M.; Xiao, Z.Y.; Liu, C.W. Maturity and its history of Cambrian marine source rocks in the Tarim Basin. Geochimica 2003, 5, 461–468. [Google Scholar]
- Harris, N.B.; Freeman, K.H.; Pancost, R.D.; White, T.S.; Mitchell, G.D. The character and origin of lacustrine source rocks in the Lower Cretaceous synrift section, Congo Basin, west Africa. AAPG Bull. 2004, 88, 1163–1184. [Google Scholar] [CrossRef]
- El-Shahat, W.; Villinski, J.C.; El-Bakry, G. Hydrocarbon potentiality, burial history and thermal evolution for some source rocks in October oil field, northern Gulf of Suez, Egypt. J. Pet. Sci. Eng. 2009, 68, 245–267. [Google Scholar] [CrossRef]
- Gottardi, R.; Adams, L.M.; Borrok, D.; Teixeira, B. Hydrocarbon source rock characterization, burial history, and thermal maturity of the Steele, Niobrara and Mowry Formations at Teapot Dome, Wyoming. Mar. Pet. Geol. 2019, 100, 326–340. [Google Scholar] [CrossRef]
- Qiu, N.S.; Chang, J.; Feng, Q.Q.; Zeng, S.; Liu, X.Y.; Li, H.L.; Ma, A.L. Maturation history of deep and ultra-deep source rocks, central and western basins, China. Earth Sci. Front. 2023, 30, 199–212. [Google Scholar]
- Hunt, J.M. Petroleum Geochemistry and Geology (Textbook), 2nd ed.; WH Freeman Company: New York, NY, USA, 1995. [Google Scholar]
- Peters, K.E.; Walters, C.C.; Moldowan, J.M. Biomarkers and isotopes in the petroleum exploration and Earth history. In The Biomarker Guide; Cambridge University Press: Cambridge, UK, 2005. [Google Scholar]
- Fildani, A.; Hanson, A.D.; Chen, Z.; Moldowan, J.M.; Graham, S.A.; Arriola, P.R. Geochemical characteristics of oil and source rocks and implications for petroleum systems, Talara basin, northwest Peru. AAPG Bull. 2005, 89, 1519–1545. [Google Scholar] [CrossRef]
- Shalaby, M.R.; Hakimi, M.H.; Abdullah, W.H. Geochemical characteristics and hydrocarbon generation modeling of the Jurassic source rocks in the Shoushan Basin, north Western Desert, Egypt. Mar. Pet. Geol. 2011, 28, 1611–1624. [Google Scholar] [CrossRef]
- Sykes, R.; Snowdon, L.R. Guidelines for assessing the petroleum potential of coaly source rocks using Rock-Eval pyrolysis. Org. Geochem. 2002, 33, 1441–1455. [Google Scholar] [CrossRef]
- Allen, P.A.; Allen, J.R. Basin Analysis: Principles and Application to Petroleum Play Assessment; John Wiley & Sons: Hoboken, NJ, USA, 2013. [Google Scholar]
- Opera, A.; Alizadeh, B.; Sarafdokht, H.; Janbaz, M.; Fouladvand, R.; Heidarifard, M.H. Burial history reconstruction and thermal maturity modeling for the middle cretaceous–Early miocene petroleum System, southern Dezful Embayment, SW Iran. Int. J. Coal Geol. 2013, 120, 1–14. [Google Scholar] [CrossRef]
- Zhang, X.D.; Liu, G.D.; Wang, J.L. Structural characters of the hailar basinand its geologicai evolution. Pet. Geol. Exp. 1994, 2, 119–127. [Google Scholar]
- Zhang, Y.Q.; Zhao, Y.; Dong, S.W.; Yang, N. Tectonic evolution stages of the Early Cretaceous rift basins in Eastern China and adjacent areas and their geodynamic background. Earth Sci. Front. 2004, 3, 123–133. [Google Scholar]
- Liu, S.G.; Luo, Z.L.; Zhao, X.K.; Long, X.M.; Wang, D.L.; Zhang, E.H.; Li, A.F. Studying the evolution of the hailaer basin, neimenggu. J. Chengdu Univ. Technol. Sci. Technol. Ed. 1993, 2, 78–87. [Google Scholar]
- Peters, K.E.; Cassa, M.R. Applied Source Rock Geochemistry. In The Petroleum System. From Source to Trap; Magoon, L.B., Dow, W.G., Eds.; AAPG: Tulsa, OK, USA, 1994. [Google Scholar]
- Behar, F.; Beaumont, V.; Penteado, H.D.B. Rock-Eval 6 technology: Performances and developments. Oil Gas Sci. Technol. 2001, 56, 111–134. [Google Scholar] [CrossRef]
- Lopatin, N.V. Time and temperature as factors in coalification: Izvestiya Akademiya Nauk USSR. Seriya Geol. 1971, 3, 95–106. [Google Scholar]
- El Nady, M. Geothermal history of hydrocarbon generation of wells in the North Western Desert, Egypt. Energy Sources Part A Recovery Util. Environ. Eff. 2013, 35, 401–412. [Google Scholar] [CrossRef]
- Sweeney, J.J.; Burnham, A.K. Evaluation of a Simple Model of Vitrinite Reflectance Based on Chemical Kinetics1. AAPG Bull. 1990, 74, 1559–1570. [Google Scholar]
- Odisho, K.; Othman, R. Preliminary geochemical evaluation of hydrocarbon source rock in northern parts of Iraq. Iraqi Geol. J. 1992, 25, 136–153. [Google Scholar]
- Lu, S.F.; Ma, Y.L.; Cao, R.C.; Li, J.J.; Wang, W.M.; Li, H.G.; Chen, F.W. Evaluation Criteria of High-Quality Source Rocks and Its Applications: Taking the Wuerxun Sag in Hailaer Basin as an Example. Earth Sci. 2012, 37, 535–544. [Google Scholar]
- Bett, G.K. Geochemical Evaluation of the Hydrocarbon Potential of Source Rocks in the Anza Basin. Master’s Thesis, University of Nairobi, Nairobi, Kenya, 2018. [Google Scholar]
- Sundararaman, P.; Merz, P.H.; Mann, R.G. Determination of kerogen activation energy distribution. Energy Fuels 1992, 6, 793–803. [Google Scholar] [CrossRef]
- Tu, J.Q.; Wang, S.Z.; Fei, X.D. Geochemical characteristics of the jurassic hydrocarbonsource rocks in the baigezhuang uplift. Pet. Geol. Exp. 1998, 2, 187–191. [Google Scholar]
- Chen, L.; Wang, Z.Q.; Xie, Y.S.; Huang, W. Organic matter types of the Early Paleogene from the Sanshui Basin and its response to paleoclimate. Adv. Mater. Res. 2012, 518, 5809–5812. [Google Scholar] [CrossRef]
- Li, C.P.; Sui, G.M.; Liu, Z.G.; Yang, S.L.; Yan, Q.H.; Yin, C. Organic type identification for mature and postmature source rock. Geophys. Geochem. Explor. 2017, 41, 219–223. [Google Scholar]
- Hao, F.; Chen, J.Y.; Wang, Q.J. Carbon isotope composition of casein roots and its significance. Earth Environ. 1990, 2, 70–74. [Google Scholar]
- Liu, W.H.; Xu, Y.C.; Chen, J.F. Organic carbon isotope record in marine sediment and its environmental significance—An example from Ordos Basin, NW China. Pet. Explor. Dev. 2004, 5, 11–16. [Google Scholar]
- Guo, L.Y.; Zhang, S.W.; Xie, X.N.; Li, Z.S.; Huang, C.Y.; Chen, B.C. Geochemical Characteristics and Organic Matter Enrichment of the Dongyuemiao Member Mudstone of Lower Jurassic in the Western Hubei-Eastern Chongqing. Earth Sci. 2017, 42, 1235–1246. [Google Scholar]
- Riediger, C.L. Solid bitumen reflectance and Rock-Eval Tmax as maturation indices: An example from the “Nordegg Member”, Western Canada Sedimentary Basin. Int. J. Coal Geol. 1993, 22, 295–315. [Google Scholar] [CrossRef]
- Qiu, N.S. Thermal evaluation and hydrocarbon generation history of the sedimentary basins in western China. Pet. Explor. Dev. 2002, 1, 6–8. [Google Scholar]
- Petersen, H.I.; Sherwood, N.; Mathiesen, A.; Fyhn, M.B.W.; Dau, N.T.; Russell, N.; Bojesen-Koefoed, J.A.; Nielsen, L.H. Application of integrated vitrinite reflectance and FAMM analyses for thermal maturity assessment of the northeastern Malay Basin, offshore Vietnam: Implications for petroleum prospectivity evaluation. Mar. Pet. Geol. 2009, 26, 319–332. [Google Scholar] [CrossRef]
- Ren, Z.L.; Tian, T.; Li, J.B.; Wang, J.P.; Cui, J.P.; Li, H.; Tang, J.Y.; Guo, K. Review on Methods of Thermal Evolution History in Sedimentary Basins and Thermal Evolution History Reconstruction of Superimposed Basins. J. Earth Sci. Environ. 2014, 36, 1–21. [Google Scholar]
- Wu, H.B.; Wang, G.C.; Hou, Y.P.; Shi, G.Z.; Jia, Z.Z.; Peng, W.; Zhang, H.J. Seismic Identification of the Jurassic Volcano-Sedimentary series in the Hailar Basin and Lithofacies Palaeogeography Reconstruction. Earth Sci. 2022, 47, 3056–3072. [Google Scholar]
- Huang, Q.; Chen, R.T.; Peng, X.B.; Li, X.; Wang, N. Characteristics and geological significance of biomarkers from the Paleogene source rocks in Bozhong Sag, Bohai Bay Basin. Bull. Geol. Sci. Technol. 2022, 41, 180–192. [Google Scholar]
- Ren, Z.L. Advances on thermal histories of sedimentary basins. Adv. Earth Sci. 1992, 3, 43–49. [Google Scholar]
- Zuo, Y.H.; Qiu, N.S.; Hao, Q.Q.; Pang, X.Q.; Gao, X.; Wang, X.J.; Luo, X.P.; Zhao, Z.Y. Geothermal regime and source rock thermal evolution in the Chagan sag, Inner Mongolia, northern China. Mar. Pet. Geol. 2015, 59, 245–267. [Google Scholar] [CrossRef]
- Cui, J.P.; Ren, Z.L.; Su, Y.; Zhang, S.; Lu, L. Relationship between present geotemperature and hydrocarbon generation in Haila’er Basin. Pet. Explor. Dev. 2007, 04, 445–450. [Google Scholar]
- Barker, C.E.; Pawlewicz, M.J. The correlation of vitrinite reflectance with maximum temperature in humic organic matter. In Paleogeothermics: Evaluation of Geothermal Conditions in the Geological Past; Buntebarth, G., Stegena, L., Eds.; Springer: Berlin/Heidelberg, Germany, 1986; pp. 79–93. [Google Scholar]
- Cui, J.P.; Ren, Z.L. Research on the Paleotemperature in Hailaer Basin. Bull. Geol. Sci. Technol. 2013, 32, 151–156. [Google Scholar]
- Ma, C.D. Structural Characteristics, Evolution and Formationmechanism of Hongqi Depression, Hailar Basincourt Academician. Ph.D. Thesis, Chengdu University of Technology, Chengdu, China, 2020. [Google Scholar]
- Wei, Z.B.; Zhang, D.J.; Xu, H.X.; Wang, F.; Zhang, J.Z. Application of the EASY%Ro model to the study of the thermal history of Mesozoic basins in western China. Pet. Explor. Dev. 2001, 2, 43–46. [Google Scholar]
- Ren, Z.L.; Xiao, D.M.; Chi, Y.L. Restoration of the palaeogeotherm in songliao basin. Pet. Geol. Oilfield Dev. Daqing 2001, 1, 13–14. [Google Scholar]
- Yun, J.B.; Luo, D.Q.; Li, Y.X. Tectonic evolution of Mesozoic faulted basin complex in Northeast China in relation to oil formation. Pet. Explor. Dev. 1994, 6, 40–45. [Google Scholar]
- Zhou, J.B.; Zhang, X.Z.; Ma, Z.H.; Liu, L.; Jin, W.; Zhang, M.S.; Wang, C.W.; Chi, X.G. Tectonic framework and basin evolution in Northeast China. Oil Gas Geol. 2009, 30, 530–538. [Google Scholar]
- Li, J.Y.; Guo, F.; Li, C.W.; Li, H.X.; Zhao, L. Late Paleozoic-Mesozoic Nd isotopic variation of I-type and A-type granites in Northeast China and its tectonic significance. Petrol. J. 2014, 30, 1995–2008. [Google Scholar]
- Zhang, X.Z.; Guo, Y.; Zeng, Z.; Fu, Q.L.; Pu, J.B. Dynamic background of the formation and evolution of Mesozoic-Cenozoic basin groups in Northeast China. Geosci. Front. 2015, 22, 88–98. [Google Scholar]


| Well | Lithology | Depth (m) | TOC (%) | “A” (%) | S1 (mg/g) | S2 (mg/g) | S1 + S2 (mg/g) | HI (mg/g) | OI (mg/g) | Tmax (°C) | Ro (%) | δ13CPDB (‰) |
|---|---|---|---|---|---|---|---|---|---|---|---|---|
| H6 | Mudstone | 2580 | 0.27 | 0.083 | 0.84 | 0.31 | 1.15 | 115 | 36.95 | 440 | 0.80 | / |
| H6 | Mudstone | 2640 | 0.32 | 0.051 | 0.04 | 0.28 | 0.32 | 88 | 9.40 | 443 | / | / |
| H6 | Mudstone | 2740 | 1.49 | 0.419 | 0.82 | 4.81 | 5.63 | 323 | 31.58 | 447 | 0.90 | −26.142 |
| H6 | Mudstone | 2742 | 1.89 | / | 1.86 | 6.91 | 8.77 | 365 | 39.13 | 447 | / | / |
| H6 | Mudstone | 2744 | 2.01 | / | 1.38 | 7.28 | 8.66 | 363 | 35.89 | 443 | / | / |
| H6 | Mudstone | 2746 | 1.24 | 0.385 | 0.36 | 4.11 | 4.47 | 332 | 29.93 | 437 | 0.90 | −25.447 |
| H6 | Mudstone | 2748 | 1.21 | / | 1.02 | 4.51 | 5.53 | 374 | 38.17 | 436 | / | / |
| H6 | Mudstone | 2750 | 1.58 | / | 1.15 | 5.48 | 6.63 | 347 | 34.82 | 443 | / | / |
| H6 | Mudstone | 2752 | 1.44 | 0.449 | 1.38 | 4.99 | 6.37 | 346 | 36.80 | 441 | 0.91 | −26.639 |
| H6 | Mudstone | 2754 | 1.32 | / | 1.04 | 4.64 | 5.68 | 352 | 35.61 | 443 | / | / |
| H6 | Mudstone | 2756 | 1.40 | / | 1.08 | 5.07 | 6.15 | 363 | 36.49 | 444 | / | / |
| H6 | Mudstone | 2758 | 1.35 | 0.592 | 1.06 | 4.85 | 5.91 | 359 | 36.30 | 441 | 0.91 | −26.034 |
| H6 | Mudstone | 2760 | 1.20 | 0.373 | 1.04 | 3.92 | 4.96 | 328 | 34.31 | 439 | / | −25.904 |
| H6 | Mudstone | 2794 | 1.26 | 0.296 | 0.53 | 3.21 | 3.74 | 255 | 24.67 | 441 | 1.03 | −25.438 |
| H6 | Mudstone | 2809.6 | 0.90 | / | 0.71 | 1.5 | 2.21 | 166 | 19.95 | 455 | / | / |
| H6 | Mudstone | 2813.27 | 0.14 | / | 0.03 | 0.17 | 0.2 | 124 | 14.55 | 468 | / | / |
| H6 | Mudstone | 2813.77 | 0.19 | / | 0.05 | 0.2 | 0.25 | 104 | 10.36 | 560 | / | / |
| H6 | Mudstone | 2814.27 | 0.10 | / | 0.01 | 0.07 | 0.08 | 71 | 10.16 | 452 | / | / |
| H6 | Mudstone | 2815.07 | 0.46 | / | 0.35 | 1.2 | 1.55 | 263 | 28.46 | 373 | / | / |
| H6 | Mudstone | 2815.57 | 1.43 | 0.234 | 0.84 | 2.72 | 3.56 | 191 | 21.02 | 456 | 1.01 | −27.434 |
| H6 | Mudstone | 2815.78 | 1.58 | / | 0.98 | 3.49 | 4.47 | 221 | 23.41 | 447 | 1.03 | −27.522 |
| H6 | Mudstone | 2816.07 | 1.63 | / | 0.28 | 0.96 | 1.24 | 59 | 200.73 | 474 | 1.69 | / |
| H6 | Mudstone | 2816.08 | 1.48 | / | 0.59 | 0.7 | 1.29 | 47 | 1144.41 | 479 | / | / |
| H6 | Mudstone | 2816.27 | 1.55 | / | 1.81 | 5.65 | 7.46 | 364 | 40.00 | 456 | / | / |
| H6 | Mudstone | 2816.87 | 1.77 | 0.453 | 1.67 | 5.15 | 6.82 | 291 | 251.13 | 448 | / | −26.38 |
| H6 | Mudstone | 2817.07 | 1.55 | / | 2.06 | 5.94 | 8 | 382 | 42.48 | 454 | / | / |
| H6 | Mudstone | 2818.17 | 0.34 | / | 0.41 | 1.59 | 2 | 464 | 49.65 | 447 | / | / |
| H6 | Mudstone | 2818.67 | 0.31 | 0.158 | 0.21 | 0.25 | 0.46 | 82 | 6258.99 | 306 | / | −27.2 |
| H6 | Mudstone | 2818.68 | 1.16 | / | 1.06 | 2.94 | 4 | 253 | 6.02 | 449 | / | / |
| H6 | Mudstone | 2818.77 | 0.75 | / | 0.77 | 2.47 | 3.24 | 329 | 35.92 | 448 | / | / |
| H6 | Mudstone | 2825 | 0.36 | 0.250 | 0.44 | 1.21 | 1.65 | 340 | 39.33 | 443 | 1.04 | / |
| H6 | Mudstone | 2853 | 0.97 | / | 0.62 | 3.41 | 4.03 | 350 | 34.92 | 441 | / | / |
| H6 | Mudstone | 2859 | 0.66 | / | 0.43 | 1.32 | 1.75 | 199 | 22.62 | 425 | / | / |
| H6 | Mudstone | 2867 | 0.61 | 0.174 | 0.57 | 1.91 | 2.48 | 313 | 34.45 | 427 | / | / |
| H6 | Mudstone | 2880 | 0.69 | / | 0.37 | 1.58 | 1.95 | 230 | 23.27 | 424 | / | / |
| H6 | Mudstone | 2886 | 0.72 | 0.282 | 0.44 | 2.18 | 2.62 | 304 | 30.69 | 446 | 1.10 | −26.525 |
| H6 | Mudstone | 2910 | 0.43 | 0.095 | 0.21 | 0.95 | 1.16 | 222 | 23.39 | 440 | / | / |
| H6 | Mudstone | 2958 | 1.38 | 0.064 | 0.35 | 4.52 | 4.87 | 327 | 28.91 | 439 | / | −23.761 |
| H6 | Mudstone | 3007 | 0.66 | / | 1.31 | 2.12 | 3.43 | 321 | 42.42 | 429 | / | / |
| H6 | Mudstone | 3012.4 | 0.43 | / | 0.12 | 0.26 | 0.38 | 61 | 6.98 | 463 | / | / |
| H6 | Mudstone | 3015 | 0.38 | / | 0.31 | 1.02 | 1.33 | 266 | 28.72 | 440 | / | / |
| H6 | Mudstone | 3028 | 0.53 | / | 0.84 | 1.83 | 2.67 | 347 | 41.76 | 424 | / | / |
| H6 | Mudstone | 3040 | 0.49 | 0.106 | 0.4 | 1.39 | 1.79 | 284 | 30.62 | 424 | / | −24.677 |
| H6 | Mudstone | 3045.8 | 0.75 | / | 0.23 | 0.39 | 0.62 | 52 | 6.64 | 479 | / | / |
| H6 | Mudstone | 3051 | 0.63 | / | 0.31 | 1.47 | 1.78 | 232 | 23.72 | 425 | / | / |
| H6 | Mudstone | 3075 | 0.31 | 0.034 | 0.09 | 0.58 | 0.67 | 189 | 19.52 | 430 | 1.29 | / |
| H6 | Mudstone | 3084 | 0.43 | / | 0.03 | 0.43 | 0.46 | 99 | 9.22 | 443 | / | / |
| H6 | Mudstone | 3151 | 0.57 | / | 0.12 | 1.04 | 1.16 | 182 | 17.52 | 428 | / | / |
| H6 | Mudstone | 3195 | 0.74 | 0.039 | 0.1 | 0.84 | 0.94 | 113 | 10.76 | 444 | 1.46 | / |
| H6 | Mudstone | 3257 | 0.95 | / | 0.11 | 1.02 | 1.13 | 107 | 9.44 | 431 | / | / |
| H6 | Mudstone | 3265 | 1.18 | / | 0.07 | 1.29 | 1.36 | 109 | 9.29 | 439 | / | / |
| H6 | Mudstone | 3274 | 4.27 | 0.035 | 0.12 | 8.39 | 8.51 | 196 | 16.61 | 429 | / | −22.212 |
| H6 | Mudstone | 3313 | 0.46 | / | 1.03 | 2.08 | 3.11 | 456 | 57.04 | 430 | / | / |
| H6 | Mudstone | 3369 | 0.41 | 0.056 | 0.06 | 0.46 | 0.52 | 113 | 9.85 | 431 | 1.86 | −23.308 |
| H6 | Mudstone | 3378 | 0.68 | / | 0.09 | 0.6 | 0.69 | 88 | 8.78 | 439 | / | / |
| H6 | Mudstone | 3384 | 0.76 | / | 0.11 | 0.88 | 0.99 | 115 | 10.48 | 442 | / | / |
| H6 | Mudstone | 3390 | 0.78 | 0.036 | 0.14 | 0.69 | 0.83 | 88 | 8.98 | 435 | / | −23.793 |
| H6 | Mudstone | 3395 | 0.67 | / | 0.14 | 0.65 | 0.79 | 97 | 10.44 | 439 | / | / |
| H6 | Mudstone | 3412 | 0.71 | / | 0.13 | 0.65 | 0.78 | 92 | 9.91 | 443 | / | / |
| H6 | Mudstone | 3414 | 0.73 | / | 0.15 | 0.69 | 0.84 | 95 | 9.65 | 440 | / | / |
| H6 | Mudstone | 3420 | 0.61 | / | 0.15 | 0.7 | 0.85 | 114 | 11.41 | 440 | / | / |
| H6 | Mudstone | 3428.92 | 0.57 | / | 0.5 | 1.14 | 1.64 | 198 | 24.36 | 454 | / | / |
| H6 | Mudstone | 3429.62 | 1.48 | / | 0.49 | 1.25 | 1.74 | 84 | 10.11 | 483 | / | / |
| H6 | Mudstone | 3429.92 | 1.82 | 0.064 | 0.56 | 1.55 | 2.11 | 85 | 9.87 | 484 | 1.95 | −26.925 |
| H6 | Mudstone | 3430 | 1.88 | 0.056 | 0.06 | 1.8 | 1.86 | 96 | 8.52 | 438 | / | −22.479 |
| H6 | Mudstone | 3430.52 | 0.96 | / | 0.39 | 1.13 | 1.52 | 118 | 13.55 | 479 | / | / |
| H6 | Mudstone | 3431.12 | 1.61 | / | 0.51 | 1.28 | 1.79 | 80 | 9.34 | 485 | / | / |
| H6 | Mudstone | 3431.72 | 0.41 | / | 0.23 | 0.48 | 0.71 | 118 | 14.71 | 482 | / | / |
| H6 | Mudstone | 3432.22 | 0.20 | / | 0.07 | 0.28 | 0.35 | 142 | 15.20 | 346 | / | / |
| H6 | Mudstone | 3435 | 0.79 | / | 0.06 | 1.7 | 1.76 | 215 | 19.01 | 442 | / | / |
| H6 | Mudstone | 3442 | 1.00 | / | 0.04 | 2.46 | 2.5 | 246 | 21.03 | 439 | / | / |
| H6 | Mudstone | 3450 | 0.40 | 0.040 | 0.04 | 0.69 | 0.73 | 174 | 15.09 | 432 | 1.95 | −22.18 |
| H6 | Mudstone | 3456 | 0.66 | / | 0.04 | 0.61 | 0.65 | 92 | 7.56 | 437 | / | / |
| H6 | Mudstone | 3475 | 0.40 | 0.018 | 0.06 | 0.56 | 0.62 | 141 | 12.62 | 441 | 2.04 | −23.521 |
| H6 | Mudstone | 3486 | 0.56 | / | 0.05 | 0.58 | 0.63 | 103 | 8.92 | 439 | / | / |
| H6 | Mudstone | 3492 | 0.51 | 0.022 | 0.06 | 0.68 | 0.74 | 134 | 11.79 | 450 | / | −22.167 |
| H6 | Mudstone | 3502 | 0.48 | / | 0.08 | 0.35 | 0.43 | 73 | 8.32 | 477 | / | / |
| H6 | Mudstone | 3514 | 0.52 | / | 0.04 | 0.33 | 0.37 | 63 | 5.72 | 477 | / | / |
| H6 | Mudstone | 3525 | 0.90 | 0.016 | 0.04 | 0.6 | 0.64 | 66 | 5.54 | 436 | 2.04 | −21.997 |
| H6 | Mudstone | 3540 | 0.27 | / | 0.01 | 0.18 | 0.19 | 66 | 7.36 | 442 | / | / |
| H6 | Mudstone | 3545 | 0.19 | / | 0.01 | 0.11 | 0.12 | 58 | 5.31 | 443 | / | / |
| H6 | Mudstone | 3550 | 0.36 | 0.010 | 0.02 | 0.24 | 0.26 | 67 | 5.60 | 442 | / | −22.408 |
| H6 | Mudstone | 3565 | 0.65 | 0.037 | 0.16 | 1.18 | 1.34 | 181 | 16.88 | 436 | 2.04 | −21.369 |
| H7 | Mudstone | 2200 | 2.23 | / | 0.07 | 3.72 | 3.79 | 167 | 380.88 | 439 | / | / |
| H7 | Mudstone | 2208 | 3.60 | / | 0.08 | 3.56 | 3.64 | 99 | 189.58 | 422 | 0.70 | / |
| H8 | Mudstone | 2757.3 | 0.14 | / | 0.01 | 0.07 | 0.08 | 50 | 99.15 | 449 | / | / |
| H8 | Mudstone | 2999.6 | 0.14 | / | 0.02 | 0.16 | 0.18 | 112 | 97.77 | 448 | / | / |
| No. | Depth (m) | Carbon Number Range | MPC | Pr/Ph | Pr/nC17 | Pr/nC18 | nC21-/nC22 | nC21+22/nC28+29 | OEP | CPI |
|---|---|---|---|---|---|---|---|---|---|---|
| 1 | 2740 | nC13–nC35 | nC21 | 1.14 | 0.43 | 0.36 | 0.92 | 2.52 | 1.05 | 0.91 |
| 2 | 2746 | nC13–nC35 | nC21 | 1.08 | 0.48 | 0.37 | 0.93 | 2.85 | 1.06 | 0.92 |
| 3 | 2752 | nC14–nC35 | nC19 | 1.08 | 0.42 | 0.33 | 1.03 | 2.92 | 1.09 | 0.93 |
| 4 | 2758 | nC13–nC35 | nC19 | 1.14 | 0.51 | 0.39 | 1.00 | 2.71 | 1.10 | 0.98 |
| 5 | 2760 | nC13–nC35 | nC21 | 1.27 | 0.55 | 0.47 | 1.10 | 2.45 | 1.06 | 0.90 |
| 6 | 2794 | nC13–nC36 | nC19 | 1.12 | 0.26 | 0.24 | 1.94 | 2.97 | 1.08 | 0.92 |
| 7 | 2815.57 | nC12–nC36 | nC19 | 1.25 | 0.40 | 0.31 | 1.44 | 2.58 | 1.06 | 0.86 |
| 8 | 2815.78 | nC13–nC35 | nC19 | 1.15 | 0.51 | 0.42 | 1.55 | 2.89 | 1.13 | 0.90 |
| 9 | 2816.87 | nC14–nC36 | nC19 | 1.08 | 0.42 | 0.34 | 1.17 | 2.76 | 1.01 | 0.90 |
| 10 | 2816.97 | nC12–nC36 | nC19 | 1.22 | 0.50 | 0.38 | 1.31 | 2.49 | 1.10 | 0.91 |
| 11 | 2818.67 | nC15–nC36 | nC20 | 1.01 | 0.42 | 0.34 | 0.83 | 1.90 | 1.01 | 0.94 |
| 12 | 2825 | nC12–nC36 | nC19 | 1.03 | 0.53 | 0.42 | 0.94 | 2.61 | 1.08 | 0.92 |
| 13 | 2867 | nC12–nC36 | nC19 | 1.00 | 0.43 | 0.38 | 1.26 | 3.06 | 1.06 | 0.91 |
| 14 | 2886 | nC12–nC36 | nC19 | 1.23 | 0.44 | 0.34 | 1.34 | 3.07 | 1.06 | 0.93 |
| 15 | 2910 | nC13–nC36 | nC19 | 1.03 | 0.61 | 0.53 | 1.25 | 2.91 | 1.11 | 0.87 |
| 16 | 2958 | nC13–nC36 | nC19 | 1.26 | 0.56 | 0.42 | 1.32 | 2.84 | 1.10 | 0.91 |
| 17 | 3040 | nC13–nC36 | nC19 | 1.19 | 0.34 | 0.23 | 1.12 | 2.87 | 1.04 | 0.89 |
| 18 | 3075 | nC13–nC36 | nC19 | 0.93 | 0.47 | 0.41 | 0.91 | 2.39 | 1.07 | 0.91 |
| 19 | 3195 | nC13–nC36 | nC19 | 1.23 | 0.50 | 0.37 | 1.18 | 2.55 | 1.09 | 0.90 |
| 20 | 3274 | nC13–nC36 | nC19 | 1.15 | 0.42 | 0.32 | 1.40 | 3.32 | 1.11 | 0.88 |
| 21 | 3369 | nC13–nC36 | nC19 | 1.37 | 0.51 | 0.37 | 1.84 | 3.14 | 1.11 | 0.86 |
| 22 | 3390 | nC13–nC35 | nC19 | 1.18 | 0.53 | 0.39 | 1.11 | 2.27 | 1.16 | 0.94 |
| 23 | 3429.92 | nC12–nC36 | nC19 | 1.39 | 0.42 | 0.30 | 1.41 | 2.18 | 1.17 | 0.88 |
| 24 | 3430 | nC13–nC34 | nC19 | 1.16 | 0.65 | 0.49 | 1.34 | 2.69 | 1.18 | 0.94 |
| 25 | 3450 | nC13–nC36 | nC19 | 1.09 | 0.42 | 0.36 | 1.23 | 2.59 | 1.08 | 0.92 |
| 26 | 3475 | nC13–nC36 | nC19 | 0.86 | 0.30 | 0.28 | 1.24 | 3.00 | 1.10 | 0.86 |
| 27 | 3492 | nC12–nC36 | nC19 | 0.90 | 0.23 | 0.20 | 0.84 | 2.42 | 1.06 | 0.86 |
| 28 | 3525 | nC12–nC36 | nC19 | 0.69 | 0.35 | 0.31 | 0.77 | 2.34 | 1.07 | 0.98 |
| 29 | 3550 | nC12–nC36 | nC23 | 0.73 | 0.38 | 0.30 | 0.68 | 2.23 | 1.13 | 0.96 |
| 30 | 3565 | nC13–nC36 | nC19 | 1.09 | 0.43 | 0.34 | 1.33 | 3.26 | 1.10 | 0.94 |
| No. | Depth (m) | Lithology | Asphaltenes | Saturated Hydrocarbon | Aromatic Hydrocarbon | Non Hydrocarbon | Non Hydrocarbon + Asphaltenes |
|---|---|---|---|---|---|---|---|
| 1 | 2580 | Black mudstone | 2.305 | 52.161 | 11.153 | 10.375 | 12.68 |
| 2 | 2640 | Black mudstone | 6.42 | 42.996 | 13.619 | 30.156 | 36.576 |
| 3 | 2740 | Black mudstone | 2.045 | 55.01 | 17.996 | 20.654 | 22.699 |
| 4 | 2746 | Black mudstone | 2.648 | 52.138 | 17.719 | 20.774 | 23.422 |
| 5 | 2752 | Black mudstone | 2.036 | 55.882 | 19.683 | 15.611 | 17.647 |
| 6 | 2758 | Black mudstone | 0.866 | 58.009 | 19.481 | 14.069 | 14.935 |
| 7 | 2760 | Black mudstone | 2.242 | 61.659 | 19.955 | 13.004 | 15.246 |
| 8 | 2794 | Black mudstone | 5.416 | 59.574 | 14.7 | 13.926 | 19.342 |
| 9 | 2815.57 | Black mudstone | 3.018 | 61.368 | 16.499 | 9.859 | 12.877 |
| 10 | 2815.78 | Black mudstone | 2.033 | 65.041 | 20.528 | 6.707 | 8.74 |
| 11 | 2816.87 | Black mudstone | 3.992 | 59.281 | 14.97 | 10.18 | 14.172 |
| 12 | 2816.97 | Black mudstone | 3.48 | 71.612 | 14.103 | 6.41 | 9.89 |
| 13 | 2818.67 | Black mudstone | 23.508 | 49.005 | 12.297 | 7.957 | 31.465 |
| 14 | 2825 | Black mudstone | 3.626 | 66.221 | 13.931 | 13.931 | 17.557 |
| 15 | 2867 | Black mudstone | 3.571 | 66.807 | 12.605 | 12.815 | 16.386 |
| 16 | 2886 | Black mudstone | 4.008 | 63.08 | 16.034 | 9.705 | 13.713 |
| 17 | 2910 | Black mudstone | 4.494 | 60.674 | 14.045 | 12.921 | 17.415 |
| 18 | 2958 | Black mudstone | 2.783 | 53.082 | 15.507 | 17.893 | 20.676 |
| 19 | 3040 | Black mudstone | 3.915 | 42.527 | 10.142 | 32.74 | 36.655 |
| 20 | 3075 | Black mudstone | 4.651 | 36.919 | 13.663 | 32.558 | 37.209 |
| 21 | 3195 | Black mudstone | 7.216 | 54.639 | 12.371 | 17.268 | 24.484 |
| 22 | 3274 | Black mudstone | 6.34 | 55.043 | 11.239 | 17.867 | 24.207 |
| 23 | 3369 | Black mudstone | 9.498 | 57.706 | 9.498 | 10.394 | 19.892 |
| 24 | 3390 | Black mudstone | 8.84 | 47.238 | 8.564 | 21.823 | 30.663 |
| 25 | 3429.92 | Black mudstone | 6.754 | 66.979 | 9.944 | 8.255 | 15.009 |
| 26 | 3430 | Black mudstone | 10.252 | 49.281 | 10.612 | 17.086 | 27.338 |
| 27 | 3450 | Black mudstone | 7.018 | 57.143 | 14.536 | 14.787 | 21.805 |
| 28 | 3475 | Black mudstone | 12.291 | 49.721 | 10.056 | 21.788 | 34.079 |
| 29 | 3492 | Black mudstone | 11.111 | 44.907 | 10.185 | 23.148 | 34.259 |
| 30 | 3525 | Black mudstone | 17.722 | 37.975 | 12.658 | 25.949 | 43.671 |
| 31 | 3550 | Black mudstone | 21.359 | 36.893 | 13.592 | 30.097 | 51.456 |
| 32 | 3565 | Black mudstone | 6.452 | 53.226 | 11.559 | 17.742 | 24.194 |
Disclaimer/Publisher’s Note: The statements, opinions and data contained in all publications are solely those of the individual author(s) and contributor(s) and not of MDPI and/or the editor(s). MDPI and/or the editor(s) disclaim responsibility for any injury to people or property resulting from any ideas, methods, instructions or products referred to in the content. |
© 2025 by the authors. Licensee MDPI, Basel, Switzerland. This article is an open access article distributed under the terms and conditions of the Creative Commons Attribution (CC BY) license (https://creativecommons.org/licenses/by/4.0/).
Share and Cite
Cui, J.; Jin, W.; Ren, Z.; Tao, H.; Song, H.; Guo, W. Geochemical Characteristics and Thermal Evolution History of Jurassic Tamulangou Formation Source Rocks in the Hongqi Depression, Hailar Basin. Appl. Sci. 2025, 15, 8052. https://doi.org/10.3390/app15148052
Cui J, Jin W, Ren Z, Tao H, Song H, Guo W. Geochemical Characteristics and Thermal Evolution History of Jurassic Tamulangou Formation Source Rocks in the Hongqi Depression, Hailar Basin. Applied Sciences. 2025; 15(14):8052. https://doi.org/10.3390/app15148052
Chicago/Turabian StyleCui, Junping, Wei Jin, Zhanli Ren, Hua Tao, Haoyu Song, and Wei Guo. 2025. "Geochemical Characteristics and Thermal Evolution History of Jurassic Tamulangou Formation Source Rocks in the Hongqi Depression, Hailar Basin" Applied Sciences 15, no. 14: 8052. https://doi.org/10.3390/app15148052
APA StyleCui, J., Jin, W., Ren, Z., Tao, H., Song, H., & Guo, W. (2025). Geochemical Characteristics and Thermal Evolution History of Jurassic Tamulangou Formation Source Rocks in the Hongqi Depression, Hailar Basin. Applied Sciences, 15(14), 8052. https://doi.org/10.3390/app15148052