1. Introduction
Exercise is a critical element in the treatment and improvement of function and quality of life [
1]. The American Heart Association [
2], the Centers for Disease Control and Prevention [
3], and the American College of Sports Medicine (ACSM) [
1] all recommend regular exercise of moderate intensity for the prevention and complementary treatment of several diseases. However, participation in physical activity and exercise can be largely affected by pain or risk of injury. Clinical populations that experience pain and have functional deficits have reduced availability of exercise modalities and intensities, which can limit the optimization of the health and functional benefits received from exercising [
1].
While running and cycling are two commonly used, convenient, and easy-to-perform exercise modalities, populations that experience lower-extremity pain typically prefer cycling. This is often the case in individuals with osteoarthritis. For example, Golightly et al. [
4] have reported good adherence and tolerability in a feasibility study of an exercise program in individuals with knee osteoarthritis when individuals were allowed to self-select the exercise modality. In this study, only 3 out of 24 participants (14%) chose treadmill running to cycling. This indicates a clear preference towards cycling when running is the alternative in individuals with osteoarthritis. This may be related to the weight bearing component associated with running that will result in increased lower joint loadings and subsequent increase in pain [
5,
6]. However, interventions using cycling as the exercise mode, despite allowing for individuals with osteoarthritis to exercise at high intensities, have reported a lack of effectiveness for improving physical function, daily activity, quality of life, and mobility in individuals with knee osteoarthritis [
7]. Biomechanical and neuromuscular characteristics of the stationary cycling movement have been suggested as possible explanations and include the following: (1) limited improvement of knee-joint stiffness due to limited knee range of motion (ROM) during cycling; (2) unobserved improvements in a number of components crucial for global motor function (e.g., neuromuscular control) from the lack of collaborative whole-body work; (3) restricted movement variability that limits the improvement of balance and coordination effectively due to the closed-chain nature of stationary cycling that elicits constraints on the movement produced in the lower limbs; and (4) reported difficulty in mounting/dismounting the stationary bicycle as a possible barrier for adherence to stationary cycling HIIT programs [
8,
9,
10,
11,
12].
Increased hip flexion angle gait (HFgait) is an exercise modality that has been shown to result in similar energy expenditures (<1 MET difference) to treadmill running for the same heart rate [
13]. In this exercise modality, individuals walk on a treadmill and increase intensity (metabolic cost) by increasing hip flexion while walking. HFgait also removes the flight phase of gait associated with running and reduces tibia peak positive accelerations (PPAs) at heel contact [
13,
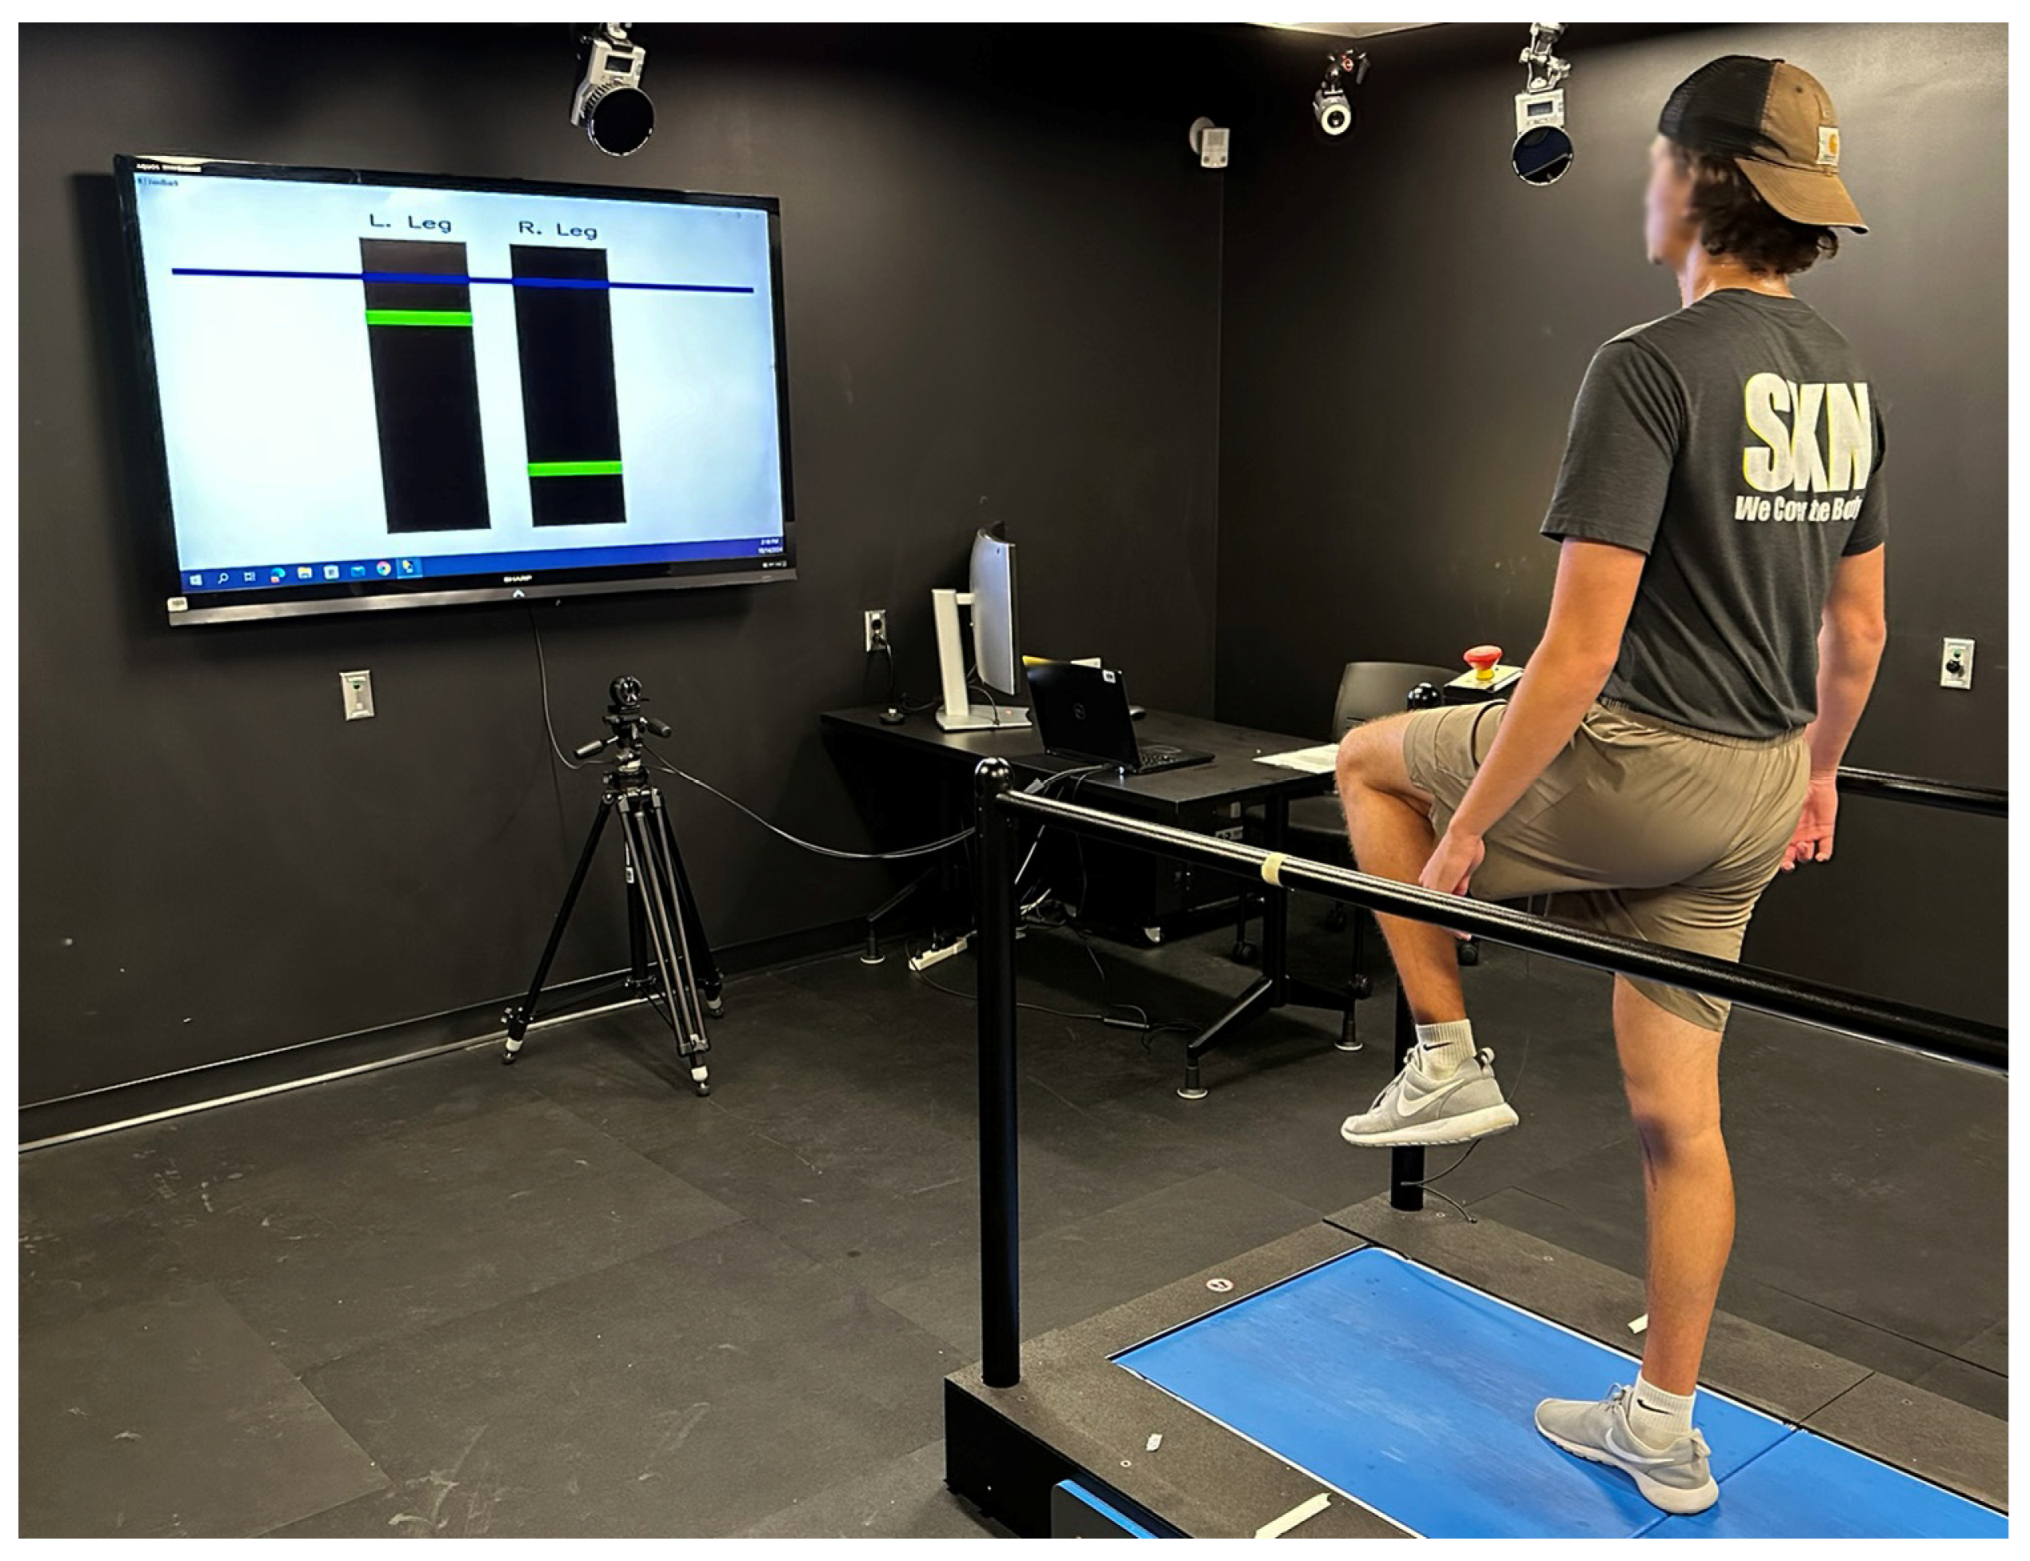
14]. The resulting activity is an open chain movement that involves the whole body (
Figure 1) and promotes coordination between the body segments involving many degrees of freedom. Therefore, HFgait might be a valid alternative to cycling for specific clinical populations that are limited to this exercise modality while providing a more complex movement than cycling and simultaneously reducing the joint loading component of running associated with knee pain. Although the metabolic cost of this activity has been investigated, the movement pattern associated with this exercise modality has yet to be investigated. Additionally, how this exercise modality compares kinematically to stationary cycling, the most commonly used exercise modality in populations with lower-extremity pain, is unknown. Understanding the kinematic differences between HFgait and cycling will provide an insight into possible injury mechanisms and highlight biomechanical characteristics of this modality that might be beneficial to specific populations. This may inform exercise prescription and support the adoption of HFgait as an alternative exercise modality.
The purpose of the current study is to compare the lower limb kinematic between HFgait and cycling. We hypothesized that lower limb kinematics during HFgait are different from cycling in ways that might be beneficial for clinical populations with lower limb injury. We investigated three-dimensional hip-, knee-, and ankle-joint angles during cycling and HFgait from a discrete and continuous perspective. Additionally, we investigated the kinematics of HFgait and cycling by implementing a phase offset optimization to remove the timing component of the differences between the two patterns.
2. Materials and Methods
Twelve healthy individuals (6M, 6F; age 29.3 ± 9.8 years; height 171.1 ± 0.1 cm; body mass 68.7 ± 13.3 kg) participated in this study. Inclusion criteria included the following: (1) being between 20 and 50 years of age, (2) being able to walk on a treadmill, and (3) being able to understand spoken English at the level needed to (a) understand and follow instructions for equipment setup, testing, and task performance, (b) answer questions related to effort and preference, and (c) be able to understand consent document. Exclusion criteria included the following: (1) significant health conditions that could limit the ability of the individual to exercise and (2) history of cardiovascular incident or other known risk factor for stroke or heart attack. This study was conducted in accordance with the Declaration of Helsinki and approved by the University Institutional Review Board. Participants were informed of the benefits and risks of the investigation before providing written consent.
Each participant performed one bout of one minute of cycling and one bout of one minute of HFgait on two different days to prevent the onset of fatigue. For cycling, resistance was set at 1.6 W/kg while cadence held at 80 rpm. For HFgait, the treadmill (AMTI Inc., Watertown, MA, USA) speed was set at 1.2 mph. The selected cycling resistance and treadmill speed corresponded to exercise intensities that represent typical intensities used in clinical populations at the introduction of an exercise program.
For cycling trials, participants were first fit on a stationary cycle ergometer. Saddle height was set such that the knee achieved 25–30° knee flexion, measured with a hand-held goniometer, when the pedal was placed at bottom dead center. The saddle fore/aft position was set such that the participant’s knee was aligned with the pedal spindle when the crank was in the horizontal forward position. This was verified by hanging a plumb-bob from the inferior pole of the patella and manually adjusting saddle position [
15]. Finally, the handlebar position of the ergometer was adjusted so the angle formed between the participant’s trunk at thigh was 90° when the crank was set at the 90° position [
15].
During HFgait, participants used a biofeedback system that uses markerless motion tracking for hip flexion angle calculation [
13,
14]. This system displays the real-time hip flexion angle and the target peak hip flexion angle while participants walk on the treadmill. This ensured that participants maintained a consistent peak hip flexion angle during the test. Previously reported error between the target hip flexion and the actual hip flexion is 8% which corresponds to approximately 6.9° [
14].
Before the test, participants performed a dynamic calibration trial where they were asked to walk on the treadmill at the selected speed while flexing their hips as much as possible. This trial set the target hip flexion to be used during the test. Participants were then fitted with retroreflective spherical markers. These markers were used to create a 7-segment lower-extremity biomechanical model of the pelvis, thighs, shanks, and feet [
16]. The pelvis was defined with reflective markers placed bilaterally on anatomic landmarks of interest, specifically the most superior aspect of the iliac crest and the greater trochanter of the femur. Pelvis motion was tracked during testing with a tracking ‘cluster’ of 4 markers secured to a semi-rigid thermoplastic shell attached to the posterior pelvis. Anatomic markers were then placed on the medial and lateral femoral epicondyles, medial and lateral malleoli, base of the 1st and 5th metatarsal heads, and on the shoe of the participant directly over the tip of the second toe. Tracking clusters were bilaterally affixed to each thigh, shank, and heel of the shoe. Following marker placement, a static standing calibration trial was recorded, and anatomic markers were removed. Identical marker sets were used for both HFgait and cycling trials; however, the cycling conditions included additional markers to define the crank arms and pedals.
During all exercise testing, three-dimensional marker trajectories were recorded using an 8-camera motion capture system (240 Hz, Qualisys, Göteborg, Sweden) for ten seconds. Participants performed all cycling conditions on a Monark cycle ergometer (828e, Monark, Vansbro, Sweden). Raw three-dimensional marker trajectories were exported into Visual 3D for analysis (Version 6, C-Motion, Inc., Germantown, MD, USA). Data were low-pass filtered using a recursive zero-lag fourth-order Butterworth filter with a cutoff frequency of 10 Hz [
17]. Angular computations were completed using a Cardan rotational sequence (X-Y-Z). Ankle dorsiflexion and inversion, knee extension and adduction, and hip flexion and adduction defined positive joint rotations. For HFgait trials, heel strike and toe-off of each step defined the stance and swing phases of gait and were determined using kinematic determinations of each event in Visual 3D [
18]. All stance phases for HFgait trials and all pedal cycles for cycling trials were averaged together for each participant, and were compared between conditions across an entire stride (stance and swing phases) and cycling trials were compared across an entire revolution of the pedal.
Maximum, minimum and range of motion joint angles were determined for each participant in Visual 3D by averaging the maximum, minimum, and range of motion joint angles across gait and pedal cycles recorded.
Average kinematic time-series curves were computed for each participant by calculating the average time-series across all gait and pedal cycles recorded. Each time-series was then time-normalized to 101 data points (0–100%). This allowed the comparison in the time domain between HFgait and cycling patterns of different lengths. Because both exercise modalities are cyclical movements, phase offset between both curves can maximize differences between the two patterns that are not meaningful from a kinematic perspective. Therefore, a phase offset reduction algorithm (POR) using cross correlations was used to identify the optimal phase shift (lag) of the cycling pattern that could result in the strongest correlation with HFgait. The offset reduction analysis was performed in MATLAB (2024a, MathWorks Inc., Natick, MA, USA) using the HFgait curve as the parent curve, and adjusting the cycling curve with the optimal phase shift. A continuous analysis of the time-normalized joint angle curves was performed with and without POR. Without POR, to spatially align the start of each phase between HFgait and cycling in a similar position (i.e., the foot oriented near the bottom of each cyclical motion), the pedal cycle was defined from bottom dead center to the next bottom dead center. HFgait cycles were defined from the heel strike to the next heel strike.
For the discrete analysis, paired sample t-tests were performed to identify differences between discrete variables. Cohen’s d was used to calculate effect sizes.
One-dimensional statistical parametric mapping (SPM-1D) paired sample t-tests were used to identify differences between cycling and HFgait for each joint motion during the cycle. SPM was used to compare HFgait to cycling with and without the POR in the cycling signal. We tested the null hypothesis that there are no differences in 1D biomechanical data between the different exercise modalities by statistically examining the entire times series using SPM. All SPM analyses were conducted in MATLAB using the open-source software package spm1D M.0.4.10 (
www.spm1d.org). A significance level of 0.05 was used for all statistical testing.
3. Results
Larger maximum (p = 0.029, d = 0.727), minimum (p < 0.001, d = 3.51), and ROM (p < 0.001, d = 3.57) were observed for HFgait compared to cycling in the hip sagittal plane. For the hip frontal plane, larger maximum (p < 0.001, d = 3.3) and ROM (p < 0.001, d = 1.42) were observed for HFgait compared to cycling; minimum hip frontal plane motion was larger for cycling compared to HFgait (p = 0.008, d = 0.93). Hip transverse plane ROM was larger for HFgait (p = 0.041, d = 0.67).
Larger minimum (p < 0.001, d = 2.77) and ROM (p < 0.001, d = 1.91) were observed for HFgait compared to cycling in the knee sagittal plane. For the knee frontal plane, larger maximum (p = 0.007, d = 0.96), minimum (p = 0.008, d = 0.93) and ROM (p < 0.001, d = 1.50) were observed for HFgait compared to cycling. Knee transverse plane minimum (p = 0.004, d = 1.1) and ROM (p = 0.003, d = 1.1) were larger for HFgait.
Larger maximum (
p = 0.013, d = 0.86) and ROM (
p = 0.012, d = 0.86) were observed for HFgait compared to cycling in the ankle sagittal plane. For the ankle frontal plane, larger maximum (
p < 0.001, d = 1.7), minimum (
p = 0.018, d = 0.80) and ROM (
p < 0.001, d = 2.1) were observed for HFgait compared to cycling. Knee transverse plane maximum (
p = 0.040, d = 0.67), minimum (
p = 0.039, d = 0.67) and ROM (
p < 0.001, d = 1.5) were larger for HFgait (
Table 1).
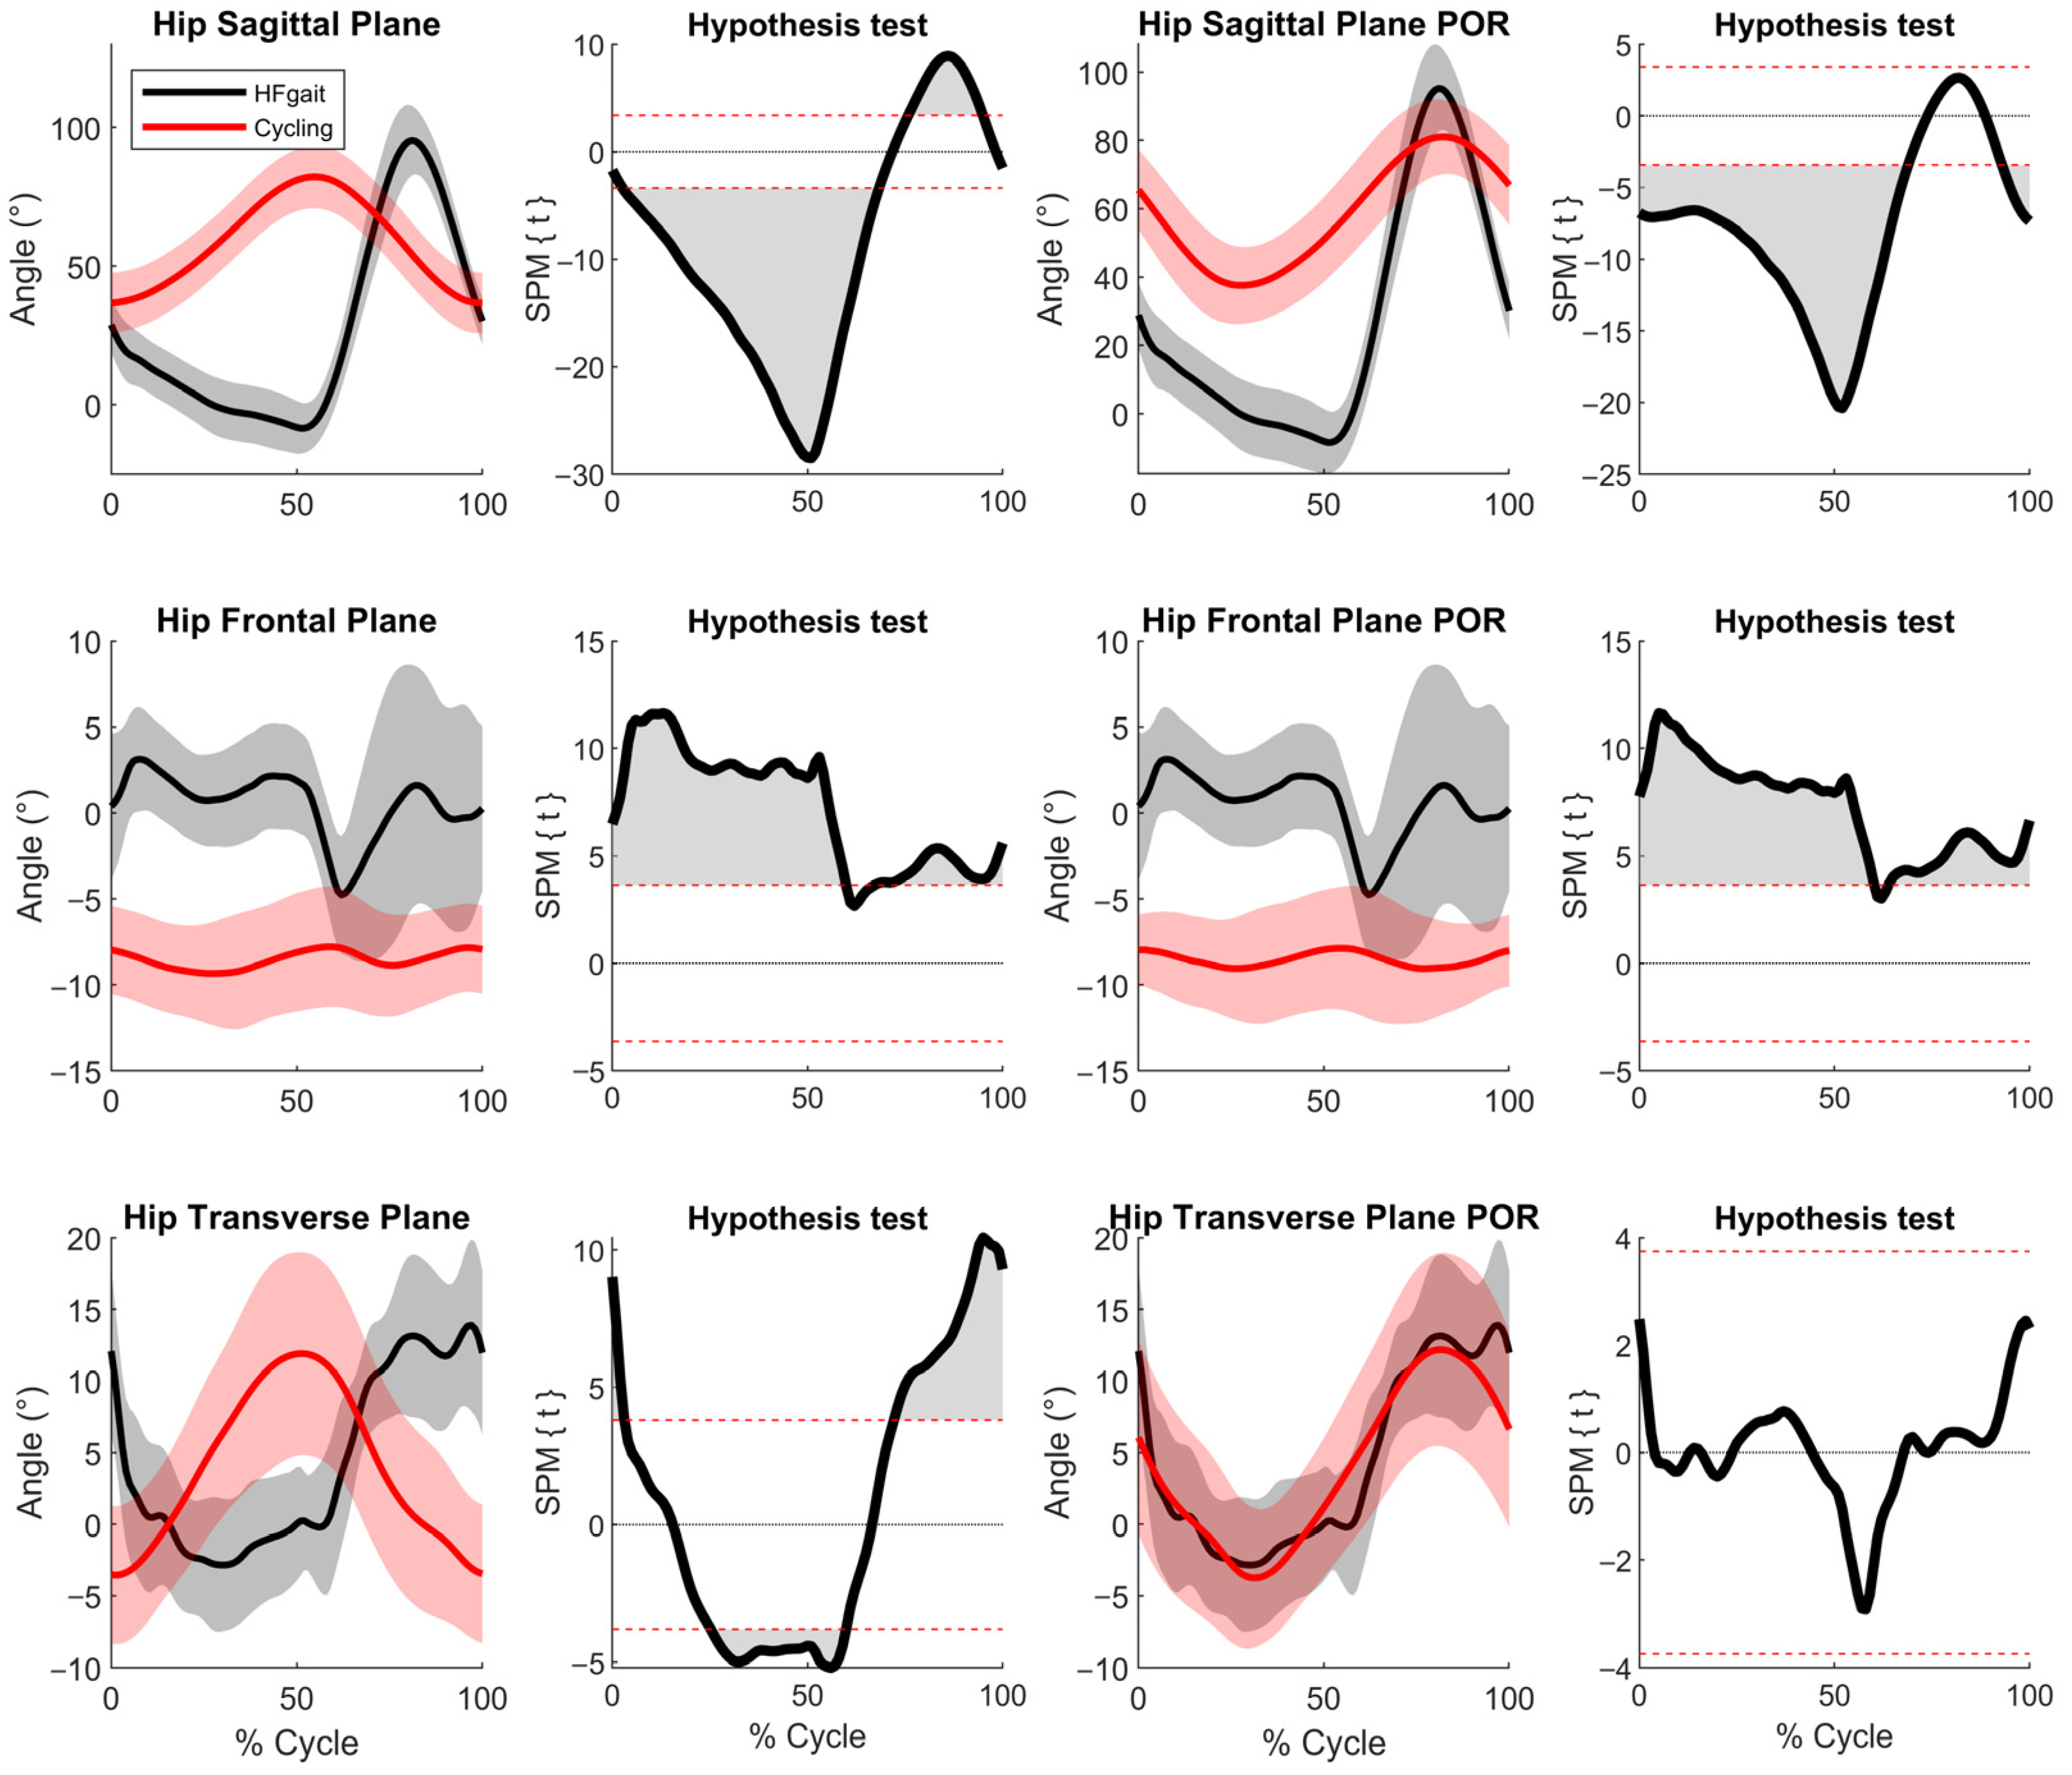
Differences were detected between HFgait and cycling for both the original and POR waveforms for all joints. For the hip, differences were observed in the sagittal plane (original: 85%; with POR: 77%), frontal plane (original: 93%; with POR: 98%), and transverse plane (original: 66%; with POR: 0%) (
Figure 2). For the knee, differences were observed in the sagittal plane (original: 93%; with POR: 76%), frontal plane (original: 41%; with POR: 12%), and transverse plane (original: 14%; with POR: 0%) (
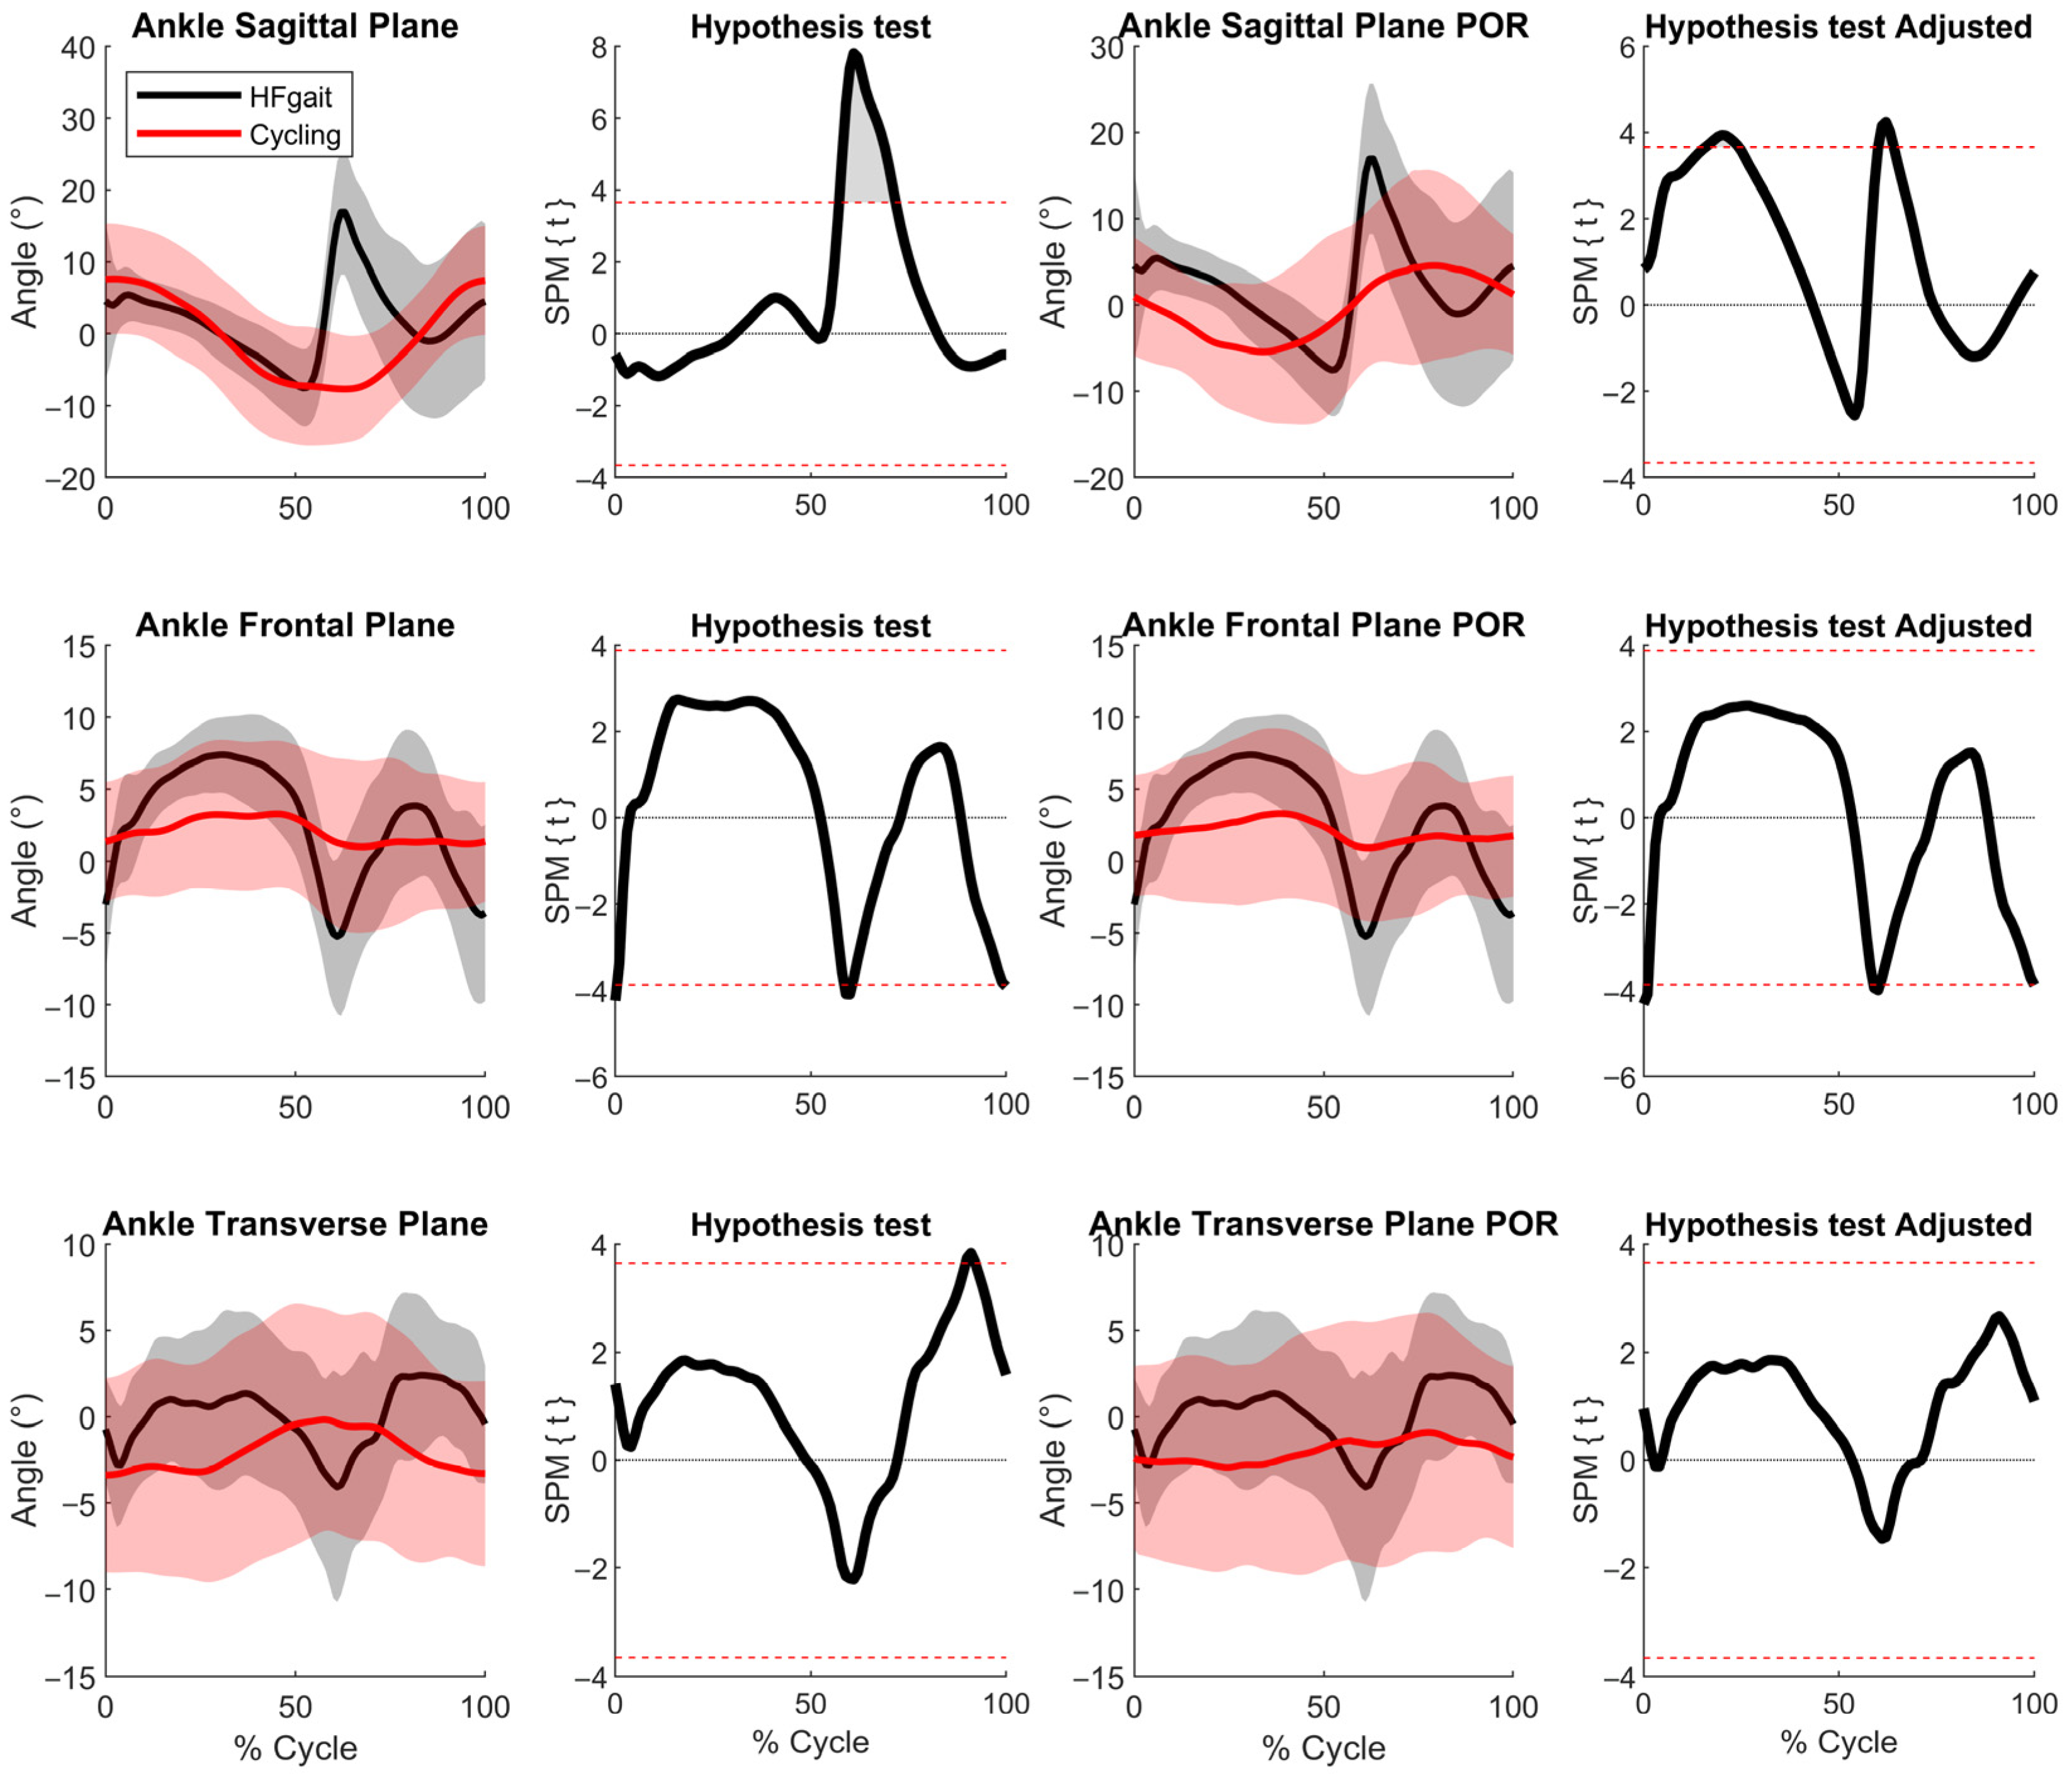
Figure 3). For the ankle, differences were observed in the sagittal plane (original: 14%; with POR: 14%), frontal plane (original: 4%; with POR: 5%), and transverse plane (original: 3%; with POR: 0%) (
Figure 4).
4. Discussion
The current study compares cycling, the most-used exercise modality among individuals with lower-extremity pain, with HFgait, an alternative novel exercise modality. Thus, this study is also the first to describe HFgait lower limb kinematics. Moreover, given that current study hypothesized differences in kinematic patterns between the two modalities, a phase offset reduction technique was applied to improve the contrast between the two cyclical movements.
The main differences between the two exercise modalities were found at the hip. Compared to cycling, HFgait has reduced hip flexion during the cycle except during the peak hip flexion, which corresponds to the period from 70 to 90% of the HFgait cycle. During HFgait, the hip has a larger sagittal plane range of motion, ranging from about 10° of extension to 95° of flexion, whereas cycling maintains an orientation of hip flexion throughout and promotes a muted range of motion of about 36° to 82° of flexion. The range of hip-joint excursion during HFgait was different from that during cycling; suggesting that HFgait has effects that cannot be achieved by cycling. Particularly, reductions in peak hip extension angle have been strongly associated with increased severity of disability in patients with hip and knee osteoarthritis [
19]. Therefore, kinematically, HFgait might be recommended for rehabilitation outcomes that benefits from a large hip range of motion [
20,
21]. Additionally, because the hip reaches extension during HFgait, which does not occur during cycling, and maintains a less flexed position for a longer duration of the HFgait cycle than during cycling, HFgait might be a valid alternative to individuals with lower back pain [
22], or vascular pathologies that might be aggravated with cycling [
23]. HFgait also involved a larger hip range of motion in the frontal plane, maintaining a less abducted hip angle compared to cycling, such that the frontal plane hip-joint angle was oriented closer to a neutral position during most of the gait cycle. This further supports the use of HFgait for interventions that target hip mobility with an exercise component, such as the clinical practice guidelines for the management of hip osteoarthritis [
24,
25,
26].
Differences in knee kinematics between HFgait and cycling were observed essentially only in the sagittal plane. Similarly to the hip, cycling maintains the knee in a more flexed position than HFgait during the cycle, while HFgait transitions from very little flexion (less than 20°) during the first half of the cycle to a large peak flexion (approximately 120°) at about 80% of the cycle. The most common overuse injury in cycling is observed at the patellofemoral joint [
23,
27]. This is attributed to the force generated at this joint at the beginning of the downstroke. At this point, the quadriceps femoris muscle group develops a large force at the patellofemoral joint surface that is made even greater by the amount of knee flexion during this phase (peak knee flexion of approximately 110°) [
28]. This pattern is not observed during HFgait. Although peak knee flexion during HFgait is similar to cycling, in HFgait, this phase takes place during the swing phase when no external forces are being applied at the knee joint. Bike configuration and saddle height have been shown to alter lower limb kinematics during cycling and limit overuse knee injuries [
29]. However, this will most likely involve bike fitting protocols with bike professionals that are not accessible to most individuals that wish to use cycling as an exercise modality.
Our discrete analysis reported differences between HFgait and cycling for the ankle joint at all discrete parameters except minimum sagittal place. However, while our continuous analysis also identified some differences for ankle joint motion, these were short in terms of duration during the cycles. Ankle sagittal plane differences occurred during 14% of the cycle, and ankle frontal and transverse plane differences were observed during 4% and 3% of the cycles, respectively. Moreover, the continuous analysis using POR, further reduced these differences by decreasing the magnitude of statistical significance at the sagittal plane motion and eliminating differences between HFgait and cycling in the transverse plane. These findings suggest that differences in ankle motion between HFgait and cycling are minimal and might not represent impactful differences for exercise prescription. Additionally, this further highlights the importance of continuous analysis (SPM) and POR when comparing kinematic patterns from different activities. In this study, this type of analysis provided a more accurate and meaningful interpretation of the potential differences in ankle joint motion between HFgait and cycling.
Restricted join ROM appears to be an important risk factor for the occurrence of locomotor disability in patients with osteoarthritis. Manual therapy and therapeutic exercises are recommended for the treatment of lower limb impairments that involve limited range of motion. Both approaches use specific exercises that target specific limitations in functional range of motion of the knee or hip because such maximum or minimum joint angles might be difficult to achieve during daily life activities and commonly used exercise modalities. HFgait might be a valid option to maximize hip and knee range of motion while receiving cardiovascular benefits from aerobic exercise. Hip and knee sagittal plane range of motion during HFgait involves approximately 78% and 80% of the healthy anatomical sagittal plane range of motion for these joints, respectively [
30,
31,
32]. This is significantly more than other previously reported activities including cycling [
33].
There are several limitations with the current study. Firstly, while the purpose of the HFgait modality is to be used by populations with or at risk of lower limb injury, the current study recruited healthy individuals. However, although this might be a limitation in the application of the findings since participants with lower limb impairments might not be able to perform the kinematic patterns described here, the current study describes the full kinematic potential of the HFgait exercise modality. This still can be used as a reference in the development of guidelines for exercise interventions and for preliminary studies in clinical populations. Another limitation of the current study is the lack of kinetic data that could highlight the differences between cycling and HFgait and provide further insights into possible injury mechanisms. This should be investigated in future studies. Finally, the current study investigated the kinematics of the HFgait at a comfortable speed for individuals that were just introduced to the movement. It is possible that as individuals become more familiar with the movement their kinematic patterns change or that they might be able to perform the movement at higher walking speeds. Therefore, changes in HFgait kinematics at different intensities and with different degrees of familiarity with this exercise modality should be investigated.
5. Conclusions
The current study introduces the lower-extremity kinematic patterns of a new exercise modality that might result in additional functional benefits in clinical populations with lower-extremity injuries compared with cycling. The HFgait involves larger hip and knee sagittal plane range of motion than cycling while maintaining the hip in a more neutral position in the frontal plane. Minimal differences in ankle motion were observed. These findings can inform the use of HFgait as an exercise option and serve as a guide for setting HFgait target kinematics during musculoskeletal rehabilitation for individuals with orthopedic disabilities.


