Review

Outage Rates and Failure Removal Times for Power Lines and Transformers

Department of Power Engineering, Lublin University of Technology, 20-618 Lublin, Poland
*
Author to whom correspondence should be addressed.
Appl. Sci. 2025, 15(14), 8030; https://doi.org/10.3390/app15148030
Submission received: 20 May 2025 / Revised: 14 July 2025 / Accepted: 17 July 2025 / Published: 18 July 2025
(This article belongs to the Section Electrical, Electronics and Communications Engineering)

Abstract

The dynamic development of distributed sources (mainly RES) contributes to the emergence of, among others, balance and overload problems. For this reason, many RES do not receive conditions for connection to the power grid in Poland. Operators sometimes extend permits based on the possibility of periodic power reduction in RES in the event of the problems mentioned above. Before making a decision, investors, for economic reasons, need information on the probability of annual power reduction in their potential installation. Analyses that allow one to determine such a probability require knowledge of the reliability indicators of transmission lines and transformers, as well as failure removal times. The article analyses the available literature on the annual risk of outages of these elements and methods to determine the appropriate reliability indicators. Example calculations were performed for two networks (test and real). The values of indicators and times that can be used in practice were indicated. The unique contribution of this article lies not only in the comprehensive comparison of current, relevant transmission line and transformer reliability analysis methods but also in developing the first reliability indices for the Polish power system in more than 30 years. It is based on the relationships presented in the article and their comparison with results reported in the international literature.

1. Introduction

The transmission network is the core of the power system, connecting electricity consumers to power plants. Due to its key position in the system, the transmission network must be an element that guarantees uninterrupted transmission of electricity to consumers. It should also be remembered that reliable production, transmission, and distribution of electricity to consumers is the primary task of the distribution system operator [1,2,3,4,5]. Therefore, with the increase in the number and capacity of installed generating installations, and due to the age of transmission lines and system transformers [6], appropriate maintenance scheduling plays an increasingly important role [7]. For this purpose, in [8], the authors used the strategy of preventive maintenance for line reliability by assigning priority to each of the analyzed objects based on indicators that define its importance in the system and its technical condition. A similar issue was addressed in [9,10,11]. Due to the continuous and unceasing development of power networks, the topics discussed in this publication may allow for further improvements in reliability for overhead transmission lines and system transformers. It should be noted that a large part of the articles related to the resilience of energy systems [12,13,14,15] and the decisions taken in connection with it [16,17,18,19] in the event of a sudden-onset disaster mainly focus on the phases planned before a disaster occurs or already in the post-disaster phase. This makes the work of [17] all the more valuable, where the authors present a concept that allows one to create a time window for decision-making, which can save a power system in the event of such an emergency.
There are various definitions of reliability in the literature [20,21,22,23,24]; however, the authors of this article define it as the ability of the elements to achieve the set goals without exceeding the required parameters. The available literature on reliability issues is quite extensive, but only a small part of it refers to transmission lines and transformers. Such work can certainly include [25,26,27,28,29]. This is because using increasingly accurate mathematical models to determine reliability requires collecting a large amount of data that is not publicly available, and operators of both distribution and transmission systems are reluctant to provide it.
The following coefficients are used to assess reliability:
  • AENS (Average Energy Not Supplied);
  • AIT (Average Interruption Time);
  • ENS (Energy Not Served).
In [30,31], the authors show that the main causes of unplanned overhead line failures are unfavorable meteorological factors such as gusty winds or lightning. The authors of these works analyze the Chinese power grids, and in 2011, these factors were responsible for more than 84% of all unplanned outages and failures. In the papers [32,33,34,35], the effect of wind conditions on the performance of the power system was studied. The work [32] presents a case study for a section of a 230 kV line, examining the behavior of the line under different wind conditions. Atmospheric factors that affect the reliability of the power system as a whole and its elements, such as transmission lines, are considered by the authors [36]. Also, in [37], reliability indicators are presented about weather conditions. To ensure the reliability of power grid operation, one of the methods used is a precise assessment of lightning risk, along with ongoing diagnostics of damage to network elements [38,39,40]. In the case of assessing lightning hazard in 110 kV distribution lines and 400 kV transmission lines, such an assessment is made based on the number of lightning strikes in the line or possibly on the number of outages of a given line during the year. More information on this subject can be found in [41].
It is also important to determine the time it takes to eliminate the failure and restore the system to its proper condition. The key aspect of failure removal time is the quick identification and localization of threats to avoid the risk of cascading failures [42]. Failure time can be defined as the time elapsed from the moment an incorrect operation of the system was detected until the irregularity is removed and the power supply is restored [43].
The articles presented in this literature review can be divided into several basic groups. The first group will consist of publications in which the authors present their formulas for determining the reliability of power line or transformer operations.
Examples of such studies are [44,45,46]. Chojnacki and his team [45] focused on analyzing the failure rate of 110 kV lines. Using empirical data, the authors carried out parametric verification and non-parametric verification of the failure duration, the duration of power outages, and the duration of emergency shutdowns. Based on the obtained data and according to the research conducted by the authors, the average line renewal time at this voltage level is 26.1 h, the average time of emergency outages is 14.1 h, and the average power outage time at the recipients is 4.58 h. It should be emphasized, however, that the results obtained by the authors pertain only to a limited area of Poland, and outage times could vary substantially when considering transmission lines across the entire country. In [47], Miroslav Mesić and Tomislav Plasić focused on determining the failure rate of 110 kV, 220 kV, and 400 kV lines operating in the Croatian power system. The issue of the reliability of 110 kV, 220 kV, and 400 kV lines in Croatia is also discussed in [48], where the authors, based on data from 1995 to 2006, present the impact of regular network maintenance on the reliability of transmission lines. Reliability indicators for transmission lines in the Sub-Saharan African networks are discussed in [49]. The authors determined the SAIFI and SAIDI coefficients based on data from 2004 to 2014. Original methods for determining the reliability coefficient and calculating the unreliability of transmission lines can also be found in [50,51], where the authors used fuzzy systems to assess reliability indicators. The literature also includes the use of various types of metaheuristic optimization methods [52,53,54]. For example, in [54], the authors use Particle Swarm Optimization for this purpose, and in [55], a Genetic Algorithm is used. Some works, such as [56], try to determine the relationship between the general condition of overhead lines (index x) and their failure rate. The authors used the following formula:
λ ( x ) = A x B x x + C
where A, B, and C are constants determined by taking into account historical failure data.
In next group of works, the authors used probability distributions to determine the dependencies for the time of failure removal and to examine the reliability of transmission lines. Examples of such works are [57,58,59]. In [57], Wang and his team propose a method for calculating the failure rate for 220 kV transmission lines. They focus on taking into account such factors as weather conditions at the time of the recorded failure or in the month of the failure. Singh and Liu [58] use the Markov set method to assess the reliability of complex power systems. Also, in [60,61], the authors focus on performing a distribution that takes into account the reliability of transmission lines to plan the optimal maintenance schedule. The Markov method for assessing the reliability of a transmission line is also used in [62,63], where the authors assume that each transmission line operates in a two-state variable weather environment. Moreover, the reliability of transmission lines in a hurricane occurrence in the United States is assessed using the full Markov method. In [64,65] the Weibull distribution or its variations are used to determine the reliability coefficient of power system elements.
In the case of transformers, interruptions in their operation can be planned or forced. Forced interruptions are mainly due to automatic switching operations performed by protection systems [66,67,68]. A transformer goes through several cycles in its life phase [67]. Subsequently, it goes through the phases of “infant mortality”, “useful life”, and “wear-out”. In each phase of the life cycle, there are different chances of failure. The reliability coefficient for transformers depending on age is presented by Tenbohlen and his team [69]. The results obtained by the authors show that the risk of damage to the transformer, which would exclude it from further use in the first 20 years of its service life, is very small but increases with age. Also in [70], the authors focus on examining the reliability index of the transformer in relation to its age. In [71], the author analyses the reliability aspects of 220/110 kV transformers in Egypt. In his work, he focuses on examining factors such as the annual number of failures, the average annual interruption, and the average annual repair time. The author obtained data from the Egyptian transmission operator from 2002 to 2009, so his research is based on specific real data. It is estimated that the average service life of transformers is between 25 and 30 years [72], while according to [73], it is reasonable to extend their service life to 40–50 years. The final service life of a transformer is greatly influenced by the way it is used, the damage it has sustained, and the care taken during maintenance. For example, block transformers operating in large power plants are loaded for a significant part of their service life between 90% and 100% of their rated power, which makes the care taken in maintenance particularly important. In [74], the authors focus on analyzing the reliability of transformers used in South Africa. Peterson, in collaboration with Austin [75], analyzes the reliability of transformers in Australia and New Zealand. Also in [76], the authors once again rated the reliability indices of transformers located in Australia and New Zealand.
In [77] the team led by Minhas focuses on the reliability of high-power transformers located in Egypt. By reading [78] the reader has the opportunity to learn about the reliability of transformers located on the Greek island of Crete.
The issue of transformer reliability is also discussed in [79,80,81]. For example, in [80], Chafai and his team provide a reliability analysis of individual transformer components that are most frequently damaged. Also, in work [79], the authors address the issue of high-power transformer reliability.
An interesting supplement to the reliability of transmission lines and transformers may be found in [82,83], where the authors focus on presenting the effect of short-circuit and overload currents on the reliability of power system components.
In [84] Zhao focuses on the reliability of switching operations of transmission lines. The article proposes a reliability assessment method based on the normal distribution. The authors test their method on a closed 118-node IEEE test network. Singh and Mitra [85] present an original method in their paper for calculating reliability indices for an extended transmission system. For this purpose, they use Monte Carlo simulations as well as check the effectiveness of their method on the IEEE test system. In [86,87,88,89], the authors focus on the reliability parameters of transformer distribution stations. A more detailed discussion of the formulas and relationships used in the above articles is presented in the next chapter.
The authors of the present paper conducted an analysis of the unreliability of 110 kV lines over a 9-year period based on the obtained data. The damage rate per 100 km of the 110 kV overhead line was, respectively, 0.67, 0.52, 0.53, 0.28, 0.42, 0.28, 0.43, 0.87, and 0.49 in each of the nine years, which gives an average result of 0.69 damage per 100 km. However, it should be remembered that the data obtained by the authors constitutes only a small part of the power system. Examples of the use of various maintenance and reliability techniques in the power system can also be found in the works of [90,91,92,93,94,95].
Despite the growing interest in the reliability of power systems with high RES saturation, there is a lack of up-to-date analyses in the literature on the actual reliability coefficients for such systems. The innovation of the present paper, apart from a comprehensive literature review on the reliability of transmission lines and system transformers, is the determination by the authors of the reliability coefficients of 110 kV, 220 kV, and 400 kV lines as well as system transformers for the Polish power system. The authors also determined fault-clearing times and made comparisons with indicators from other countries with high system saturation with renewable sources. The available data indicates that such coefficients for the transmission system have not been determined for Poland for more than 30 years, which makes the results presented in this paper a uniquely valid contribution to the national technical literature.
The article consists of six points. The first point contains an introduction and a literature review. In the second point, the authors focus on the methods for determining the outage rate of high-voltage transmission lines and power transformers. The third point contains methods for determining the time needed for repairing line and transformer failures. In the fourth point, calculations are made to determine the analyzed indicators based on the obtained data. The fifth point provides calculations of the reliability factor for transmission lines and system transformers, using the example of the IEEE 118 test network and the actual network. The sixth point contains conclusions and a summary.

2. Methods for Determining the Number of Power Line and Transformer Outages

The methods for determining the number of outages depend mostly on the month of failure (most of them occur in the winter months due to unfavorable weather conditions), as well as on the age of transmission lines and transformers.

2.1. Factors Influencing the Number of Branch Outages

In [96] the author presents the structure of factors influencing the occurrence of failures and, consequently, their impact on the reliability of 110 kV lines. The data presented by the author are reliable because they come from research based on over a thousand failures of 110 kV overhead lines that occurred in central Poland.
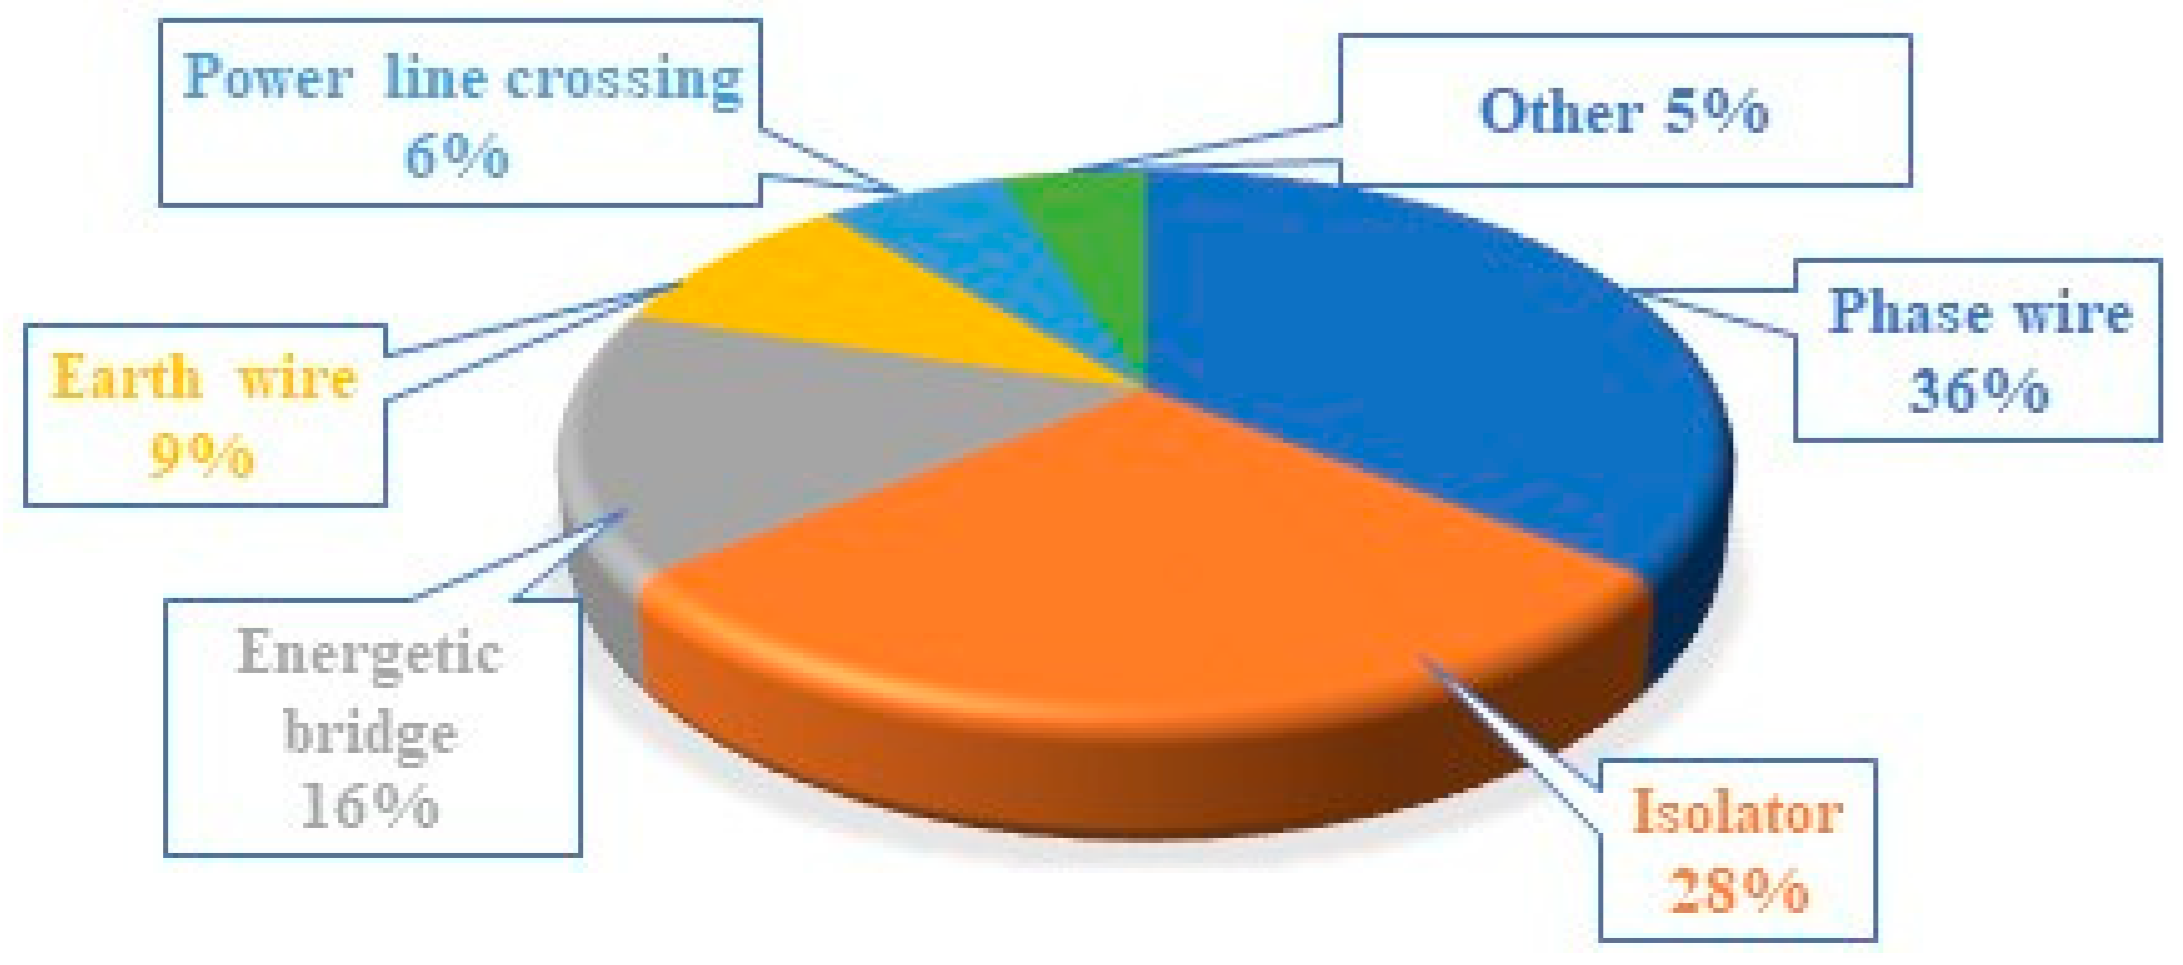
As can be seen from the conducted research, almost 20% of failures are caused by wind, 15.7% by icing and snow, and 14.8% each by disruptions caused by atmospheric discharges or tree branches falling on the lines. Factors not identified by the author are responsible for only 5.83% of all failures. In his next work [97], the author presents research showing that the largest number of 110 kV line failures were observed in the winter months (January and December), as well as in the summer-autumn months (from July to October). The results of these studies are consistent with the data presented in Figure 1 regarding the percentage of factors influencing power line failures. It can be observed that adverse weather conditions were the predominant cause of 110 kV line failures. Aging phenomena were responsible for 11% of failures. Another factor that may affect the failure rate of lines is their irregular maintenance. By contrast, a factor influencing the failure rate in high-voltage substations may be their complexity, which significantly increases the probability of failure. Figure 2 presents a percentage of the most common failures of 110 kV lines. The great majority of failures occurred in the phase wire or isolator.

2.2. Factors Influencing the Transformer Outage Rate

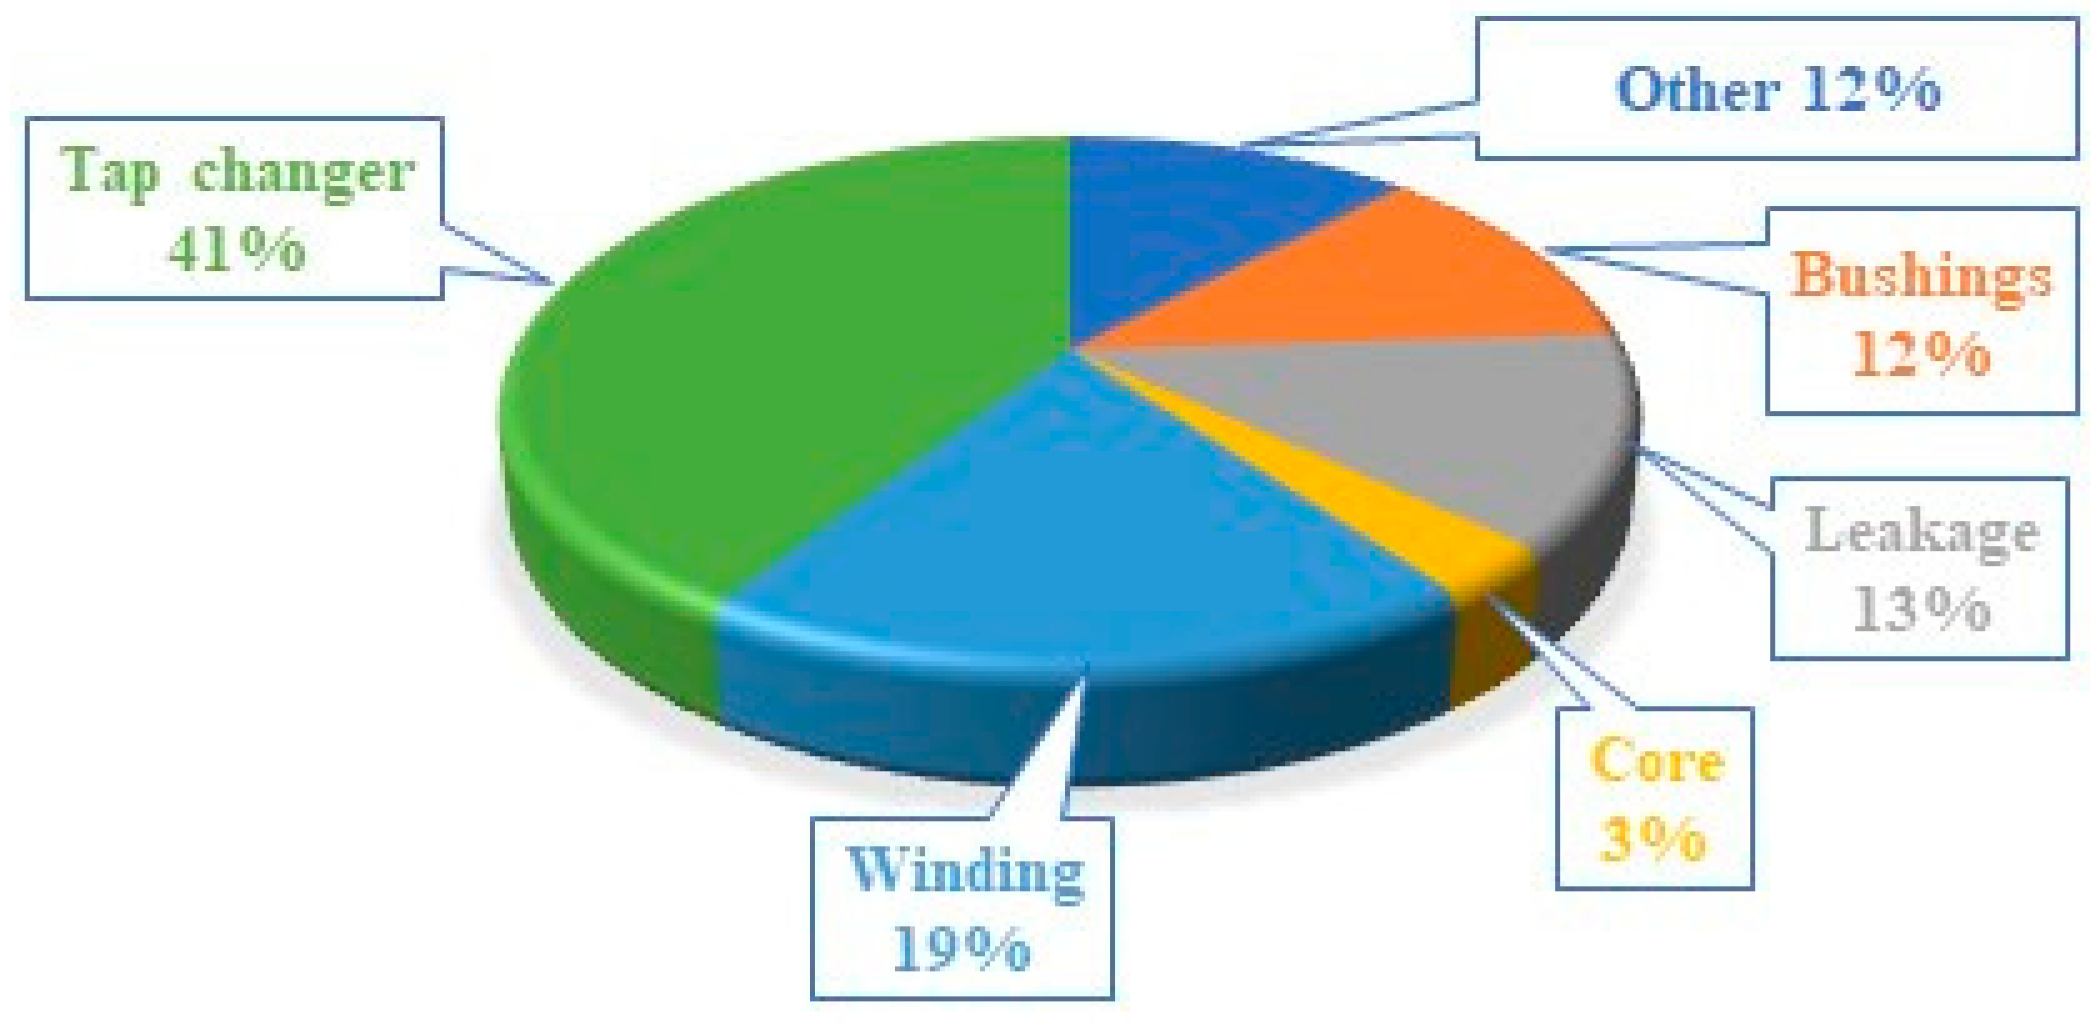
Transformers are a group of devices whose repair and renewal process most often takes place at the transformer’s place of operation. Only when significant damage or wear occurs does a complete replacement become necessary. According to [43,98], the most common causes of failure include damage to the tap changer or damage to the Buchholz relay. A graphical summary of factors influencing the occurrence of transformer failures is presented in Figure 3, while the percentage summary of the failure frequency in transformers is presented in Figure 4. Regarding the factors causing failures, as much as 51% were aging processes, and 18% were caused by lightning. Bosie published the first major study on failures and reliability factors for power transformers in 1983 [68]. The research conducted by him and his team shows that the average failure rate for transformers is 2%, regardless of the voltage category. The authors of [99] disagree with this statement. According to the results obtained by them, the failure rate due to aging in the case of smaller power transformers (up to 100 MVA) is less than 6% for transformers up to 25 years old, while it is less than 10% for those above 25 years. In the case of larger power transformers (above 100 MVA), the failure rate is insignificant (below 1%) in the first 10 years, while with age, the failure rate increases to almost 18%. It should be noted, however, that the studies conducted by Minhas, Reynders, and Klerk were conducted on a much smaller number of transformers.

2.3. Methods Used in the Literature to Determine the Number of Outages of Transmission Lines and Transformers

The number of outages (failure rate) can be defined as the number of random events (failures) that prevent the execution of a task, divided by the operating time of the device. To determine the reliability properties of individual network elements, it is crucial to determine their parameters and functions. Determining the reliability function R ( t ) , unreliability function F ( t ) , failure probability function f(t), as well as failure intensity functions λ ¯ and the expected uptime function r(t) is essential for comprehensive reliability analysis [43,59].
One defines the reliability function through the following relationship:
R ( t ) = n ( t ) N
where n ( t ) is the number of elements that have not failed in the time interval ( 0 , t > ) and N is the number of elements that are included in the system.
Researchers define the unreliability function through the following relationship:
F ( t ) = m ( t ) N
where m ( t ) is the number of elements that have failed in the time interval ( 0 , t > ) , and N is the number of elements that are included in the system.
Researchers define the failure intensity function through the following relationship:
λ ¯ = 2 m ( n p + n k ) Δ t
where m is the observed number of failures in the time interval Δ t , n p is the number of elements at the beginning of the observation period, n k is the number of elements at the end of the observation period, and Δ t is the total time of the observation.
In [57], the authors proposed using historical data to calculate the failure rate of a transmission line:
λ k ( x ) = y n k y x Y T x L k × 100   x = 1 , 2 , . , 12
where λ k ( x ) is the line failure rate in a specific historical month, n k y x is the line failure rate in a given historical month, T x is the month, Y is the total number of years taken into account in the calculations, and L k is the line length expressed in kilometers.
A similar relationship can also be used to calculate the failure rate for transmission lines with the same voltage level, as well as with similar meteorological conditions in historically corresponding months. This relationship will then appear as follows:
λ ( x ) = k ( λ k x × L k ) k L k
where λ ( x ) is the transmission line failure rate with the same voltage level in its historically corresponding month.
The failure rate of a transmission line can also be calculated using the failure distribution function. When a month is assumed as the time interval scale, the failure rate can be determined by the relationship:
λ ( x ) = λ a v e × f ( x ) = λ a v e × 12 × f ( x )
where λ ( x ) is the line failure rate in a specific historical month, λave is the average failure rate over several statistical years, while λ′ave is the average monthly failure rate, f(x) is the normalized time distribution function of the failure rate in the corresponding historical month x.
Transmission line reliability can also be determined using the Markov distribution [57,104]:
P D o w n = λ ( x ) λ ( x ) + μ
where λ ( x ) is the failure rate in month x, and µ is the repair rate.
The authors of [56] determine the reliability coefficient of transmission lines using the following relationship:
λ = i = 1 n g f i i = 1 n g L i
where L i is the length of the line, and f i is the number of failures of the tested line during the year.
An interesting approach was proposed by the authors of [43,45,100], where they attempted to determine the empirical form of the variability of the frequency of failures of 110 kV lines using a fourth-order polynomial. For this purpose, the authors used the following relationship:
f ( i ) = a i 4 + b i 3 + c i 2 + d i + e
where i is the consecutive number of the month, while a, b, c, d, e are the coefficients of the approximating function. In the article, their values were determined based on historical data. The values of these coefficients are a = 0.0210, b = −0.6306, c = 6.5081, d = −25.9092, and e = 37.9207.
In addition, the author also proposed a logarithmic-normal distribution for the time of emergency power line outages. This distribution has the following form:
f ( t wa ) = log e t wa σ 2 π exp log t wa m 2 2 σ 2
where m is the expected value of the random variable log t wa , and σ denotes the standard deviation of the random variable log t wa . The determined values of these parameters are m = 2.1244 and σ = 1.0947. Based on the conducted analyses, the authors also determined the hypothetical distribution of undelivered electricity as a result of power line outages. This distribution is exponential. To verify the hypothesis concerning the distribution types, the Kolmogorov λ test and Pearson’s chi-squared test were employed χ 2 .
In [105] the authors use the following relationship to determine the failure rate of the transmission line in Nigeria:
λ = i = 1 n F o i i = 1 n T O H i T D T i
where Foi is the number of recorded failures, TDT is the total interruption, and TOH is the time of correct operation.
In [11] the authors use the Weibull distribution to estimate the failure rate of 110 kV lines depending on the prevailing weather conditions:
λ ( t ) = λ I , 0 V ( t ) < T U λ C , T U V ( t ) < T w , V ( t ) T w
where
λ I = α I e β I V ( t )
λ C = a C + a C e ( V ( t ) ω ) a C
where α is the failure rate scale parameter, and β is the failure rate power parameter.
To determine the failure rate of surface lines, the Poisson ratio and the method based on the Bayesian method can also be used. This possibility was used in articles [106,107] where the probability distribution was used according to the relationship:
P ( k , λ ) = e λ λ k k !
where λ is the number of predicted failures in a given period, and k is the number of random event occurrences.
The second method is based on the Bayesian method and is as follows:
P = P ( X 1 , X 2 , , X n ) = i = 1 n P X i | p a X i
where X i is a random variable, and p a X i denotes the parent nodes for X i .
Also, in the article [108], the Poisson distribution was used to determine the line failure rate:
P ( X = k ) = e θ θ k / k !   k = 0 , 1 ,
If the average line length in a given weather area is known, it is possible to use the following relationship to determine the line interruption:
λ ¯ = L ¯ e B W = 1 n i = 1 n X i = θ ^
Then it is possible to determine the line failure rate from the following relationship:
P = 1 e λ ¯
If the line passes through several weather areas, then the probability of no failure is determined by the relationship “ 1 P W A q ”, which means the probability of no failure for each weather area. Then the total probability of failure for the transmission line is determined from the following relationship:
1 P = ( 1 P W A 1 ) ( 1 P W A 2 ) ( 1 P W A q )
Bossi and his team [68] propose the following to calculate the transformer failure rate:
λ = 100 × i n i i N i %
where ni is the number of transformers that failed during the year, and Ni is the total number of transformers that were in the system in a given year. The same relationship was used, among others, in [109], where Tenbohlen checked the reliability indicators of almost 700 transformers of different power.
In [69], to calculate the failure rate, the authors propose the following relationship:
λ = n 1 + n 2 + + n i ( N 1 + N 2 + + N i ) T 100 %
where n i is the number of failures that occur in the year covered by the calculations, N i is the number of all transformers operating in the year covered by the calculations, T is the reference period for calculating the factor (usually 1 year). The authors of this work also proposed an approach that makes the failure rate dependent on age. The following relationship was used for this purpose:
h ( t ) = 1 N ( t ) Δ n ( t ) Δ t
where Δ n ( t ) is the number of failures in the time specified for analysis, Δ t is the specified time interval adopted for analysis, N ( t ) is the number of components operating in the specified time that were not damaged. According to the authors of this article, it is also possible to calculate the total failure rate for transformers (e.g., from different energy companies). The authors then assumed that the number of transformers in operation is constant in the reference period:
λ = n 1 + n 2 + + n i N 1 T 1 + N 2 T 2 + + N i T i 100 %
where n i is the number of failures that occur in the year covered by the calculations, and N i is the number of all transformers in operation in the year covered by the calculations.
The authors of [110,111] use a very similar relationship to determine the reliability coefficient. They formulate it as follows:
λ = 1 i n i 1 i N i 100 %
where n i is the number of failures that occur in the year covered by the calculations, and N i is the number of all transformers in operation in the year covered by the calculations.
In [69,70] the authors use the following empirical formula to determine the reliability of transformers depending on their age:
h ( t ) 1 N ( t ) × Δ n ( t ) Δ t
where Δ t is the length of the time interval, Δ n ( t ) is the number of failures in a time interval, N ( t ) is the population surviving at time.
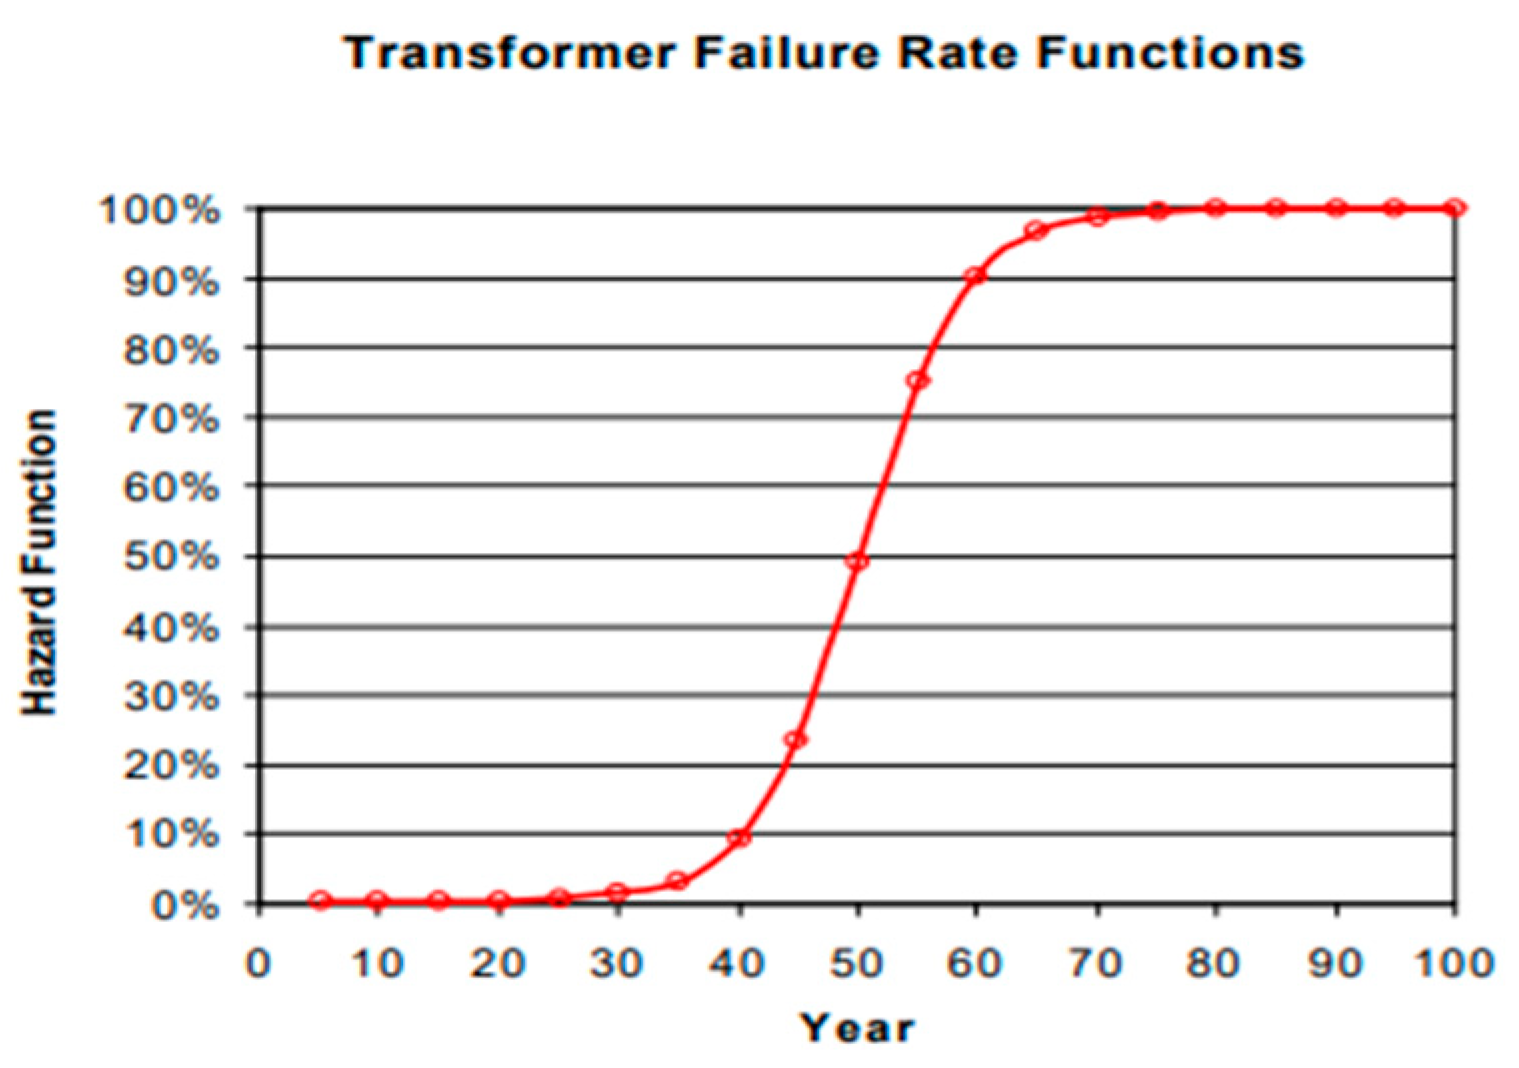
According to the graph (Figure 5) presented by William Bartley at a conference in Stockholm [112], the failure rate of transformers is very strongly dependent on their age. In the first 30 years of operation, the failure rate is low, reaching a few percent, and then increases significantly with the aging of the transformers. The author defined this relationship as follows:
N u m b e r   of   failures   =   [ Failure   rate ]   ×   [ population ]
The following relationship was used to determine the annual failure rates [113]:
A n n u a l   Failure   Rate = F a i l u r e s T o t a l   in   service   transformers × 100 %
where Failures is the number of recorded failures, and Total in service transformers is the number of actively working transformers at the time of failure.
Also in this case, the authors make the failure rate of the transformer dependent on its age, and the results obtained confirm those obtained by Bartley and his team. In the first few decades of operation, the failure rate does not exceed 8%, and then it starts to grow rapidly. Also, in [114], we can see a strong correlation of the failure rate with the age of the transformer. In the first 30 years of operation, this factor usually does not exceed the value of 0.1 (depending on the transformer power), but later on, it records a sudden increase in failure rate.
In [81] the authors use the Weibull distribution to determine the failure rate of transformers:
f ( t , x 1 , x 2 ) = δ λ ( x 1 , x 2 ) ( t λ ( x 1 , x 2 ) ) δ 1 e ( t λ ( x 1 , x 2 ) ) δ
where δ and λ are the parameters of the shape and the life characteristics.

3. Methods of Determining the Time of Failure Removal in Transmission Lines and Power System Transformers

The time of failure can be defined as the time that elapses from the moment of occurrence of incorrect operation of the element until the moment of elimination of the damage, with the simultaneous possibility of restoring the power supply and providing energy to the recipients [115]. In the case of transformers, this time can also be called the time of recovery. The determination of the time of recovery is related to the transition of the transformer from the state of damage to the time of renewed operational suitability [116].

3.1. Factors Influencing the Time of Failure Removal

The factors influencing the time of failure removal include primarily the type and extent of the failure, as well as the technical capabilities of the operating teams of the operators in whose area the damage occurred. Factors influencing the time of failure removal will also be the availability of spare parts and weather conditions in which maintenance work will have to be carried out.

3.2. Methods Used in the Literature for Determining the Time of Failure Removal in Transmission Lines and Transformers

An important factor that should be taken into account in the case of determining the time of failure removal is the determination of the diagnostic time [117]. Because, as a result of diagnostics, the damage to the object is identified, and only after a thorough diagnosis is it possible to start repairing the components. The total time of failure removal T a can therefore be divided into the time spent on diagnosis T d and the time spent on repairing damaged elements T n :
q = T a T = T d + T n T
In [71,118] the following relationship is used to determine the average annual repair time of transformers:
A A R T = T R T N × T
where AART is the average annual repair time of the transformer, TRT is the total repair time in the period under study, N is the average number of transformers accepted for testing, and T is the period from which the data was accepted for testing.
In [119,120] fuzzy logic is used to estimate the time of failure removal ( r E ), as well as to determine the outage rate ( λ E ) within a given timespan. The authors use a general relationship for this purpose, which allows them to determine these quantities:
λ E = λ N R + λ A 1 R r E = λ N R r N + λ A 1 R r A λ N R + λ A 1 R
where λ N , r N , λ A and r A denote, respectively, failure rates and failure removal times of the line in normal states (index N) and unfavorable weather conditions (index A). Individual failure rates λ and failure removal times r can then be calculated from the relationship:
λ = [ λ 1 , λ 2 ] = [ X 1 α / 2 2 ( 2 m ) / ( 2 T ) , X α / 2 2 ( 2 m + 2 ) / ( 2 T ) ] r = [ r 1 , r 2 ] = [ r avg z α / 2 s / n , r avg z α / 2 s / n ]
where m is the number of line outages in time T, r avg denotes the average time of failure removal (based on n historical data), α is a given significant level, z α / 2 is such a value that the integral of the standard normal density function from z α / 2 to ∞ equals α / 2 , and s is the standard deviation.
The total time to remove failures in transmission lines is always much shorter than a period of one year. Therefore, the interruption rates and the numerical frequency of the interruption are very similar to each other and are often used interchangeably in the reliability assessment. Therefore, according to [119], the total failure removal time can also be calculated from the relationship:
U E = λ E r E 8760
In [121] the authors propose a relationship that allows determining the line renewal time depending on weather conditions:
r ( t ) = w w ( t ) × w d ( d ) × w h ( t ) × r
where w w is the weather weighting factor dependent on the current conditions, w h is the hourly weighting factor established based on experience in repairs and switching, r is the renewal time in normal weather conditions, and w d is the weekly weighting factor established based on experience in repairs and switching.
In [122] the authors adopt a similar approach to determining the failure removal time in overhead lines, dependent on weather conditions:
r ( t ) = f w ( w ( t ) , N g ( t ) ) f d ( t ) f h ( t ) r n o r m
where f w ( w ( t ) , N g ( t ) ) are constants dependent on weather conditions, f h ( t ) is a constant dependent on hourly changes, f d ( t ) is a constant dependent on daily changes, and r n o r m is the reference renewal time in normal weather conditions.
In [50] the following relations are used to determine the failure recovery time coefficient:
r S L = λ f e r f e + λ e r e λ S L
where λ f e is the general forced interruption index in the system calculated from the relation
λ f e = i = 1 n λ f i
r f e is the expected interruption value for the system calculated from the relation
r f e = i = 1 n λ f i r i λ f e
λ S L is the annual interruption index calculated from the relation
λ S L = λ f e + λ e
λ e is the maintenance interruption index calculated from the relation
λ e = i = 1 n λ i
and r e is the expected value of maintenance interruption calculated from the relation
r e = i = 1 n λ i r i λ e
Table 1 summarizes the methods used to determine the failure rate and failure removal time.

4. Methods of Determining the Reliability Factor and the Time of Failure Removal of HV Lines and Transformers

The authors analyzed the relationships available in the literature and discussed about them in the previous sections of this article. In this section, the data obtained by the authors, concerning transmission lines, were used, while the data on the number of transformers operating in individual years were obtained based on the report of the Polish Society for Transmission and Distribution of Electricity, as well as data provided by the Polish Power Grids [130,131]. Due to the large number of transformers operating in the transmission network (several hundred units), as well as the low damage rate, statistically around 0.11 disturbance per 100 units, for illustrative purposes, the occurrence of 1 damage per year was assumed for the example calculations.
The transformer reliability function can then be defined using the relationship (2) presented, among others, in [59]:
R ( t ) = n ( t ) N = 212 213 = 0.99
The unreliability function can be defined using the following relationship:
F ( t ) = m ( t ) N = 1 213 = 0.0047
The authors determined the average failure intensity for a specific year, knowing the number of transformer failures that occurred in a given year, as well as the population size at the beginning and end of the period under study, using the relationship (4):
λ ¯ = 2 m ( n p + n k ) Δ t = 2 1 ( 213 + 213 ) 1 = 0.0047
In order to calculate the transmission line failure rate, the authors used, among others, the formula proposed by Wang et al. For this purpose, the authors assumed a month duration of 30 days and an average length of a 110 kV line of 11.3 km. The average annual number of failures, according to the obtained data, was 5 failures per year.
λ k ( x ) = y n k y x Y T x L k × 100 = 5 9 30 11.3 × 100 = 1.64
The average monthly failure rate of a 110 kV line based on the data obtained by the authors was 1.64 failures per 100 km.
If the lines are at the same voltage levels, the following relationship can be used:
λ ( x ) = k ( λ k x × L k ) k L k
The data needed to calculate this indicator are the average data for 110 kV lines obtained by the authors. Then, taking into account 5 lines with a voltage of 110 kV with lengths of 6 km, 10 km, 15 km, 20 km, and 25 km, the average annual reliability indicator of a section consisting of 5 lines is 1.13 failures per 100 km of line.
Based on Formula (1) and data presented in [56], the authors assumed an average failure rate of 0.92 in the case of variant 1 shown by Zhang et al., and 0.97 in the case of variant 2. The failure rate ranged from 0.5881 to 1.6431 in the case of the first variant and from 0.4271 to 1.7500 in the case of the second variant.
In the case of 220 kV lines in the German transmission network, the reliability factor is between 0.5 and 3.2 failures per 100 km. In the case of 400 kV lines, the factor was 2.1 failures per 100 km, while in the case of 110 kV lines it is 1.6 failures per 100 km [44].
In the case of 110 kV lines in the Austrian power system, the failure factor is 1.29 failures per 100 km of line. In the case of 220 kV lines, the failure factor is 0.53 failures per 100 km of line. In the case of the Japanese transmission network, the failure factor is between 0.52 and 1.64 failures per 100 km of line.
In the case of the UK power system, the authors of [123] present data from 3 different operators. The data they obtained demonstrate that lightning discharges and gusty winds exerted the greatest influence on the reliability of transmission lines. The reliability index of transmission lines ranged from 0.55 to 1.34 outages per 100 km of line, depending on the Operator.
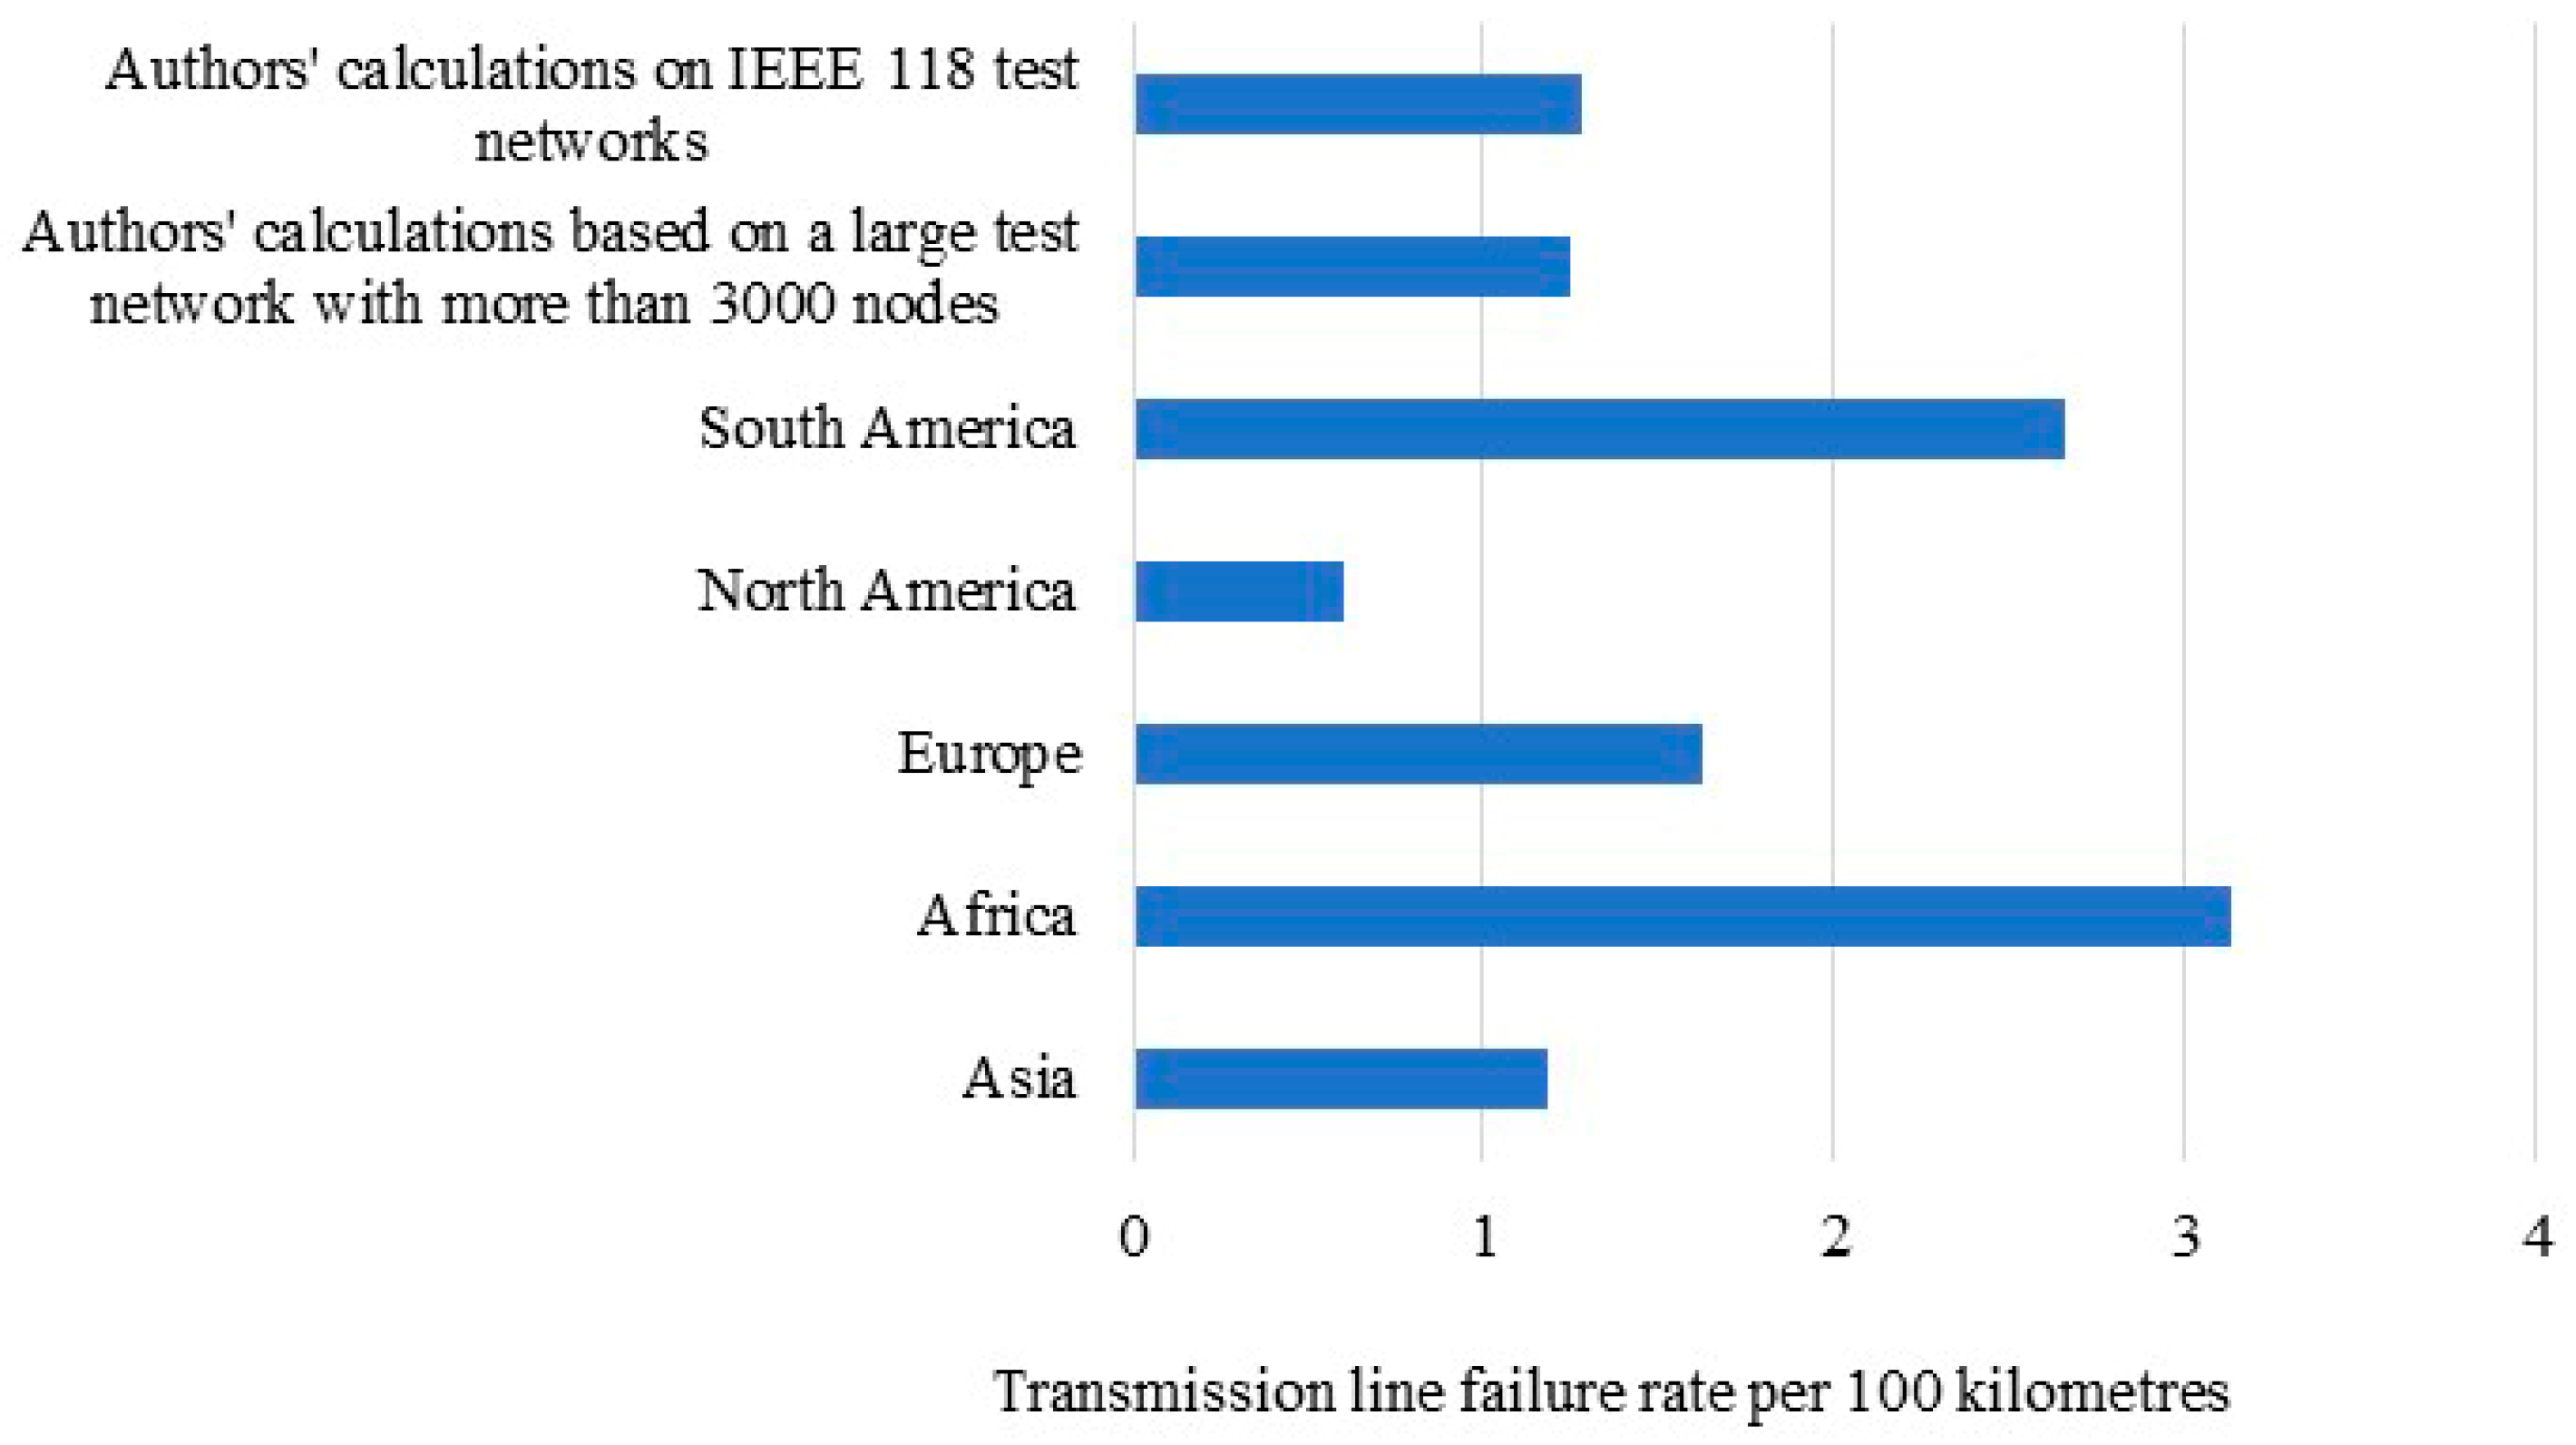
The authors also compared the coefficients on other continents. The average index for transmission lines without dividing into voltage levels in the United States should be assumed to be at the level of 0.6 outages per 100 km of line [128]. In the case of South America, the country where the information was obtained was Chile, and the reliability index for transmission lines without dividing into voltage levels is 2.66 outages per 100 km of line [129]. In the case of Africa, the Republic of South Africa was used as a reference point, where this coefficient is 3.13 outages [124].
Based on the data presented by the authors [125], the reliability coefficients were 0.59 trips per 100 km per year for 400 kV lines, 1.46 trips per 100 km per year for 220 kV lines, and 2.90 trips per 100 km per year for 110 kV lines, respectively. In the case of HV/HV transformers, the coefficient was statistically 0.12 trips per 100 transformers in operation over one year for 400/220 kV and 400/110 kV transformers and 0.11 trips per 100 transformers in operation in the case of 220/110 kV transformers.
To determine the reliability coefficient of transformers, the relationship proposed by Bossi et al. [22] was utilized. Then, after taking into account the data obtained by the authors for one calendar year and assuming the occurrence of one failure in one year, the following results were obtained:
λ = 100 % × i n i i N i = 100 × 1 213 = 0.46
The indicator obtained then is 0.46 damage per 100 transformers per year. It can therefore be assumed that damage to a single transformer will occur on average every 3 years.
In many works, it was also possible to find simple relationships for determining the number of transformer damages (28), as well as for determining the damage indicator per 100 working transformers (29):
N u m b e r   of   failures   =   [ Failure   rate ]   ×   [ population ] , N u m b e r   of   failures = 0 . 0047 × 213 = 1
A n n u a l   Failure   Rate = F a i l u r e s T o t a l   in   service   transformers × 100 % A n n u a l   Failure   Rate = 1 213 × 100 % = 0.47
The authors also propose to use the relationship (50) with the damage index calculated for 100 HV/HV transformer:
N u m b e r   of   failures   = [ Failure   rate ]   ×   [ population ] 100   , N u m b e r   of   failures   = [ 0.47 ] × [ 213 ] 100 = 1
In the case of system transformers located in North and South America, the outage rate is between 0.23 and 1.29 failures per 100 transformers according to the literature [113,126], then the outage rate for the Polish Power System, which has 213 system transformers, is between 1 and 3 transformer outages per year, which was calculated from the following relationship:
k = λ p = 0.23 2.13 = 0.49 k = λ p = 1.29 2.13 = 2.74
where k represents the number of shutdowns, λ is the outage rate per 100 transformers, and p is the total number of transformer groups counted in hundreds.
In the case of HV/HV transformers located in Germany, the reliability rate is 0.03 failures per 100 transformers per year [125]. In the case of 400/130 kV transformers located in Sweden, this rate was 0.38 failures per 100 transformers per year in 2021 [127].

Failure Removal Time

Based on the report of the Polish Energy Regulatory Authority and data available in the literature, it can be assumed that the average time to remove a failure of a transmission line in the Polish power grid is 14 h [16], while the average outage rate of 110 kV lines according to the same article is 1.7 outages per 100 km of line.
In the case of the Chinese power grid, according to the work [119], the average time to repair a line is 10.5 h. According to [8] the outage rate of transmission lines in the Iranian transmission system is 0.61 outages per 100 km, with an average repair time of less than 8 h. According to [44], the average time to repair a line in Europe is less than 15 h, which corresponds to the values presented for Poland, while the average time to repair transmission lines for Canada and the USA is around 8 h, which is almost 2 times less time needed to repair the damage than in Europe.
In [71] the authors obtained data for calculation purposes on transformers operating in the Egyptian Power System from 2002 to 2009. The number of transformers included in the calculations ranged from 223 transformers in 2002 to 292 transformers in 2009, which indicates that this network is similar in size to the Polish network, which has 213 system transformers. The results of the conducted studies show that the average time needed to repair a transformer without dividing into the type of damage was about 8 h in 2002, while in 2007, the average time needed to repair a single damage was 17 h, without dividing them into single damages. In the case of specifying the time needed to repair a specific damage, the most time was needed for Buchholz and pressure relief repair. In 2007, the repair time was 63 h, whereas the average repair time across all measured years was nearly 22 h. The smallest amount of time needed to repair a single failure was 50 min in 2007 to repair hot spots, while the average amount of time from all measurement years to repair this failure was 2 h.
However, data available in the literature [8] regarding the Iranian power system indicate an average of less than 44 h needed to repair a network transformer.
In [125] one can find detailed reliability calculations for the Polish power system in the 1990s. The authors obtained detailed data for the years 1995–1997. It can be seen that during these two years, there were 152 forced outages of 400 kV lines and 473 forced outages of 220 kV lines. In the case of network transformers, there were 85 forced outages and 709 planned outages. The authors also obtained information on the total duration of the network elements’ inability to operate properly. Thus, in the case of network transformers, the average duration of an emergency shutdown for 400/220 kV transformers was 12 h per single failure, 12 h for 400/110 kV transformers, and 9 h for 220/110 kV transformers. In the case of HV transmission lines, the average time needed to repair forced shutdowns of 400 kV lines was 15 h per single shutdown, while for 220 kV lines, it was 13 h. These calculations are based on actual data because the authors received data from the Polish Power System Operator.
Averaging all results, the average time needed to restore a transmission line in the Polish Power System can be assumed to be 14 h, while the time needed to repair an HV/HV transformer failure can be assumed to be 11 h.

5. Calculations for Different Test Networks

The first test network, which shows the effect of different line lengths, different line ages, and transformers on the reliability index, is the modified IEEE 118 test network. This network was modified to adapt it to the operating parameters of the European network. Therefore, the voltage levels were adjusted to 400 kV, 220 kV, and 110 kV. The cross sections and load capacities of the conductors were also adjusted. Additionally, the total load value in the network was adjusted to the value occurring in the Polish power system.
The authors performed an analysis of the reliability results for a set of data for a period of 5 to 9 years.
There are 158 110 kV lines in the IEEE 118 network. Based on the data obtained by the authors, as well as literature data and reports from the Polish Power Transmission and Distribution Society, the average number of failures was assumed to be at level 5. The average time of the month was also assumed to be 30 days. The average line lengths were taken from the test network. Then, the average annual failure rate was 1.41 failures per 100 km (9-year data) and 2.54 failures per 100 km (5-year data) using the relationship (5).
The test network is also made up of 8 220 kV lines. For this voltage level, the average annual reliability rate was 0.92 failures per 100 km (9-year data). For the 5-year data, the failure rate was 1.32 per 100 km of line using the relationship (5).
For the 400 kV lines, of which there are 11 in the test network, data from the literature [125] were used to determine the average number of failures, and the average number of failures was taken at level 3. Average line lengths were taken from the IEEE test network. Then the average annual failure rate was 0.54 failures per 100 km of line (9-year data). For the 5-year data, the reliability factor was 0.96 failures per 100 km of line using the relationship (5).
For calculating the reliability factor of transmission lines, the relationship (6) can also be used, which can be used to calculate the reliability factor for transmission lines with the same voltage level.
Using this relationship, the annual reliability factor for 110 kV lines is 1.1 failures per 100 km of line (9-year data), 1.94 failures per 100 km of line (5-year data), with an assumed average number of failures of 2. For 220 kV lines, the reliability factor is 0.74 failures per 100 km of line (9-year data). For the 5-year data, this factor is 1.32 failures per 100 km. At the 400 kV voltage level, the failure rate amounts to 0.26 failures per 100 km of line according to data accumulated over a nine-year period, and to 0.46 failures per 100 km of line based on data collected over a five-year period.
The IEEE 118 test network examined also consists of 29 system transformers, which are made up of 9 220/110 kV transformers, 4 400/220 kV transformers, and 16 400/110 kV transformers.
To determine their reliability coefficient, the authors used the obtained data, as well as the items in the literature [125], where the authors had precise data on the Polish power system. On this basis, the authors assumed an average number of failures of 0.12 failures per 100 units in the case of 400/110 kV transformers, 0.12 failures per 100 units in the case of 220/110 kV transformers, 0.1 failures per 100 kV transformers, and 100 damages in the case of 400/220 kV transformers. Since the damage indicators are small, in networks containing several hundred transformer units, the number of damages will be less than 1 or close to one; therefore, the calculations for one damage during the year are presented below as an example. According to the relationship (22), the reliability indicator for system transformers is 3.3 failures per 100 transformers during the year.
The second network on which the influence of different types of line lengths, different ages and the influence of the number of damages to system transformers and transmission lines was shown is a large real network of over 3000 nodes, consisting of over 40 thousand kilometers of transmission lines consisting of over 3000 lines and 230 system transformers consisting of 30 400/220 kV transformers, 65 400/110 kV transformers and 135 220/110 kV transformers. The network contains about 3000 110 kV lines, 171 220 kV lines, and 130 400 kV lines [130,132,133,134].
Similarly to the IEEE 118 test network, in the case of the actual network under study, the authors assumed that the average duration of a month would be 30 days. For calculation purposes, the authors also determined the number of failures of a particular line in the period under study from the normal distribution. The average line lengths were assumed from the actual network model. Then, the average annual failure rate for a 110 kV line according to the relationship (5) is 1.64 failures per 100 km (data for 9 years) and 2.94 failures per 100 km of line in the case of data for a period of 5 years. The transmission network for the large model is also composed of 171 lines with a voltage of 220 kV. In the case of lines with this voltage level, the reliability coefficient according to the relationship (5) is 0.69 (data for 9 years), and there are 1.25 emergency shutdowns in the case of data for a period of 5 years. In the case of 400 kV lines, the coefficient is 0.21 for data from 9 years and 0.36 for data from 5 years.
In the case of transformer reliability index calculations, the same relationship was used as in the case of the IEEE 118 test network. The reliability index of transmission transformers is then 0.41 emergency disruptions per 100 transformers per year. As can be seen, the smaller the calculation network, the higher the reliability index of the transformer. In practice, such a situation does not occur, and emergency shutdowns are at a much lower level, and according to the literature [125], one can expect one emergency shutdown per 3 years.
Averaging the shutdown rates from all voltage levels for the Polish Power System, it can be assumed that the average shutdown rate in overhead lines in Poland is between 1.3 and 1.8 shutdowns per 100 km of line. Therefore, an average indicator of 1.5 outages per 100 km of line can be assumed without dividing into voltages.
In the case of transformers, on the other hand, an indicator of 1 emergency outage per year can be assumed in calculations for the Polish Power System. It should be noted, however, that actual outages occur even less frequently, and it can be assumed that such an element is removed from the system approximately once every three years.
The approach presented in this article, based on the determination of non-watertightness indicators with available data, provides important conclusions about the technical condition of the transmission infrastructure. However, the method has some limitations that need to be borne in mind when interpreting the results. Firstly, the analysis is based on historical data collected statistically, which limits the ability to take into account dynamic states of system operation and short-term load changes. Secondly, the current methodology does not take into account the full impact of RES generation on network operation. Thirdly, due to the lack of comparable contemporary studies for Polish conditions (the last such study for the transmission grid was produced more than 30 years ago), no comparison of the results with those of other contemporary studies was made. In future work, the authors plan to extend the approach to include models using machine learning techniques. They also plan to take into account factors such as temperature, humidity, and weather anomalies. This approach will enable a more comprehensive estimation of power system reliability in the energy transition in the future.

6. Conclusions

The issue related to the failure rate of transmission lines and network transformers is particularly important in the area of these networks where the connection of RES is planned. In this article, the authors have proposed an extensive literature review presented in point 2. Based on it, as well as on the authors’ own calculations, it can be stated that the line reliability indicator will differ significantly depending on the locations on the continent. Based on the literature review and the authors’ own calculations, Figure 6 presents a summary of the averaged reliability factors for transmission lines by continent. For this purpose, the authors reached for data available not only in scientific works by other authors but also in data provided by operator companies operating on a given continent. The presented graph does not include data for Australia and Oceania due to the unavailability of reliable information on this subject in these regions. Operators operating in Australia are reluctant to provide such data, and despite reviewing many works on this subject, the authors were unable to find reliable data.
Figure 7 presents a graph comparing the reliability coefficients of lines with individual voltage values for Poland, Europe, and those resulting from the authors’ own calculations. It can be seen that the results obtained as a result of the authors’ calculations correspond to the values for Poland and Europe.
Based on the graphs presented below, the authors recommend using the reliability coefficient of the 110 kV line at the level of 1.7 for calculation purposes, the 220 kV line at the level of 1.45, and the 400 kV line at the level of 0.6. Without dividing into voltages, the authors recommend using the reliability coefficient at the level of 1.5.
In the case of the reliability indicator (Figure 8), the authors recommend using the statistical value of 0.11 disturbance per year per 100 system transformers for calculation purposes.
Regarding the failure removal time (Figure 9) for transmission lines, the authors recommend adopting a repair duration of 14 h per line. These data are consistent with the values for Europe, where the time needed to repair a single transmission line is 15 h. In the case of system transformers (Figure 10) located in the Polish Power System, the authors suggest considering the time needed to repair this element as 11 h without dividing it into the voltage levels at which they operate.
The presented analysis is a first step toward a broader and more complex approach to reliability issues in the transmission system, especially in the context of RES development. In their engineering practice, the authors, as authors of numerous connection studies for renewable sources, observe that the main limitation for the connection of new generation units at the voltage levels of 110 kV, 220 kV, and 400 kV is the outdated and overloaded infrastructure components. The determination of reliability indices for these system components enables the identification of key technical constraints and will form the basis for the development of a tool to support the process of connecting distributed renewable energy sources to the system. In further stages of their research, the authors plan to develop a methodology based on artificial intelligence to support investment decisions.
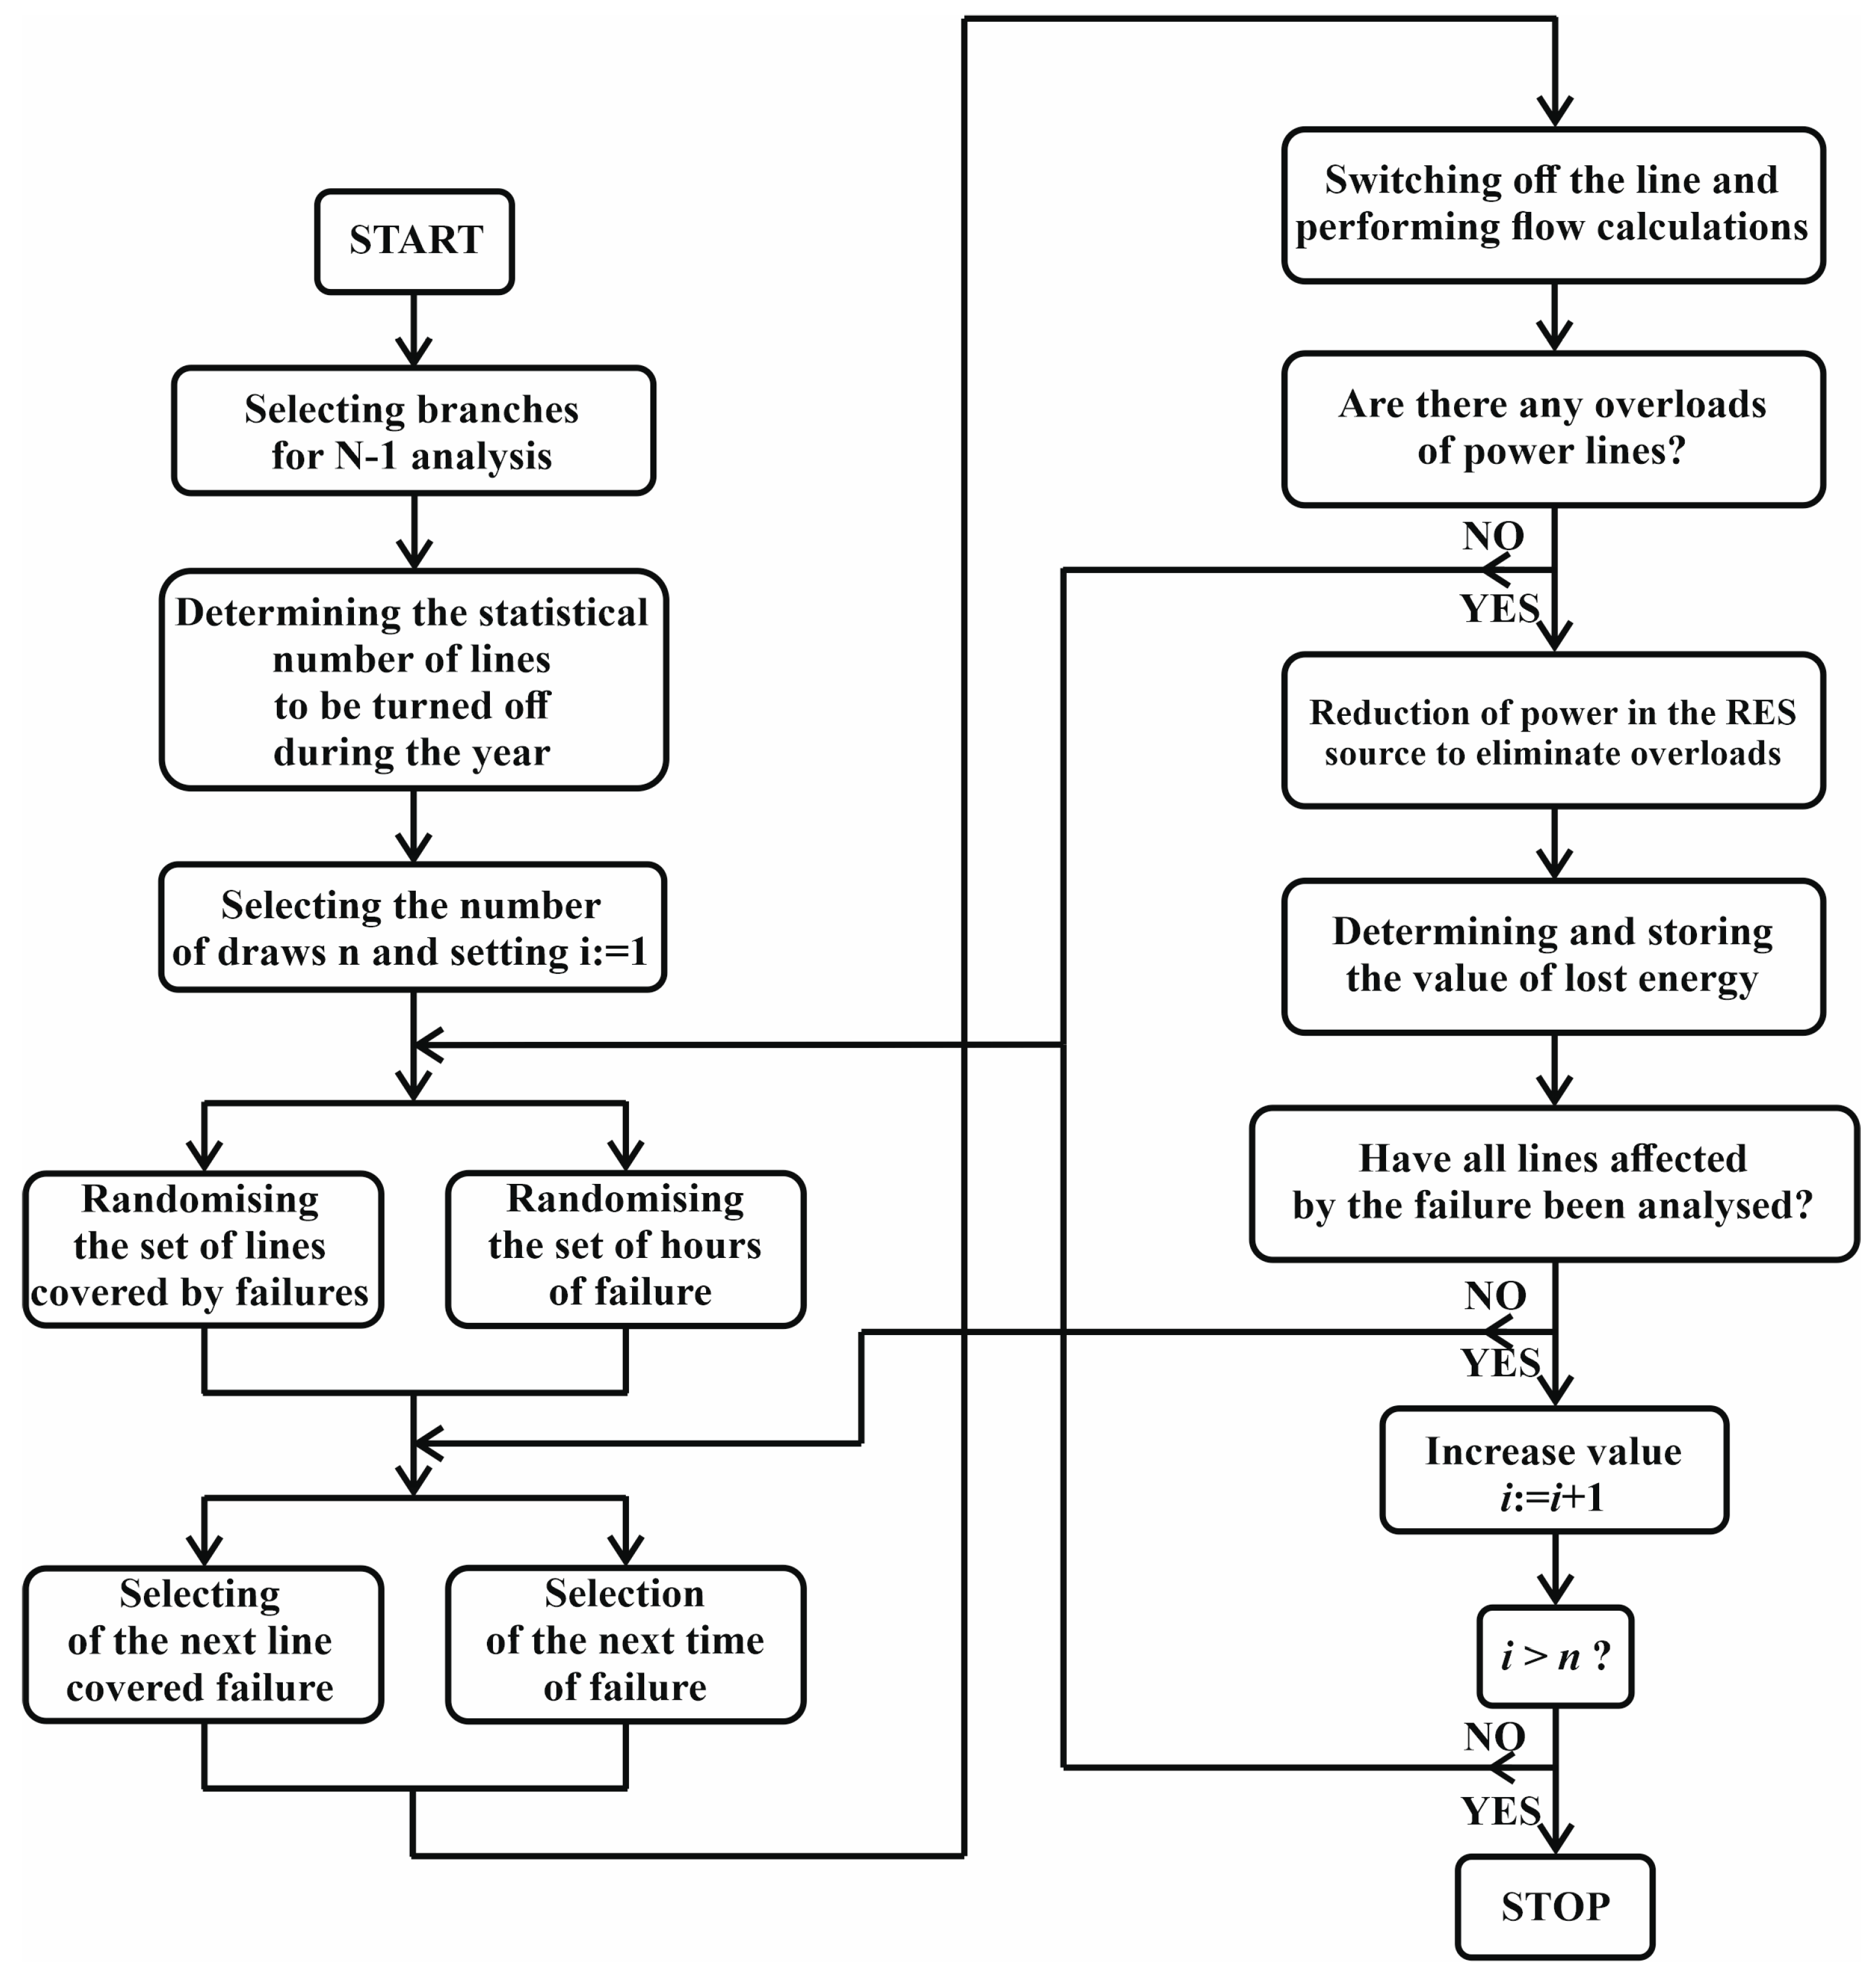
In the presented methodology, an N-1 analysis approach will be adopted with a random selection of both the number of lines subjected to outages and the hours of these outages. The number of lines and the time of fault clearing will be determined based on the reliability indices presented in the article. In the case of overloads caused by line outages, a renewable generation reduction algorithm will be implemented to eliminate them. The amount of energy lost due to generation curtailment will then be calculated. This process will be repeated for multiple random samples, capturing the stochastic nature of outages and the variability of renewable generation. Thus, the methodology will take into account both the increasing share of RES in the system and the dynamic operating conditions of the grid in the context of electricity transmission reliability. A schematic of the proposed methodology is shown in Figure 11.

Author Contributions

Conceptualization, P.P. and A.B.; methodology, P.P. and A.B.; validation, P.P.; formal analysis, P.P. and A.B.; investigation, P.P. and A.B.; resources, A.B.; data curation, P.P. and A.B.; writing—original draft preparation P.P. and A.B.; writing—review and editing, P.P. and A.B.; visualization, P.P. and A.B.; supervision, P.P. All authors have read and agreed to the published version of the manuscript.

Funding

This research received no external funding.

Informed Consent Statement

No applicable.

Data Availability Statement

The original contributions presented in the study are included in the article; further inquiries can be directed to the corresponding author.

Conflicts of Interest

The authors declare no conflicts of interest.

References

  1. Michał, B. Analiza Ryzyka Wykonawcy Dotycząca Wybranych Etapów Inwestycji Elektroenergetycznej [Contractors for Selected Phases of an Electricity Project]; SGH: Singapore, 2019. [Google Scholar]
  2. Borecki, M. A Proposed New Approach for the Assessment of Selected Operating Conditions of the High Voltage Cable Line. Energies 2020, 13, 5275. [Google Scholar] [CrossRef]
  3. Borecki, M.; Sobolewski, K. An Elimination Method for an Emergency Situation in Gas-Insulated Switchgear in Power Grids. IEEE Trans. Power Deliv. 2021, 36, 3724–3732. [Google Scholar] [CrossRef]
  4. Hoidalen, H.K. Analytical formulation of lightning-induced voltages on multiconductor overhead lines above lossy ground. IEEE Trans. Electromagn. Compat. 2003, 45, 92–100. [Google Scholar] [CrossRef]
  5. Kang, Y.-C.; Lee, B.-E.; Zheng, T.-Y.; Kim, Y.-H.; Crossley, P.A. Protection, faulted phase and winding identification for the three-winding transformer using the increments of flux linkages. IET Gener. Transm. Distrib. 2010, 4, 1060. [Google Scholar] [CrossRef]
  6. Kontroli, N.I. Najwyższa Izba Kontroli. Rozwój Elektroenergetycznej Sieci Dystrybucyjnej [Development of the Electricity Distribution Network]; Najwyższa Izba Kontroli: Warszawa, Poland, 2024.
  7. Christiaanse, W.; Palmer, A. A Technique for the Automated Scheduling of the Maintenance of Generating Facilities. IEEE Trans. Power Appar. Syst. 1972, PAS-91, 137–144. [Google Scholar] [CrossRef]
  8. Abbasghorbani, M.; Damchi, Y.; Rajabi Mashhadi, H. Reliability-Centered Maintenance for Overhead Transmission Lines in Composite Power System. Int. Trans. Electr. Energ. Syst. 2022, 2022, 1170269. [Google Scholar] [CrossRef]
  9. Pandzic, H.; Conejo, A.J.; Kuzle, I.; Caro, E. Yearly Maintenance Scheduling of Transmission Lines Within a Market Environment. IEEE Trans. Power Syst. 2012, 27, 407–415. [Google Scholar] [CrossRef]
  10. Abiri-Jahromi, A.; Fotuhi-Firuzabad, M.; Abbasi, E. An Efficient Mixed-Integer Linear Formulation for Long-Term Overhead Lines Maintenance Scheduling in Power Distribution Systems. IEEE Trans. Power Deliv. 2009, 24, 2043–2053. [Google Scholar] [CrossRef]
  11. Alvarez-Alvarado, M.S.; Jayaweera, D. Reliability-based smart-maintenance model for power system generators. IET Gener. Transm. Distrib. 2020, 14, 1770–1780. [Google Scholar] [CrossRef]
  12. Xiao, Y.; Zhao, X.; Wu, Y.; Chen, Z.; Gong, H.; Zhu, L.; Liu, Y. Seismic resilience assessment of urban interdependent lifeline networks. Reliab. Eng. Syst. Saf. 2022, 218, 108164. [Google Scholar] [CrossRef]
  13. Ferrario, E.; Poulos, A.; Castro, S.; La Llera, J.C.d.; Lorca, A. Predictive capacity of topological measures in evaluating seismic risk and resilience of electric power networks. Reliab. Eng. Syst. Saf. 2022, 217, 108040. [Google Scholar] [CrossRef]
  14. Liu, X.; Zheng, S.; Wu, X.; Chen, D.; He, J. Research on a seismic connectivity reliability model of power systems based on the quasi-Monte Carlo method. Reliab. Eng. Syst. Saf. 2021, 215, 107888. [Google Scholar] [CrossRef]
  15. Iuliis, M.d.; Kammouh, O.; Cimellaro, G.P.; Tesfamariam, S. Quantifying restoration time of power and telecommunication lifelines after earthquakes using Bayesian belief network model. Reliab. Eng. Syst. Saf. 2021, 208, 107320. [Google Scholar] [CrossRef]
  16. Venkateswaran, V.B.; Saini, D.K.; Sharma, M. Techno-economic hardening strategies to enhance distribution system resilience against earthquake. Reliab. Eng. Syst. Saf. 2021, 213, 107682. [Google Scholar] [CrossRef]
  17. Wang, H.; Fang, Y.-P.; Zio, E. Resilience-oriented optimal post-disruption reconfiguration for coupled traffic-power systems. Reliab. Eng. Syst. Saf. 2022, 222, 108408. [Google Scholar] [CrossRef]
  18. Xie, H.; Tang, L.; Zhu, H.; Cheng, X.; Bie, Z. Robustness assessment and enhancement of deep reinforcement learning-enabled load restoration for distribution systems. Reliab. Eng. Syst. Saf. 2023, 237, 109340. [Google Scholar] [CrossRef]
  19. Huang, X.; Wang, N. An adaptive nested dynamic downscaling strategy of wind-field for real-time risk forecast of power transmission systems during tropical cyclones. Reliab. Eng. Syst. Saf. 2024, 242, 109731. [Google Scholar] [CrossRef]
  20. Chłopek, Z. The cognitive interpretation of the Monte Carlo method for the technical applications. Eksploat. I Niezawodn. 2009, 38–46. [Google Scholar]
  21. Laudyn, D.; Maksymiuk, J. Jakość i Niezawodność w Elektroenergetyce [Quality and Reliability in the Electric Power Industry]; Oficyna Wydawnicza Politechniki Warszawskiej: Warszawa, Poland, 1996. [Google Scholar]
  22. Paska, J. Niezawodność Systemów Elektroenergetycznych [Reliability of Electricity Systems]; Oficyna Wydawnicza Politechniki Warszawskiej: Warszawa, Poland, 2005. [Google Scholar]
  23. Zhang, C.; Zeng, Q.; Dui, H.; Chen, R.; Wang, S. Reliability model and maintenance cost optimization of wind-photovoltaic hybrid power systems. Reliab. Eng. Syst. Saf. 2025, 255, 110673. [Google Scholar] [CrossRef]
  24. Cao, M.; Guo, J.; Xiao, H.; Wu, L. Reliability analysis and optimal generator allocation and protection strategy of a non-repairable power grid system. Reliab. Eng. Syst. Saf. 2022, 222, 108443. [Google Scholar] [CrossRef]
  25. Meng, X.; Tian, L.; Liu, J.; Jin, Q. Failure prediction of overhead transmission lines incorporating time series prediction model for wind-ice loads. Reliab. Eng. Syst. Saf. 2025, 259, 110927. [Google Scholar] [CrossRef]
  26. Dikshit, S.; Alipour, A. A moment-matching method for fragility analysis of transmission towers under straight line winds. Reliab. Eng. Syst. Saf. 2023, 236, 109241. [Google Scholar] [CrossRef]
  27. Meng, X.; Tian, L.; Li, C.; Liu, J. Copula-based wind-induced failure prediction of overhead transmission line considering multiple temperature factors. Reliab. Eng. Syst. Saf. 2024, 247, 110138. [Google Scholar] [CrossRef]
  28. Du, W.-L.; Fu, X.; Shao, S.; Li, G.; Li, H.-N.; Yang, F.-L. Wind hazard reliability assessment of a transmission tower-line system incorporating progressive collapse. Reliab. Eng. Syst. Saf. 2025, 257, 110878. [Google Scholar] [CrossRef]
  29. Du, W.-L.; Fu, X.; Zhu, D.-J.; Li, G.; Li, H.-N.; Huang, Z.-H.; Liu, Y.-Z. Nataf-based probabilistic buffeting prediction of overhead transmission lines under multi-dimensional turbulent wind excitation. Reliab. Eng. Syst. Saf. 2025, 257, 110846. [Google Scholar] [CrossRef]
  30. Chen, L.J.; Li, X. Statistic analysis on reliability of power transmission and transformation facilities in China in 2011. Elect. Power 2012, 45, 89–93. [Google Scholar]
  31. Chen, L.J.; Hu, X.Z. Statistic analysis on reliability of power transmission and transformation facilities in China in 2010. Elect. Power 2011, 44, 71–77. [Google Scholar]
  32. Alminhana, F.; Mason, M.; Albermani, F. Transmission line failure propagation under extreme wind scenarios: Extratropical cyclones. Eng. Struct. 2023, 284, 115942. [Google Scholar] [CrossRef]
  33. Dikshit, S.; Dobson, I.; Alipour, A. Cascading structural failures of towers in an electric power transmission line due to straight line winds. Reliab. Eng. Syst. Saf. 2024, 250, 110304. [Google Scholar] [CrossRef]
  34. Ma, L.; Christou, V.; Bocchini, P. Framework for probabilistic simulation of power transmission network performance under hurricanes. Reliab. Eng. Syst. Saf. 2022, 217, 108072. [Google Scholar] [CrossRef]
  35. Bi, W.; Tian, L.; Li, C.; Ma, Z.; Pan, H. Wind-induced failure analysis of a transmission tower-line system with long-term measured data and orientation effect. Reliab. Eng. Syst. Saf. 2023, 229, 108875. [Google Scholar] [CrossRef]
  36. Billinton, R.; Singh, G. Application of adverse and extreme adverse weather: Modelling in transmission and distribution system reliability evaluation. IEE Proc. Gener. Transm. Distrib. 2006, 153, 115. [Google Scholar] [CrossRef]
  37. Billinton, R.; Singh, G.D. Reliability assessment of transmission and distribution systems considering repair in adverse weather conditions. In Proceedings of the IEEE CCECE2002 Canadian Conference on Electrical and Computer Engineering. Conference Proceedings (Cat. No.02CH37373), Winnipeg, MB, Canada, 12–15 May 2002; IEEE: New York, NY, USA, 2002; pp. 88–93, ISBN 0-7803-7514-9. [Google Scholar]
  38. Chernysheva, A.; Adamec, V.; Tulsky, V.; Vanin, A. Calibration of the distribution network reliability model based on failure data. Case Study. In Proceedings of the 2019 International Youth Conference on Radio Electronics, Electrical and Power Engineering (REEPE), Moscow, Russia, 14–15 March 2019; IEEE: New York, NY, USA, 2019; pp. 1–5, ISBN 978-1-5386-9334-6. [Google Scholar]
  39. Christodoulou, C.A.; Ekonomou, L.; Fotis, G.P.; Gonos, I.F.; Stathopulos, I.A. Assessment of surge arrester failure rate and application studies in Hellenic high voltage transmission lines. Electr. Power Syst. Res. 2010, 80, 176–183. [Google Scholar] [CrossRef]
  40. Malik, H.; Yadav, A.K.; Mishra, S.; Mehto, T. Application of neuro-fuzzy scheme to investigate the winding insulation paper deterioration in oil-immersed power transformer. Int. J. Electr. Power Energy Syst. 2013, 53, 256–271. [Google Scholar] [CrossRef]
  41. Borecki, M. Analiza Zagrożenia Piorunowego i Sposobów Jego Ograniczenia w Liniach Napowietrznych 110 kV–400 kV [Analysis of the Lightning Danger and Ways to Reduce It in 110 kV–400 kV Overhead Lines], 1st ed.; Oficyna Wydawnicza Politechniki Warszawskiej: Warszawa, Poland, 2024. [Google Scholar]
  42. Sundararaman, B.; Jain, P. Fault Detection and Classification in Electrical Power Transmission System Using Wavelet Transform. In RAiSE-2023; MDPI: Basel, Switzerland, 2023; p. 71. [Google Scholar]
  43. Chojnacki, A.Ł. Analiza Niezawodności Eksploatacyjnej Elektroenergetycznych Sieci Dystrybucyjnych [Analysis of the Operational Reliability of Electricity Distribution Networks]; Politechnika Świętokrzyska: Kielce, Poland, 2013. [Google Scholar]
  44. Mahmoud, S.A. Reliability Assessment for Overhead Power Transmission Lines Using Failure Rate Analysis. Aust. J. Basic Appl. Sci. 2016, 10, 34–49. [Google Scholar]
  45. Chojnacki, A. Właściwości niezawodnościowe napowietrznych linii dystrybucyjnych 110 kV [Reliability characteristics of 110 kV overhead distribution lines]. Przegląd Elektrotechniczny 2017, 85, 15–19. [Google Scholar] [CrossRef]
  46. Chojnacki, A. Impact of ambient temperature on the failure intensity of overhead MV power lines. Przegląd Elektrotechniczny 2022, 1, 309–313. [Google Scholar] [CrossRef]
  47. Mesić, M.; Plavšić, T. The contribution of failure analyses to transmission network maintenance preferentials. Eng. Fail. Anal. 2013, 35, 262–271. [Google Scholar] [CrossRef]
  48. Mesic, M.; Toljan, I.; Tesnjak, S. The role of transmission network maintenance in achieving power system reliability. In Proceedings of the MELECON 2008—The 14th IEEE Mediterranean Electrotechnical Conference. MELECON 2008—2008 IEEE Mediterranean Electrotechnical Conference, Ajaccio, France, 5–7 May 2008; IEEE: New York, NY, USA, 2008; pp. 688–693, ISBN 978-1-4244-1632-5. [Google Scholar]
  49. Melodi, A.O.; Momoh, J.A.; Oyinlola, A.O. Transmission system reliability modeling and assessment for Nigerian electric grid. In Proceedings of the 2017 IEEE PES PowerAfrica, Accra, Ghana, 27–30 June 2017; IEEE: New York, NY, USA, 2017; pp. 40–45, ISBN 978-1-5090-4746-8. [Google Scholar]
  50. Gaver, D.P.; Montmeat, F.E.; Patton, A.D. Power System Reliability I-Measures of Reliability and Methods of Calculation. IEEE Trans. Power Appar. Syst. 1964, 83, 727–737. [Google Scholar] [CrossRef]
  51. Liu, Y.; Singh, C. Evaluation of Hurricane Impact on Failure Rate of Transmission Lines Using Fuzzy Expert System. In Proceedings of the 2009 15th International Conference on Intelligent System Applications to Power Systems (ISAP), Curitiba, Brazil, 8–12 November 2009; IEEE: New York, NY, USA, 2009; pp. 1–6, ISBN 978-1-4244-5097-8. [Google Scholar]
  52. Ahmadi, R.; Wu, S.; Sobhani, A. Reliability Modeling and Maintenance Optimization for a Repairable System with Heterogeneity Population. IEEE Trans. Rel. 2022, 71, 87–99. [Google Scholar] [CrossRef]
  53. Enjavimadar, M.; Rastegar, M. Optimal reliability-centered maintenance strategy based on the failure modes and effect analysis in power distribution systems. Electr. Power Syst. Res. 2022, 203, 107647. [Google Scholar] [CrossRef]
  54. Heo, J.H.; Kim, M.K.; Lyu, J.K. Implementation of Reliability-Centered Maintenance for transmission components using Particle Swarm Optimization. Int. J. Electr. Power Energy Syst. 2014, 55, 238–245. [Google Scholar] [CrossRef]
  55. Heo, J.-H.; Kim, M.-K.; Park, G.-P.; Yoon, Y.T.; Park, J.K.; Lee, S.-S.; Kim, D.-H. A Reliability-Centered Approach to an Optimal Maintenance Strategy in Transmission Systems Using a Genetic Algorithm. IEEE Trans. Power Deliv. 2011, 26, 2171–2179. [Google Scholar] [CrossRef]
  56. Zhang, D.; Li, W.; Xiong, X. Overhead Line Preventive Maintenance Strategy Based on Condition Monitoring and System Reliability Assessment. IEEE Trans. Power Syst. 2014, 29, 1839–1846. [Google Scholar] [CrossRef]
  57. Wang, J.; Xiong, X.; Zhou, N.; Li, Z.; Weng, S. Time-varying failure rate simulation model of transmission lines and its application in power system risk assessment considering seasonal alternating meteorological disasters. IET Gener. Transm. Distrib. 2016, 10, 1582–1588. [Google Scholar] [CrossRef]
  58. Liu, Y.; Singh, C. Reliability Evaluation of Composite Power Systems Using Markov Cut-Set Method. IEEE Trans. Power Syst. 2010, 25, 777–785. [Google Scholar] [CrossRef]
  59. Chojnacki, A. Funkcje niezawodnościowe napowietrznych linii dystrybucyjnych 110 kV, SN oraz nn [Reliability functions of 110 kV, MV and LV overhead distribution lines]. Przegląd Elektrotechniczny 2024, 1, 196–200. [Google Scholar] [CrossRef]
  60. Yellen, J.; Al-Khamis, T.M.; Vemuri, S.; Lemonidis, L. A decomposition approach to unit maintenance scheduling. IEEE Trans. Power Syst. 1992, 7, 726–733. [Google Scholar] [CrossRef]
  61. Al-Khamis, T.M.; Vemuri, S.; Lemonidis, L.; Yellen, J. Unit maintenance scheduling with fuel constraints. IEEE Trans. Power Syst. 1992, 7, 933–939. [Google Scholar] [CrossRef]
  62. Billinton, R.; Bollinger, K. Transmission System Reliability Evaluation Using Markov Processes. IEEE Trans. Power Appar. Syst. 1968, PAS-87, 538–547. [Google Scholar] [CrossRef]
  63. Han, S.-R.; Guikema, S.D.; Quiring, S.M.; Lee, K.-H.; Rosowsky, D.; Davidson, R.A. Estimating the spatial distribution of power outages during hurricanes in the Gulf coast region. Reliab. Eng. Syst. Saf. 2009, 94, 199–210. [Google Scholar] [CrossRef]
  64. Mo, H.; Sansavini, G. Impact of aging and performance degradation on the operational costs of distributed generation systems. Renew. Energy 2019, 143, 426–439. [Google Scholar] [CrossRef]
  65. Azadeh, A.; Asadzadeh, S.M.; Salehi, N.; Firoozi, M. Condition-based maintenance effectiveness for series–parallel power generation system—A combined Markovian simulation model. Reliab. Eng. Syst. Saf. 2015, 142, 357–368. [Google Scholar] [CrossRef]
  66. IEEE. 2007 International Power Engineering Conference (IPEC 2007); IEEE: Piscataway, NJ, USA, 2007. [Google Scholar]
  67. IEEE Std C57.125-2015; (Revision of IEEE Std C57.125-1991): IEEE Guide for Failure Investigation, Documentation, Analysis, and Reporting for Power Transformers and Shunt Reactors. IEEE: New York, NY, USA, 2015; ISBN 978-0-7381-9901-6.
  68. Bossi, A.; Dind, J.; Frisson, J.; Khoudiakov, U.; Light, H. An International Survey on Failures in Large Power Transformers in Service; Electra: London, UK, 1983. [Google Scholar]
  69. Tenbohlen, S.; Jagers, J.; Vahidi, F. Standardized survey of transformer reliability: On behalf of CIGRE WG A2.37. In Proceedings of the 2017 International Symposium on Electrical Insulating Materials (ISEIM), Toyohashi, Japan, 11–15 September 2017; IEEE: New York, NY, USA, 2017; pp. 593–596, ISBN 978-4-88686-099-6. [Google Scholar]
  70. Tenbohlen, S. VDE-Hochspannungstechnik: Vorträge der ETG-Fachtagung 14.–16. November 2016 in Berlin; VDE Verlag: Berlin/Offenbach, Germany, 2016; ISBN 978-3-8007-4310-0. [Google Scholar]
  71. Abdelfatah, M.; EL-Shimy, M.; Ismail, H.M. Reliability analysis of 220 kV power transformers in Egypt. Ain Shams Eng. J. 2011, 2, 183–194. [Google Scholar] [CrossRef]
  72. Klistala, T. Przegląd metod diagnostycznych układów izolacyjnych transformatorów dużej mocy w eksploatacji [Overview of diagnostic methods for insulating systems of high-power transformers in service]. Pomiary Autom. Kontrola 2008, 54, 754–759. [Google Scholar]
  73. Bagiński, A.; Domżalski, T.; Kaźmierski, M.; Łukaszewski, J.; Olech, W.; Olejniczak, H.; Owczarek, J.; Sieradzki, S.; Szymański, Z. Ramowa Instrukcja Eksploatacji Transformatorów [Framework for the Operation of Transformers]; ELEKTRYKA Sp. z o. O: Gliwice, Poland, 2001. [Google Scholar]
  74. Jagers, J.N.; Khosa, J.; De Klerk, P.J.; Gaunt, C.T. Transformer reliability and condition assessment in a South African utility. In Proceedings of the XVth International Symposium on High Voltage Engineering, Ljubljana, Slovenia, 27–31 August 2007. [Google Scholar]
  75. Petersen, A.A.P.L. Impact of recent transformer failures and fires Australian and New Zealand experiences. In Proceedings of the CIGRE-Session 2004 Elektrotech, Inftech, Paris, France, 29 August–3 September 2004; pp. 1–10. [Google Scholar]
  76. Martin, D.; Marks, J.; Saha, T. Survey of Australian power transformer failures and retirements. IEEE Electr. Insul. Mag. 2017, 33, 16–22. [Google Scholar] [CrossRef]
  77. Minhas, M.S.A.; De Klerk, P.J.; Reynders, J.P. Failures in Large Power Transformers. In Proceedings of the CIGRE International Conference on Large High Voltage Systems, Cairo, Egypt, 27–30 September 1997. [Google Scholar]
  78. Siderakis, K.; Pylarinos, D.; Thalassinakis, E. Power Transformers Management in the Power System of Crete. In Proceedings of the 9th International Conference on Deregulated Electricity Market Issues in South Eastern Europe, Nicosia, Cyprus, 25–26 September 2014. [Google Scholar]
  79. Kogan, V.I.; Fleeman, J.A.; Provanzana, J.H.; Shih, C.H. Failure analysis of EHV transformers. IEEE Trans. Power Deliv. 1988, 3, 672–683. [Google Scholar] [CrossRef]
  80. Chafai, M.; Refoufi, L.; Bentarzi, H. Large power transformer reliability modeling. Int. J. Syst. Assur. Eng. Manag. 2016, 7, 9–17. [Google Scholar] [CrossRef]
  81. Soleimani, M.; Kezunovic, M.; Butenko, S. Linear Arrhenius-Weibull Model for Power Transformer Thermal Stress Assessment. IEEE Access 2022, 10, 19013–19021. [Google Scholar] [CrossRef]
  82. Behzadirafi, S.; Salehfar, H.; Aravindan, V. Impact of Power System Protection and Fault Current Limiters on Component Failure Rates. In Proceedings of the 2018 IEEE International Conference on Probabilistic Methods Applied to Power Systems (PMAPS), Boise, ID, USA, 24–28 June 2018; IEEE: New York, NY, USA, 2018; pp. 1–6, ISBN 978-1-5386-3596-4. [Google Scholar]
  83. Behzadirafi, S.; Salehfar, H. Preventive Maintenance Scheduling Based on Short Circuit and Overload Currents. IEEE Trans. Smart Grid 2015, 6, 1740–1747. [Google Scholar] [CrossRef]
  84. Zhao, S.; Singh, C. A reliability evaluation method for line switching operations in power systems. In Proceedings of the 2016 Power Systems Computation Conference (PSCC), Genoa, Italy, 20–24 June 2016; IEEE: New York, NY, USA, 2016; pp. 1–7, ISBN 978-88-941051-2-4. [Google Scholar]
  85. Singh, C.; Mitra, J. Composite system reliability evaluation using state space pruning. IEEE Trans. Power Syst. 1997, 12, 471–479. [Google Scholar] [CrossRef]
  86. Chojnacki, A. Ocena wskaźników niezawodnościowych stacji 110 kV/SN i rozdzielni sieciowych SN w oparciu o metody analityczne oraz symulacyjne [Reliability assessment of 110 kV/SN substations and MV network switchgear based on analytical and simulation methods]. Przegląd Elektrotechniczny 2016, 1, 182–187. [Google Scholar] [CrossRef]
  87. Chojnacki, A. Parametry i właściwości niezawodnościowe stacji GPZ i RS [Parameters and reliability characteristics of GPZ and RS substations]. Przegląd Elektrotechniczny 2016, 1, 198–204. [Google Scholar] [CrossRef]
  88. Chojnacki, A. Podstawowe funkcje niezawodnościowe stacji 110 kV/SN oraz rozdzielni sieciowych SN [Basic reliability functions of 110 kV/SN substations and MV network switchgear]. Przegląd Elektrotechniczny 2016, 1, 240–243. [Google Scholar] [CrossRef]
  89. Stępień, J. Kompleksowy model niezawodnościowy głównych punktów zasilających 110/15 kV [Comprehensive reliability model of 110/15 kV main supply points]. Przegląd Elektrotechniczny 2008, 1, 128–131. [Google Scholar]
  90. Pijarski, P.; Belowski, A. Application of Methods Based on Artificial Intelligence and Optimisation in Power Engineering—Introduction to the Special Issue. Energies 2024, 17, 516. [Google Scholar] [CrossRef]
  91. Alvarez-Alvarado, M.S.; Donaldson, D.L.; Recalde, A.A.; Noriega, H.H.; Khan, Z.A.; Velasquez, W.; Rodriguez-Gallegos, C.D. Power System Reliability and Maintenance Evolution: A Critical Review and Future Perspectives. IEEE Access 2022, 10, 51922–51950. [Google Scholar] [CrossRef]
  92. Safdarian, F.; Wert, J.L.; Cyr, D.; Overbye, T.J. Power System Resiliency and Reliability Issues from Renewable Resource Droughts. In Proceedings of the 2024 IEEE Kansas Power and Energy Conference (KPEC), Manhattan, KS, USA, 25–26 April 2024; IEEE: New York, NY, USA, 2024; pp. 1–6, ISBN 979-8-3503-7240-3. [Google Scholar]
  93. Mahdavi, M.; Javadi, M.S.; Catalão, J.P. Integrated generation-transmission expansion planning considering power system reliability and optimal maintenance activities. Int. J. Electr. Power Energy Syst. 2023, 145, 108688. [Google Scholar] [CrossRef]
  94. Tian, Z.; Wang, H. Wind power system reliability and maintenance optimization considering turbine and wind uncertainty. JQME 2022, 28, 252–273. [Google Scholar] [CrossRef]
  95. Garip, S.; Özdemir, Ş.; Altin, N. Power System Reliability Assessment—A Review on Analysis and Evaluation Methods. J. Energy Syst. 2022, 6, 401–419. [Google Scholar] [CrossRef]
  96. Chojnacki, A.L. Assessment of the Risk of Damage to 110 kV Overhead Lines Due to Wind. Energies 2021, 14, 556. [Google Scholar] [CrossRef]
  97. Chojnacki, A. Analysis of Seasonality and Causes of Equipment and Facility Failures in Electric Power Distribution Networks. Przegląd Elektrotechniczny 2023, 1, 159–165. [Google Scholar] [CrossRef]
  98. Rexhepi, V. An Analysis of Power Transformer Outages and Reliability Monitoring. Energy Procedia 2017, 141, 418–422. [Google Scholar] [CrossRef]
  99. Minhas, M. Failures in power system transformers and appropriate monitoring techniques. In Proceedings of the 11th International Symposium on High-Voltage Engineering (ISH 99), London, UK, 23–27 August 1999; IEEE: New York, NY, USA, 1999. v1-94-v1-94. ISBN 0-85296-719-5. [Google Scholar]
  100. Chojnacki, A.Ł.; Chojnacka, K.J. Niezawodność Elektroenergetycznych Sieci Dystrybucyjnych [Reliability of Electricity Distribution Networks]; Wydawnictwo Politechniki Świętokrzyskiej: Kielce, Poland, 2018. [Google Scholar]
  101. Jongen, R.A.; Morshuis, P.H.F.; Smit, J.J.; Janssen, A.L.J.; Gulski, E. A Statistical Approach to Processing Power Transformer Failure Data. In Proceedings of the 19th International Conference on Electricity Distribution (CIRED), Vienna, Austria, 21–24 May 2007. [Google Scholar]
  102. Jongen, R.; Gulski, E.; Morshuis, P.; Smit, J.; Janssen, A. Statistical analysis of power transformer component life time data. In Proceedings of the 2007 International Power Engineering Conference (IPEC 2007), Singapore, 3–6 December 2007. [Google Scholar]
  103. Khalil, M. Qualitative and Quantitative FMECA on 220 kV Power Transformers. In Proceedings of the 2018 IEEE International Conference on Environment and Electrical Engineering and 2018 IEEE Industrial and Commercial Power Systems Europe (EEEIC/I&CPS Europe), Palermo, Italy, 12–15 June 2018; pp. 1–8, ISBN 978-1-5386-5186-5. [Google Scholar]
  104. Li, W. Risk Assessment of Power Systems; Wiley: New York, NY, USA, 2014; ISBN 9781118686706. [Google Scholar]
  105. Airoboman, A. Reliability Assessment of Power System Network: A Detailed Review. IJET 2022, 7, 90–103. [Google Scholar] [CrossRef]
  106. Zhou, Y.; Pahwa, A.; Yang, S.-S. Modeling Weather-Related Failures of Overhead Distribution Lines. IEEE Trans. Power Syst. 2006, 21, 1683–1690. [Google Scholar] [CrossRef]
  107. Pahwa, A. Modeling Weather-Related Failures of Overhead Distribution Lines. In Proceedings of the 2007 IEEE Power Engineering Society General Meeting, Tampa, FL, USA, 24–28 June 2007; IEEE: New York, NY, USA, 2007; p. 1, ISBN 1-4244-1296-X. [Google Scholar]
  108. Yang, S.; Zhou, W.; Zhu, S.; Le Wang, Y.E.L.; Xia, X.; Li, H. Failure probability estimation of overhead transmission lines considering the spatial and temporal variation in severe weather. J. Mod. Power Syst. Clean Energy 2019, 7, 131–138. [Google Scholar] [CrossRef]
  109. Tenbohlen, S.; Jagers, J.; Gebauer, J.; Müller, P.; Lapworth, J.; Yukiyasu, S.; Desai, B.; McIntosh, A.; Bastos, G.; Bo, L. Transformer Reliability Survey: Interim Report. Electra 2012, 46–49. [Google Scholar]
  110. Hachimenum, N.; Amadi, F.I.I. Analysis of Transformer Loadings and Failure Rate in Onitsha Electricity Distribution Network. Am. J. Electr. Electron. Eng. 2016, 4, 157–163. [Google Scholar]
  111. Farzaneh Vahidi, S.T. Statistical Failure Analysis of European Substation Transformers. In Proceedings of the Diagnostik elektrischer Betriebsmittel 2014—Beiträge der 6, Berlin, Germany, 25–26 November 2014. [Google Scholar]
  112. William, H.B. Analysis of transformer failures WGP 33 (03). In Proceedings of the 36th Annual Conference on International Association of Engineering Insurers (IMIA), Stockholm, Sweden, 15–17 September 2003. [Google Scholar]
  113. Hernandez, R.D.; Hancock, B.; Salmeron, M. Lessons Learned from Analysis of Power Transformer Failure Rates. In Proceedings of the 2022 IEEE 40th Central America and Panama Convention (CONCAPAN), Panama City, Panama, 9–12 November 2022; IEEE: New York, NY, USA, 2022; pp. 1–6, ISBN 978-1-7281-6715-2. [Google Scholar]
  114. Jagers, J.T.S. Evaluation of transformer reliability data based on national and utility statistics. In Proceedings of the 16th International Symposium on High Voltage Engineering, Cape Town, South Africa, 24–28 August 2009. [Google Scholar]
  115. Kowalski, Z. Niezawodność Zasilania Odbiorców Energii Elektrycznej [Reliability of Power Supply to Electricity Consumers], 1st ed.; Wydawnictwo Politechniki Łódzkiej: Łódź, Poland, 1992. [Google Scholar]
  116. Sozański, J. Niezawodność i Jakość Pracy Systemu Elektroenergetycznego [Reliability and Quality of Power System Operation]; WNT: Warszawa, Poland, 1990. [Google Scholar]
  117. Dąbrowska-Kauf, G. Niezawodność dostaw energii elektrycznej jako miara efektywności diagnostyki technicznej w sieciach elektroenergetycznych [Reliability of electricity supply as a measure of the effectiveness of technical diagnostics in electricity networks]. Diagnostyka 2005, 33, 203–208. [Google Scholar]
  118. Abdelfatah, M.; EL-Shimy, M.; Ismail, H.M. Outage data analysis of utility power transformers based on outage reports during 2002–2009. Int. J. Electr. Power Energy Syst. 2013, 47, 41–51. [Google Scholar] [CrossRef]
  119. Li, W.; Zhou, J.; Xiong, X. Fuzzy Models of Overhead Power Line Weather-Related Outages. IEEE Trans. Power Syst. 2008, 23, 1529–1531. [Google Scholar] [CrossRef]
  120. Kacejko, P.; Pijarski, P.; Wancerz, M.; Adamek, S. Risk Assessment of Generation Curtailment in RES for Emergency States of Power Grids. AEZ 2023, 14, 10–34. [Google Scholar] [CrossRef]
  121. Wang, P.; Billinton, R. Reliability cost/worth assessment of distribution systems incorporating time-varying weather conditions and restoration resources. IEEE Trans. Power Deliv. 2002, 17, 260–265. [Google Scholar] [CrossRef]
  122. Alvehag, K.; Soder, L. A Reliability Model for Distribution Systems Incorporating Seasonal Variations in Severe Weather. IEEE Trans. Power Deliv. 2011, 26, 910–919. [Google Scholar] [CrossRef]
  123. Murray, K.; Bell, K.R.W. Wind related faults on the GB transmission network. In Proceedings of the 2014 International Conference on Probabilistic Methods Applied to Power Systems (PMAPS), Durham, UK, 7–10 July 2014; IEEE: New York, NY, USA, 2014; pp. 1–6, ISBN 978-1-4799-3561-1. [Google Scholar]
  124. Ulrich, M. The Characterisation and Automatic the Characterisa and Automatic Classification of Transmission Line Faults. Ph.D. Thesis, University of Cape Town, Cape Town, South Africa, 2014. [Google Scholar]
  125. Bargiel, J.; Goc, W.; Teichman, B. Dane do oceny niezawodności sieci Elektroenergetycznych wysokiego napięcia [Data for reliability assessment of high-voltage electricity networks]. Zeszyty Naukowe Politechniki Śląskiej 2000, 174, 119–130. [Google Scholar]
  126. Tenbohlen, S.; Hanif, Z.; Martin, D. Analysis of Major Failures of Power Transformers. In Proceedings of the ICTRAM, Split, Croatia, 29 November–2 December 2023. [Google Scholar]
  127. Energiforsk. High Voltage Equipment Reliability Data. 2023. Available online: https://energiforsk.se/media/32998/2023-974-high-voltage-equipment-reliability-data.pdf (accessed on 15 April 2025).
  128. Kjolle, G.H. What Do Fault Statistics Tell Us What Do Fault Statistics Tell Us Regarding Causes Resulting in Power Outages? CESI: Milan, Italy, 2011. [Google Scholar]
  129. Enel Foundation. Assessment of the Impact of International Interconnection Lines on the Resilience of Argentina and Chile; CESI: Milan, Italy, 2020. [Google Scholar]
  130. Polskie Sieci Elektroenergetyczne PSE S.A. Available online: https://www.pse.pl (accessed on 15 April 2025).
  131. PTPiREE. Energetyka, Dystrybucja, Przesył—Edycja 2024, Poznań, 2024. Available online: https://ptpiree.pl/raport-ptpiree/ (accessed on 15 April 2025).
  132. Waldemar, D. Zagrożenia i wyzwania dla krajowej sieci przesyłowej [Threats and challenges to the national transmission network]. Rynek Energii 2018, 138, 48–54. [Google Scholar]
  133. Waldemar, D. Krajowe Stacje Najwyższych i Wysokich Napięć—Przegląd Rozwiązań i Technologii [National High and High Voltage Substations—Overview of Solutions and Technologies]. In Proceedings of the XLIII Konferencja Naukowo Techniczna Nowoczesne Technologie w Stacjach i Liniach Elektroenergetycznych, Gdańsk, Polska, 9–10 May 2019. [Google Scholar]
  134. Waldemar, D. Krajowa sieć elektroenergetyczna—Analiza stanu i zagrożeń funkcjonowania [National electricity grid—Analysis of status and risks of operation]. Rynek Energii 2023, 166, 3–10. [Google Scholar]
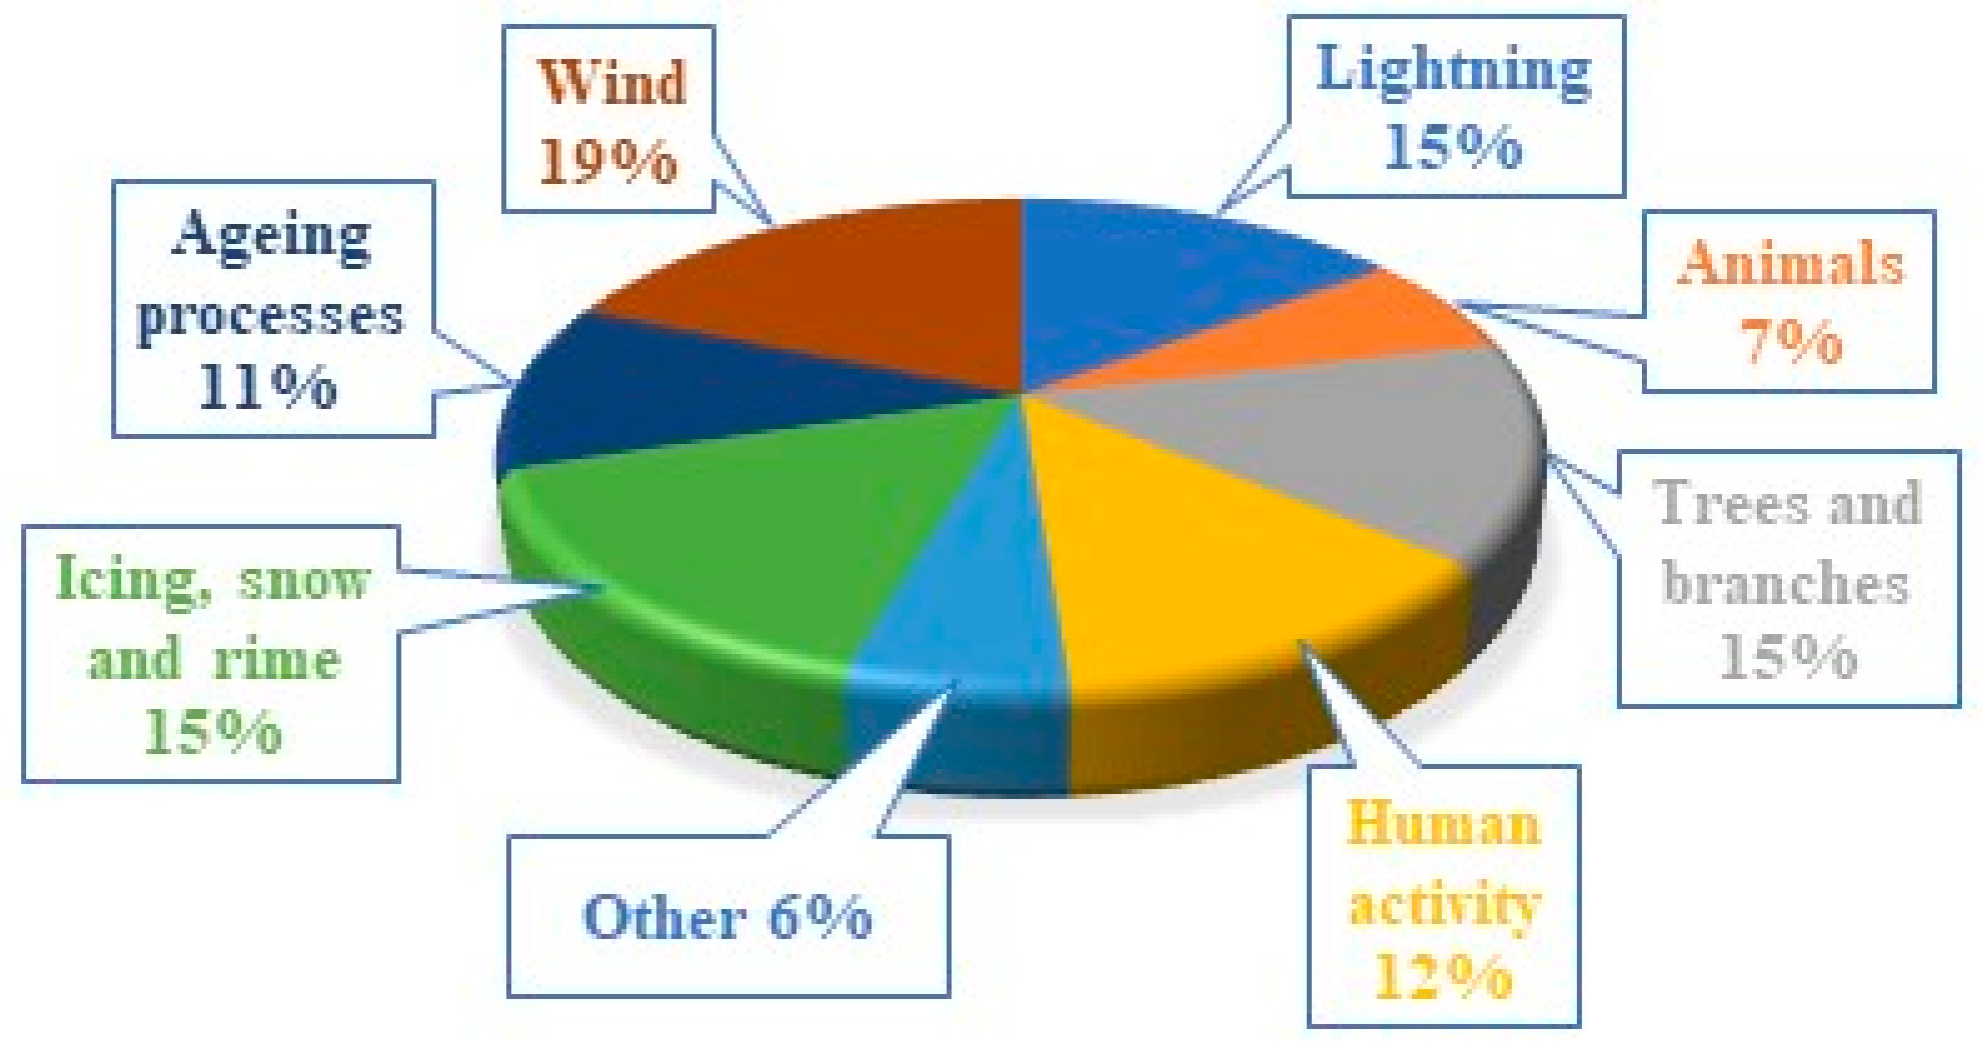
Figure 1. Percentage of factors influencing damage to 110 kV lines according to [96].
Applsci 15 08030 g001
Figure 2. Percentage of the most frequent damages of 110 kV lines according to [16].
Applsci 15 08030 g002
Figure 3. Percentage of factors influencing transformer damage according to [100].
Applsci 15 08030 g003
Figure 4. Percentage of the most common transformer failures by [98,101,102,103].
Applsci 15 08030 g004
Figure 5. Failure rate of transformers about age [112].
Applsci 15 08030 g005
Figure 6. Comparison of transmission line reliability indicators across continents.
Applsci 15 08030 g006
Figure 7. Comparison of reliability indicators of transmission lines with different voltage levels.
Applsci 15 08030 g007
Figure 8. Comparison of HV/HV transformer reliability indices.
Applsci 15 08030 g008
Figure 9. Summary of times needed to repair a transmission line by region.
Applsci 15 08030 g009
Figure 10. Summary of times needed to repair a HV/HV transformer depending on the region.
Applsci 15 08030 g010
Figure 11. Block diagram of the proposed methodology.
Applsci 15 08030 g011
Table 1. Summary of methods used to determine the failure rate and failure removal time.
Method UsedContinentReferences
Empirical formulaEurope[2,3,4,38,39,40,41,43,44,45,46,47,48,59,70,86,87,89,90,91,92,100,110,111,112,116,122,123,124,125,126,127]
Asia[5,8,30,31,44,56,108,110,118,121]
North America[44,50,103,113,128]
Africa[49,71,80,105,118,129]
Australia and Oceania[70,76]
Weibull distributionEurope[11,81]
Asia[50,54]
North America[82]
Markov processesAsia[51,52,53,55,65]
North America[58,62,82]
Australia and Oceania[64]
Poisson distributionAsia[97,99]
North America[98]
Disclaimer/Publisher’s Note: The statements, opinions and data contained in all publications are solely those of the individual author(s) and contributor(s) and not of MDPI and/or the editor(s). MDPI and/or the editor(s) disclaim responsibility for any injury to people or property resulting from any ideas, methods, instructions or products referred to in the content.