Article

Visualization of Distributed Plasticity in Concrete Piles Using OpenSeesPy

by
Juan-Carlos Pantoja
1,
Joaquim Tinoco
1,*,
Jhon Paul Smith-Pardo
2,
Gustavo Boada-Parra
3 and
José Matos
1
1
Department of Civil Engineering, Advanced Production and Intelligent Systems (ARISE), Institute for Sustainability and Innovation in Structural Engineering (ISISE), University of Minho, 4800-058 Guimarães, Portugal
2
Department of Civil and Environmental Engineering, Seattle University, Seattle, WA 98122, USA
3
Departamento de Ingeniería Del Transporte, Territorio y Urbanismo, Universidad Politécnica de Madrid, C/Profesor Aranguren 3, 28040 Madrid, Spain
*
Author to whom correspondence should be addressed.
Appl. Sci. 2025, 15(14), 8004; https://doi.org/10.3390/app15148004
Submission received: 10 June 2025 / Revised: 16 July 2025 / Accepted: 16 July 2025 / Published: 18 July 2025

Abstract

Lumped plasticity models available in commercial software offer a limited resolution of damage distribution along structural members. This study presents an open-source workflow that combines force-based fiber elements in OpenSeesPy with automated 3D post-processing for visualizing distributed plasticity in reinforced concrete piles. A 60 cm diameter pile subjected to monotonic lateral loading is analyzed using both SAP2000’s default plastic hinges and OpenSeesPy fiber sections (Concrete02/Steel02). Although the fiber model incurs a runtime approximately 2.5 times greater, it captures the gradual spread of yielding and deterioration with improved fidelity. The presented workflow includes Python routines for interactive stress–strain visualization, facilitating the identification of critical sections and verification of strain limits. This approach offers a computationally feasible alternative for performance-based analysis with enhanced insight into member-level behavior. Because the entire workflow—from model definition through post-processing—is fully scripted in Python, any change to geometry, materials, or loading can be re-run in seconds, dramatically reducing the time taken to execute sensitivity analyses.

1. Introduction and Background

1.1. Motivation: Limitations of Lumped Hinges in Practice

The seismic design of reinforced concrete (RC) wharf structures commonly adopts simplified nonlinear modeling approaches, with lumped plastic hinges at pile–deck connections and pile bases. These idealizations, accepted by standards such as ASCE 61-14, ASCE 41-17, Eurocode 8, and ACI 318 [1,2,3,4] and design guidelines for pile-supported wharves as POLB, POLA and OCDI [5,6,7], aim to concentrate inelastic behavior within discrete regions for computational efficiency [8]. However, they inherently assume zero-length plasticity zones and neglect critical mechanisms affecting actual seismic performance—particularly the spread of inelasticity and variation in axial load.
Recent studies have underscored the limitations of lumped hinge models to represent damage progression under bidirectional or cyclic loading, underestimating displacements corresponding to the ultimate loads [9]. Also, yield and ultimate deformations are not accurately estimated, in addition to the dependency of plastic hinge locations [10,11]. Furthermore, hinge lengths in these models are typically prescribed through empirical formulas, disregarding axial load fluctuations, the damage progression [12,13], and its diminution due to the confining effect of surrounding soil [14]. Such simplifications may mislocate critical plastic regions and underpredict damage extent, posing risks in the performance of harbor facilities.

1.2. State of the Art in Fiber Modeling and Visualization

More refined finite element analyses (FEAs) have demonstrated that wharf–soil interaction behavior can be accurately assessed using both 2D approaches [15,16,17,18,19] and 3D simulations [20,21,22,23]. However, the time required to develop detailed numerical models, combined with high computational demands and the need for extensive calibration campaigns to achieve accurate results, can be quite restrictive for practical applications.
To address the limitations of both detailed FEAs and simplified lumped plasticity models, distributed plasticity (fiber-based) formulations have gained prominence in the seismic analysis of RC wharf structures. These models discretize cross-sections into concrete and steel fibers, each governed by nonlinear constitutive laws. When implemented within force-based beam–column elements [24,25], they capture the progressive development of inelasticity along member lengths under varying axial forces and bending moments. This is essential for modeling wharf structures, where nonlinear soil–structure interaction, P– δ effects, and vertical inertial forces affect seismic response [13].
Fiber modeling of reinforced concrete pile elements and their connections has been reported in both building and bridge applications, demonstrating good agreement with experimental results in capturing deformation, damage progression, and evaluating repair techniques [12,26,27,28,29,30,31,32].
Recent studies have demonstrated the superior predictive capabilities of fiber models for marine infrastructure. For example, Chiaramonte et al. [33] implemented 2D fiber models to analyze damage-resistant pile-to-wharf connections under both static and dynamic loading, finding that these configurations outperformed conventional detailing in terms of seismic performance. Goel [34] evaluated the in-ground plastic hinge length and found that, for clays, it increases with lower-bound soil properties and decreases with upper-bound values relative to the nominal case. This finding supports the need for conducting separate analyses using different plastic hinge lengths for the two seismic design levels, in order to more realistically estimate displacement capacity at each level. Su et al. [35] conducted detailed 3D seismic simulations of a pile-supported wharf using nonlinear fiber-section beam-column elements for both the deck and piles, coupled with soil macro-elements to capture pile–soil interaction and kinematic effects under liquefaction conditions. More recently, the same author [36] developed a refined 3D OpenSees model incorporating realistic free-field boundary conditions and coupled pile springs to evaluate performance under two seismic hazard levels defined in ASCE 61-14 (Contingency and Design Earthquake levels). Their fiber model results indicated that, even under strong ground shaking, computed pile strains remained well below code-specified limits. In a subsequent study, Su et al. [37] extended the analysis to crane–wharf interaction, concluding that the crane influences the static response of the wharf pile foundation prior to shaking, and this effect carries over into dynamic response during seismic events. Refani and Nagao [11] investigated the effect of corrosion in prestressed concrete (PC) bars on the seismic performance of a pile-supported wharf using fiber sections through the Scientific ToolKit for OpenSees (STKO) [38]. STKO is a graphical pre- and post-processor that facilitates the creation, visualization, and analysis of finite element models using OpenSees, enabling model development and interpretation through an user interface. They concluded that distributed plasticity yields more accurate pushover curves compared to those from idealized concentrated hinge approaches.
Despite the advantages, the adoption of fiber models in routine engineering practice remains limited due to perceived complexity, greater computational demands, and lack of standardized workflows. Fiber-based models are thus often reserved for specialized analyses, where detailed representation of axial–flexural interaction, post-yield behavior, and damage evolution are necessary.
The visualization of fiber model results has also advanced. Tools such as VFO (Visualization for OpenSees) [39] and custom Python-based scripts now allow engineers to extract and display strain distributions, monitor the formation of plastic zones, and assess compliance with performance criteria in design standards. Traditional commercial FEM platforms typically emphasize force and displacement outputs, which may suffice for building and bridge design, but fall short for wharf structures that require tracking material-level strain states. In models relying on lumped hinges, strain-based limit states must be inferred, while solid-element approaches are computationally expensive and often require manual extraction of strain data from critical sections.
The integration of Python with structural analysis platforms has substantially enhanced the flexibility and efficiency of numerical modeling workflows. OpenSeesPy [40], the Python interface to the OpenSees framework [41], leverages Python’s extensive scientific ecosystem to streamline model development, execution, and post-processing. In addition to its built-in constitutive models, OpenSeesPy supports the implementation of user-defined materials, allowing researchers to incorporate advanced material formulations. This integration has led to the development of open-source toolkits that simplify numerical model creation, meshing, load application, and both pre- and post-processing tasks [42,43]. In parallel, more advanced frameworks have emerged, incorporating machine learning techniques and structural optimization capabilities to further expand analytical possibilities [44,45]. This synergy enables the creation of tailored 2D and 3D representations using packages such as matplotlib and pyvista, facilitating intuitive interpretation of fiber response. Moreover, both OpenSeesPy and Python are open-source, promoting accessibility and customization. These capabilities offer a compelling solution for advanced yet practical performance-based assessment of RC wharf structures, bridging the gap between academic rigor and engineering practice.

1.3. Contribution of This Work

The present study addresses lumped plasticity model limitations by developing and applying an open-source, fiber-based seismic model of a typical RC wharf pile. The model is implemented in OpenSeesPy and features 3D nonlinear springs to simulate soil–structure interaction, and fiber-discretized RC sections to capture distributed plasticity. This allows axial–moment interactions and distributed yielding to take place. To aid the interpretation of results, a Python-based post-processing workflow is employed using custom scripts to visualize sectional strains, curvature profiles, and demand-to-capacity ratios.
Since the validation of OpenSeesPy models against experimental data has been successfully presented by many researchers [11,35,36,37,46], the main objective of this paper is to compare numerical modeling platforms—specifically, a fiber-based OpenSeesPy model versus a lumped plasticity model built in SAP2000—highlighting the differences in damage progression. Advantages of the approach include the following:
  • Using OpenSeesPy to integrate full 3D soil–pile interaction with distributed plasticity;
  • Automating result visualization so that fiber strain and curvature demand along the pile length can be plotted;
  • Enables engineers to generate automated sequences for modifying model parameters and instantly obtaining updated stress–strain visualizations, thereby streamlining parametric studies, and design optimization;
  • Benchmarking the OpenSeesPy fiber model against the commercial SAP2000 frame-hinge model of the same pile.
By comparing the results from these models, it is shown how fiber-based analysis can reveal damage progression, overlooked by lumped hinges, and can be used to verify pile strain limits prescribed by design standards such as ASCE 61-14.

2. Modeling Methodology

2.1. Fiber-Based Model of an RC Pile in OpenSeesPy

This study focuses on the nonlinear modeling of a single RC pile representative of those used in pile-supported wharf structures. Following established nonlinear modeling strategies for reinforced concrete [47], the methodology includes the definition of inelastic properties for concrete and steel using uniaxial OpenSeesPy materials Concrete02 and Steel02, respectively. The pile was modeled using a distributed plasticity formulation. The structural member was discretized into multiple forceBeamColumn elements with five Gauss–Lobatto integration points to capture curvature distribution and inelastic behavior. The discretization of fibers in the cross-section, including both longitudinal steel reinforcement and concrete, plays a significant role on the accurate representation of the load-bearing capacity of pile-to-deck connections. A finer and well-distributed fiber discretization improves the representation of stress and strain gradients across the section, especially under inelastic behavior. Inadequate discretization may lead to inaccurate estimation of sectional stiffness, strength, and energy dissipation. Appropriate fiber resolution is essential to capture the interaction between concrete and reinforcement, particularly in regions where inelastic behavior is expected. In this study, cross-sections are discretized using 160 Concrete02 fibers for confined and cover concrete, and 8 Steel02 fibers for longitudinal reinforcement. This level of discretization enables accurate representation of both the elastic response—governed by the uniaxial material models’ initial stiffness—and the progressive stiffness degradation resulting from large load excursions. Material parameter are defined using recommendations by Segura Jr et al. [48] when experimental data are unavailable. Geometric nonlinearity and P-Delta effects are considered in the model by employing forceBeamColumn elements, which inherently capture local second-order effects (P- δ ) through the nonlinear force–deformation behavior at the fiber-section level. Moreover, the geometric transformation P- Δ is assigned to these elements through the Opensees command PDelta, to capture global P-Delta effects.

2.2. Nonlinear Soil–Structure Interaction Springs

Soil–structure interaction (SSI) through spring elements can effectively capture the behavior of maritime structures; however, the definition of spring properties significantly influences the overall system ductility, and neglecting these effects may lead to unconservative results [49,50]. In this study, SSI is modeled using zero-length elements at each node along the embedded portion of the pile to represent depth-varying nonlinear soil springs. Three uniaxial material types are used to capture the restraining effect of the soil:
  • PySimple1 for lateral resistance (p–y behavior);
  • TzSimple1 for axial shaft friction (t–z behavior);
  • QzSimple1 for end-bearing resistance (q–z behavior).
Spring stiffness and ultimate capacities are defined based on recommendations by [46,51,52,53,54,55,56]. Spring spacing is denser near the mudline and coarser at greater depths. All soil springs are connected to pile nodes via equalDOF constraints to ensure force compatibility.

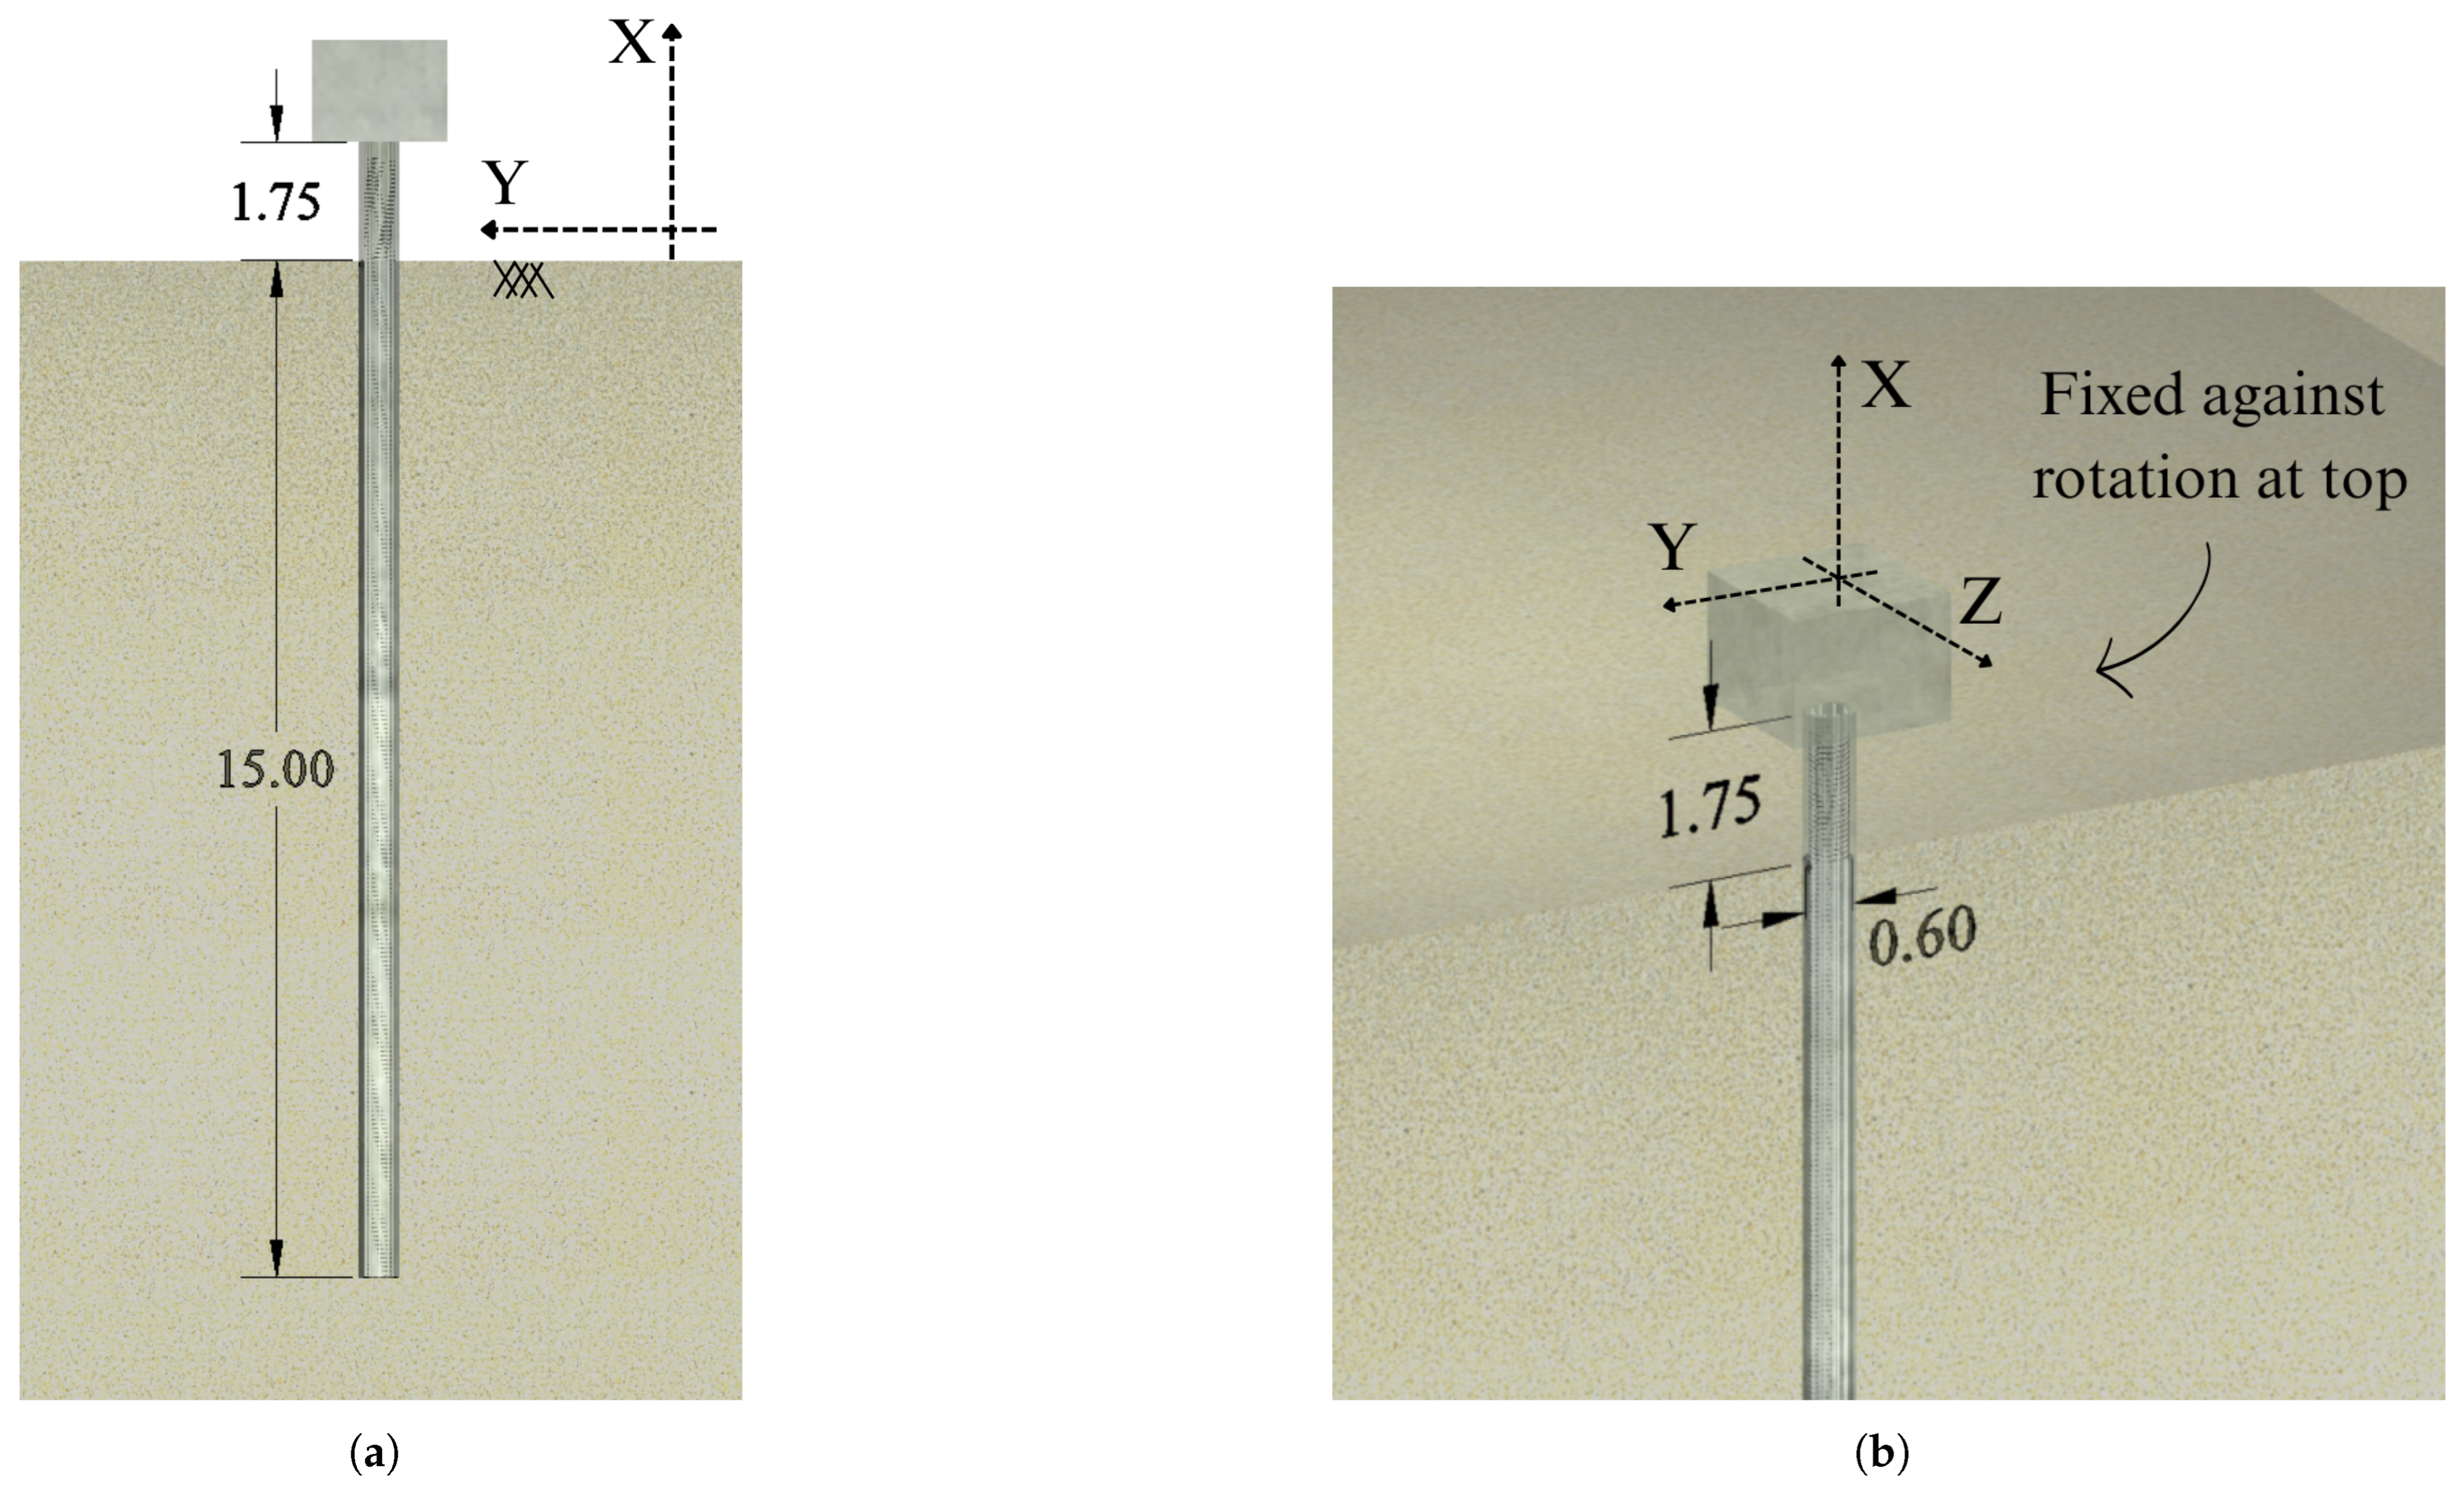
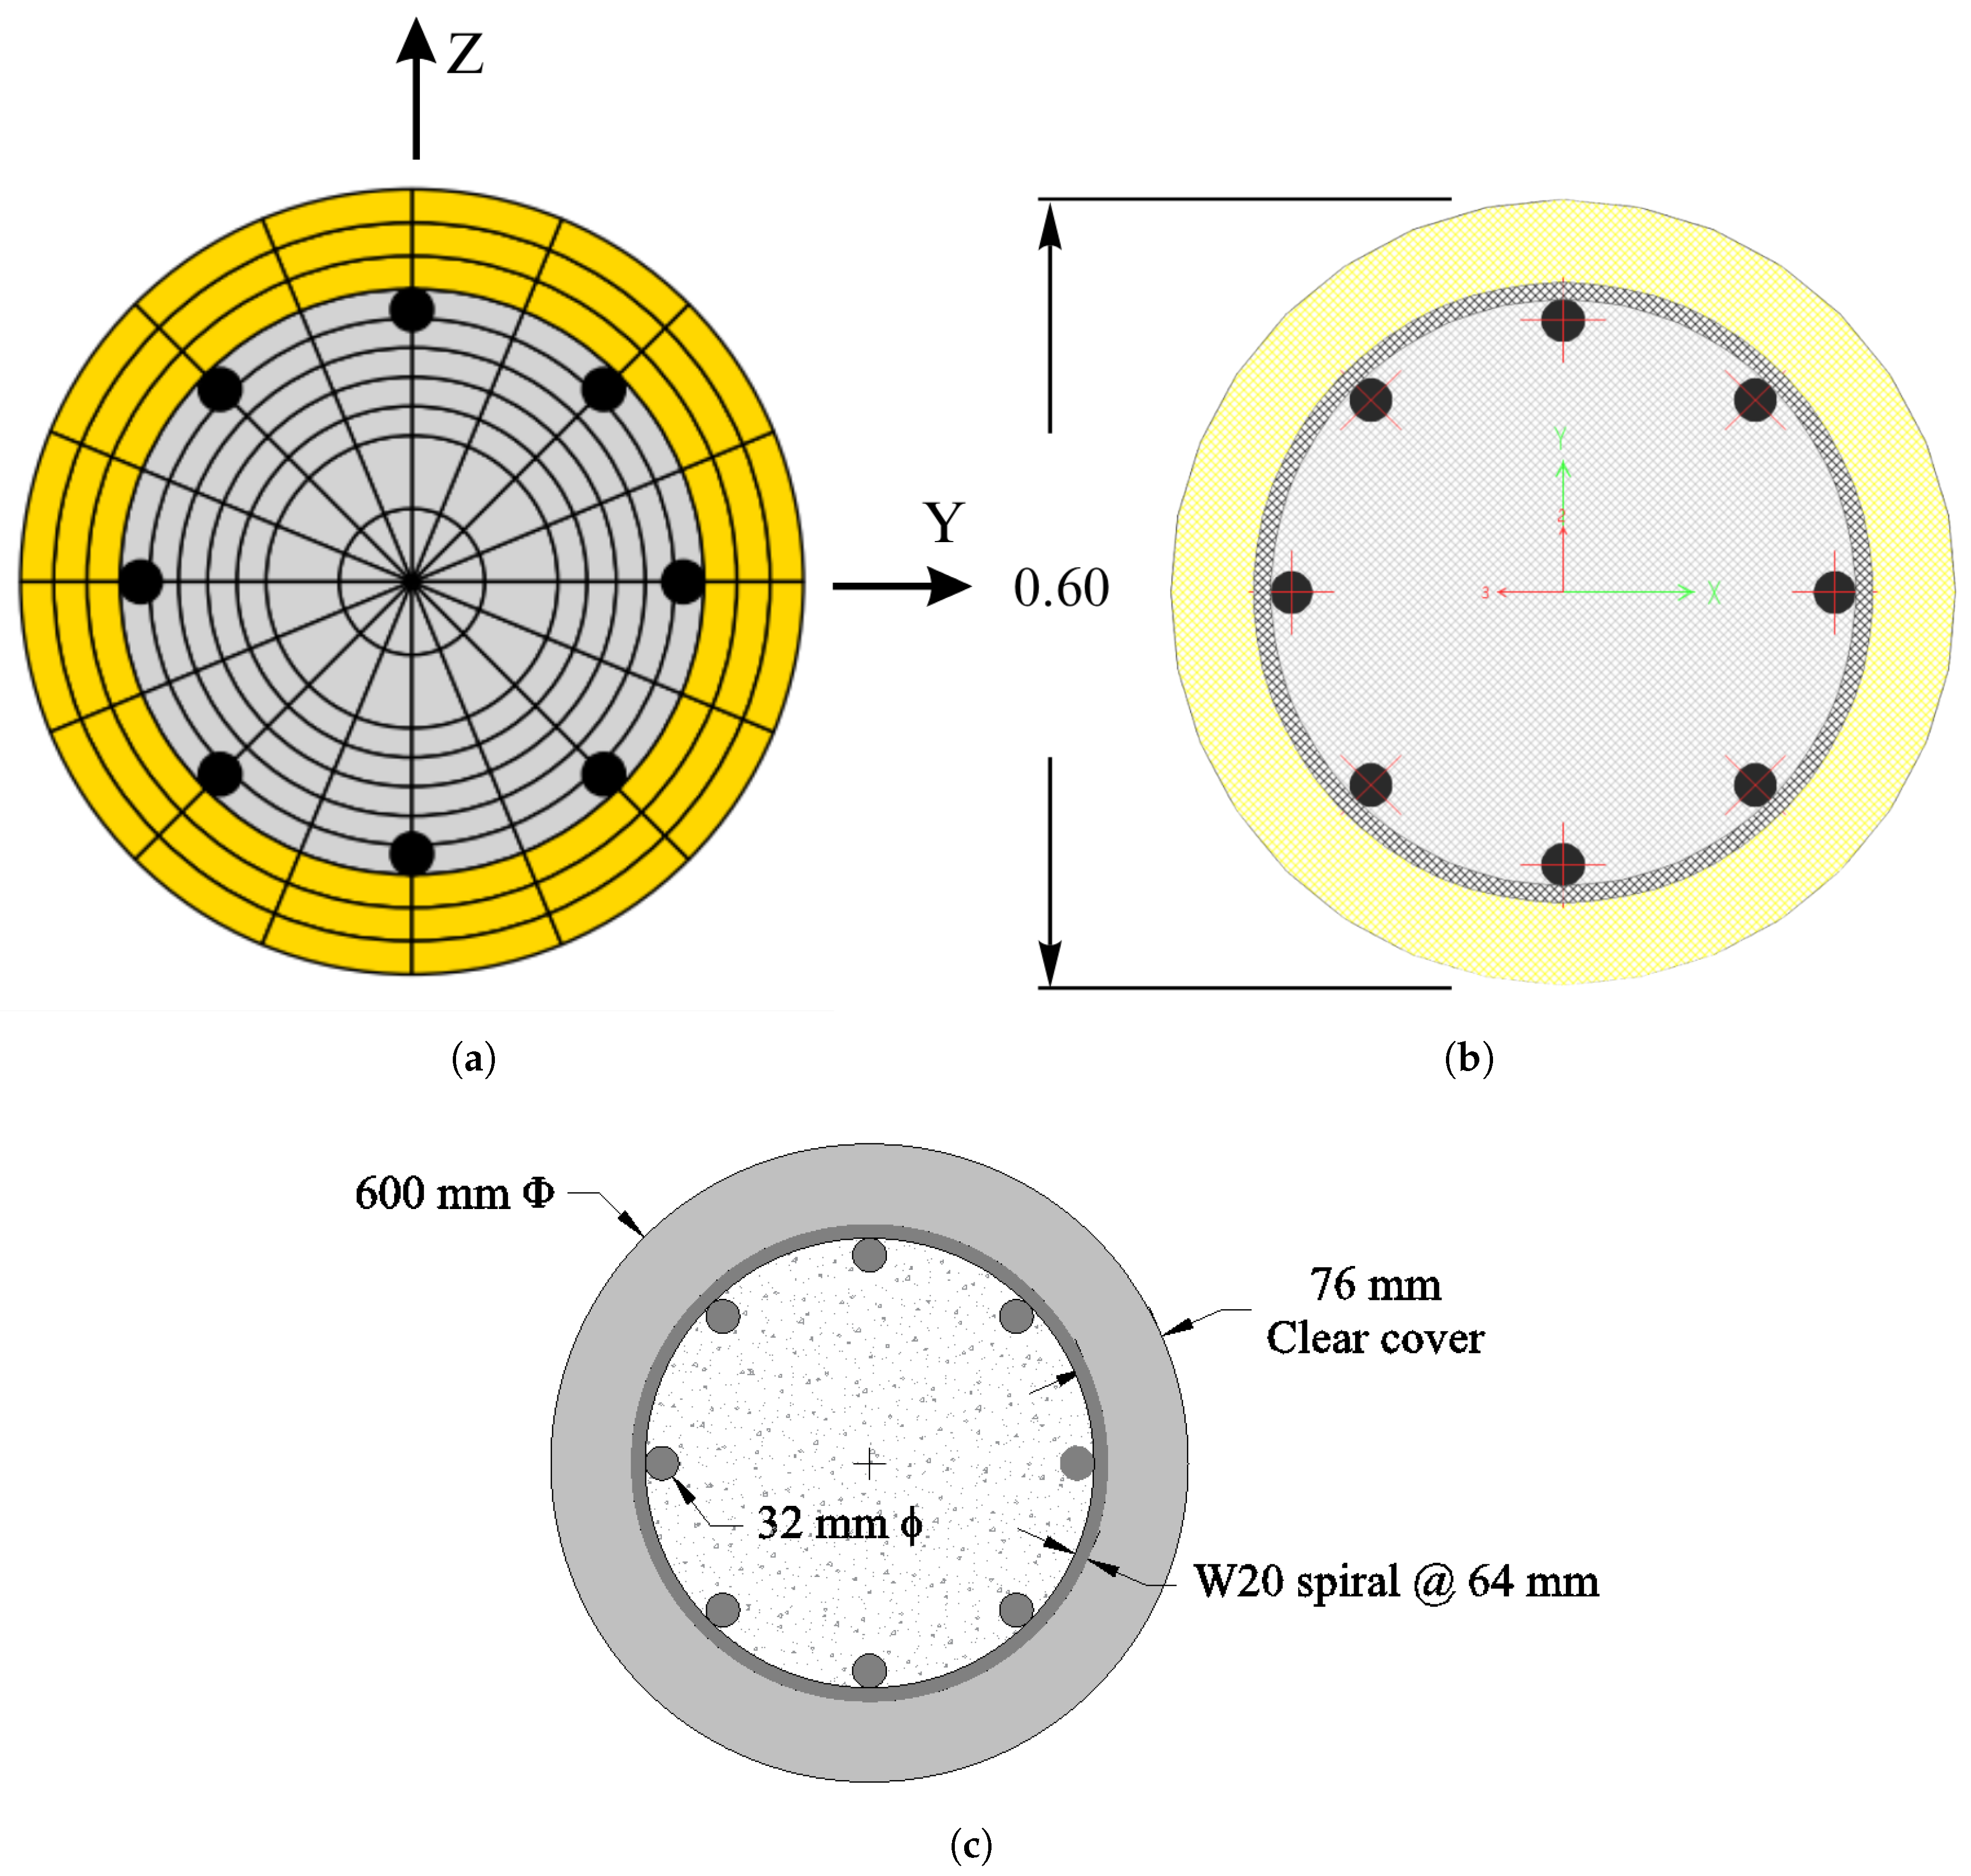
2.3. Pile Geometry, Material Properties, and Loading

Gravity loads are applied first to the pile model, followed by monotonic lateral load at the pile head. The modeled pile has an overall length of 16.75 m and diameter of 60 cm precast concrete as shown in Figure 1.
The pile is prestressed using twelve 15 mm diameter strands with a characteristic tensile strength f p k = 1860 MPa. Confinement is provided by a W20 spiral (Grade 420 MPa yielding strength) at 64 mm pitch with a clear cover of 76 mm. The pile connection consists of eight 32 mm dowel bars, which project into a pile cap. Figure 2 illustrates the cross-sectional details of the precast concrete pile at its connection to the cap beam.
The selected concrete compressive strength is 48 MPa, while the yield strength of the connection reinforcement dowels was taken as 420 MPa, which are representative values used in the design of RC piles in wharf structures. For modeling of concrete materials, the stress–strain proposed by Mander et al. [57] is utilized for both confined and unconfined conditions. Dowel steel bars are modeled using methodology outlined by Park and Paulay [58]. Prestressing strands are not modeled under the premise that inground hinging is undesirable in practice. However, for simplicity and for the sole purpose of comparing results of the two modeling platforms (SAP2000 vs. OpenseesPy), the section in Figure 2 was also used in-ground. Figure 3 illustrates the stress–strain relationships of the pile section materials.
Soil consists of loose sand. The effective unit weight and friction angle are 32 kN/m3 and 33 degrees, respectively. Soil spring spacing for both SAP2000 and OpenseesPy models follows the recommendations of ASCE61-14 [1] for a 60 cm prestressed pile. Parameters to define PySimple1, TzSimple1, and QzSimple1 springs for the OpenseesPy model are computed at each depth below the mudline. For the SAP2000 model, the p-y curves are generated using the same PySimple1 parameters as those used in the OpenseesPy model at four depths. For the upper five pile diameters below the mudline, three p-y curves corresponding to depths 1 m to 3 m are utilized with a spring spacing of 30.5 cm, designated as K1-1, K1-2, and K1-3. Beyond this depth, one additional p-y curve at a 6 m depth is employed with a spring spacing of 61 cm and 1.2 m, referred to as K2 and K3, respectively. T-z and Q-z springs are not considered in the SAP2000 model. Figure 4 illustrates the force–deformation relationships for each soil spring and their distribution along the pile length.

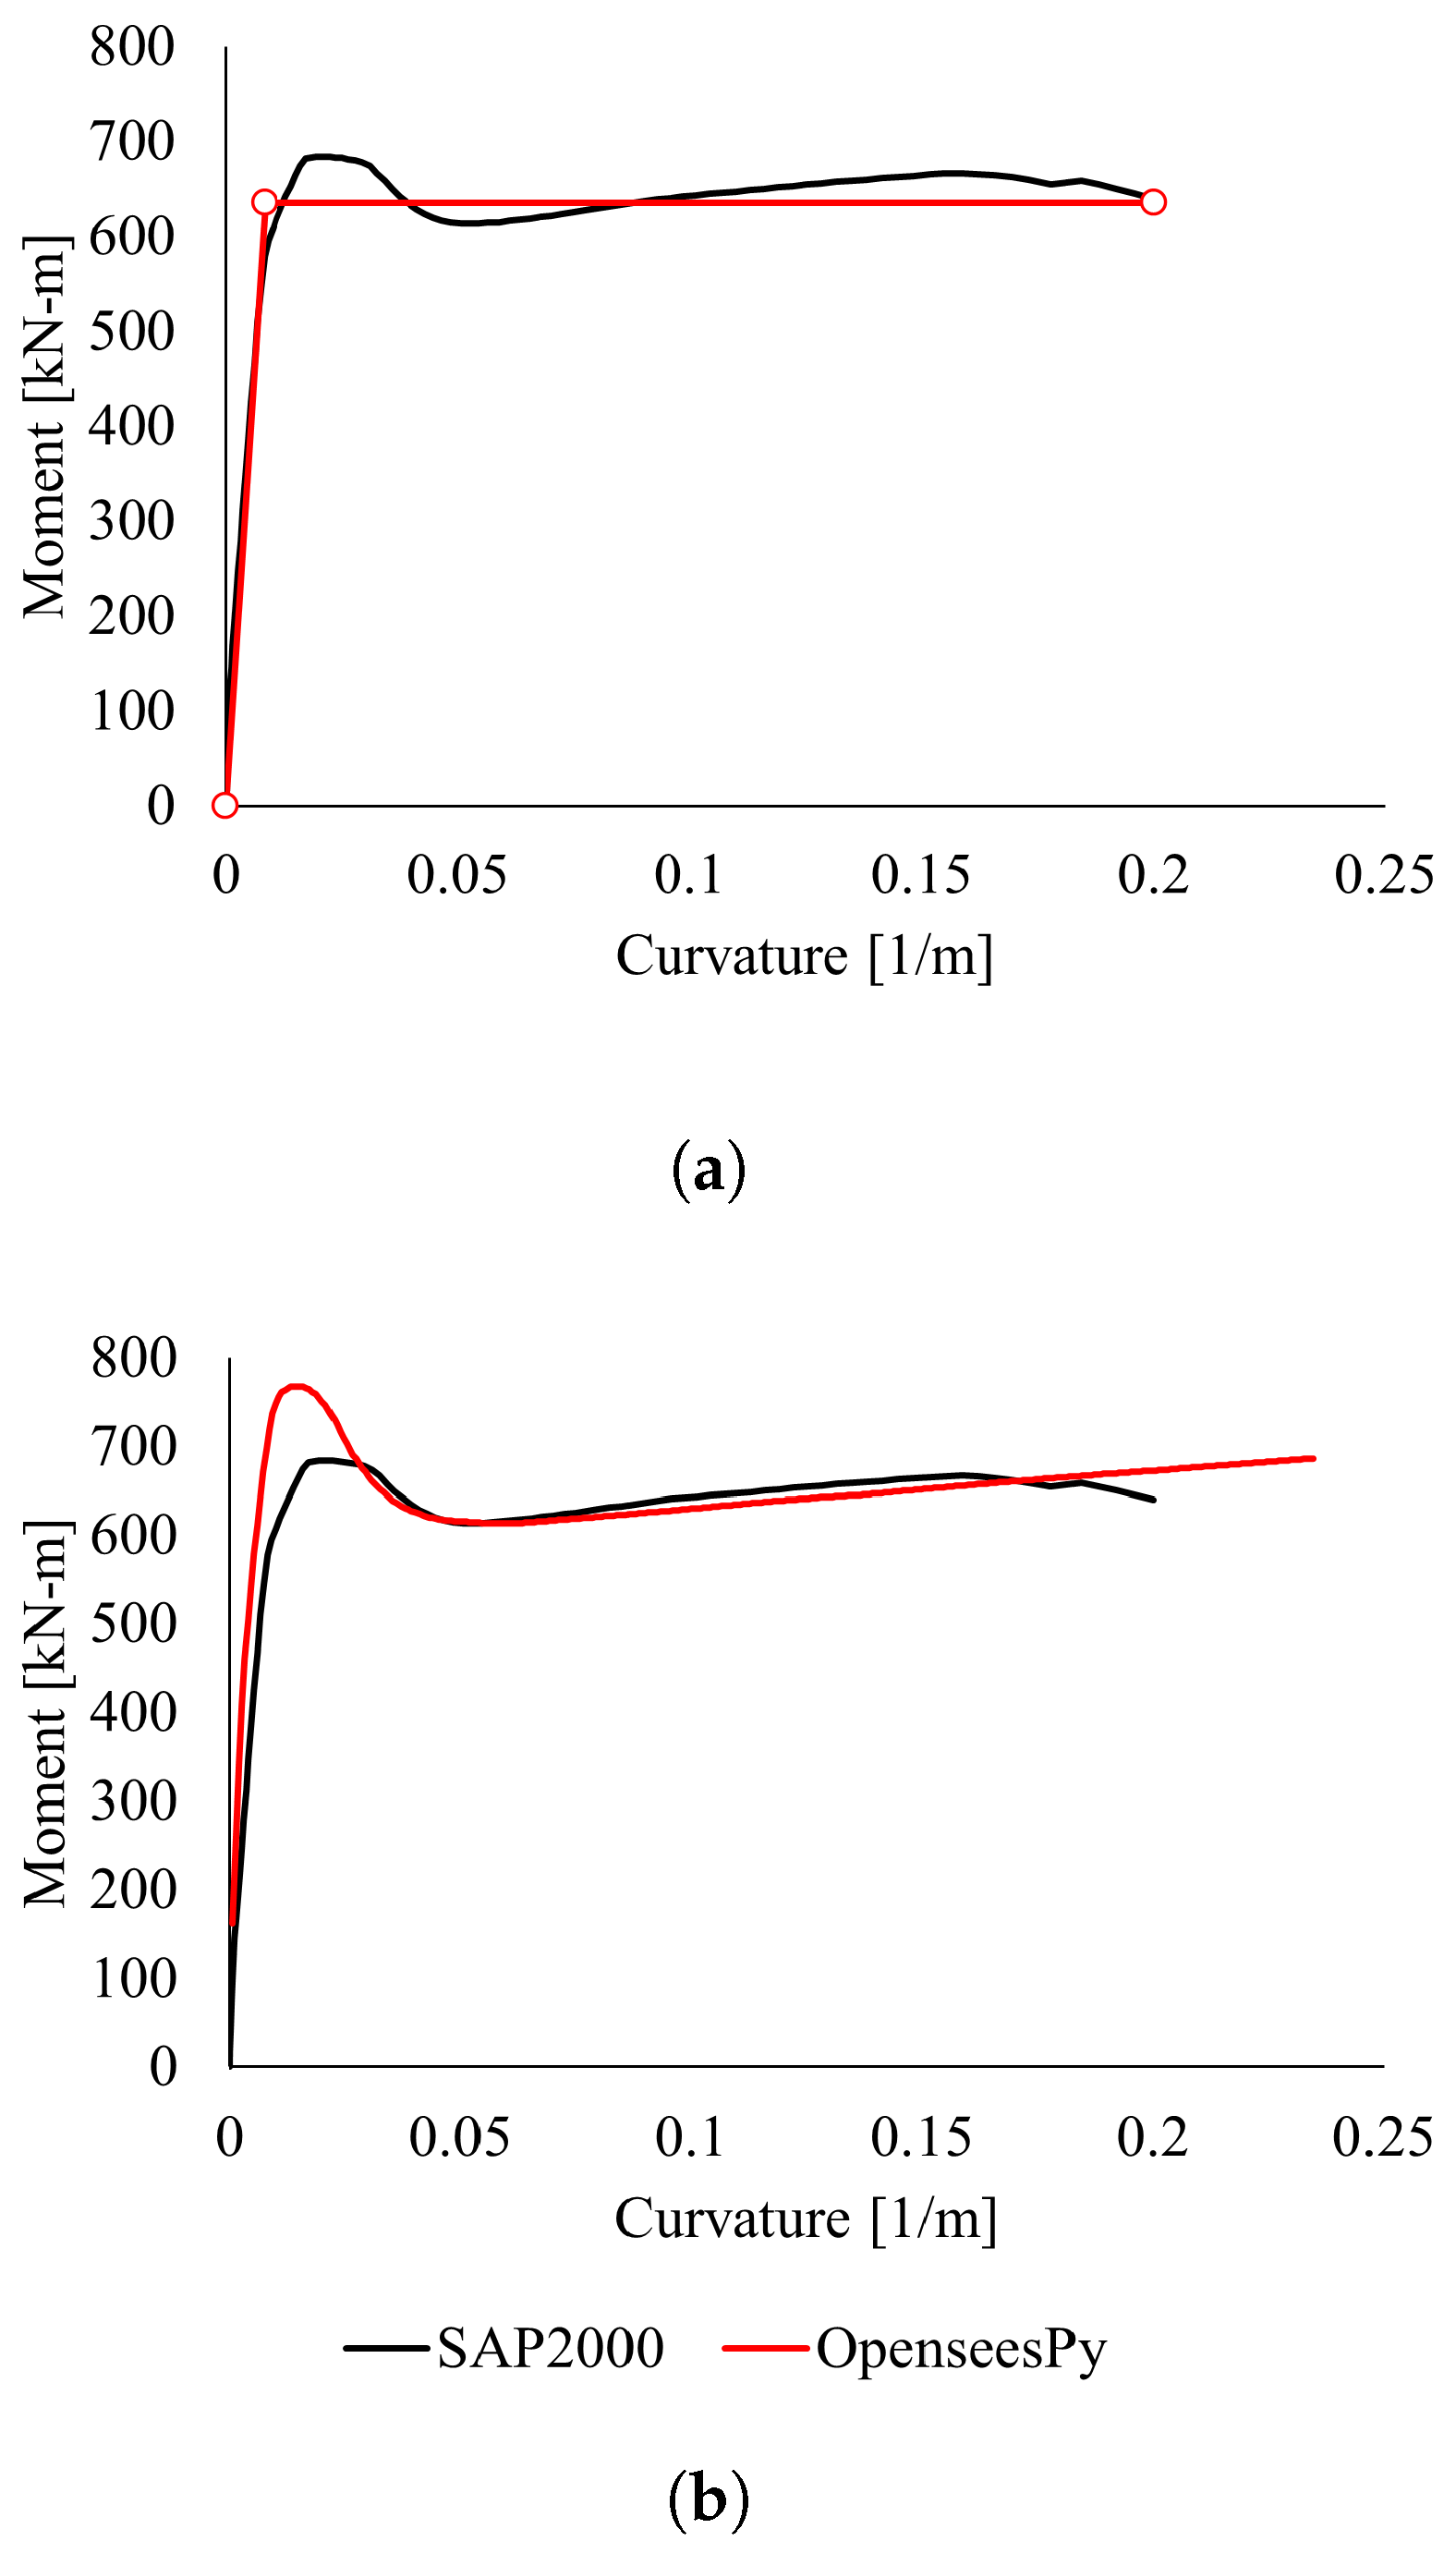
2.4. SAP2000 Plastic Hinge Model for Comparison

The SAP2000 model was constructed using an elastic frame element with nonlinear behavior concentrated in discrete plastic hinges at the pile head and in-ground regions. Plastic hinge lengths were determined in accordance with the provisions of ASCE 61-14 [1], while the moment–curvature relationships were derived from fiber-section analyses within SAP2000 to ensure alignment with material strain-limit criteria used in OpenSeesPy. This approach promotes consistency in deformation capacity assessment across both modeling platforms. Figure 5 presents a comparison of the moment–curvature behavior obtained from SAP2000 and OpenSeesPy cross-section models, alongside the curvature-based plastic hinge definition implemented in SAP2000.

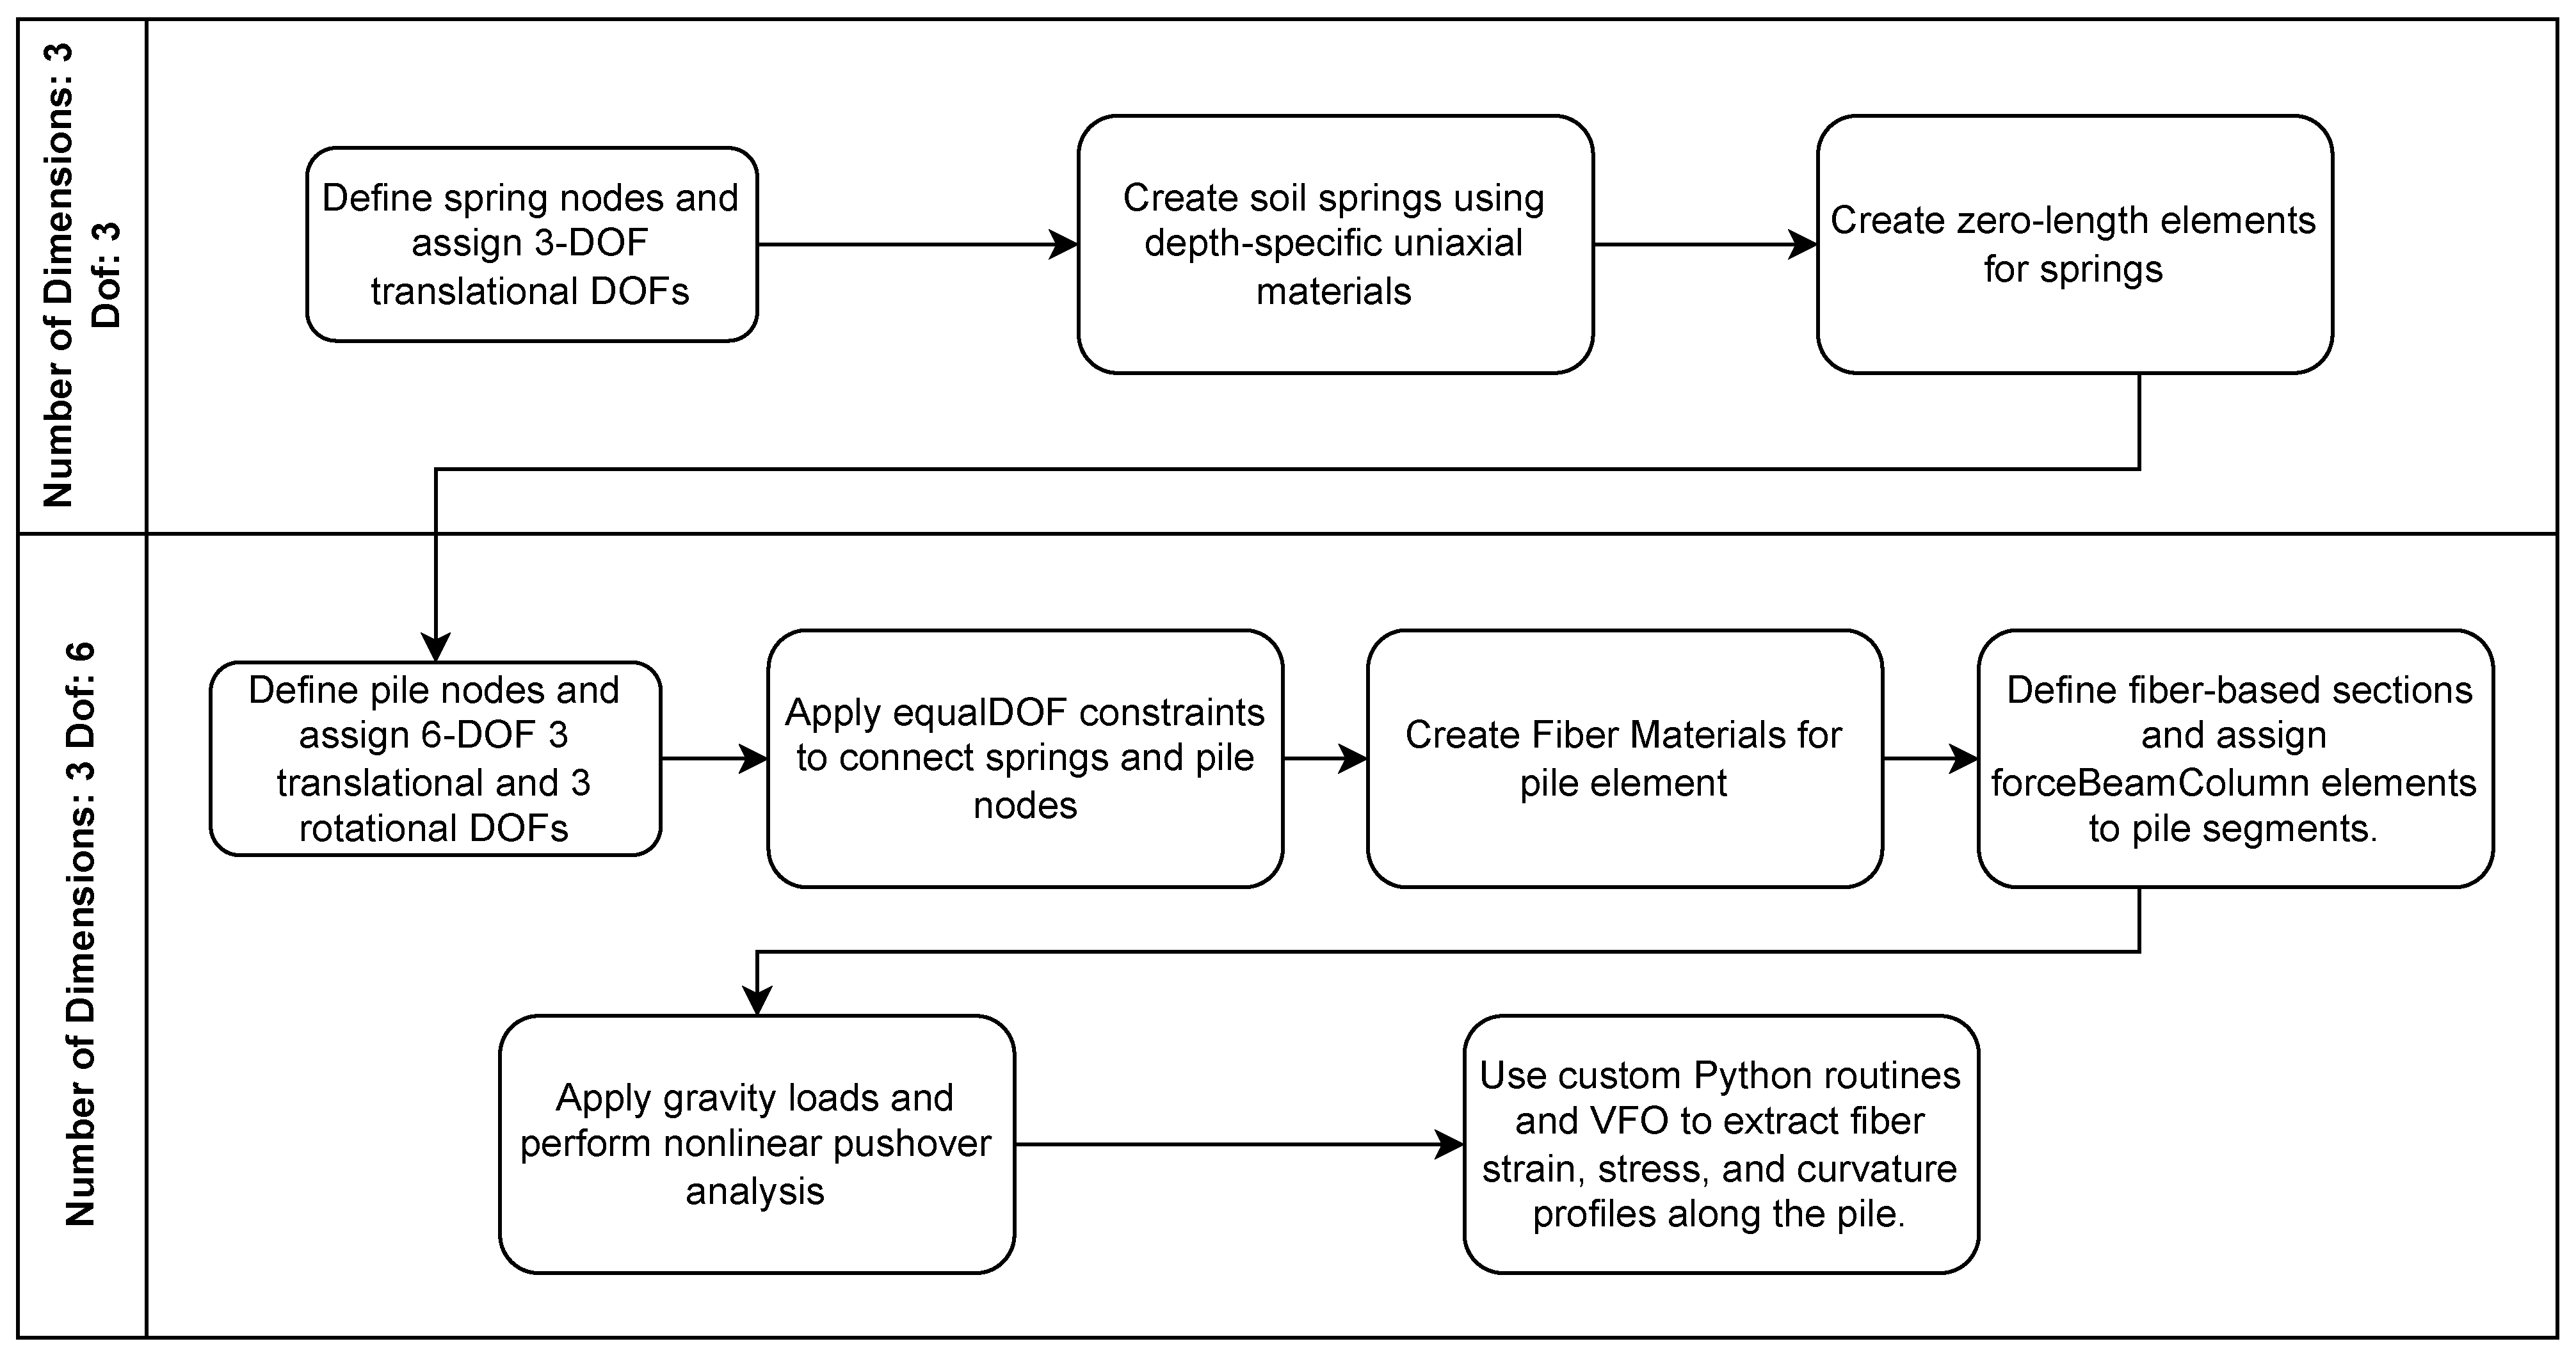
2.5. OpenseesPy Analysis Workflow and Post-Processing

The OpenSeesPy model workflow, which leverages modular Python scripts to ensure versatility, is described in Figure 6.
The modular approach allows for easy adaptation of alternative pile geometries, reinforcement configurations, and soil types. More importantly, visualization scripts based on matplotlib and pyvista allows for generating 2D and 3D plots of strain distribution, enabling rapid interpretation of localized damage and plasticity spread. All analysis steps—model setup, nonlinear analysis, and 2D/3D plotting—are executed through modular Python scripts, allowing rapid batch runs and “what-if” studies with minimal manual intervention.

3. Results and Discussion

Pushover curves from both models are shown in Figure 7. It is observed that the two models exhibit similar initial stiffness, while the displacement at the peak base shear differs by 5.6%. Additionally, the figure illustrates the progression of hinge formation throughout the pile during the pushover analysis, identifying locations where plastic rotations occur.
Leveraging OpenSeesPy’s capability to extract element-level fiber responses, custom Python visualization routines were developed to plot extreme stress and extreme strain distributions for each material type along the pile length (Figure 8). OpenSeesPy defines fiber sections in the local Y and Z axes; in each subplot, solid lines represent strain or stress in the positive local axis direction, while dashed lines indicate responses in the negative direction. This visualization helps to identify critical regions along the pile where material strain demands may exceed code-based limits.
Three-dimensional color-coded plots provide direct insight into the spatial distribution of fiber-level stress and strain responses along the pile. Using OpenSeesPy output and custom Python post-processing tools, strain demands are evaluated against code-prescribed material-specific limit states, enabling the visualization of plastic strain demand-to-capacity ratios along the pile. This distributed plasticity modeling reveals localized strain concentrations and the shifting position of the neutral axis—phenomena that remain obscured under the lumped hinge approach with fixed plastic hinge lengths and rotations.
Figure 9 illustrates the evolution of stress and strain states across the pile’s cross-sections. Plastic regions are readily distinguishable, and the spatial extent of damage progression can be contrasted against the limited regions assumed in traditional lumped plasticity models. In these graphs, the strain limits for unconfined concrete, confined concrete, and reinforcing steel were defined based on three performance levels. At Level 1, the limits were set at 80% of the peak compressive and tensile strains for both unconfined and confined concrete, and at 80% of the yield strain for steel reinforcement. At Level 2, the limits corresponded to 100% of the peak compressive and tensile strains for concrete and the full yield strain for steel. For Level 3, the strain limits were defined using the ultimate compressive and tensile strain capacities of both unconfined and confined concrete, as well as the ultimate strain capacity of the reinforcing steel. Additionally, the limits account for the distinct behavior and capacity of concrete under compression and tension.
To assess structural performance relative to code-defined limit states, maximum and minimum fiber strains are extracted at each cross-section. These results support the verification of design performance objectives, including those required for design standards such as ASCE 61-14. Figure 10 summarizes the strain envelopes along the pile length.
An estimate of the time required for numerical modeling in both SAP2000 and OpenSeesPy is provided in Table 1. The OpenseesPy fiber model required 2.5 × more CPU time as compared to the SAP2000 hinge model, yet it remained within practical limits (pushover in 2.5 s on a standard laptop with 16 GB of memory and Intel Core i7 processor). Although the SAP2000 analysis itself was fast (1.0 s), setting the model up required much more time, and any subsequent change to the pile cross-section or material properties would necessitate significantly additional time for adjustments. In contrast, the initial configuration of the OpenSeesPy model required about 1.5 h more, but provided greater flexibility—allowing rapid and repeatable updates to geometry, section properties, and materials through script-based automation.
Finally, while lumped hinges offer conservative and fast estimates, fiber modeling provides richer insight into damage progression. For critical projects or resilience evaluations, the added computational cost is entirely justified to provide improved behavior characterization.

4. Conclusions

This study presents a practical and extensible fiber-based modeling framework for RC wharf piles, incorporating 3D nonlinear soil–structure interaction and high-fidelity damage tracking. Implementation of OpenSeesPy, offers theoretical rigor with Python-based post-processing to support performance-based design workflows. The key features of the proposed approach can be summarized as follows:
  • The fiber-element formulation enables distributed plasticity and axial–flexural interaction, which lumped hinge models inherently miss.
  • The enhanced nonlinear spring model captures realistic p–y, t–z, and q–z behavior, improving accuracy in structural member demands.
  • Post-processing tools allow for detailed extraction and visualization of strain and stress in each individual fiber, demand/capacity ratios (DCRs) at the material level, and curvature and strain profiles along the pile length.
  • Visualization capabilities make it possible to directly identify plastic hinge formation, reinforcement yielding, and core concrete crushing with spatial resolution and without reliance on interpretations.
OpenSeesPy can be seamlessly integrated into engineering workflows. Pile geometries and material properties defined in commercial platforms such as SAP2000 can be transferred into OpenSeesPy using translation scripts, facilitating interoperability. Moreover, Python’s flexibility enables integration with optimization routines, parametric studies, and automated documentation. This adaptability opens a pathway for future extensions of the proposed workflow to simulate complex systems such as those that use viscoelastic materials governed by polymer chain dynamics or hybrid energy dissipation devices. The open-source nature of both OpenSeesPy and its associated visualization libraries (e.g., matplotlib and pyvista) further enhances the accessibility and practical adoption of the framework in research and professional practice.

5. Data and Code Availability

The input scripts, material definitions, and post-processing Python routines developed in this study are only available upon request at this stage, because they are part of an ongoing Ph.D. research. Interested researchers may contact the corresponding author for specific inquiries or collaboration requests.

Author Contributions

Conceptualization, J.-C.P., J.P.S.-P. and J.T.; Data Curation, J.-C.P.; formal analysis, J.-C.P., J.P.S.-P. and J.T.; funding acquisition, J.-C.P. and J.T.; investigation, J.-C.P. and J.T.; methodology, J.-C.P. and J.T.; resources, J.-C.P. and J.T.; software, J.-C.P.; supervision, J.-C.P., J.P.S.-P., J.M. and J.T.; validation, J.-C.P. and J.T.; visualization, J.-C.P. and G.B.-P.; writing—original draft preparation, J.-C.P., J.P.S.-P., G.B.-P. and J.T.; writing—review and editing, J.-C.P., J.P.S.-P., G.B.-P., J.M. and J.T. All authors have read and agreed to the published version of the manuscript.

Funding

This work was supported by FCT (Fundação para a Ciência e Tecnologia), I.P. by project reference 2023.04374.BDANA, with DOI identifier https://doi.org/10.54499/2023.04374.BDANA attributed to the first author, and CEECINST/00018/2021 attributed to the second author. Also, this work was partly financed by FCT/MCTES through national funds (PIDDAC) under the R&D Unit Institute for Sustainability and Innovation in Structural Engineering (ISISE), under reference UIDB/04029/2020 (https://doi.org/10.54499/UIDB/04029/2020), and under the Associate Laboratory Advanced Production and Intelligent Systems ARISE under reference LA/P/0112/2020.

Institutional Review Board Statement

Not applicable.

Informed Consent Statement

Not applicable.

Data Availability Statement

The datasets presented in this article are not readily available because the data are part of an ongoing research study.

Conflicts of Interest

The authors declare no conflicts of interest.

Abbreviations

The following abbreviations are used in this manuscript:
ASCEAmerican Society of Civil Engineers
DOFDegree of Freedom
DPDiameters of Pile
FEFinite Element
FEAFinite Element Analysis
MLMachine Learning
RCReinforced Concrete
SSISoil–Structure Interaction
STKOScientific ToolKit for OpenSees
VFOVisualization for OpenSees

References

  1. ASCE/COPRI 61-14; Seismic Design of Piers and Wharves. American Society of Civil Engineers: Reston, VA, USA, 2014.
  2. ASCE 41-17; Seismic Evaluation and Retrofit of Existing Buildings. American Society of Civil Engineers: Reston, VA, USA, 2017. [CrossRef]
  3. EN 1998-1-1:2024; Eurocode 8: Design of Structures for Earthquake Resistance—Part 1-1: General Rules and Seismic Action. European Committee for Standardization (CEN): Brussels, Belgium, 2024.
  4. ACI CODE-318-19(22); Building Code Requirements for Structural Concrete and Commentary. American Concrete Institute: Farmington Hills, MI, USA, 2019; Reapproved 2022.
  5. POLB. Port of Long Beach Wharf Design Criteria; Port of Long Beach: Long Beach, CA, USA, 2021. [Google Scholar]
  6. POLA. The Port of Los Angeles Code for Seismic Design, Upgrade and Repair of Container Wharves; Port of Los Angeles: Los Angeles, CA, USA, 2010. [Google Scholar]
  7. OCDI. Technical Standards and Commentaries for Port and Harbour Facilities in Japan; The Overseas Coastal Area Development Institute of Japan: Tokyo, Japan, 2025. [Google Scholar]
  8. Deierlein, G.G.; Reinhorn, A.M.; Willford, M.R. Nonlinear structural analysis for seismic design. NEHRP Seism. Des. Tech. Brief 2010, 4, 1–36. [Google Scholar]
  9. Vafaei, M.; Alih, S.C.; Fallah, A. The accuracy of the lumped plasticity model for estimating nonlinear behavior of reinforced concrete frames under gradually increasing vertical loads. Struct. Concr. 2020, 21, 65–80. [Google Scholar] [CrossRef]
  10. Ilyas, M.; Ahmad, A.; Riaz, A.; Khan, F.A.; Sher, S.; Waseem, M.; Ali, S.Z.; Badrashi, Y.I.; Waqas, H.A.; Seitz, H.; et al. Review of modeling techniques for analysis and assessment of RC beam–column joints subjected to seismic loads. Materials 2022, 15, 7448. [Google Scholar] [CrossRef] [PubMed]
  11. Refani, A.N.; Nagao, T. Simplified Method for Nonlinear Seismic Response Analysis of Corroded Pile-Supported Wharf. Appl. Sci. 2023, 13, 10936. [Google Scholar] [CrossRef]
  12. Izadpanah, M.; Habibi, A.R. New spread plasticity model for reinforced concrete structural elements accounting for both gravity and lateral load effects. J. Struct. Eng. 2018, 144, 04018028. [Google Scholar] [CrossRef]
  13. Cook, D.; Sen, A.; Liel, A.; Basnet, T.; Creagh, A.; Koodiani, H.K.; Berkowitz, R.; Ghannoum, W.; Hortacsu, A.; Kim, I.; et al. ASCE/SEI 41 assessment of reinforced concrete buildings: Benchmarking nonlinear dynamic procedures with empirical damage observations. Earthq. Spectra 2023, 39, 1721–1754. [Google Scholar] [CrossRef]
  14. Abuduweili, Y.; Ma, L.; Shi, K.; Zhu, X. Bearing Capacity and Deformation of Micropiles Considering Plastic Hinge. Buildings 2025, 15, 1168. [Google Scholar] [CrossRef]
  15. Heidary-Torkamani, H.; Bargi, K.; Amirabadi, R. Seismic vulnerability assessment of pile-supported wharves using fragility curves. Struct. Infrastruct. Eng. 2014, 10, 1417–1431. [Google Scholar] [CrossRef]
  16. Deghoul, L.; Gabi, S.; Hamrouni, A. The influence of the soil constitutive models on the seismic analysis of pile-supported wharf structures with batter piles in cut-slope rock dike. Stud. Geotech. Mech. 2020, 42, 191–209. [Google Scholar] [CrossRef]
  17. Boyke, C.; Nagao, T. Seismic Performance Assessment of Pile-Supported Wharfs: 2D Frame Analysis Method Considering Both Inertial and Kinematic Forces. Appl. Sci. 2023, 13, 3629. [Google Scholar] [CrossRef]
  18. Zhao, J.; Cui, C.; Zhang, P.; Wang, K.; Zhao, M. Parameter sensitivity analysis of the seismic response of a piled wharf structure. Buildings 2023, 13, 349. [Google Scholar] [CrossRef]
  19. Plata, R.R.; Lai, C.G.; Cubrinovski, M. Dynamic non-linear soil-structure interaction analyses of a large diameter pile-supported wharf founded on liquefiable soils. Jpn. Geotech. Soc. Spec. Publ. 2024, 10, 495–500. [Google Scholar]
  20. Roth, W.; Dawson, E. Analyzing the seismic performance of wharves, part 2: SSI analysis with non-linear, effective-stress soil models. In Advancing Mitigation Technologies and Disaster Response for Lifeline Systems; American Society of Civil Engineers: Reston, VA, USA, 2003; pp. 395–404. [Google Scholar]
  21. Donahue, M.J.; Dickenson, S.E.; Miller, T.H.; Yim, S.C. Implications of the observed seismic performance of a pile-supported wharf for numerical modeling. Earthq. Spectra 2005, 21, 617–634. [Google Scholar] [CrossRef]
  22. Zacchei, E.; Lyra, P.H.; Stucchi, F.R. Pushover analysis for flexible and semi-flexible pile-supported wharf structures accounting the dynamic magnification factors due to torsional effects. Struct. Concr. 2020, 21, 2669–2688. [Google Scholar] [CrossRef]
  23. Soltani, M.; Amirabadi, R. Seismic vulnerability assessment of pile-supported wharves using fragility surfaces. J. Earthq. Eng. 2022, 26, 7140–7155. [Google Scholar] [CrossRef]
  24. Neuenhofer, A.; Filippou, F.C. Geometrically nonlinear flexibility-based frame finite element. J. Struct. Eng. 1998, 124, 704–711. [Google Scholar] [CrossRef]
  25. Alemdar, B.N.; White, D.W. Displacement, flexibility, and mixed beam–column finite element formulations for distributed plasticity analysis. J. Struct. Eng. 2005, 131, 1811–1819. [Google Scholar] [CrossRef]
  26. Zeng, X.G.; Jiang, S.F.; Xu, X.C.; Huang, H.S. Numerical modeling of earthquake-damaged circular bridge columns repaired using combination of near-surface-mounted BFRP bars with external BFRP sheets jacketing. Materials 2019, 12, 258. [Google Scholar] [CrossRef]
  27. Darmawan, M.F.; Fajar, A.; Satyarno, I.; Awaludin, A.; Yogatama, B.A. Seismic Performance Comparison of Pile Supported Slab Viaduct with PHC Pile and RC Bored Pile in South Part of Java Island. In Proceedings of the 5th International Conference on Sustainable Civil Engineering Structures and Construction Materials; Springer: Singapore, 2020; pp. 719–734. [Google Scholar]
  28. Narinder; Goswami, K.; Bose, S.; Banerjee, A.; Chakraborty, S. ML-Based Surrogate Model for RC Bridge Pier Collapse Fragility Prediction. In Proceedings of 17th Symposium on Earthquake Engineering; Springer: Singapore, 2022; pp. 661–671. [Google Scholar]
  29. Liang, W.; Leng, L.; Tian, H.; Tian, X. Nonlinear numerical simulation of dynamic response of pile site and pile foundation under earthquake. Nonlinear Eng. 2022, 11, 485–493. [Google Scholar] [CrossRef]
  30. Setiawan, A.F.; Santoso, A.K.; Darmawan, M.F.; Adi, A.D.; Ismanti, S. Nonlinear analysis for investigating seismic performance of a spun pile-column of viaduct structure. Civ. Eng. J. 2023, 9, 1561–1578. [Google Scholar] [CrossRef]
  31. Tipsunavee, T.; Arangjelovski, G.; Jongpradist, P. Numerical analysis on effects of soil improvement on pile forces on existing high-rise building. Buildings 2023, 13, 1523. [Google Scholar] [CrossRef]
  32. Çetindemir, O.; Zülfikar, A.C. Numerical validation of fully coupled nonlinear seismic soil–pile–structure interaction. Buildings 2024, 14, 1502. [Google Scholar] [CrossRef]
  33. Chiaramonte, M.M.; Arduino, P.; Lehman, D.E.; Roeder, C.W. Seismic analyses of conventional and improved marginal wharves. Earthq. Eng. Struct. Dyn. 2013, 42, 1435–1450. [Google Scholar] [CrossRef]
  34. Goel, R.K. Evaluation of in-ground plastic-hinge length and depth for piles in marine oil terminals. Earthq. Spectra 2015, 31, 2397–2417. [Google Scholar] [CrossRef]
  35. Su, L.; Lu, J.; Elgamal, A.; Arulmoli, A.K. Seismic performance of a pile-supported wharf: Three-dimensional finite element simulation. Soil Dyn. Earthq. Eng. 2017, 95, 167–179. [Google Scholar] [CrossRef]
  36. Su, L.; Wan, H.P.; Lu, J.; Ling, X.; Elgamal, A.; Arulmoli, A.K. Seismic performance evaluation of a pile-supported wharf system at two seismic hazard levels. Ocean Eng. 2021, 219, 108333. [Google Scholar] [CrossRef]
  37. Su, L.; Zhang, X.; Xie, L.; Zhang, P.; Zhang, A.; Qiu, Z.; Ling, X. Response characteristic of crane-wharf interaction system: Numerical simulation and global sensitivity analysis. Ocean Eng. 2022, 266, 113011. [Google Scholar] [CrossRef]
  38. ASDEA Software Technology. STKO—Scientific ToolKit for OpenSees. Version 4.0.0. 2025. Available online: https://asdea.eu/software/ (accessed on 5 July 2025).
  39. vfo—Visualization for OpenSees. Available online: https://vfo.readthedocs.io/en/latest/ (accessed on 5 February 2025).
  40. Zhu, M.; McKenna, F.; Scott, M.H. OpenSeesPy: Python library for the OpenSees finite element framework. SoftwareX 2018, 7, 6–11. [Google Scholar] [CrossRef]
  41. McKenna, F. OpenSees: A framework for earthquake engineering simulation. Comput. Sci. Eng. 2011, 13, 58–66. [Google Scholar] [CrossRef]
  42. Arroyo, O.; Feliciano, D.; Novoa, D.; Valcárcel, J. opseestools: A Python library to streamline OpenSeesPy workflows. SoftwareX 2024, 27, 101832. [Google Scholar] [CrossRef]
  43. Yan, Y.; Xie, Y. opstool: A Python library for OpenSeesPy analysis automation, streamlined pre-and post-processing, and enhanced data visualization. SoftwareX 2025, 30, 102126. [Google Scholar] [CrossRef]
  44. Solorzano, G.; Plevris, V. An Open-Source Framework for Modeling RC Shear Walls Using Deep Neural Networks. Adv. Civ. Eng. 2023, 2023, 7953869. [Google Scholar] [CrossRef]
  45. Smyl, D. OpenPyStruct: Open-Source Toolkit for Machine Learning-Driven Structural Optimization. engrxiv 2025. [Google Scholar] [CrossRef]
  46. McGann, C.; Arduino, P. Laterally-Loaded Pile Foundation. Available online: https://opensees.berkeley.edu/wiki/index.php/Laterally-Loaded_Pile_Foundation (accessed on 5 February 2025).
  47. Sunil, J.; Kamatchi, P. Nonlinear modelling strategies for seismic performance evaluation of reinforced concrete structures. Mater. Today: Proc. 2022, 65, 503–510. [Google Scholar] [CrossRef]
  48. Segura Jr, C.L.; Sattar, S.; Hariri-Ardebili, M.A. Quantifying material uncertainty in seismic evaluations of reinforced concrete bridge column structures. ACI Struct. J. 2022, 119. [Google Scholar] [CrossRef]
  49. Koronides, M.; Michailides, C.; Onoufriou, T. Nonlinear Soil–Pile–Structure Interaction Behaviour of Marine Jetty Structures. J. Mar. Sci. Eng. 2024, 12, 1153. [Google Scholar] [CrossRef]
  50. Koronides, M.; Michailides, C.; Stylianidis, P.; Onoufriou, T. Numerical Study of the Nonlinear Soil–Pile–Structure Interaction Effects on the Lateral Response of Marine Jetties. J. Mar. Sci. Eng. 2024, 12, 2075. [Google Scholar] [CrossRef]
  51. API. API Recommended Practice 2A-LRFD: Planning, Designing, and Constructing Fixed Offshore Platforms—Load and Resistance Factor Design, 2nd ed.; American Petroleum Institute: Washington, DC, USA, 2019. [Google Scholar]
  52. Mosher, R.L. Load-Transfer Criteria for Numerical Analysis of Axially Loaded Piles in Sand. Part 1: Load-Transfer Criteria; Final Report; US Army Engineer Waterways Experiment Station: Vicksburg, MS, USA, 1984. [Google Scholar]
  53. Kulhawy, F.H. Drilled Shaft Foundations; Springer: Boston, MA, USA, 1991; pp. 537–552. [Google Scholar]
  54. Meyerhof, G.G. Bearing capacity and settlement of pile foundations. J. Geotech. Eng. Div. 1976, 102, 197–228. [Google Scholar] [CrossRef]
  55. Vijivergiya, V. Load-movement characteristics of piles. In Proceedings of the 4th Symp. of Waterway, Port, Coastal and Occean Div., ASCE, Long Beach, CA, USA, 9–11 March 1977; Volume 2, pp. 269–284. [Google Scholar]
  56. Kulhawy, F.H.; Mayne, P.W. Manual on Estimating Soil Properties for Foundation Design; Technical Report; Electric Power Research Institute: Palo Alto, CA, USA; Cornell University: Ithaca, NY, USA, 1990. [Google Scholar]
  57. Mander, J.B.; Priestley, M.J.; Park, R. Theoretical stress-strain model for confined concrete. J. Struct. Eng. 1988, 114, 1804–1826. [Google Scholar] [CrossRef]
  58. Park, R.; Paulay, T. Reinforced Concrete Structures; John Wiley & Sons: New York, NY, USA, 1991. [Google Scholar]
Figure 1. Pile–soil overall geometry configuration: (a) elevation view; (b) isometric view.
Applsci 15 08004 g001
Figure 2. Cross-section modeling approaches for nonlinear analysis of prestressed piles: (a) Fiber-section model developed in OpenSeesPy, representing the location of confined and unconfined concrete fibers along with longitudinal reinforcement. (b) Representation in SAP2000 section modeler. (c) Reinforcement detailing.
Applsci 15 08004 g002
Figure 3. Stress–strain curves for section materials: (a) Unconfined concrete. (b) Confined concrete. (c) Dowel reinforcement.
Applsci 15 08004 g003
Figure 4. Soil modeling: (a) p-y curves along the pile embedment depth; (b) distribution of soil springs through the depth.
Applsci 15 08004 g004aApplsci 15 08004 g004b
Figure 5. Comparison of moment–curvature relationships for the reinforced concrete pile dowel connection: (a) SAP2000-derived moment–curvature curve based on internal fiber-section analysis and ASCE 61-14 plastic hinge definition; (b) OpenSeesPy fiber-section response.
Applsci 15 08004 g005
Figure 6. Workflow for the implementation of the FEM of pile in OpenseesPy.
Applsci 15 08004 g006
Figure 7. Comparison of pushover analysis results for the RC pile: (a) Base shear–displacement curve from the SAP2000 model using lumped plasticity hinges. (b) Deformed shape of the SAP2000 model at the final step of the pushover analysis, showing hinge locations and plastic rotation states. (c) Base shear–displacement curve from the OpenSeesPy model using distributed plasticity with fiber sections. (d) Deformed shape of the OpenSeesPy model at maximum displacement.
Applsci 15 08004 g007
Figure 8. Fiber extreme stress and extreme strain distributions along the pile length: (a) Stress–strain response for bending about Y axis. (b) Stress–strain response for bending about Z axis. Solid blue lines represent positive fiber locations, and dashed red lines indicate negative fiber locations, according to the local coordinate system of the section. Insets show a schematic of the cross-section, with the tracked fiber color coded.
Applsci 15 08004 g008
Figure 9. Three-dimensional distributed plasticity visualization along the pile: (a) Demand/capacity ratios for material strain distribution computed at each fiber location along pile length. (b) Stresses and strains at multiple cross-sections.
Applsci 15 08004 g009
Figure 10. Strain envelopes along pile depth: Maximum and minimum strain values at each cross-section, used to evaluate structural performance levels and compliance with strain-based limit states.
Applsci 15 08004 g010
Table 1. Estimated modeling and post-processing execution time comparison for a laterally loaded pile using SAP2000 vs. OpenSeesPy.
StepSAP2000 (min)OpenSeesPy (min)Comments
Geometry and Section Definition90–120120–180GUI-based input in SAP2000; scripted coordinates and section definitions in OpenSeesPy.
Material and Spring Assignment60–9090–120Materials and springs assigned via dialogs in SAP2000; manually defined in Python.
Load Application and Analysis Setup10–2015–25SAP2000 uses graphical interfaces; OpenSeesPy requires command-based scripting.
Analysis Execution and Post-Processing15–2035–45SAP2000 offers built-in plots; OpenSeesPy requires exporting recorders and plotting via Matplotlib.
Total (approx.)175–250260–370OpenSeesPy takes longer initially but allows automation and full reproducibility.
Disclaimer/Publisher’s Note: The statements, opinions and data contained in all publications are solely those of the individual author(s) and contributor(s) and not of MDPI and/or the editor(s). MDPI and/or the editor(s) disclaim responsibility for any injury to people or property resulting from any ideas, methods, instructions or products referred to in the content.

