Article

Study of Online Testing of Void Defects in AM Components with Grating Laser Ultrasonic Spectrum Method

by
Hengtao Li
1,
Yan Liu
1,
Jinfeng Yang
2,
Qinghua Guo
3,
Zhichao Gan
4 and
Cuixiang Pei
4,*
1
State Key Laboratory of Oil and Gas Equipment, CNPC Tubular Goods Research Institute, Xi’an 710065, China
2
PetroChina Changqing Oilfield Company, Xi’an 710200, China
3
Huanqing Oil Production Plant of Yumen Oilfield, Qingyang 745700, China
4
State Key Laboratory for Strength and Vibration of Mechanical Structures, Shaanxi Engineering Research Center of NDT and Structural Integrity Evaluation, Xi’an Jiaotong University, Xi’an 710049, China
*
Author to whom correspondence should be addressed.
Appl. Sci. 2025, 15(14), 7995; https://doi.org/10.3390/app15147995
Submission received: 9 June 2025 / Revised: 9 July 2025 / Accepted: 16 July 2025 / Published: 17 July 2025
(This article belongs to the Special Issue Industrial Applications of Laser Ultrasonics)

Abstract

Void defects, manifested as distributed porosity, are common in metal additive manufacturing (AM) and can significantly degrade the mechanical performance and reliability of fabricated components. To enable real-time quality control during fabrication, this study proposes a grating laser ultrasonic method for the online evaluation of porosity in AM parts. Based on the theoretical relationship between surface acoustic wave (SAW) velocity and material porosity, a non-contact detection approach is developed, allowing the direct inference of porosity from the measured SAW velocities without requiring knowledge of the exact source–detector distance. Numerical simulations are conducted to analyze SAW propagation under varying porosity conditions and to validate the inversion model. Experimental measurements on aluminum alloy specimens with different porosity levels further confirm the sensitivity of SAW signals to internal voids. The results show consistent waveform and spectral trends between the simulation and experiment, supporting the feasibility of the proposed method for practical applications. Overall, the findings demonstrate the potential of this approach for the accurate online monitoring of void defects in metal AM components.

1. Introduction

Metal additive manufacturing (AM), a disruptive fabrication technology, offers significant advantages in material utilization and manufacturing cycle reduction. It has shown great potential for applications in strategic emerging industries such as aerospace, rail transportation, and biomedical engineering [1]. However, due to the inherent characteristics of the layer-by-layer deposition process and repeated thermal cycling, various types of internal defects are inevitably introduced during fabrication, among which void defects, in the form of gas pores or lack-of-fusion (LOF) cavities, are particularly prevalent [2]. These voids can critically compromise the structural integrity and service life of AM components, and in severe cases, may even lead to catastrophic failures [3]. Therefore, the detection and characterization of void defects during the AM process have become essential for ensuring the quality and reliability of manufactured parts.
Conventional quality assurance in metal AM has predominantly relied on post-process non-destructive testing (NDT) methods. These techniques, commonly termed offline or ex situ inspections, are conducted after the fabrication process to evaluate the structural soundness and reliability of the final component [4]. Representative offline NDT methods include ultrasonic testing (UT) [5,6], radiographic testing (RT) [7,8], eddy current testing (ET) [9,10], and liquid penetrant testing (PT) [11,12]. Each of these techniques offers specific benefits and faces inherent limitations [13,14]. For example, UT is capable of detecting internal defects with considerable penetration depth and sensitivity, but it often necessitates the use of couplants and meticulous surface preparation, thereby reducing its practicality for high-volume or complex part geometries. RT methods, including X-ray imaging and computed tomography, deliver high-resolution visualizations of internal features but are often restricted by high equipment and operational costs, prolonged acquisition times, and strict safety protocols—challenges that become increasingly prominent when inspecting large-scale or dense metallic structures. ET is highly effective for detecting surface and near-surface flaws in conductive materials, though its sensitivity declines with increasing depth and geometric complexity. PT, on the other hand, is a cost-effective technique suitable for identifying surface-breaking discontinuities regardless of material type, but its application is restricted to open-to-surface defects and requires careful surface cleaning and post-inspection processing. Furthermore, a fundamental limitation shared across these offline techniques is their retrospective nature: because they are implemented only after the completion of the build, they cannot support timely process correction. As a result, defect discovery at this stage may lead to substantial material waste, increased rework or scrapping costs, and the inefficient use of manufacturing resources [15].
To address the limitations of offline inspection, extensive research efforts have been directed toward the development of in situ or online defect detection technologies capable of monitoring part quality during the fabrication process itself. These online monitoring approaches enable the identification of defects as they emerge, offering the potential for immediate feedback and process intervention [16]. Generally, online detection methods fall into two major categories: process signature monitoring and real-time non-destructive evaluation. The former involves indirect monitoring through physical indicators such as melt pool dimensions, thermal gradients, spatter activity, and deposition morphology, typically measured via optical, thermal, or acoustic sensors [17,18]. While process signatures may serve as useful proxies for identifying abnormal process conditions, their interpretation often relies on empirical correlations, which are sensitive to parameter variability and lack universal generalizability across different materials and part geometries [19]. In contrast, online NDT methods aim to directly interrogate the evolving material structure during layer-by-layer fabrication, allowing the detection of internal or subsurface defects in real time. Compared to offline techniques, online NDT methods offer critical advantages in terms of immediacy and responsiveness: they enable the dynamic adjustment of processing parameters, timely defect mitigation strategies, and the avoidance of cumulative errors that may compromise final part performance. Among the various online NDT techniques under active investigation, laser-based approaches have demonstrated significant potential due to their non-contact nature and adaptability to the thermally dynamic and often particulate-laden environment of metal AM. In particular, infrared thermography and laser ultrasonics (LU) have gained attention for their applicability in real-time defect detection [20]. While infrared thermography depends on the thermal response of the material surface and enables rapid detection, its depth penetration and sensitivity are inherently limited [21]. In contrast, LU offers a superior penetration capability, allowing for the detection of subsurface and internal defects with a high sensitivity and resolution [22]. As such, LU presents a highly promising solution for the online monitoring of internal defects in metal AM.
LU offers notable advantages such as non-contact operation, high spatial resolution, and excellent accessibility, making it well suited for the harsh and complex conditions commonly encountered in AM processes, including high temperatures and dust-laden atmospheres [23]. Extensive experimental studies have demonstrated the potential of LU in this field, and significant progress has been made in recent years [24,25]. For instance, Stratoudaki et al. [26] applied laser-induced phased array detection combined with full matrix capture and the total focusing method (TFM) to inspect aluminum samples manufactured by SLM. Their approach enabled the detection of defects as small as 0.5 mm located at depths up to 26 mm, demonstrating the high sensitivity and spatial resolution achievable with laser ultrasonic techniques. In a related study, Davis et al. [27] employed LU to inspect flat-bottom hole defects artificially embedded in AlSi12 samples fabricated via selective laser melting (SLM). The defects, with radii of 1 mm and depths ranging from 2 to 20 mm, were successfully detected, and their results were validated against X-ray computed tomography and immersion ultrasonic testing, confirming the feasibility of LU for internal defect evaluation in AM parts. Similarly, Yu et al. [28] utilized surface acoustic waves (SAWs) generated by LU to detect embedded internal holes of varying sizes in Ti-6Al-4V specimens. Their results showed an approximately linear attenuation of surface wave amplitude with increasing pore size and enabled the accurate identification of defects larger than 0.8 mm in both B-scan and C-scan images. However, the conventional LU method based on point- or line-focused sources still face several limitations. In particular, the broadband characteristics of the generated signals can complicate spectral interpretation and make wave velocity extraction challenging, as it requires the precise time-of-flight (TOF) and source-to-detector distance [29]. Furthermore, the relatively low signal-to-noise ratio (SNR) and sensitivity to surface roughness frequently necessitate surface preparation, such as polishing or sandblasting [30], which further hinders the practical implementation of conventional LU in real-time AM process monitoring. In recent years, grating laser ultrasonics have attracted increasing attention as a promising alternative. This technique offers an improved SNR and facilitates more straightforward spectral analysis, allowing the direct extraction of local acoustic velocity without requiring precise knowledge of the source-to-detector distance [31,32]. Pieris et al. [33] demonstrated the effectiveness of grating laser ultrasonics in imaging surface and subsurface defects using SAW velocities, confirming its potential for defect evaluation in AM components. Nevertheless, existing research on grating laser ultrasonics in the context of AM remains limited, particularly regarding the evaluation of porosity or void-type defects.
In this work, a grating laser ultrasonic method is proposed for the non-contact evaluation of porosity in metal AM components, with a focus on establishing the relationship between SAW velocity and porosity level. Benefiting from its remote sensing capability and high spatial resolution, the proposed method is well suited for online testing during the AM process. Numerical simulations and laser ultrasonic experiments are conducted to validate the theoretical model and assess the feasibility and effectiveness of the proposed method for defect detection. The remainder of this paper is organized as follows: Section 2 presents the theoretical framework and measurement methodology; Section 3 describes the simulation and experimental setups along with the analysis of their results; and Section 4 summarizes the conclusions and discusses future perspectives.

2. Methodology

SAWs are elastic waves that propagate along the surface of a solid medium and decay exponentially with depth. They arise from the complex interaction and superposition of bulk waves (longitudinal and shear waves), with their velocity being primarily governed by the shear wave component due to its dominant contribution to surface displacement. The shear wave velocity c S , in turn, is determined by the relationship between the effective elastic modulus and the density of the material:
c S = E 2 ρ 1 + ν
where E , ρ , and ν denote the elastic modulus, density, and Poisson’s ratio of the material, respectively.
For an isotropic and homogeneous elastic half-space, the classical SAW velocity c R 0 can be approximated by the following [34]:
c R 0 = 0.87 + 1.12 ν 1 + ν c S = 0.87 + 1.12 ν 1 + ν E 2 ρ ( 1 + ν )
Porosity, as a structural characteristic, affects both the elastic modulus and the density of the material. As the porosity increases, more void space is introduced within the material matrix, thereby reducing the overall stiffness and mass per unit volume. Consequently, the acoustic wave velocity, including the SAW velocity, is diminished. The relationship between porosity and effective density ρ P can be modeled as follows:
ρ P = ρ 0 ( 1 P )
where ρ 0 is the density of the fully dense matrix material, and P is the volumetric porosity of the material.
To account for the effect of porosity on the elastic modulus, several micromechanical models have been developed. In this study, we adopt a simplified theoretical model based on the following assumptions: the matrix material is isotropic, homogeneous, and continuous; the pores are idealized as rigid spherical voids of radius; and the inter-pore distance is sufficiently large to neglect ultrasonic wave interactions between pores. Under these conditions, the effective elastic modulus E P can be approximated by the following [35]:
E P = E 0 ( 1 a P )
where E 0 is the elastic modulus of the dense matrix material, and a is a material-dependent constant reflecting the sensitivity of modulus reduction to porosity. In this study, a is taken as 2.5.
By combining Equations (2)–(4), the dependence of the SAW velocity c R 0 on porosity P can be derived:
c R 0 = 0.87 + 1.12 ν 1 + ν E 0 ( 1 a P ) 2 ρ 0 ( 1 + ν ) ( 1 P ) = ξ × 1 a P 1 P
where ξ is a constant that encapsulates the intrinsic material parameters of the fully dense matrix, including the elastic modulus, density, and Poisson’s ratio.
As shown in Figure 1, a pulsed grating laser source is directly illuminated onto the surface of the AM specimen, inducing narrowband SAWs with a fixed wavelength λ s propagating in opposite directions. A detection probe is positioned in close proximity to the laser excitation region to acquire the SAW signal in real time. The received signal is subjected to frequency domain analysis using the fast Fourier transform (FFT), enabling the extraction of its central frequency f . Based on the fundamental wave relation, the SAW velocity c R 1 is calculated as follows:
c R 1 = λ s × f
This measurement strategy offers several key advantages: First, it is entirely non-contact in nature, relying on optical excitation and detection. Second, since the velocity estimation depends solely on the wavelength and frequency of the local SAW field, and not on the precise spatial separation between the excitation and detection points, the method exhibits strong robustness and high repeatability. These characteristics simplify the experimental setup and alignment procedures and make the technique particularly well suited for integration into online defect detection systems during the AM process. Finally, by comparing the measured SAW velocity c R 1 with the theoretical curve described in Equation (5), the corresponding porosity P of the specimen can be inferred.

3. Numerical Simulations and Experiment Validation

3.1. Theoretical Basis for Laser Ultrasonics Generation

To investigate the interaction between laser-generated SAWs and the porosity in metal AM components, it is essential to establish the theoretical basis for thermoelastic wave generation under grating laser excitation. In laser ultrasonics, when a pulsed laser irradiates the surface of a solid at an energy density below the material’s melting threshold, a rapid and spatially non-uniform temperature field is induced due to the partial absorption of optical energy. The resulting thermoelastic expansion generates elastic waves.
In this study, a two-dimensional simulation model is developed in the x-z plane, where the laser source is applied along the top surface of the specimen. The transient thermal response induced by laser absorption is governed by the heat conduction equation:
κ 2 T ρ c T ˙ = 0
where T is the temperature vector, κ is the thermal conductivity, ρ is the material density, and c is the specific heat capacity. Since the laser energy is absorbed at the material surface, the heat input is treated as a surface heat flux rather than a volumetric heat source. The boundary condition at the laser-irradiated surface is therefore defined as follows:
n T T = q s ( x , t ) κ
where n denotes the outward surface normal vector and q s ( x ,   t ) represents the pulsed laser heat flux. For a pulsed laser, this surface heat input can be modeled as a separable function in space and time:
q s ( x , t ) = A I 0 f ( x ) g ( t )
where A is the optical absorptivity of the material surface, I 0 is the peak laser intensity, and f   ( x ) , g   ( t ) are the spatial and temporal distributions of the laser pulse, respectively.
For the grating laser source used in this study, the spatial and temporal distributions can be defined by the following:
f ( x ) = exp ( x x 0 ) 2 / 2 a 0 2 ( 1 cos ( 2 π x / w ) ) / 2 g ( t ) = 8 t 3 t 0 3 exp 2 t 2 t 0 2
here, x 0 is the center position of the laser source, a 0 is the half-irradiation width of the grating laser source, w is the grating line spacing, and t 0 is the characteristic rise time of the laser pulse.
As the temperature field evolves, localized thermal expansion induces internal stresses that excite elastic waves in the surrounding medium. According to thermoelastic theory, the displacement field u   ( x ,   z ,   t ) satisfies the following governing equation:
ρ u ¨ = μ 2 u + ( λ + μ ) ( u ) α ( 3 λ + 2 μ ) T
where λ and μ are the Lamé constants, and the third term on the right-hand side represents the thermal driving force due to temperature gradients.

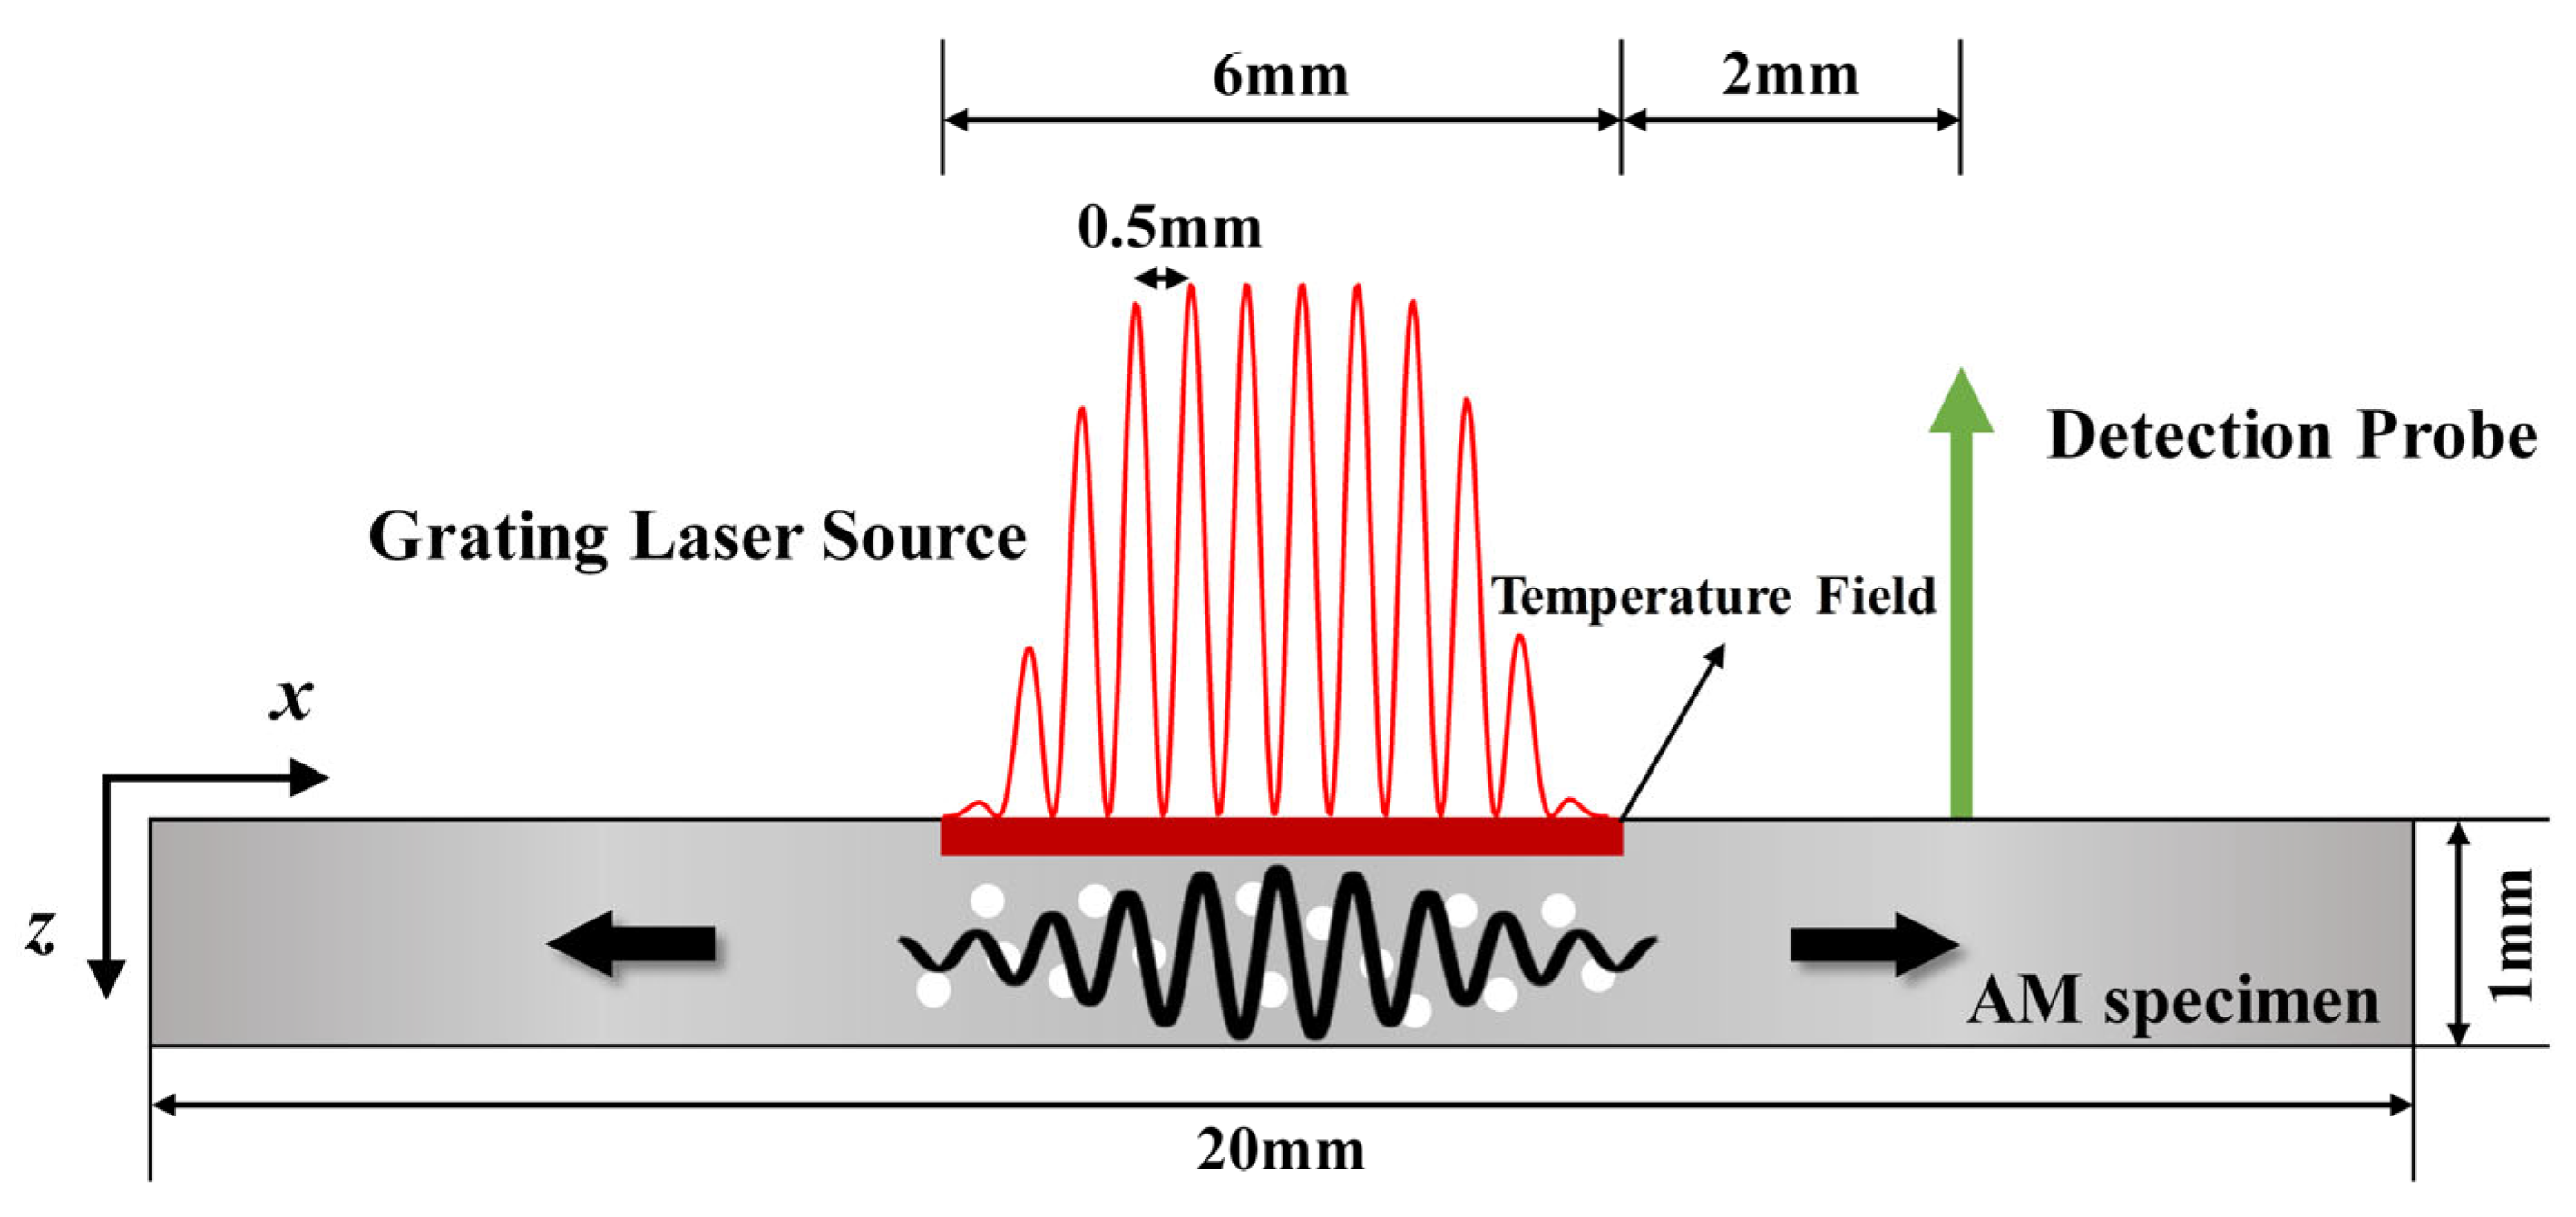
3.2. Finite Element Simulation Model

Building upon the theoretical framework described in Section 3.1, a two-dimensional finite element model of the AM component was developed using a self-written simulation program, as illustrated in Figure 2. The model measures 20 mm in length and 1 mm in height, with aluminum alloy specified as the base material; its corresponding thermal and physical properties are provided in Table 1. To ensure a sufficient resolution of the wave characteristics, the spatial mesh size was set to 5 μm, and the time step was fixed at 0.1 ns. The total simulation duration was 5 μs to capture the complete wave evolution and interaction with defects.
To realistically emulate the internal void defects that are frequently observed in metal AM, multiple circular pores were introduced into the model domain. These voids were randomly distributed using a stochastic function, ensuring variability in both spatial arrangement and defect quantity. The diameters of the individual pores ranged from 20 μm to 100 μm, based on the defect characterizations reported in the literature [24,36,37], ensuring consistency with realistic porosity scales encountered in metal AM process. This allowed for the investigation of different porosity levels and their effects on wave propagation. In the numerical model, a grating-patterned laser source, consisting of 12 lines with a 0.5 mm period (totaling 6 mm in length), was applied to the top surface to induce localized thermoelastic expansion and generate SAWs with a fixed wavelength λ s of 0.5 mm. The resulting transient thermal response was confined to a narrow region (6 mm × 0.1 mm) adjacent to the laser source. To minimize boundary reflections, low-reflecting conditions were imposed on the bottom and lateral boundaries. A detection probe was placed 2 mm to the right of the laser source to capture the generated SAW signal.

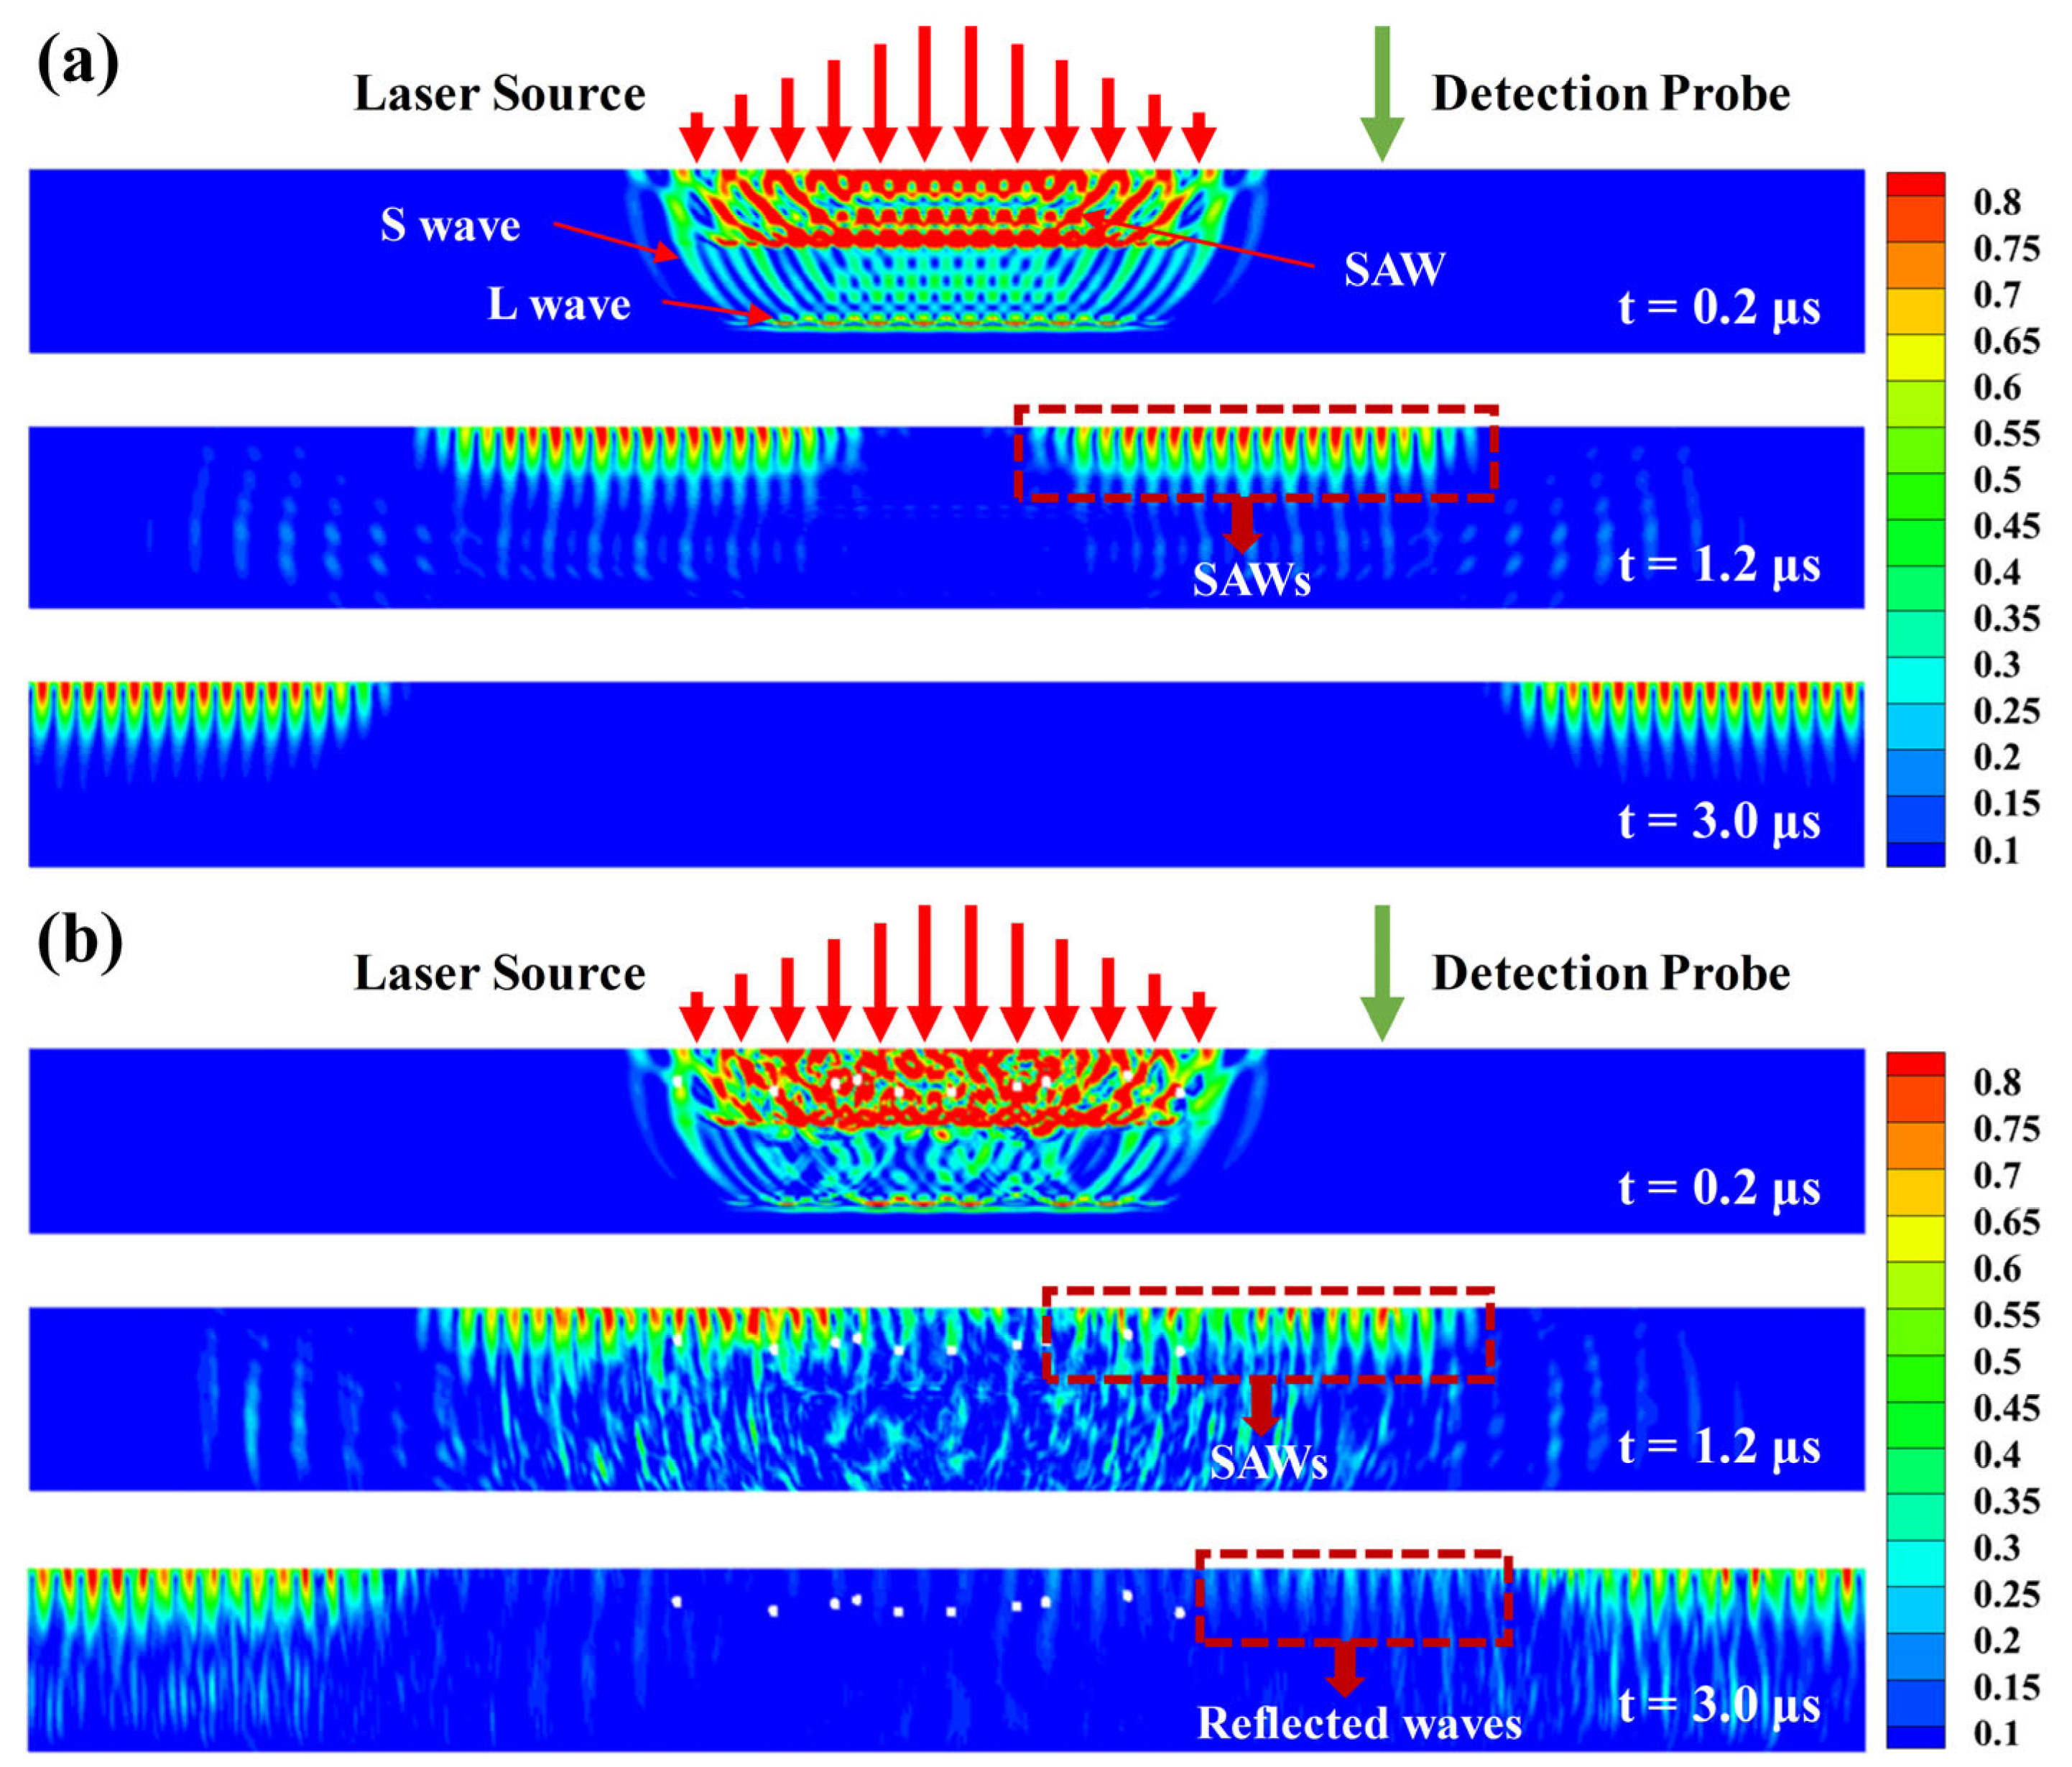
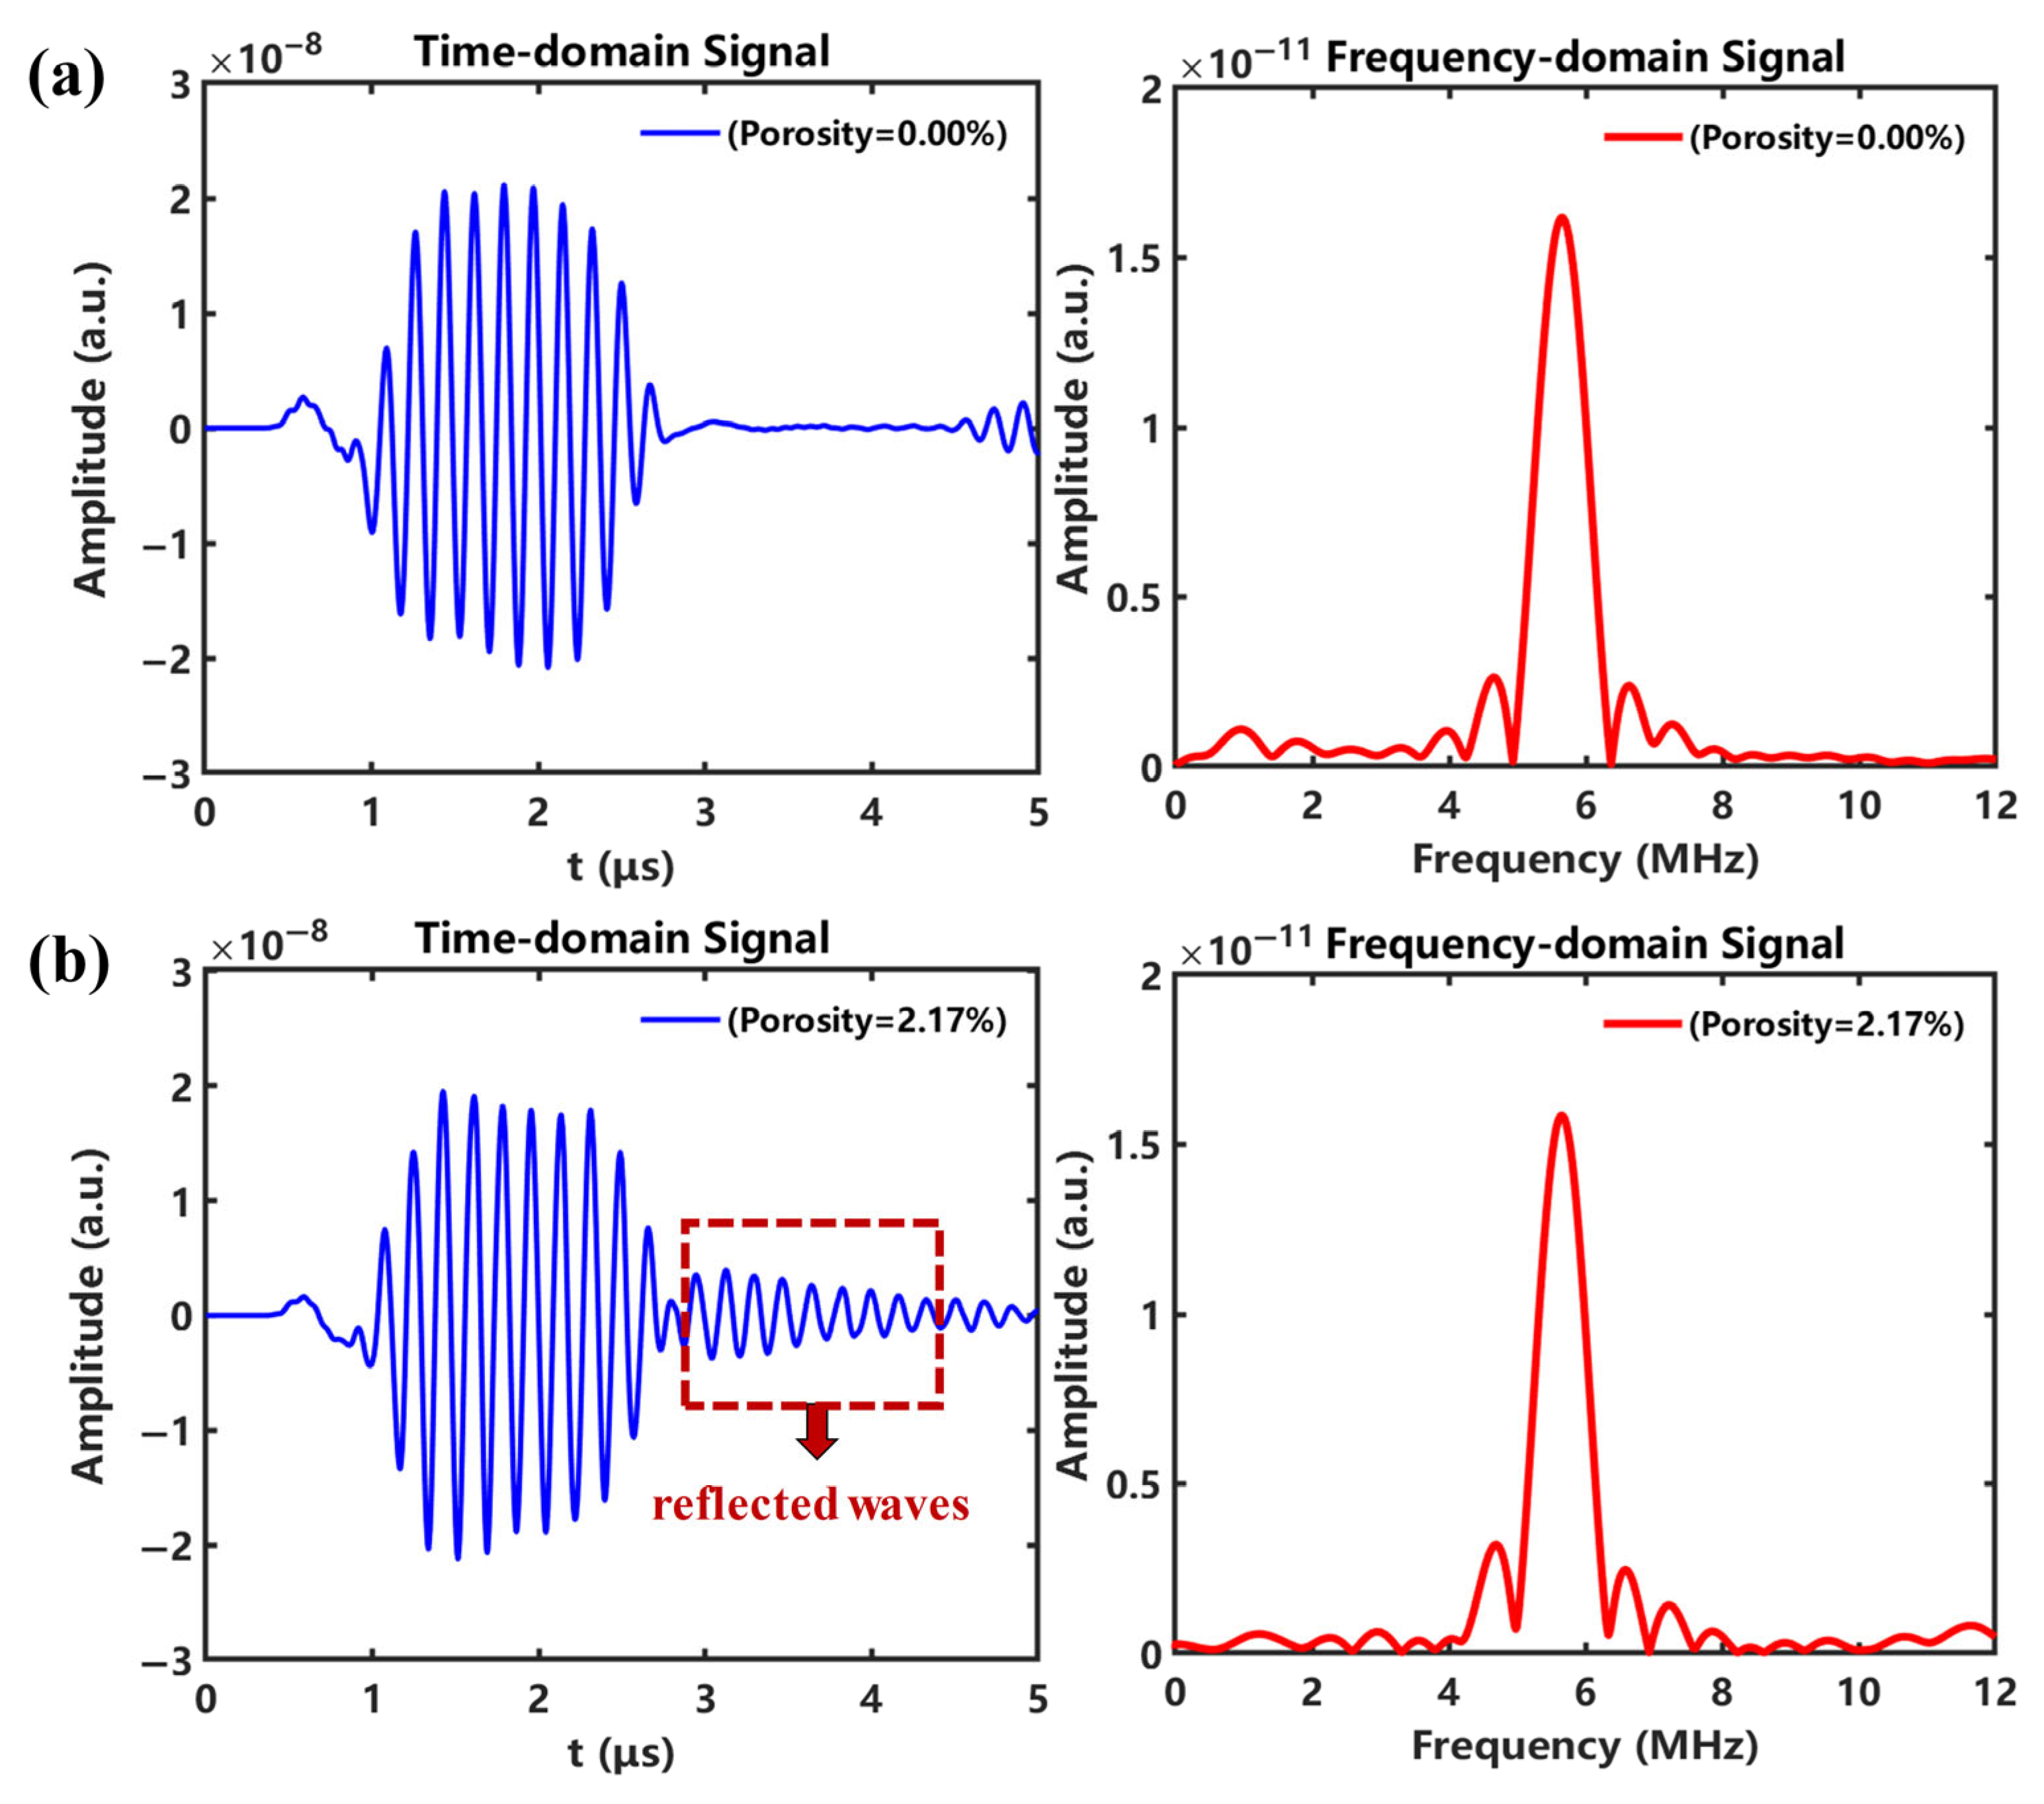
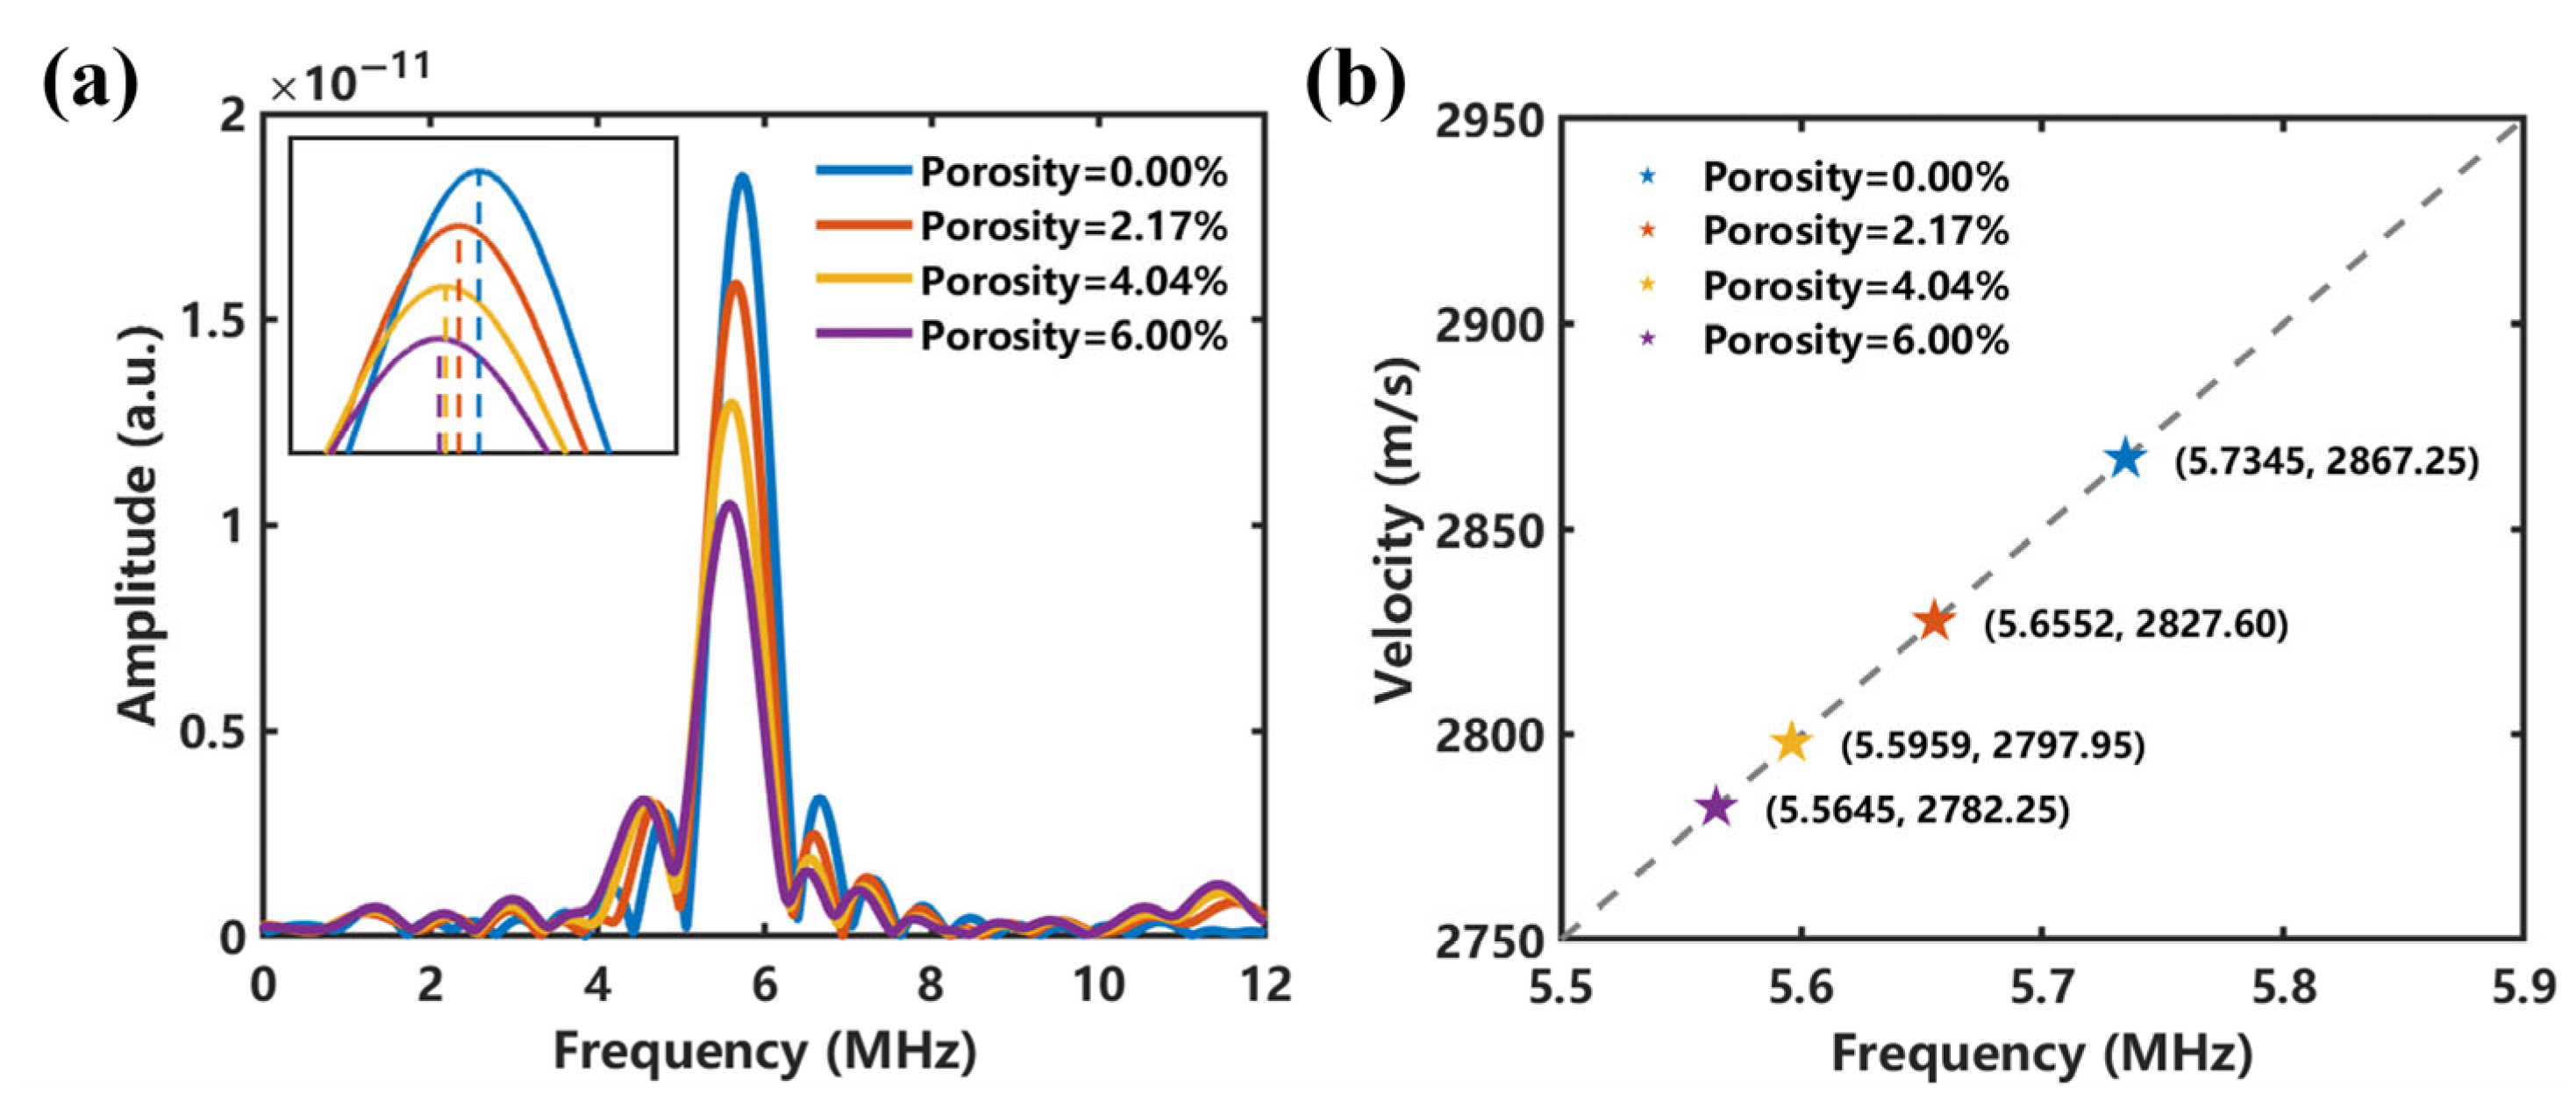
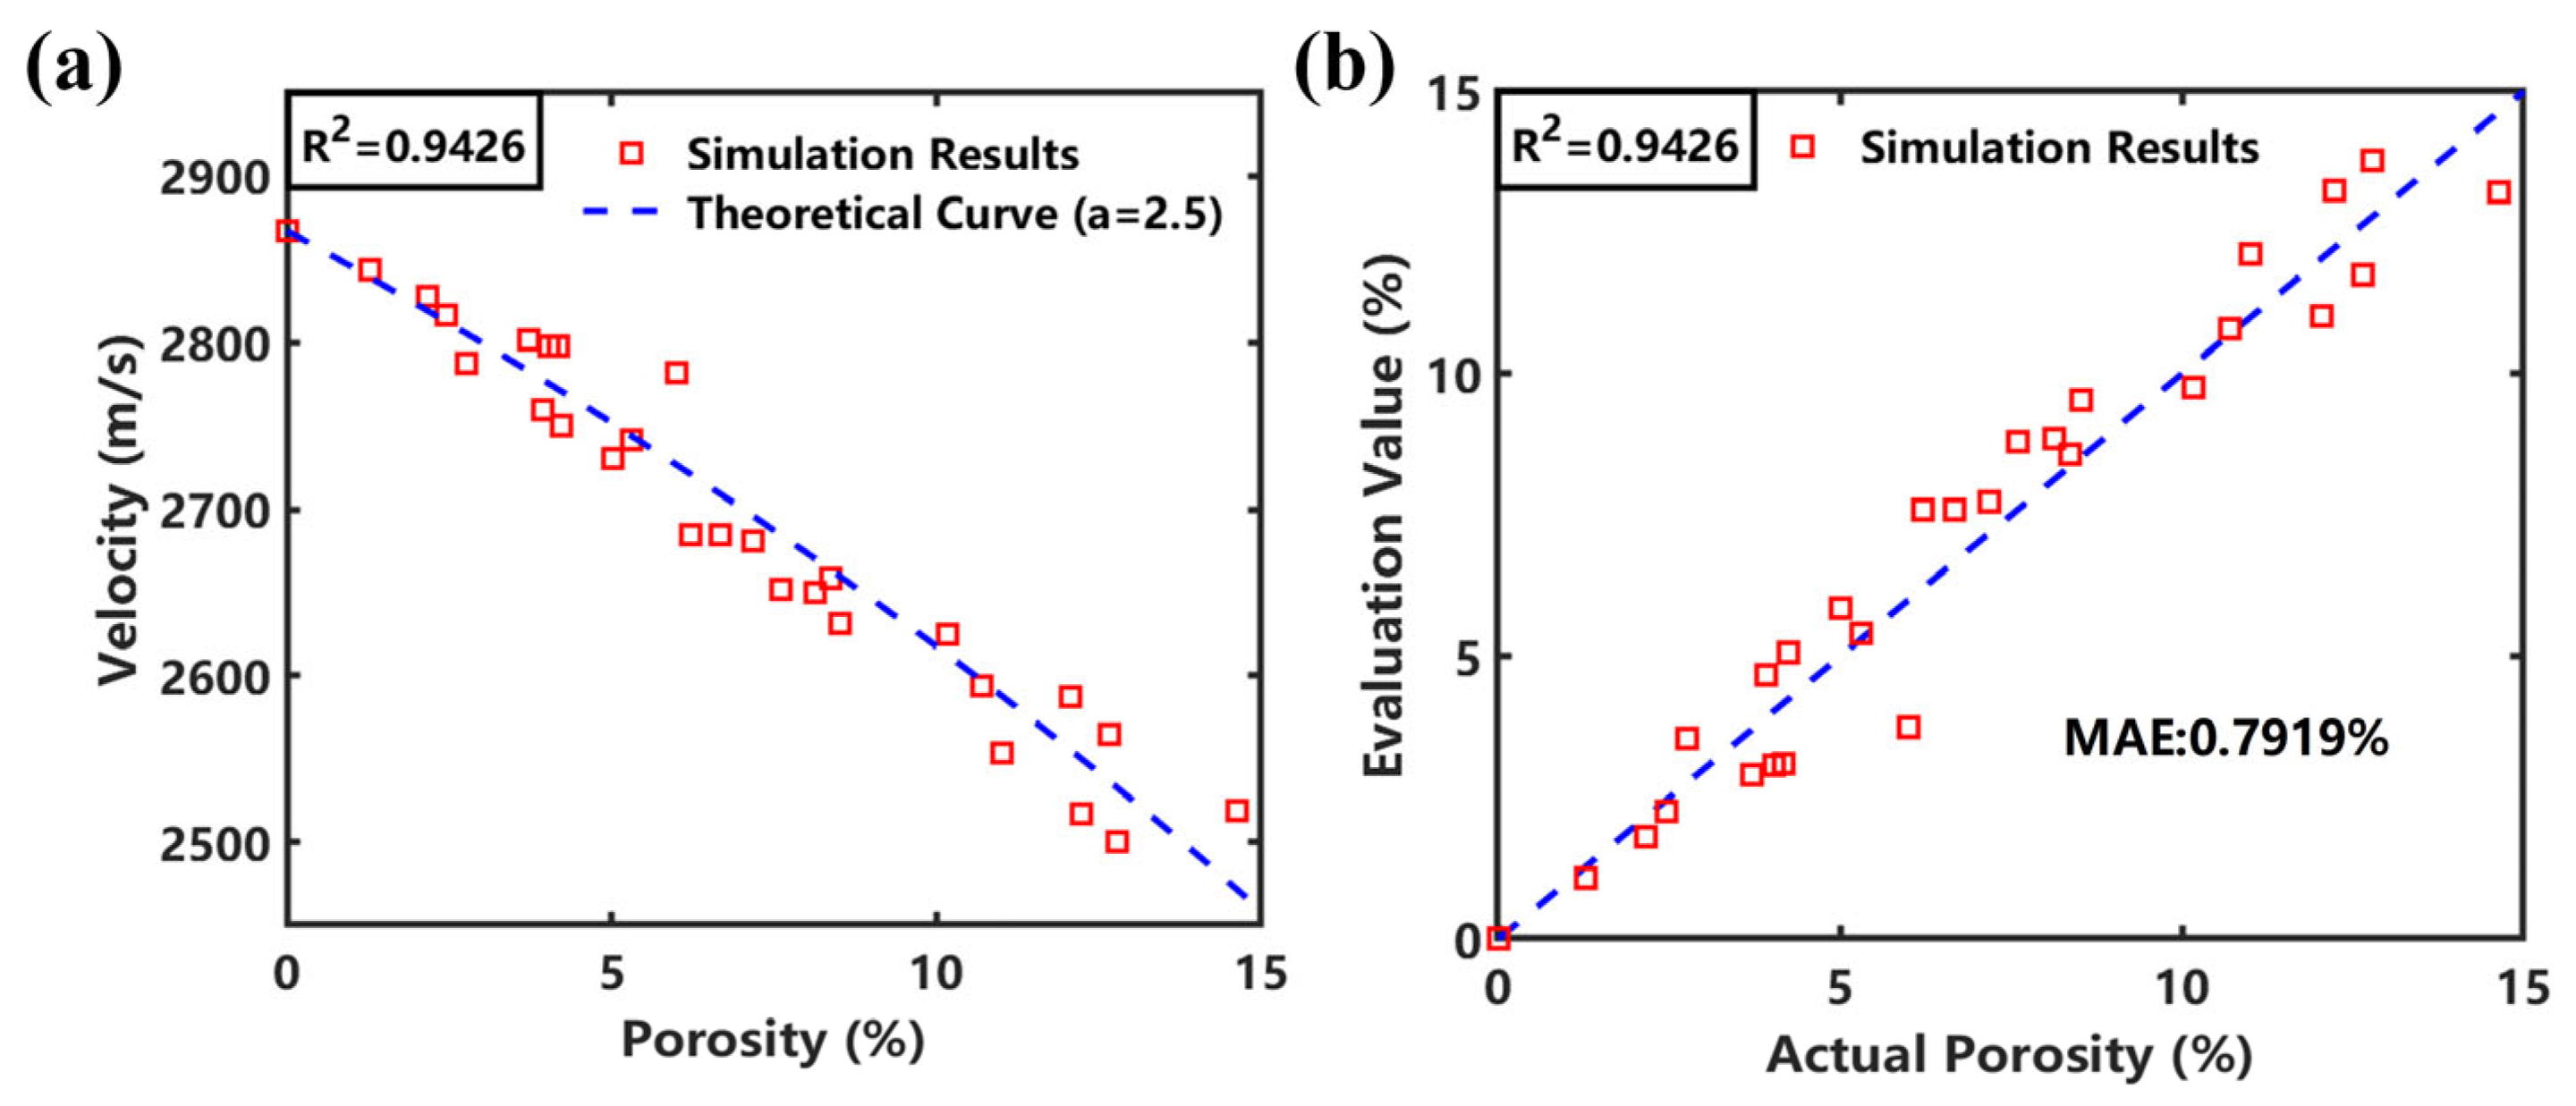
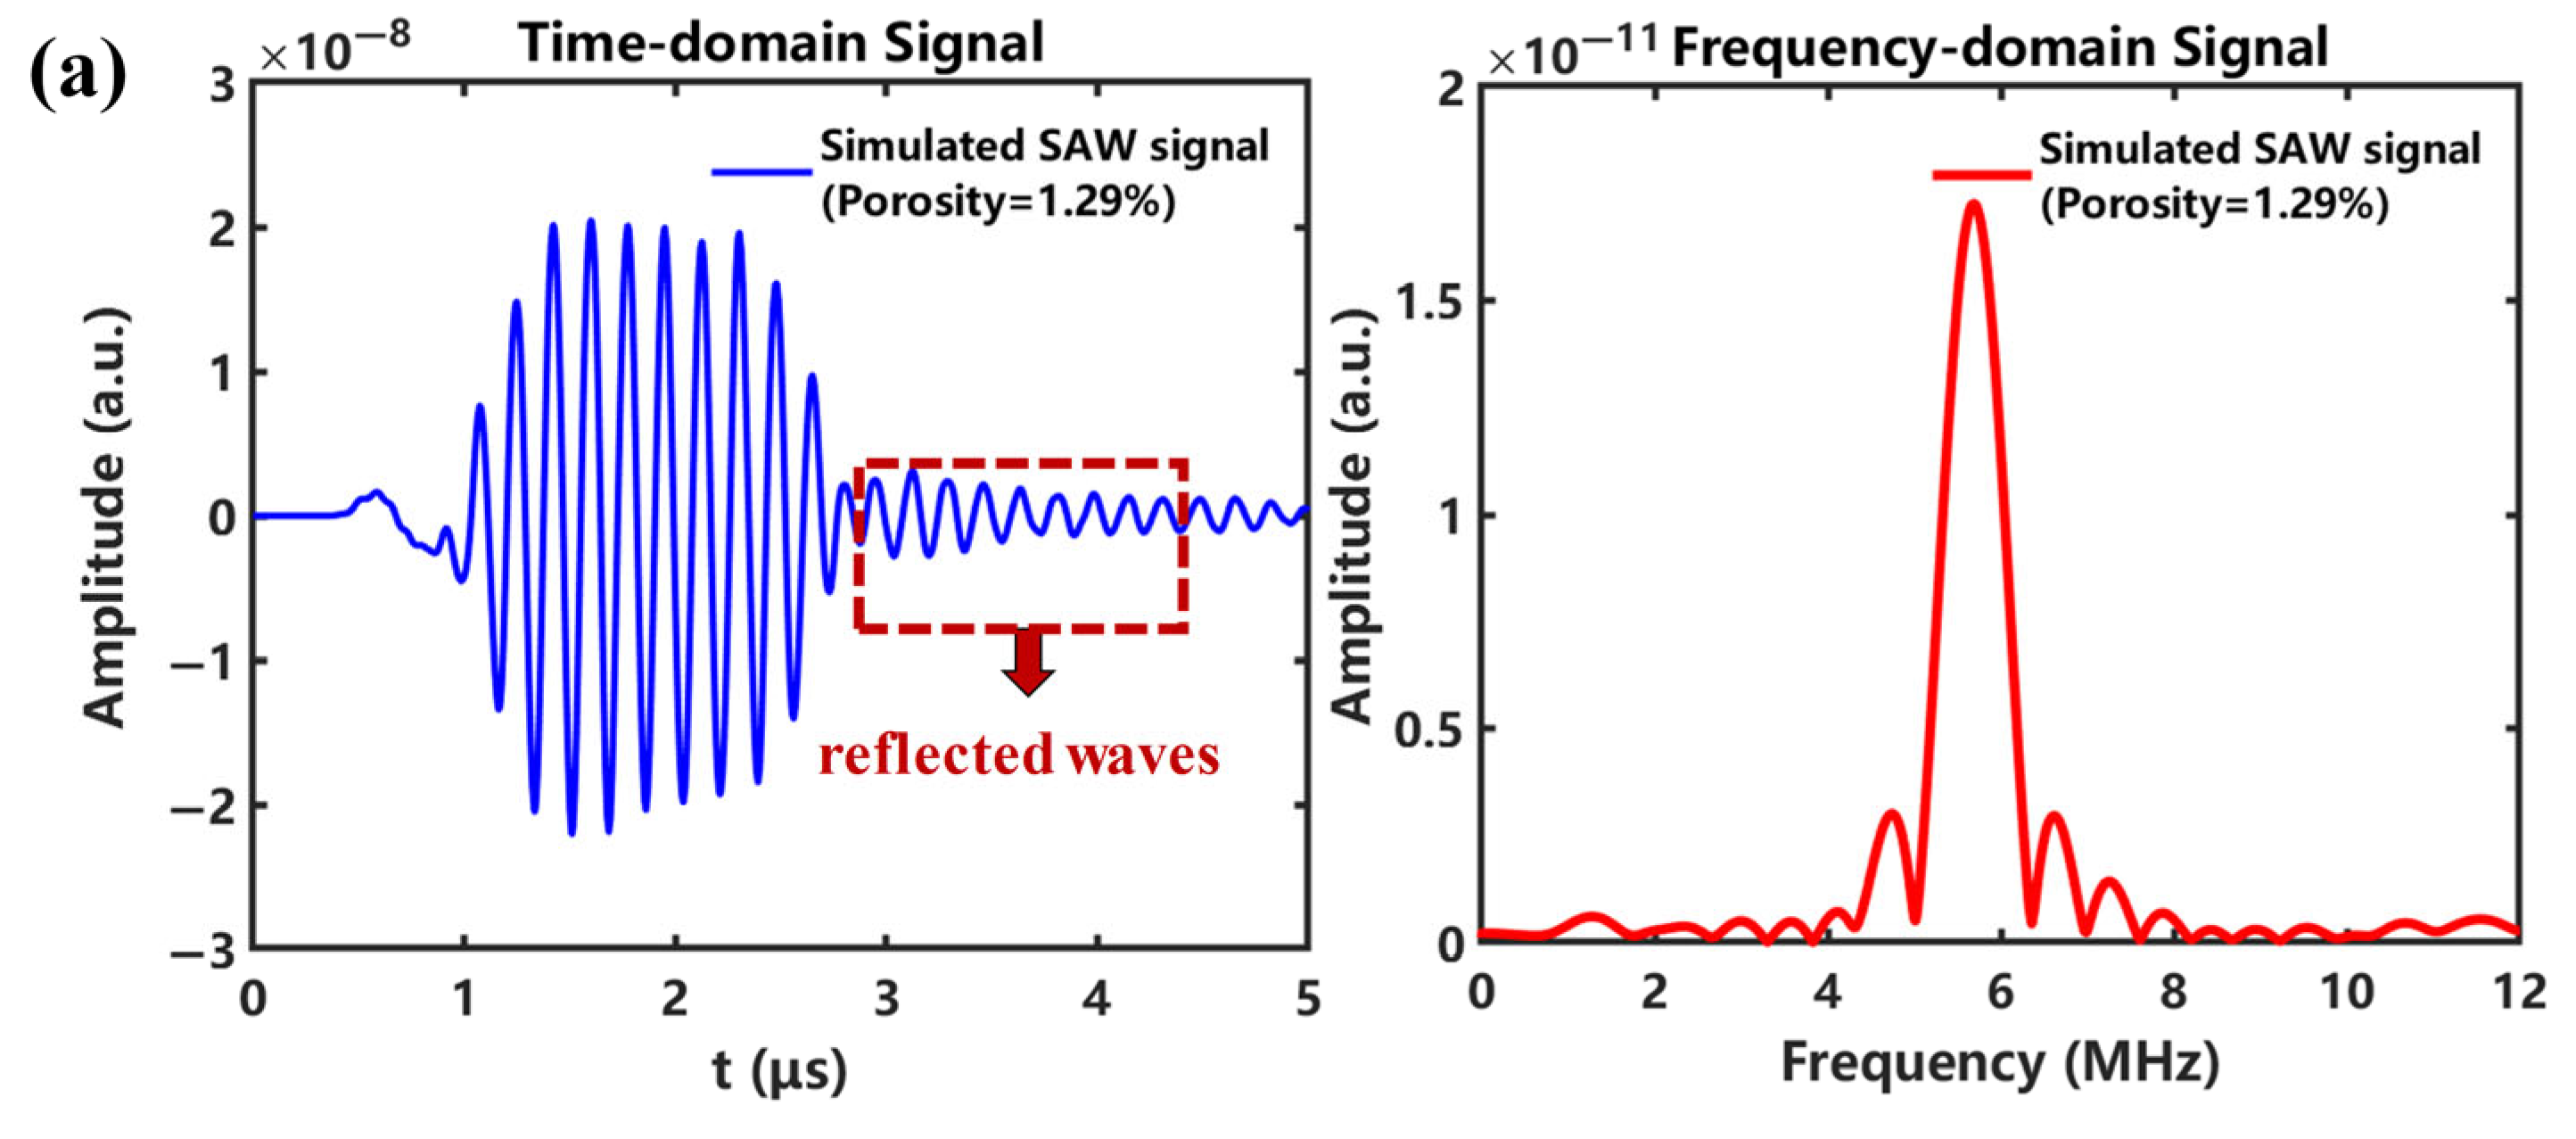
3.3. Simulation Results and Analysis

To provide an intuitive understanding of wave propagation behavior in the presence of void defects, the transient acoustic fields generated by the grating-patterned laser source were analyzed for both defect-free and porous models, as illustrated in Figure 3. The pulsed laser induces a spatially periodic thermal stress distribution, which simultaneously generates narrowband SAWs and bulk waves, including longitudinal waves (L waves) and shear waves (S waves). Among these, the SAWs propagate bidirectionally along the specimen surface, with their energy highly confined within approximately one wavelength of the surface, making them particularly sensitive to both surface and near-surface discontinuities. This confinement renders SAWs especially suitable for detecting small defects located at or near the surface.
In the absence of defects (Figure 3a), the SAWs propagate symmetrically along the surface with smooth, undisturbed wavefronts and no significant scattering or reflection, indicating stable wave transmission. In contrast, the porous model (Figure 3b) reveals clear evidence of wave–defect interactions. At 1.2 μs, interactions between the SAWs and internal voids become evident, as local disruptions in the wavefront can be observed near the defect regions. By 3.0 μs, secondary wavefronts emerge behind the primary SAW packet, indicating the presence of reflected waves resulting from scattering at the void boundaries.
Figure 4 further investigates the influence of porosity on SAW propagation through a time and frequency domain analysis of the simulated signals at porosity levels of 0.00%, 2.17%, 4.04%, and 6.00%. In the time domain results, the introduction of porosity leads to the appearance of reflected waves following the primary SAW packet. As porosity increases, the amplitude of the main wave packet gradually decreases, and the waveform becomes progressively more distorted. These trends indicate increased scattering and energy attenuation due to the presence of internal voids, which disrupt the coherent propagation of the surface waves. In the frequency domain, although the individual spectra in Figure 4 do not clearly show a consistent shift in the central frequency with increasing porosity, they reveal a general reduction in overall amplitude and a slight enhancement of high-frequency components. These spectral changes suggest that porosity not only affects wave attenuation but also modifies the dispersion behavior of the propagating wavefield.
To better quantify the influence of porosity on wave velocity, Figure 5a provides a direct comparison of the frequency domain spectra across all porosity levels. As porosity increases, the spectral peak progressively shifts toward lower frequencies, indicating greater dispersion and energy loss—trends that are consistent with the expected interaction between SAWs and internal voids. Figure 5b further demonstrates the quantitative relationship between porosity and SAW velocity. Using the central frequency values extracted from the spectra and the known excitation wavelength ( λ s = 0.5 mm), the SAW velocity at each porosity level was calculated according to Equation (6). As predicted by theoretical analysis, the velocity decreases monotonically with increasing porosity due to the reduction in the effective elastic modulus and in the mass density introduced by the voids. This result aligns with the theoretical analysis and provides a reliable basis for porosity estimation using measured frequency domain characteristics.
As shown in Figure 6a, the theoretical SAW velocity–porosity curve derived from Equation (5) is compared with the simulation results, where each scatter point represents the actual porosity and the corresponding SAW velocity obtained from a set of numerical simulations. The porosity range considers spans from 0% to 15%, and the fitting between the simulated data and the theoretical model yields a high coefficient of determination (R2 = 0.9426), indicating strong agreement between the theoretical prediction and the numerical results. Figure 6b further validates the effectiveness of the proposed method by comparing the porosity values estimated from simulated SAW velocities with the actual porosities used in the numerical models. This comparison demonstrates a similarly high level of agreement, with an R2 of 0.9426 and a mean absolute error (MAE) of 0.7919%, confirming that the proposed approach can reliably and accurately estimate porosity based on SAW velocity measurements.

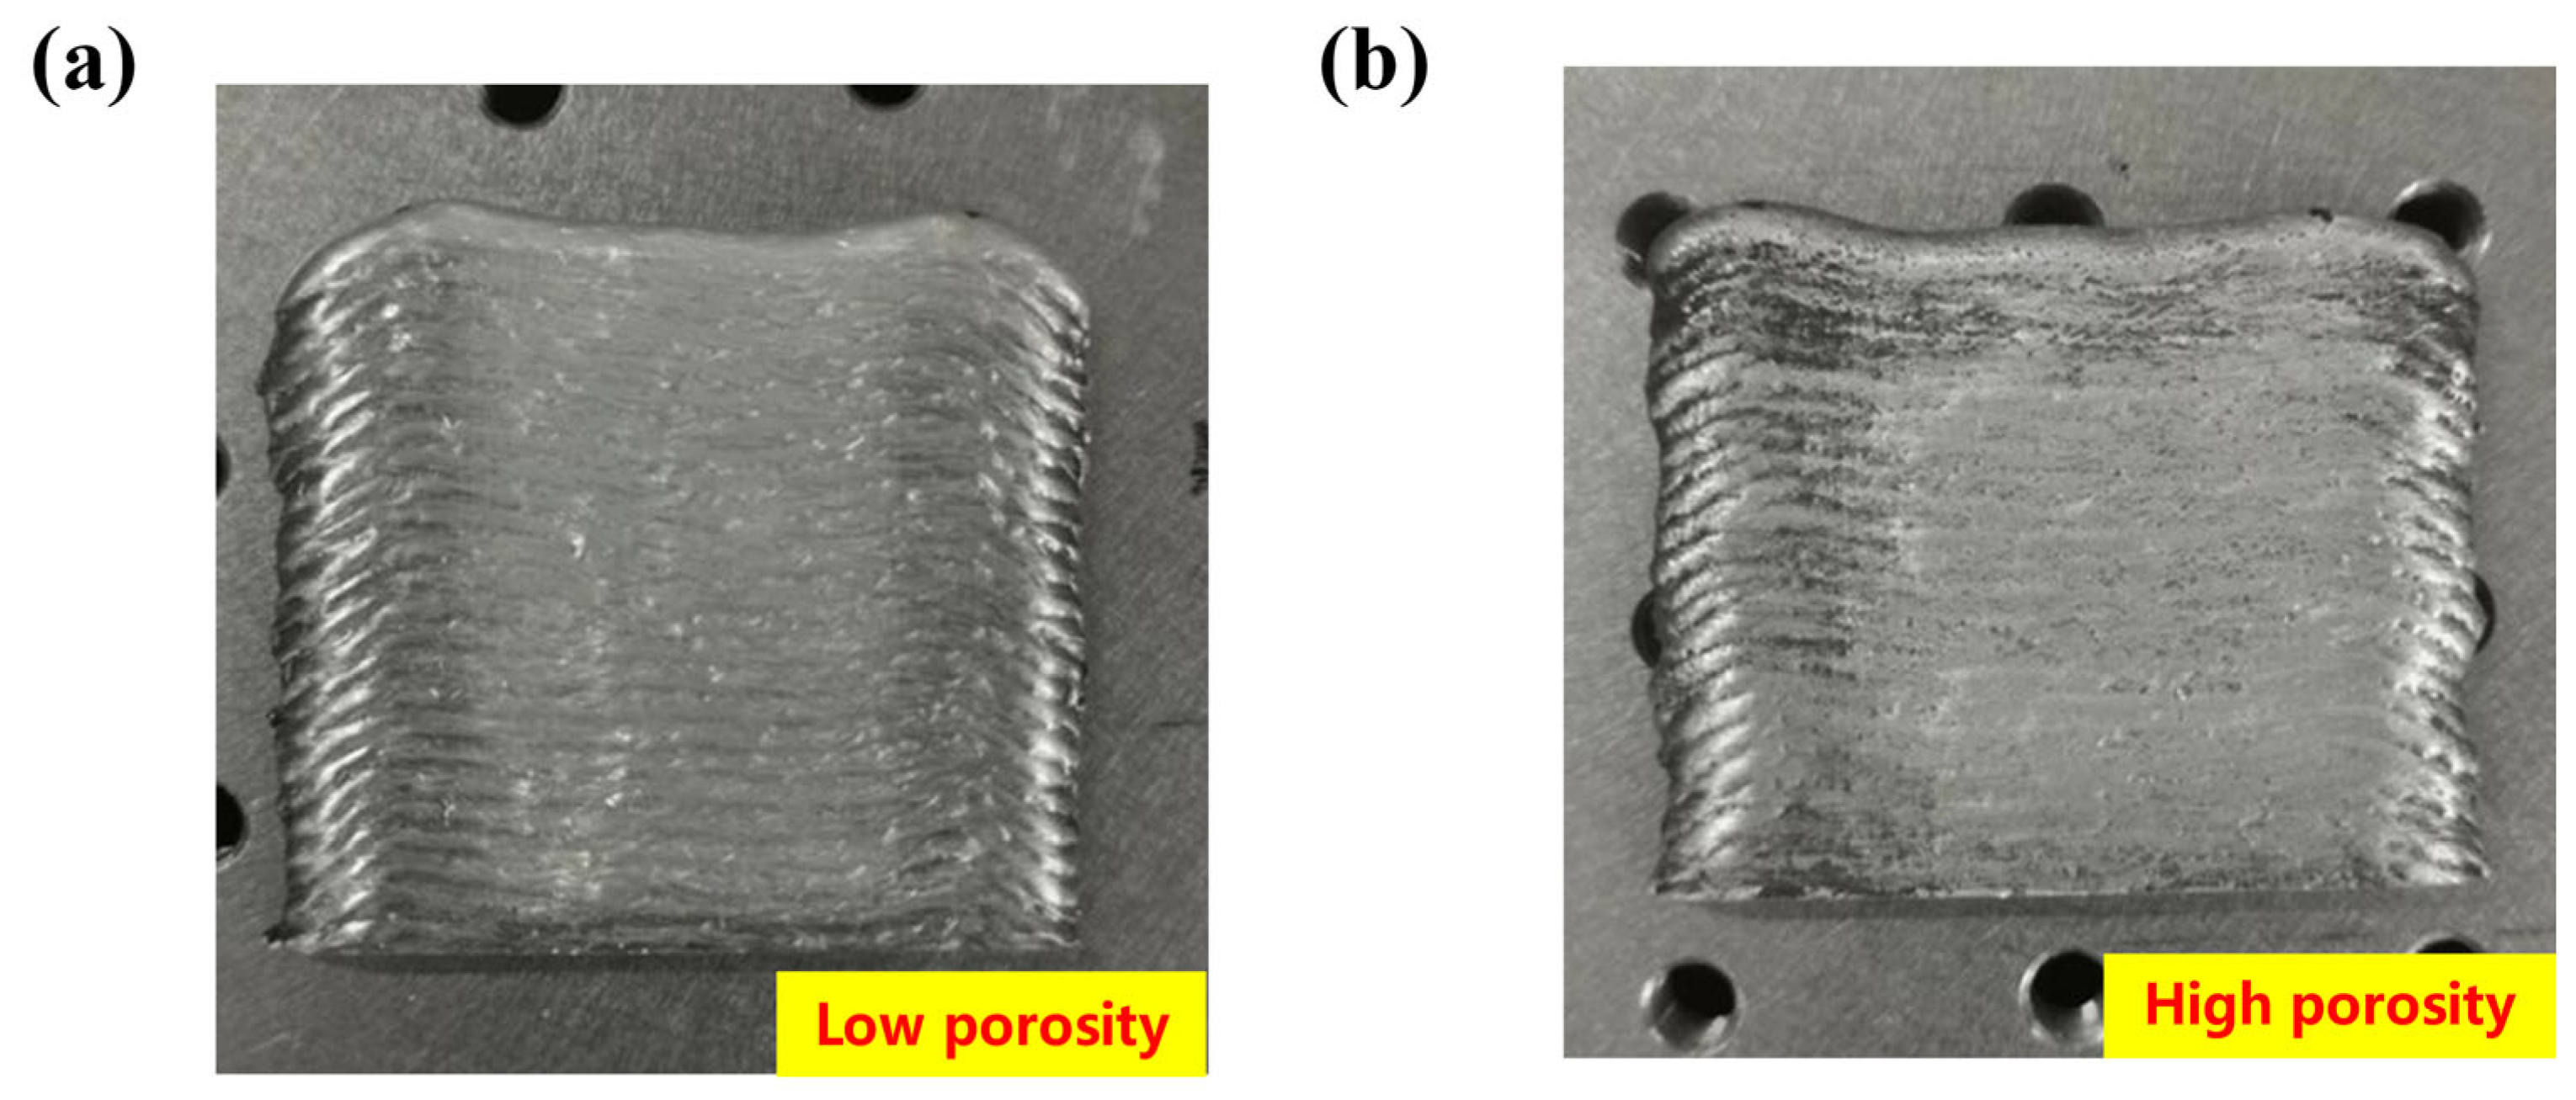
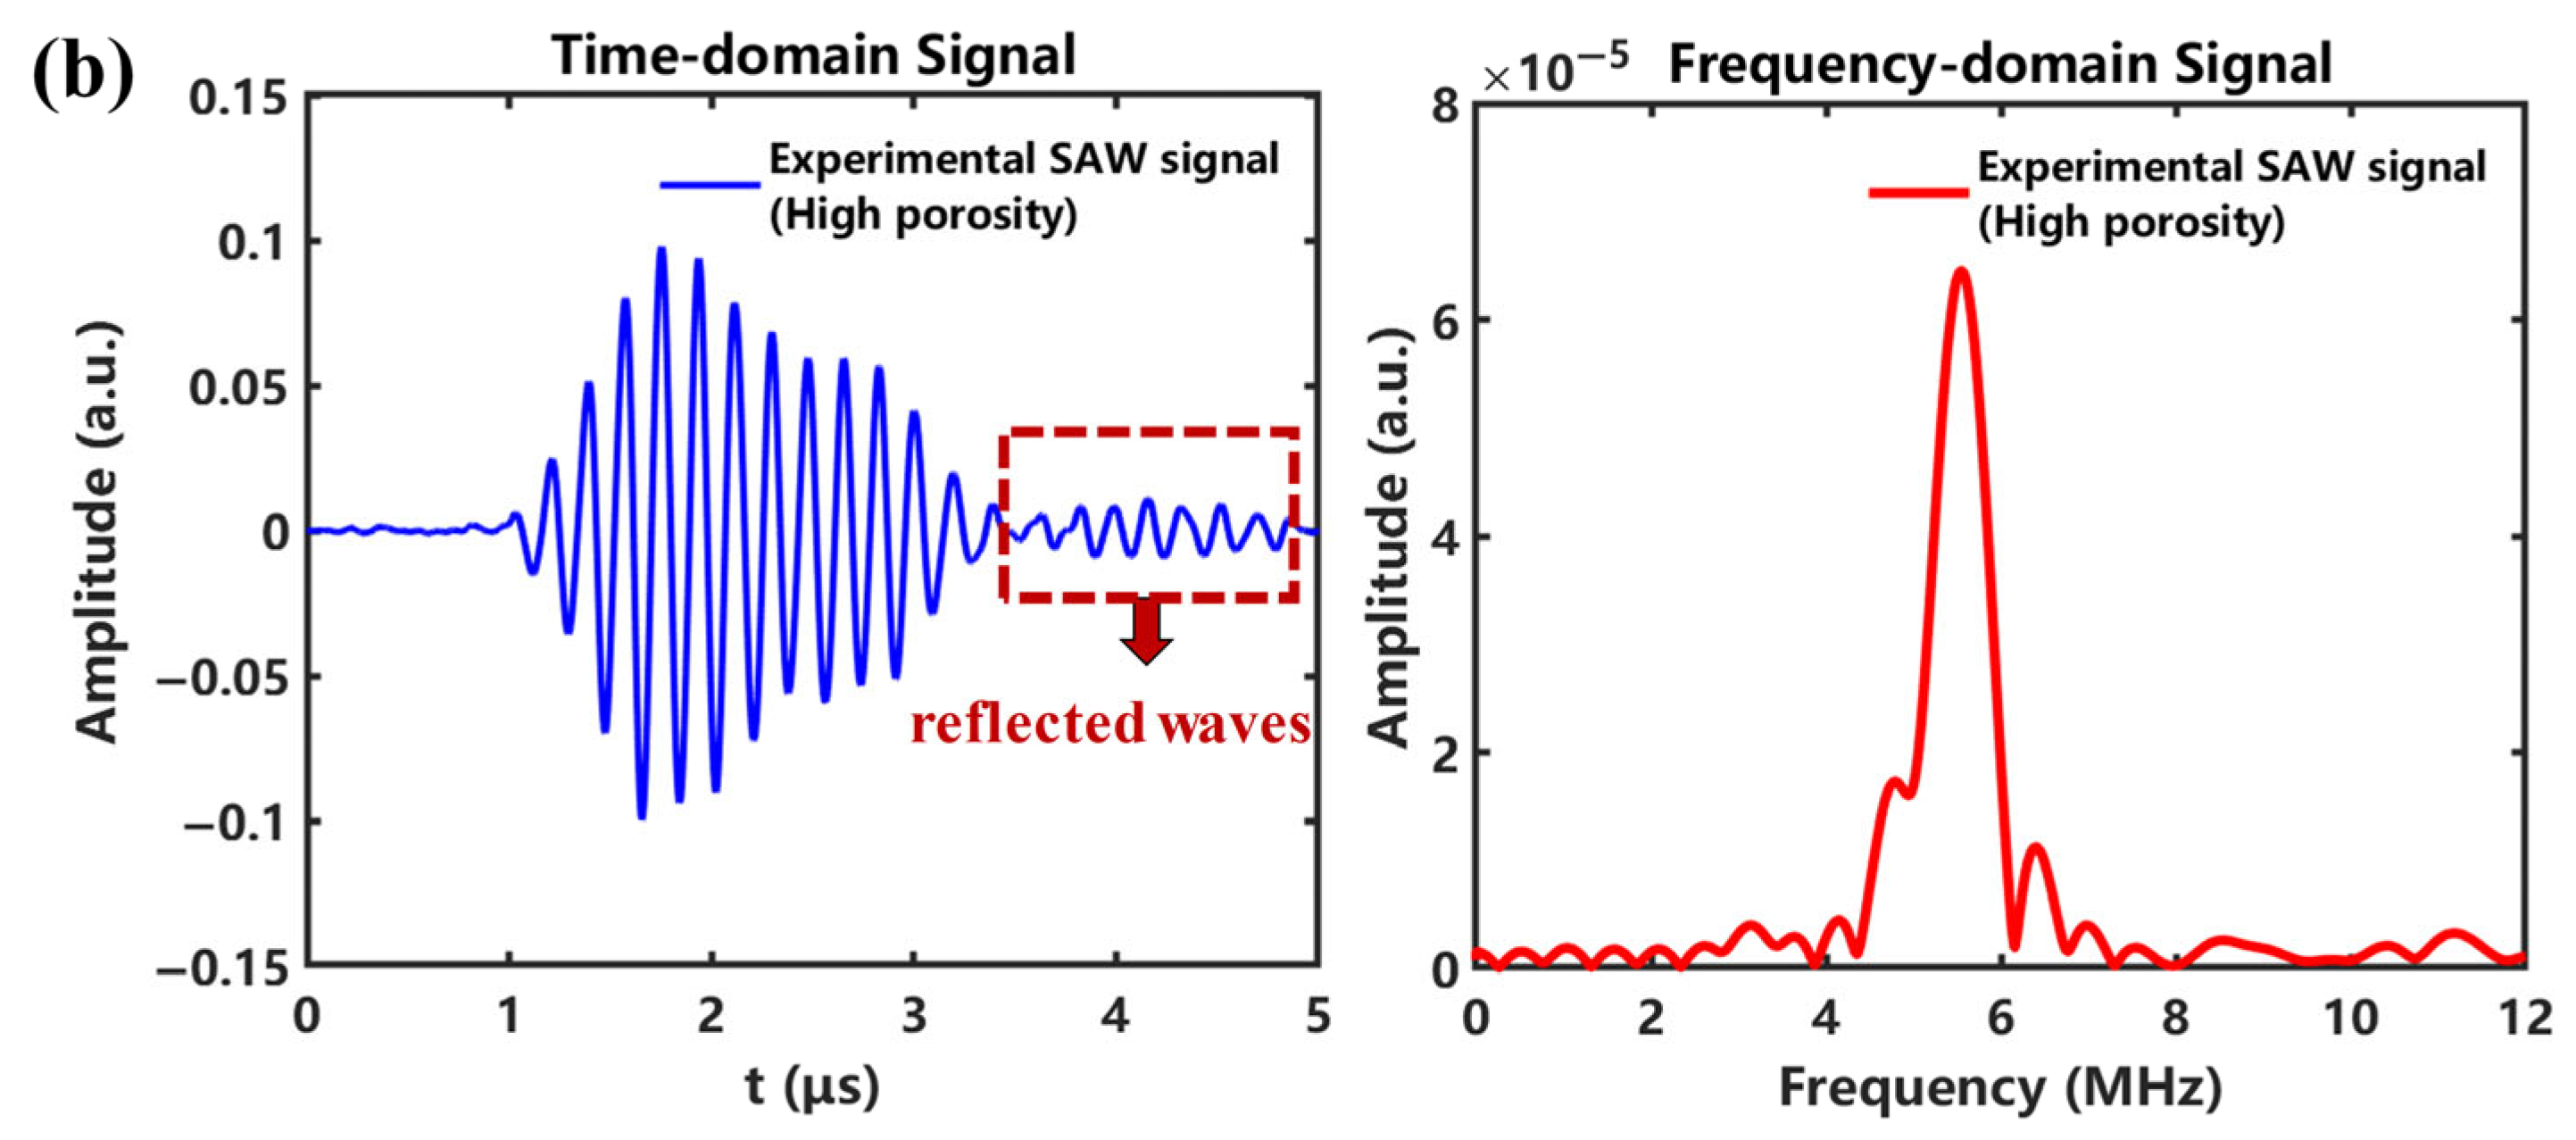
3.4. Experiment Validation

To experimentally verify the feasibility and practical applicability of the proposed grating laser ultrasonic method, aluminum alloy specimens fabricated via wire arc additive manufacturing (WAAM) were employed. By adjusting the WAAM process parameters, two types of specimens with distinct internal conditions were obtained, as visually illustrated in Figure 7. One exhibited minimal internal porosity (estimated to be near 0%) and is hereafter referred to as the low-porosity specimen, serving as a dense reference. The other, referred to as the high-porosity specimen, exhibited a visibly greater internal void content, corresponding to an estimated porosity level of approximately 1–2% based on process experience and prior observations. A pulsed laser beam was used to generate SAWs through a microlens array with a spatial period of 0.5 mm, producing a periodic grating pattern on the specimen surface. A laser interferometer was used to capture the SAW signals for subsequent analysis. The excitation and detection points were separated by approximately 2 mm, consistent with the simulation configuration. Importantly, the use of laser-based excitation and interferometric detection enabled a fully non-contact measurement scheme that demonstrates strong potential for integration into real-time or online defect monitoring systems in metal AM.
To validate the simulation results and further assess the applicability of SAW signals for evaluating porosity in metal AM components, experiments were carried out on aluminum alloy specimens with relatively low and high porosity levels. Figure 8 presents a side-by-side comparison between the simulated SAW signal for a porosity level of 1.29% (Figure 8a) and the experimentally measured signal obtained from the high-porosity WAAM specimen (Figure 8b). In both cases, distinct reflected waves appear following the main SAW packet in the time-domain response, suggesting a notable interaction between the wave and internal voids. The corresponding frequency-domain signals also display comparable spectral shapes and bandwidths, indicating that the simulation can reasonably reproduce the frequency characteristics of SAW propagation under similar porosity conditions.
Figure 9 further presents a comparison between the experimental signals obtained from the low- and high-porosity specimens. In the time domain, the signal from the high-porosity sample shows a more evident reflected wave and a slight decrease in the amplitude of the main wave packet. In the frequency domain, a shift of the spectral peak toward lower frequencies is observed along with a mild increase in the amplitude of the high-frequency components. These trends are consistent with the simulation results and align with the theoretical expectation that increased porosity leads to reduced effective wave velocity and greater signal scattering.
It should be noted that although the experimental results show agreement with the simulations in terms of waveform evolution and spectral shift, a precise quantitative analysis (i.e., porosity estimation from SAW velocity) is not conducted here. This is primarily due to the lack of reliable material property data (e.g., elastic modulus and density) for the as-built specimens, which can significantly affect their absolute wave velocities. Nevertheless, the observed waveform and spectral trends confirm the sensitivity of SAW signals to internal void defects, providing an effective validation of the proposed approach.

3.5. Discussion

The results obtained from both the simulation and experimental investigations demonstrate the effectiveness of the proposed grating laser ultrasonic method for non-contact porosity evaluation in metal AM. The simulation results indicate that the SAW velocity decreases with increasing porosity, showing good agreement with the theoretical velocity–porosity model. These findings are further supported by experimental measurements on WAAM-fabricated specimens with differing porosity levels. Although the experimental analysis is limited to qualitative trends due to the absence of accurate material property data, their observed consistency with the simulation results confirms the method’s sensitivity to internal voids. Furthermore, the fully non-contact configuration—based on laser excitation and interferometric detection—highlights the method’s strong potential for online, in situ monitoring during the AM process.

4. Conclusions

In this study, a grating-based laser ultrasonic technique was proposed for the non-contact evaluation of porosity in metal AM components. This method relies on the relationship between SAW velocity and material porosity, as established through theoretical modeling that accounts for changes in the effective elastic modulus and density due to void defects. By generating narrowband SAWs using a pulsed laser grating and detecting the wave signals with a laser interferometer, this fully non-contact excitation and detection configuration makes the technique well suited for online monitoring during the AM process. Moreover, this method enables the accurate calculation of the SAW velocity based solely on local frequency and wavelength information, independent of source–detector distance.
Numerical simulations on aluminum alloy models with varying porosity levels demonstrated that increased porosity leads to signal attenuation, waveform distortion, and a leftward shift in the frequency spectrum. These changes are consistent with the theoretical prediction that porosity reduces wave speed and increases scattering. Simulated SAW velocities and actual porosity values exhibited excellent agreement with the theoretical velocity–porosity relationship, and the inverse estimation of porosity achieved high accuracy (R2 = 0.9426, MAE = 0.7919%).
To further verify the feasibility of the method, experiments were conducted on two WAAM-fabricated aluminum alloy specimens with distinctly different porosity levels—one with low porosity (near-zero) and the other with high porosity (in the range of 1–2%). The experimental results exhibited waveform features and spectral trends consistent with the simulation, including the appearance of reflected waves and moderate shifts in spectral content. Although quantitative porosity estimation was not performed due to the lack of precise material property data (e.g., elastic modulus and density), the observed responses confirmed the sensitivity of SAW signals to internal porosity. This experimental validation reinforces the potential of the proposed approach for detecting porosity in additively manufactured materials.
Future work will focus on extending this method toward experimental quantitative evaluation by incorporating reliable material parameters. Additionally, while stable SAW signals can be obtained on as-built rough surfaces, further investigation is needed to quantify the influence of surface roughness on evaluation accuracy.

Author Contributions

Conceptualization, J.Y. and C.P.; Methodology, J.Y. and C.P.; Software, Y.L. and Q.G.; Validation, H.L. and Z.G.; Formal analysis, H.L., Q.G. and Z.G.; Investigation, H.L. and Z.G.; Resources, Y.L. and Q.G.; Data curation, H.L., Y.L. and Z.G.; Writing—original draft, H.L. and J.Y.; Writing—review & editing, C.P.; Visualization, H.L., J.Y. and Q.G.; Supervision, Y.L. and C.P.; Project administration, C.P.; Funding acquisition, Y.L. and C.P. All authors have read and agreed to the published version of the manuscript.

Funding

This research was supported by the Natural Science Basic Research Program of Shaanxi [No. 2024JC-YBQN-0545], Key Science and Technology Projects for Basic and Prospective Research of CNPC [No. 2023ZZ11], Shaanxi Province Key Research and Development Project [No. 2024PT-ZCK-48], and National Natural Science Foundation [No. 92366301].

Institutional Review Board Statement

Not applicable.

Informed Consent Statement

Not applicable.

Data Availability Statement

The original contributions presented in this study are included in the article. Further inquiries can be directed to the corresponding author.

Conflicts of Interest

Author Jinfeng Yang was employed by PetroChina Changqing Oilfield Company. Author Qinghua Guo was employed by Huanqing Oil Production Plant of Yumen Oilfield. The remaining authors declare that the research was conducted in the absence of any commercial or financial relationships that could be construed as a potential conflict of interest.

References

  1. Khajavi, S.H.; Deng, G.; Holmström, J.; Puukko, P.; Partanen, J. Selective laser melting raw material commoditization: Impact on comparative competitiveness of additive manufacturing. Int. J. Prod. Res. 2018, 56, 4874–4896. [Google Scholar] [CrossRef]
  2. Wu, B.; Pan, Z.; Ding, D.; Cuiuri, D.; Li, H.; Xu, J.; Norrish, J. A review of the wire arc additive manufacturing of metals: Properties, defects and quality improvement. J. Manuf. Process. 2018, 35, 127–139. [Google Scholar] [CrossRef]
  3. Hauser, T.; Reisch, R.T.; Breese, P.P.; Lutz, B.S.; Pantano, M.; Nalam, Y.; Bela, K.; Kamps, T.; Volpp, J.; Kaplan, A.F. Porosity in wire arc additive manufacturing of aluminium alloys. Addit. Manuf. 2021, 41, 101993. [Google Scholar] [CrossRef]
  4. Ramírez, I.S.; Márquez, F.P.G.; Papaelias, M. Review on additive manufacturing and non-destructive testing. J. Manuf. Syst. 2023, 66, 260–286. [Google Scholar] [CrossRef]
  5. Li, W.; Zhou, Z.; Li, Y. Application of ultrasonic array method for the inspection of TC18 addictive manufacturing titanium alloy. Sensors 2019, 19, 4371. [Google Scholar] [CrossRef]
  6. Kim, C.; Yin, H.; Shmatok, A.; Prorok, B.C.; Lou, X.; Matlack, K.H. Ultrasonic nondestructive evaluation of laser powder bed fusion 316L stainless steel. Addit. Manuf. 2021, 38, 101800. [Google Scholar] [CrossRef]
  7. Sun, X.; Huang, L.; Xiao, B.; Zhang, Q.; Li, J.; Ding, Y.; Fang, Q.; He, W.; Xie, H. X-ray computed tomography in metal additive manufacturing: A review on prevention, diagnostic, and prediction of failure. Thin-Walled Struct. 2024, 207, 112736. [Google Scholar] [CrossRef]
  8. Rahman, O.; Rakhmonov, J.; Bahl, S.; Frederick, C.; Shyam, A.; Dehoff, R.; Plotkowski, A.; Ziabari, A. Dual X-ray computed tomography-aided classification of melt pool boundaries and flaws in crept additively manufactured parts. Mater. Charact. 2024, 217, 114317. [Google Scholar] [CrossRef]
  9. Sun, W.; Kasa, T.; Hatsukade, Y.; Yonehara, M.; Ikeshoji, T.; Kyogoku, H. Quality assessment of SUS316L fabricated by metal additive manufacturing with eddy current inspection. NDT E Int. 2023, 138, 102901. [Google Scholar] [CrossRef]
  10. Zimermann, R.; Mohseni, E.; Foster, E.A.; Vasilev, M.; Loukas, C.; Vithanage, R.K.; Macleod, C.N.; Lines, D.; Silva, M.P.E.E.; Fitzpatrick, S. In-process non-destructive evaluation of metal additive manufactured components at build using ultrasound and eddy-current approaches. J. Manuf. Process. 2023, 107, 549–558. [Google Scholar] [CrossRef]
  11. Caiazzo, F.; Cardaropoli, F.; Alfieri, V.; Sergi, V.; Cuccaro, L. Experimental analysis of selective laser melting process for Ti-6Al-4V turbine blade manufacturing. In Proceedings of the XIX International Symposium on High-Power Laser Systems and Applications 2012, Istanbul, Turkey, 10–14 September 2012; pp. 381–390. [Google Scholar]
  12. Strantza, M.; Aggelis, D.G.; De Baere, D.; Guillaume, P.; Van Hemelrijck, D. Evaluation of SHM system produced by additive manufacturing via acoustic emission and other NDT methods. Sensors 2015, 15, 26709–26725. [Google Scholar] [CrossRef]
  13. Lu, Q.Y.; Wong, C.H. Applications of non-destructive testing techniques for post-process control of additively manufactured parts. Virtual Phys. Prototyp. 2017, 12, 301–321. [Google Scholar] [CrossRef]
  14. Mandache, C. Overview of non-destructive evaluation techniques for metal-based additive manufacturing. Mater. Sci. Technol. 2019, 35, 1007–1015. [Google Scholar] [CrossRef]
  15. Ngo, T.D.; Kashani, A.; Imbalzano, G.; Nguyen, K.T.; Hui, D. Additive manufacturing (3D printing): A review of materials, methods, applications and challenges. Compos. Part B Eng. 2018, 143, 172–196. [Google Scholar] [CrossRef]
  16. Xia, C.; Pan, Z.; Polden, J.; Li, H.; Xu, Y.; Chen, S.; Zhang, Y. A review on wire arc additive manufacturing: Monitoring, control and a framework of automated system. J. Manuf. Syst. 2020, 57, 31–45. [Google Scholar] [CrossRef]
  17. Jeon, I.; Yang, L.; Ryu, K.; Sohn, H. Online melt pool depth estimation during directed energy deposition using coaxial infrared camera, laser line scanner, and artificial neural network. Addit. Manuf. 2021, 47, 102295. [Google Scholar] [CrossRef]
  18. Ma, H.; Mao, Z.; Feng, W.; Yang, Y.; Hao, C.; Zhou, J.; Liu, S.; Xie, H.; Guo, G.; Liu, Z. Online in-situ monitoring of melt pool characteristic based on a single high-speed camera in laser powder bed fusion process. Appl. Therm. Eng. 2022, 211, 118515. [Google Scholar] [CrossRef]
  19. Zhang, B.; Li, Y.; Bai, Q. Defect formation mechanisms in selective laser melting: A review. Chin. J. Mech. Eng. 2017, 30, 515–527. [Google Scholar] [CrossRef]
  20. Cerniglia, D.; Montinaro, N. Defect detection in additively manufactured components: Laser ultrasound and laser thermography comparison. Procedia Struct. Integr. 2018, 8, 154–162. [Google Scholar] [CrossRef]
  21. Cai, Y.; Xiong, J.; Chen, H.; Zhang, G. A review of in-situ monitoring and process control system in metal-based laser additive manufacturing. J. Manuf. Syst. 2023, 70, 309–326. [Google Scholar] [CrossRef]
  22. Pieris, D.; Stratoudaki, T.; Javadi, Y.; Lukacs, P.; Catchpole-Smith, S.; Wilcox, P.D.; Clare, A.; Clark, M. Laser Induced Phased Arrays (LIPA) to detect nested features in additively manufactured components. Mater. Des. 2020, 187, 108412. [Google Scholar] [CrossRef]
  23. Honarvar, F.; Varvani-Farahani, A. A review of ultrasonic testing applications in additive manufacturing: Defect evaluation, material characterization, and process control. Ultrasonics 2020, 108, 106227. [Google Scholar] [CrossRef] [PubMed]
  24. Zhang, J.; Zhao, X.; Yang, B.; Li, J.; Liu, Y.; Ma, G.; Yuan, S.; Wu, J. Nondestructive evaluation of porosity in additive manufacturing by laser ultrasonic surface wave. Measurement 2022, 193, 110944. [Google Scholar] [CrossRef]
  25. Lv, G.; Yao, Z.; Chen, D.; Li, Y.; Cao, H.; Yin, A.; Liu, Y.; Guo, S. Fast and high-resolution laser-ultrasonic imaging for visualizing subsurface defects in additive manufacturing components. Mater. Des. 2023, 225, 111454. [Google Scholar] [CrossRef]
  26. Stratoudaki, T.; Javadi, Y.; Kerr, W.; Wilcox, P.D.; Pieris, D.; Clark, M. Laser induced phased arrays for remote ultrasonic imaging of additive manufactured components. In Proceedings of the 57th Annual Conference of the British Institute of Non-Destructive Testing, NDT 2018, Nottingham, UK, 10–12 September 2018; pp. 174–182. [Google Scholar]
  27. Davis, G.; Nagarajah, R.; Palanisamy, S.; Rashid, R.A.R.; Rajagopal, P.; Balasubramaniam, K. Laser ultrasonic inspection of additive manufactured components. Int. J. Adv. Manuf. Technol. 2019, 102, 2571–2579. [Google Scholar] [CrossRef]
  28. Yu, J.; Zhang, D.; Li, H.; Song, C.; Zhou, X.; Shen, S.; Zhang, G.; Yang, Y.; Wang, H. Detection of internal holes in additive manufactured Ti-6Al-4V part using laser ultrasonic testing. Appl. Sci. 2020, 10, 365. [Google Scholar] [CrossRef]
  29. Qian, C.; Chen, Y.; Pei, C.; Chen, Z. Remote measurement of material elastic property at elevated temperature with grating laser ultrasonic testing. Nondestruct. Test. Eval. 2024, 39, 2316–2329. [Google Scholar] [CrossRef]
  30. Dai, T.; Jia, X.; Zhang, J.; Wu, J.; Sun, Y.; Yuan, S.; Ma, G.; Xiong, X.; Ding, H. Laser ultrasonic testing for near-surface defects inspection of 316L stainless steel fabricated by laser powder bed fusion. China Foundry 2021, 18, 360–368. [Google Scholar] [CrossRef]
  31. Qian, C.; Kou, X.; Pei, C.; Chen, Z. Topcoat thickness measurement of thermal barrier coating using grating laser acoustic spectrum method. Ceram. Int. 2022, 48, 3676–3684. [Google Scholar] [CrossRef]
  32. Li, W.; Dryburgh, P.; Pieris, D.; Patel, R.; Clark, M.; Smith, R.J. Imaging microstructure on optically rough surfaces using spatially resolved acoustic spectroscopy. Appl. Sci. 2023, 13, 3424. [Google Scholar] [CrossRef]
  33. Pieris, D.; Patel, R.; Dryburgh, P.; Hirsch, M.; Li, W.; Sharples, S.; Smith, R.; Clare, A.; Clark, M. Spatially resolved acoustic spectroscopy towards online inspection of additive manufacturing. Insight Non Destr. Test. Cond. Monit. 2019, 61, 132–137. [Google Scholar] [CrossRef]
  34. Cao-Rial, M.T.; Moreno, C.; Quintela, P. Determination of Young modulus by using Rayleigh waves. Appl. Math. Model. 2020, 77, 439–455. [Google Scholar] [CrossRef]
  35. Ternero, F.; Rosa, L.G.; Urban, P.; Montes, J.M.; Cuevas, F.G. Influence of the total porosity on the properties of sintered materials—A review. Metals 2021, 11, 730. [Google Scholar] [CrossRef]
  36. Kim, F.H.; Kim, F.H.; Moylan, S.P. Literature Review of Metal Additive Manufacturing Defects; National Institute of Standards and Technology: Gaithersburg, MD, USA, 2018. [Google Scholar]
  37. Wang, Y.; Chen, J.; Wu, X.; Chen, M.; Su, H.; Wang, L.; Wu, C. Investigation on high-deposition-rate directed energy deposition of Al-5% Mg alloy via external compound magnetic fields. Addit. Manuf. 2023, 61, 103299. [Google Scholar] [CrossRef]
Figure 1. Overall schematic diagram of measurement method.
Applsci 15 07995 g001
Figure 2. Schematic diagram of simulation model.
Applsci 15 07995 g002
Figure 3. Transient acoustic fields generated by grating laser excitation: (a) defect-free model; (b) porous model.
Applsci 15 07995 g003
Figure 4. SAW signals for simulation models with varying porosity levels: (a) porosity = 1.29%; (b) porosity = 1.29%; (c) porosity = 1.29%; (d) porosity = 1.29%.
Applsci 15 07995 g004aApplsci 15 07995 g004b
Figure 5. Frequency domain analysis and velocity–porosity correlation: (a) SAW frequency spectra for varying porosity levels; (b) center frequency and corresponding velocity as function of porosity.
Applsci 15 07995 g005
Figure 6. (a) Comparison between the theoretical SAW velocity–porosity curve and simulated data points; (b) correlation between evaluated porosity values derived from SAW velocities and actual porosity values in the numerical models.
Applsci 15 07995 g006
Figure 7. AM specimens with different porosity levels: (a) low porosity; (b) high porosity.
Applsci 15 07995 g007
Figure 8. Comparison of simulated and experimental SAW signals: (a) SAW signals from simulation (porosity = 1.29%); (b) SAW signals from experiment (high porosity).
Applsci 15 07995 g008aApplsci 15 07995 g008b
Figure 9. Experimental comparison of SAW signals for specimens with different porosity levels.
Applsci 15 07995 g009
Table 1. Thermal and physical parameters used for numerical simulation.
Density
(kg·m−3)
Specific Heat
(J·kg−1·K−1)
Thermal Conductivity
(W·m−1·K−1)
Thermal Expansion
(K−1)
Elastic Modulus
(Pa)
Poisson’s Ratio
4.35 × 1035407.08.8 × 10−51.1 × 10110.34
Disclaimer/Publisher’s Note: The statements, opinions and data contained in all publications are solely those of the individual author(s) and contributor(s) and not of MDPI and/or the editor(s). MDPI and/or the editor(s) disclaim responsibility for any injury to people or property resulting from any ideas, methods, instructions or products referred to in the content.

